UNITED STATES
SECURITIES AND EXCHANGE COMMISSION
Washington,
D.C. 20549
FORM 6-K
Report of Foreign Private Issuer
Pursuant to Rule 13a-16 or 15d-16 under
the Securities Exchange Act of 1934
Report on Form 6-K dated January 25, 2024
(Commission File No. 1-13202)
Nokia Corporation
Karakaari 7
FI-02610 Espoo
Finland
(Translation of the registrant’s name into English and address of registrant’s principal executive office)
| Indicate
by check mark whether the registrant files or will file annual reports under cover of Form 20-F or Form 40-F: |
| |
|
|
| Form 20-F: x |
|
Form 40-F: ¨ |
Enclosures:
| · | Stock
Exchange Release: Nokia Corporation Financial Report for Q4 and full year 2023 |
| · | Enclosures:
Report for Q4 and full year 2023 |
| | | 1 |
 | | STOCK EXCHANGE RELEASE 25 January 2024 |
Nokia Corporation
Financial Statement Release
25 January 2024 at 08:00 EET
Nokia Corporation Financial Report
for Q4 and full year 2023
Improving order intake and cash flow
at the end of a challenging year
| • | Net
sales declined 21% y-o-y in constant currency (-23% reported) in Q4 as macroeconomic uncertainty
continues to pressure operator spending. Full year net sales declined 8% y-o-y in constant
currency (-11% reported). |
| • | In
Q4 the environment remained challenging however there are now signs of stabilization with
improving order trends. |
| • | Comparable
gross margin in Q4 declined by 40bps y-o-y to 43.1% (reported declined 100bps to 41.8%).
Significant improvements in Mobile Networks and Cloud and Network Services were offset by
lower contribution from Nokia Technologies which benefited from a significant one-off in
the prior year. |
| • | Q4
comparable operating margin declined 70bps y-o-y to 14.8% (reported down 220bps to 9.6%),
demonstrating the resilience of our profitability relative to the net sales decline. 2023
comparable operating margin 10.7% (reported 7.6%) |
| • | Q4
comparable diluted EPS of EUR 0.10; reported diluted EPS of EUR -0.01. Full year EUR 0.29
and EUR 0.12 respectively. Q4 reported EPS impacted by an operating model change that led
to non-cash remeasurement of deferred tax assets. |
| • | Q4
free cash flow positive EUR 1.7bn, net cash balance EUR 4.3bn. Full year free cash flow EUR
0.8bn. |
| • | Board
proposes dividend authorization of EUR 0.13 per share and initiates two year EUR 600 million
buyback program. |
| • | Nokia
expects full year 2024 comparable operating profit of between EUR 2.3 billion to 2.9 billion
and free cash flow conversion from comparable operating profit of between 30% and 60%. |
This is a summary of the Nokia Corporation
Financial Report for Q4 and full year 2023 published today. Nokia only publishes a summary
of its financial reports in stock exchange releases. The summary focuses on Nokia Group's financial information as well as on Nokia's
outlook. The detailed, segment-level discussion will be available in the complete financial report hosted at www.nokia.com/financials.
A video interview summarizing the key points of our Q4 results will also be published on the website. Investors should not solely rely
on summaries of Nokia's financial reports and should also review the complete reports with tables.
| | | 2 |
| | STOCK EXCHANGE RELEASE 25 January 2024 |
PEKKA LUNDMARK, PRESIDENT AND CEO,
ON Q4 AND FULL YEAR 2023 RESULTS
In 2023 we
saw a meaningful shift in customer behavior impacting our industry driven by the macro-economic environment and high interest rates along
with customer inventory digestion. This led to our full year net sales declining by 8% in constant currency. Proactive action across
our organization meant we were able to protect our profitability while continuing to invest in R&D and we delivered a comparable
operating margin of 10.7% for the full year. This was a resilient performance considering the challenging environment and lower contribution
from our high margin patent licensing business as some renewals remained outstanding.
Looking specifically
at the fourth quarter those same factors drove a net sales decline of 21% y-o-y in constant currency. Encouragingly we saw improvements
in our gross margin across several of our businesses which, combined with continued cost discipline, helped us to deliver a strong comparable
operating margin of 14.8%. In addition, we have seen a significant improvement in order intake in the fourth quarter, particularly in
Network Infrastructure, indicating at least some improvement in the overall spending environment.
We delivered well in 2023 against our
strategic pillar of growing in Enterprise with 16% net sales growth in constant currency and this customer segment now accounts for over
10% of our group net sales. Growth in the fourth quarter was muted at -3% in constant currency as we faced a tough comparison period.
We continue to have strong momentum in this segment and expect another year of double-digit growth in 2024.
In Network
Infrastructure we made important progress in a number of areas in the quarter. We received further webscale orders for our IP Routing
business which supports our expectations of significant growth in webscale in 2024. In the fourth quarter we also saw good progress in
the US government initiatives in Fixed Networks and we continue to expect these programs to increasingly benefit our net sales in the
second half of 2024 and into 2025. The fourth quarter also saw us sign a new and significant customer in Asia for our Fixed Wireless
Access products. In Optical Networks we continue to have good momentum and our new PSE-6s solutions are proving their capabilities in
the field; recent live network trials set a new record of 800Gbps transmission on a single wavelength over 6 600km.
Mobile Networks
net sales performance continued to be challenging in the fourth quarter, but we did see a further important improvement in gross margin
which benefited from a product mix shift towards software. AT&T’s announcement in December to move to a largely single-sourced
RAN network was a disappointing development. It does not reflect the technological competitiveness we have achieved with our products
as evidenced by our significant increase in RAN market share in recent years. I firmly believe we have the right strategy in place for
Mobile Networks to create value for our shareholders into the future with opportunities to gain share, diversify our business and achieve
a double-digit operating margin longer-term.
Our Cloud and
Network Services business had a strong year. We had a slight decline in net sales for the full year, but we made progress on profitability
with a largely stable gross margin and improved operating margin. The business continued to rebalance its portfolio, with the divestment
of its Device Management and Service Management Platform businesses in December. During 2023, we led the industry trend towards programmable
networks with the launch of our Network as Code platform which now has 9 commercial agreements and we also achieved our first commercial
deal for 5G Core as a service to CSPs.
| | | 3 |
| | STOCK EXCHANGE RELEASE 25 January 2024 |
In Nokia Technologies,
we signed significant long-term deals with both Apple and Samsung in 2023 and we also signed a deal with Honor late in the year. I am
also pleased that we have now signed a multi-year agreement with OPPO and we are close to concluding another agreement in China. After
these, we are in the final stages of our smartphone license renewal cycle with only one other, recently expired, major agreement outstanding.
This provides long-term stability to our Nokia Technologies business which will continue to focus on growing our licensing run-rate in
new growth areas including automotive, consumer electronics, IoT and multimedia. I remain confident that with growth in these areas we
can return to an annual net sales run-rate of EUR 1.4 to 1.5 billion in Nokia Technologies in the mid-term.
A clear positive
in the fourth quarter was our cash flow performance. We generated EUR 1.7 billion of free cash flow as we saw a significant improvement
in working capital in the quarter supported by a partial prepayment of a licensing agreement. We ended the year with a net cash position
of EUR 4.3 billion. The Board is proposing a dividend of EUR 0.13 per share in
respect of the financial year 2023 and considering we now hold excess cash at the end of the year, the Board is also instituting a new
share buyback program of EUR 600 million to be executed in the next two years.
Looking ahead,
we expect the challenging environment of 2023 to continue during the first half of 2024, particularly in the first quarter. However,
we are now starting to see some green shoots on the horizon, with improving order intake for Network Infrastructure and some of the specific
deals we have won. This is expected to drive a strong improvement in Network Infrastructure net sales growth in the second half of 2024
which we believe, even with a challenging first half, will drive solid growth for the full year. In Mobile Networks, we expect top line
challenges in 2024 related to a more normalized pace of investment in India and the AT&T decision. We do expect further improvement
in gross margin and then in the second half we will start to see more benefits from our cost savings program. At the Nokia level, we
currently estimate that we will deliver comparable operating profit of between EUR 2.3 and 2.9 billion
in 2024. We also target to deliver an improved free cash flow performance with conversion of between 30% and 60%.
I want to thank
all our people for their resilience and determination to deliver these results and executing on our corporate strategy in what can only
be described as a highly challenging market environment.
| | | 4 |
| | STOCK EXCHANGE RELEASE 25 January 2024 |
FINANCIAL RESULTS
| EUR million (except
for EPS in EUR) | |
Q4'23 | | |
Q4'22 | | |
YoY
change | | |
Constant
currency
YoY
change | | |
Q1-Q4'23 | | |
Q1-Q4'22 | | |
YoY
change | | |
Constant
currency
YoY
change | |
| Reported results | |
| | |
| | |
| | |
| | |
| | |
| | |
| | |
| |
| Net sales | |
| 5 707 | | |
| 7 449 | | |
| (23 | )% | |
| (21 | )% | |
| 22 258 | | |
| 24 911 | | |
| (11 | )% | |
| (8 | )% |
| Gross margin % | |
| 41.8 | % | |
| 42.8 | % | |
| (100 | )bps | |
| | | |
| 39.0 | % | |
| 41.0 | % | |
| (200 | )bps | |
| | |
| Research and development expenses | |
| (1 092 | ) | |
| (1 222 | ) | |
| (11 | )% | |
| | | |
| (4 327 | ) | |
| (4 550 | ) | |
| (5 | )% | |
| | |
| Selling, general and administrative
expenses | |
| (787 | ) | |
| (838 | ) | |
| (6 | )% | |
| | | |
| (2 929 | ) | |
| (3 013 | ) | |
| (3 | )% | |
| | |
| Operating profit | |
| 547 | | |
| 882 | | |
| (38 | )% | |
| | | |
| 1 688 | | |
| 2 318 | | |
| (27 | )% | |
| | |
| Operating margin % | |
| 9.6 | % | |
| 11.8 | % | |
| (220 | )bps | |
| | | |
| 7.6 | % | |
| 9.3 | % | |
| (170 | )bps | |
| | |
| (Loss)/profit for the period | |
| (33 | ) | |
| 3 152 | | |
| (101 | )% | |
| | | |
| 679 | | |
| 4 259 | | |
| (84 | )% | |
| | |
| EPS, diluted | |
| -0.01 | | |
| 0.56 | | |
| (102 | )% | |
| | | |
| 0.12 | | |
| 0.75 | | |
| (84 | )% | |
| | |
| Net
cash and interest-bearing financial investments | |
| 4 323 | | |
| 4 767 | | |
| (9 | )% | |
| | | |
| 4 323 | | |
| 4 767 | | |
| (9 | )% | |
| | |
| Comparable
results | |
| | | |
| | | |
| | | |
| | | |
| | | |
| | | |
| | | |
| | |
| Net sales | |
| 5 707 | | |
| 7 449 | | |
| (23 | )% | |
| (21 | )% | |
| 22 258 | | |
| 24 911 | | |
| (11 | )% | |
| (8 | )% |
| Gross margin % | |
| 43.1 | % | |
| 43.5 | % | |
| (40 | )bps | |
| | | |
| 39.7 | % | |
| 41.4 | % | |
| (170 | )bps | |
| | |
| Research and development expenses | |
| (1 034 | ) | |
| (1 189 | ) | |
| (13 | )% | |
| | | |
| (4 190 | ) | |
| (4 449 | ) | |
| (6 | )% | |
| | |
| Selling, general and administrative
expenses | |
| (626 | ) | |
| (727 | ) | |
| (14 | )% | |
| | | |
| (2 490 | ) | |
| (2 604 | ) | |
| (4 | )% | |
| | |
| Operating profit | |
| 846 | | |
| 1 154 | | |
| (27 | )% | |
| | | |
| 2 375 | | |
| 3 109 | | |
| (24 | )% | |
| | |
| Operating margin % | |
| 14.8 | % | |
| 15.5 | % | |
| (70 | )bps | |
| | | |
| 10.7 | % | |
| 12.5 | % | |
| (180 | )bps | |
| | |
| Profit for the period | |
| 568 | | |
| 929 | | |
| (39 | )% | |
| | | |
| 1 623 | | |
| 2 481 | | |
| (35 | )% | |
| | |
| EPS, diluted | |
| 0.10 | | |
| 0.16 | | |
| (38 | )% | |
| | | |
| 0.29 | | |
| 0.44 | | |
| (34 | )% | |
| | |
| ROIC1 | |
| 10.1 | % | |
| 17.5 | % | |
| (740 | )bps | |
| | | |
| 10.1 | % | |
| 17.5 | % | |
| (740 | )bps | |
| | |
1 Comparable ROIC = Comparable
operating profit after tax, last four quarters / invested capital, average of last five quarters ending balances. Refer to the Performance
measures section in Nokia Corporation Financial Report for Q4 and full year 2023 for details.
| Business group results | |
Network
Infrastructure | | |
Mobile
Networks | | |
Cloud and Network
Services | | |
Nokia
Technologies | | |
Group Common
and Other | |
| EUR million | |
Q4'23 | | |
Q4'22 | | |
Q4'23 | | |
Q4'22 | | |
Q4'23 | | |
Q4'22 | | |
Q4'23 | | |
Q4'22 | | |
Q4'23 | | |
Q4'22 | |
| Net sales | |
| 2 003 | | |
| 2 709 | | |
| 2 450 | | |
| 2 960 | | |
| 977 | | |
| 1 060 | | |
| 251 | | |
| 679 | | |
| 25 | | |
| 59 | |
| YoY change | |
| (26 | )% | |
| | | |
| (17 | )% | |
| | | |
| (8 | )% | |
| | | |
| (63 | )% | |
| | | |
| (58 | )% | |
| | |
| Constant currency YoY change | |
| (24 | )% | |
| | | |
| (14 | )% | |
| | | |
| (5 | )% | |
| | | |
| (63 | )% | |
| | | |
| (57 | )% | |
| | |
| Gross margin % | |
| 40.2 | % | |
| 39.6 | % | |
| 38.3 | % | |
| 34.7 | % | |
| 47.6 | % | |
| 43.8 | % | |
| 100.0 | % | |
| 99.9 | % | |
| 8.0 | % | |
| (10.2 | )% |
| Operating profit/(loss) | |
| 279 | | |
| 431 | | |
| 281 | | |
| 201 | | |
| 223 | | |
| 147 | | |
| 169 | | |
| 564 | | |
| (106 | ) | |
| (189 | ) |
| Operating
margin % | |
| 13.9 | % | |
| 15.9 | % | |
| 11.5 | % | |
| 6.8 | % | |
| 22.8 | % | |
| 13.9 | % | |
| 67.3 | % | |
| 83.1 | % | |
| (424.0 | )% | |
| (320.3 | )% |
SHAREHOLDER DISTRIBUTION
Dividend
The Board of Directors proposes that
the Annual General Meeting 2024 authorizes the Board to resolve on the distribution of an aggregate maximum of EUR 0.13 per share to
be paid in respect of the financial year 2023. The authorization would be used to distribute dividend and/or assets from the reserve
for invested unrestricted equity in four installments during the authorization period, in connection with the quarterly results, unless
the Board decides otherwise for a justified reason.
Under the authorization
by the Annual General Meeting held on 4 April 2023, the Board of Directors may resolve on the distribution of an aggregate maximum of
EUR 0.12 per share to be paid in respect of financial year 2022. The authorization will be used to distribute dividend and/or assets
from the reserve for invested unrestricted equity in four installments during the authorization period, in connection with the quarterly
results, unless the Board decides otherwise for a justified reason.
| | | 5 |
| | STOCK EXCHANGE RELEASE 25 January 2024 |
On 25 January
2024, the Board resolved to distribute a dividend of EUR 0.03 per
share. The dividend record date is on 30 January 2024 and the dividend will be paid on 8 February 2024. The actual dividend payment date
outside Finland will be determined by the practices of the intermediary banks transferring the dividend payments.
Following this
announced distribution of the fourth installment and executed payments of the previous installments, the Board has no remaining distribution
authorization.
Share buyback program
Nokia’s Board of Directors is
initiating a share buyback program under the current authorization from the Annual General Meeting to repurchase shares, with purchases
expected to begin in Q1. The program targets to return up to EUR 600 million of cash to shareholders in tranches over a period of two
years, subject to continued authorization from the Annual General Meeting.
In February
2022, Nokia’s Board of Directors initiated a share buyback program to repurchase shares to return up to EUR 600 million of cash
to shareholders in tranches over a period of two years. The second EUR 300 million phase of the share buyback program started in January
2023 and was completed in November 2023. Under this phase, Nokia repurchased
78 301 011 of its own shares at an average price per share of approximately EUR 3.83. The repurchases reduced the Company's unrestricted
equity by EUR 300 million and the repurchased shares were cancelled in November 2023.
OUTLOOK
| |
Full
Year 2024 |
| Comparable
operating profit1 |
EUR
2.3 billion to EUR 2.9 billion |
| Free
cash flow1 |
30%
to 60% conversion from comparable operating profit |
1Please refer to Performance
measures section in Nokia Corporation Financial Report for Q4 and full year 2023 for a full explanation of how these terms are defined.
The outlook, long-term targets and all
of the underlying outlook assumptions described below are forward-looking statements subject to a number of risks and uncertainties as
described or referred to in the Risk Factors section later in this release. Along with Nokia's official outlook targets provided above,
below are outlook assumptions by business group that support the group level outlook.
| |
Nokia
business group assumptions |
| |
Net
sales growth (constant currency) |
Operating
margin |
| Network
Infrastructure |
+2%
to +8% |
11.5%
to 14.5% |
| Mobile
Networks |
-15%
to -10% |
1.0%
to 4.0% |
| Cloud
and Network Services |
-2%
to +3% |
6.0%
to 9.0% |
| | | 6 |
| | STOCK EXCHANGE RELEASE 25 January 2024 |
Nokia provides the following approximate
outlook assumptions for additional items concerning 2024:
| |
Full
year 2024 |
Comment |
| Seasonality
|
H2
weighted |
Nokia
expects Q1 net sales in its networks businesses (consisting of Network Infrastructure, Mobile Networks and Cloud and Network Services)
to show an approximately normal seasonal decline sequentially. Since 2016 the average Q1 sequential decline in sales has been -23%.
Nokia expects significant seasonality in profit generation in 2024 with low sales coverage to weigh on operating profit in Q1, particularly
in MN and CNS. The company then expects progressive improvement in these businesses through the year. |
| Nokia
Technologies operating profit |
at
least
EUR 1.4 billion |
Nokia
assumes operating profit in 2024 for Nokia Technologies of at least EUR 1.4 billion which assumes resolution of outstanding renewals
and includes catch-up net sales related to prior periods. Nokia expects cash generation in Nokia Technologies to be EUR 700 million
below operating profit in 2024 due to prepayments received in 2023. From 2025 onwards Nokia expects greater alignment between cash
generation and operating profit in Nokia Technologies. |
| Group
Common and Other operating expenses |
EUR
350 million |
This
includes central function costs which are expected to be largely stable at approximately EUR 200 million and an increase in investment
in long-term research to approximately EUR 150 million. |
| Comparable
financial income and expenses |
EUR
0 to negative EUR 100 million |
|
| Comparable
income tax rate |
~25% |
|
| Cash
outflows related to income taxes |
EUR
500 million |
|
| Capital
Expenditures |
EUR
600 million |
|
2026 TARGETS
On 12 December 2023, as a conclusion
to Nokia's long-range planning process, the company decided to lower its comparable operating margin target to be achieved by 2026 from
the prior at least 14% to at least 13%. Nokia still sees a path to achieving the at least 14% comparable operating margin target but
considering the current market conditions in Mobile Networks, this was deemed a prudent change. Nokia sees further opportunities to increase
margins beyond 2026 and believes this 14% target remains achievable over the longer term.
| Net
sales |
Grow
faster than the market |
| Comparable
operating margin1 |
≥
13% |
| Free
cash flow1 |
55%
to 85% conversion from comparable operating profit |
1 Please refer to Performance
measures section in Nokia Corporation Financial Report for Q4 and full year 2023 report for a full explanation of how these terms are
defined.
The comparable operating margin target
for Nokia Group is built on the following assumptions by business group for 2026:
| Network
Infrastructure |
12
- 15% operating margin |
| Mobile
Networks |
6
- 9% operating margin |
| Cloud
and Network Services |
7
- 10% operating margin |
| Nokia
Technologies |
Operating
profit more than EUR 1.1 billion |
| Group
common and other |
Approximately
EUR 300 million of operating expenses |
| | | 7 |
| | STOCK EXCHANGE RELEASE 25 January 2024 |
RISK FACTORS
Nokia and its businesses are exposed
to a number of risks and uncertainties which include but are not limited to:
| • | Competitive
intensity, which is expected to continue at a high level as some competitors seek to take
share; |
| • | Our
ability to ensure competitiveness of our product roadmaps and costs through additional R&D
investments; |
| • | Our
ability to procure certain standard components and the costs thereof, such as semiconductors; |
| • | Disturbance
in the global supply chain; |
| • | Accelerating
inflation, increased global macro-uncertainty, major currency fluctuations and higher interest
rates; |
| • | Potential
economic impact and disruption of global pandemics; |
| • | War
or other geopolitical conflicts, disruptions and potential costs thereof; |
| • | Other
macroeconomic, industry and competitive developments; |
| • | Timing
and value of new, renewed and existing patent licensing agreements with smartphone vendors,
automotive companies, consumer electronics companies and other licensees; |
| • | Results
in brand and technology licensing; costs to protect and enforce our intellectual property
rights; on-going litigation with respect to licensing and regulatory landscape for patent
licensing; |
| • | The
outcomes of on-going and potential disputes and litigation; |
| • | Timing
of completions and acceptances of certain projects; |
| • | Our
product and regional mix; |
| • | Uncertainty
in forecasting income tax expenses and cash outflows, over the long-term, as they are also
subject to possible changes due to business mix, the timing of patent licensing cash flow
and changes in tax legislation, including potential tax reforms in various countries and
OECD initiatives; |
| • | Our
ability to utilize our Finnish deferred tax assets and their recognition on our balance sheet; |
| • | Our
ability to meet our sustainability and other ESG targets, including our targets relating
to greenhouse gas emissions; |
as well the risk factors specified under
Forward-looking statements of this release, and our 2022 annual report on Form 20-F published
on 2 March 2023 under Operating and financial review and prospects-Risk factors.
FORWARD-LOOKING STATEMENTS
Certain statements herein that are not
historical facts are forward-looking statements. These forward-looking statements reflect Nokia's current expectations and views of future
developments and include statements regarding: A) expectations, plans, benefits or outlook related to our strategies, product launches,
growth management, licenses, sustainability and other ESG targets, operational key performance indicators and decisions on market exits;
B) expectations, plans or benefits related to future performance of our businesses (including the expected impact, timing and duration
of potential global pandemics and the general or regional macroeconomic conditions on our businesses, our supply chain and our customers’
businesses) and any future dividends and other distributions of profit; C) expectations and targets regarding financial performance and
results of operations, including market share, prices, net sales, income, margins, cash flows, cost savings, the timing of receivables,
operating expenses, provisions, impairments, taxes, currency exchange rates, hedging, investment funds, inflation, product cost reductions,
competitiveness, revenue generation in any specific region, and licensing income and payments; D) ability to execute, expectations, plans
or benefits related to changes in organizational structure and operating model; E) impact on revenue with respect to litigation/renewal
discussions; and F) any statements preceded by or including "continue", “believe”, “commit”, “estimate”,
“expect”, “aim”, “influence”, "will”, “target”, “likely”, “intend”,
“may”, “could”, “would” or similar expressions. These forward-looking statements are subject to a
number of risks and uncertainties, many of which are beyond our control, which could cause our actual results to differ materially from
such statements. These statements are based on management’s best assumptions and beliefs in light of the information currently
available to them. These forward-looking statements are only predictions based upon our current expectations and views of future events
and developments and are subject to risks and uncertainties that are difficult to predict because they relate to events and depend on
circumstances that will occur in the future. Factors, including risks and uncertainties that could cause these differences, include those
risks and uncertainties identified in the Risk Factors above.
| | | 8 |
| | STOCK EXCHANGE RELEASE 25 January 2024 |
ANALYST WEBCAST
| • | Nokia's
webcast will begin on 25 January 2024 at 11.30 a.m. Finnish time (EET). The webcast
will last approximately 60 minutes. |
| • | The
webcast will be a presentation followed by a Q&A session. Presentation slides will be
available for download at www.nokia.com/financials. |
| • | A
link to the webcast will be available at www.nokia.com/financials. |
| • | Media
representatives can listen in via the link, or alternatively call +1-412-317-5619. |
FINANCIAL CALENDAR
| • | Nokia
plans to publish its "Nokia in 2023" annual report, which includes the review by
the Board of Directors and the audited annual accounts, during the week starting on 26 February
2024. |
| • | Nokia's
Annual General Meeting 2024 is planned to be held on 3 April 2024. |
| • | Nokia
plans to publish its first quarter 2024 results on 18 April 2024. |
| • | Nokia
plans to publish its second quarter and half year 2024 results on 18 July 2024. |
| • | Nokia
plans to publish its third quarter and January-September 2024 results on 17 October 2024. |
About Nokia
At Nokia, we create technology that
helps the world act together.
As a B2B technology innovation leader,
we are pioneering networks that sense, think and act by leveraging our work across mobile, fixed and cloud networks. In addition, we
create value with intellectual property and long-term research, led by the award-winning Nokia Bell Labs.
Service providers, enterprises and partners
worldwide trust Nokia to deliver secure, reliable and sustainable networks today – and work with us to create the digital services
and applications of the future.
Inquiries:
Nokia
Communications
Phone: +358 10 448 4900
Email:
press.services@nokia.com
Kaisa Antikainen,
Communications Manager
Nokia
Investor Relations
Phone: +358 4080 3 4080
Email:
investor.relations@nokia.com
| Report for Q4 and full year 2023
Improving order intake and cash flow at the end of a challenging year
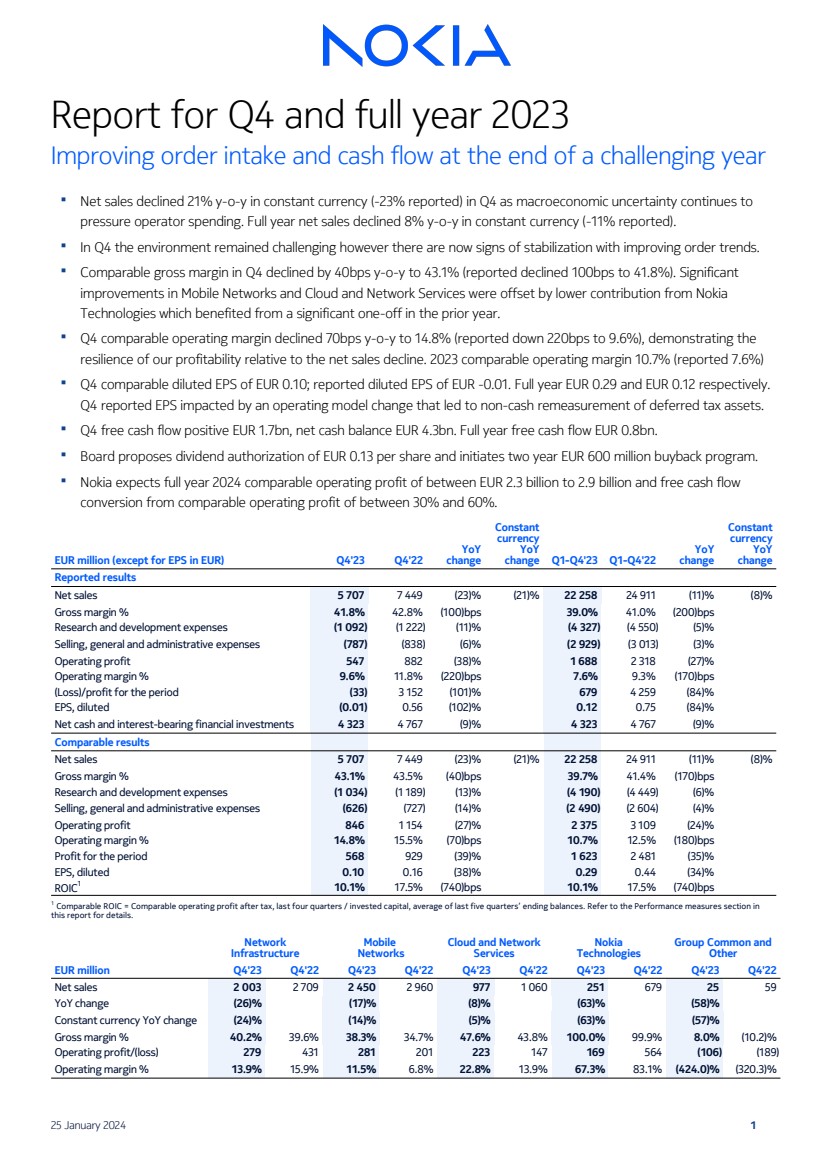
▪ Net sales declined 21% y-o-y in constant currency (-23% reported) in Q4 as macroeconomic uncertainty continues to
pressure operator spending. Full year net sales declined 8% y-o-y in constant currency (-11% reported).
▪ In Q4 the environment remained challenging however there are now signs of stabilization with improving order trends.
▪ Comparable gross margin in Q4 declined by 40bps y-o-y to 43.1% (reported declined 100bps to 41.8%). Significant
improvements in Mobile Networks and Cloud and Network Services were offset by lower contribution from Nokia
Technologies which benefited from a significant one-off in the prior year.
▪ Q4 comparable operating margin declined 70bps y-o-y to 14.8% (reported down 220bps to 9.6%), demonstrating the
resilience of our profitability relative to the net sales decline. 2023 comparable operating margin 10.7% (reported 7.6%)
▪ Q4 comparable diluted EPS of EUR 0.10; reported diluted EPS of EUR -0.01. Full year EUR 0.29 and EUR 0.12 respectively.
Q4 reported EPS impacted by an operating model change that led to non-cash remeasurement of deferred tax assets.
▪ Q4 free cash flow positive EUR 1.7bn, net cash balance EUR 4.3bn. Full year free cash flow EUR 0.8bn.
▪ Board proposes dividend authorization of EUR 0.13 per share and initiates two year EUR 600 million buyback program.
▪ Nokia expects full year 2024 comparable operating profit of between EUR 2.3 billion to 2.9 billion and free cash flow
conversion from comparable operating profit of between 30% and 60%.
EUR million (except for EPS in EUR) Q4'23 Q4'22
YoY
change
Constant
currency
YoY
change Q1-Q4'23 Q1-Q4'22
YoY
change
Constant
currency
YoY
change
Reported results
Net sales 5 707 7 449 (23)% (21)% 22 258 24 911 (11)% (8)%
Gross margin % 41.8% 42.8% (100)bps 39.0% 41.0% (200)bps
Research and development expenses (1 092) (1 222) (11)% (4 327) (4 550) (5)%
Selling, general and administrative expenses (787) (838) (6)% (2 929) (3 013) (3)%
Operating profit 547 882 (38)% 1 688 2 318 (27)%
Operating margin % 9.6% 11.8% (220)bps 7.6% 9.3% (170)bps
(Loss)/profit for the period (33) 3 152 (101)% 679 4 259 (84)%
EPS, diluted (0.01) 0.56 (102)% 0.12 0.75 (84)%
Net cash and interest-bearing financial investments 4 323 4 767 (9)% 4 323 4 767 (9)%
Comparable results
Net sales 5 707 7 449 (23)% (21)% 22 258 24 911 (11)% (8)%
Gross margin % 43.1% 43.5% (40)bps 39.7% 41.4% (170)bps
Research and development expenses (1 034) (1 189) (13)% (4 190) (4 449) (6)%
Selling, general and administrative expenses (626) (727) (14)% (2 490) (2 604) (4)%
Operating profit 846 1 154 (27)% 2 375 3 109 (24)%
Operating margin % 14.8% 15.5% (70)bps 10.7% 12.5% (180)bps
Profit for the period 568 929 (39)% 1 623 2 481 (35)%
EPS, diluted 0.10 0.16 (38)% 0.29 0.44 (34)%
ROIC1
10.1% 17.5% (740)bps 10.1% 17.5% (740)bps
1
Comparable ROIC = Comparable operating profit after tax, last four quarters / invested capital, average of last five quarters’ ending balances. Refer to the Performance measures section in
this report for details.
Network
Infrastructure
Mobile
Networks
Cloud and Network
Services
Nokia
Technologies
Group Common and
Other
EUR million Q4'23 Q4'22 Q4'23 Q4'22 Q4'23 Q4'22 Q4'23 Q4'22 Q4'23 Q4'22
Net sales 2 003 2 709 2 450 2 960 977 1 060 251 679 25 59
YoY change (26)% (17)% (8)% (63)% (58)%
Constant currency YoY change (24)% (14)% (5)% (63)% (57)%
Gross margin % 40.2% 39.6% 38.3% 34.7% 47.6% 43.8% 100.0% 99.9% 8.0% (10.2)%
Operating profit/(loss) 279 431 281 201 223 147 169 564 (106) (189)
Operating margin % 13.9% 15.9% 11.5% 6.8% 22.8% 13.9% 67.3% 83.1% (424.0)% (320.3)%
25 January 2024 1 |
| In 2023 we saw a meaningful shift in customer behavior
impacting our industry driven by the macro-economic
environment and high interest rates along with customer
inventory digestion. This led to our full year net sales declining
by 8% in constant currency. Proactive action across our
organization meant we were able to protect our profitability
while continuing to invest in R&D and we delivered a
comparable operating margin of 10.7% for the full year. This
was a resilient performance considering the challenging
environment and lower contribution from our high margin
patent licensing business as some renewals remained
outstanding.
Looking specifically at the fourth quarter those same factors
drove a net sales decline of 21% y-o-y in constant currency.
Encouragingly we saw improvements in our gross margin across
several of our businesses which, combined with continued cost
discipline, helped us to deliver a strong comparable operating
margin of 14.8%. In addition, we have seen a significant
improvement in order intake in the fourth quarter, particularly
in Network Infrastructure, indicating at least some
improvement in the overall spending environment.
We delivered well in 2023 against our strategic pillar of growing
in Enterprise with 16% net sales growth in constant currency
and this customer segment now accounts for over 10% of our
group net sales. Growth in the fourth quarter was muted at
-3% in constant currency as we faced a tough comparison
period. We continue to have strong momentum in this segment
and expect another year of double-digit growth in 2024.
In Network Infrastructure we made important progress in a
number of areas in the quarter. We received further webscale
orders for our IP Routing business which supports our
expectations of significant growth in webscale in 2024. In the
fourth quarter we also saw good progress in the US
government initiatives in Fixed Networks and we continue to
expect these programs to increasingly benefit our net sales in
the second half of 2024 and into 2025. The fourth quarter also
saw us sign a new and significant customer in Asia for our Fixed
Wireless Access products. In Optical Networks we continue to
have good momentum and our new PSE-6s solutions are
proving their capabilities in the field; recent live network trials
set a new record of 800Gbps transmission on a single
wavelength over 6 600km.
Mobile Networks net sales performance continued to be
challenging in the fourth quarter, but we did see a further
important improvement in gross margin which benefited from
a product mix shift towards software. AT&T’s announcement in
December to move to a largely single-sourced RAN network
was a disappointing development. It does not reflect the
technological competitiveness we have achieved with our
products as evidenced by our significant increase in RAN
market share in recent years. I firmly believe we have the right
strategy in place for Mobile Networks to create value for our
shareholders into the future with opportunities to gain share,
diversify our business and achieve a double-digit operating
margin longer-term.
Our Cloud and Network Services business had a strong year. We
had a slight decline in net sales for the full year, but we made
progress on profitability with a largely stable gross margin and
improved operating margin. The business continued to
rebalance its portfolio, with the divestment of its Device
Management and Service Management Platform businesses in
December. During 2023, we led the industry trend towards
programmable networks with the launch of our Network as
Code platform which now has 9 commercial agreements and we
also achieved our first commercial deal for 5G Core as a service
to CSPs.
In Nokia Technologies, we signed significant long-term deals
with both Apple and Samsung in 2023 and we also signed a
deal with Honor late in the year. I am also pleased that we have
now signed a multi-year agreement with OPPO and we are
close to concluding another agreement in China. After these,
we are in the final stages of our smartphone license renewal
cycle with only one other, recently expired, major agreement
outstanding. This provides long-term stability to our Nokia
Technologies business which will continue to focus on growing
our licensing run-rate in new growth areas including
automotive, consumer electronics, IoT and multimedia. I remain
confident that with growth in these areas we can return to an
annual net sales run-rate of EUR 1.4 to 1.5 billion in Nokia
Technologies in the mid-term.
A clear positive in the fourth quarter was our cash flow
performance. We generated EUR 1.7 billion of free cash flow as
we saw a significant improvement in working capital in the
quarter supported by a partial prepayment of a licensing
agreement. We ended the year with a net cash position of EUR
4.3 billion. The Board is proposing a dividend of EUR 0.13 per
share in respect of the financial year 2023 and considering we
now hold excess cash at the end of the year, the Board is also
instituting a new share buyback program of EUR 600 million to
be executed in the next two years.
Looking ahead, we expect the challenging environment of 2023
to continue during the first half of 2024, particularly in the first
quarter. However, we are now starting to see some green
shoots on the horizon, with improving order intake for Network
Infrastructure and some of the specific deals we have won. This
is expected to drive a strong improvement in Network
Infrastructure net sales growth in the second half of 2024
which we believe, even with a challenging first half, will drive
solid growth for the full year. In Mobile Networks, we expect top
line challenges in 2024 related to a more normalized pace of
investment in India and the AT&T decision. We do expect
further improvement in gross margin and then in the second
half we will start to see more benefits from our cost savings
program. At the Nokia level, we currently estimate that we will
deliver comparable operating profit of between EUR 2.3 and
2.9 billion in 2024. We also target to deliver an improved free
cash flow performance with conversion of between 30% and
60%.
I want to thank all our people for their resilience and
determination to deliver these results and executing on our
corporate strategy in what can only be described as a highly
challenging market environment.
25 January 2024 2 |
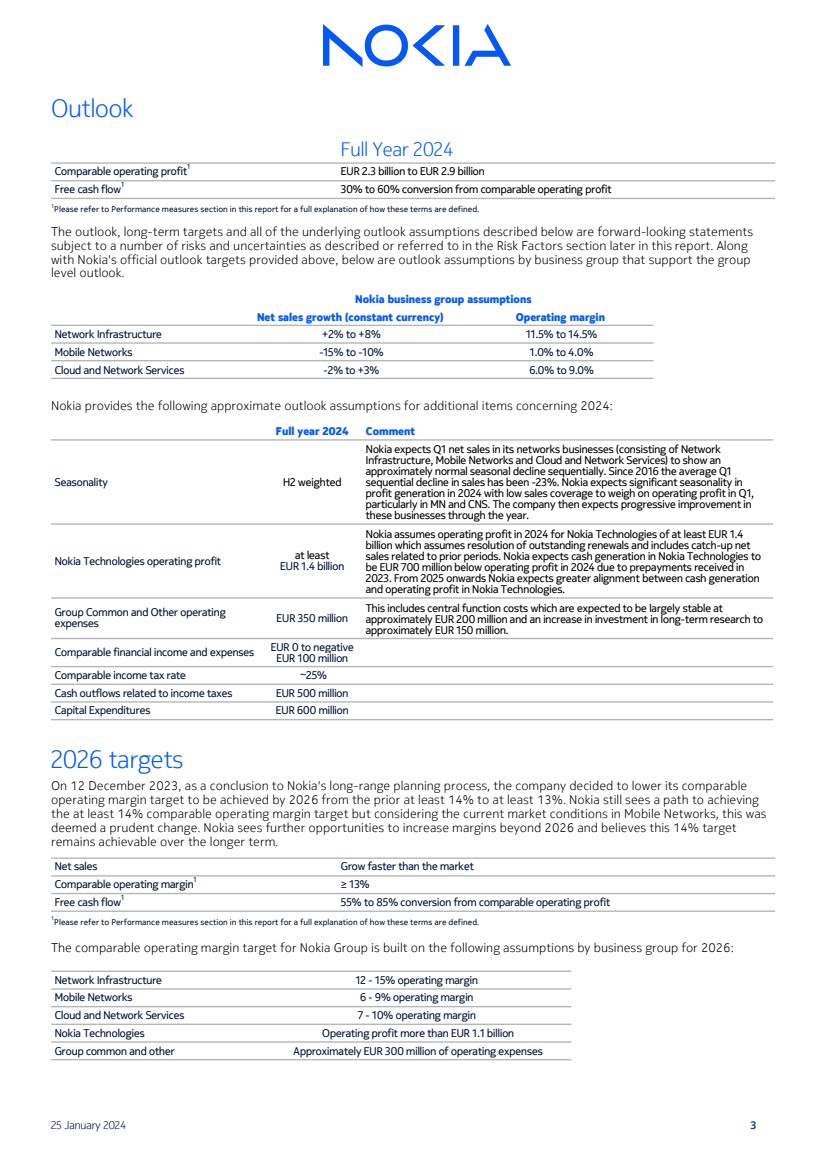
| Outlook
Full Year 2024
Comparable operating profit1
EUR 2.3 billion to EUR 2.9 billion
Free cash flow1
30% to 60% conversion from comparable operating profit
1
Please refer to Performance measures section in this report for a full explanation of how these terms are defined.
The outlook, long-term targets and all of the underlying outlook assumptions described below are forward-looking statements
subject to a number of risks and uncertainties as described or referred to in the Risk Factors section later in this report. Along
with Nokia's official outlook targets provided above, below are outlook assumptions by business group that support the group
level outlook.
Nokia business group assumptions
Net sales growth (constant currency) Operating margin
Network Infrastructure +2% to +8% 11.5% to 14.5%
Mobile Networks -15% to -10% 1.0% to 4.0%
Cloud and Network Services -2% to +3% 6.0% to 9.0%
Nokia provides the following approximate outlook assumptions for additional items concerning 2024:
Full year 2024 Comment
Seasonality H2 weighted
Nokia expects Q1 net sales in its networks businesses (consisting of Network
Infrastructure, Mobile Networks and Cloud and Network Services) to show an
approximately normal seasonal decline sequentially. Since 2016 the average Q1
sequential decline in sales has been -23%. Nokia expects significant seasonality in
profit generation in 2024 with low sales coverage to weigh on operating profit in Q1,
particularly in MN and CNS. The company then expects progressive improvement in
these businesses through the year.
Nokia Technologies operating profit at least
EUR 1.4 billion
Nokia assumes operating profit in 2024 for Nokia Technologies of at least EUR 1.4
billion which assumes resolution of outstanding renewals and includes catch-up net
sales related to prior periods. Nokia expects cash generation in Nokia Technologies to
be EUR 700 million below operating profit in 2024 due to prepayments received in
2023. From 2025 onwards Nokia expects greater alignment between cash generation
and operating profit in Nokia Technologies.
Group Common and Other operating
expenses EUR 350 million
This includes central function costs which are expected to be largely stable at
approximately EUR 200 million and an increase in investment in long-term research to
approximately EUR 150 million.
Comparable financial income and expenses EUR 0 to negative
EUR 100 million
Comparable income tax rate ~25%
Cash outflows related to income taxes EUR 500 million
Capital Expenditures EUR 600 million
2026 targets
On 12 December 2023, as a conclusion to Nokia's long-range planning process, the company decided to lower its comparable
operating margin target to be achieved by 2026 from the prior at least 14% to at least 13%. Nokia still sees a path to achieving
the at least 14% comparable operating margin target but considering the current market conditions in Mobile Networks, this was
deemed a prudent change. Nokia sees further opportunities to increase margins beyond 2026 and believes this 14% target
remains achievable over the longer term.
Net sales Grow faster than the market
Comparable operating margin1
≥ 13%
Free cash flow1
55% to 85% conversion from comparable operating profit
1
Please refer to Performance measures section in this report for a full explanation of how these terms are defined.
The comparable operating margin target for Nokia Group is built on the following assumptions by business group for 2026:
Network Infrastructure 12 - 15% operating margin
Mobile Networks 6 - 9% operating margin
Cloud and Network Services 7 - 10% operating margin
Nokia Technologies Operating profit more than EUR 1.1 billion
Group common and other Approximately EUR 300 million of operating expenses
25 January 2024 3 |
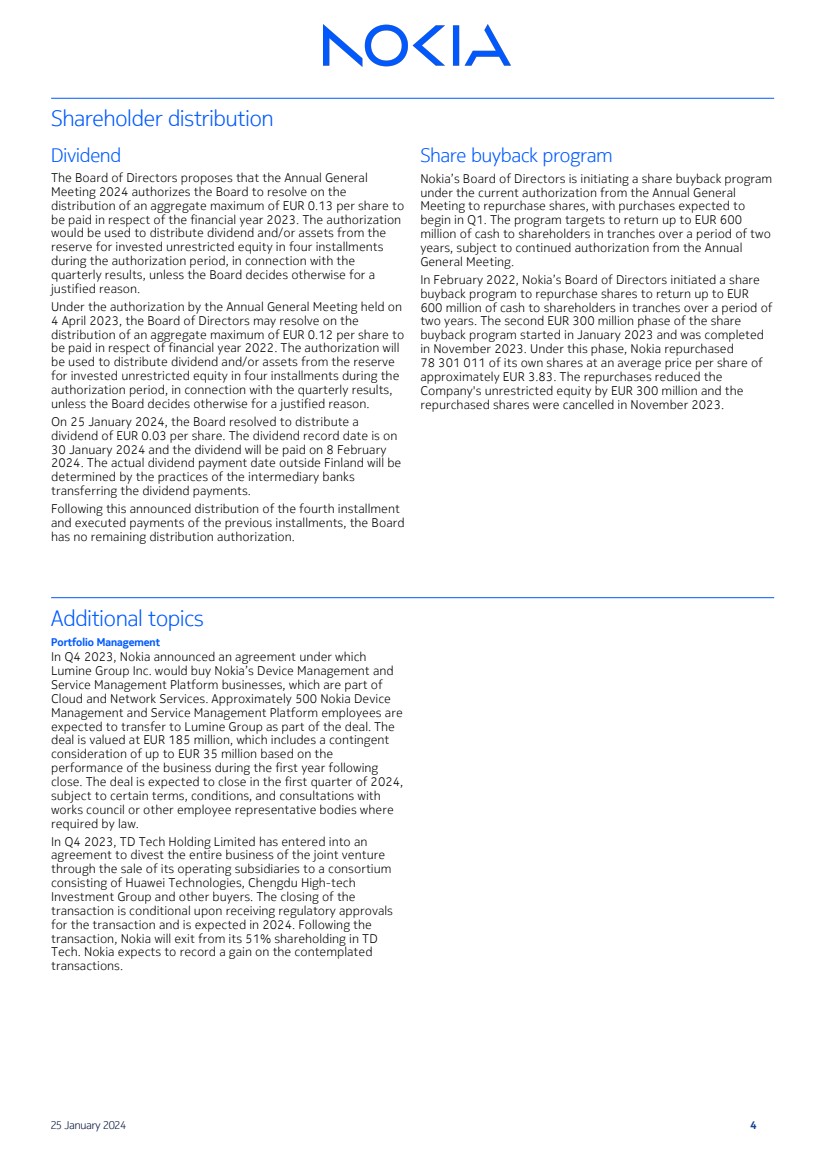
| Shareholder distribution
Dividend
The Board of Directors proposes that the Annual General
Meeting 2024 authorizes the Board to resolve on the
distribution of an aggregate maximum of EUR 0.13 per share to
be paid in respect of the financial year 2023. The authorization
would be used to distribute dividend and/or assets from the
reserve for invested unrestricted equity in four installments
during the authorization period, in connection with the
quarterly results, unless the Board decides otherwise for a
justified reason.
Under the authorization by the Annual General Meeting held on
4 April 2023, the Board of Directors may resolve on the
distribution of an aggregate maximum of EUR 0.12 per share to
be paid in respect of financial year 2022. The authorization will
be used to distribute dividend and/or assets from the reserve
for invested unrestricted equity in four installments during the
authorization period, in connection with the quarterly results,
unless the Board decides otherwise for a justified reason.
On 25 January 2024, the Board resolved to distribute a
dividend of EUR 0.03 per share. The dividend record date is on
30 January 2024 and the dividend will be paid on 8 February
2024. The actual dividend payment date outside Finland will be
determined by the practices of the intermediary banks
transferring the dividend payments.
Following this announced distribution of the fourth installment
and executed payments of the previous installments, the Board
has no remaining distribution authorization.
Share buyback program
Nokia’s Board of Directors is initiating a share buyback program
under the current authorization from the Annual General
Meeting to repurchase shares, with purchases expected to
begin in Q1. The program targets to return up to EUR 600
million of cash to shareholders in tranches over a period of two
years, subject to continued authorization from the Annual
General Meeting.
In February 2022, Nokia’s Board of Directors initiated a share
buyback program to repurchase shares to return up to EUR
600 million of cash to shareholders in tranches over a period of
two years. The second EUR 300 million phase of the share
buyback program started in January 2023 and was completed
in November 2023. Under this phase, Nokia repurchased
78 301 011 of its own shares at an average price per share of
approximately EUR 3.83. The repurchases reduced the
Company's unrestricted equity by EUR 300 million and the
repurchased shares were cancelled in November 2023.
Additional topics
Portfolio Management
In Q4 2023, Nokia announced an agreement under which
Lumine Group Inc. would buy Nokia’s Device Management and
Service Management Platform businesses, which are part of
Cloud and Network Services. Approximately 500 Nokia Device
Management and Service Management Platform employees are
expected to transfer to Lumine Group as part of the deal. The
deal is valued at EUR 185 million, which includes a contingent
consideration of up to EUR 35 million based on the
performance of the business during the first year following
close. The deal is expected to close in the first quarter of 2024,
subject to certain terms, conditions, and consultations with
works council or other employee representative bodies where
required by law.
In Q4 2023, TD Tech Holding Limited has entered into an
agreement to divest the entire business of the joint venture
through the sale of its operating subsidiaries to a consortium
consisting of Huawei Technologies, Chengdu High-tech
Investment Group and other buyers. The closing of the
transaction is conditional upon receiving regulatory approvals
for the transaction and is expected in 2024. Following the
transaction, Nokia will exit from its 51% shareholding in TD
Tech. Nokia expects to record a gain on the contemplated
transactions.
25 January 2024 4 |
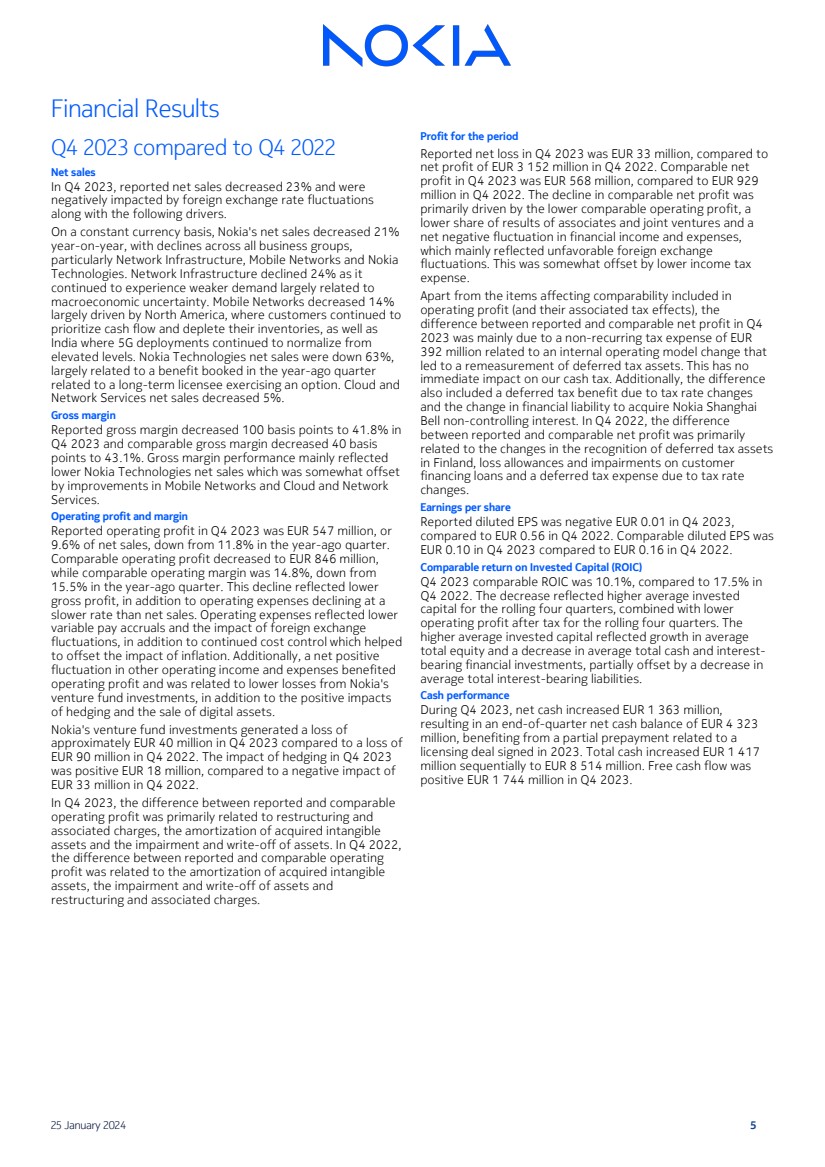
| Financial Results
Q4 2023 compared to Q4 2022
Net sales
In Q4 2023, reported net sales decreased 23% and were
negatively impacted by foreign exchange rate fluctuations
along with the following drivers.
On a constant currency basis, Nokia's net sales decreased 21%
year-on-year, with declines across all business groups,
particularly Network Infrastructure, Mobile Networks and Nokia
Technologies. Network Infrastructure declined 24% as it
continued to experience weaker demand largely related to
macroeconomic uncertainty. Mobile Networks decreased 14%
largely driven by North America, where customers continued to
prioritize cash flow and deplete their inventories, as well as
India where 5G deployments continued to normalize from
elevated levels. Nokia Technologies net sales were down 63%,
largely related to a benefit booked in the year-ago quarter
related to a long-term licensee exercising an option. Cloud and
Network Services net sales decreased 5%.
Gross margin
Reported gross margin decreased 100 basis points to 41.8% in
Q4 2023 and comparable gross margin decreased 40 basis
points to 43.1%. Gross margin performance mainly reflected
lower Nokia Technologies net sales which was somewhat offset
by improvements in Mobile Networks and Cloud and Network
Services.
Operating profit and margin
Reported operating profit in Q4 2023 was EUR 547 million, or
9.6% of net sales, down from 11.8% in the year-ago quarter.
Comparable operating profit decreased to EUR 846 million,
while comparable operating margin was 14.8%, down from
15.5% in the year-ago quarter. This decline reflected lower
gross profit, in addition to operating expenses declining at a
slower rate than net sales. Operating expenses reflected lower
variable pay accruals and the impact of foreign exchange
fluctuations, in addition to continued cost control which helped
to offset the impact of inflation. Additionally, a net positive
fluctuation in other operating income and expenses benefited
operating profit and was related to lower losses from Nokia's
venture fund investments, in addition to the positive impacts
of hedging and the sale of digital assets.
Nokia's venture fund investments generated a loss of
approximately EUR 40 million in Q4 2023 compared to a loss of
EUR 90 million in Q4 2022. The impact of hedging in Q4 2023
was positive EUR 18 million, compared to a negative impact of
EUR 33 million in Q4 2022.
In Q4 2023, the difference between reported and comparable
operating profit was primarily related to restructuring and
associated charges, the amortization of acquired intangible
assets and the impairment and write-off of assets. In Q4 2022,
the difference between reported and comparable operating
profit was related to the amortization of acquired intangible
assets, the impairment and write-off of assets and
restructuring and associated charges.
Profit for the period
Reported net loss in Q4 2023 was EUR 33 million, compared to
net profit of EUR 3 152 million in Q4 2022. Comparable net
profit in Q4 2023 was EUR 568 million, compared to EUR 929
million in Q4 2022. The decline in comparable net profit was
primarily driven by the lower comparable operating profit, a
lower share of results of associates and joint ventures and a
net negative fluctuation in financial income and expenses,
which mainly reflected unfavorable foreign exchange
fluctuations. This was somewhat offset by lower income tax
expense.
Apart from the items affecting comparability included in
operating profit (and their associated tax effects), the
difference between reported and comparable net profit in Q4
2023 was mainly due to a non-recurring tax expense of EUR
392 million related to an internal operating model change that
led to a remeasurement of deferred tax assets. This has no
immediate impact on our cash tax. Additionally, the difference
also included a deferred tax benefit due to tax rate changes
and the change in financial liability to acquire Nokia Shanghai
Bell non-controlling interest. In Q4 2022, the difference
between reported and comparable net profit was primarily
related to the changes in the recognition of deferred tax assets
in Finland, loss allowances and impairments on customer
financing loans and a deferred tax expense due to tax rate
changes.
Earnings per share
Reported diluted EPS was negative EUR 0.01 in Q4 2023,
compared to EUR 0.56 in Q4 2022. Comparable diluted EPS was
EUR 0.10 in Q4 2023 compared to EUR 0.16 in Q4 2022.
Comparable return on Invested Capital (ROIC)
Q4 2023 comparable ROIC was 10.1%, compared to 17.5% in
Q4 2022. The decrease reflected higher average invested
capital for the rolling four quarters, combined with lower
operating profit after tax for the rolling four quarters. The
higher average invested capital reflected growth in average
total equity and a decrease in average total cash and interest-bearing financial investments, partially offset by a decrease in
average total interest-bearing liabilities.
Cash performance
During Q4 2023, net cash increased EUR 1 363 million,
resulting in an end-of-quarter net cash balance of EUR 4 323
million, benefiting from a partial prepayment related to a
licensing deal signed in 2023. Total cash increased EUR 1 417
million sequentially to EUR 8 514 million. Free cash flow was
positive EUR 1 744 million in Q4 2023.
25 January 2024 5 |
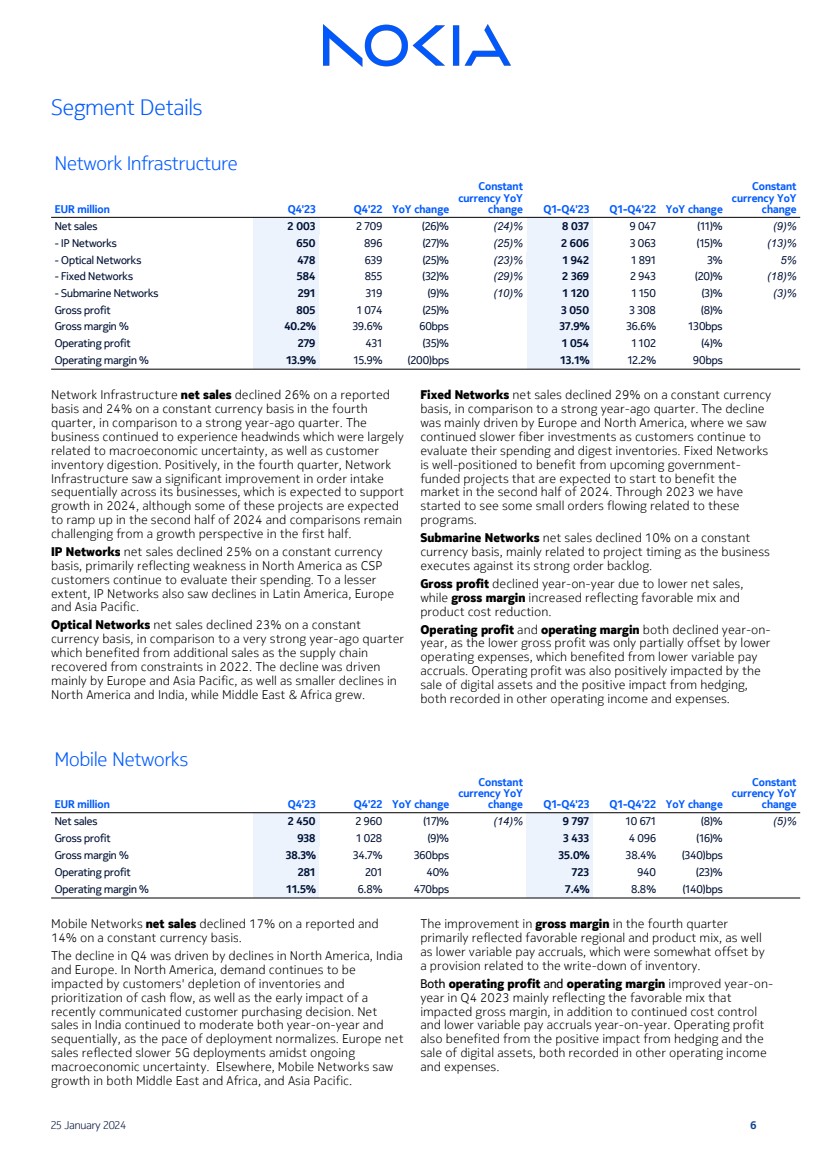
| Segment Details
Network Infrastructure
EUR million Q4'23 Q4'22 YoY change
Constant
currency YoY
change Q1-Q4'23 Q1-Q4'22 YoY change
Constant
currency YoY
change
Net sales 2 003 2 709 (26)% (24)% 8 037 9 047 (11)% (9)%
- IP Networks 650 896 (27)% (25)% 2 606 3 063 (15)% (13)%
- Optical Networks 478 639 (25)% (23)% 1 942 1 891 3% 5%
- Fixed Networks 584 855 (32)% (29)% 2 369 2 943 (20)% (18)%
- Submarine Networks 291 319 (9)% (10)% 1 120 1 150 (3)% (3)%
Gross profit 805 1 074 (25)% 3 050 3 308 (8)%
Gross margin % 40.2% 39.6% 60bps 37.9% 36.6% 130bps
Operating profit 279 431 (35)% 1 054 1 102 (4)%
Operating margin % 13.9% 15.9% (200)bps 13.1% 12.2% 90bps
Network Infrastructure net sales declined 26% on a reported
basis and 24% on a constant currency basis in the fourth
quarter, in comparison to a strong year-ago quarter. The
business continued to experience headwinds which were largely
related to macroeconomic uncertainty, as well as customer
inventory digestion. Positively, in the fourth quarter, Network
Infrastructure saw a significant improvement in order intake
sequentially across its businesses, which is expected to support
growth in 2024, although some of these projects are expected
to ramp up in the second half of 2024 and comparisons remain
challenging from a growth perspective in the first half.
IP Networks net sales declined 25% on a constant currency
basis, primarily reflecting weakness in North America as CSP
customers continue to evaluate their spending. To a lesser
extent, IP Networks also saw declines in Latin America, Europe
and Asia Pacific.
Optical Networks net sales declined 23% on a constant
currency basis, in comparison to a very strong year-ago quarter
which benefited from additional sales as the supply chain
recovered from constraints in 2022. The decline was driven
mainly by Europe and Asia Pacific, as well as smaller declines in
North America and India, while Middle East & Africa grew.
Fixed Networks net sales declined 29% on a constant currency
basis, in comparison to a strong year-ago quarter. The decline
was mainly driven by Europe and North America, where we saw
continued slower fiber investments as customers continue to
evaluate their spending and digest inventories. Fixed Networks
is well-positioned to benefit from upcoming government-funded projects that are expected to start to benefit the
market in the second half of 2024. Through 2023 we have
started to see some small orders flowing related to these
programs.
Submarine Networks net sales declined 10% on a constant
currency basis, mainly related to project timing as the business
executes against its strong order backlog.
Gross profit declined year-on-year due to lower net sales,
while gross margin increased reflecting favorable mix and
product cost reduction.
Operating profit and operating margin both declined year-on-year, as the lower gross profit was only partially offset by lower
operating expenses, which benefited from lower variable pay
accruals. Operating profit was also positively impacted by the
sale of digital assets and the positive impact from hedging,
both recorded in other operating income and expenses.
Mobile Networks
EUR million Q4'23 Q4'22 YoY change
Constant
currency YoY
change Q1-Q4'23 Q1-Q4'22 YoY change
Constant
currency YoY
change
Net sales 2 450 2 960 (17)% (14)% 9 797 10 671 (8)% (5)%
Gross profit 938 1 028 (9)% 3 433 4 096 (16)%
Gross margin % 38.3% 34.7% 360bps 35.0% 38.4% (340)bps
Operating profit 281 201 40% 723 940 (23)%
Operating margin % 11.5% 6.8% 470bps 7.4% 8.8% (140)bps
Mobile Networks net sales declined 17% on a reported and
14% on a constant currency basis.
The decline in Q4 was driven by declines in North America, India
and Europe. In North America, demand continues to be
impacted by customers' depletion of inventories and
prioritization of cash flow, as well as the early impact of a
recently communicated customer purchasing decision. Net
sales in India continued to moderate both year-on-year and
sequentially, as the pace of deployment normalizes. Europe net
sales reflected slower 5G deployments amidst ongoing
macroeconomic uncertainty. Elsewhere, Mobile Networks saw
growth in both Middle East and Africa, and Asia Pacific.
The improvement in gross margin in the fourth quarter
primarily reflected favorable regional and product mix, as well
as lower variable pay accruals, which were somewhat offset by
a provision related to the write-down of inventory.
Both operating profit and operating margin improved year-on-year in Q4 2023 mainly reflecting the favorable mix that
impacted gross margin, in addition to continued cost control
and lower variable pay accruals year-on-year. Operating profit
also benefited from the positive impact from hedging and the
sale of digital assets, both recorded in other operating income
and expenses.
25 January 2024 6 |
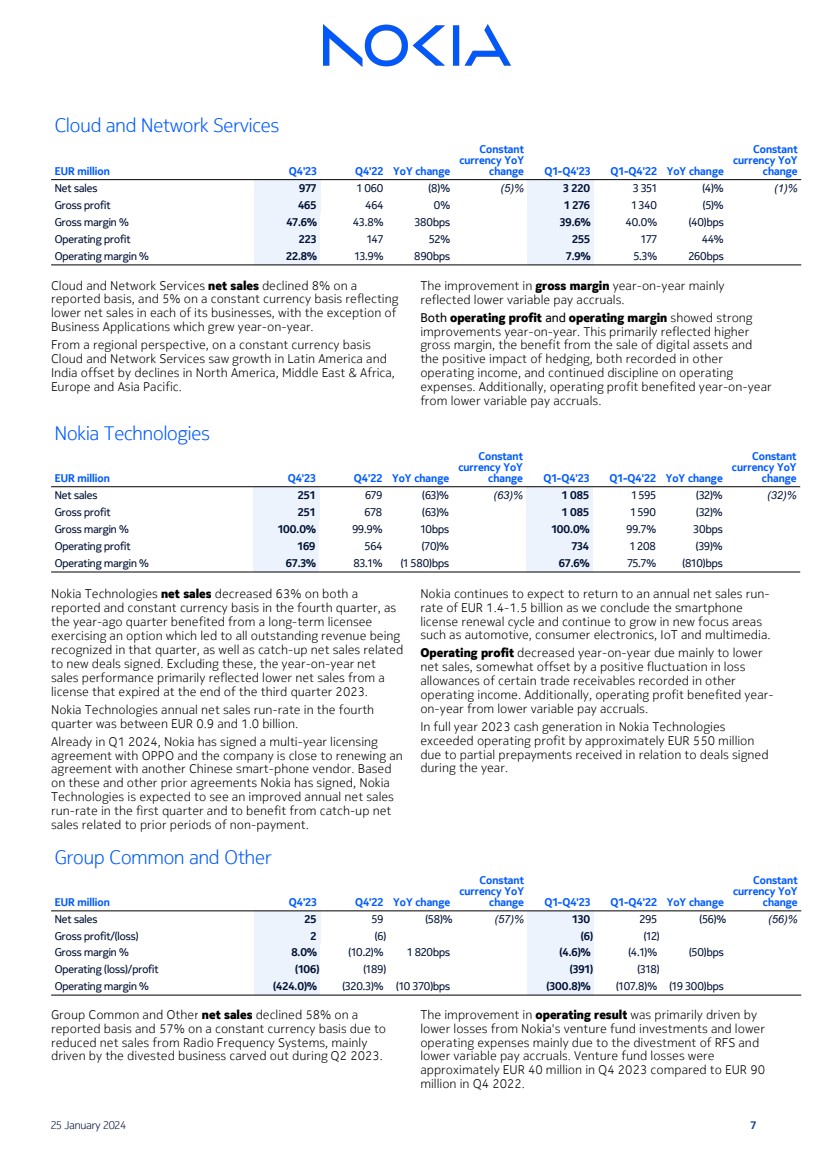
| Cloud and Network Services
EUR million Q4'23 Q4'22 YoY change
Constant
currency YoY
change Q1-Q4'23 Q1-Q4'22 YoY change
Constant
currency YoY
change
Net sales 977 1 060 (8)% (5)% 3 220 3 351 (4)% (1)%
Gross profit 465 464 0% 1 276 1 340 (5)%
Gross margin % 47.6% 43.8% 380bps 39.6% 40.0% (40)bps
Operating profit 223 147 52% 255 177 44%
Operating margin % 22.8% 13.9% 890bps 7.9% 5.3% 260bps
Cloud and Network Services net sales declined 8% on a
reported basis, and 5% on a constant currency basis reflecting
lower net sales in each of its businesses, with the exception of
Business Applications which grew year-on-year.
From a regional perspective, on a constant currency basis
Cloud and Network Services saw growth in Latin America and
India offset by declines in North America, Middle East & Africa,
Europe and Asia Pacific.
The improvement in gross margin year-on-year mainly
reflected lower variable pay accruals.
Both operating profit and operating margin showed strong
improvements year-on-year. This primarily reflected higher
gross margin, the benefit from the sale of digital assets and
the positive impact of hedging, both recorded in other
operating income, and continued discipline on operating
expenses. Additionally, operating profit benefited year-on-year
from lower variable pay accruals.
Nokia Technologies
EUR million Q4'23 Q4'22 YoY change
Constant
currency YoY
change Q1-Q4'23 Q1-Q4'22 YoY change
Constant
currency YoY
change
Net sales 251 679 (63)% (63)% 1 085 1 595 (32)% (32)%
Gross profit 251 678 (63)% 1 085 1 590 (32)%
Gross margin % 100.0% 99.9% 10bps 100.0% 99.7% 30bps
Operating profit 169 564 (70)% 734 1 208 (39)%
Operating margin % 67.3% 83.1% (1 580)bps 67.6% 75.7% (810)bps
Nokia Technologies net sales decreased 63% on both a
reported and constant currency basis in the fourth quarter, as
the year-ago quarter benefited from a long-term licensee
exercising an option which led to all outstanding revenue being
recognized in that quarter, as well as catch-up net sales related
to new deals signed. Excluding these, the year-on-year net
sales performance primarily reflected lower net sales from a
license that expired at the end of the third quarter 2023.
Nokia Technologies annual net sales run-rate in the fourth
quarter was between EUR 0.9 and 1.0 billion.
Already in Q1 2024, Nokia has signed a multi-year licensing
agreement with OPPO and the company is close to renewing an
agreement with another Chinese smart-phone vendor. Based
on these and other prior agreements Nokia has signed, Nokia
Technologies is expected to see an improved annual net sales
run-rate in the first quarter and to benefit from catch-up net
sales related to prior periods of non-payment.
Nokia continues to expect to return to an annual net sales run-rate of EUR 1.4-1.5 billion as we conclude the smartphone
license renewal cycle and continue to grow in new focus areas
such as automotive, consumer electronics, IoT and multimedia.
Operating profit decreased year-on-year due mainly to lower
net sales, somewhat offset by a positive fluctuation in loss
allowances of certain trade receivables recorded in other
operating income. Additionally, operating profit benefited year-on-year from lower variable pay accruals.
In full year 2023 cash generation in Nokia Technologies
exceeded operating profit by approximately EUR 550 million
due to partial prepayments received in relation to deals signed
during the year.
Group Common and Other
EUR million Q4'23 Q4'22 YoY change
Constant
currency YoY
change Q1-Q4'23 Q1-Q4'22 YoY change
Constant
currency YoY
change
Net sales 25 59 (58) % (57)% 130 295 (56) % (56)%
Gross profit/(loss) 2 (6) (6) (12)
Gross margin % 8.0% (10.2)% 1 820bps (4.6)% (4.1)% (50)bps
Operating (loss)/profit (106) (189) (391) (318)
Operating margin % (424.0)% (320.3)% (10 370)bps (300.8)% (107.8)% (19 300)bps
Group Common and Other net sales declined 58% on a
reported basis and 57% on a constant currency basis due to
reduced net sales from Radio Frequency Systems, mainly
driven by the divested business carved out during Q2 2023.
The improvement in operating result was primarily driven by
lower losses from Nokia's venture fund investments and lower
operating expenses mainly due to the divestment of RFS and
lower variable pay accruals. Venture fund losses were
approximately EUR 40 million in Q4 2023 compared to EUR 90
million in Q4 2022.
25 January 2024 7 |
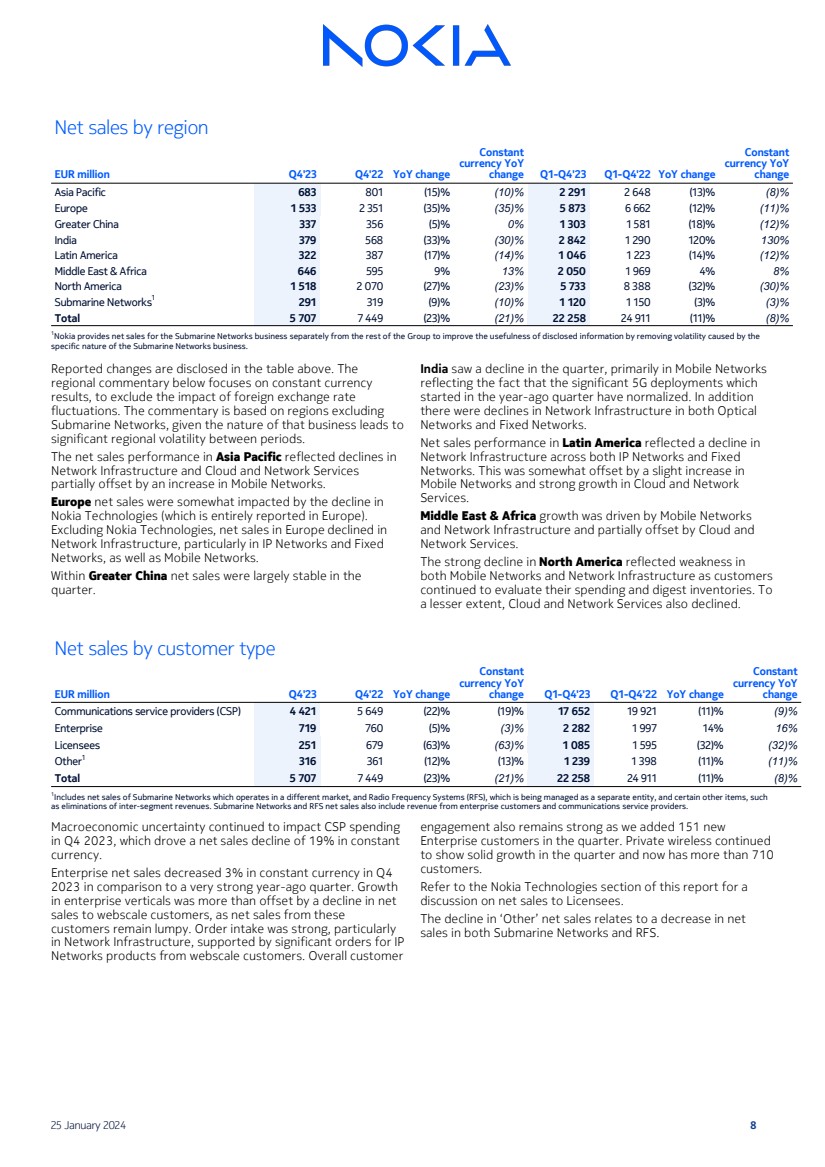
| Net sales by region
EUR million Q4'23 Q4'22 YoY change
Constant
currency YoY
change Q1-Q4'23 Q1-Q4'22 YoY change
Constant
currency YoY
change
Asia Pacific 683 801 (15)% (10)% 2 291 2 648 (13)% (8)%
Europe 1 533 2 351 (35)% (35)% 5 873 6 662 (12)% (11)%
Greater China 337 356 (5)% 0% 1 303 1 581 (18)% (12)%
India 379 568 (33)% (30)% 2 842 1 290 120% 130%
Latin America 322 387 (17)% (14)% 1 046 1 223 (14)% (12)%
Middle East & Africa 646 595 9% 13% 2 050 1 969 4% 8%
North America 1 518 2 070 (27)% (23)% 5 733 8 388 (32)% (30)%
Submarine Networks1
291 319 (9)% (10)% 1 120 1 150 (3)% (3)%
Total 5 707 7 449 (23)% (21)% 22 258 24 911 (11)% (8)%
1Nokia provides net sales for the Submarine Networks business separately from the rest of the Group to improve the usefulness of disclosed information by removing volatility caused by the
specific nature of the Submarine Networks business.
Reported changes are disclosed in the table above. The
regional commentary below focuses on constant currency
results, to exclude the impact of foreign exchange rate
fluctuations. The commentary is based on regions excluding
Submarine Networks, given the nature of that business leads to
significant regional volatility between periods.
The net sales performance in Asia Pacific reflected declines in
Network Infrastructure and Cloud and Network Services
partially offset by an increase in Mobile Networks.
Europe net sales were somewhat impacted by the decline in
Nokia Technologies (which is entirely reported in Europe).
Excluding Nokia Technologies, net sales in Europe declined in
Network Infrastructure, particularly in IP Networks and Fixed
Networks, as well as Mobile Networks.
Within Greater China net sales were largely stable in the
quarter.
India saw a decline in the quarter, primarily in Mobile Networks
reflecting the fact that the significant 5G deployments which
started in the year-ago quarter have normalized. In addition
there were declines in Network Infrastructure in both Optical
Networks and Fixed Networks.
Net sales performance in Latin America reflected a decline in
Network Infrastructure across both IP Networks and Fixed
Networks. This was somewhat offset by a slight increase in
Mobile Networks and strong growth in Cloud and Network
Services.
Middle East & Africa growth was driven by Mobile Networks
and Network Infrastructure and partially offset by Cloud and
Network Services.
The strong decline in North America reflected weakness in
both Mobile Networks and Network Infrastructure as customers
continued to evaluate their spending and digest inventories. To
a lesser extent, Cloud and Network Services also declined.
Net sales by customer type
EUR million Q4'23 Q4'22 YoY change
Constant
currency YoY
change Q1-Q4'23 Q1-Q4'22 YoY change
Constant
currency YoY
change
Communications service providers (CSP) 4 421 5 649 (22)% (19)% 17 652 19 921 (11)% (9)%
Enterprise 719 760 (5)% (3)% 2 282 1 997 14% 16%
Licensees 251 679 (63)% (63)% 1 085 1 595 (32)% (32)%
Other1
316 361 (12)% (13)% 1 239 1 398 (11)% (11)%
Total 5 707 7 449 (23)% (21)% 22 258 24 911 (11)% (8)%
1
Includes net sales of Submarine Networks which operates in a different market, and Radio Frequency Systems (RFS), which is being managed as a separate entity, and certain other items, such
as eliminations of inter-segment revenues. Submarine Networks and RFS net sales also include revenue from enterprise customers and communications service providers.
Macroeconomic uncertainty continued to impact CSP spending
in Q4 2023, which drove a net sales decline of 19% in constant
currency.
Enterprise net sales decreased 3% in constant currency in Q4
2023 in comparison to a very strong year-ago quarter. Growth
in enterprise verticals was more than offset by a decline in net
sales to webscale customers, as net sales from these
customers remain lumpy. Order intake was strong, particularly
in Network Infrastructure, supported by significant orders for IP
Networks products from webscale customers. Overall customer
engagement also remains strong as we added 151 new
Enterprise customers in the quarter. Private wireless continued
to show solid growth in the quarter and now has more than 710
customers.
Refer to the Nokia Technologies section of this report for a
discussion on net sales to Licensees.
The decline in ‘Other’ net sales relates to a decrease in net
sales in both Submarine Networks and RFS.
25 January 2024 8 |
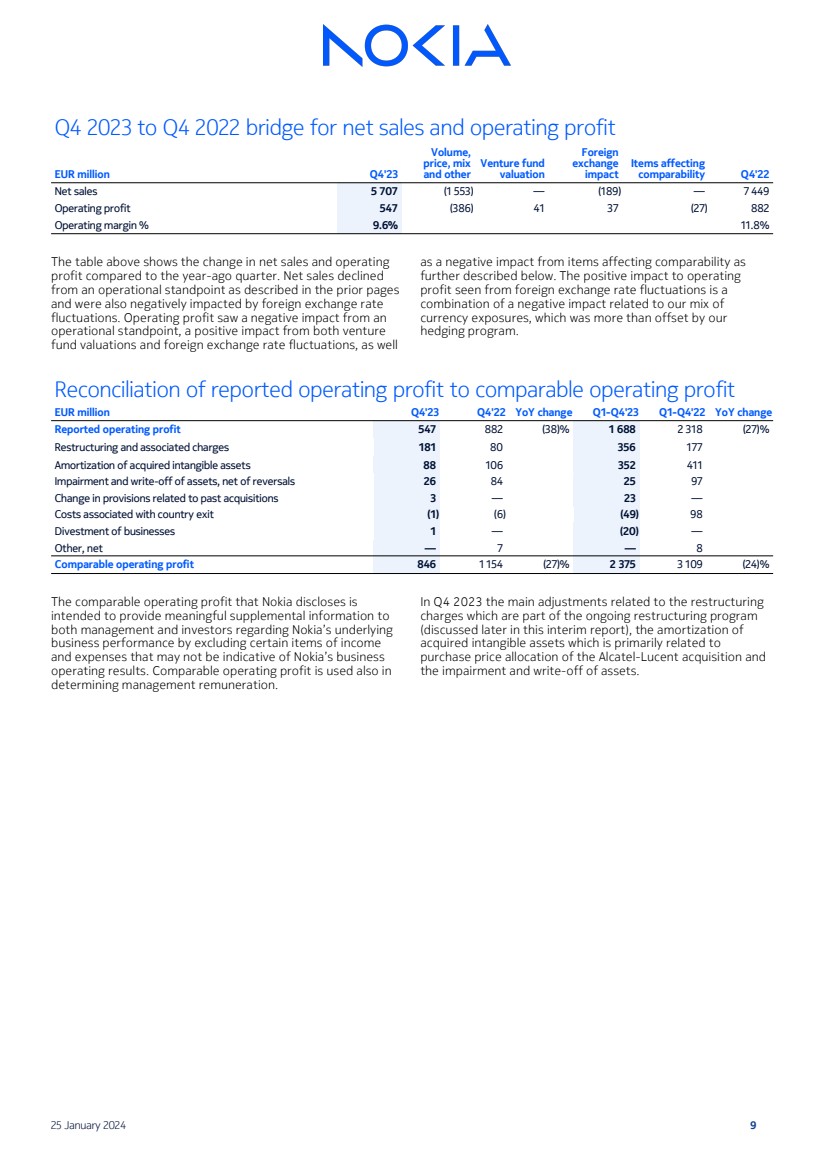
| Q4 2023 to Q4 2022 bridge for net sales and operating profit
EUR million Q4'23
Volume,
price, mix
and other
Venture fund
valuation
Foreign
exchange
impact
Items affecting
comparability Q4'22
Net sales 5 707 (1 553) — (189) — 7 449
Operating profit 547 (386) 41 37 (27) 882
Operating margin % 9.6% 11.8%
The table above shows the change in net sales and operating
profit compared to the year-ago quarter. Net sales declined
from an operational standpoint as described in the prior pages
and were also negatively impacted by foreign exchange rate
fluctuations. Operating profit saw a negative impact from an
operational standpoint, a positive impact from both venture
fund valuations and foreign exchange rate fluctuations, as well
as a negative impact from items affecting comparability as
further described below. The positive impact to operating
profit seen from foreign exchange rate fluctuations is a
combination of a negative impact related to our mix of
currency exposures, which was more than offset by our
hedging program.
Reconciliation of reported operating profit to comparable operating profit
EUR million Q4'23 Q4'22 YoY change Q1-Q4'23 Q1-Q4'22 YoY change
Reported operating profit 547 882 (38)% 1 688 2 318 (27)%
Restructuring and associated charges 181 80 356 177
Amortization of acquired intangible assets 88 106 352 411
Impairment and write-off of assets, net of reversals 26 84 25 97
Change in provisions related to past acquisitions 3 — 23 —
Costs associated with country exit (1) (6) (49) 98
Divestment of businesses 1 — (20) —
Other, net — 7 — 8
Comparable operating profit 846 1 154 (27)% 2 375 3 109 (24)%
The comparable operating profit that Nokia discloses is
intended to provide meaningful supplemental information to
both management and investors regarding Nokia’s underlying
business performance by excluding certain items of income
and expenses that may not be indicative of Nokia’s business
operating results. Comparable operating profit is used also in
determining management remuneration.
In Q4 2023 the main adjustments related to the restructuring
charges which are part of the ongoing restructuring program
(discussed later in this interim report), the amortization of
acquired intangible assets which is primarily related to
purchase price allocation of the Alcatel-Lucent acquisition and
the impairment and write-off of assets.
25 January 2024 9 |
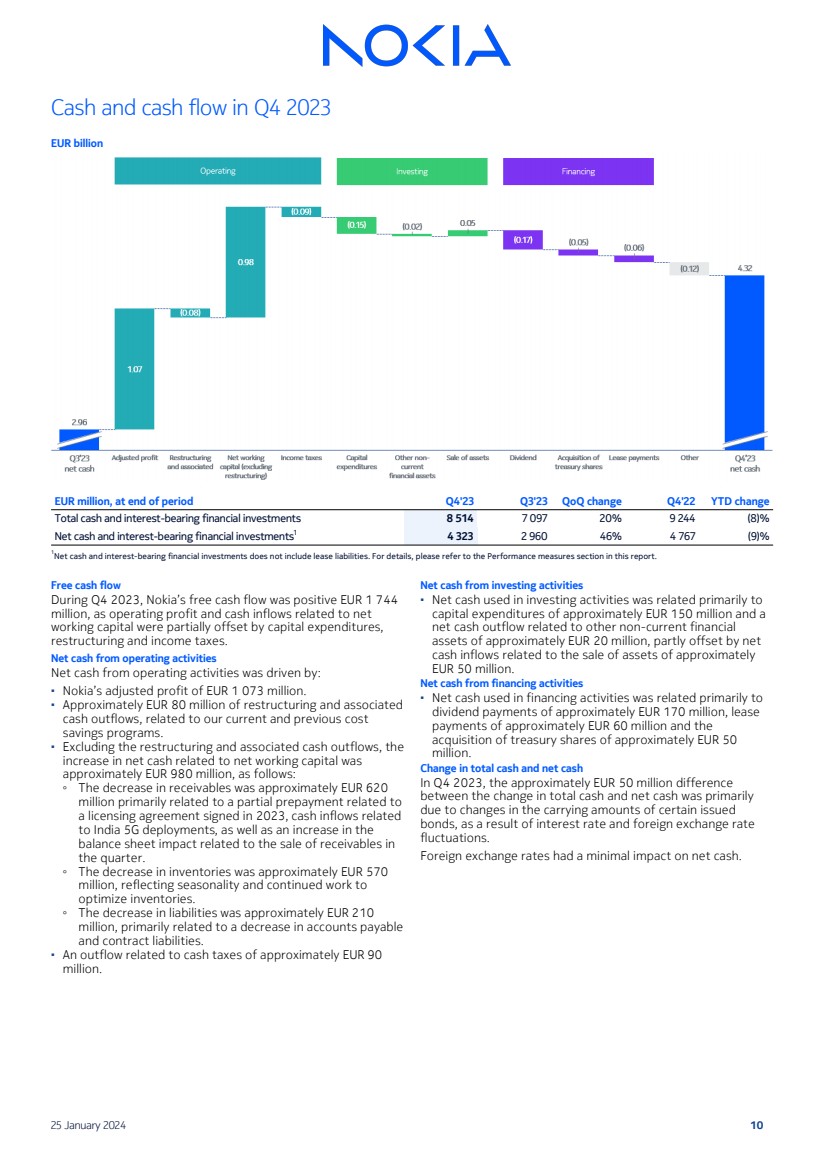
| Cash and cash flow in Q4 2023
EUR billion
EUR million, at end of period Q4'23 Q3'23 QoQ change Q4'22 YTD change
Total cash and interest-bearing financial investments 8 514 7 097 20% 9 244 (8)%
Net cash and interest-bearing financial investments1
4 323 2 960 46% 4 767 (9)%
1Net cash and interest-bearing financial investments does not include lease liabilities. For details, please refer to the Performance measures section in this report.
Free cash flow
During Q4 2023, Nokia’s free cash flow was positive EUR 1 744
million, as operating profit and cash inflows related to net
working capital were partially offset by capital expenditures,
restructuring and income taxes.
Net cash from operating activities
Net cash from operating activities was driven by:
▪ Nokia’s adjusted profit of EUR 1 073 million.
▪ Approximately EUR 80 million of restructuring and associated
cash outflows, related to our current and previous cost
savings programs.
▪ Excluding the restructuring and associated cash outflows, the
increase in net cash related to net working capital was
approximately EUR 980 million, as follows:
◦ The decrease in receivables was approximately EUR 620
million primarily related to a partial prepayment related to
a licensing agreement signed in 2023, cash inflows related
to India 5G deployments, as well as an increase in the
balance sheet impact related to the sale of receivables in
the quarter.
◦ The decrease in inventories was approximately EUR 570
million, reflecting seasonality and continued work to
optimize inventories.
◦ The decrease in liabilities was approximately EUR 210
million, primarily related to a decrease in accounts payable
and contract liabilities.
▪ An outflow related to cash taxes of approximately EUR 90
million.
Net cash from investing activities
▪ Net cash used in investing activities was related primarily to
capital expenditures of approximately EUR 150 million and a
net cash outflow related to other non-current financial
assets of approximately EUR 20 million, partly offset by net
cash inflows related to the sale of assets of approximately
EUR 50 million.
Net cash from financing activities
▪ Net cash used in financing activities was related primarily to
dividend payments of approximately EUR 170 million, lease
payments of approximately EUR 60 million and the
acquisition of treasury shares of approximately EUR 50
million.
Change in total cash and net cash
In Q4 2023, the approximately EUR 50 million difference
between the change in total cash and net cash was primarily
due to changes in the carrying amounts of certain issued
bonds, as a result of interest rate and foreign exchange rate
fluctuations.
Foreign exchange rates had a minimal impact on net cash.
25 January 2024 10 |
| January-December 2023 compared to
January-December 2022
Net sales
In 2023, reported net sales decreased 11%, with a negative
impact from foreign exchange rate fluctuations along with the
following drivers.
On a constant currency basis, Nokia net sales decreased 8%
driven by declines across all business groups, with particular
weakness in Network Infrastructure, Mobile Networks and Nokia
Technologies.
Gross margin
Both reported and comparable gross margin declined year-on-year in 2023. Reported gross margin decreased 200 basis
points to 39.0% and comparable gross margin decreased 170
basis points to 39.7%. The gross margin decline was primarily
driven by a lower contribution from Nokia Technologies along
with unfavorable regional mix in Mobile Networks.
Operating profit and margin
Reported operating profit in 2023 was EUR 1 688 million, or
7.6% of net sales, down from EUR 2 318 million or 9.3% in
2022. Comparable operating profit decreased to EUR 2 375
million from EUR 3 109 million year-on-year, while comparable
operating margin declined 180 basis points year-on-year to
10.7%. Comparable operating profit decreased in 2023 mainly
due to lower gross profit and the impact of inflation, somewhat
offset by lower variable pay accruals year-on-year and a net
positive fluctuation in other operating income and expenses.
The net positive fluctuation in other operating income and
expenses reflected the positive impact from hedging and the
sale of digital assets, which were partly offset by the impact
from Nokia's venture fund investments.
In 2023, Nokia's operating profit saw an approximate EUR 400
million benefit from below target variable pay accruals given
Nokia's business performance in 2023. The impact of hedging
in 2023 was positive EUR 80 million, compared to a negative
impact of EUR 107 million in 2022. Nokia's venture fund
investments generated a loss of approximately EUR 70 million
in 2023 compared to a benefit of EUR 20 million in 2022.
In 2023, the difference between reported and comparable
operating profit was primarily related to restructuring and
associated charges, the amortization of acquired intangible
assets and the partial reversal of a provision associated with a
country exit. In 2022, the difference between reported and
comparable operating profit was primarily related to the
amortization of acquired intangible assets, restructuring and
associated charges, a provision associated with a country exit
and the impairment and write-off of assets.
Profit for the period
Reported net profit in 2023 was EUR 679 million, compared to
EUR 4 259 million in 2022. Comparable net profit was EUR
1 623 million, compared to EUR 2 481 million in 2022. The
decrease in comparable net profit primarily reflects a decrease
in comparable operating profit, a net negative fluctuation in
financial income and expenses and higher income taxes.
Apart from the items affecting comparability included in
operating profit (and their associated tax effects), the
difference between reported and comparable net profit in
2023 was mainly due to a non-recurring tax expense related to
an internal operating model change that led to a
remeasurement of deferred tax assets, a deferred tax benefit
due to tax rate changes, as well as an impairment of assets. In
2022, the difference between reported and comparable net
profit was mainly related to changes in the recognition of
deferred tax assets in Finland and loss allowances on customer
financing.
Earnings per share
Reported diluted EPS in 2023 was EUR 0.12, compared to EUR
0.75 in 2022. Comparable diluted EPS in 2023 was EUR 0.29
compared to EUR 0.44 in 2022.
Cash performance
At the end of 2023, Nokia had a net cash balance of EUR 4 323
million, a decrease of EUR 444 million compared to the end of
2022. Total cash decreased EUR 730 million, resulting in total
cash balance of EUR 8 514 million. Free cash flow was positive
EUR 805 million in 2023 which equates to 34% conversion from
comparable operating profit.
25 January 2024 11 |
| Sustainability
Our strategy and focus areas
Nokia’s purpose is to create technology that helps the world act together. A key enabler of our purpose is our sustainability
approach and ESG strategy. ESG as a competitive advantage is one of the six pillars of Nokia corporate strategy. Our ESG strategic
approach will help us achieve this competitive advantage by focusing on five areas: environment, industrial digitalization, security
and privacy, bridging the digital divide and responsible business. Below are some of our key ESG achievements from the fourth
quarter of 2023.
Environment
During the quarter, Nokia expanded its work on energy
efficiency, biodiversity, geodiversity and circularity.
Nokia’s public target of 50% reduction of average power
consumption of its 5G massive MIMO Base Station by 2023
from 2019 baseline was achieved through Nokia’s AirScale 5G
Base Station power consumption improvements. This was
underpinned by enhanced software functionalities and new 5G
products based on the latest generation Nokia ReefShark
System-on-Chip (SoC).
In December, we announced the deployment of our AVA Energy
Efficiency software for Safaricom Kenya. The solution helps the
operator reduce the power consumption and costs of its 5G,
4G, and 3G networks. It uses artificial intelligence and machine
learning algorithms to shut down idle and unused equipment
automatically during low usage periods, reducing energy
consumption while maintaining network performance.
In November, we announced that Nokia will deploy its fully O-RAN-compliant 5G AirScale baseband solution in NTT
DOCOMO’s commercial multi-vendor network. This solution,
which is powered by the latest ReefShark technology, will
deliver sustainability benefits as well as operational cost
savings to DOCOMO due to its small physical footprint and low
power consumption.
In November, working with our customer Deutsche Telekom, we
announced that our Fixed Networks Lightspan portfolio would
rapidly move to 100% recyclable packaging by the end of 2023.
This more sustainable product packaging is expected to lead to
a 60% decrease in packaging size and a 44% reduction in
overall weight, enabling Nokia to ship more products per pallet
and reduce CO2 emissions from transportation by up to 60%.
Nokia is also working to protect the environment and
established two new nature conservation areas in Finland. The
company now has six protected land areas totaling 131
hectares of natural forests and islands, and 110 hectares of
the Baltic Sea coastal area. In December, Nokia announced
collaboration with the University of Jyväskylä and the Finnish
Innovation Fund SITRA to improve biodiversity footprint
assessments.
Nokia announced its cooperation with Orange under the UNIDO
(United Nations Industrial Development Organization) -run
Switch to Circular Economy Value Chains (SWITCH2CE) initiative.
The project aims to accelerate circularity in developing
countries. Nokia will work closely with Orange to further
develop circular approaches in network equipment, including
setting up a new refurbishment and repair center in Egypt.
Industrial Digitalization
In the energy sector, Nokia Bell Labs and Aramco, the world’s
largest energy company, signed a non-binding R&D
collaboration agreement to drive industrial digitalization within
the Kingdom of Saudi Arabia, the Middle East, and North Africa.
The collaboration seeks to leverage research and technologies
from both companies to advance digital use-cases for a diverse
range of industries.
The importance of the twin transitions of digital and energy
was further underscored when Nokia and Ooredoo Qatar
established the Middle East and Africa’s first private wireless
network for the energy sector. The project will provide
dedicated voice and customer data services in the most
remote locations.
Security and privacy
Secure products are a critical part of the Nokia offer,
supported by initiatives such as the Product Security
Transformation Program and certification for essential 5G
products. We have set up Service Security as a separate
domain to cover the full-service lifecycle with a defined service
security framework. We remain focused on the continuous
certification of services teams in the ISO27001 standard.
Additionally, there is a program dedicated to enhancing the
security of Nokia service companies and joint ventures.
During the fourth quarter, Nokia continued its security training
program that includes annual mandatory training, quarterly
awareness campaigns, monthly phishing simulations, and
expanded initiatives to safeguard key data such as a Zero-trust
and Critical Information Protection Program.
Bridging the digital divide
Nokia renewed its partnership with UN Women. This unique
collaboration will bring together UN Women and Nokia
volunteers to provide on the ground support in 11 countries to
execute initiatives, focused on closing the digital gender gap
and addressing online violence.
Nokia and UN Women also implemented two additional Action
for Leadership programs with key customers during Q4. These
programs bring the joint expertise of women leaders from
Nokia and its key customers to develop solutions to internal
and external sustainability challenges.
Responsible business
Our value chain is a key part of how we operate as a
responsible business. As such, we seek to recognize notable
achievements of our suppliers. In October, the Nokia Diamond
Awards celebrated our suppliers for improvements in
innovation, quality and sustainability. This year Intel was
selected as winner of the Sustainability Award and recognized
for its collaboration with partners to reduce emissions of their
products.
Other strategic ESG developments
At Nokia, we believe that there is no green without digital and
that the business community has a critical role in supporting
and enabling climate action. At COP28, in Dubai, at the launch
event commemorating the inauguration of the Finland Pavilion,
we espoused the importance of digital solutions in accelerating
the response to climate change and its role in supporting hard-to-abate industries. To further underline the critical role of
digital solutions in decarbonization, Nokia brought together
representatives of the ICT sector together with the
International Telecommunications Union (ITU) to outline
commitments to accelerate the green transition. Nokia and
senior industry executives also examined how the digital
industry can embrace circular concepts in its own value chain
and explored the role of industrial digitalization. During the
conference, Nokia launched its Middle East and Africa ESG
customer advisory council with several key communication
service provider customers in the region.
25 January 2024 12 |
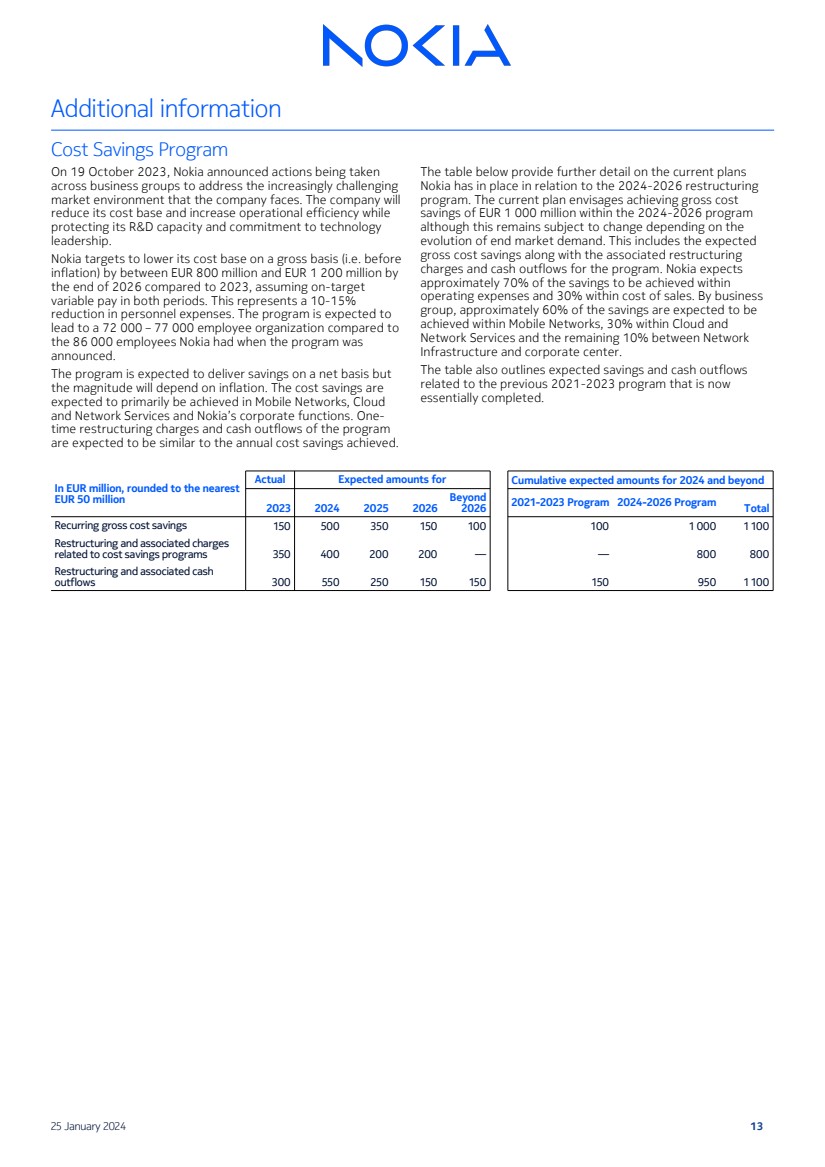
| Additional information
Cost Savings Program
On 19 October 2023, Nokia announced actions being taken
across business groups to address the increasingly challenging
market environment that the company faces. The company will
reduce its cost base and increase operational efficiency while
protecting its R&D capacity and commitment to technology
leadership.
Nokia targets to lower its cost base on a gross basis (i.e. before
inflation) by between EUR 800 million and EUR 1 200 million by
the end of 2026 compared to 2023, assuming on-target
variable pay in both periods. This represents a 10-15%
reduction in personnel expenses. The program is expected to
lead to a 72 000 – 77 000 employee organization compared to
the 86 000 employees Nokia had when the program was
announced.
The program is expected to deliver savings on a net basis but
the magnitude will depend on inflation. The cost savings are
expected to primarily be achieved in Mobile Networks, Cloud
and Network Services and Nokia’s corporate functions. One-time restructuring charges and cash outflows of the program
are expected to be similar to the annual cost savings achieved.
The table below provide further detail on the current plans
Nokia has in place in relation to the 2024-2026 restructuring
program. The current plan envisages achieving gross cost
savings of EUR 1 000 million within the 2024-2026 program
although this remains subject to change depending on the
evolution of end market demand. This includes the expected
gross cost savings along with the associated restructuring
charges and cash outflows for the program. Nokia expects
approximately 70% of the savings to be achieved within
operating expenses and 30% within cost of sales. By business
group, approximately 60% of the savings are expected to be
achieved within Mobile Networks, 30% within Cloud and
Network Services and the remaining 10% between Network
Infrastructure and corporate center.
The table also outlines expected savings and cash outflows
related to the previous 2021-2023 program that is now
essentially completed.
In EUR million, rounded to the nearest
EUR 50 million
Actual Expected amounts for Cumulative expected amounts for 2024 and beyond
2023 2024 2025 2026
Beyond
2026 2021-2023 Program 2024-2026 Program Total
Recurring gross cost savings 150 500 350 150 100 100 1 000 1 100
Restructuring and associated charges
related to cost savings programs 350 400 200 200 — — 800 800
Restructuring and associated cash
outflows 300 550 250 150 150 150 950 1 100
25 January 2024 13 |
| Significant events
January – December 2023
On 25 January 2023, Nokia announced it had appointed Esa
Niinimäki as Chief Legal Officer and member of the Group
Leadership Team. Niinimäki has worked at Nokia for more than
15 years where he has held multiple positions, most recently
Interim Chief Legal Officer.
On 9 February 2023, Nokia announced it commenced an offer
to purchase the outstanding EUR 750 million 2.00% notes due
15 March 2024 (the “2024 Notes”), EUR 500 million 2.375%
notes due 15 May 2025 (the “2025 Notes”) and EUR 750
million 2.00% notes due 11 March 2026 (the “2026 Notes”), up
to a maximum cash consideration of EUR 700 million (the
“Tender Offer”). The purpose of the Tender Offer is to manage
the overall indebtedness of Nokia and to extend Nokia’s debt
maturity profile in an efficient manner.
Nokia accepted tenders for EUR 372 million (49.66% of the
nominal amount) of the 2024 Notes, EUR 208 million (41.57%
of the nominal amount) of the 2025 Notes and EUR 120 million
(15.96% of the nominal amount) of the 2026 Notes. The
Tender Offer was settled on 21 February 2023.
On 21 February 2023, Nokia issued EUR 500 million 4.375%
sustainability-linked Notes due August 2031 under its 5 billion
Euro Medium-Term Note Programme. The proceeds of the new
notes are intended to fund the Tender Offer and for general
corporate purposes.
On 2 March 2023, Nokia informed it had updated its capital
management policy with a focus on sustaining investment
grade rating and improving shareholder returns consistent with
the performance of the business. Nokia now targets to
maintain a net cash position in the range of 10-15% of net
sales. Nokia intends to maintain a net cash position around this
level to ensure it can continue to invest in the necessary R&D
to maintain and further improve its technology leadership, fund
working capital requirements in support of the company’s
growth ambitions and to maintain some flexibility for bolt-on
acquisitions. Nokia’s previous target in terms of cash
management was to maintain a total cash position equivalent
to at least 30% of net sales.
On 4 April 2023, Nokia held its Annual General Meeting (AGM) in
Helsinki. Shareholders were also able to follow the AGM through
a webcast. Approximately 108 000 shareholders representing
approximately 3.2 billion shares and votes were represented at
the meeting. Among others, the following resolutions were
made:
▪ The financial statements were adopted, and the Board of
Directors and President and CEO were discharged from
liability for the financial year 2022.
▪ The AGM decided that no dividend is distributed by a
resolution of the AGM and authorized the Board to decide on
the distribution of an aggregate maximum of EUR 0.12 per
share as dividend from the retained earnings and/or as
assets from the reserve for invested unrestricted equity.
▪ Sari Baldauf, Thomas Dannenfeldt, Lisa Hook, Jeanette
Horan, Thomas Saueressig, Søren Skou, Carla Smits-Nusteling and Kai Öistämö were re-elected as members of
the Board for a term ending at the close of the next AGM. In
addition, the AGM resolved to elect Timo Ahopelto and
Elizabeth Crain as new members of the Board for the same
term. In its assembly meeting that took place after the AGM,
the Board re-elected Sari Baldauf as Chair of the Board and
Søren Skou as Vice Chair of the Board.
▪ The annual fees of the Board members were increased by
EUR 15 000 except for the Board Chair.
▪ The remuneration Report of the company's governing bodies
was supported in an advisory vote.
▪ Deloitte Oy was re-elected as the auditor for Nokia for the
financial year 2024 with Authorized Public Accountant Marika
Nevalainen as the auditor in charge.
▪ The Board was authorized to resolve to repurchase a
maximum of 550 million Nokia shares and to issue a
maximum of 550 million shares through issuance of shares
or special rights entitling to shares in one or more issues. The
authorizations are effective until 3 October 2024 and they
terminated the corresponding authorizations granted by the
AGM on 5 April 2022.
On 30 June 2023, Nokia announced it had signed a new long-term patent cross-license agreement with Apple replacing the
previous license that expired at the end of 2023. The license
covers Nokia’s fundamental inventions in 5G and other
technologies. The terms of the agreement remain confidential
between the parties.
On 19 October 2023, Nokia announced strategic and
operational changes to its business. The actions include
accelerating strategy execution by giving business groups more
operational autonomy and streamlining operating model by
embedding sales teams into the business groups. In addition,
Nokia announced a new program designed to lower its cost
base by EUR 800–1 200 million on a gross basis over a three-year period. The announced actions will better position Nokia
for longer-term growth and enable it to navigate the current
market uncertainty.
On 10 November 2023, Nokia announced it had completed the
second phase of the share buyback program announced in
December 2022. For more information on the share buyback
program, refer to the Shareholder distribution section in this
report.
On 5 December 2023, Nokia announced it expects its revenue
from AT&T in Mobile Networks will decrease over the next 2-3
years as a result of AT&T’s plans to commit to an Open RAN
deployment in collaboration with other vendors over the next
five years. AT&T had accounted for 5-8% of Mobile Networks
net sales in 2023 to the date of the announcement. Nokia
expects Mobile Networks to remain profitable over the coming
years, but AT&T's decision would delay the timeline of
achieving double digit operating margin by up to 2 years. Nokia
remains a key partner for AT&T within both its Network
Infrastructure and Cloud and Network Services businesses.
AT&T will also continue to buy products such as microwave
radio links and femto solutions from Mobile Networks.
On 12 December 2023, Nokia hosted an investor and analyst
event where it provided an update on its execution against its
group strategy. Nokia also revised its long-term targets for
2026 as explained in the Outlook section in this report.
After 31 December 2023
On 24 January 2024 Nokia announced that it has concluded a
multi-year patent cross-license agreement with OPPO. Under
the agreement OPPO will make royalty payments, along with
catch-up payments to cover the periods of non-payment. The
agreement resolves all pending patent litigation between the
parties, in all jurisdictions.
Shares
The total number of Nokia shares on 31 December 2023,
equaled 5 613 496 565. On 31 December 2023, Nokia and its
subsidiary companies held 87 895 712 Nokia shares,
representing approximately 1.6% of the total number of Nokia
shares and voting rights.
25 January 2024 14 |
| Risk Factors
Nokia and its businesses are exposed to a number of risks and
uncertainties which include but are not limited to:
▪ Competitive intensity, which is expected to continue at a high
level as some competitors seek to take share;
▪ Our ability to ensure competitiveness of our product
roadmaps and costs through additional R&D investments;
▪ Our ability to procure certain standard components and the
costs thereof, such as semiconductors;
▪ Disturbance in the global supply chain;
▪ Accelerating inflation, increased global macro-uncertainty,
major currency fluctuations and higher interest rates;
▪ Potential economic impact and disruption of global
pandemics;
▪ War or other geopolitical conflicts, disruptions and potential
costs thereof;
▪ Other macroeconomic, industry and competitive
developments;
▪ Timing and value of new, renewed and existing patent
licensing agreements with smartphone vendors, automotive
companies, consumer electronics companies and other
licensees;
▪ Results in brand and technology licensing; costs to protect
and enforce our intellectual property rights; on-going
litigation with respect to licensing and regulatory landscape
for patent licensing;
▪ The outcomes of on-going and potential disputes and
litigation;
▪ Timing of completions and acceptances of certain projects;
▪ Our product and regional mix;
▪ Uncertainty in forecasting income tax expenses and cash
outflows, over the long-term, as they are also subject to
possible changes due to business mix, the timing of patent
licensing cash flow and changes in tax legislation, including
potential tax reforms in various countries and OECD
initiatives;
▪ Our ability to utilize our Finnish deferred tax assets and their
recognition on our balance sheet;
▪ Our ability to meet our sustainability and other ESG targets,
including our targets relating to greenhouse gas emissions;
as well the risk factors specified under Forward-looking
statements of this report, and our 2022 annual report on Form
20-F published on 2 March 2023 under Operating and financial
review and prospects-Risk factors.
Forward-looking statements
Certain statements herein that are not historical facts are
forward-looking statements. These forward-looking
statements reflect Nokia's current expectations and views of
future developments and include statements regarding: A)
expectations, plans, benefits or outlook related to our
strategies, product launches, growth management, licenses,
sustainability and other ESG targets, operational key
performance indicators and decisions on market exits; B)
expectations, plans or benefits related to future performance
of our businesses (including the expected impact, timing and
duration of potential global pandemics and the general or
regional macroeconomic conditions on our businesses, our
supply chain and our customers’ businesses) and any future
dividends and other distributions of profit; C) expectations and
targets regarding financial performance and results of
operations, including market share, prices, net sales, income,
margins, cash flows, cost savings, the timing of receivables,
operating expenses, provisions, impairments, taxes, currency
exchange rates, hedging, investment funds, inflation, product
cost reductions, competitiveness, revenue generation in any
specific region, and licensing income and payments;
D) ability to execute, expectations, plans or benefits related to
changes in organizational structure and operating model; E)
impact on revenue with respect to litigation/renewal
discussions; and F) any statements preceded by or including
"continue", “believe”, “commit”, “estimate”, “expect”, “aim”,
“influence”, "will”, “target”, “likely”, “intend”, “may”, “could”,
“would” or similar expressions. These forward-looking
statements are subject to a number of risks and uncertainties,
many of which are beyond our control, which could cause our
actual results to differ materially from such statements. These
statements are based on management’s best assumptions and
beliefs in light of the information currently available to them.
These forward-looking statements are only predictions based
upon our current expectations and views of future events and
developments and are subject to risks and uncertainties that
are difficult to predict because they relate to events and
depend on circumstances that will occur in the future. Factors,
including risks and uncertainties that could cause these
differences, include those risks and uncertainties identified in
the Risk Factors above.
25 January 2024 15 |
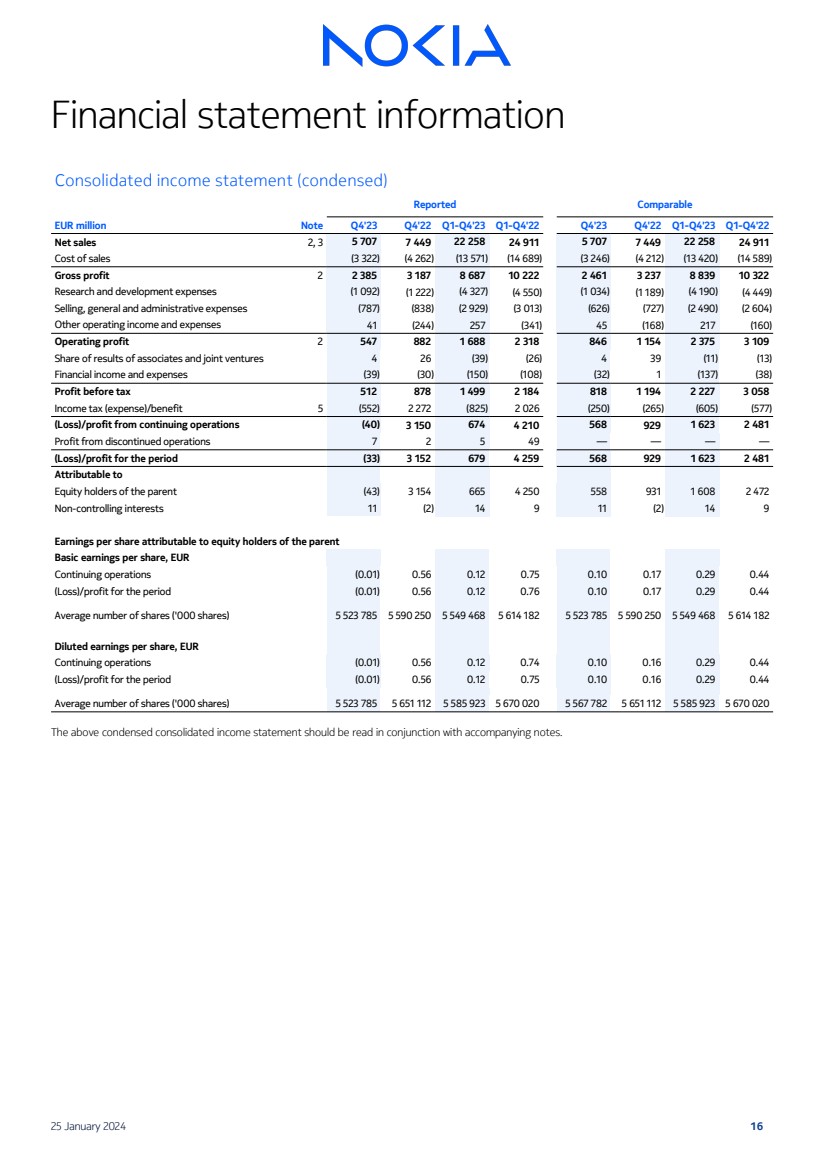
| Financial statement information
Consolidated income statement (condensed)
EUR million
Reported Comparable
Note Q4'23 Q4'22 Q1-Q4'23 Q1-Q4'22 Q4'23 Q4'22 Q1-Q4'23 Q1-Q4'22
Net sales 2, 3 5 707 7 449 22 258 24 911 5 707 7 449 22 258 24 911
Cost of sales (3 322) (4 262) (13 571) (14 689) (3 246) (4 212) (13 420) (14 589)
Gross profit 2 2 385 3 187 8 687 10 222 2 461 3 237 8 839 10 322
Research and development expenses (1 092) (1 222) (4 327) (4 550) (1 034) (1 189) (4 190) (4 449)
Selling, general and administrative expenses (787) (838) (2 929) (3 013) (626) (727) (2 490) (2 604)
Other operating income and expenses 41 (244) 257 (341) 45 (168) 217 (160)
Operating profit 2 547 882 1 688 2 318 846 1 154 2 375 3 109
Share of results of associates and joint ventures 4 26 (39) (26) 4 39 (11) (13)
Financial income and expenses (39) (30) (150) (108) (32) 1 (137) (38)
Profit before tax 512 878 1 499 2 184 818 1 194 2 227 3 058
Income tax (expense)/benefit 5 (552) 2 272 (825) 2 026 (250) (265) (605) (577)
(Loss)/profit from continuing operations (40) 3 150 674 4 210 568 929 1 623 2 481
Profit from discontinued operations 7 2 5 49 — — — —
(Loss)/profit for the period (33) 3 152 679 4 259 568 929 1 623 2 481
Attributable to
Equity holders of the parent (43) 3 154 665 4 250 558 931 1 608 2 472
Non-controlling interests 11 (2) 14 9 11 (2) 14 9
Earnings per share attributable to equity holders of the parent
Basic earnings per share, EUR
Continuing operations (0.01) 0.56 0.12 0.75 0.10 0.17 0.29 0.44
(Loss)/profit for the period (0.01) 0.56 0.12 0.76 0.10 0.17 0.29 0.44
Average number of shares ('000 shares) 5 523 785 5 590 250 5 549 468 5 614 182 5 523 785 5 590 250 5 549 468 5 614 182
Diluted earnings per share, EUR
Continuing operations (0.01) 0.56 0.12 0.74 0.10 0.16 0.29 0.44
(Loss)/profit for the period (0.01) 0.56 0.12 0.75 0.10 0.16 0.29 0.44
Average number of shares ('000 shares) 5 523 785 5 651 112 5 585 923 5 670 020 5 567 782 5 651 112 5 585 923 5 670 020
The above condensed consolidated income statement should be read in conjunction with accompanying notes.
25 January 2024 16 |
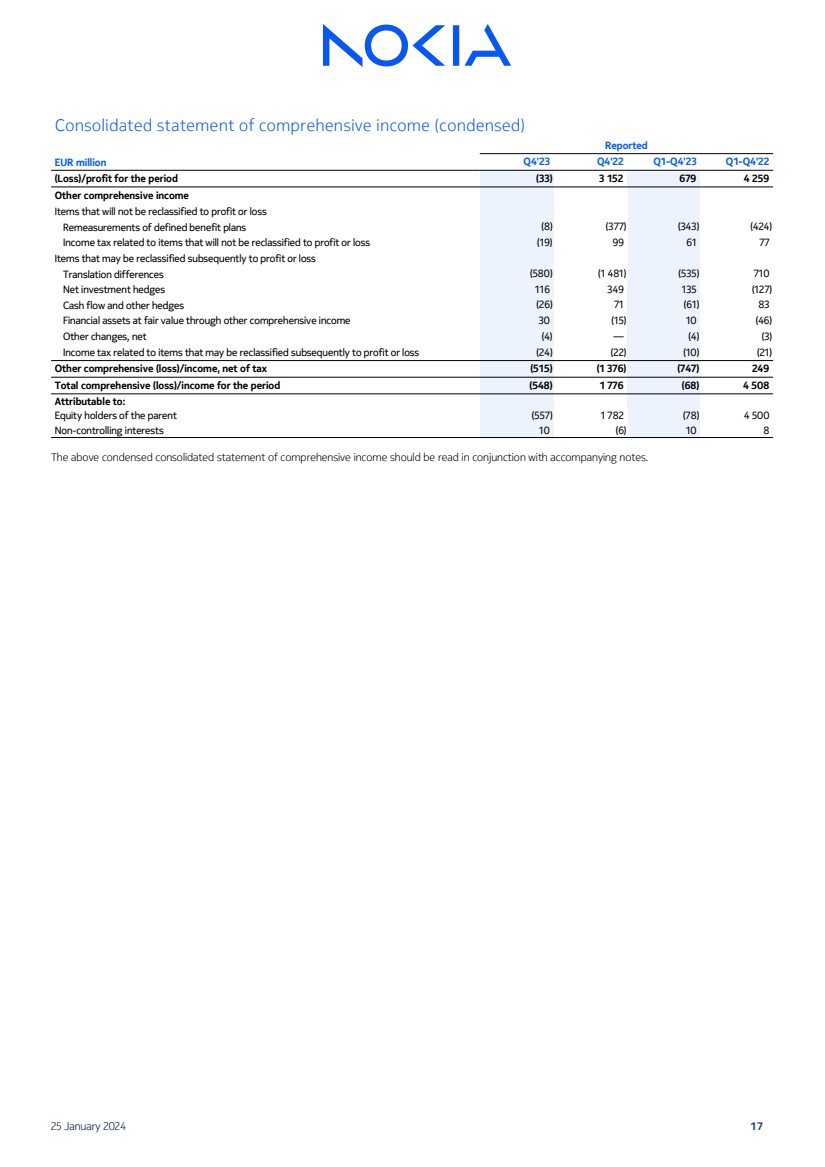
| Consolidated statement of comprehensive income (condensed)
EUR million
Reported
Q4'23 Q4'22 Q1-Q4'23 Q1-Q4'22
(Loss)/profit for the period (33) 3 152 679 4 259
Other comprehensive income
Items that will not be reclassified to profit or loss
Remeasurements of defined benefit plans (8) (377) (343) (424)
Income tax related to items that will not be reclassified to profit or loss (19) 99 61 77
Items that may be reclassified subsequently to profit or loss
Translation differences (580) (1 481) (535) 710
Net investment hedges 116 349 135 (127)
Cash flow and other hedges (26) 71 (61) 83
Financial assets at fair value through other comprehensive income 30 (15) 10 (46)
Other changes, net (4) — (4) (3)
Income tax related to items that may be reclassified subsequently to profit or loss (24) (22) (10) (21)
Other comprehensive (loss)/income, net of tax (515) (1 376) (747) 249
Total comprehensive (loss)/income for the period (548) 1 776 (68) 4 508
Attributable to:
Equity holders of the parent (557) 1 782 (78) 4 500
Non-controlling interests 10 (6) 10 8
The above condensed consolidated statement of comprehensive income should be read in conjunction with accompanying notes.
25 January 2024 17 |
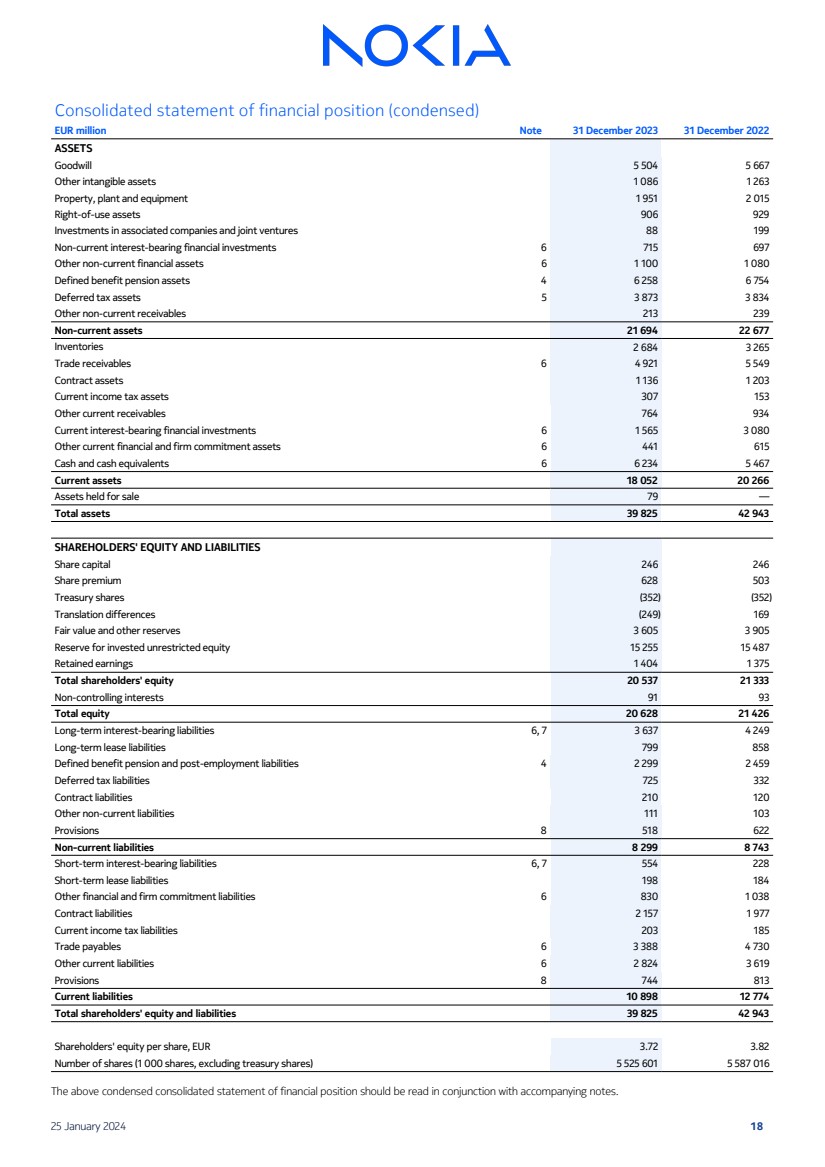
| Consolidated statement of financial position (condensed)
EUR million Note 31 December 2023 31 December 2022
ASSETS
Goodwill 5 504 5 667
Other intangible assets 1 086 1 263
Property, plant and equipment 1 951 2 015
Right-of-use assets 906 929
Investments in associated companies and joint ventures 88 199
Non-current interest-bearing financial investments 6 715 697
Other non-current financial assets 6 1 100 1 080
Defined benefit pension assets 4 6 258 6 754
Deferred tax assets 5 3 873 3 834
Other non-current receivables 213 239
Non-current assets 21 694 22 677
Inventories 2 684 3 265
Trade receivables 6 4 921 5 549
Contract assets 1 136 1 203
Current income tax assets 307 153
Other current receivables 764 934
Current interest-bearing financial investments 6 1 565 3 080
Other current financial and firm commitment assets 6 441 615
Cash and cash equivalents 6 6 234 5 467
Current assets 18 052 20 266
Assets held for sale 79 —
Total assets 39 825 42 943
SHAREHOLDERS' EQUITY AND LIABILITIES
Share capital 246 246
Share premium 628 503
Treasury shares (352) (352)
Translation differences (249) 169
Fair value and other reserves 3 605 3 905
Reserve for invested unrestricted equity 15 255 15 487
Retained earnings 1 404 1 375
Total shareholders' equity 20 537 21 333
Non-controlling interests 91 93
Total equity 20 628 21 426
Long-term interest-bearing liabilities 6, 7 3 637 4 249
Long-term lease liabilities 799 858
Defined benefit pension and post-employment liabilities 4 2 299 2 459
Deferred tax liabilities 725 332
Contract liabilities 210 120
Other non-current liabilities 111 103
Provisions 8 518 622
Non-current liabilities 8 299 8 743
Short-term interest-bearing liabilities 6, 7 554 228
Short-term lease liabilities 198 184
Other financial and firm commitment liabilities 6 830 1 038
Contract liabilities 2 157 1 977
Current income tax liabilities 203 185
Trade payables 6 3 388 4 730
Other current liabilities 6 2 824 3 619
Provisions 8 744 813
Current liabilities 10 898 12 774
Total shareholders' equity and liabilities 39 825 42 943
Shareholders' equity per share, EUR 3.72 3.82
Number of shares (1 000 shares, excluding treasury shares) 5 525 601 5 587 016
The above condensed consolidated statement of financial position should be read in conjunction with accompanying notes.
25 January 2024 18 |
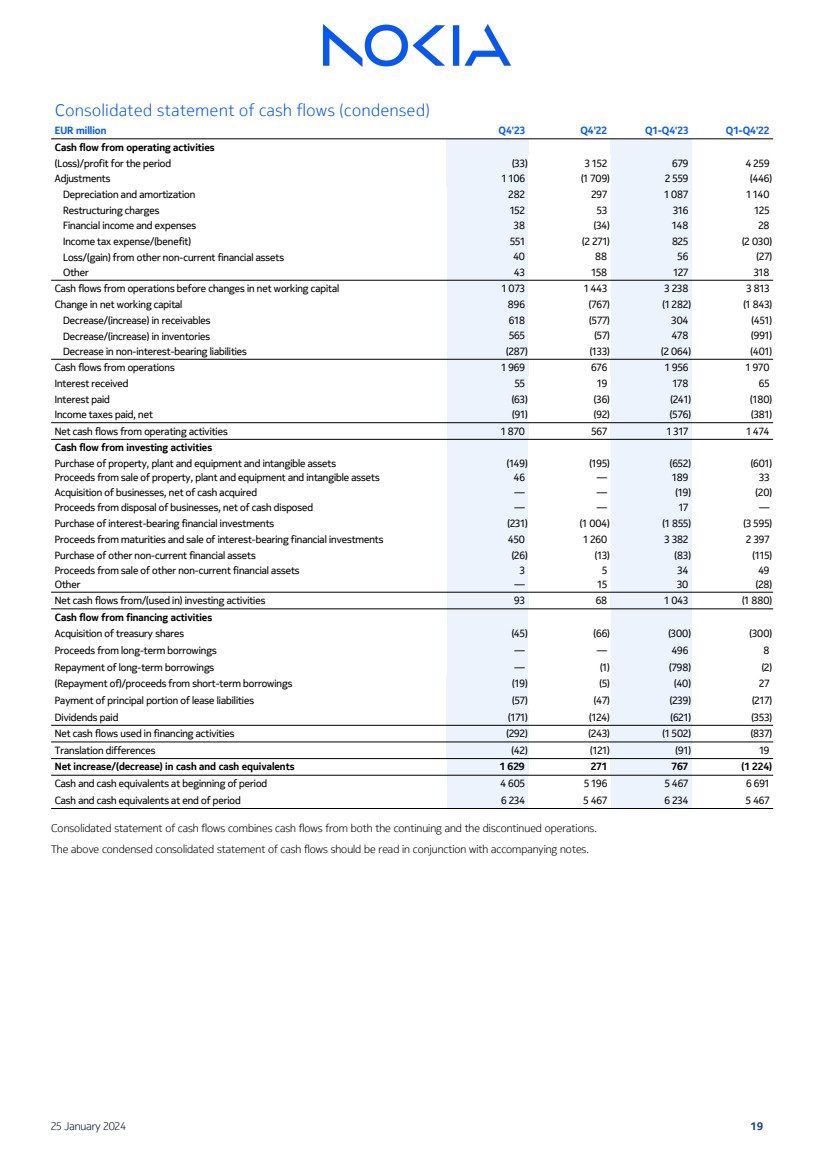
| Consolidated statement of cash flows (condensed)
EUR million Q4'23 Q4'22 Q1-Q4'23 Q1-Q4'22
Cash flow from operating activities
(Loss)/profit for the period (33) 3 152 679 4 259
Adjustments 1 106 (1 709) 2 559 (446)
Depreciation and amortization 282 297 1 087 1 140
Restructuring charges 152 53 316 125
Financial income and expenses 38 (34) 148 28
Income tax expense/(benefit) 551 (2 271) 825 (2 030)
Loss/(gain) from other non-current financial assets 40 88 56 (27)
Other 43 158 127 318
Cash flows from operations before changes in net working capital 1 073 1 443 3 238 3 813
Change in net working capital 896 (767) (1 282) (1 843)
Decrease/(increase) in receivables 618 (577) 304 (451)
Decrease/(increase) in inventories 565 (57) 478 (991)
Decrease in non-interest-bearing liabilities (287) (133) (2 064) (401)
Cash flows from operations 1 969 676 1 956 1 970
Interest received 55 19 178 65
Interest paid (63) (36) (241) (180)
Income taxes paid, net (91) (92) (576) (381)
Net cash flows from operating activities 1 870 567 1 317 1 474
Cash flow from investing activities
Purchase of property, plant and equipment and intangible assets (149) (195) (652) (601)
Proceeds from sale of property, plant and equipment and intangible assets 46 — 189 33
Acquisition of businesses, net of cash acquired — — (19) (20)
Proceeds from disposal of businesses, net of cash disposed — — 17 —
Purchase of interest-bearing financial investments (231) (1 004) (1 855) (3 595)
Proceeds from maturities and sale of interest-bearing financial investments 450 1 260 3 382 2 397
Purchase of other non-current financial assets (26) (13) (83) (115)
Proceeds from sale of other non-current financial assets 3 5 34 49
Other — 15 30 (28)
Net cash flows from/(used in) investing activities 93 68 1 043 (1 880)
Cash flow from financing activities
Acquisition of treasury shares (45) (66) (300) (300)
Proceeds from long-term borrowings — — 496 8
Repayment of long-term borrowings — (1) (798) (2)
(Repayment of)/proceeds from short-term borrowings (19) (5) (40) 27
Payment of principal portion of lease liabilities (57) (47) (239) (217)
Dividends paid (171) (124) (621) (353)
Net cash flows used in financing activities (292) (243) (1 502) (837)
Translation differences (42) (121) (91) 19
Net increase/(decrease) in cash and cash equivalents 1 629 271 767 (1 224)
Cash and cash equivalents at beginning of period 4 605 5 196 5 467 6 691
Cash and cash equivalents at end of period 6 234 5 467 6 234 5 467
Consolidated statement of cash flows combines cash flows from both the continuing and the discontinued operations.
The above condensed consolidated statement of cash flows should be read in conjunction with accompanying notes.
25 January 2024 19 |
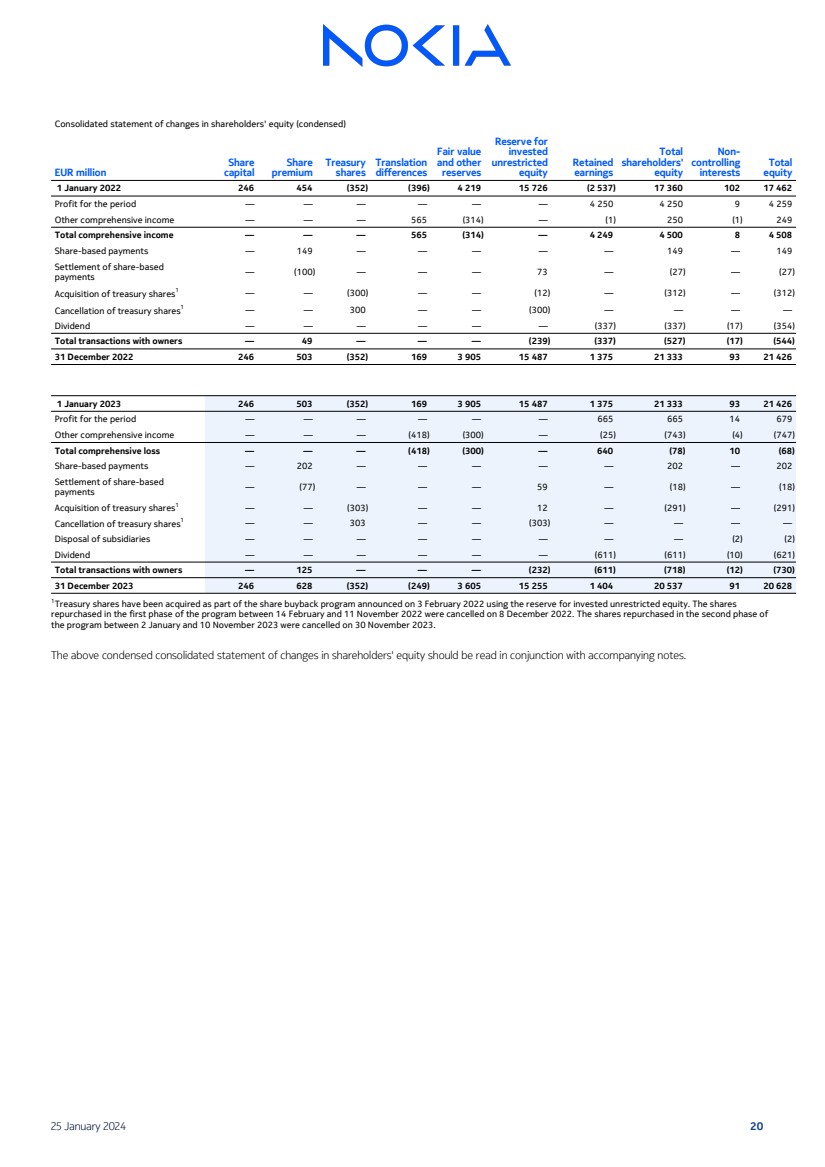
| Consolidated statement of changes in shareholders' equity (condensed)
EUR million
Share
capital
Share
premium
Treasury
shares
Translation
differences
Fair value
and other
reserves
Reserve for
invested
unrestricted
equity
Retained
earnings
Total
shareholders'
equity
Non-controlling
interests
Total
equity
1 January 2022 246 454 (352) (396) 4 219 15 726 (2 537) 17 360 102 17 462
Profit for the period — — — — — — 4 250 4 250 9 4 259
Other comprehensive income — — — 565 (314) — (1) 250 (1) 249
Total comprehensive income — — — 565 (314) — 4 249 4 500 8 4 508
Share-based payments — 149 — — — — — 149 — 149
Settlement of share-based
payments — (100) — — — 73 — (27) — (27)
Acquisition of treasury shares1
— — (300) — — (12) — (312) — (312)
Cancellation of treasury shares1
— — 300 — — (300) — — — —
Dividend — — — — — — (337) (337) (17) (354)
Total transactions with owners — 49 — — — (239) (337) (527) (17) (544)
31 December 2022 246 503 (352) 169 3 905 15 487 1 375 21 333 93 21 426
1 January 2023 246 503 (352) 169 3 905 15 487 1 375 21 333 93 21 426
Profit for the period — — — — — — 665 665 14 679
Other comprehensive income — — — (418) (300) — (25) (743) (4) (747)
Total comprehensive loss — — — (418) (300) — 640 (78) 10 (68)
Share-based payments — 202 — — — — — 202 — 202
Settlement of share-based
payments — (77) — — — 59 — (18) — (18)
Acquisition of treasury shares1
— — (303) — — 12 — (291) — (291)
Cancellation of treasury shares1
— — 303 — — (303) — — — —
Disposal of subsidiaries — — — — — — — — (2) (2)
Dividend — — — — — — (611) (611) (10) (621)
Total transactions with owners — 125 — — — (232) (611) (718) (12) (730)
31 December 2023 246 628 (352) (249) 3 605 15 255 1 404 20 537 91 20 628
1
Treasury shares have been acquired as part of the share buyback program announced on 3 February 2022 using the reserve for invested unrestricted equity. The shares
repurchased in the first phase of the program between 14 February and 11 November 2022 were cancelled on 8 December 2022. The shares repurchased in the second phase of
the program between 2 January and 10 November 2023 were cancelled on 30 November 2023.
The above condensed consolidated statement of changes in shareholders' equity should be read in conjunction with accompanying notes.
25 January 2024 20 |
| Notes to Financial statements
1. GENERAL INFORMATION
This unaudited and condensed consolidated financial statement information of Nokia has been prepared in accordance with IAS 34, Interim Financial
Reporting, and it should be read in conjunction with the annual consolidated financial statements for 2022 prepared in accordance with IFRS as published by
the IASB and adopted by the EU. The same accounting policies, methods of computation and applications of judgment are followed in this financial
statement information as was followed in the annual consolidated financial statements for 2022. Percentages and figures presented herein may include
rounding differences and therefore may not add up precisely to the totals presented and may vary from previously published financial information. This
financial report was authorized for issue by the Board of Directors on 25 January 2024.
Net sales and operating profit of the Nokia Group, particularly in Network Infrastructure, Mobile Networks and Cloud and Network Services segments, are
subject to seasonal fluctuations being generally highest in the fourth quarter and lowest in the first quarter of the year. This is mainly due to the seasonality
in the spending cycles of communications service providers.
Nokia Shanghai Bell
In 2017, Nokia and China Huaxin Post & Telecommunication Economy Development Center (China Huaxin) commenced operations of the joint venture Nokia
Shanghai Bell (NSB). The contractual arrangement provides China Huaxin with the right to fully transfer its ownership interest in NSB to Nokia and Nokia with
the right to purchase China Huaxin’s ownership interest in NSB in exchange for a future cash settlement. To reflect this, Nokia derecognized the non-controlling interest balance related to NSB and recognized a financial liability based on the estimated future cash settlement to acquire China Huaxin’s
ownership interest. Any changes in the estimated future cash settlement are recorded in financial income and expense. In 2023, the contractual arrangement
was extended until 30 June 2024. If it expires unexercised, Nokia will derecognize the financial liability and record non-controlling interest equal to its share of
NSB’s net assets with any difference recorded within shareholders’ equity.
TD Tech
In the second quarter of 2023, Nokia signed an agreement to sell its 51% ownership interest in TD Tech Holding Limited (”TD Tech HK”), a Hong Kong based
joint venture holding company, to New East New Materials. In the third quarter of 2023, Nokia exercised its contractual right to terminate the Sale and
Purchase Agreement with New East New Materials.
In the fourth quarter of 2023, TD Tech HK has entered into an agreement to divest the entire business of the joint venture through the sale of TD Tech HK’s
operating subsidiaries to a consortium consisting of Huawei Technologies, Chengdu High-tech Investment Group and other buyers. The closing of the
transaction is conditional upon receiving regulatory approvals for the transaction and is expected in 2024. Following the transaction, Nokia will exit from its
shareholding in TD Tech HK. Nokia expects to record a gain on the contemplated transactions. At 31 December 2023, the carrying amount of Nokia’s
investment in TD Tech HK is included in assets held for sale in the statement of financial position.
HMD
In 2016, Nokia entered into a strategic agreement with HMD Global Oy (HMD) granting HMD an exclusive global license to create Nokia-branded mobile
phones and tablets for ten years. Under the agreement, Nokia receives royalty payments from HMD for sales of Nokia branded mobile phones and tablets,
covering both brand and patent licensing. In August 2023, Nokia and HMD amended the licensing agreement so that HMD’s exclusive license to create Nokia-branded devices will expire by March 2026. Nokia has held an ownership interest in HMD since 2020 which it has accounted for as an investment in associate.
In the third quarter of 2023 Nokia recorded an impairment loss of EUR 28 million related to its investment in HMD in the share of results of associates and
joint ventures.
Device Management and Service Management Platform businesses
In the fourth quarter of 2023, Nokia signed an agreement to sell its Device Management and Service Management Platform businesses, which are part of
Cloud and Network Services, to Lumine Group Inc. The deal is valued at EUR 185 million, which includes a contingent consideration of up to EUR 35 million
based on the performance of the business during the first year following close. The deal is expected to close in the first quarter of 2024, subject to certain
terms, conditions, and consultations with works council or other employee representative bodies where required by law. At 31 December 2023, the assets of
Device Management and Service Management Platform businesses are included in assets held for sale in the statement of financial position.
Comparable and constant currency measures
Nokia presents financial information on a reported, comparable and constant currency basis. Comparable measures presented in this document exclude
intangible asset amortization and other purchase price fair value adjustments, goodwill impairments, restructuring related charges and certain other items
affecting comparability. In order to allow full visibility on determining comparable results, information on items affecting comparability is presented
separately for each of the components of profit or loss.
Constant currency reporting provides additional information on change in financial measures on a constant currency basis in order to better reflect the
underlying business performance. Therefore, change in financial measures at constant currency excludes the impact of changes in exchange rates in
comparison to euro, our reporting currency.
As comparable or constant currency financial measures are not defined in IFRS they may not be directly comparable with similarly titled measures used by
other companies, including those in the same industry. The primary rationale for presenting these measures is that the management uses these measures in
assessing the financial performance of Nokia and believes that these measures provide meaningful supplemental information on the underlying business
performance of Nokia. These financial measures should not be considered in isolation from, or as a substitute for, financial information presented in
compliance with IFRS. For further details on performance measures used by Nokia and reconciliations to the closest IFRS-defined measures, refer to the
Performance measures section accompanying this consolidated financial statement information.
25 January 2024 21 |
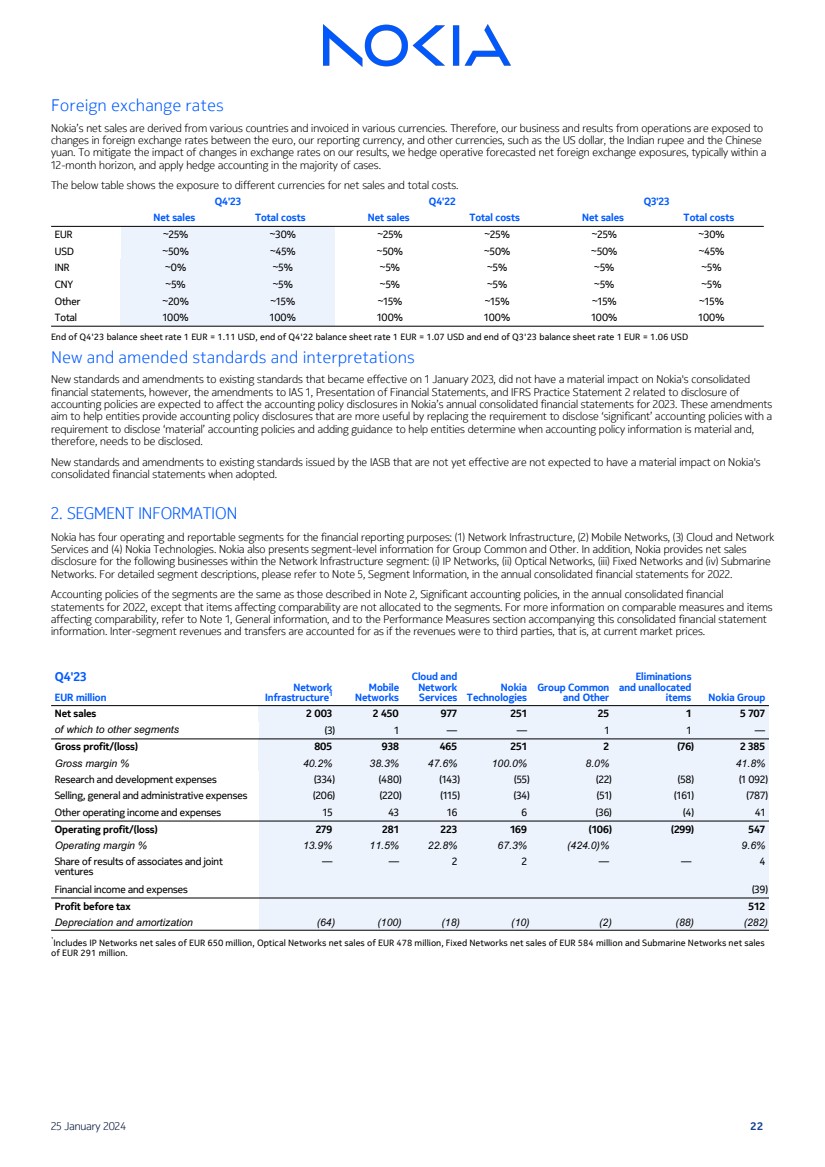
| Foreign exchange rates
Nokia’s net sales are derived from various countries and invoiced in various currencies. Therefore, our business and results from operations are exposed to
changes in foreign exchange rates between the euro, our reporting currency, and other currencies, such as the US dollar, the Indian rupee and the Chinese
yuan. To mitigate the impact of changes in exchange rates on our results, we hedge operative forecasted net foreign exchange exposures, typically within a
12-month horizon, and apply hedge accounting in the majority of cases.
The below table shows the exposure to different currencies for net sales and total costs.
Q4'23 Q4'22 Q3'23
Net sales Total costs Net sales Total costs Net sales Total costs
EUR ~25% ~30% ~25% ~25% ~25% ~30%
USD ~50% ~45% ~50% ~50% ~50% ~45%
INR ~0% ~5% ~5% ~5% ~5% ~5%
CNY ~5% ~5% ~5% ~5% ~5% ~5%
Other ~20% ~15% ~15% ~15% ~15% ~15%
Total 100% 100% 100% 100% 100% 100%
End of Q4'23 balance sheet rate 1 EUR = 1.11 USD, end of Q4'22 balance sheet rate 1 EUR = 1.07 USD and end of Q3'23 balance sheet rate 1 EUR = 1.06 USD
New and amended standards and interpretations
New standards and amendments to existing standards that became effective on 1 January 2023, did not have a material impact on Nokia's consolidated
financial statements, however, the amendments to IAS 1, Presentation of Financial Statements, and IFRS Practice Statement 2 related to disclosure of
accounting policies are expected to affect the accounting policy disclosures in Nokia’s annual consolidated financial statements for 2023. These amendments
aim to help entities provide accounting policy disclosures that are more useful by replacing the requirement to disclose ‘significant’ accounting policies with a
requirement to disclose ‘material’ accounting policies and adding guidance to help entities determine when accounting policy information is material and,
therefore, needs to be disclosed.
New standards and amendments to existing standards issued by the IASB that are not yet effective are not expected to have a material impact on Nokia's
consolidated financial statements when adopted.
2. SEGMENT INFORMATION
Nokia has four operating and reportable segments for the financial reporting purposes: (1) Network Infrastructure, (2) Mobile Networks, (3) Cloud and Network
Services and (4) Nokia Technologies. Nokia also presents segment-level information for Group Common and Other. In addition, Nokia provides net sales
disclosure for the following businesses within the Network Infrastructure segment: (i) IP Networks, (ii) Optical Networks, (iii) Fixed Networks and (iv) Submarine
Networks. For detailed segment descriptions, please refer to Note 5, Segment Information, in the annual consolidated financial statements for 2022.
Accounting policies of the segments are the same as those described in Note 2, Significant accounting policies, in the annual consolidated financial
statements for 2022, except that items affecting comparability are not allocated to the segments. For more information on comparable measures and items
affecting comparability, refer to Note 1, General information, and to the Performance Measures section accompanying this consolidated financial statement
information. Inter-segment revenues and transfers are accounted for as if the revenues were to third parties, that is, at current market prices.
Q4'23
Network
Infrastructure1
Mobile
Networks
Cloud and
Network
Services
Nokia
Technologies
Group Common
and Other
Eliminations
and unallocated
EUR million items Nokia Group
Net sales 2 003 2 450 977 251 25 1 5 707
of which to other segments (3) 1 — — 1 1 —
Gross profit/(loss) 805 938 465 251 2 (76) 2 385
Gross margin % 40.2% 38.3% 47.6% 100.0% 8.0% 41.8%
Research and development expenses (334) (480) (143) (55) (22) (58) (1 092)
Selling, general and administrative expenses (206) (220) (115) (34) (51) (161) (787)
Other operating income and expenses 15 43 16 6 (36) (4) 41
Operating profit/(loss) 279 281 223 169 (106) (299) 547
Operating margin % 13.9% 11.5% 22.8% 67.3% (424.0)% 9.6%
Share of results of associates and joint
ventures
— — 2 2 — — 4
Financial income and expenses (39)
Profit before tax 512
Depreciation and amortization (64) (100) (18) (10) (2) (88) (282)
¹
Includes IP Networks net sales of EUR 650 million, Optical Networks net sales of EUR 478 million, Fixed Networks net sales of EUR 584 million and Submarine Networks net sales
of EUR 291 million.
25 January 2024 22 |
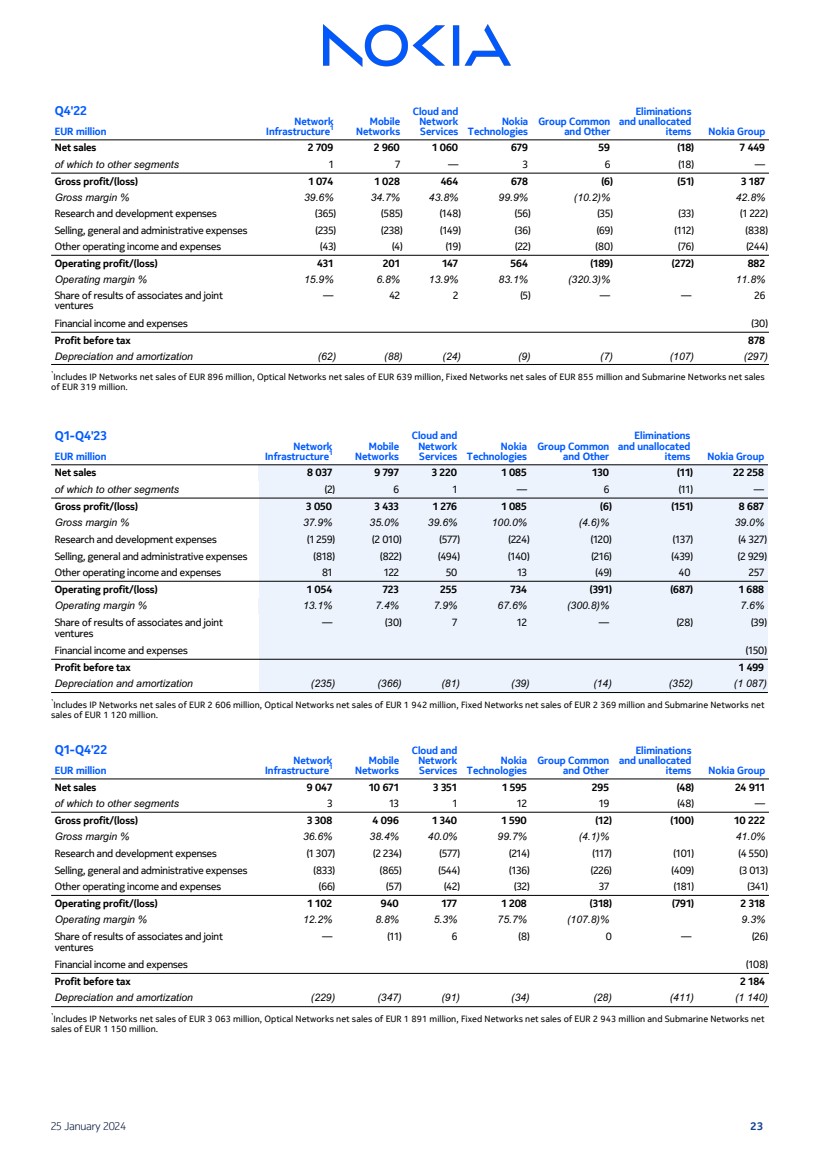
| Q4'22
Network
Infrastructure1
Mobile
Networks
Cloud and
Network
Services
Nokia
Technologies
Group Common
and Other
Eliminations
and unallocated
EUR million items Nokia Group
Net sales 2 709 2 960 1 060 679 59 (18) 7 449
of which to other segments 1 7 — 3 6 (18) —
Gross profit/(loss) 1 074 1 028 464 678 (6) (51) 3 187
Gross margin % 39.6% 34.7% 43.8% 99.9% (10.2)% 42.8%
Research and development expenses (365) (585) (148) (56) (35) (33) (1 222)
Selling, general and administrative expenses (235) (238) (149) (36) (69) (112) (838)
Other operating income and expenses (43) (4) (19) (22) (80) (76) (244)
Operating profit/(loss) 431 201 147 564 (189) (272) 882
Operating margin % 15.9% 6.8% 13.9% 83.1% (320.3)% 11.8%
Share of results of associates and joint
ventures
— 42 2 (5) — — 26
Financial income and expenses (30)
Profit before tax 878
Depreciation and amortization (62) (88) (24) (9) (7) (107) (297)
¹
Includes IP Networks net sales of EUR 896 million, Optical Networks net sales of EUR 639 million, Fixed Networks net sales of EUR 855 million and Submarine Networks net sales
of EUR 319 million.
Q1-Q4'23
Network
Infrastructure1
Mobile
Networks
Cloud and
Network
Services
Nokia
Technologies
Group Common
and Other
Eliminations
and unallocated
EUR million items Nokia Group
Net sales 8 037 9 797 3 220 1 085 130 (11) 22 258
of which to other segments (2) 6 1 — 6 (11) —
Gross profit/(loss) 3 050 3 433 1 276 1 085 (6) (151) 8 687
Gross margin % 37.9% 35.0% 39.6% 100.0% (4.6)% 39.0%
Research and development expenses (1 259) (2 010) (577) (224) (120) (137) (4 327)
Selling, general and administrative expenses (818) (822) (494) (140) (216) (439) (2 929)
Other operating income and expenses 81 122 50 13 (49) 40 257
Operating profit/(loss) 1 054 723 255 734 (391) (687) 1 688
Operating margin % 13.1% 7.4% 7.9% 67.6% (300.8)% 7.6%
Share of results of associates and joint
ventures
— (30) 7 12 — (28) (39)
Financial income and expenses (150)
Profit before tax 1 499
Depreciation and amortization (235) (366) (81) (39) (14) (352) (1 087)
¹
Includes IP Networks net sales of EUR 2 606 million, Optical Networks net sales of EUR 1 942 million, Fixed Networks net sales of EUR 2 369 million and Submarine Networks net
sales of EUR 1 120 million.
Q1-Q4'22
Network
Infrastructure1
Mobile
Networks
Cloud and
Network
Services
Nokia
Technologies
Group Common
and Other
Eliminations
and unallocated
EUR million items Nokia Group
Net sales 9 047 10 671 3 351 1 595 295 (48) 24 911
of which to other segments 3 13 1 12 19 (48) —
Gross profit/(loss) 3 308 4 096 1 340 1 590 (12) (100) 10 222
Gross margin % 36.6% 38.4% 40.0% 99.7% (4.1)% 41.0%
Research and development expenses (1 307) (2 234) (577) (214) (117) (101) (4 550)
Selling, general and administrative expenses (833) (865) (544) (136) (226) (409) (3 013)
Other operating income and expenses (66) (57) (42) (32) 37 (181) (341)
Operating profit/(loss) 1 102 940 177 1 208 (318) (791) 2 318
Operating margin % 12.2% 8.8% 5.3% 75.7% (107.8)% 9.3%
Share of results of associates and joint
ventures
— (11) 6 (8) 0 — (26)
Financial income and expenses (108)
Profit before tax 2 184
Depreciation and amortization (229) (347) (91) (34) (28) (411) (1 140)
¹
Includes IP Networks net sales of EUR 3 063 million, Optical Networks net sales of EUR 1 891 million, Fixed Networks net sales of EUR 2 943 million and Submarine Networks net
sales of EUR 1 150 million.
25 January 2024 23 |
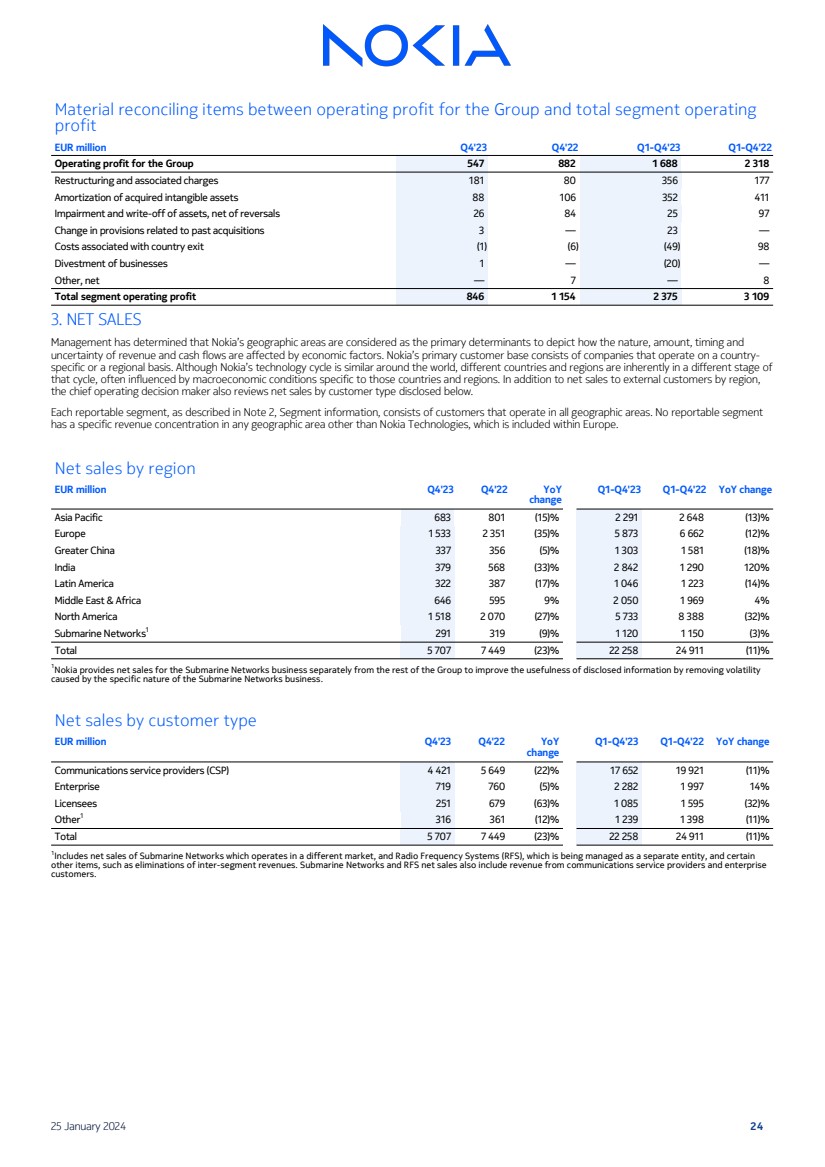
| Material reconciling items between operating profit for the Group and total segment operating
profit
EUR million Q4'23 Q4'22 Q1-Q4'23 Q1-Q4'22
Operating profit for the Group 547 882 1 688 2 318
Restructuring and associated charges 181 80 356 177
Amortization of acquired intangible assets 88 106 352 411
Impairment and write-off of assets, net of reversals 26 84 25 97
Change in provisions related to past acquisitions 3 — 23 —
Costs associated with country exit (1) (6) (49) 98
Divestment of businesses 1 — (20) —
Other, net — 7 — 8
Total segment operating profit 846 1 154 2 375 3 109
3. NET SALES
Management has determined that Nokia’s geographic areas are considered as the primary determinants to depict how the nature, amount, timing and
uncertainty of revenue and cash flows are affected by economic factors. Nokia’s primary customer base consists of companies that operate on a country-specific or a regional basis. Although Nokia’s technology cycle is similar around the world, different countries and regions are inherently in a different stage of
that cycle, often influenced by macroeconomic conditions specific to those countries and regions. In addition to net sales to external customers by region,
the chief operating decision maker also reviews net sales by customer type disclosed below.
Each reportable segment, as described in Note 2, Segment information, consists of customers that operate in all geographic areas. No reportable segment
has a specific revenue concentration in any geographic area other than Nokia Technologies, which is included within Europe.
Net sales by region
EUR million Q4'23 Q4'22 YoY
change
Q1-Q4'23 Q1-Q4'22 YoY change
Asia Pacific 683 801 (15)% 2 291 2 648 (13)%
Europe 1 533 2 351 (35)% 5 873 6 662 (12)%
Greater China 337 356 (5)% 1 303 1 581 (18)%
India 379 568 (33)% 2 842 1 290 120%
Latin America 322 387 (17)% 1 046 1 223 (14)%
Middle East & Africa 646 595 9% 2 050 1 969 4%
North America 1 518 2 070 (27)% 5 733 8 388 (32)%
Submarine Networks1
291 319 (9)% 1 120 1 150 (3)%
Total 5 707 7 449 (23)% 22 258 24 911 (11)%
1Nokia provides net sales for the Submarine Networks business separately from the rest of the Group to improve the usefulness of disclosed information by removing volatility
caused by the specific nature of the Submarine Networks business.
Net sales by customer type
EUR million Q4'23 Q4'22 YoY
change
Q1-Q4'23 Q1-Q4'22 YoY change
Communications service providers (CSP) 4 421 5 649 (22)% 17 652 19 921 (11)%
Enterprise 719 760 (5)% 2 282 1 997 14%
Licensees 251 679 (63)% 1 085 1 595 (32)%
Other1
316 361 (12)% 1 239 1 398 (11)%
Total 5 707 7 449 (23)% 22 258 24 911 (11)%
1
Includes net sales of Submarine Networks which operates in a different market, and Radio Frequency Systems (RFS), which is being managed as a separate entity, and certain
other items, such as eliminations of inter-segment revenues. Submarine Networks and RFS net sales also include revenue from communications service providers and enterprise
customers.
25 January 2024 24 |
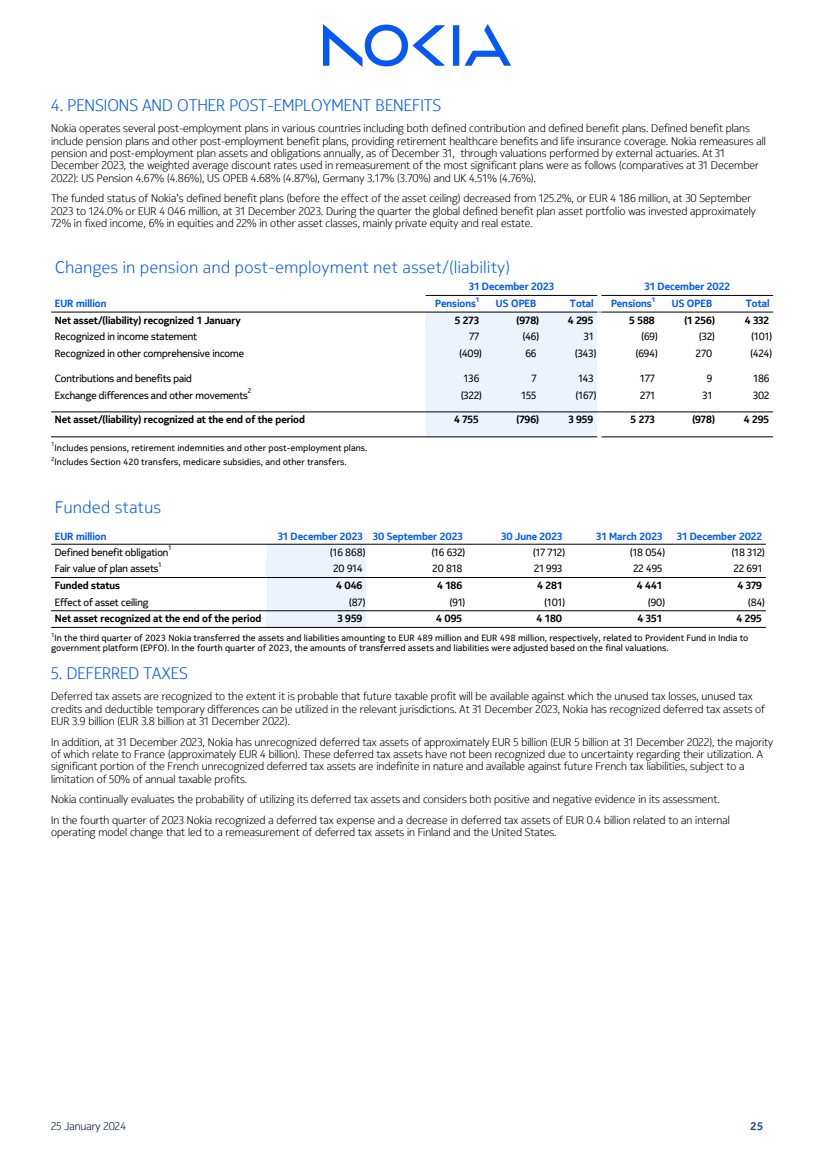
| 4. PENSIONS AND OTHER POST-EMPLOYMENT BENEFITS
Nokia operates several post-employment plans in various countries including both defined contribution and defined benefit plans. Defined benefit plans
include pension plans and other post-employment benefit plans, providing retirement healthcare benefits and life insurance coverage. Nokia remeasures all
pension and post-employment plan assets and obligations annually, as of December 31, through valuations performed by external actuaries. At 31
December 2023, the weighted average discount rates used in remeasurement of the most significant plans were as follows (comparatives at 31 December
2022): US Pension 4.67% (4.86%), US OPEB 4.68% (4.87%), Germany 3.17% (3.70%) and UK 4.51% (4.76%).
The funded status of Nokia’s defined benefit plans (before the effect of the asset ceiling) decreased from 125.2%, or EUR 4 186 million, at 30 September
2023 to 124.0% or EUR 4 046 million, at 31 December 2023. During the quarter the global defined benefit plan asset portfolio was invested approximately
72% in fixed income, 6% in equities and 22% in other asset classes, mainly private equity and real estate.
Changes in pension and post-employment net asset/(liability)
31 December 2023 31 December 2022
EUR million Pensions1
US OPEB Total Pensions1
US OPEB Total
Net asset/(liability) recognized 1 January 5 273 (978) 4 295 5 588 (1 256) 4 332
Recognized in income statement 77 (46) 31 (69) (32) (101)
Recognized in other comprehensive income (409) 66 (343) (694) 270 (424)
Contributions and benefits paid 136 7 143 177 9 186
Exchange differences and other movements2
(322) 155 (167) 271 31 302
Net asset/(liability) recognized at the end of the period 4 755 (796) 3 959 5 273 (978) 4 295
1
Includes pensions, retirement indemnities and other post-employment plans.
2
Includes Section 420 transfers, medicare subsidies, and other transfers.
Funded status
EUR million 31 December 2023 30 September 2023 30 June 2023 31 March 2023 31 December 2022
Defined benefit obligation1
(16 868) (16 632) (17 712) (18 054) (18 312)
Fair value of plan assets1
20 914 20 818 21 993 22 495 22 691
Funded status 4 046 4 186 4 281 4 441 4 379
Effect of asset ceiling (87) (91) (101) (90) (84)
Net asset recognized at the end of the period 3 959 4 095 4 180 4 351 4 295
1
In the third quarter of 2023 Nokia transferred the assets and liabilities amounting to EUR 489 million and EUR 498 million, respectively, related to Provident Fund in India to
government platform (EPFO). In the fourth quarter of 2023, the amounts of transferred assets and liabilities were adjusted based on the final valuations.
5. DEFERRED TAXES
Deferred tax assets are recognized to the extent it is probable that future taxable profit will be available against which the unused tax losses, unused tax
credits and deductible temporary differences can be utilized in the relevant jurisdictions. At 31 December 2023, Nokia has recognized deferred tax assets of
EUR 3.9 billion (EUR 3.8 billion at 31 December 2022).
In addition, at 31 December 2023, Nokia has unrecognized deferred tax assets of approximately EUR 5 billion (EUR 5 billion at 31 December 2022), the majority
of which relate to France (approximately EUR 4 billion). These deferred tax assets have not been recognized due to uncertainty regarding their utilization. A
significant portion of the French unrecognized deferred tax assets are indefinite in nature and available against future French tax liabilities, subject to a
limitation of 50% of annual taxable profits.
Nokia continually evaluates the probability of utilizing its deferred tax assets and considers both positive and negative evidence in its assessment.
In the fourth quarter of 2023 Nokia recognized a deferred tax expense and a decrease in deferred tax assets of EUR 0.4 billion related to an internal
operating model change that led to a remeasurement of deferred tax assets in Finland and the United States.
25 January 2024 25 |
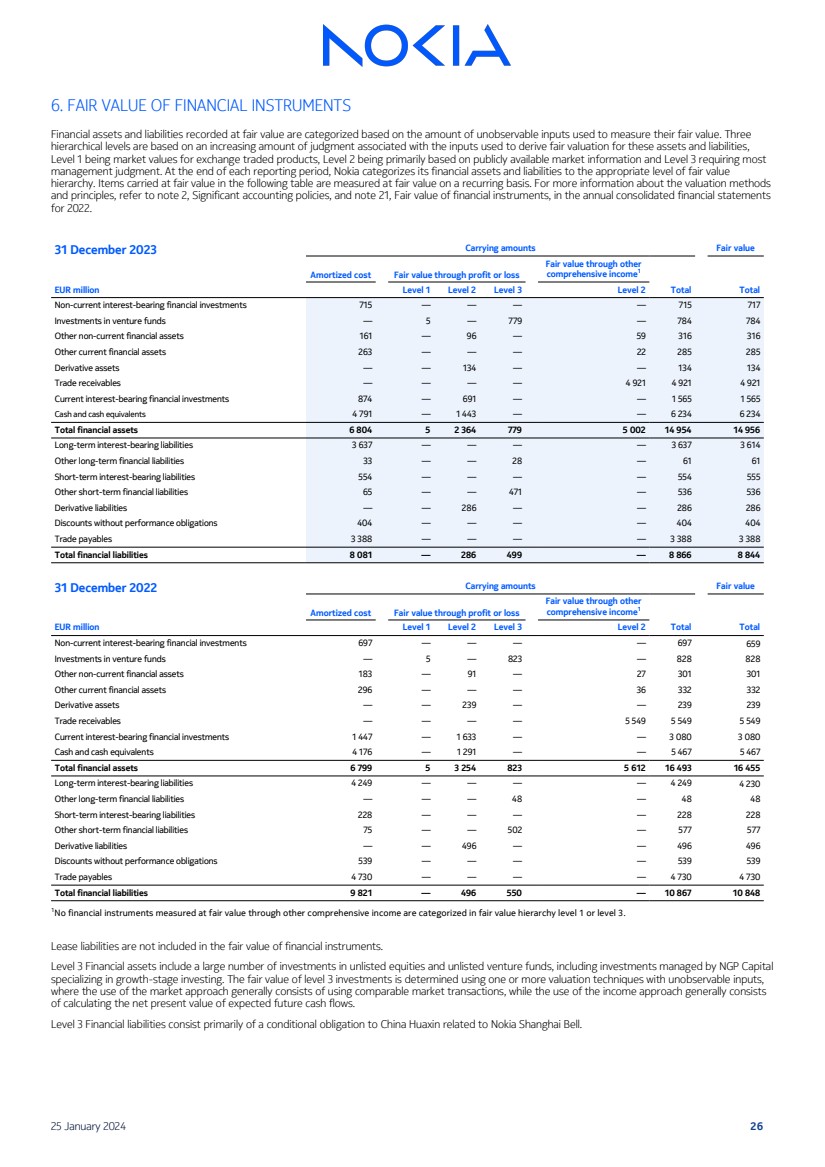
| 6. FAIR VALUE OF FINANCIAL INSTRUMENTS
Financial assets and liabilities recorded at fair value are categorized based on the amount of unobservable inputs used to measure their fair value. Three
hierarchical levels are based on an increasing amount of judgment associated with the inputs used to derive fair valuation for these assets and liabilities,
Level 1 being market values for exchange traded products, Level 2 being primarily based on publicly available market information and Level 3 requiring most
management judgment. At the end of each reporting period, Nokia categorizes its financial assets and liabilities to the appropriate level of fair value
hierarchy. Items carried at fair value in the following table are measured at fair value on a recurring basis. For more information about the valuation methods
and principles, refer to note 2, Significant accounting policies, and note 21, Fair value of financial instruments, in the annual consolidated financial statements
for 2022.
31 December 2023 Carrying amounts Fair value
Amortized cost Fair value through profit or loss
Fair value through other
comprehensive income1
EUR million Level 1 Level 2 Level 3 Level 2 Total Total
Non-current interest-bearing financial investments 715 — — — — 715 717
Investments in venture funds — 5 — 779 — 784 784
Other non-current financial assets 161 — 96 — 59 316 316
Other current financial assets 263 — — — 22 285 285
Derivative assets — — 134 — — 134 134
Trade receivables — — — — 4 921 4 921 4 921
Current interest-bearing financial investments 874 — 691 — — 1 565 1 565
Cash and cash equivalents 4 791 — 1 443 — — 6 234 6 234
Total financial assets 6 804 5 2 364 779 5 002 14 954 14 956
Long-term interest-bearing liabilities 3 637 — — — — 3 637 3 614
Other long-term financial liabilities 33 — — 28 — 61 61
Short-term interest-bearing liabilities 554 — — — — 554 555
Other short-term financial liabilities 65 — — 471 — 536 536
Derivative liabilities — — 286 — — 286 286
Discounts without performance obligations 404 — — — — 404 404
Trade payables 3 388 — — — — 3 388 3 388
Total financial liabilities 8 081 — 286 499 — 8 866 8 844
31 December 2022 Carrying amounts Fair value
Amortized cost Fair value through profit or loss
Fair value through other
comprehensive income1
EUR million Level 1 Level 2 Level 3 Level 2 Total Total
Non-current interest-bearing financial investments 697 — — — — 697 659
Investments in venture funds — 5 — 823 — 828 828
Other non-current financial assets 183 — 91 — 27 301 301
Other current financial assets 296 — — — 36 332 332
Derivative assets — — 239 — — 239 239
Trade receivables — — — — 5 549 5 549 5 549
Current interest-bearing financial investments 1 447 — 1 633 — — 3 080 3 080
Cash and cash equivalents 4 176 — 1 291 — — 5 467 5 467
Total financial assets 6 799 5 3 254 823 5 612 16 493 16 455
Long-term interest-bearing liabilities 4 249 — — — — 4 249 4 230
Other long-term financial liabilities — — — 48 — 48 48
Short-term interest-bearing liabilities 228 — — — — 228 228
Other short-term financial liabilities 75 — — 502 — 577 577
Derivative liabilities — — 496 — — 496 496
Discounts without performance obligations 539 — — — — 539 539
Trade payables 4 730 — — — — 4 730 4 730
Total financial liabilities 9 821 — 496 550 — 10 867 10 848
1No financial instruments measured at fair value through other comprehensive income are categorized in fair value hierarchy level 1 or level 3.
Lease liabilities are not included in the fair value of financial instruments.
Level 3 Financial assets include a large number of investments in unlisted equities and unlisted venture funds, including investments managed by NGP Capital
specializing in growth-stage investing. The fair value of level 3 investments is determined using one or more valuation techniques with unobservable inputs,
where the use of the market approach generally consists of using comparable market transactions, while the use of the income approach generally consists
of calculating the net present value of expected future cash flows.
Level 3 Financial liabilities consist primarily of a conditional obligation to China Huaxin related to Nokia Shanghai Bell.
25 January 2024 26 |
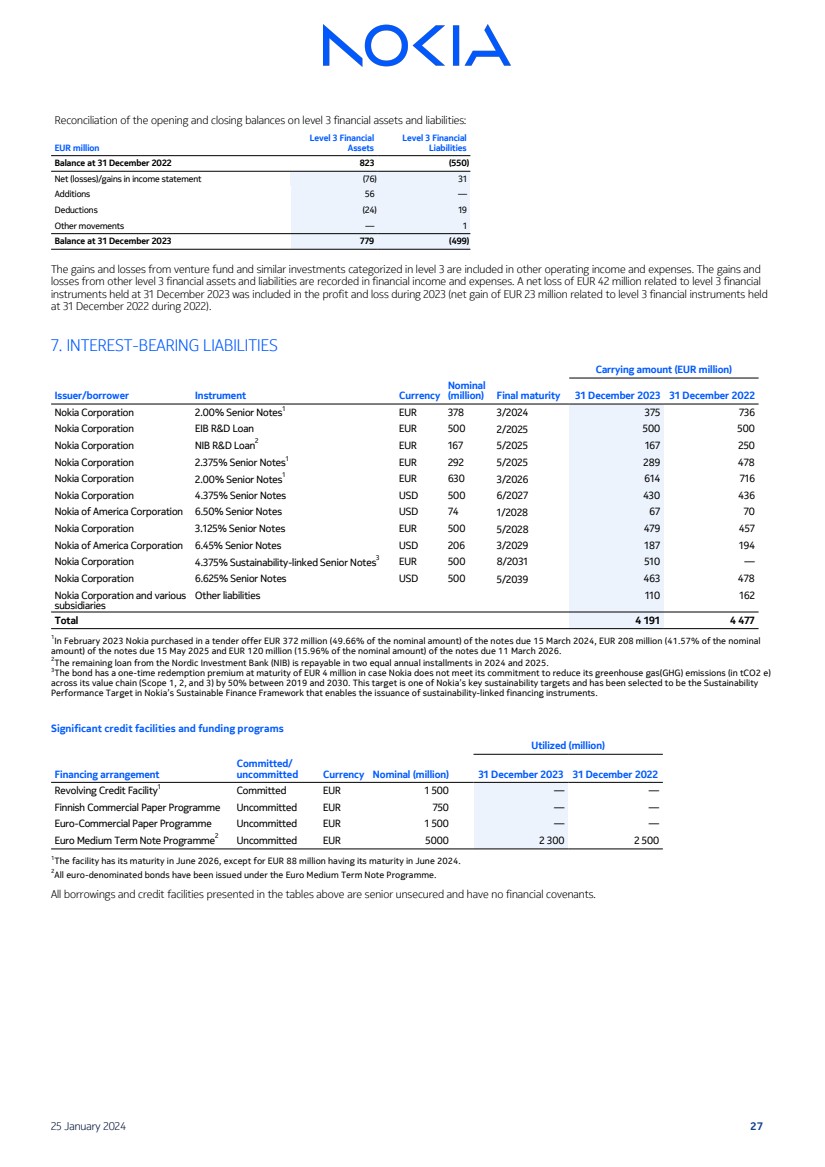
| Reconciliation of the opening and closing balances on level 3 financial assets and liabilities:
EUR million
Level 3 Financial
Assets
Level 3 Financial
Liabilities
Balance at 31 December 2022 823 (550)
Net (losses)/gains in income statement (76) 31
Additions 56 —
Deductions (24) 19
Other movements — 1
Balance at 31 December 2023 779 (499)
The gains and losses from venture fund and similar investments categorized in level 3 are included in other operating income and expenses. The gains and
losses from other level 3 financial assets and liabilities are recorded in financial income and expenses. A net loss of EUR 42 million related to level 3 financial
instruments held at 31 December 2023 was included in the profit and loss during 2023 (net gain of EUR 23 million related to level 3 financial instruments held
at 31 December 2022 during 2022).
7. INTEREST-BEARING LIABILITIES
Carrying amount (EUR million)
Issuer/borrower Instrument Currency
Nominal
(million) Final maturity 31 December 2023 31 December 2022
Nokia Corporation 2.00% Senior Notes1
EUR 378 3/2024 375 736
Nokia Corporation EIB R&D Loan EUR 500 2/2025 500 500
Nokia Corporation NIB R&D Loan2
EUR 167 5/2025 167 250
Nokia Corporation 2.375% Senior Notes1
EUR 292 5/2025 289 478
Nokia Corporation 2.00% Senior Notes1
EUR 630 3/2026 614 716
Nokia Corporation 4.375% Senior Notes USD 500 6/2027 430 436
Nokia of America Corporation 6.50% Senior Notes USD 74 1/2028 67 70
Nokia Corporation 3.125% Senior Notes EUR 500 5/2028 479 457
Nokia of America Corporation 6.45% Senior Notes USD 206 3/2029 187 194
Nokia Corporation 4.375% Sustainability-linked Senior Notes3
EUR 500 8/2031 510 —
Nokia Corporation 6.625% Senior Notes USD 500 5/2039 463 478
Nokia Corporation and various
subsidiaries
Other liabilities 110 162
Total 4 191 4 477
1
In February 2023 Nokia purchased in a tender offer EUR 372 million (49.66% of the nominal amount) of the notes due 15 March 2024, EUR 208 million (41.57% of the nominal
amount) of the notes due 15 May 2025 and EUR 120 million (15.96% of the nominal amount) of the notes due 11 March 2026.
2
The remaining loan from the Nordic Investment Bank (NIB) is repayable in two equal annual installments in 2024 and 2025.
3
The bond has a one-time redemption premium at maturity of EUR 4 million in case Nokia does not meet its commitment to reduce its greenhouse gas(GHG) emissions (in tCO2 e)
across its value chain (Scope 1, 2, and 3) by 50% between 2019 and 2030. This target is one of Nokia’s key sustainability targets and has been selected to be the Sustainability
Performance Target in Nokia’s Sustainable Finance Framework that enables the issuance of sustainability-linked financing instruments.
Significant credit facilities and funding programs
Utilized (million)
Financing arrangement
Committed/
uncommitted Currency Nominal (million) 31 December 2023 31 December 2022
Revolving Credit Facility1
Committed EUR 1 500 — —
Finnish Commercial Paper Programme Uncommitted EUR 750 — —
Euro-Commercial Paper Programme Uncommitted EUR 1 500 — —
Euro Medium Term Note Programme2
Uncommitted EUR 5000 2 300 2 500
1
The facility has its maturity in June 2026, except for EUR 88 million having its maturity in June 2024.
2
All euro-denominated bonds have been issued under the Euro Medium Term Note Programme.
All borrowings and credit facilities presented in the tables above are senior unsecured and have no financial covenants.
25 January 2024 27 |
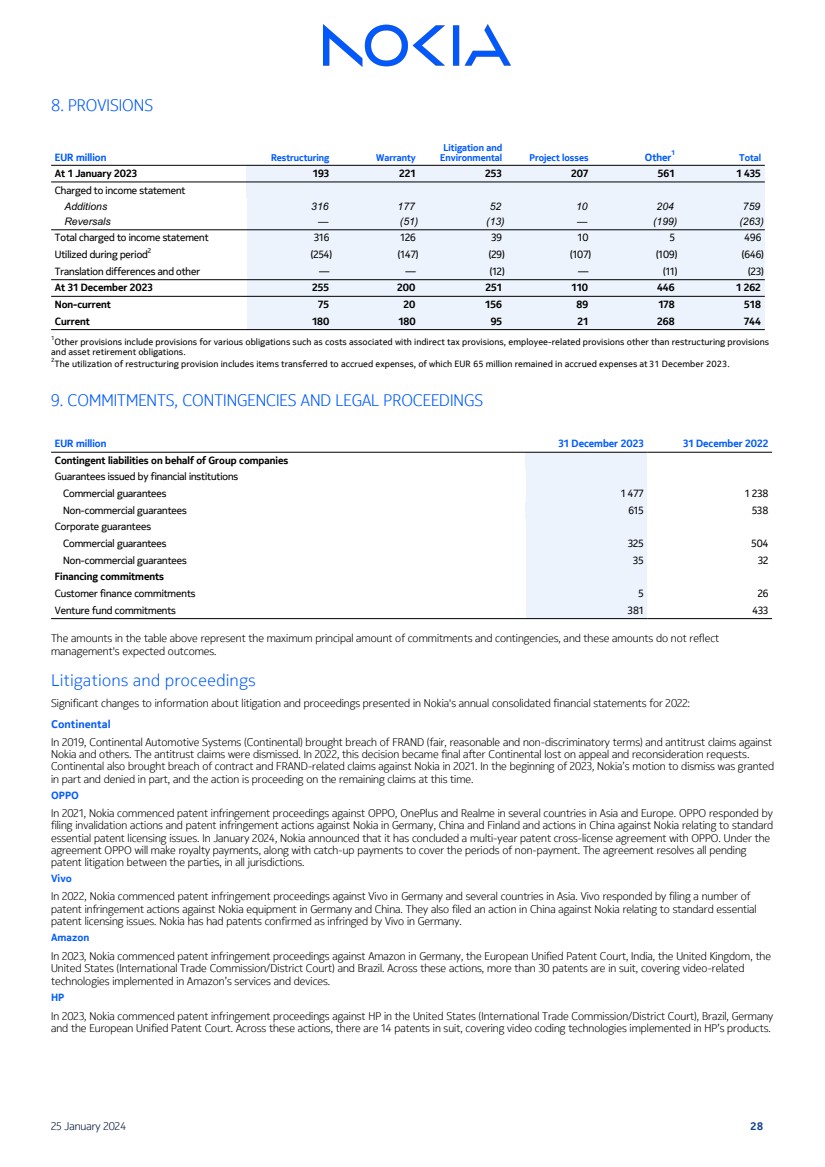
| 8. PROVISIONS
EUR million Restructuring Warranty
Litigation and
Environmental Project losses Other1
Total
At 1 January 2023 193 221 253 207 561 1 435
Charged to income statement
Additions 316 177 52 10 204 759
Reversals — (51) (13) — (199) (263)
Total charged to income statement 316 126 39 10 5 496
Utilized during period2
(254) (147) (29) (107) (109) (646)
Translation differences and other — — (12) — (11) (23)
At 31 December 2023 255 200 251 110 446 1 262
Non-current 75 20 156 89 178 518
Current 180 180 95 21 268 744
1Other provisions include provisions for various obligations such as costs associated with indirect tax provisions, employee-related provisions other than restructuring provisions
and asset retirement obligations.
2
The utilization of restructuring provision includes items transferred to accrued expenses, of which EUR 65 million remained in accrued expenses at 31 December 2023.
9. COMMITMENTS, CONTINGENCIES AND LEGAL PROCEEDINGS
EUR million 31 December 2023 31 December 2022
Contingent liabilities on behalf of Group companies
Guarantees issued by financial institutions
Commercial guarantees 1 477 1 238
Non-commercial guarantees 615 538
Corporate guarantees
Commercial guarantees 325 504
Non-commercial guarantees 35 32
Financing commitments
Customer finance commitments 5 26
Venture fund commitments 381 433
The amounts in the table above represent the maximum principal amount of commitments and contingencies, and these amounts do not reflect
management's expected outcomes.
Litigations and proceedings
Significant changes to information about litigation and proceedings presented in Nokia's annual consolidated financial statements for 2022:
Continental
In 2019, Continental Automotive Systems (Continental) brought breach of FRAND (fair, reasonable and non-discriminatory terms) and antitrust claims against
Nokia and others. The antitrust claims were dismissed. In 2022, this decision became final after Continental lost on appeal and reconsideration requests.
Continental also brought breach of contract and FRAND-related claims against Nokia in 2021. In the beginning of 2023, Nokia’s motion to dismiss was granted
in part and denied in part, and the action is proceeding on the remaining claims at this time.
OPPO
In 2021, Nokia commenced patent infringement proceedings against OPPO, OnePlus and Realme in several countries in Asia and Europe. OPPO responded by
filing invalidation actions and patent infringement actions against Nokia in Germany, China and Finland and actions in China against Nokia relating to standard
essential patent licensing issues. In January 2024, Nokia announced that it has concluded a multi-year patent cross-license agreement with OPPO. Under the
agreement OPPO will make royalty payments, along with catch-up payments to cover the periods of non-payment. The agreement resolves all pending
patent litigation between the parties, in all jurisdictions.
Vivo
In 2022, Nokia commenced patent infringement proceedings against Vivo in Germany and several countries in Asia. Vivo responded by filing a number of
patent infringement actions against Nokia equipment in Germany and China. They also filed an action in China against Nokia relating to standard essential
patent licensing issues. Nokia has had patents confirmed as infringed by Vivo in Germany.
Amazon
In 2023, Nokia commenced patent infringement proceedings against Amazon in Germany, the European Unified Patent Court, India, the United Kingdom, the
United States (International Trade Commission/District Court) and Brazil. Across these actions, more than 30 patents are in suit, covering video-related
technologies implemented in Amazon’s services and devices.
HP
In 2023, Nokia commenced patent infringement proceedings against HP in the United States (International Trade Commission/District Court), Brazil, Germany
and the European Unified Patent Court. Across these actions, there are 14 patents in suit, covering video coding technologies implemented in HP’s products.
25 January 2024 28 |
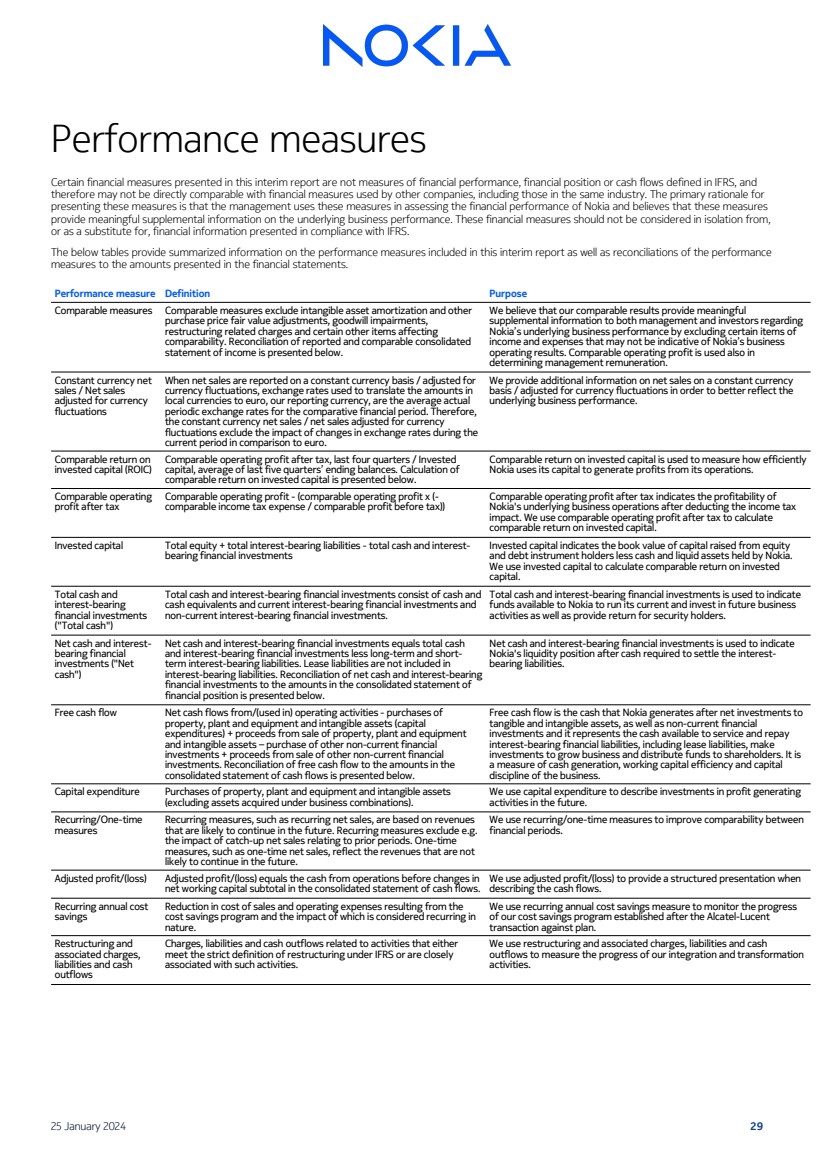
| Performance measures
Certain financial measures presented in this interim report are not measures of financial performance, financial position or cash flows defined in IFRS, and
therefore may not be directly comparable with financial measures used by other companies, including those in the same industry. The primary rationale for
presenting these measures is that the management uses these measures in assessing the financial performance of Nokia and believes that these measures
provide meaningful supplemental information on the underlying business performance. These financial measures should not be considered in isolation from,
or as a substitute for, financial information presented in compliance with IFRS.
The below tables provide summarized information on the performance measures included in this interim report as well as reconciliations of the performance
measures to the amounts presented in the financial statements.
Performance measure Definition Purpose
Comparable measures Comparable measures exclude intangible asset amortization and other
purchase price fair value adjustments, goodwill impairments,
restructuring related charges and certain other items affecting
comparability. Reconciliation of reported and comparable consolidated
statement of income is presented below.
We believe that our comparable results provide meaningful
supplemental information to both management and investors regarding
Nokia’s underlying business performance by excluding certain items of
income and expenses that may not be indicative of Nokia’s business
operating results. Comparable operating profit is used also in
determining management remuneration.
Constant currency net
sales / Net sales
adjusted for currency
fluctuations
When net sales are reported on a constant currency basis / adjusted for
currency fluctuations, exchange rates used to translate the amounts in
local currencies to euro, our reporting currency, are the average actual
periodic exchange rates for the comparative financial period. Therefore,
the constant currency net sales / net sales adjusted for currency
fluctuations exclude the impact of changes in exchange rates during the
current period in comparison to euro.
We provide additional information on net sales on a constant currency
basis / adjusted for currency fluctuations in order to better reflect the
underlying business performance.
Comparable return on
invested capital (ROIC)
Comparable operating profit after tax, last four quarters / Invested
capital, average of last five quarters’ ending balances. Calculation of
comparable return on invested capital is presented below.
Comparable return on invested capital is used to measure how efficiently
Nokia uses its capital to generate profits from its operations.
Comparable operating
profit after tax
Comparable operating profit - (comparable operating profit x (-
comparable income tax expense / comparable profit before tax))
Comparable operating profit after tax indicates the profitability of
Nokia's underlying business operations after deducting the income tax
impact. We use comparable operating profit after tax to calculate
comparable return on invested capital.
Invested capital Total equity + total interest-bearing liabilities - total cash and interest-bearing financial investments
Invested capital indicates the book value of capital raised from equity
and debt instrument holders less cash and liquid assets held by Nokia.
We use invested capital to calculate comparable return on invested
capital.
Total cash and
interest-bearing
financial investments
("Total cash")
Total cash and interest-bearing financial investments consist of cash and
cash equivalents and current interest-bearing financial investments and
non-current interest-bearing financial investments.
Total cash and interest-bearing financial investments is used to indicate
funds available to Nokia to run its current and invest in future business
activities as well as provide return for security holders.
Net cash and interest-bearing financial
investments ("Net
cash")
Net cash and interest-bearing financial investments equals total cash
and interest-bearing financial investments less long-term and short-term interest-bearing liabilities. Lease liabilities are not included in
interest-bearing liabilities. Reconciliation of net cash and interest-bearing
financial investments to the amounts in the consolidated statement of
financial position is presented below.
Net cash and interest-bearing financial investments is used to indicate
Nokia's liquidity position after cash required to settle the interest-bearing liabilities.
Free cash flow Net cash flows from/(used in) operating activities - purchases of
property, plant and equipment and intangible assets (capital
expenditures) + proceeds from sale of property, plant and equipment
and intangible assets – purchase of other non-current financial
investments + proceeds from sale of other non-current financial
investments. Reconciliation of free cash flow to the amounts in the
consolidated statement of cash flows is presented below.
Free cash flow is the cash that Nokia generates after net investments to
tangible and intangible assets, as well as non-current financial
investments and it represents the cash available to service and repay
interest-bearing financial liabilities, including lease liabilities, make
investments to grow business and distribute funds to shareholders. It is
a measure of cash generation, working capital efficiency and capital
discipline of the business.
Capital expenditure Purchases of property, plant and equipment and intangible assets
(excluding assets acquired under business combinations).
We use capital expenditure to describe investments in profit generating
activities in the future.
Recurring/One-time
measures
Recurring measures, such as recurring net sales, are based on revenues
that are likely to continue in the future. Recurring measures exclude e.g.
the impact of catch-up net sales relating to prior periods. One-time
measures, such as one-time net sales, reflect the revenues that are not
likely to continue in the future.
We use recurring/one-time measures to improve comparability between
financial periods.
Adjusted profit/(loss) Adjusted profit/(loss) equals the cash from operations before changes in
net working capital subtotal in the consolidated statement of cash flows.
We use adjusted profit/(loss) to provide a structured presentation when
describing the cash flows.
Recurring annual cost
savings
Reduction in cost of sales and operating expenses resulting from the
cost savings program and the impact of which is considered recurring in
nature.
We use recurring annual cost savings measure to monitor the progress
of our cost savings program established after the Alcatel-Lucent
transaction against plan.
Restructuring and
associated charges,
liabilities and cash
outflows
Charges, liabilities and cash outflows related to activities that either
meet the strict definition of restructuring under IFRS or are closely
associated with such activities.
We use restructuring and associated charges, liabilities and cash
outflows to measure the progress of our integration and transformation
activities.
25 January 2024 29 |
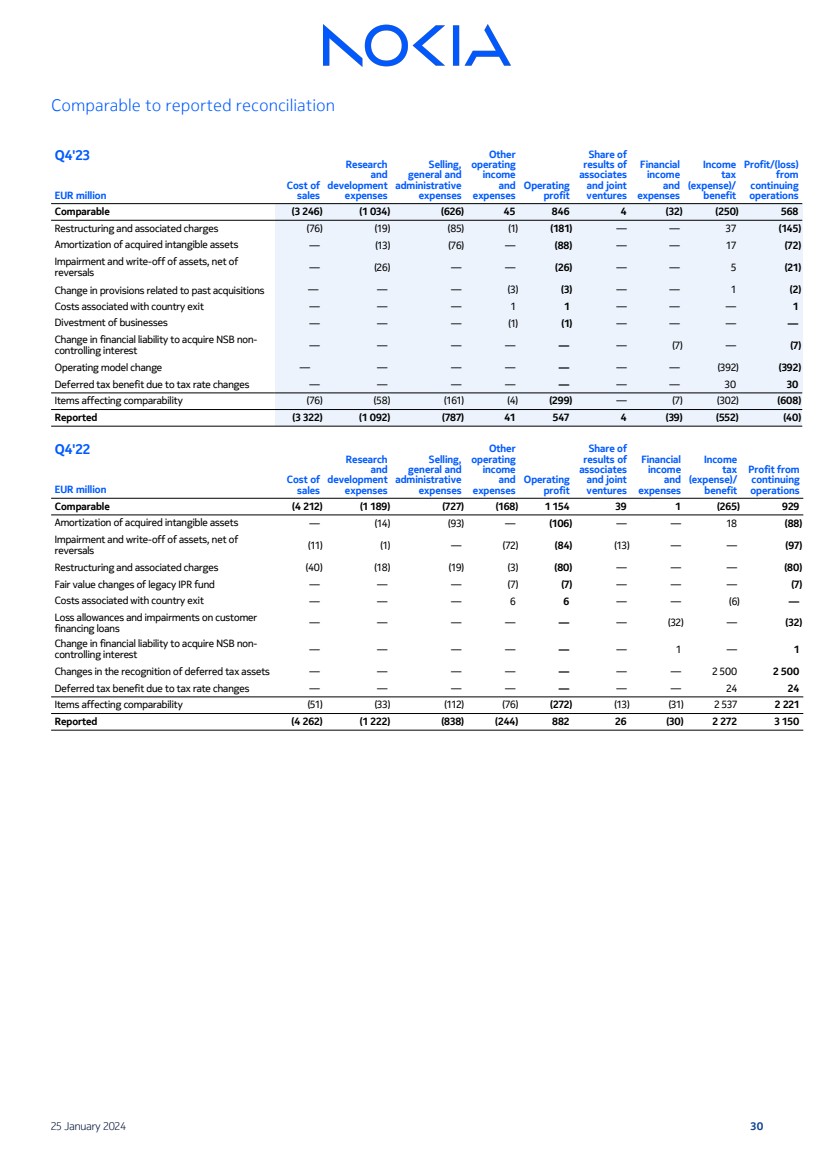
| Comparable to reported reconciliation
Q4'23
Cost of
sales
Research
and
development
expenses
Selling,
general and
administrative
expenses
Other
operating
income
and
expenses
Operating
profit
Share of
results of
associates
and joint
ventures
Financial
income
and
expenses
Income
tax
(expense)/
benefit
Profit/(loss)
from
continuing
EUR million operations
Comparable (3 246) (1 034) (626) 45 846 4 (32) (250) 568
Restructuring and associated charges (76) (19) (85) (1) (181) — — 37 (145)
Amortization of acquired intangible assets — (13) (76) — (88) — — 17 (72)
Impairment and write-off of assets, net of
reversals — (26) — — (26) — — 5 (21)
Change in provisions related to past acquisitions — — — (3) (3) — — 1 (2)
Costs associated with country exit — — — 1 1 — — — 1
Divestment of businesses — — — (1) (1) — — — —
Change in financial liability to acquire NSB non-controlling interest — — — — — — (7) — (7)
Operating model change — — — — — — — (392) (392)
Deferred tax benefit due to tax rate changes — — — — — — — 30 30
Items affecting comparability (76) (58) (161) (4) (299) — (7) (302) (608)
Reported (3 322) (1 092) (787) 41 547 4 (39) (552) (40)
Q4'22
Cost of
sales
Research
and
development
expenses
Selling,
general and
administrative
expenses
Other
operating
income
and
expenses
Operating
profit
Share of
results of
associates
and joint
ventures
Financial
income
and
expenses
Income
tax
(expense)/
benefit
Profit from
continuing
EUR million operations
Comparable (4 212) (1 189) (727) (168) 1 154 39 1 (265) 929
Amortization of acquired intangible assets — (14) (93) — (106) — — 18 (88)
Impairment and write-off of assets, net of
reversals (11) (1) — (72) (84) (13) — — (97)
Restructuring and associated charges (40) (18) (19) (3) (80) — — — (80)
Fair value changes of legacy IPR fund — — — (7) (7) — — — (7)
Costs associated with country exit — — — 6 6 — — (6) —
Loss allowances and impairments on customer
financing loans — — — — — — (32) — (32)
Change in financial liability to acquire NSB non-controlling interest — — — — — — 1 — 1
Changes in the recognition of deferred tax assets — — — — — — — 2 500 2 500
Deferred tax benefit due to tax rate changes — — — — — — — 24 24
Items affecting comparability (51) (33) (112) (76) (272) (13) (31) 2 537 2 221
Reported (4 262) (1 222) (838) (244) 882 26 (30) 2 272 3 150
25 January 2024 30 |
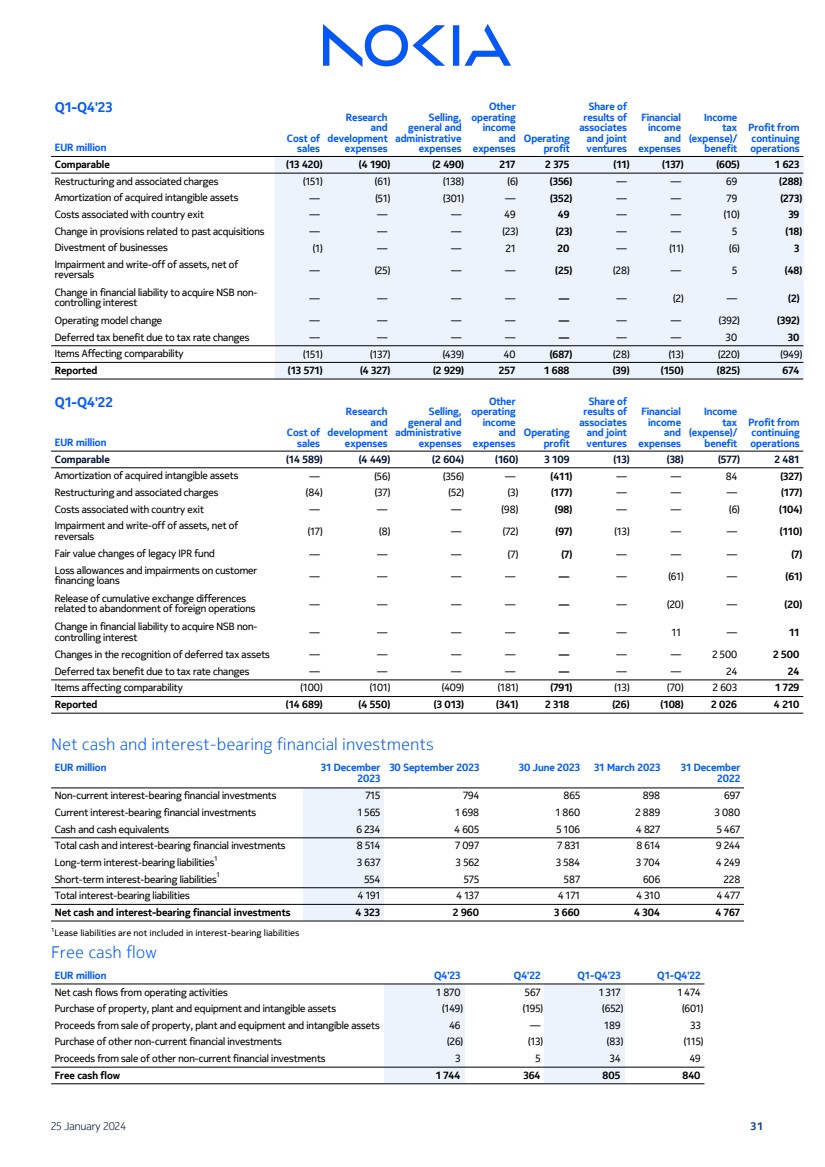
| Q1-Q4'23
Cost of
sales
Research
and
development
expenses
Selling,
general and
administrative
expenses
Other
operating
income
and
expenses
Operating
profit
Share of
results of
associates
and joint
ventures
Financial
income
and
expenses
Income
tax
(expense)/
benefit
Profit from
continuing
EUR million operations
Comparable (13 420) (4 190) (2 490) 217 2 375 (11) (137) (605) 1 623
Restructuring and associated charges (151) (61) (138) (6) (356) — — 69 (288)
Amortization of acquired intangible assets — (51) (301) — (352) — — 79 (273)
Costs associated with country exit — — — 49 49 — — (10) 39
Change in provisions related to past acquisitions — — — (23) (23) — — 5 (18)
Divestment of businesses (1) — — 21 20 — (11) (6) 3
Impairment and write-off of assets, net of
reversals — (25) — — (25) (28) — 5 (48)
Change in financial liability to acquire NSB non-controlling interest — — — — — — (2) — (2)
Operating model change — — — — — — — (392) (392)
Deferred tax benefit due to tax rate changes — — — — — — — 30 30
Items Affecting comparability (151) (137) (439) 40 (687) (28) (13) (220) (949)
Reported (13 571) (4 327) (2 929) 257 1 688 (39) (150) (825) 674
Q1-Q4'22
Cost of
sales
Research
and
development
expenses
Selling,
general and
administrative
expenses
Other
operating
income
and
expenses
Operating
profit
Share of
results of
associates
and joint
ventures
Financial
income
and
expenses
Income
tax
(expense)/
benefit
Profit from
continuing
EUR million operations
Comparable (14 589) (4 449) (2 604) (160) 3 109 (13) (38) (577) 2 481
Amortization of acquired intangible assets — (56) (356) — (411) — — 84 (327)
Restructuring and associated charges (84) (37) (52) (3) (177) — — — (177)
Costs associated with country exit — — — (98) (98) — — (6) (104)
Impairment and write-off of assets, net of
reversals (17) (8) — (72) (97) (13) — — (110)
Fair value changes of legacy IPR fund — — — (7) (7) — — — (7)
Loss allowances and impairments on customer
financing loans — — — — — — (61) — (61)
Release of cumulative exchange differences
related to abandonment of foreign operations — — — — — — (20) — (20)
Change in financial liability to acquire NSB non-controlling interest — — — — — — 11 — 11
Changes in the recognition of deferred tax assets — — — — — — — 2 500 2 500
Deferred tax benefit due to tax rate changes — — — — — — — 24 24
Items affecting comparability (100) (101) (409) (181) (791) (13) (70) 2 603 1 729
Reported (14 689) (4 550) (3 013) (341) 2 318 (26) (108) 2 026 4 210
Net cash and interest-bearing financial investments
EUR million 31 December
2023
30 September 2023 30 June 2023 31 March 2023 31 December
2022
Non-current interest-bearing financial investments 715 794 865 898 697
Current interest-bearing financial investments 1 565 1 698 1 860 2 889 3 080
Cash and cash equivalents 6 234 4 605 5 106 4 827 5 467
Total cash and interest-bearing financial investments 8 514 7 097 7 831 8 614 9 244
Long-term interest-bearing liabilities1
3 637 3 562 3 584 3 704 4 249
Short-term interest-bearing liabilities1
554 575 587 606 228
Total interest-bearing liabilities 4 191 4 137 4 171 4 310 4 477
Net cash and interest-bearing financial investments 4 323 2 960 3 660 4 304 4 767
1
Lease liabilities are not included in interest-bearing liabilities
Free cash flow
EUR million Q4'23 Q4'22 Q1-Q4'23 Q1-Q4'22
Net cash flows from operating activities 1 870 567 1 317 1 474
Purchase of property, plant and equipment and intangible assets (149) (195) (652) (601)
Proceeds from sale of property, plant and equipment and intangible assets 46 — 189 33
Purchase of other non-current financial investments (26) (13) (83) (115)
Proceeds from sale of other non-current financial investments 3 5 34 49
Free cash flow 1 744 364 805 840
25 January 2024 31 |
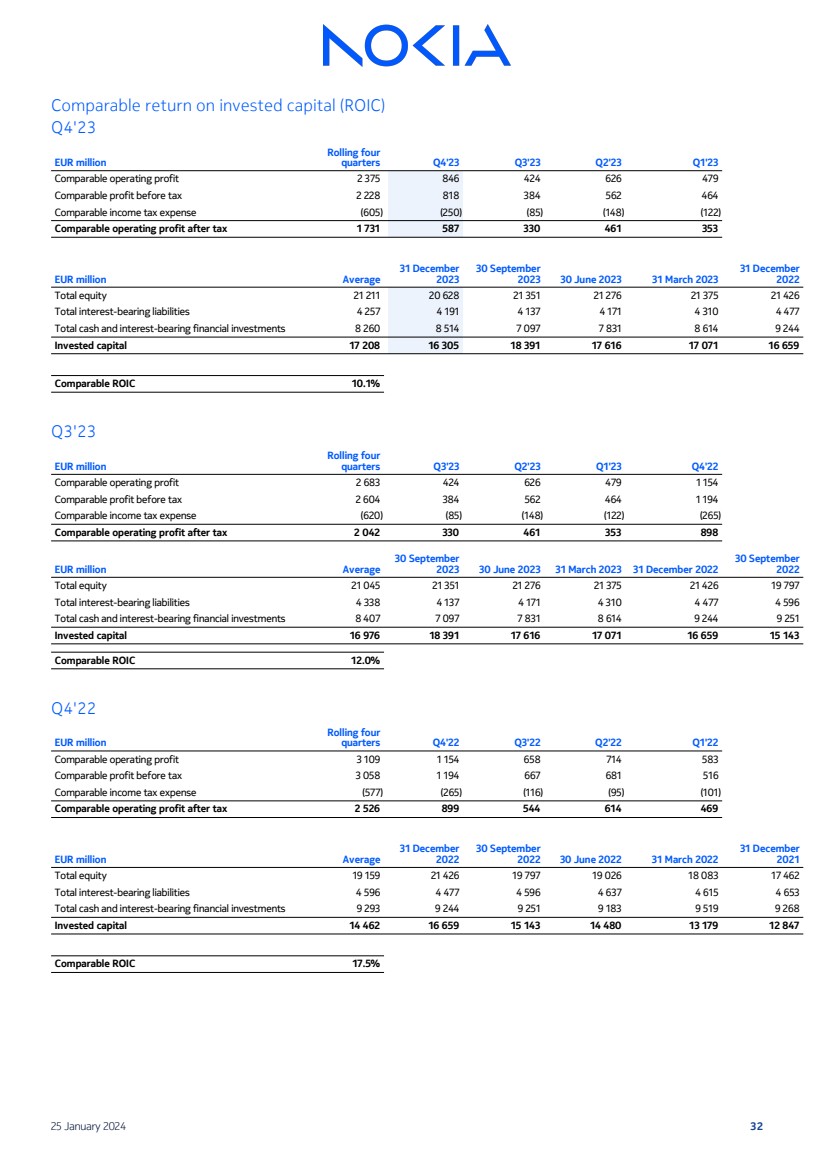
| Comparable return on invested capital (ROIC)
Q4'23
EUR million
Rolling four
quarters Q4'23 Q3'23 Q2'23 Q1'23
Comparable operating profit 2 375 846 424 626 479
Comparable profit before tax 2 228 818 384 562 464
Comparable income tax expense (605) (250) (85) (148) (122)
Comparable operating profit after tax 1 731 587 330 461 353
EUR million Average
31 December
2023
30 September
2023 30 June 2023 31 March 2023
31 December
2022
Total equity 21 211 20 628 21 351 21 276 21 375 21 426
Total interest-bearing liabilities 4 257 4 191 4 137 4 171 4 310 4 477
Total cash and interest-bearing financial investments 8 260 8 514 7 097 7 831 8 614 9 244
Invested capital 17 208 16 305 18 391 17 616 17 071 16 659
Comparable ROIC 10.1%
Q3'23
EUR million
Rolling four
quarters Q3'23 Q2'23 Q1'23 Q4'22
Comparable operating profit 2 683 424 626 479 1 154
Comparable profit before tax 2 604 384 562 464 1 194
Comparable income tax expense (620) (85) (148) (122) (265)
Comparable operating profit after tax 2 042 330 461 353 898
EUR million Average
30 September
2023 30 June 2023 31 March 2023 31 December 2022
30 September
2022
Total equity 21 045 21 351 21 276 21 375 21 426 19 797
Total interest-bearing liabilities 4 338 4 137 4 171 4 310 4 477 4 596
Total cash and interest-bearing financial investments 8 407 7 097 7 831 8 614 9 244 9 251
Invested capital 16 976 18 391 17 616 17 071 16 659 15 143
Comparable ROIC 12.0%
Q4'22
EUR million
Rolling four
quarters Q4'22 Q3'22 Q2'22 Q1'22
Comparable operating profit 3 109 1 154 658 714 583
Comparable profit before tax 3 058 1 194 667 681 516
Comparable income tax expense (577) (265) (116) (95) (101)
Comparable operating profit after tax 2 526 899 544 614 469
EUR million Average
31 December
2022
30 September
2022 30 June 2022 31 March 2022
31 December
2021
Total equity 19 159 21 426 19 797 19 026 18 083 17 462
Total interest-bearing liabilities 4 596 4 477 4 596 4 637 4 615 4 653
Total cash and interest-bearing financial investments 9 293 9 244 9 251 9 183 9 519 9 268
Invested capital 14 462 16 659 15 143 14 480 13 179 12 847
Comparable ROIC 17.5%
25 January 2024 32 |
| This financial report was approved by the Board of Directors on 25 January 2024.
Media and Investor Contacts:
Communications, tel. +358 10 448 4900 email: press.services@nokia.com
Investor Relations, tel. +358 4080 3 4080 email: investor.relations@nokia.com
• Nokia plans to publish its "Nokia in 2023" annual report, which includes the review by the Board of Directors
and the audited annual accounts, during the week starting on 26 February 2024.
• Nokia's Annual General Meeting 2024 is planned to be held on 3 April 2024.
• Nokia plans to publish its first quarter 2024 results on 18 April 2024.
• Nokia plans to publish its second quarter and half year 2024 results on 18 July 2024.
• Nokia plans to publish its third quarter and January-September 2024 results on 17 October 2024.
25 January 2024 33 |
SIGNATURE
Pursuant
to the requirements of the Securities Exchange Act of 1934, the registrant, Nokia Corporation, has duly caused this report to be signed
on its behalf by the undersigned, thereunto duly authorized.
| Date: January 25, 2024 |
Nokia Corporation |
| |
By: |
/s/
Esa Niinimäki |
| |
Name: |
Esa Niinimäki |
| |
Title: |
Chief Legal Officer |
Nokia (NYSE:NOK)
Historical Stock Chart
From Mar 2024 to Apr 2024

Nokia (NYSE:NOK)
Historical Stock Chart
From Apr 2023 to Apr 2024
