WATERS CORP /DE/ NYSE false 0001000697 0001000697 2024-01-08 2024-01-08
UNITED STATES
SECURITIES AND EXCHANGE COMMISSION
WASHINGTON, D.C. 20549
FORM 8-K
CURRENT REPORT
Pursuant to Section 13 or 15(d)
of the Securities Exchange Act of 1934
Date of Report (Date of earliest event reported): January 8, 2024
Waters Corporation
(Exact Name of Registrant as Specified in its Charter)
|
|
|
|
|
| Delaware |
|
01-14010 |
|
13-3668640 |
(State or other jurisdiction
of incorporation) |
|
(Commission
File Number) |
|
(IRS Employer
Identification No.) |
34 Maple Street
Milford, Massachusetts 01757
(Address of Principal Executive Offices) (Zip Code)
(508) 478-2000
(Registrant’s telephone number, including area code)
N/A
(Former name or former address, if changed since last report)
Check the appropriate box below if the Form 8-K filing is intended to simultaneously satisfy the filing obligation of the registrant under any of the following provisions:
| ☐ |
Written communications pursuant to Rule 425 under the Securities Act (17 CFR 230.425) |
| ☐ |
Soliciting material pursuant to Rule 14a-12 under the Exchange Act (17 CFR 240.14a-12) |
| ☐ |
Pre-commencement communications pursuant to Rule 14d-2(b) under the Exchange Act (17 CFR 240.14d-2(b)) |
| ☐ |
Pre-commencement communications pursuant to Rule 13e-4(c) under the Exchange Act (17 CFR 240.13e-4(c)) |
Securities registered pursuant to Section 12(b) of the Act:
|
|
|
|
|
| Title of each class |
|
Trading
Symbol(s) |
|
Name of each exchange
on which registered |
| Common stock, par value $0.01 per share |
|
WAT |
|
New York Stock Exchange, Inc. |
Indicate by check mark whether the registrant is an emerging growth company as defined in Rule 405 of the Securities Act of 1933 (§230.405 of this chapter) or Rule 12b-2 of the Securities Exchange Act of 1934 (§240.12b-2 of this chapter).
Emerging growth company ☐
If an emerging growth company, indicate by check mark if the registrant has elected not to use the extended transition period for complying with any new or revised financial accounting standards provided pursuant to Section 13(a) of the Exchange Act. ☐
| Item 7.01 |
Regulation FD Disclosure. |
Waters Corporation (the “Company”) is furnishing as Exhibit 99.1 to this Current Report on Form 8-K an investor presentation (the “Presentation”) that it presented at the J.P. Morgan Healthcare Conference (the “Conference”) on January 8, 2024, which, along with the subsequent Q&A session, included high-level commentary on business performance. The Company made the Presentation available to the public prior to the Presentation’s occurrence on Waters Corporation’s website www.waters.com in the Investors section under Investor Presentations. A transcript of the Presentation is available on the Waters Corporation website www.waters.com in the Investors section under Investor Presentations.
The information contained in this Current Report on Form 8-K (including Exhibit 99.1) is being furnished and shall not be deemed “filed” for purposes of Section 18 of the Securities Exchange Act of 1934, as amended (the “Exchange Act”), or otherwise subject to the liabilities under that section, and shall not be deemed incorporated by reference into any filing under the Securities Act of 1933, as amended, or the Exchange Act, except as shall be expressly provided by specific reference in such filing.
| Item 9.01 |
Financial Statements and Exhibits. |
(d) Exhibits
Signatures
Pursuant to the requirements of the Securities Exchange Act of 1934, the registrant has duly caused this report to be signed on its behalf by the undersigned hereunto duly authorized.
|
|
|
| WATERS CORPORATION |
|
|
| By: |
|
/s/ Amol Chaubal |
| Name: |
|
Amol Chaubal |
| Title: |
|
Senior Vice President and Chief Financial Officer |
|
|
(Principal Financial Officer and Principal Accounting Officer) |
Dated: January 9, 2024
3

Exhibit 99.1 J.P. Morgan 42nd Annual Healthcare Conference Udit Batra,
Ph.D. President & CEO January 8, 2024
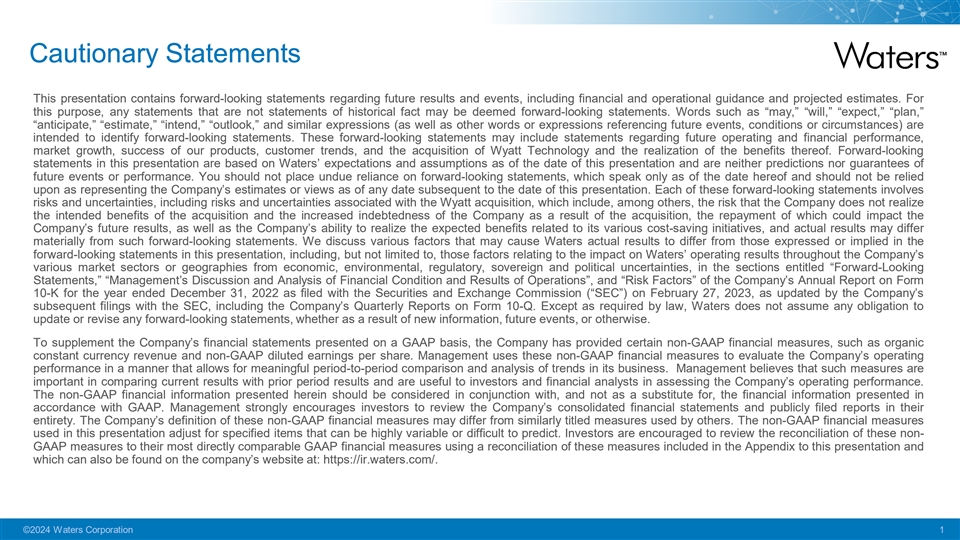
Cautionary Statements This presentation contains forward-looking
statements regarding future results and events, including financial and operational guidance and projected estimates. For this purpose, any statements that are not statements of historical fact may be deemed forward-looking statements. Words such as
“may,” “will,” “expect,” “plan,” “anticipate,” “estimate,” “intend,” “outlook,” and similar expressions (as well as other words or expressions
referencing future events, conditions or circumstances) are intended to identify forward-looking statements. These forward-looking statements may include statements regarding future operating and financial performance, market growth, success of our
products, customer trends, and the acquisition of Wyatt Technology and the realization of the benefits thereof. Forward-looking statements in this presentation are based on Waters’ expectations and assumptions as of the date of this
presentation and are neither predictions nor guarantees of future events or performance. You should not place undue reliance on forward-looking statements, which speak only as of the date hereof and should not be relied upon as representing the
Company’s estimates or views as of any date subsequent to the date of this presentation. Each of these forward-looking statements involves risks and uncertainties, including risks and uncertainties associated with the Wyatt acquisition, which
include, among others, the risk that the Company does not realize the intended benefits of the acquisition and the increased indebtedness of the Company as a result of the acquisition, the repayment of which could impact the Company’s future
results, as well as the Company’s ability to realize the expected benefits related to its various cost-saving initiatives, and actual results may differ materially from such forward-looking statements. We discuss various factors that may cause
Waters actual results to differ from those expressed or implied in the forward-looking statements in this presentation, including, but not limited to, those factors relating to the impact on Waters’ operating results throughout the
Company’s various market sectors or geographies from economic, environmental, regulatory, sovereign and political uncertainties, in the sections entitled “Forward-Looking Statements,” “Management’s Discussion and
Analysis of Financial Condition and Results of Operations”, and “Risk Factors” of the Company’s Annual Report on Form 10-K for the year ended December 31, 2022 as filed with the Securities and Exchange Commission
(“SEC”) on February 27, 2023, as updated by the Company’s subsequent filings with the SEC, including the Company’s Quarterly Reports on Form 10-Q. Except as required by law, Waters does not assume any obligation to update or
revise any forward-looking statements, whether as a result of new information, future events, or otherwise. To supplement the Company’s financial statements presented on a GAAP basis, the Company has provided certain non-GAAP financial
measures, such as organic constant currency revenue and non-GAAP diluted earnings per share. Management uses these non-GAAP financial measures to evaluate the Company’s operating performance in a manner that allows for meaningful
period-to-period comparison and analysis of trends in its business. Management believes that such measures are important in comparing current results with prior period results and are useful to investors and financial analysts in assessing the
Company’s operating performance. The non-GAAP financial information presented herein should be considered in conjunction with, and not as a substitute for, the financial information presented in accordance with GAAP. Management strongly
encourages investors to review the Company’s consolidated financial statements and publicly filed reports in their entirety. The Company’s definition of these non-GAAP financial measures may differ from similarly titled measures used by
others. The non-GAAP financial measures used in this presentation adjust for specified items that can be highly variable or difficult to predict. Investors are encouraged to review the reconciliation of these non- GAAP measures to their most
directly comparable GAAP financial measures using a reconciliation of these measures included in the Appendix to this presentation and which can also be found on the company’s website at: https://ir.waters.com/. ©2024 Waters Corporation
1

Key Messages Strong Business Model in Attractive Markets Transformation
that is Delivering Well Positioned for Future Growth ©2024 Waters Corporation 2
Key Messages Strong Business Model in Attractive Markets Transformation
that is Delivering Well Positioned for Future Growth ©2024 Waters Corporation 3

Waters Serves Regulated Markets with Large Unmet Needs Pharma Clinical
Food & Environment Materials HSD HSD MSD MSD Safe renewable energy High-quality medicines Early disease detection Pure food and water Biologics, Novel Modalities Alzheimer's, Endocrine PFAS, Nitrosamines Batteries, Electric Vehicles $12B TAM*
with 4-6% Long-Term Growth * TAM = Total Addressable Market, where $12B of a broader $80B TAM for Analytical Instruments is serviceable by Waters core (established) business. Growth rates here reflect our internal analysis of historical, long- term
market trend data, which are subject to future changes. TAMs and growth rates are estimates based on internal projections and represent forward-looking statements and are subject to inherent uncertainties that could cause actual results to differ
and such differences could be material. 1. Estimated total addressable market for analytical instruments of ~$80B; Source: Waters data and estimates, consulting data, industry reports, and market research. ©2024 Waters Corporation 4
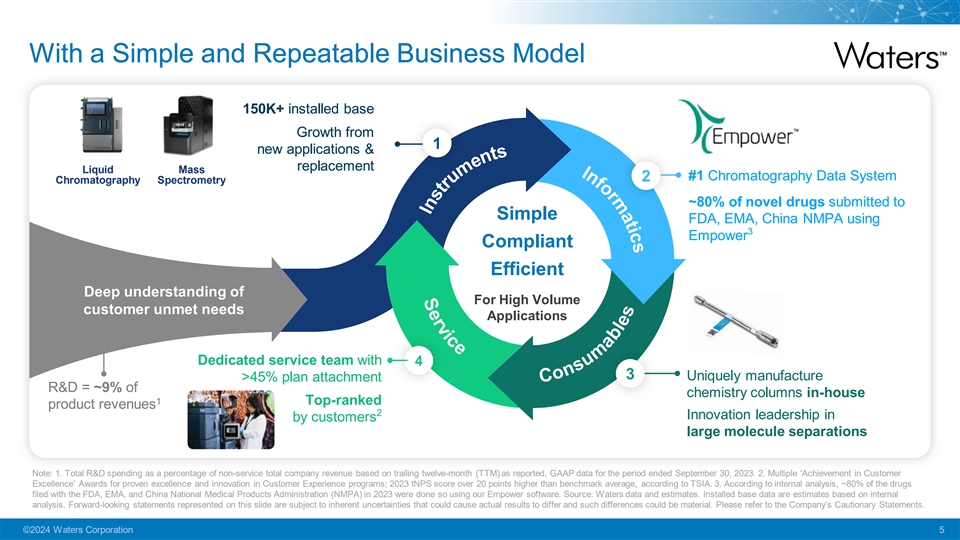
With a Simple and Repeatable Business Model 150K+ installed base Growth
from 1 new applications & replacement Liquid Mass 2 #1 Chromatography Data System Chromatography Spectrometry ~80% of novel drugs submitted to Simple FDA, EMA, China NMPA using 3 Empower Compliant Efficient Deep understanding of For High Volume
customer unmet needs Applications Dedicated service team with 4 3 Uniquely manufacture >45% plan attachment R&D = ~9% of chemistry columns in-house 1 Top-ranked product revenues 2 Innovation leadership in by customers large molecule
separations Note: 1. Total R&D spending as a percentage of non-service total company revenue based on trailing twelve-month (TTM) as reported, GAAP data for the period ended September 30, 2023. 2. Multiple ‘Achievement in Customer
Excellence’ Awards for proven excellence and innovation in Customer Experience programs; 2023 tNPS score over 20 points higher than benchmark average, according to TSIA. 3. According to internal analysis, ~80% of the drugs filed with the FDA,
EMA, and China National Medical Products Administration (NMPA) in 2023 were done so using our Empower software. Source: Waters data and estimates. Installed base data are estimates based on internal analysis. Forward-looking statements represented
on this slide are subject to inherent uncertainties that could cause actual results to differ and such differences could be material. Please refer to the Company’s Cautionary Statements. ©2024 Waters Corporation 5

Resulting in Industry-Leading Profitability NYSE:WAT Serving High
Volume, Downstream Presence Regulated Applications $3.0B 1 Total Revenue (TTM) Pharma QA/QC testing Late-Stage Drug Development 59.1% Gross Margin (TTM) Food & Environmental Safety Clinical Diagnostics 30.6% 2 Adj. Operating Margin (TTM)
Materials Analysis Yields High Degree of 24% >50% Sales Recurrence 3 of Pharma revenues in QA/QC 5-yr Avg FCF as % of Sales Note: 1. Based on trailing twelve-month (TTM) as reported, GAAP data for the period ended September 30, 2023; 2. Operating
Margin results are in adjusted, non-GAAP operating margin percentage terms based on trailing twelve-month non-GAAP data for the period ended September 30, 2023. See reconciliations of the non-GAAP measures to the most directly comparable GAAP
measures included in the Appendix of this presentation and available on the Company’s $7B Total Accessible Market website at: https://ir.waters.com/. 3. FCF = Free Cash Flow where data presented is a 5-year average of annual free cash flow as
a % of as-reported, GAAP revenues from 2018-2022. Source: Waters Corporation data. ©2024 Waters Corporation 6
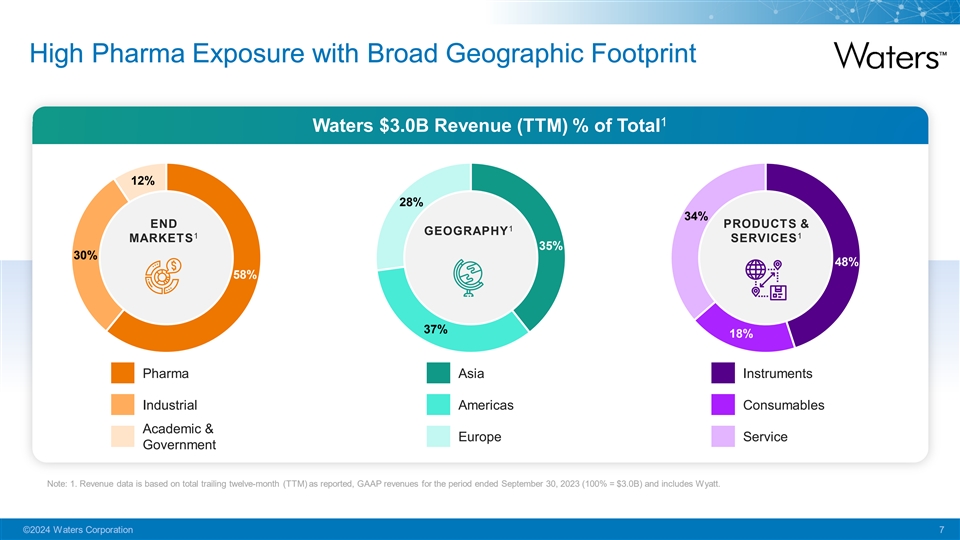
High Pharma Exposure with Broad Geographic Footprint 1 Waters $3.0B
Revenue (TTM) % of Total 12% 28% 34% END PRODUCTS & 1 GEOGRAPHY 1 1 MARKETS SERVICES 35% 30% 48% 58% 37% 18% Pharma Asia Instruments Industrial Americas Consumables Academic & Europe Service Government Note: 1. Revenue data is based on total
trailing twelve-month (TTM) as reported, GAAP revenues for the period ended September 30, 2023 (100% = $3.0B) and includes Wyatt. ©2024 Waters Corporation 7

Key Messages Strong Business Model in Attractive Markets Transformation
that is Delivering Well Positioned for Future Growth ©2024 Waters Corporation 8
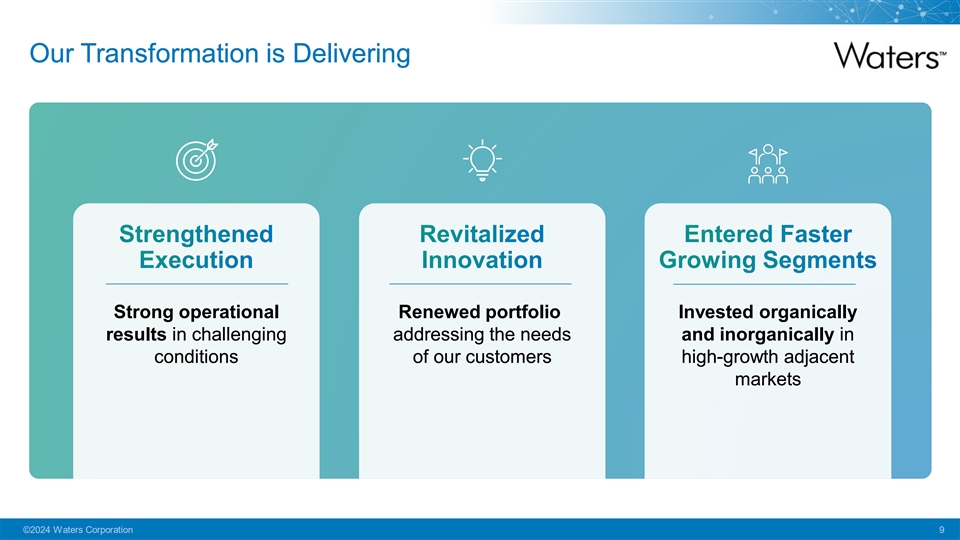
Our Transformation is Delivering Strong operational Renewed portfolio
Invested organically results in challenging addressing the needs and inorganically in conditions of our customers high-growth adjacent markets ©2024 Waters Corporation 9
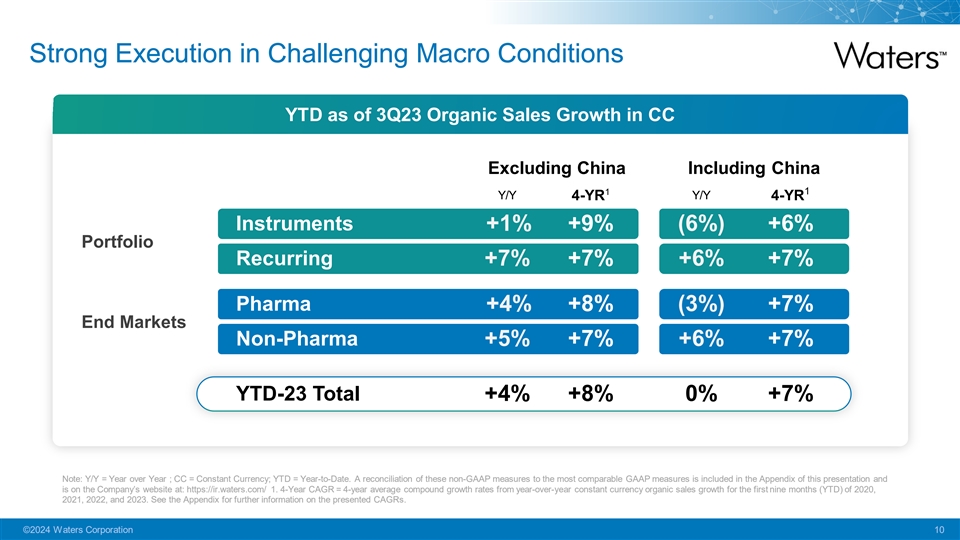
Strong Execution in Challenging Macro Conditions YTD as of 3Q23 Organic
Sales Growth in CC Excluding China Including China 1 1 Y/Y 4-YR Y/Y 4-YR Instruments +1% +9% (6%) +6% Portfolio Recurring +7% +7% +6% +7% Pharma +4% +8% (3%) +7% End Markets Non-Pharma +5% +7% +6% +7% YTD-23 Total +4% +8% 0% +7% Note: Y/Y = Year
over Year ; CC = Constant Currency; YTD = Year-to-Date. A reconciliation of these non-GAAP measures to the most comparable GAAP measures is included in the Appendix of this presentation and is on the Company’s website at:
https://ir.waters.com/ 1. 4-Year CAGR = 4-year average compound growth rates from year-over-year constant currency organic sales growth for the first nine months (YTD) of 2020, 2021, 2022, and 2023. See the Appendix for further information on the
presented CAGRs. ©2024 Waters Corporation 10

Commercial Initiatives are Contributing Solid progress in our
transformation with long-term runway ahead 1 2 3 4 5 Instrument Service Plan Chemistry Adoption Contract Impact Markets Replacement Attachment of eCommerce Organizations with Innovation 25% 550bps >35% 25% 500bps Aged instruments Service plan
vs.~20% in 2019, Improvement in Core pharma revenues remaining in original expansion vs. 2019, driving incremental product vitality index now from CXOs 1 dataset w/ +200bps in 2023 spend vs. 2019 Goal Goal Goal Goal Goal Catch-up prior Grow
attachment 10% Sell 55% of chemistry 35% of pharma revs Solve customer unmet replacement opportunities vs 2019 levels via eCommerce from CXOs needs with new products Note: Data referenced on this slide represents a combination of historical analysis
based on internal Waters estimates and forward-looking statements which are subject to inherent uncertainties that could cause actual results to differ and such differences could be material. Historical results are not indicative of future
performance. 1. Denotes ex-TA product vitality ©2024 Waters Corporation 11
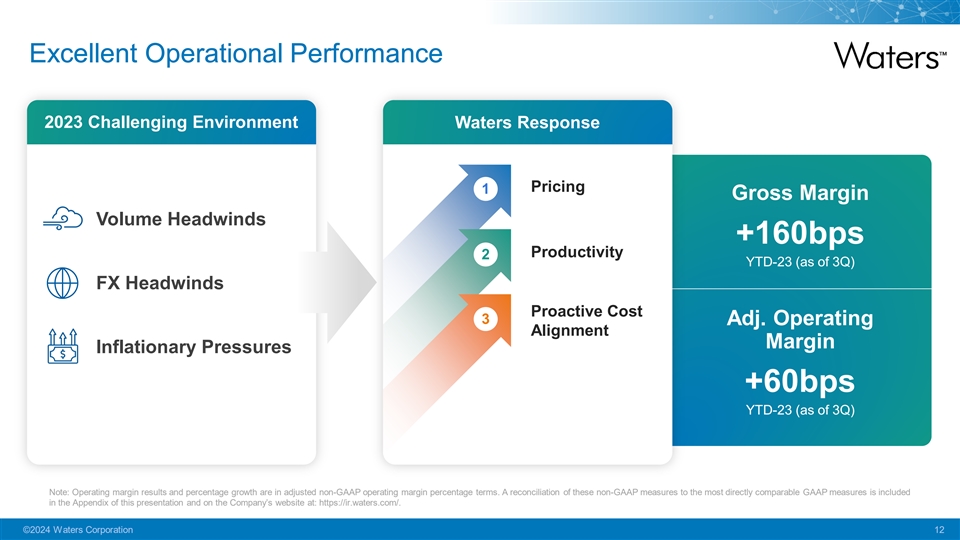
Excellent Operational Performance 2023 Challenging Environment Waters
Response Pricing 1 Gross Margin Volume Headwinds +160bps Productivity 2 YTD-23 (as of 3Q) FX Headwinds Proactive Cost 3 Adj. Operating Alignment Margin Inflationary Pressures +60bps YTD-23 (as of 3Q) Note: Operating margin results and percentage
growth are in adjusted non-GAAP operating margin percentage terms. A reconciliation of these non-GAAP measures to the most directly comparable GAAP measures is included in the Appendix of this presentation and on the Company’s website at:
https://ir.waters.com/. $7B Total Accessible Market ©2024 Waters Corporation 12
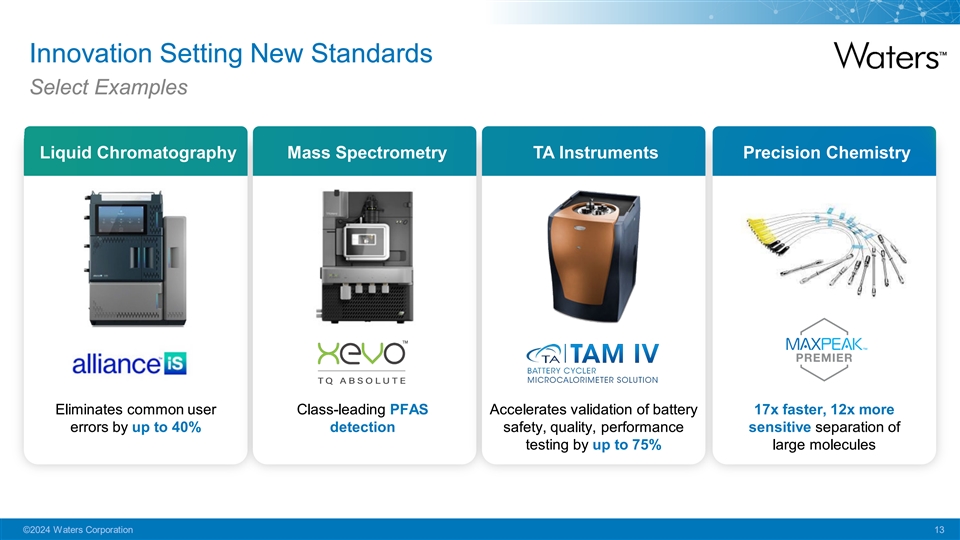
Innovation Setting New Standards Select Examples Liquid Chromatography
Mass Spectrometry TA Instruments Precision Chemistry Eliminates common user Class-leading PFAS Accelerates validation of battery 17x faster, 12x more errors by up to 40% detection safety, quality, performance sensitive separation of testing by up to
75% large molecules ©2024 Waters Corporation 13
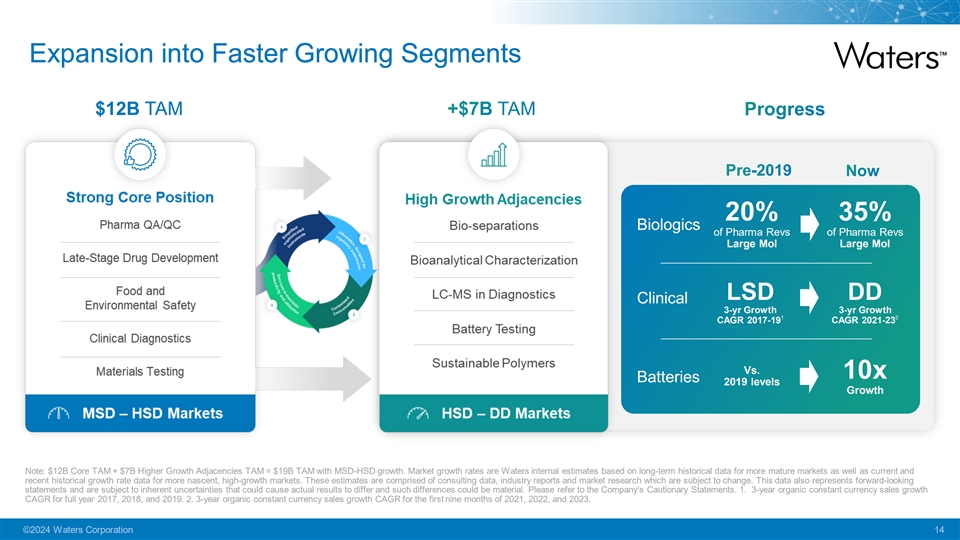
Expansion into Faster Growing Segments $12B TAM 20% 35% Biologics of
Pharma Revs of Pharma Revs Large Mol Large Mol LSD DD Clinical 3-yr Growth 3-yr Growth 1 2 CAGR 2017-19 CAGR 2021-23 Vs. 10x Batteries 2019 levels Growth Note: $12B Core TAM + $7B Higher Growth Adjacencies TAM = $19B TAM with MSD-HSD growth. Market
growth rates are Waters internal estimates based on long-term historical data for more mature markets as well as current and recent historical growth rate data for more nascent, high-growth markets. These estimates are comprised of consulting data,
industry reports and market research which are subject to change. This data also represents forward-looking statements and are subject to inherent uncertainties that could cause actual results to differ and such differences could be material. Please
refer to the Company’s Cautionary Statements. 1. 3-year organic constant currency sales growth CAGR for full year 2017, 2018, and 2019. 2. 3-year organic constant currency sales growth CAGR for the first nine months of 2021, 2022, and 2023.
©2024 Waters Corporation 14

Transitioning to More Balanced Capital Allocation Mix with M&A
M&A Execution: Ahead of Plan for Synergy Progress GOAL / KPI 2023 PROGRESS Geographic Initiated direct sales & Segment Lead-sharing ahead of expectations Expansion Despite macro environment, 2023 PROGRESS Wyatt 2Q and GOAL / KPI Waters SEC
columns launched 3Q sales and bundling as of 3Q23 Increased Industry-Leading Light Attachment contribution LC databridge completed in 4Q23, Scattering Detection ahead of schedule ACQUIRED MAY 2023 ahead of 1 expectations 2023 PROGRESS GOAL / KPI
First beta expected in 2024; full Accelerate release in 2025 LC-MALS in Initial workflows will cover mAbs QA/QC and AAVs Note: 1. Refers to GAAP metrics where Wyatt contributed 2% to as-reported sales in 2Q23 and 4% to as-reported sales in 3Q23.
Synergy progress is based on internal data and estimates, Historical returns are not indicative of future performance. This data represents forward-looking statements and are subject to inherent uncertainties that could cause actual results to
differ and such differences could be material. Please refer to the Company’s Cautionary Statements. 1. Refers to contribution of As Reported, GAAP total company revenues. ©2024 Waters Corporation 15
Key Messages Strong Business Model in Attractive Markets Transformation
that is Delivering Well Positioned for Future Growth ©2024 Waters Corporation 16

Aligned with Secular Tailwinds that are Stronger than Ever Waters %
Revenue Growth (Y/Y Constant Currency 2008-22) Incremental Growth Vectors 2 vs. Historical Trends 6% 20% 1 Faster Volume Growth Average 1 5% 10% 2008-2022 § Faster Prescription growth 1 Avg § Regulations (PFAS) 0% New Applications 2 -10%
§ Large molecule and novel modalities require more extensive analysis 10% Above Historic Pricing 3 § Expected to drive +100bps 7% future long-term growth 1 Avg 0% Historical Future Long-Term Long-Term Growth Growth Potential Note: 1.
Average Annual Growth Rates of year-over-year, constant currency sales growth from 2008 to 2022. Growth rates here reflect our internal analysis of Waters historical, annual non-GAAP sales data which is publicly available, including the relevant
GAAP to Non-GAAP reconciliations for each year. 2. Estimates on this page are comprised of internal analysis, consulting data, industry reports and market research which are subject to change. This data also represents forward-looking statements and
are subject to inherent uncertainties that could cause actual results to differ and such differences could be material. Please refer to the Company’s Cautionary Statements. ©2024 Waters Corporation 17 Recurring Instruments 08 09 10 11 12
13 14 15 16 17 18 19 20 21 22
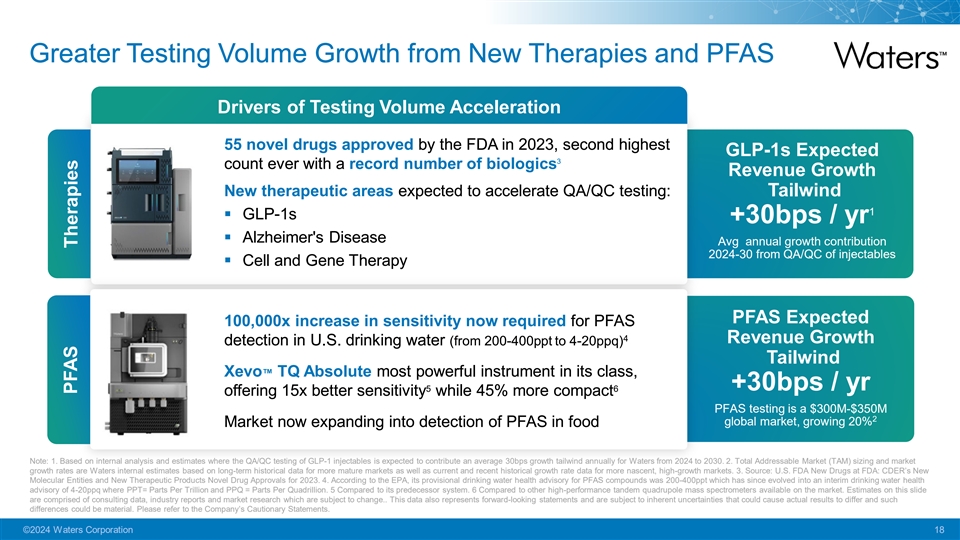
Greater Testing Volume Growth from New Therapies and PFAS Drivers of
Testing Volume Acceleration 55 novel drugs approved by the FDA in 2023, second highest GLP-1s Expected 3 count ever with a record number of biologics Revenue Growth New therapeutic areas expected to accelerate QA/QC testing: Tailwind 1 § GLP-1s
+30bps / yr § Alzheimer's Disease Avg annual growth contribution 2024-30 from QA/QC of injectables § Cell and Gene Therapy PFAS Expected 100,000x increase in sensitivity now required for PFAS 4 Revenue Growth detection in U.S. drinking
water (from 200-400ppt to 4-20ppq) Tailwind Xevo™ TQ Absolute most powerful instrument in its class, +30bps / yr 5 6 offering 15x better sensitivity while 45% more compact PFAS testing is a $300M-$350M 2 global market, growing 20% Market now
expanding into detection of PFAS in food Note: 1. Based on internal analysis and estimates where the QA/QC testing of GLP-1 injectables is expected to contribute an average 30bps growth tailwind annually for Waters from 2024 to 2030. 2. Total
Addressable Market (TAM) sizing and market growth rates are Waters internal estimates based on long-term historical data for more mature markets as well as current and recent historical growth rate data for more nascent, high-growth markets. 3.
Source: U.S. FDA New Drugs at FDA: CDER’s New Molecular Entities and New Therapeutic Products Novel Drug Approvals for 2023. 4. According to the EPA, its provisional drinking water health advisory for PFAS compounds was 200-400ppt which has
since evolved into an interim drinking water health advisory of 4-20ppq where PPT= Parts Per Trillion and PPQ = Parts Per Quadrillion. 5 Compared to its predecessor system. 6 Compared to other high-performance tandem quadrupole mass spectrometers
available on the market. Estimates on this slide are comprised of consulting data, industry reports and market research which are subject to change.. This data also represents forward-looking statements and are subject to inherent uncertainties that
could cause actual results to differ and such differences could be material. Please refer to the Company’s Cautionary Statements. ©2024 Waters Corporation 18 PFAS Therapies
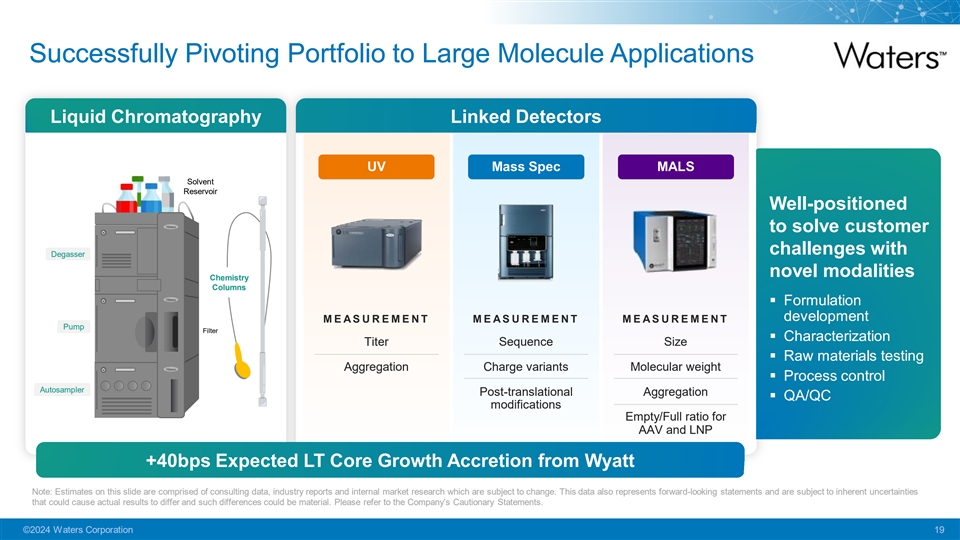
Successfully Pivoting Portfolio to Large Molecule Applications Liquid
Chromatography Linked Detectors UV Mass Spec MALS Solvent Reservoir Well-positioned to solve customer challenges with Degasser novel modalities Chemistry Columns § Formulation development M EA SU R EM EN T M EA SU R EM EN T M EA SU R EM EN T
Pump Filter § Characterization Titer Sequence Size § Raw materials testing Aggregation Charge variants Molecular weight § Process control Autosampler Post-translational Aggregation § QA/QC modifications Empty/Full ratio for AAV
and LNP +40bps Expected LT Core Growth Accretion from Wyatt Note: Estimates on this slide are comprised of consulting data, industry reports and internal market research which are subject to change. This data also represents forward-looking
statements and are subject to inherent uncertainties that could cause actual results to differ and such differences could be material. Please refer to the Company’s Cautionary Statements. ©2024 Waters Corporation 19

Uniquely Positioned for M&A New leadership capabilities unlocking
additional vector of shareholder value creation Strong Free Cash Focused on growth Scope of current Flow Conversion opportunities with portfolio may offer can allow for rapid sound industrial advantaged position de-levering logic and with in
today’s regulatory financial discipline environment Note: This data also represents forward-looking statements and are subject to inherent uncertainties that could cause actual results to differ and such differences could be material. Please
refer to the Company’s Cautionary Statements. ©2024 Waters Corporation 20
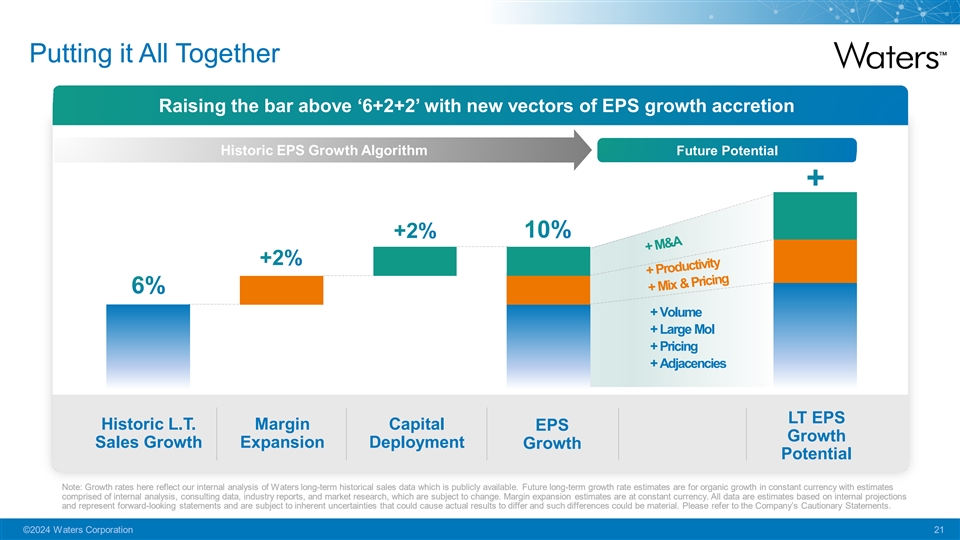
Putting it All Together Raising the bar above ‘6+2+2’ with
new vectors of EPS growth accretion Historic EPS Growth Algorithm F Fut utur ure e P Po ot te ent ntiia all + Volume + Large Mol + Pricing + Adjacencies LT EPS Historic L.T. Margin Capital EPS Growth Sales Growth Expansion Deployment Growth
Potential Note: Growth rates here reflect our internal analysis of Waters long-term historical sales data which is publicly available. Future long-term growth rate estimates are for organic growth in constant currency with estimates comprised of
internal analysis, consulting data, industry reports, and market research, which are subject to change. Margin expansion estimates are at constant currency. All data are estimates based on internal projections and represent forward-looking
statements and are subject to inherent uncertainties that could cause actual results to differ and such differences could be material. Please refer to the Company’s Cautionary Statements. ©2024 Waters Corporation 21
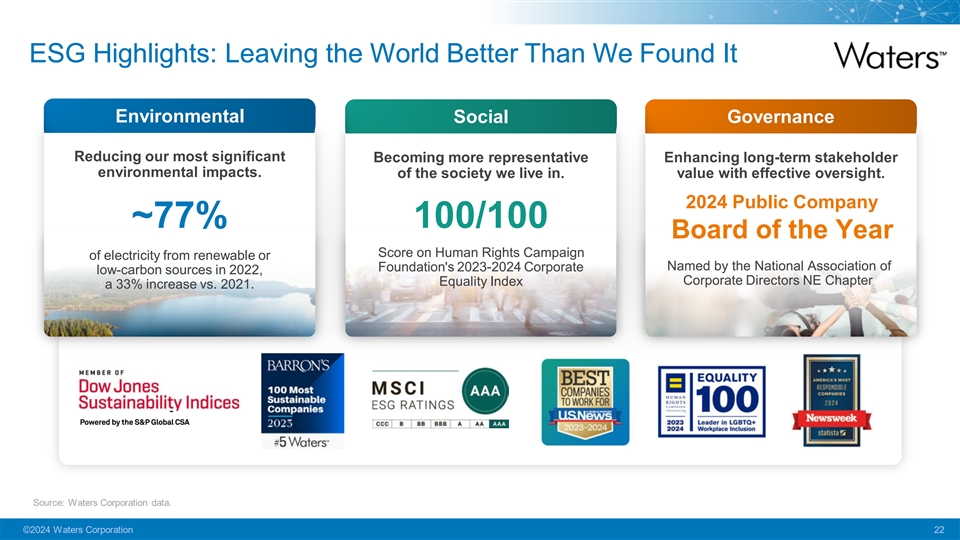
ESG Highlights: Leaving the World Better Than We Found It Environmental
Social Governance Reducing our most significant Becoming more representative Enhancing long-term stakeholder environmental impacts. of the society we live in. value with effective oversight. 2024 Public Company ~77% 100/100 Board of the Year Score
on Human Rights Campaign of electricity from renewable or Named by the National Association of Foundation's 2023-2024 Corporate low-carbon sources in 2022, Corporate Directors NE Chapter Equality Index a 33% increase vs. 2021. Source: Waters
Corporation data. ©2024 Waters Corporation 22

Key Messages Strong Business Model in Attractive Markets Transformation
that is Delivering Well Positioned for Future Growth ©2024 Waters Corporation 23
Appendix GAAP to Non-GAAP Reconciliations
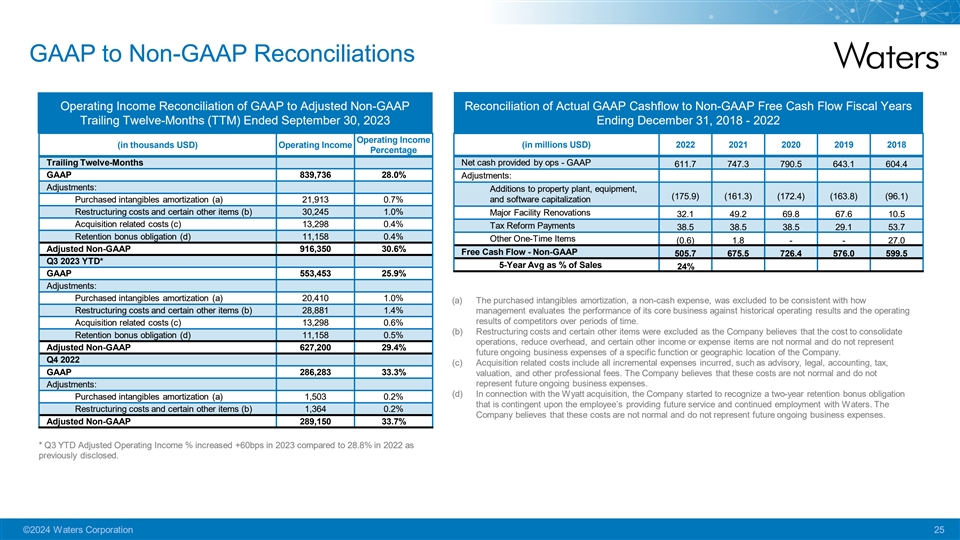
GAAP to Non-GAAP Reconciliations Operating Income Reconciliation of
GAAP to Adjusted Non-GAAP Reconciliation of Actual GAAP Cashflow to Non-GAAP Free Cash Flow Fiscal Years Trailing Twelve-Months (TTM) Ended September 30, 2023 Ending December 31, 2018 - 2022 Operating Income (in thousands USD) Operating Income (in
millions USD) 2022 2021 2020 2019 2018 Percentage Trailing Twelve-Months Net cash provided by ops - GAAP 611.7 747.3 790.5 643.1 604.4 GAAP 839,736 28.0% Adjustments: Adjustments: Additions to property plant, equipment, (175.9) (161.3) (172.4)
(163.8) (96.1) Purchased intangibles amortization (a) 21,913 0.7% and software capitalization Restructuring costs and certain other items (b) 30,245 1.0% Major Facility Renovations 32.1 49.2 69.8 67.6 10.5 Acquisition related costs (c) 13,298 0.4%
Tax Reform Payments 38.5 38.5 38.5 29.1 53.7 Retention bonus obligation (d) 11,158 0.4% Other One-Time Items (0.6) 1.8 - - 27.0 Adjusted Non-GAAP 916,350 30.6% Free Cash Flow - Non-GAAP 505.7 675.5 726.4 576.0 599.5 Q3 2023 YTD* 5-Year Avg as % of
Sales 24% GAAP 553,453 25.9% Adjustments: Purchased intangibles amortization (a) 20,410 1.0% (a) The purchased intangibles amortization, a non-cash expense, was excluded to be consistent with how Restructuring costs and certain other items (b)
28,881 1.4% management evaluates the performance of its core business against historical operating results and the operating results of competitors over periods of time. Acquisition related costs (c) 13,298 0.6% (b) Restructuring costs and certain
other items were excluded as the Company believes that the cost to consolidate Retention bonus obligation (d) 11,158 0.5% operations, reduce overhead, and certain other income or expense items are not normal and do not represent Adjusted Non-GAAP
627,200 29.4% future ongoing business expenses of a specific function or geographic location of the Company. Q4 2022 (c) Acquisition related costs include all incremental expenses incurred, such as advisory, legal, accounting, tax, GAAP 286,283
33.3% valuation, and other professional fees. The Company believes that these costs are not normal and do not represent future ongoing business expenses. Adjustments: (d) In connection with the Wyatt acquisition, the Company started to recognize a
two-year retention bonus obligation Purchased intangibles amortization (a) 1,503 0.2% that is contingent upon the employee’s providing future service and continued employment with Waters. The Restructuring costs and certain other items (b)
1,364 0.2% Company believes that these costs are not normal and do not represent future ongoing business expenses. Adjusted Non-GAAP 289,150 33.7% * Q3 YTD Adjusted Operating Income % increased +60bps in 2023 compared to 28.8% in 2022 as previously
disclosed. ©2024 Waters Corporation 25
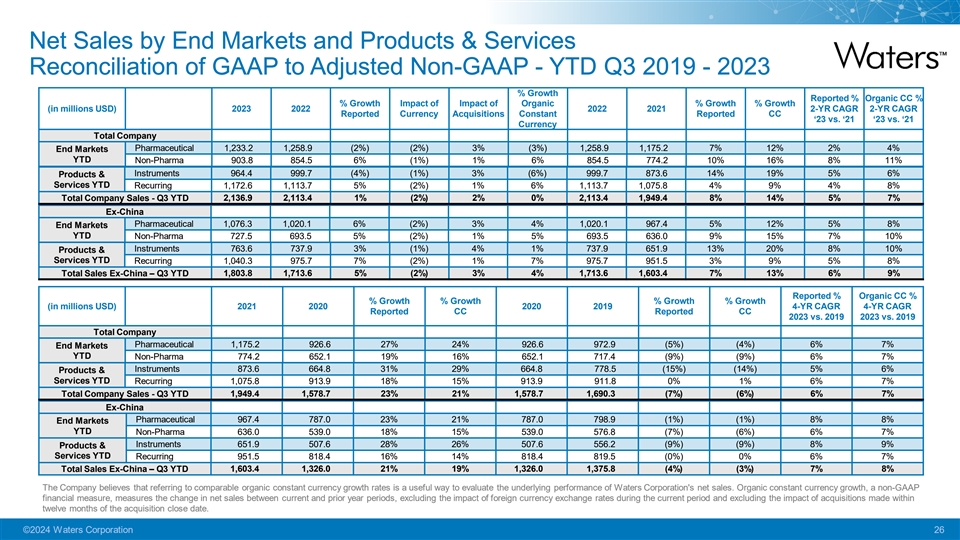
Net Sales by End Markets and Products & Services Reconciliation of
GAAP to Adjusted Non-GAAP - YTD Q3 2019 - 2023 % Growth Reported % Organic CC % % Growth Impact of Impact of Organic % Growth % Growth (in millions USD) 2023 2022 2022 2021 2-YR CAGR 2-YR CAGR Reported Currency Acquisitions Constant Reported CC
‘23 vs. ‘21 ‘23 vs. ‘21 Currency Total Company Pharmaceutical 1,233.2 1,258.9 (2%) (2%) 3% (3%) 1,258.9 1,175.2 7% 12% 2% 4% End Markets YTD Non-Pharma 903.8 854.5 6% (1%) 1% 6% 854.5 774.2 10% 16% 8% 11% Instruments 964.4
999.7 (4%) (1%) 3% (6%) 999.7 873.6 14% 19% 5% 6% Products & Services YTD Recurring 1,172.6 1,113.7 5% (2%) 1% 6% 1,113.7 1,075.8 4% 9% 4% 8% Total Company Sales - Q3 YTD 2,136.9 2,113.4 1% (2%) 2% 0% 2,113.4 1,949.4 8% 14% 5% 7% Ex-China
Pharmaceutical 1,076.3 1,020.1 6% (2%) 3% 4% 1,020.1 967.4 5% 12% 5% 8% End Markets YTD Non-Pharma 727.5 693.5 5% (2%) 1% 5% 693.5 636.0 9% 15% 7% 10% Instruments 763.6 737.9 3% (1%) 4% 1% 737.9 651.9 13% 20% 8% 10% Products & Services YTD
Recurring 1,040.3 975.7 7% (2%) 1% 7% 975.7 951.5 3% 9% 5% 8% 1,803.8 1,713.6 5% (2%) 3% 4% 1,713.6 1,603.4 7% 13% 6% 9% Total Sales Ex-China – Q3 YTD Reported % Organic CC % % Growth % Growth % Growth % Growth (in millions USD) 2021 2020 2020
2019 4-YR CAGR 4-YR CAGR Reported CC Reported CC 2023 vs. 2019 2023 vs. 2019 Total Company Pharmaceutical 1,175.2 926.6 27% 24% 926.6 972.9 (5%) (4%) 6% 7% End Markets YTD Non-Pharma 774.2 652.1 19% 16% 652.1 717.4 (9%) (9%) 6% 7% Instruments 873.6
664.8 31% 29% 664.8 778.5 (15%) (14%) 5% 6% Products & Services YTD Recurring 1,075.8 913.9 18% 15% 913.9 911.8 0% 1% 6% 7% Total Company Sales - Q3 YTD 1,949.4 1,578.7 23% 21% 1,578.7 1,690.3 (7%) (6%) 6% 7% Ex-China Pharmaceutical 967.4 787.0
23% 21% 787.0 798.9 (1%) (1%) 8% 8% End Markets YTD Non-Pharma 636.0 539.0 18% 15% 539.0 576.8 (7%) (6%) 6% 7% Instruments 651.9 507.6 28% 26% 507.6 556.2 (9%) (9%) 8% 9% Products & Services YTD Recurring 951.5 818.4 16% 14% 818.4 819.5 (0%) 0%
6% 7% Total Sales Ex-China – Q3 YTD 1,603.4 1,326.0 21% 19% 1,326.0 1,375.8 (4%) (3%) 7% 8% The Company believes that referring to comparable organic constant currency growth rates is a useful way to evaluate the underlying performance of
Waters Corporation's net sales. Organic constant currency growth, a non-GAAP financial measure, measures the change in net sales between current and prior year periods, excluding the impact of foreign currency exchange rates during the current
period and excluding the impact of acquisitions made within twelve months of the acquisition close date. ©2024 Waters Corporation 26
v3.23.4
| X |
- DefinitionBoolean flag that is true when the XBRL content amends previously-filed or accepted submission.
| Name: |
dei_AmendmentFlag |
| Namespace Prefix: |
dei_ |
| Data Type: |
xbrli:booleanItemType |
| Balance Type: |
na |
| Period Type: |
duration |
|
| X |
- DefinitionFor the EDGAR submission types of Form 8-K: the date of the report, the date of the earliest event reported; for the EDGAR submission types of Form N-1A: the filing date; for all other submission types: the end of the reporting or transition period. The format of the date is YYYY-MM-DD.
| Name: |
dei_DocumentPeriodEndDate |
| Namespace Prefix: |
dei_ |
| Data Type: |
xbrli:dateItemType |
| Balance Type: |
na |
| Period Type: |
duration |
|
| X |
- DefinitionThe type of document being provided (such as 10-K, 10-Q, 485BPOS, etc). The document type is limited to the same value as the supporting SEC submission type, or the word 'Other'.
| Name: |
dei_DocumentType |
| Namespace Prefix: |
dei_ |
| Data Type: |
dei:submissionTypeItemType |
| Balance Type: |
na |
| Period Type: |
duration |
|
| X |
- DefinitionAddress Line 1 such as Attn, Building Name, Street Name
| Name: |
dei_EntityAddressAddressLine1 |
| Namespace Prefix: |
dei_ |
| Data Type: |
xbrli:normalizedStringItemType |
| Balance Type: |
na |
| Period Type: |
duration |
|
| X |
- Definition
+ References
+ Details
| Name: |
dei_EntityAddressCityOrTown |
| Namespace Prefix: |
dei_ |
| Data Type: |
xbrli:normalizedStringItemType |
| Balance Type: |
na |
| Period Type: |
duration |
|
| X |
- DefinitionCode for the postal or zip code
| Name: |
dei_EntityAddressPostalZipCode |
| Namespace Prefix: |
dei_ |
| Data Type: |
xbrli:normalizedStringItemType |
| Balance Type: |
na |
| Period Type: |
duration |
|
| X |
- DefinitionName of the state or province.
| Name: |
dei_EntityAddressStateOrProvince |
| Namespace Prefix: |
dei_ |
| Data Type: |
dei:stateOrProvinceItemType |
| Balance Type: |
na |
| Period Type: |
duration |
|
| X |
- DefinitionA unique 10-digit SEC-issued value to identify entities that have filed disclosures with the SEC. It is commonly abbreviated as CIK. Reference 1: http://www.xbrl.org/2003/role/presentationRef
-Publisher SEC
-Name Exchange Act
-Number 240
-Section 12
-Subsection b-2
| Name: |
dei_EntityCentralIndexKey |
| Namespace Prefix: |
dei_ |
| Data Type: |
dei:centralIndexKeyItemType |
| Balance Type: |
na |
| Period Type: |
duration |
|
| X |
- DefinitionIndicate if registrant meets the emerging growth company criteria. Reference 1: http://www.xbrl.org/2003/role/presentationRef
-Publisher SEC
-Name Exchange Act
-Number 240
-Section 12
-Subsection b-2
| Name: |
dei_EntityEmergingGrowthCompany |
| Namespace Prefix: |
dei_ |
| Data Type: |
xbrli:booleanItemType |
| Balance Type: |
na |
| Period Type: |
duration |
|
| X |
- DefinitionCommission file number. The field allows up to 17 characters. The prefix may contain 1-3 digits, the sequence number may contain 1-8 digits, the optional suffix may contain 1-4 characters, and the fields are separated with a hyphen.
| Name: |
dei_EntityFileNumber |
| Namespace Prefix: |
dei_ |
| Data Type: |
dei:fileNumberItemType |
| Balance Type: |
na |
| Period Type: |
duration |
|
| X |
- DefinitionTwo-character EDGAR code representing the state or country of incorporation.
| Name: |
dei_EntityIncorporationStateCountryCode |
| Namespace Prefix: |
dei_ |
| Data Type: |
dei:edgarStateCountryItemType |
| Balance Type: |
na |
| Period Type: |
duration |
|
| X |
- DefinitionThe exact name of the entity filing the report as specified in its charter, which is required by forms filed with the SEC. Reference 1: http://www.xbrl.org/2003/role/presentationRef
-Publisher SEC
-Name Exchange Act
-Number 240
-Section 12
-Subsection b-2
| Name: |
dei_EntityRegistrantName |
| Namespace Prefix: |
dei_ |
| Data Type: |
xbrli:normalizedStringItemType |
| Balance Type: |
na |
| Period Type: |
duration |
|
| X |
- DefinitionThe Tax Identification Number (TIN), also known as an Employer Identification Number (EIN), is a unique 9-digit value assigned by the IRS. Reference 1: http://www.xbrl.org/2003/role/presentationRef
-Publisher SEC
-Name Exchange Act
-Number 240
-Section 12
-Subsection b-2
| Name: |
dei_EntityTaxIdentificationNumber |
| Namespace Prefix: |
dei_ |
| Data Type: |
dei:employerIdItemType |
| Balance Type: |
na |
| Period Type: |
duration |
|
| X |
- DefinitionLocal phone number for entity.
| Name: |
dei_LocalPhoneNumber |
| Namespace Prefix: |
dei_ |
| Data Type: |
xbrli:normalizedStringItemType |
| Balance Type: |
na |
| Period Type: |
duration |
|
| X |
- DefinitionBoolean flag that is true when the Form 8-K filing is intended to satisfy the filing obligation of the registrant as pre-commencement communications pursuant to Rule 13e-4(c) under the Exchange Act. Reference 1: http://www.xbrl.org/2003/role/presentationRef
-Publisher SEC
-Name Exchange Act
-Number 240
-Section 13e
-Subsection 4c
| Name: |
dei_PreCommencementIssuerTenderOffer |
| Namespace Prefix: |
dei_ |
| Data Type: |
xbrli:booleanItemType |
| Balance Type: |
na |
| Period Type: |
duration |
|
| X |
- DefinitionBoolean flag that is true when the Form 8-K filing is intended to satisfy the filing obligation of the registrant as pre-commencement communications pursuant to Rule 14d-2(b) under the Exchange Act. Reference 1: http://www.xbrl.org/2003/role/presentationRef
-Publisher SEC
-Name Exchange Act
-Number 240
-Section 14d
-Subsection 2b
| Name: |
dei_PreCommencementTenderOffer |
| Namespace Prefix: |
dei_ |
| Data Type: |
xbrli:booleanItemType |
| Balance Type: |
na |
| Period Type: |
duration |
|
| X |
- DefinitionTitle of a 12(b) registered security. Reference 1: http://www.xbrl.org/2003/role/presentationRef
-Publisher SEC
-Name Exchange Act
-Number 240
-Section 12
-Subsection b
| Name: |
dei_Security12bTitle |
| Namespace Prefix: |
dei_ |
| Data Type: |
dei:securityTitleItemType |
| Balance Type: |
na |
| Period Type: |
duration |
|
| X |
- DefinitionName of the Exchange on which a security is registered. Reference 1: http://www.xbrl.org/2003/role/presentationRef
-Publisher SEC
-Name Exchange Act
-Number 240
-Section 12
-Subsection d1-1
| Name: |
dei_SecurityExchangeName |
| Namespace Prefix: |
dei_ |
| Data Type: |
dei:edgarExchangeCodeItemType |
| Balance Type: |
na |
| Period Type: |
duration |
|
| X |
- DefinitionBoolean flag that is true when the Form 8-K filing is intended to satisfy the filing obligation of the registrant as soliciting material pursuant to Rule 14a-12 under the Exchange Act. Reference 1: http://www.xbrl.org/2003/role/presentationRef
-Publisher SEC
-Name Exchange Act
-Section 14a
-Number 240
-Subsection 12
| Name: |
dei_SolicitingMaterial |
| Namespace Prefix: |
dei_ |
| Data Type: |
xbrli:booleanItemType |
| Balance Type: |
na |
| Period Type: |
duration |
|
| X |
- DefinitionTrading symbol of an instrument as listed on an exchange.
| Name: |
dei_TradingSymbol |
| Namespace Prefix: |
dei_ |
| Data Type: |
dei:tradingSymbolItemType |
| Balance Type: |
na |
| Period Type: |
duration |
|
| X |
- DefinitionBoolean flag that is true when the Form 8-K filing is intended to satisfy the filing obligation of the registrant as written communications pursuant to Rule 425 under the Securities Act. Reference 1: http://www.xbrl.org/2003/role/presentationRef
-Publisher SEC
-Name Securities Act
-Number 230
-Section 425
| Name: |
dei_WrittenCommunications |
| Namespace Prefix: |
dei_ |
| Data Type: |
xbrli:booleanItemType |
| Balance Type: |
na |
| Period Type: |
duration |
|
Waters (NYSE:WAT)
Historical Stock Chart
From Mar 2024 to Apr 2024

Waters (NYSE:WAT)
Historical Stock Chart
From Apr 2023 to Apr 2024
