MEDICAL PROPERTIES TRUST INC false 0001287865 0001287865 2023-10-26 2023-10-26


UNITED STATES

SECURITIES AND EXCHANGE COMMISSION

WASHINGTON, D.C. 20549


FORM 8-K


CURRENT REPORT

PURSUANT TO SECTION 13 OR 15(d)

OF THE SECURITIES EXCHANGE ACT OF 1934

Date of report (Date of earliest event reported): October 26, 2023


MEDICAL PROPERTIES TRUST, INC.

(Exact Name of Registrant as Specified in Charter)


Commission File Number 001-32559


Maryland   20-0191742

(State or other jurisdiction of

incorporation or organization)


(I.R.S. Employer

Identification No.)


1000 Urban Center Drive, Suite 501

Birmingham, AL

  35242
(Address of principal executive offices)   (Zip Code)

Registrant’s telephone number, including area code

(205) 969-3755


Check the appropriate box below if the Form 8-K filing is intended to simultaneously satisfy the filing obligation of the Registrant under any of the following provisions:


Written communications pursuant to Rule 425 under the Securities Act (17 CFR 230.425)


Soliciting material pursuant to Rule 14a-12 under the Exchange Act (17 CFR 240.14a-12)


Pre-commencement communications pursuant to Rule 14d-2(b) under the Exchange Act (17 CFR 240.14d-2(b))


Pre-commencement communications pursuant to Rule 13e-4(c) under the Exchange Act (17 CFR 240.13e-4(c))

Securities registered pursuant to Section 12(b) of the Act:


Title of each class


Trading
Symbol


Name of each exchange
on which registered

Common Stock, par value $0.001 per share, of Medical Properties Trust, Inc.   MPW   The New York Stock Exchange

Indicate by check mark whether the registrant is an emerging growth company as defined in Rule 405 of the Securities Act of 1933 (§230.405 of this chapter) or Rule 12b-2 of the Securities Exchange Act of 1934 (§240.12b-2 of this chapter).

Emerging growth company 

If an emerging growth company, indicate by check mark if the registrant has elected not to use the extended transition period for complying with any new or revised financial accounting standards provided pursuant to Section 13(a) of the Exchange Act. ☐


Item 2.02.

Results of Operations and Financial Condition.

On October 26, 2023, Medical Properties Trust, Inc. issued a press release announcing its financial results for the three and nine months ended September 30, 2023. A copy of the press release is attached as Exhibit 99.1 to this Current Report on Form 8-K and is incorporated herein by reference. The information in this Current Report on Form 8-K, including the information set forth in Exhibit 99.1 and Exhibit 99.2 attached hereto, shall not be deemed “filed” for purposes of Section 18 of the Securities Exchange Act of 1934, as amended, or otherwise subject to the liability of that section or Sections 11 and 12(a)(2) of the Securities Act of 1933, as amended. In addition, this information shall not be deemed incorporated by reference in any filing of Medical Properties Trust, Inc. with the Securities and Exchange Commission, except as expressly set forth by specific reference in any such filing.


Item 9.01.

Financial Statements and Exhibits.

(d) Exhibits.


Exhibit
Number


Description

99.1    Press release dated October 26, 2023 reporting financial results for the three and nine months ended September 30, 2023
99.2    Medical Properties Trust, Inc. 3rd Quarter 2023 Supplemental Information
104    Cover Page Interactive Data File (embedded within the Inline XBRL document)


2


SIGNATURES

Pursuant to the requirements of the Securities Exchange Act of 1934, as amended, the registrant has duly caused this report to be signed on its behalf by the undersigned hereunder duly authorized.


MEDICAL PROPERTIES TRUST, INC.
By:  

/s/ R. Steven Hamner

Name:   R. Steven Hamner
Title:   Executive Vice President and Chief Financial Officer

Date: October 26, 2023


3

Exhibit 99.1


LOGO


  Contact: Drew Babin, CFA, CMA
  Senior Managing Director of Corporate Communications
  Medical Properties Trust, Inc.
  (646) 884-9809
  dbabin@medicalpropertiestrust.com

MEDICAL PROPERTIES TRUST, INC. CONFIRMS LONG-TERM STRENGTH, STABILITY AND PERFORMANCE OF BUSINESS MODEL IN THIRD QUARTER RESULTS

Per Share Net Income of $0.19 and Normalized FFO of $0.38 in Third Quarter

Expected Liquidity Transactions in the Next Twelve Months to Fund Aggressive Repayment of Debt Maturities

Birmingham, AL – October 26, 2023 – Medical Properties Trust, Inc. (the “Company” or “MPT”) (NYSE: MPW) today announced financial and operating results for the third quarter ended September 30, 2023, as well as certain events occurring subsequent to quarter end.


Net income of $0.19 and Normalized Funds from Operations (“NFFO”) of $0.38 for the 2023 third quarter on a per diluted share basis and including approximately $0.02 per share from MPT’s receipt of non-cash and non-recurring investment consideration in PHP Holdings (“PHP”) in lieu of third quarter cash rent and interest contractually owed by Prospect Medical Holdings (“Prospect”);


As anticipated, collected cash rent payments in each of September and October from Prospect;


Commenced in July rent collections at a newly developed post-acute facility operated by Ernest in South Carolina at a total cost of approximately $22 million; and


Agreed in principle to sell seven facilities back to a tenant comprising approximately 1% of MPT’s total assets in the first half of 2024, substantively ending the relationship and making MPT whole for its investment and deferred amounts. Due to accounting requirements, net income includes related write-offs detailed in Operating Results and Outlook.

Previously announced activities:


Sold in July three hospitals to Prime Healthcare for approximately $100 million;


Purchased in the open market through October approximately £50 million in 2.55% Notes Due 2023;


Sold in October four remaining facilities in Australia for cash proceeds of roughly AUD$470 million, representing a 5.7% cash capitalization rate and funding a reduction in the balance of the revolving credit facility and an increase in cash availability; and


Declared per share third quarter dividend of $0.15, representing a 50% payout of third quarter per share adjusted funds from operations (“AFFO”), in alignment with updated capital allocation strategy to increase liquidity and enhance long-term value creation.


1


“Our business model remains strong and stable,” said Edward K. Aldag, Jr., Chairman, President and Chief Executive Officer. “Looking forward, we have launched a capital allocation strategy to increase liquidity, effectively address our debt maturities and solidify through a right-sized cash dividend our business for sustained long-term shareholder creation and growth when our cost of capital inevitably begins to normalize.”

Included in the financial tables accompanying this press release is information about the Company’s assets and liabilities, net income, and reconciliations of net income to NFFO and AFFO, including per share amounts, all on a basis comparable to 2022 results.

PORTFOLIO UPDATE

Medical Properties Trust has total assets of approximately $19.0 billion, including $12.3 billion of general acute facilities, $2.5 billion of behavioral health facilities and $1.7 billion of post-acute facilities. As of September 30, 2023, MPT’s portfolio included 441 properties and approximately 44,000 licensed beds. Since the end of the third quarter, MPT has sold four properties and now owns approximately 43,000 licensed beds leased to or mortgaged by 54 hospital operating companies across the United States as well as in the United Kingdom, Switzerland, Germany, Spain, Finland, Colombia, Italy and Portugal.

Europe ($6.1 billion total assets)

During the third quarter, Centene Corporation agreed to sell Circle Health (“Circle”) ($2 billion) to PureHealth at a value of roughly $1.2 billion. While the change in sponsorship is not expected to impact Circle’s strategy or operations, the transaction is evidence that the business of running private hospitals in the United Kingdom is attractive to a broad, global investor base. This business cannot perform without Circle’s 36 facilities leased from MPT across the UK, at which rent coverage is strong and consistent.

Across the remainder of MPT’s European portfolio, operators are benefitting from growing reimbursement revenue and continued normalization of labor costs. Priory ($1.3 billion) maintained EBITDARM coverage of approximately 2.0x and MEDIAN continues to consistently report EBITDARM coverage in the 1.5-2.0x range for the twelve months ended June 30, 2023. The Infracore joint venture, through which MPT owns a 70% stake in nearly $1.5 billion of gross real estate assets leased to Swiss Medical Network (“SMN”), has reliably paid cash distributions since the investment was made in 2019. SMN reported a year-to-date EBITDAR margin of 19% through the end of June and also added a new investor in a transaction that favorably impacted the fair market value of the platform, resulting in an approximate CHF 20 million third quarter gain on MPT’s equity stake.

Steward Health Care System (“Steward”) ($3.8 billion)

Steward reported facility level GAAP EBITDARM coverage of 2.7x for the twelve months ended June 30, 2023. Although demands on cash from operations have been impacted by challenges related to revenue cycle management and an accounts payable backlog, MPT believes that Steward will be able to satisfy its rental obligations over the full term of the leases given the local profitability Steward generates at MPT’s facilities, the cross-defaulted nature of the master leases, and the additional security of its overall Steward collateral package. For more detailed information about MPT’s investments with Steward, please refer to MPT’s investor relations website under Webcasts and Presentations.

Prospect ($1.1 billion)

As expected, Prospect resumed payments of the approximately $3 million of contractual rent which will be due monthly through February of 2024. Under the lease agreement, Prospect will begin making full rent payments on its approximately $513 million California portfolio at a mid-8% cash rate in March of 2024.


2


In May 2023, MPT disclosed that it agreed to provide Prospect a $75 million delayed draw term loan facility in connection with its recapitalization transactions. Funding under this facility increased to $45 million during the third quarter and to $65 million following quarter-end. The delayed draw term loan facility earns cash interest, which was fully paid to MPT in early October, and is secured by government and commercial insurance accounts receivable.

CAPITAL ALLOCATION STRATEGY UPDATE

Having utilized proceeds from its exit from Australia to reduce the balance of its revolving credit facility and to increase cash availability, MPT is flexible to manage near-term maturities with existing liquidity and projected retained cash flow. However, in the interest of expediting the repayment of these maturities, significantly reducing its revolving credit facility balance and repaying additional maturities, the Company is evaluating divestiture and joint venture opportunities for which indications of marketability are encouraging. MPT is also exploring limited secured debt financing options which similarly would provide immediate liquidity based on asset value. In the aggregate, MPT expects to raise approximately $2 billion in new liquidity over the next twelve months.

OPERATING RESULTS AND OUTLOOK

Net income for the third quarter ended September 30, 2023 was $117 million ($0.19 per diluted share) compared to net income of $222 million ($0.37 per diluted share) in the year earlier period. Included in third quarter net income is the recognition of $13 million of third quarter 2023 contractually owed rent and interest revenue from the receipt of an investment in PHP and, separately, an approximate $30 million fair market value adjustment due to updated assumptions related to the value of MPT’s investment received in the second quarter of 2023. In addition, net income includes the write-off of deferred rent receivable of approximately $17 million and straight-line rent of roughly $32 million resulting from the planned substantive exit of MPT’s relationship with a tenant currently comprising approximately 1% of total assets. Although the agreement with the tenant is expected to result in full collection of the deferred rent during the first half of 2024, accounting rules require that both the straight-line rent and deferred rent be written off currently.

NFFO for the third quarter ended September 30, 2023 was $226 million ($0.38 per diluted share) compared to $272 million ($0.45 per diluted share) in the year earlier period. Included in 2023 third quarter NFFO is roughly $13 million ($0.02 per diluted share) from the receipt of an investment in PHP in lieu of cash for third quarter contractually owed rent and interest revenue from Prospect. This recognition completes MPT’s accounting for the receipt of its investment in PHP. The combined amount of approximately $82 million recorded in the second and third quarters is not intended to represent cash currently and is not expected to recur.

The Company is narrowing its 2023 calendar estimate of per share net income to $0.36 to $0.38 to account for third quarter results and is also narrowing its estimate of per share NFFO to $1.56 to $1.58. The ranges include the recognition of PHP investment value received in the second and third quarters. The estimates are based on an existing portfolio which includes the impact of binding disposition and leasing transactions and excludes expected future contributions from development and other capital projects.

These estimates do not include the effects, among others, of unexpected real estate operating costs, modifications to lease terms, changes in accounting pronouncements, litigation costs, debt refinancing costs, acquisition costs, currency exchange rate movements, changes in income tax rates, interest rate hedging activities, write-offs of straight-line rent and in place lease intangibles, other impairments or other non-recurring/unplanned transactions. These estimates may change if the Company acquires or sells assets in amounts that are different from estimates, market interest rates change, debt is refinanced or repurchased, new shares are issued or repurchased, additional debt is incurred, other operating expenses vary, income from equity investments vary from expectations, or existing leases or loans do not perform in accordance with their terms.


3


CONFERENCE CALL AND WEBCAST

The Company has scheduled a conference call and webcast for October 26, 2023 at 11:00 a.m. Eastern Time to present the Company’s financial and operating results for the quarter ended September 30, 2023. The dial-in numbers for the conference call are 844-481-2836 (U.S.) and 412-317-1856 (International); there is no passcode requirement. Call participants are to ask the operator to be joined to the Medical Properties Trust, Inc. conference call upon dialing in. The conference call will also be available via webcast in the Investor Relations section of the Company’s website, www.medicalpropertiestrust.com.

A telephone and webcast replay of the call will be available beginning shortly after the call’s completion. The telephone replay will be available through November 9, 2023, using dial-in numbers 877-344-7529 (U.S.), 855-669-9658 (Canada) and 412-317-0088 (International) along with passcode 1930844. The webcast replay will be available for one year following the call’s completion on the Investor Relations section of the Company’s website.

The Company’s supplemental information package for the current period will also be available on the Company’s website in the Investor Relations section.

The Company uses, and intends to continue to use, the Investor Relations page of its website, which can be found at www.medicalpropertiestrust.com, as a means of disclosing material nonpublic information and of complying with its disclosure obligations under Regulation FD, including, without limitation, through the posting of investor presentations that may include material nonpublic information. Accordingly, investors should monitor the Investor Relations page, in addition to following our press releases, SEC filings, public conference calls, presentations and webcasts. The information contained on, or that may be accessed through, our website is not incorporated by reference into, and is not a part of, this document.

About Medical Properties Trust, Inc.

Medical Properties Trust, Inc. is a self-advised real estate investment trust formed in 2003 to acquire and develop net-leased hospital facilities. From its inception in Birmingham, Alabama, the Company has grown to become one of the world’s largest owners of hospital real estate with 441 facilities and approximately 44,000 licensed beds as of September 30, 2023. Since the end of the third quarter, the Company has sold four facilities and now owns approximately 43,000 licensed beds in nine countries across three continents. MPT’s financing model facilitates acquisitions and recapitalizations and allows operators of hospitals to unlock the value of their real estate assets to fund facility improvements, technology upgrades and other investments in operations. For more information, please visit the Company’s website at www.medicalpropertiestrust.com.

This press release includes forward-looking statements within the meaning of Section 27A of the Securities Act of 1933, as amended, and Section 21E of the Securities Exchange Act of 1934, as amended. Forward-looking statements can generally be identified by the use of forward-looking words such as “may”, “will”, “would”, “could”, “expect”, “intend”, “plan”, “estimate”, “target”, “anticipate”, “believe”, “objectives”, “outlook”, “guidance” or other similar words, and include statements regarding our strategies, objectives, future expansion and development activities, asset sales, expected returns on investments and expected financial performance. Forward-looking statements involve known and unknown risks and uncertainties that may cause our actual results or future events to differ materially from those expressed in or underlying such forward-


4


looking statements, including, but not limited to: (i) the economic, political and social impact of, and uncertainty relating to, potential impact from health crises (like COVID-19); (ii) the ability of our tenants, operators and borrowers to satisfy their obligations under their respective contractual arrangements with us, especially as a result of the adverse economic impact of the COVID-19 pandemic, and government regulation of hospitals and healthcare providers in connection with same (as further detailed in our Current Report on Form 8-K filed with the SEC on April 8, 2020); (iii) our expectations regarding annual guidance for net income and NFFO per share; (iv) our success in implementing our business strategy and our ability to identify, underwrite, finance, consummate and integrate acquisitions and investments; (v) the nature and extent of our current and future competition; (vi) macroeconomic conditions, such as a disruption of or lack of access to the capital markets or movements in currency exchange rates; (vii) our ability to obtain debt financing on attractive terms or at all, which may adversely impact our ability to pursue acquisition and development opportunities and pay down, refinance, restructure or extend our indebtedness as it becomes due; (viii) increases in our borrowing costs as a result of changes in interest rates and other factors; (ix) international, national and local economic, real estate and other market conditions, which may negatively impact, among other things, the financial condition of our tenants, lenders and institutions that hold our cash balances, and may expose us to increased risks of default by these parties; (x) factors affecting the real estate industry generally or the healthcare real estate industry in particular; (xi) our ability to maintain our status as a REIT for income tax purposes; (xii) federal and state healthcare and other regulatory requirements, as well as those in the foreign jurisdictions where we own properties; (xiii) the value of our real estate assets, which may limit our ability to dispose of assets at attractive prices or obtain or maintain equity or debt financing secured by our properties or on an unsecured basis; (xiv) the ability of our tenants and operators to operate profitably and generate positive cash flow, comply with applicable laws, rules and regulations in the operation of our properties, to deliver high-quality services, to attract and retain qualified personnel and to attract patients; (xv) potential environmental contingencies and other liabilities; (xvi) the risk that the expected sale of three Connecticut hospitals currently leased to Prospect does not occur; (xvii) the risk that MPT is unable to monetize its investment in PHP at full value within a reasonable time period or at all; (xiii) the risk that other property sales, loan repayments, and other capital recycling transactions do not occur; (xix) the risk that MPT is not able to attain its leverage, liquidity and cost of capital objectives within a reasonable time period or at all; and (xx) the risks and uncertainties of litigation.

The risks described above are not exhaustive and additional factors could adversely affect our business and financial performance, including the risk factors discussed under the section captioned “Risk Factors” in our Annual Report on Form 10-K for the year ended December 31, 2022 and as updated in our quarterly reports on Form 10-Q. Forward-looking statements are inherently uncertain and actual performance or outcomes may vary materially from any forward-looking statements and the assumptions on which those statements are based. Readers are cautioned to not place undue reliance on forward-looking statements as predictions of future events. We disclaim any responsibility to update such forward-looking statements, which speak only as of the date on which they were made.

# # #


5


MEDICAL PROPERTIES TRUST, INC. AND SUBSIDIARIES

Consolidated Balance Sheets


(Amounts in thousands, except for per share data)             
     September 30, 2023     December 31, 2022  
Assets    (Unaudited)     (A)  

Real estate assets


Land, buildings and improvements, intangible lease assets, and other

   $ 13,042,260     $ 13,862,415  

Investment in financing leases

     1,233,336       1,691,323  

Real estate held for sale

     290,321       —   

Mortgage loans

     302,476       364,101  


Gross investment in real estate assets

     14,868,393       15,917,839  

Accumulated depreciation and amortization

     (1,315,223     (1,193,312


Net investment in real estate assets

     13,553,170       14,724,527  

Cash and cash equivalents

     340,058       235,668  

Interest and rent receivables, net

     195,559       167,035  

Straight-line rent receivables

     788,761       787,166  

Investments in unconsolidated real estate joint ventures

     1,461,725       1,497,903  

Investments in unconsolidated operating entities

     1,843,847       1,444,872  

Other loans

     263,471       227,839  

Other assets

     558,291       572,990  


Total Assets

   $ 19,004,882     $ 19,658,000  


Liabilities and Equity


Liabilities


Debt, net

   $ 10,157,079     $ 10,268,412  

Accounts payable and accrued expenses

     375,888       621,324  

Deferred revenue

     32,280       27,727  

Obligations to tenants and other lease liabilities

     154,218       146,130  


Total Liabilities

     10,719,465       11,063,593  

Equity


Preferred stock, $0.001 par value. Authorized 10,000 shares; no shares outstanding

     —        —   

Common stock, $0.001 par value. Authorized 750,000 shares; issued and outstanding - 598,444 shares at September 30, 2023 and 597,476 shares at December 31, 2022

     598       597  

Additional paid-in capital

     8,558,768       8,535,140  

Retained (deficit) earnings

     (215,058     116,285  

Accumulated other comprehensive loss

     (59,778     (59,184


Total Medical Properties Trust, Inc. Stockholders’ Equity

     8,284,530       8,592,838  

Non-controlling interests

     887       1,569  


Total Equity

     8,285,417       8,594,407  


Total Liabilities and Equity

   $ 19,004,882     $ 19,658,000  


(A)

Financials have been derived from the prior year audited financial statements.


MEDICAL PROPERTIES TRUST, INC. AND SUBSIDIARIES

Consolidated Statements of Income

(Unaudited)


(Amounts in thousands, except for per share data)    For the Three Months Ended     For the Nine Months Ended  
     September 30, 2023     September 30, 2022     September 30, 2023     September 30, 2022  

Revenues


Rent billed

   $ 229,306     $ 232,418     $ 724,954     $ 737,029  

Straight-line rent

     21,511       26,552       38,875       146,114  

Income from financing leases

     26,066       51,011       107,729       154,660  

Interest and other income

     29,693       42,358       122,624       124,562  


Total revenues

     306,576       352,339       994,182       1,162,365  

Expenses


Interest

     106,709       88,076       308,833       266,989  

Real estate depreciation and amortization

     77,802       81,873       526,065       251,523  

Property-related (A)

     6,483       8,265       38,269       37,998  

General and administrative

     38,110       37,319       115,438       117,601  


Total expenses

     229,104       215,533       988,605       674,111  

Other income (expense)


(Loss) gain on sale of real estate

     (20     68,795       209       536,788  

Real estate and other impairment (charges) recovery

     (3,750     19,450       (93,288     14,575  

Earnings from equity interests

     11,264       11,483       34,840       33,606  

Debt refinancing and unutilized financing benefit (costs)

     862       (17     46       (9,452

Other (including fair value adjustments on securities)

     41,125       4,082       25,447       20,875  


Total other income (expense)

     49,481       103,793       (32,746     596,392  


Income (loss) before income tax

     126,953       240,599       (27,169     1,084,646  

Income tax (expense) benefit

     (10,058     (18,579     134,661       (40,615


Net income

     116,895       222,020       107,492       1,044,031  

Net income attributable to non-controlling interests

     (185     (227     (25     (960


Net income attributable to MPT common stockholders

   $ 116,710     $ 221,793     $ 107,467     $ 1,043,071  


Earnings per common share - basic and diluted:


Net income attributable to MPT common stockholders

   $ 0.19     $ 0.37     $ 0.18     $ 1.74  


Weighted average shares outstanding - basic

     598,444       598,980       598,363       598,828  

Weighted average shares outstanding - diluted

     598,553       599,339       598,406       599,099  

Dividends declared per common share

   $ 0.15     $ 0.29     $ 0.73     $ 0.87  


(A)

Includes $3.3 million and $5.6 million of ground lease and other expenses (such as property taxes and insurance) paid directly by us and reimbursed by our tenants for the three months ended September 30, 2023 and 2022, respectively, and $28.6 million and $30.2 million for the nine months ended September 30, 2023 and 2022, respectively.


MEDICAL PROPERTIES TRUST, INC. AND SUBSIDIARIES

Reconciliation of Net Income to Funds From Operations

(Unaudited)


(Amounts in thousands, except for per share data)    For the Three Months Ended     For the Nine Months Ended  
     September 30,
2023
    September 30,
2022
    September 30,
2023
    September 30,
2022
 

FFO information:


Net income attributable to MPT common stockholders

   $ 116,710     $ 221,793     $ 107,467     $ 1,043,071  

Participating securities’ share in earnings

     (311     (288     (1,295     (1,035


Net income, less participating securities’ share in earnings

   $ 116,399     $ 221,505     $ 106,172     $ 1,042,036  

Depreciation and amortization

     96,280       99,296       580,484       300,731  

Loss (gain) on sale of real estate

     20       (68,795     (209     (536,788

Real estate impairment charges

     3,750       —        55,854       —   


Funds from operations

   $ 216,449     $ 252,006     $ 742,301     $ 805,979  

Write-off of unbilled rent and other

     52,742       35,587       150,576       35,259  

Other impairment (recovery) charges

     —        (19,450     37,434       (14,575

Litigation and other

     2,759       —        12,987       —   

Share-based compensation adjustments

     1,243       —        (3,120     (966

Non-cash fair value adjustments

     (46,815     (3,597     (42,562     (12,563

Tax rate changes and other

     —        7,726       (164,535     6,901  

Debt refinancing and unutilized financing (benefit) costs

     (862     17       (46     9,452  


Normalized funds from operations

   $ 225,516     $ 272,289     $ 733,035     $ 829,487  

Share-based compensation

     10,210       11,089       32,839       33,968  

Debt costs amortization

     5,016       4,543       15,340       14,716  

Rent deferral, net

     2,351       549       7,144       (6,494

Straight-line rent revenue from operating and finance leases

     (61,003     (73,061     (184,417     (225,151


Adjusted funds from operations

   $ 182,090     $ 215,409     $ 603,941     $ 646,526  


Per diluted share data:


Net income, less participating securities’ share in earnings

   $ 0.19     $ 0.37     $ 0.18     $ 1.74  

Depreciation and amortization

     0.16       0.16       0.97       0.50  

Loss (gain) on sale of real estate

     —        (0.11     —        (0.90

Real estate impairment charges

     0.01       —        0.09       —   


Funds from operations

   $ 0.36     $ 0.42     $ 1.24     $ 1.34  

Write-off of unbilled rent and other

     0.09       0.06       0.25       0.06  

Other impairment (recovery) charges

     —        (0.03     0.06       (0.03

Litigation and other

     0.01       —        0.02       —   

Share-based compensation adjustments

     —        —        (0.01     —   

Non-cash fair value adjustments

     (0.08     (0.01     (0.07     (0.02

Tax rate changes and other

     —        0.01       (0.27     0.01  

Debt refinancing and unutilized financing (benefit) costs

     —        —        —        0.02  


Normalized funds from operations

   $ 0.38     $ 0.45     $ 1.22     $ 1.38  

Share-based compensation

     0.02       0.02       0.06       0.06  

Debt costs amortization

     0.01       0.01       0.03       0.02  

Rent deferral, net

     —        —        0.01       (0.01

Straight-line rent revenue from operating and finance leases

     (0.11     (0.12     (0.31     (0.37


Adjusted funds from operations

   $ 0.30     $ 0.36     $ 1.01     $ 1.08  


Notes:

(A) Certain line items above (such as depreciation and amortization) include our share of such income/expense from unconsolidated joint ventures. These amounts are included with all activity of our equity interests in the “Earnings from equity interests” line on the consolidated statements of income.

(B) Investors and analysts following the real estate industry utilize funds from operations (“FFO”) as a supplemental performance measure. FFO, reflecting the assumption that real estate asset values rise or fall with market conditions, principally adjusts for the effects of GAAP depreciation and amortization of real estate assets, which assumes that the value of real estate diminishes predictably over time. We compute FFO in accordance with the definition provided by the National Association of Real Estate Investment Trusts, or Nareit, which represents net income (loss) (computed in accordance with GAAP), excluding gains (losses) on sales of real estate and impairment charges on real estate assets, plus real estate depreciation and amortization, including amortization related to in-place lease intangibles, and after adjustments for unconsolidated partnerships and joint ventures.

In addition to presenting FFO in accordance with the Nareit definition, we disclose normalized FFO, which adjusts FFO for items that relate to unanticipated or non-core events or activities or accounting changes that, if not noted, would make comparison to prior period results and market expectations less meaningful to investors and analysts. We believe that the use of FFO, combined with the required GAAP presentations, improves the understanding of our operating results among investors and the use of normalized FFO makes comparisons of our operating results with prior periods and other companies more meaningful. While FFO and normalized FFO are relevant and widely used supplemental measures of operating and financial performance of REITs, they should not be viewed as a substitute measure of our operating performance since the measures do not reflect either depreciation and amortization costs or the level of capital expenditures and leasing costs (if any not paid by our tenants) to maintain the operating performance of our properties, which can be significant economic costs that could materially impact our results of operations. FFO and normalized FFO should not be considered an alternative to net income (loss) (computed in accordance with GAAP) as indicators of our results of operations or to cash flow from operating activities (computed in accordance with GAAP) as an indicator of our liquidity.

We calculate adjusted funds from operations, or AFFO, by subtracting from or adding to normalized FFO (i) straight-line rent, (ii) non-cash share-based compensation expense, and (iii) amortization of deferred financing costs. AFFO is an operating measurement that we use to analyze our results of operations based more on the receipt, rather than the accrual, of our rental revenue and on certain other adjustments. We believe that this is an important measurement because our infrastructure-type assets generally require longer term leases with annual contractual escalations of base rents, resulting in the recognition of a significant amount of rental income that is not billable/collected until future periods. Our calculation of AFFO may not be comparable to AFFO or similarly titled measures reported by other REITs. AFFO should not be considered as an alternative to net income (calculated pursuant to GAAP) as an indicator of our results of operations or to cash flow from operating activities (calculated pursuant to GAAP) as an indicator of our liquidity.


MEDICAL PROPERTIES TRUST, INC. AND SUBSIDIARIES

2023 Guidance Reconciliation

(Unaudited)


     2023 Guidance -Per Share(1)  
     Low     High  

Net income attributable to MPT common stockholders

   $ 0.36     $ 0.38  

Participating securities’ share in earnings

     —        —   


Net income, less participating securities’ share in earnings

   $ 0.36     $ 0.38  

Depreciation and amortization

     1.13       1.13  

Real estate impairment charges

     0.09       0.09  


Funds from operations

   $ 1.58     $ 1.60  

Other adjustments

     (0.02     (0.02


Normalized funds from operations

   $ 1.56     $ 1.58  


(1)

The guidance is based on current expectations and actual results or future events may differ materially from those expressed in this table, which is a forward-looking statement within the meaning of the federal securities laws. Please refer to the forward-looking statement included in this press release and our filings with the Securities and Exchange Commission for a discussion of risk factors that affect our performance.

Exhibit 99.2


LOGO

Medical Properties Trust QUARTERLY SUPPLEMENTAL THIRD QUARTER 2023


LOGO

THIRD QUARTER 2023 COMPANY OVERVIEW Company Information 3 FINANCIAL INFORMATION Reconciliation of Net Income to Funds from Operations 6 Debt Summary 7 Debt Maturities and Debt Metrics 8 PORTFOLIO INFORMATION Lease and Loan Maturity Schedule 9 Total Assets and Revenues by Asset Type, Operator, State and Country 10 Rent Coverage 13 Summary of Investments and Development Projects 15 FINANCIAL STATEMENTS Consolidated Statements of Income 16On the cover: Diginity Consolidated Balance Sheets 17 Investments in Unconsolidated Real Estate Joint Ventures 18 Investments in Unconsolidated Operating Entities 19 Appendix—Non-GAAP Reconciliations 20 FORWARD-LOOKING STATEMENTS Forward-looking statements involve known and unknown risks, uncertainties and other factors that may cause the actual results of the Company or future events to differ materially from those expressed in or underlying such forward-looking statements, including without limitation: Normalized FFO per share; expected payout ratio; the expected sale of three Connecticut hospitals currently leased to Prospect Medical Holdings; the amount and timing of acquisitions or dispositions of healthcare real estate or other investments, if any; Net Debt to EBITDAre; portfolio diversification; capital markets conditions; the repayment of debt arrangements; statements concerning the additional income to the Company as a result of ownership interests in certain hospital operations and the timing of such income; the payment of future dividends, if any; completion of additional debt arrangements and additional investments; national and international economic, business, regulatory, real estate and other market condi- tions; the competitive environment in which the Company operates; the execution of the Company’s business plan; financing risks; the Company’s ability to maintain its status as a REIT; acquisition and development risks; potential environmental and other liabilities; potential impact from health crises; the risks and uncertainties of litigation; other events beyond the control of our tenants/borrowers and the related impact to us; and other factors affecting the real estate industry generally or healthcare real estate in partic- ular. For further discussion of the factors that could affect outcomes, please refer to the “Risk Factors” section of the Company’s Annual Report on Form 10-K for the year ended December 31, 2022, and as updated by the Company’s sub- sequently filed Quarterly Reports on Form 10-Q and other SEC filings. Except as otherwise required by the federal securities laws, the Company undertakes no obligation to update the information in this report. On the cover: Diginity Health—Mesa, Arizona. Below: Dignity Health—Chandler, Arizona.


LOGO

COMPANY OVERVIEW Medical Properties Trust, Inc. is a self-advised real estate investment trust formed in 2003 to acquire and develop net-leased hospital facilities. From its inception in Birmingham, Alabama, the Company has grown to become one of the world’s largest owners of hospital real estate. MPT’s financing model facilitates acquisitions and recapitalizations and allows operators of hospitals to unlock the value of their real estate assets to fund facility improvements, technology upgrades and other investments in operations. As of September 30, 2023. 441 properties 55 operators ~44,000 beds 31 U.S. states 10 countries Note: Figures above are as of September 30, 2023 and do not include the sale of four remaining Australian properties. MEDICAL PROPERTIES TRUST | SUPPLEMENTAL INFORMATION | Q3 2023 3


LOGO

MPT Officers Edward K. Aldag, Jr. Chairman, President and Chief Executive Officer R. Steven Hamner Executive Vice President and Chief Financial Officer J. Kevin Hanna Senior Vice President, Controller and Chief Accounting Officer Rosa H. Hooper Senior Vice President of Operations & Secretary Larry H. Portal Senior Vice President, Senior Advisor to the CEO Charles R. Lambert Vice President, Treasurer and Managing Director of Capital Markets R. Lucas Savage Vice President, Head of Global Acquisitions Board of Directors Corporate Headquarters Edward K. Aldag, Jr. G. Steven Dawson R. Steven Hamner Caterina A. Mozingo Emily W. Murphy Elizabeth N. Pitman D. Paul Sparks, Jr. Michael G. Stewart C. Reynolds Thompson, III Medical Properties Trust, Inc. 1000 Urban Center Drive, Suite 501 Birmingham, AL 35242 (205) 969-3755 (205) 969-3756 (fax) www.medicalpropertiestrust.com MEDICAL PROPERTIES TRUST | SUPPLEMENTAL INFORMATION | Q3 2023 4


LOGO

INVESTOR RELATIONS Drew Babin Tim Berryman Senior Managing Director of Corporate Communications (646) 884-9809 dbabin@medicalpropertiestrust.com Managing Director of Investor Relations (205) 397-8589 tberryman@medicalpropertiestrust.com Transfer Agent Stock Exchange Listing and Trading Symbol Senior Unsecured Debt Ratings Equiniti Trust Company, LLC 6201 15th Avenue Brooklyn, NY 11219 https://equiniti.com/us New York Stock Exchange (NYSE): MPW Moody’s: Ba1 Standard & Poor’s: BB+ Sulis Hospital —U.K., operated by NHS. MEDICAL PROPERTIES TRUST | SUPPLEMENTAL INFORMATION | Q3 2023 5


LOGO

RECONCILIATION OF NET INCOME TO FUNDS FROM OPERATIONS (Unaudited) (Amounts in thousands, except per share data) FFO INFORMATION: Net income attributable to MPT common stockholders Participating securities’ share in earnings Net income, less participating securities’ share in earnings For the Three Months Ended For the Nine Months Ended September 30, 2023 September 30, 2022 September 30, 2023 September 30, 2022 Depreciation and amortization 96,280 99,296 580,484 300,731 Loss (gain) on sale of real estate 20(68,795)(209)(536,788) Real estate impairment charges 3,750 — 55,854—Funds from operations $ 216,449 $ 252,006 $ 742,301 $ 805,979 Write-off of unbilled rent and other 52,742 35,587 150,576 35,259 Other impairment (recovery) charges -(19,450) 37,434(14,575) Litigation and other 2,759—12,987—Share-based compensation adjustments 1,243 -(3,120)(966) Non-cash fair value adjustments(46,815)(3,597)(42,562)(12,563) Tax rate changes and other—7,726(164,535) 6,901 Debt refinancing and unutilized financing (benefit) costs(862) 17 (46) 9,452 Normalized funds from operations $ 225,516 $ 272,289 $ 733,035 $ 829,487 Share-based compensation Debt costs amortization Rent deferral, net Straight-line rent revenue from operating and finance leases Adjusted funds from operations PER DILUTED SHARE DATA: Net income, less participating securities’ share in earnings $ 0.19 $ 0.37 $ 0.18 $ 1.74 Depreciation and amortization 0.16 0.16 0.97 0.50 Loss (gain) on sale of real estate -(0.11) -(0.90) Real estate impairment charges 0.01 — 0.09— Funds from operations $ 0.36 $ 0.42 $ 1.24 $ 1.34 Write-off of unbilled rent and other Other impairment (recovery) charges Litigation and other Share-based compensation adjustments Non-cash fair value adjustments Tax rate changes and other Debt refinancing and unutilized financing (benefit) costs Normalized funds from operations Share-based compensation Debt costs amortization Rent deferral, net Straight-line rent revenue from operating and finance leases Adjusted funds from operations Notes: (A) Certain line items above (such as depreciation and amortization) include our share of such income/expense from unconsolidated joint ventures. These amounts are included with all activity of our equity interests in the “Earnings from equity interests” line on the consolidated statements of income. (B) Investors and analysts following the real estate industry utilize funds from operations (“FFO”) as a supplemental performance measure. FFO, reflecting the assumption that real estate asset values rise or fall with market conditions, principally adjusts for the effects of GAAP depreciation and amortization of real estate assets, which assumes that the value of real estate diminishes predictably over time. We compute FFO in accordance with the definition provided by the National Association of Real Estate Investment Trusts, or Nareit, which represents net income (loss) (computed in accordance with GAAP), excluding gains (losses) on sales of real estate and impairment charges on real estate assets, plus real estate depreciation and amortization, including amortization related to in-place lease intangibles, and after adjustments for unconsolidated partnerships and joint ventures. In addition to presenting FFO in accordance with the Nareit definition, we disclose normalized FFO, which adjusts FFO for items that relate to unanticipated or non-core events or activities or accounting changes that, if not noted, would make comparison to prior period results and market expectations less meaningful to investors and analysts. We believe that the use of FFO, combined with the required GAAP presentations, improves the understanding of our operating results among investors and the use of normalized FFO makes comparisons of our operating results with prior periods and other companies more meaningful. While FFO and normalized FFO are relevant and widely used supplemental measures of operating and financial performance of REITs, they should not be viewed as a substitute measure of our operating performance since the measures do not reflect either depreciation and amortization costs or the level of capital expenditures and leasing costs (if any not paid by our tenants) to maintain the operating performance of our properties, which can be significant economic costs that could materially impact our results of operations. FFO and normalized FFO should not be considered an alternative to net income (loss) (computed in accordance with GAAP) as indicators of our results of operations or to cash flow from operating activities (computed in accordance with GAAP) as an indicator of our liquidity. We calculate adjusted funds from operations, or AFFO, by subtracting from or adding to normalized FFO (i) straight-line rent, (ii) non-cash share-based compensation expense, and (iii) amortization of deferred financing costs. AFFO is an operating measurement that we use to analyze our results of operations based more on the receipt, rather than the accrual, of our rental revenue and on certain other adjustments. We believe that this is an important measurement because our infrastructure-type assets generally require longer term leases with annual contractual escalations of base rents, resulting in the recognition of a significant amount of rental income that is not billable/collected until future periods. Our calculation of AFFO may not be comparable to AFFO or similarly titled measures reported by other REITs. AFFO should not be considered as an alternative to net income (calculated pursuant to GAAP) as an indicator of our results of operations or to cash flow from operating activities (calculated pursuant to GAAP) as an indicator of our liquidity. MEDICAL PROPERTIES TRUST | SUPPLEMENTAL INFORMATION | Q3 2023 6


LOGO

FINANCIAL INFORMATION (As (As of September 30, 2023) ($ amounts in thousands) DEBT SUMMARY Debt Instrument Rate Type Rate Balance 2026 Credit Facility Revolver(A) Variable 5.358%—6.934% $ 1,354,294 2027 Term Loan Variable 7.116% 200,000 2.550% Notes Due 2023 (£360M)(A) Fixed 2.550% 439,399 2024 AUD Term Loan (A$470M)(A) Fixed(B) 2.850% 302,445 2024 GBP Term Loan (£105M)(A) Fixed 5.250% 127,907 3.325% Notes Due 2025 (€500M)(A) Fixed 3.325% 528,650 2025 GBP Term Loan (£700M)(A) Fixed(C) 2.349% 853,930 0.993% Notes Due 2026 (€500M)(A) Fixed 0.993% 528,650 5.250% Notes Due 2026 Fixed 5.250% 500,000 2.500% Notes Due 2026 (£500M)(A) Fixed 2.500% 609,950 5.000% Notes Due 2027 Fixed 5.000% 1,400,000 3.692% Notes Due 2028 (£600M)(A) Fixed 3.692% 731,940 4.625% Notes Due 2029 Fixed 4.625% 900,000 3.375% Notes Due 2030 (£350M)(A) Fixed 3.375% 426,965 3.500% Notes Due 2031 Fixed 3.500% 1,300,000 $ 10,204,130 Debt issuance costs and discount(47,051) Weighted average rate 4.041% $ 10,157,079 RATE TYPE AS PERCENTAGE OF TOTAL DEBT Variable 15% Fixed 85% (A) Non-USD denominated debt converted to U.S. dollars at September 30, 2023. (B) We entered into an interest rate swap transaction, effective July 3, 2019, to fix the benchmark variable interest rate of the loan. On March 10, 2023, the rate increased to 2.850%. (C) We entered into an interest rate swap transaction, effective March 6, 2020, to fix the benchmark variable interest rate of the loan. On March 10, 2023, the rate increased to 2.349%. MEDICAL PROPERTIES TRUST | SUPPLEMENTAL INFORMATION | Q3 2023 7


LOGO

FINANCIAL INFORMATION (As of September 30, 2023) ($ amounts in thousands) DEBT MATURITIES Senior Unsecured Year Term Loans/Revolver Notes Total Debt % of Total 2023 $ 439,399 $—$ 439,399 4.3% 2024—430,352 430,352 4.2% 2025 528,650 853,930 1,382,580 13.6% 2026 1,638,600 1,354,294 2,992,894 29.3% 2027 1,400,000 200,000 1,600,000 15.7% 2028 731,940—731,940 7.2% 2029 900,000—900,000 8.8% 2030 426,965—426,965 4.2% DEBT BY LOCAL CURRENCY Senior Unsecured Term Loans/Revolver Notes Total Debt % of Total United States $ 4,100,000 $ 1,140,000 $ 5,240,000 51.3% United Kingdom 2,208,254 1,075,769 3,284,023 32.2% Australia—302,445 302,445 3.0% Europe 1,057,300 320,362 1,377,662 13.5% DEBT METRICS Adjusted Net Debt to Annualized EBITDAre Ratios: Adjusted Net Debt For the Three Months Ended September 30, 2023 $ 9,322,609 Adjusted Annualized EBITDAre 1,381,360 Adjusted Net Debt to Adjusted Annualized EBITDAre Ratio 6.7x Adjusted Net Debt $ 9,322,609 Transaction Adjusted Annualized EBITDAre 1,375,360 Adjusted Net Debt to Transaction Adjusted Annualized EBITDAre Ratio 6.8x Leverage Ratio: Unsecured Debt $ 10,076,223 Secured Debt 127,907 Total Debt $ 10,204,130 Total Gross Assets(A) 20,320,105 Financial Leverage 50.2% Interest Coverage Ratios: Interest Expense Capitalized Interest Debt Costs Amortization Total Interest EBITDAre Interest Coverage Ratio Adjusted EBITDAre Adjusted Interest Coverage Ratio (A) Total Gross Assets equals total assets plus accumulated depreciation and amortization. See appendix for reconciliation of other Non-GAAP financial measures. MEDICAL PROPERTIES TRUST | SUPPLEMENTAL INFORMATION | Q3 2023 8


LOGO

PORTFOLIO INFORMATION LEASE AND LOAN MATURITY SCHEDULE (A) ($ amounts in thousands) Years of Maturities(B) 2023 (E) 2024 2025 2026 2027 2028 2029 2030 2031 2032 Thereafter Percentage of total base rent/interest 100% 90% 87.7% 80% 70% 60% 50% 40% 30% 20% 10% 0% 1.4% 0.2% 1.5% 0.2% 0.3% 1.5% 1.0% 0.5% 0.4% 5.3% (A) Schedule includes leases and mortgage loans. (B) Lease/Loan expiration is based on the fixed term of the lease/loan and does not factor in potential renewal or other options provided for in our agreements. (C) Reflects all properties, including those that are part of joint ventures, except vacant properties (approximately 0.2% of total assets), and five facilities that are under development. (D) Represents contractual base rent/interest income on an annualized basis as of period end (including foreign currency exchange rates) but does not include tenant recoveries, additional rents and other lease-related adjustments to revenue (i.e., straight-line rents and deferred revenues). (E) Properties classified as held for sale are shown to mature in current year, including four facilities previously leased to Healthscope that were sold in October 2023. MEDICAL PROPERTIES TRUST | SUPPLEMENTAL INFORMATION | Q3 2023 9


LOGO

PORTFOLIO INFORMATION TOTAL ASSETS AND REVENUES BY ASSET TYPE (September 30, 2023) ($ amounts in thousands) Asset Types Properties Total Assets(A) Percentage of Total Assets Q3 2023 Revenues(B) Percentage of Q3 2023 Revenues General Acute Care Hospitals 194 $ 12,105,205 63.7% $ 256,821 72.2% Behavioral Health Facilities 70 2,525,664 13.3% 55,695 15.7% Inpatient Rehabilitation Facilities 114 1,430,494 7.5% 31,783 8.9% Long-Term Acute Care Hospitals 20 274,971 1.5% 5,146 1.5% Freestanding ER/Urgent Care Facilities 43 232,572 1.2% 6,031 1.7% Other Total -(C 2,435,976 ) 12.8% — TOTAL ASSETS BY ASSET TYPE TOTAL REVENUES BY ASSET TYPE 1% 1% 13% General Acute Care Hospitals Behavioral Health Facilities 1% 2% 9% 8% 13% 64% Inpatient Rehabilitation Facilities Long-Term Acute Care Hospitals Freestanding ER/Urgent Care Faciliti Other 16% 72% DOMESTIC ASSETS BY ASSET TYPE DOMESTIC REVENUES BY ASSET TYPE 2% 3% 2% 2% 15% 7% 66% General Acute Care Hospitals Behavioral Health Facilities Inpatient Rehabilitation Facilities 10% 9% 8% Long-Term Acute Care Hospitals 76% Freestanding ER/Urgent Care Facilitie Other Note: Investments in operating entities are allocated pro rata based on the gross book value of the real estate. Such pro rata allocations are subject to change from period to period. (A) Reflects total assets on our consolidated balance sheets. (B) Reflects actual revenues on our consolidated statements of income, except for the $48.9 million reserve of straight-line rent and other receivables for one tenant. (C) Includes our PHP Holdings investment of $684 million. MEDICAL PROPERTIES TRUST | SUPPLEMENTAL INFORMATION | Q3 2023 10


LOGO

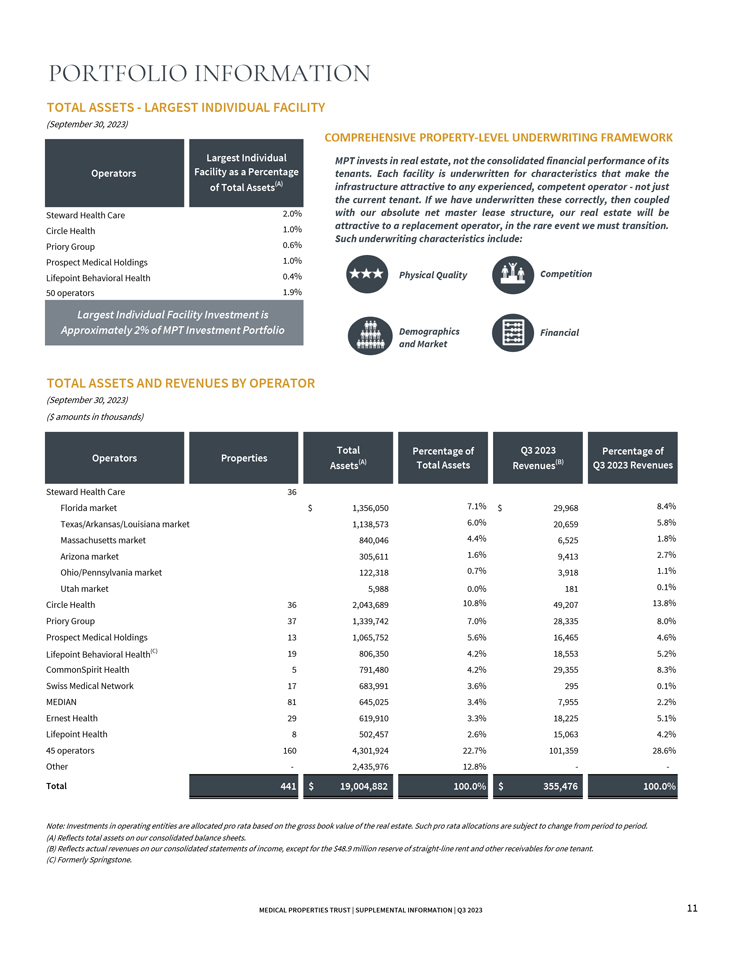
PORTFOLIO INFORMATION TOTAL ASSETS—LARGEST INDIVIDUAL FACILITY (September 30, 2023) Operators Steward Health Care Circle Health Priory Group Prospect Medical Holdings Lifepoint Behavioral Health 50 operators Largest Individual Facility as a Percentage of Total Assets(A) 2.0% 1.0% 0.6% 1.0% 0.4% 1.9% COMPREHENSIVE PROPERTY-LEVEL UNDERWRITING FRAMEWORK MPT invests in real estate, not the consolidated financial performance of its tenants. Each facility is underwritten for characteristics that make the infrastructure attractive to any experienced, competent operator—not just the current tenant. If we have underwritten these correctly, then coupled with our absolute net master lease structure, our real estate will be attractive to a replacement operator, in the rare event we must transition. Such underwriting characteristics include: Physical Quality Competition Largest Individual Facility Investment is Approximately 2% of MPT Investment Portfolio Demographics and Market Financial TOTAL ASSETS AND REVENUES BY OPERATOR (September 30, 2023) ($ amounts in thousands) Operators Properties Total Assets(A) Percentage of Total Assets Q3 2023 Revenues(B) Percentage of Q3 2023 Revenues Steward Health Care Florida market 36 $ 1,356,050 7.1% $ 29,968 8.4% Texas/Arkansas/Louisiana market 1,138,573 6.0% 20,659 5.8% Massachusetts market 840,046 4.4% 6,525 1.8% Arizona market 305,611 1.6% 9,413 2.7% Ohio/Pennsylvania market 122,318 0.7% 3,918 1.1% Utah market 5,988 0.0% 181 0.1% Circle Health 36 2,043,689 10.8% 49,207 13.8% Priory Group 37 1,339,742 7.0% 28,335 8.0% Prospect Medical Holdings 13 1,065,752 5.6% 16,465 4.6% Lifepoint Behavioral Health(C) 19 806,350 4.2% 18,553 5.2% CommonSpirit Health 5 791,480 4.2% 29,355 8.3% Swiss Medical Network 17 683,991 3.6% 295 0.1% MEDIAN 81 645,025 3.4% 7,955 2.2% Ernest Health 29 619,910 3.3% 18,225 5.1% Lifepoint Health 8 502,457 2.6% 15,063 4.2% 45 operators 160 4,301,924 22.7% 101,359 28.6% Other—2,435,976 12.8% — Total 441 $ 19,004,882 100.0% $ 355,476 100.0% Note: Investments in operating entities are allocated pro rata based on the gross book value of the real estate. Such pro rata allocations are subject to change from period to period. (A) Reflects total assets on our consolidated balance sheets. (B) Reflects actual revenues on our consolidated statements of income, except for the $48.9 million reserve of straight-line rent and other receivables for one tenant. (C) Formerly Springstone. TOTAL ASSETS AND REVENUES BY U.S. STATE AND COUNTRY (September 30, 2023) ($ amounts in thousands) U.S. States and Other Countries Properties Total Assets(A) Percentage of Total Assets Q3 2023 Revenues(B) Percentage of Q3 2023 Revenues Texas 51 $ 2,009,435 10.6% $ 40,423 11.4% Florida 9 1,356,050 7.1% 28,443 8.0% California 19 1,227,372 6.4% 31,551 8.9% Massachusetts 10 844,804 4.5% 5,799 1.6% Utah 7 829,434 4.4% 30,559 8.6% 26 Other States 120 3,757,534 19.8% 101,953 28.7% Other—1,775,974 9.3% — United States 216 $ 11,800,603 62.1% $ 238,728 67.2% United Kingdom 92 $ 4,108,393 21.6% $ 90,655 25.5% Germany 85 716,959 3.8% 10,000 2.8% Switzerland 17 683,991 3.6% 295 0.1% Australia 4 290,321 1.5% 5,198 1.5% Spain 9 233,724 1.2% 2,101 0.6% Other Countries 18 510,889 2.7% 8,499 2.3% Other—660,002 3.5% — International 225 $ 7,204,279 37.9% $ 116,748 32.8% Total Note: Investments in operating entities are allocated pro rata based on the gross book value of the real estate. Such pro rata allocations are subject to change from period to period. (A) Reflects total assets on our consolidated balance sheets. (B) Reflects actual revenues on our consolidated statements of income, except for the $48.9 million reserve of straight-line rent and other receivables for one tenant. (C) Formerly Springstone. MEDICAL PROPERTIES TRUST | SUPPLEMENTAL INFORMATION | Q3 2023 11


LOGO

PORTFOLIO INFORMATION TOTAL ASSETS BY COUNTRY TOTAL REVENUES BY COUNTRY 1% 3% 3% 1% 4% 4% 22% 62% United States United Kingdom Germany Switzerland Australia 1% 1% 2% 3% 26% 67% Spain Other Countries Other ASSETS BY U.S. STATE REVENUES BY U.S. STATE 9% 20% 4% 11% 7% 6% 5% Texas Florida California Massachusetts Utah 26 Other States Other 29% 11% 8% 9% 9% 1% MEDICAL PROPERTIES TRUST | SUPPLEMENTAL INFORMATION | Q3 2023 12


LOGO

PORTFOLIO INFORMATION TOTAL PORTFOLIO TTM EBITDARM(A)(B) RENT COVERAGE EXCLUSIVE OF ALL CARES ACT GRANTS YOY AND SEQUENTIAL QUARTER COMPARISONS BY PROPERTY TYPE Notes: All data presented is on a trailing twelve month basis. For properties acquired in the preceding twelve months, data is for the period between MPT acquisition and June 30, 2023. (A) EBITDARM is facility-level earnings before interest, taxes, depreciation, amortization, rent and management fees. EBITDARM includes normal GAAP expensed maintenance and repair costs. EBITDARM does not give effect for capitalized expenditures that extend the life or improve the facility and equipment in a way to drive more future revenues. The majority of these types of capital expenditures are financed and do not have an immediate cash impact. MPT’s rent is not subordinate to capitalized expenses. In addition, EBITDARM does not represent property net income or cash flows from operations and should not be considered an alternative to those indicators. EBITDARM figures utilized in calculating coverages presented are based on financial information provided by MPT’s tenants. MPT has not independently verified this information, but has no reason to believe this information is inaccurate in any material respect. TTM Coverages are calculated based on actual, unadjusted EBITDARM results as presented in tenant financial reporting and cash rent paid to MPT, except as noted below.—All CARES Act Grants received by tenants have been removed from the tenant’s reported financial results in the above time periods.—EBITDARM figures for California hospitals include amounts expected to be received under the Hospital Quality Assurance Fee (“HQAF”) Program 8. The HQAF amounts are based on the current payment model from the California Hospital Association, which has not yet been approved by CMS. (B) General Acute Care coverages and Total Portfolio coverages do not include Pipeline Health facilities as Pipeline Health filed Chapter 11 bankruptcy in October 2022, Healthscope facilities due to completed sale, Prospect Medical Holdings Connecticut facilities due to pending sale, and Prospect Medical Holdings Pennsylvania facilities as interest has not commenced under the mortgage loan. MEDICAL PROPERTIES TRUST | SUPPLEMENTAL INFORMATION | Q3 2023 13


LOGO

PORTFOLIO INFORMATION TOTAL PORTFOLIO TTM EBITDARM RENT COVERAGE EXCLUSIVE OF ALL CARES ACT GRANTS EBITDARM RENT COVERAGE: OPERATORS WITH PROPERTY-LEVEL REPORTING Net Investment Tenant Steward Health Care (in thousands)(A) $ 2,411,887 Primary Property Type General Acute TTM EBITDARM Rent Coverage 2.7x Priory Group 1,182,194 Behavioral MEDIAN 645,025 IRF Ernest Health 545,456 IRF/LTACH Prospect Medical Holdings(B) 512,316 General Acute Prime Healthcare 464,496 General Acute Aspris Children’s Services 235,052 Behavioral Vibra Healthcare 221,892 IRF/LTACH Surgery Partners 171,160 General Acute Ardent Health Services 86,415 General Acute Other Reporting Tenants 626,226 Various 2.1x 1.6x 2.3x 1.0x 4.0x 2.1x 1.3x 7.7x 7.4x 2.7x Total $ 7,102,119 2.6x Tenant International Operator 1 Net Investment (in thousands)(A) $ 1,994,162 Primary Property Type General Acute TTM EBITDARM Rent Coverage 2.3x Domestic Operator 1 502,457 General Acute Domestic Operator 2 383,859 General Acute/LTACH Domestic Operator 3 774,335 Behavioral 0.7x 1.5x 1.5x Total $ 3,654,813 1.7x PROPERTY-LEVEL REPORTING NOT REQUIRED AND/OR NOT AVAILABLE Tenant Net Investment (in thousands)(A) Primary Property Type Comments One of the largest nonprofit health care operators in the U.S.; CommonSpirit Health $ 791,480 General Acute Investment grade-rated Swiss Medical Network 432,920 General Acute Ramsay Health Care UK 388,688 General Acute Pihlajalinna 210,521 General Acute Saint Luke’s—Kansas City 128,098 General Acute NHS 85,226 General Acute Dignity Health 43,727 General Acute CUF 28,922 General Acute NeuroPsychiatric Hospitals 26,965 Behavioral Community Health Systems 26,410 General Acute Other Tenants 22,055 General Acute Second largest group of private hospitals in Switzerland One of largest health care operators in the world; Parent guaranty; Investment grade-rated Finland’s leading provider of social and health services Investment grade-rated Single-payor government entity in UK Part of CommonSpirit; Parent guaranty; Investment grade-rated One of the largest private hospital systems in Portugal with 24 facilities and 75+ year operating history Parent guaranty U.S. hospital operator with substantial operating history N/A Total $ 2,185,012 Above data represents approximately 87% of MPT Total Real Estate Investment (C) Notes: All data presented is on a trailing twelve month basis. For properties acquired in the preceding twelve months, data is for the period between MPT acquisition and June 30, 2023. (A) Investment figures exclude equity investments, non-real estate loans, freestanding ER/urgent care facilities, and facilities under development. (B) Prospect Medical Holdings coverage includes California facilities only. (C) Healthscope is excluded due to completed sale and Prospect Connecticut is excluded due to pending sale. MEDICAL PROPERTIES TRUST | SUPPLEMENTAL INFORMATION | Q3 2023 14


LOGO

PORTFOLIO INFORMATION SUMMARY OF INVESTMENTS (For the nine months ended September 30, 2023) (Amounts in thousands) Operator Location Investment(A) Commencement Date PHP Holdings California $ 50,000 Q1 2023 MEDIAN Germany 77,230 Q2 2023 Priory Group U.K. 57,606 Q2 2023 Prospect Medical Holdings California 45,000 Q2 2023 Capital Additions, Development and Other Funding for Existing Tenants(B) Various 216,126 Various $ 445,962 SUMMARY OF CURRENT DEVELOPMENT PROJECTS AS OF SEPTEMBER 30, 2023 (Amounts in thousands) Operator Location Commitment Costs Incurred as of September 30, 2023 Estimated Commencement Date IMED Hospitales Spain $ 44,848 $ 43,103 Q4 2023 Lifepoint Behavioral Health Texas 31,600 17,790 Q1 2024 IMED Hospitales Spain 36,280 13,775 Q3 2024 IMED Hospitales Spain 49,790 17,045 Q1 2025 Steward Health Care Texas 169,408 90,445 Q2 2026 $ 331,926 $ 182,158 (A) Excludes transaction costs, such as real estate transfer and other taxes. Amount assumes exchange rate as of the investment date. (B) Reflects normal capital additions that extend the life or improve existing facilities on which we receive a return equal to the lease rate for the respective facility. This includes over 10 facilities and six different operators. MEDICAL PROPERTIES TRUST | SUPPLEMENTAL INFORMATION | Q3 2023 15


LOGO

CONSOLIDATED STATEMENTS OF INCOME (Unaudited) (Amounts in thousands, except per share data) For the Three Months Ended For the Nine Months Ended REVENUES September 30, 2023 September 30, 2022 September 30, 2023 September 30, 2022 Rent billed $ 229,306 $ 232,418 $ 724,954 $ 737,029 Straight-line rent 21,511 26,552 38,875 146,114 Income from financing leases 26,066 51,011 107,729 154,660 Interest and other income 29,693 42,358 122,624 124,562 Total revenues 306,576 352,339 994,182 1,162,365 EXPENSES Interest 106,709 88,076 308,833 266,989 Real estate depreciation and amortization 77,802 81,873 526,065 251,523 Property-related(A) 6,483 8,265 38,269 37,998 General and administrative 38,110 37,319 115,438 117,601 Total expenses 229,104 215,533 988,605 674,111 OTHER INCOME (EXPENSE) (Loss) gain on sale of real estate(20) 68,795 209 536,788 Real estate and other impairment (charges) recovery(3,750) 19,450(93,288) 14,575 Earnings from equity interests 11,264 11,483 34,840 33,606 Debt refinancing and unutilized financing benefit (costs) 862(17) 46(9,452) Other (including fair value adjustments on securities) 41,125 4,082 25,447 20,875 Total other income (expense) 49,481 103,793(32,746) 596,392 Income (loss) before income tax Income tax (expense) benefit Net income Net income attributable to non-controlling interests Net income attributable to MPT common stockholders EARNINGS PER COMMON SHARE—BASIC AND DILUTED Net income attributable to MPT common stockholders $ 0.19 $ 0.37 $ 0.18 $ 1.74 WEIGHTED AVERAGE SHARES OUTSTANDING—BASIC 598,444 598,980 598,363 598,828 WEIGHTED AVERAGE SHARES OUTSTANDING—DILUTED 598,553 599,339 598,406 599,099 DIVIDENDS DECLARED PER COMMON SHARE $ 0.15 $ 0.29 $ 0.73 $ 0.87 (A) Includes $3.3 million and $5.6 million of ground lease and other expenses (such as property taxes and insurance) paid directly by us and reimbursed by our tenants for the three months ended September 30, 2023 and 2022, respectively, and $28.6 million and $30.2 million for the nine months ended September 30, 2023 and 2022, respectively. MEDICAL PROPERTIES TRUST | SUPPLEMENTAL INFORMATION | Q3 2023 16


LOGO

FINANCIAL STATEMENTS CONSOLIDATED BALANCE SHEETS (Amounts in thousands, except per share data) ASSETS Real estate assets Land, buildings and improvements, intangible lease assets, and other Investment in financing leases Real estate held for sale Mortgage loans Gross investment in real estate assets Accumulated depreciation and amortization Net investment in real estate assets September 30, 2023 December 31, 2022 (Unaudited)(A) Cash and cash equivalents 340,058 235,668 Interest and rent receivables, net 195,559 167,035 Straight-line rent receivables 788,761 787,166 Investments in unconsolidated real estate joint ventures 1,461,725 1,497,903 Investments in unconsolidated operating entities 1,843,847 1,444,872 Other loans 263,471 227,839 Other assets 558,291 572,990 Total Assets $ 19,004,882 $ 19,658,000 LIABILITIES AND EQUITY Liabilities Debt, net $ 10,157,079 $ 10,268,412 Accounts payable and accrued expenses 375,888 621,324 Deferred revenue 32,280 27,727 Obligations to tenants and other lease liabilities 154,218 146,130 Total Liabilities 10,719,465 11,063,593 Equity Preferred stock, $0.001 par value. Authorized 10,000 shares; no shares outstanding Common stock, $0.001 par value. Authorized 750,000 shares; issued and outstanding—598,444 shares at September 30, 2023 and 597,476 shares at December 31, 2022 Additional paid-in capital Retained (deficit) earnings Accumulated other comprehensive loss Total Medical Properties Trust, Inc. Stockholders’ Equity Non-controlling interests Total Equity Total Liabilities and Equity $ 19,004,882 $ 19,658,000 (A) Financials have been derived from the prior year audited financial statements. MEDICAL PROPERTIES TRUST | SUPPLEMENTAL INFORMATION | Q3 2023 17


LOGO

FINANCIAL STATEMENTS INVESTMENTS IN UNCONSOLIDATED REAL ESTATE JOINT VENTURES (As of and for the three months ended September 30, 2023) (Unaudited) ($ amounts in thousands) Gross real estate Cash Accumulated depreciation and amortization Other assets Total Assets Debt (third party) Other liabilities Equity and shareholder loans Total Liabilities and Equity MPT share of real estate joint venture 50% 70% 50% 50% 45% Total $ 461,930 $ 432,919 $ 431,224 $ 82,327 $ 53,325 $ 1,461,725 MEDIAN(C) Swiss Medical Network(D) Steward Health Care(E) Policlinico di Monza(F) HM Hospitales(G) Total MPT Pro Rata Share Total revenues(B) Expenses: Property-related $ 32,537 $ $ 820 $ 17,704 $ 485 $ 34,604 $ 201 $ 4,456 $ 867 $ 3,809 $ 42 $ 93,110 $ 2,415 $ 49,905 1,302 Interest 13,026 5,291 17,250—538 36,105 19,084 Real estate depreciation and amortization 11,305 8,698 10,307 1,050 2,069 33,429 18,350 General and administrative 494 292 99(169) 12 728 422 Gain on sale of real estate— ——— — —Income taxes 1,276 430 — 293 1,999 1,071 Total expenses $ 26,921 $ 15,196 $ 27,857 $ 1,748 $ 2,954 $ 74,676 $ 40,229 Net Income $ 5,616 $ 2,508 $ 6,747 $ 2,708 $ 855 $ 18,434 $ 9,676 MPT share of real estate joint venture 50% 70% 50% 50% 45% Earnings from equity interests $ 2,808 $ 1,756 $ 3,374 $ 1,354 $ 384 $ 9,676 (H) (A) Includes a €297 million loan from both shareholders. (B) Includes $4.6 million of straight-line rent revenue. (C) MPT managed joint venture of 71-owned German facilities that are fully leased. (D) Represents ownership in Infracore, which owns and leases all 17 Switzerland facilities. (E) MPT managed joint venture of eight-owned Massachusetts hospital facilities that are fully leased pursuant to a master lease. (F) Represents ownership in eight Italian facilities that are fully leased. (G) Represents ownership in two Spanish facilities that are fully leased. (H) Excludes $1.6 million from a combination of returns on our Lifepoint Behavioral Health equity investment and dividends received on our Aevis equity investment ($1.3 million), less amortization of equity investment costs. MEDICAL PROPERTIES TRUST | SUPPLEMENTAL INFORMATION | Q3 2023 18


LOGO

FINANCIAL STATEMENTS INVESTMENTS IN UNCONSOLIDATED OPERATING ENTITIES (Amounts in thousands) OPERATING ENTITY INVESTMENT FRAMEWORK MPT’s hospital expertise and comprehensive underwriting process allows for opportunistic investments in hospital operations. • Passive investments typically needed in order to acquire the larger real estate transactions. • Cash payments go to previous owner and not to the tenant, with limited exceptions. • Operators are vetted as part of our overall underwriting process. • Potential for outsized returns and organic growth. • Certain of these investments entitle us to customary minority rights and protections. • No additional operating loss exposure beyond our investment. • Proven track record of successful investments, including Ernest Health and Capella Healthcare. Operator Investment as of September 30, 2023 Ownership Interest Structure PHP Holdings $ 684,418 49.0% Includes a 49% equity ownership interest in, along with a loan convertible into PHP Holdings, the managed care business of Prospect. Both instruments are accounted for under the fair value option method, which resulted in a $30 million gain in Q3 2023. Steward Health Care 362,589 N/A International Joint Venture 230,153 49.0% Loan, for which proceeds were paid to Steward’s former private equity sponsor, is secured by the equity of Steward and provides for an initial 4% return plus 37% of the increase in the value of Steward over seven years. Includes our 49% equity ownership interest and a loan made for the purpose of investing in select international hospital operations. The loan carries a 7.5% interest rate and is secured by the remaining equity of the international joint venture and guaranteed by the other equity owner. Swiss Medical Network 171,334 8.9% Priory Group 157,547 9.9% Steward Health Care 125,862 9.9% Aevis 79,738 4.6% Aspris 15,996 9.2% Lifepoint Behavioral Health 11,093 20.9% Includes our passive equity ownership interest, along with a CHF 37 million loan as part of a syndicated loan facility. In order to close the 2021 acquisition of 35 facilities, we made a 9.9% passive equity investment and a loan, proceeds of which were paid to the former owner. The loan carries a variable interest rate. Includes our passive equity ownership interest. Proceeds from our original investment of $150 million were paid directly to Steward’s former private equity sponsor and other shareholders. Includes our passive equity ownership interest in Aevis, a public healthcare investment company. Our original investment of CHF 47 million is marked-to-market quarterly. Includes our passive equity ownership interest in Aspris, a spin-off of Priory’s education and children’s services line of business. In order to close the 2021 acquisition of 18 behavioral facilities, we made an equity investment and a loan, proceeds of which were paid to the former owners. As a result of Lifepoint’s acquisition of a majority interest in Springstone (now Lifepoint Behavioral Health) in February 2023, the loan and related interest (of approximately $205 million) was paid in full. We continue to hold our minority equity interest in Lifepoint Behavioral Health. Total INVESTMENTS IN UNCONSOLIDATED OPERATING ENTITIES AS A PERCENTAGE OF TOTAL ASSETS 10% 90% MEDICAL PROPERTIES TRUST | SUPPLEMENTAL INFORMATION | Q3 2023 19


LOGO

APPENDIX—NON-GAAP RECONCILIATIONS ADJUSTED NET DEBT/ANNUALIZED EBITDA re (Unaudited) (Amounts in thousands) ADJUSTED EBITDA re RECONCILIATION Net income Add back: Interest Income tax Depreciation and amortization Loss on sale of real estate Real estate impairment charges Adjustment to reflect MPT’s share of unlevered EBITDAre from unconsolidated real estate joint ventures(A) 3Q 2023 EBITDAre Share-based compensation Write-off of unbilled rent and other Litigation and other Debt refinancing and unutilized financing benefit Non-cash fair value adjustments Prospect Medical Holdings adjustment 3Q 2023 Adjusted EBITDAre Adjustments for mid-quarter investment activity(B) 3Q 2023 Transaction Adjusted EBITDAre For the Three Months Ended September 30, 2023 ADJUSTED NET DEBT RECONCILIATION Total debt at September 30, 2023 $ 10,157,079 Less: Cash at September 30, 2023(340,058) Less: Cash funded for building improvements in progress and construction in progress at September 30, 2023(C)(494,412) Adjusted Net Debt $ 9,322,609 Investors and analysts following the real estate industry utilize net debt (debt less cash) to EBITDAre as a measurement of leverage that shows how many years it would take for us to pay back our debt, assuming net debt and EBITDAre are held constant. In our calculation, we start with EBITDAre , as defined by Nareit, which is net income before interest expense, income tax expense, depreciation and amortization, losses/gains on disposition of depreciated property, impairment losses, and adjustments to reflect our share of EBITDAre from unconsolidated real estate joint ventures. We then adjust EBITDAre for non-cash share-based compensation, non-cash fair value adjustments and other items that would make comparison of our operating results with prior periods and other companies more meaningful, to derive Adjusted EBITDAre . We adjust net debt for cash funded for building improvements in progress and construction in progress for which we are not yet receiving rent to derive Adjusted Net Debt. We adjust Adjusted EBITDAre for the effects from investments and capital transactions that were completed during the period, assuming such transactions were consummated/fully funded as of the beginning of the period to derive Transaction Adjusted EBITDAre . Although non-GAAP measures, we believe Adjusted Net Debt, Adjusted EBITDAre , and Transaction Adjusted EBITDAre are useful to investors and analysts as they allow for a more current view of our credit quality and allow for the comparison of our credit strength between periods and to other real estate companies without the effect of items that by their nature are not comparable from period to period. (A) Includes only the unlevered portion of our share of EBITDAre from unconsolidated real estate joint ventures, as we have excluded any net debt from our unconsolidated real estate joint ventures in the Adjusted Net Debt line. We believe this adjustment is needed to appropriately reflect the relationship between EBITDA re and net debt. (B) Reflects a full quarter impact from our mid-quarter investments, disposals, and loan payoffs. (C) Excluded development and capital improvement projects that are in process and not yet generating a cash return but will generate a return once completed. MEDICAL PROPERTIES TRUST | SUPPLEMENTAL INFORMATION | Q3 2023 20


LOGO

Medical Properties Trust 1000 Urban Center Drive, Suite 501 Birmingham, AL 35242 (205) 969-3755 NYSE: MPW www.medicalpropertiestrust.com Contact: Drew Babin, Senior Managing Director of Corporate Communications (646) 884-9809 or dbabin@medicalpropertiestrust.com or Tim Berryman, Managing Director of Investor Relations (205) 397-8589 or tberryman@medicalpropertiestrust.com

v3.23.3
Document and Entity Information
Oct. 26, 2023
Cover [Abstract]  
Entity Registrant Name MEDICAL PROPERTIES TRUST INC
Amendment Flag false
Entity Central Index Key 0001287865
Document Type 8-K
Document Period End Date Oct. 26, 2023
Entity File Number 001-32559
Entity Incorporation State Country Code MD
Entity Tax Identification Number 20-0191742
Entity Address, Address Line One 1000 Urban Center Drive
Entity Address, Address Line Two Suite 501
Entity Address, City or Town Birmingham
Entity Address, State or Province AL
Entity Address, Postal Zip Code 35242
City Area Code (205)
Local Phone Number 969-3755
Written Communications false
Soliciting Material false
Pre Commencement Tender Offer false
Pre Commencement Issuer Tender Offer false
Security 12b Title Common Stock, par value $0.001 per share, of Medical Properties Trust, Inc.
Trading Symbol MPW
Security Exchange Name NYSE
Entity Emerging Growth Company false

Medical Properties (NYSE:MPW)
Historical Stock Chart
From Mar 2024 to Apr 2024 Click Here for more Medical Properties Charts.
Medical Properties (NYSE:MPW)
Historical Stock Chart
From Apr 2023 to Apr 2024 Click Here for more Medical Properties Charts.