0001049782 False 0001049782 2023-10-25 2023-10-25 iso4217:USD xbrli:shares iso4217:USD xbrli:shares
UNITED STATES
SECURITIES AND EXCHANGE COMMISSION
Washington, D.C. 20549
_________________
FORM 8-K
_________________
CURRENT REPORT
Pursuant to Section 13 or 15(d)
of the Securities Exchange Act of 1934
Date of Report (Date of earliest event reported): October 25, 2023
_______________________________
BROOKLINE BANCORP, INC.
(Exact name of registrant as specified in its charter)
_______________________________
| Delaware | 0-23695 | 04-3402944 |
| (State or Other Jurisdiction of Incorporation) | (Commission File Number) | (I.R.S. Employer Identification No.) |
131 Clarendon Street
Boston, Massachusetts 02116
(Address of Principal Executive Offices) (Zip Code)
(617) 425-4600
(Registrant's telephone number, including area code)
Not applicable
(Former name or former address, if changed since last report)
_______________________________
Check the appropriate box below if the Form 8-K filing is intended to simultaneously satisfy the filing obligation of the registrant under any of the following provisions:
| ☐ | Written communications pursuant to Rule 425 under the Securities Act (17 CFR 230.425) |
| ☐ | Soliciting material pursuant to Rule 14a-12 under the Exchange Act (17 CFR 240.14a-12) |
| ☐ | Pre-commencement communications pursuant to Rule 14d-2(b) under the Exchange Act (17 CFR 240.14d-2(b)) |
| ☐ | Pre-commencement communications pursuant to Rule 13e-4(c) under the Exchange Act (17 CFR 240.13e-4(c)) |
Securities registered pursuant to Section 12(b) of the Act:
| Title of each class | Trading Symbol(s) | Name of each exchange on which registered |
| Common Stock, par value of $0.01 per share | BRKL | Nasdaq Global Select Market |
Indicate by check mark whether the registrant is an emerging growth company as defined in Rule 405 of the Securities Act of 1933 (§230.405 of this chapter) or Rule 12b-2 of the Securities Exchange Act of 1934 (§240.12b-2 of this chapter).
Emerging growth company ☐
If an emerging growth company,indicate by check mark if the registrant has elected not to use the extended transition period for complying with any new or revised financial accounting standards provided pursuant to Section 13(a) of the Exchange Act. ☐
Item 2.02. Results of Operations and Financial Condition.
On October 25, 2023, the Board of Directors of Brookline Bancorp, Inc. (the “Company”) issued a press release announcing its earnings for the quarter ended September 30, 2023. Additionally, the Company announced the approval by its Board of Directors of a regular quarterly dividend of $0.135 per share payable on November 24, 2023 to stockholders of record on November 10, 2023. A copy of that press release is attached hereto as Exhibit 99.1 and is hereby incorporated by reference herein.
Item 7.01. Regulation FD Disclosure.
In connection with the press release announcing the Company’s first quarter earnings, the Company posted an investor presentation to its website at www.brooklinebancorp.com. A copy of the investor presentation is attached hereto as Exhibit 99.2 and is hereby incorporated by reference herein.
Item 9.01. Financial Statements and Exhibits.
SIGNATURE
Pursuant to the requirements of the Securities Exchange Act of 1934, the registrant has duly caused this report to be signed on its behalf by the undersigned hereunto duly authorized.
| | BROOKLINE BANCORP, INC. |
| | | |
| | | |
| Date: October 25, 2023 | By: | /s/ Carl M. Carlson |
| | | Carl M. Carlson |
| | | Co-President, Chief Financial & Strategy Officer |
| | | |
EXHIBIT INDEX
The following exhibits are furnished as part of this report:
EXHIBIT 99.1
Brookline Bancorp Announces Third Quarter Results
Net Income of $22.7 million, EPS of $0.26
BOSTON, Oct. 25, 2023 (GLOBE NEWSWIRE) -- Brookline Bancorp, Inc. (NASDAQ: BRKL) (the “Company”) today announced net income of $22.7 million, or $0.26 per basic and diluted share, for the third quarter of 2023, compared to net income of $21.9 million, or $0.25 per basic and diluted share, for the second quarter of 2023, and net income of $30.1 million, or $0.39 per basic and diluted share, for the third quarter of 2022.
Paul Perrault, Chairman and CEO commented on the quarter, “I am pleased to report on our Company’s performance in the third quarter. We continue to make progress in all of our markets. Our colleagues are keeping us well positioned to continue taking advantage of opportunities as they present themselves.”
BALANCE SHEET
Total assets at September 30, 2023 decreased $25.5 million to $11.18 billion from $11.21 billion at June 30, 2023, and increased $2.5 billion from $8.7 billion at September 30, 2022. At September 30, 2023, total loans and leases were $9.4 billion, representing an increase of $40.0 million from June 30, 2023, and an increase of $2.0 billion from September 30, 2022, primarily driven by the acquisition of PCSB Financial Corporation ("PCSB").
Total investment securities at September 30, 2023 decreased $29.8 million to $880.4 million from $910.2 million at June 30, 2023, and increased $204.7 million from $675.7 million at September 30, 2022. Total cash and cash equivalents at September 30, 2023 decreased $63.4 million to $161.0 million from $224.4 million at June 30, 2023, and increased $48.5 million from $112.5 million at September 30, 2022. As of September 30, 2023, total investment securities and total cash and cash equivalents represented 9.3 percent of total assets compared to 10.1 percent and 9.1 percent as of June 30, 2023 and September 30, 2022, respectively.
Total deposits at September 30, 2023 increased $49.0 million to $8.57 billion from $8.52 billion at June 30, 2023, consisting of an $87.5 million increase in customer deposits, partially offset by a $38.5 million decrease in brokered deposits, and increased $1.8 billion from $6.74 billion at September 30, 2022, primarily driven by the completion of the PCSB acquisition.
Total borrowed funds at September 30, 2023 decreased $91.2 million to $1.1 billion from $1.2 billion at June 30, 2023, and increased $376.3 million from $758.8 million at September 30, 2022.
The ratio of stockholders’ equity to total assets was 10.36 percent at September 30, 2023, compared to 10.37 percent at June 30, 2023, and 11.08 percent at September 30, 2022. The ratio of tangible stockholders’ equity to tangible assets (non-GAAP) was 8.16 percent at both September 30, 2023 and June 30, 2023, and 9.39 percent at September 30, 2022. Tangible book value per common share (non-GAAP) decreased $0.05 from $10.07 at June 30, 2023 to $10.02 at September 30, 2023, compared to $10.43 at September 30, 2022.
NET INTEREST INCOME
Net interest income decreased $2.0 million to $84.1 million during the third quarter of 2023 from $86.0 million for the quarter ended June 30, 2023. The net interest margin decreased 8 basis points to 3.18 percent for the three months ended September 30, 2023 from 3.26 percent for the three months ended June 30, 2023, primarily driven by higher funding costs.
NON-INTEREST INCOME
Total non-interest income for the quarter ended September 30, 2023 was $5.5 million and flat compared to the quarter ended June 30, 2023.
PROVISION FOR CREDIT LOSSES
The Company recorded a provision for credit losses of $2.9 million for the quarter ended September 30, 2023, compared to $5.7 million for the quarter ended June 30, 2023.
Total net charge-offs for the third quarter of 2023 were $11.0 million compared to $1.1 million in the second quarter of 2023. The increase was primarily driven by $10.2 million in net charge-offs on two commercial loans, the majority of which was previously reserved for. The ratio of net loan and lease charge-offs to average loans and leases on an annualized basis increased to 47 basis points for the third quarter of 2023 from 5 basis points for the second quarter of 2023.
The allowance for loan and lease losses represented 1.27 percent of total loans and leases at September 30, 2023, compared to 1.35 percent at June 30, 2023, and 1.27 percent at September 30, 2022, driven by a decline in individually assessed reserves due to the aforementioned charge-offs.
ASSET QUALITY
The ratio of nonperforming loans and leases to total loans and leases was 0.55 percent at September 30, 2023, an increase from 0.50 percent at June 30, 2023. Total nonaccrual loans and leases increased $4.9 million to $51.2 million at September 30, 2023 from $46.3 million at June 30, 2023. The ratio of nonperforming assets to total assets was 0.46 percent at September 30, 2023, an increase from 0.42 percent at June 30, 2023. Total nonperforming assets increased $4.6 million to $51.5 million at September 30, 2023 from $46.9 million at June 30, 2023. The increase in nonperforming assets was primarily driven by a $14.8 million commercial real estate relationship becoming non-accrual during the quarter, partially offset by two commercial relationships of which $10.2 million was charged off during the quarter.
NON-INTEREST EXPENSE
Non-interest expense for the quarter ended September 30, 2023 decreased $0.1 million to $57.7 million from $57.8 million for the quarter ended June 30, 2023. The decrease was primarily driven by a decrease of $1.0 million in merger and acquisition expense and a decrease of $0.5 million in FDIC insurance expense, partially offset by an increase of $0.7 million in other non-interest expense and an increase of $0.4 million in professional services expense.
PROVISION FOR INCOME TAXES
The effective tax rate was 21.4 percent and 20.3 percent for the three and nine months ended September 30, 2023 compared to 21.4 percent for the three months ended June 30, 2023 and 18.7 percent and 22.9 percent for the three and nine months ended September 30, 2022.
RETURNS ON AVERAGE ASSETS AND AVERAGE EQUITY
The annualized return on average assets increased to 0.81 percent during the third quarter 2023 from 0.78 percent for the second quarter of 2023.
The annualized return on average stockholders' equity increased to 7.78 percent during the third quarter of 2023 from 7.44 percent for the second quarter of 2023. The annualized return on average tangible stockholders’ equity increased to 10.09 percent for the third quarter of 2023 from 9.67 percent for the second quarter of 2023.
DIVIDEND DECLARED
The Company’s Board of Directors approved a dividend of $0.135 per share for the quarter ended September 30, 2023. The dividend will be paid on November 24, 2023 to stockholders of record on November 10, 2023.
CONFERENCE CALL
The Company will conduct a conference call/webcast at 1:30 PM Eastern Time on Thursday, October 26, 2023 to discuss the results for the quarter, business highlights and outlook. A copy of the Earnings Presentation is available on the Company’s website, www.brooklinebancorp.com. To listen to the call and view the Company’s Earnings Presentation, please join the call via https://events.q4inc.com/attendee/328004214. To listen to the call without access to the slides, interested parties may dial 833-470-1428 (United States) or 404-975-4839 (internationally) and ask for the Brookline Bancorp, Inc. conference call (Access Code 454769). A recorded playback of the call will be available for one week following the call on the Company’s website under “Investor Relations” or by dialing 866-813-9403 (United States) or 204-525-0658 (internationally) and entering the passcode: 509267.
ABOUT BROOKLINE BANCORP, INC.
Brookline Bancorp, Inc., a bank holding company with $11.2 billion in assets and branch locations in Massachusetts, Rhode Island, and the Lower Hudson Valley of New York State, is headquartered in Boston, Massachusetts and operates as the holding company for Brookline Bank, Bank Rhode Island, and PCSB Bank (the "banks"). The Company provides commercial and retail banking services, cash management and investment services to customers throughout Central New England and the Lower Hudson Valley of New York State. More information about Brookline Bancorp, Inc. and its banks can be found at the following websites: www.brooklinebank.com, www.bankri.com and www.pcsb.com.
FORWARD-LOOKING STATEMENTS
Certain statements contained in this press release that are not historical facts may constitute forward-looking statements within the meaning of Section 27A of the Securities Act of 1933, as amended, and Section 21E of the Securities Exchange Act of 1934, as amended, and are intended to be covered by the safe harbor provisions of the Private Securities Litigation Reform Act of 1995. We may also make forward-looking statements in other documents we file with the Securities and Exchange Commission ("SEC"), in our annual reports to shareholders, in press releases and other written materials, and in oral statements made by our officers, directors or employees. You can identify forward looking statements by the use of the words “believe,” “expect,” “anticipate,” “intend,” “estimate,” “assume,” “outlook,” “will,” “should,” and other expressions that predict or indicate future events and trends and which do not relate to historical matters, including statements regarding the Company’s business, credit quality, financial condition, liquidity and results of operations. Forward-looking statements may differ, possibly materially, from what is included in this press release due to factors and future developments that are uncertain and beyond the scope of the Company’s control. These include, but are not limited to, the Company’s ability to achieve the synergies and value creation contemplated by the acquisition of PCSB; turbulence in the capital and debt markets; changes in interest rates; competitive pressures from other financial institutions; general economic conditions (including inflation and concerns about liquidity) on a national basis or in the local markets in which the Company operates; changes in consumer behavior due to changing political, business and economic conditions, or legislative or regulatory initiatives; changes in the value of securities and other assets in the Company’s investment portfolio; increases in loan and lease default and charge-off rates; the adequacy of allowances for loan and lease losses; decreases in deposit levels that necessitate increases in borrowing to fund loans and investments; operational risks including, but not limited to, cybersecurity incidents, fraud, natural disasters, and future pandemics; changes in regulation; the possibility that future credit losses may be higher than currently expected due to changes in economic assumptions and adverse economic developments; the risk that goodwill and intangibles recorded in the Company’s financial statements will become impaired; and changes in assumptions used in making such forward-looking statements. Forward-looking statements involve risks and uncertainties which are difficult to predict. The Company’s actual results could differ materially from those projected in the forward-looking statements as a result of, among others, the risks outlined in the Company’s Annual Report on Form 10-K, as updated by its Quarterly Reports on Form 10-Q and other filings submitted to the SEC. The Company does not undertake any obligation to update any forward-looking statement to reflect circumstances or events that occur after the date the forward-looking statements are made.
BASIS OF PRESENTATION
The Company's consolidated financial statements have been prepared in conformity with generally accepted accounting principles (“GAAP”) as set forth by the Financial Accounting Standards Board in its Accounting Standards Codification and through the rules and interpretive releases of the SEC under the authority of federal securities laws. Certain amounts previously reported have been reclassified to conform to the current period's presentation.
NON-GAAP FINANCIAL MEASURES
The Company uses certain non-GAAP financial measures, such as operating earnings, operating earnings per common share, operating return on average assets, operating return on average tangible assets, operating return on average stockholders' equity, operating return on average tangible stockholders' equity, tangible book value per common share, tangible stockholders’ equity to tangible assets, return on average tangible assets (annualized) and return on average tangible stockholders' equity (annualized). These non-GAAP financial measures provide information for investors to effectively analyze financial trends of ongoing business activities, and to enhance comparability with peers across the financial services sector. A detailed reconciliation table of the Company's GAAP to the non-GAAP measures is attached.
| INVESTOR RELATIONS: |
| | |
| Contact: | Carl M. Carlson |
| | Brookline Bancorp, Inc. |
| | Co-President and Chief Financial Officer |
| | (617) 425-5331 |
| | ccarlson@brkl.com |
| BROOKLINE BANCORP, INC. AND SUBSIDIARIES |
| Selected Financial Highlights (Unaudited) |
| |
| | | At and for the Three Months Ended |
| | | September 30,
2023 | June 30,
2023 | March 31,
2023 | December 31,
2022 | September 30,
2022 |
| | | (Dollars In Thousands Except per Share Data) |
| Earnings Data: | | | | | | |
| Net interest income | | $ | 84,070 | | $ | 86,037 | | $ | 86,049 | | $ | 80,030 | | $ | 78,026 | |
| Provision (credit) for credit losses | | | 2,947 | | | 5,726 | | | 25,344 | | | 5,671 | | | 2,845 | |
| Provision (credit) for investment losses | | | 84 | | | 133 | | | 198 | | | 54 | | | (10 | ) |
| Non-interest income | | | 5,508 | | | 5,462 | | | 12,937 | | | 9,056 | | | 6,834 | |
| Non-interest expense | | | 57,679 | | | 57,825 | | | 64,776 | | | 47,225 | | | 44,959 | |
| Income before provision for income taxes | | | 28,868 | | | 27,815 | | | 8,668 | | | 36,136 | | | 37,066 | |
| Net income | | | 22,701 | | | 21,850 | | | 7,560 | | | 29,695 | | | 30,149 | |
| | | | | | | |
| Performance Ratios: | | | | | | |
| Net interest margin (1) | | | 3.18 | % | | 3.26 | % | | 3.36 | % | | 3.81 | % | | 3.80 | % |
| Interest-rate spread (1) | | | 2.45 | % | | 2.51 | % | | 2.66 | % | | 3.35 | % | | 3.58 | % |
| Return on average assets (annualized) | | | 0.81 | % | | 0.78 | % | | 0.27 | % | | 1.34 | % | | 1.40 | % |
| Return on average tangible assets (annualized) (non-GAAP) | | | 0.83 | % | | 0.79 | % | | 0.28 | % | | 1.37 | % | | 1.43 | % |
| Return on average stockholders' equity (annualized) | | | 7.78 | % | | 7.44 | % | | 2.61 | % | | 12.09 | % | | 12.29 | % |
| Return on average tangible stockholders' equity (annualized) (non-GAAP) | | | 10.09 | % | | 9.67 | % | | 3.43 | % | | 14.48 | % | | 14.72 | % |
| Efficiency ratio (2) | | | 64.39 | % | | 63.20 | % | | 65.44 | % | | 53.01 | % | | 52.98 | % |
| | | | | | | |
| Per Common Share Data: | | | | | | |
| Net income — Basic | | $ | 0.26 | | $ | 0.25 | | $ | 0.09 | | $ | 0.39 | | $ | 0.39 | |
| Net income — Diluted | | | 0.26 | | | 0.25 | | | 0.09 | | | 0.39 | | | 0.39 | |
| Cash dividends declared | | | 0.135 | | | 0.135 | | | 0.135 | | | 0.135 | | | 0.135 | |
| Book value per share (end of period) | | | 13.03 | | | 13.11 | | | 13.14 | | | 12.91 | | | 12.54 | |
| Tangible book value per share (end of period) (non-GAAP) | | | 10.02 | | | 10.07 | | | 10.08 | | | 10.80 | | | 10.43 | |
| Stock price (end of period) | | | 9.11 | | | 8.74 | | | 10.50 | | | 14.15 | | | 11.65 | |
| |
| Balance Sheet: | | | | | | |
| Total assets | | $ | 11,180,555 | | $ | 11,206,078 | | $ | 11,522,485 | | $ | 9,185,836 | | $ | 8,695,708 | |
| Total loans and leases | | | 9,380,782 | | | 9,340,799 | | | 9,246,965 | | | 7,644,388 | | | 7,421,304 | |
| Total deposits | | | 8,566,013 | | | 8,517,013 | | | 8,456,462 | | | 6,522,146 | | | 6,735,605 | |
| Total stockholders’ equity | | | 1,157,871 | | | 1,162,308 | | | 1,165,066 | | | 992,125 | | | 963,618 | |
| | | | | | | |
| Asset Quality: | | | | | | |
| Nonperforming assets | | $ | 51,540 | | $ | 46,925 | | $ | 28,962 | | $ | 15,302 | | $ | 18,312 | |
| Nonperforming assets as a percentage of total assets | | | 0.46 | % | | 0.42 | % | | 0.25 | % | | 0.17 | % | | 0.21 | % |
| Allowance for loan and lease losses | | $ | 119,081 | | $ | 125,817 | | $ | 120,865 | | $ | 98,482 | | $ | 94,169 | |
| Allowance for loan and lease losses as a percentage of total loans and leases | | | 1.27 | % | | 1.35 | % | | 1.31 | % | | 1.29 | % | | 1.27 | % |
| Net loan and lease charge-offs (recoveries) | | $ | 10,974 | | $ | 1,097 | | $ | 451 | | $ | 310 | | $ | (179 | ) |
| Net loan and lease charge-offs as a percentage of average loans and leases (annualized) | | | 0.47 | % | | 0.05 | % | | 0.02 | % | | 0.02 | % | | (0.01 | )% |
| | | | | | | |
| Capital Ratios: | | | | | | |
| Stockholders’ equity to total assets | | | 10.36 | % | | 10.37 | % | | 10.11 | % | | 10.80 | % | | 11.08 | % |
| Tangible stockholders’ equity to tangible assets (non-GAAP) | | | 8.16 | % | | 8.16 | % | | 7.94 | % | | 9.20 | % | | 9.39 | % |
| | | | | | | |
| (1) Calculated on a fully tax-equivalent basis. |
| (2) Calculated as non-interest expense as a percentage of net interest income plus non-interest income. |
| BROOKLINE BANCORP, INC. AND SUBSIDIARIES |
| Consolidated Balance Sheets (Unaudited) |
| |
| | | September 30,
2023 | June 30,
2023 | March 31,
2023 | December 31,
2022 | September 30,
2022 |
| ASSETS | | (In Thousands Except Share Data) |
| Cash and due from banks | | $ | 33,506 | | $ | 44,323 | | $ | 30,782 | | $ | 191,767 | | $ | 65,638 | |
| Short-term investments | | | 127,495 | | | 180,109 | | | 455,538 | | | 191,192 | | | 46,873 | |
| Total cash and cash equivalents | | | 161,001 | | | 224,432 | | | 486,320 | | | 382,959 | | | 112,511 | |
| Investment securities available-for-sale | | | 880,412 | | | 910,210 | | | 1,067,032 | | | 656,766 | | | 675,692 | |
| Total investment securities | | | 880,412 | | | 910,210 | | | 1,067,032 | | | 656,766 | | | 675,692 | |
| Allowance for investment security losses | | | (517 | ) | | (433 | ) | | (301 | ) | | (102 | ) | | (48 | ) |
| Net investment securities | | | 879,895 | | | 909,777 | | | 1,066,731 | | | 656,664 | | | 675,644 | |
| Loans and leases: | | | | | | |
| Commercial real estate loans | | | 5,669,768 | | | 5,670,771 | | | 5,610,414 | | | 4,404,148 | | | 4,269,512 | |
| Commercial loans and leases | | | 2,241,375 | | | 2,193,027 | | | 2,147,149 | | | 2,016,499 | | | 1,933,645 | |
| Consumer loans | | | 1,469,639 | | | 1,477,001 | | | 1,489,402 | | | 1,223,741 | | | 1,218,147 | |
| Total loans and leases | | | 9,380,782 | | | 9,340,799 | | | 9,246,965 | | | 7,644,388 | | | 7,421,304 | |
| Allowance for loan and lease losses | | | (119,081 | ) | | (125,817 | ) | | (120,865 | ) | | (98,482 | ) | | (94,169 | ) |
| Net loans and leases | | | 9,261,701 | | | 9,214,982 | | | 9,126,100 | | | 7,545,906 | | | 7,327,135 | |
| Restricted equity securities | | | 65,460 | | | 71,421 | | | 86,230 | | | 71,307 | | | 44,760 | |
| Premises and equipment, net of accumulated depreciation | | | 90,476 | | | 90,685 | | | 87,799 | | | 71,391 | | | 69,912 | |
| Right-of-use asset operating leases | | | 31,619 | | | 31,774 | | | 30,067 | | | 19,484 | | | 18,614 | |
| Deferred tax asset | | | 74,491 | | | 77,704 | | | 75,028 | | | 52,237 | | | 56,894 | |
| Goodwill | | | 241,222 | | | 241,222 | | | 241,222 | | | 160,427 | | | 160,427 | |
| Identified intangible assets, net of accumulated amortization | | | 26,172 | | | 28,126 | | | 30,080 | | | 1,781 | | | 1,902 | |
| Other real estate owned and repossessed assets | | | 299 | | | 602 | | | 508 | | | 408 | | | 591 | |
| Other assets | | | 348,219 | | | 315,353 | | | 292,400 | | | 223,272 | | | 227,318 | |
| Total assets | | $ | 11,180,555 | | $ | 11,206,078 | | $ | 11,522,485 | | $ | 9,185,836 | | $ | 8,695,708 | |
| LIABILITIES AND STOCKHOLDERS' EQUITY | | | | | | |
| Deposits: | | | | | | |
| Demand checking accounts | | $ | 1,745,137 | | $ | 1,843,516 | | $ | 1,899,370 | | $ | 1,802,518 | | $ | 1,848,562 | |
| NOW accounts | | | 647,476 | | | 699,119 | | | 757,411 | | | 544,118 | | | 597,870 | |
| Savings accounts | | | 1,625,804 | | | 1,464,054 | | | 1,268,375 | | | 762,271 | | | 824,789 | |
| Money market accounts | | | 2,161,359 | | | 2,166,570 | | | 2,185,971 | | | 2,174,952 | | | 2,405,680 | |
| Certificate of deposit accounts | | | 1,491,844 | | | 1,410,905 | | | 1,362,970 | | | 928,143 | | | 924,771 | |
| Brokered deposit accounts | | | 894,393 | | | 932,849 | | | 982,365 | | | 310,144 | | | 133,933 | |
| Total deposits | | | 8,566,013 | | | 8,517,013 | | | 8,456,462 | | | 6,522,146 | | | 6,735,605 | |
| Borrowed funds: | | | | | | |
| Advances from the FHLBB | | | 899,304 | | | 1,043,381 | | | 1,458,457 | | | 1,237,823 | | | 557,895 | |
| Subordinated debentures and notes | | | 84,152 | | | 84,116 | | | 84,080 | | | 84,044 | | | 84,008 | |
| Other borrowed funds | | | 151,612 | | | 98,773 | | | 87,565 | | | 110,785 | | | 116,865 | |
| Total borrowed funds | | | 1,135,068 | | | 1,226,270 | | | 1,630,102 | | | 1,432,652 | | | 758,768 | |
| Operating lease liabilities | | | 32,807 | | | 33,021 | | | 31,373 | | | 19,484 | | | 18,614 | |
| Mortgagors’ escrow accounts | | | 12,578 | | | 17,207 | | | 17,080 | | | 5,607 | | | 5,785 | |
| Reserve for unfunded credits | | | 21,497 | | | 22,789 | | | 23,112 | | | 20,602 | | | 19,555 | |
| Accrued expenses and other liabilities | | | 254,721 | | | 227,470 | | | 199,290 | | | 193,220 | | | 193,763 | |
| Total liabilities | | | 10,022,684 | | | 10,043,770 | | | 10,357,419 | | | 8,193,711 | | | 7,732,090 | |
| Stockholders' equity: | | | | | | |
| Common stock, $0.01 par value; 200,000,000 shares authorized; 96,998,075 shares issued, 96,998,075 shares issued, 96,998,075 shares issued, 85,177,172 shares issued, and 85,177,172 shares issued, respectively | | | 970 | | | 970 | | | 970 | | | 852 | | | 852 | |
| Additional paid-in capital | | | 901,376 | | | 905,084 | | | 904,174 | | | 736,074 | | | 735,119 | |
| Retained earnings, partially restricted | | | 427,937 | | | 417,328 | | | 407,528 | | | 412,019 | | | 392,779 | |
| Accumulated other comprehensive income | | | (81,541 | ) | | (66,156 | ) | | (52,688 | ) | | (61,947 | ) | | (70,227 | ) |
| Treasury stock, at cost; | | | | | | |
| 7,350,981, 7,734,891, 7,734,891, 7,731,445, and 7,730,945 shares, respectively | | | (90,871 | ) | | (94,918 | ) | | (94,918 | ) | | (94,873 | ) | | (94,866 | ) |
| Unallocated common stock held by the Employee Stock Ownership Plan; | | | | | | |
| 0, 0, 0, 0, and 4,833 shares, respectively | | | — | | | — | | | — | | | — | | | (39 | ) |
| Total stockholders' equity | | | 1,157,871 | | | 1,162,308 | | | 1,165,066 | | | 992,125 | | | 963,618 | |
| Total liabilities and stockholders' equity | | $ | 11,180,555 | | $ | 11,206,078 | | $ | 11,522,485 | | $ | 9,185,836 | | $ | 8,695,708 | |
| BROOKLINE BANCORP, INC. AND SUBSIDIARIES |
| Consolidated Statements of Income (Unaudited) |
| | | Three Months Ended |
| | | September 30,
2023 | June 30,
2023 | March 31,
2023 | December 31,
2022 | September 30,
2022 |
| | | (In Thousands Except Share Data) |
| Interest and dividend income: | | | | | | |
| Loans and leases | | $ | 136,561 | | $ | 132,299 | | $ | 121,931 | | $ | 98,386 | | $ | 84,375 | |
| Debt securities | | | 6,799 | | | 8,034 | | | 7,870 | | | 3,497 | | | 3,337 | |
| Restricted equity securities | | | 1,310 | | | 1,673 | | | 1,255 | | | 766 | | | 467 | |
| Short-term investments | | | 2,390 | | | 3,351 | | | 1,495 | | | 754 | | | 464 | |
| Total interest and dividend income | | | 147,060 | | | 145,357 | | | 132,551 | | | 103,403 | | | 88,643 | |
| Interest expense: | | | | | | |
| Deposits | | | 49,116 | | | 43,147 | | | 29,368 | | | 14,185 | | | 7,354 | |
| Borrowed funds | | | 13,874 | | | 16,173 | | | 17,134 | | | 9,188 | | | 3,263 | |
| Total interest expense | | | 62,990 | | | 59,320 | | | 46,502 | | | 23,373 | | | 10,617 | |
| Net interest income | | | 84,070 | | | 86,037 | | | 86,049 | | | 80,030 | | | 78,026 | |
| Provision for credit losses | | | 2,947 | | | 5,726 | | | 25,344 | | | 5,671 | | | 2,845 | |
| Provision (credit) for investment losses | | | 84 | | | 133 | | | 198 | | | 54 | | | (10 | ) |
| Net interest income after provision for credit losses | | | 81,039 | | | 80,178 | | | 60,507 | | | 74,305 | | | 75,191 | |
| Non-interest income: | | | | | | |
| Deposit fees | | | 3,024 | | | 2,866 | | | 2,657 | | | 2,916 | | | 2,759 | |
| Loan fees | | | 639 | | | 491 | | | 391 | | | 446 | | | 349 | |
| Loan level derivative income, net | | | 376 | | | 363 | | | 2,373 | | | 670 | | | 1,275 | |
| Gain on investment securities, net | | | — | | | 3 | | | 1,701 | | | 321 | | | — | |
| Gain on sales of loans and leases held-for-sale | | | 225 | | | 308 | | | 1,638 | | | 2,612 | | | 889 | |
| Other | | | 1,244 | | | 1,431 | | | 4,177 | | | 2,091 | | | 1,562 | |
| Total non-interest income | | | 5,508 | | | 5,462 | | | 12,937 | | | 9,056 | | | 6,834 | |
| Non-interest expense: | | | | | | |
| Compensation and employee benefits | | | 33,491 | | | 33,438 | | | 36,565 | | | 29,525 | | | 28,306 | |
| Occupancy | | | 4,983 | | | 4,870 | | | 5,223 | | | 4,005 | | | 3,906 | |
| Equipment and data processing | | | 6,766 | | | 6,531 | | | 6,462 | | | 5,758 | | | 5,066 | |
| Professional services | | | 2,368 | | | 1,986 | | | 1,430 | | | 1,546 | | | 1,069 | |
| FDIC insurance | | | 2,152 | | | 2,609 | | | 1,244 | | | 1,001 | | | 709 | |
| Advertising and marketing | | | 1,174 | | | 1,382 | | | 1,410 | | | 1,052 | | | 1,337 | |
| Amortization of identified intangible assets | | | 1,955 | | | 1,954 | | | 1,966 | | | 120 | | | 120 | |
| Merger and acquisition expense | | | — | | | 1,002 | | | 6,409 | | | 641 | | | 1,073 | |
| Other | | | 4,790 | | | 4,053 | | | 4,067 | | | 3,577 | | | 3,373 | |
| Total non-interest expense | | | 57,679 | | | 57,825 | | | 64,776 | | | 47,225 | | | 44,959 | |
| Income before provision for income taxes | | | 28,868 | | | 27,815 | | | 8,668 | | | 36,136 | | | 37,066 | |
| Provision for income taxes | | | 6,167 | | | 5,965 | | | 1,108 | | | 6,441 | | | 6,917 | |
| Net income | | $ | 22,701 | | $ | 21,850 | | $ | 7,560 | | $ | 29,695 | | $ | 30,149 | |
| Earnings per common share: | | | | | | |
| Basic | | $ | 0.26 | | $ | 0.25 | | $ | 0.09 | | $ | 0.39 | | $ | 0.39 | |
| Diluted | | $ | 0.26 | | $ | 0.25 | | $ | 0.09 | | $ | 0.39 | | $ | 0.39 | |
| Weighted average common shares outstanding during the period: | | | | | |
| Basic | | | 88,795,270 | | | 88,665,135 | | | 86,563,641 | | | 76,841,655 | | | 76,779,038 | |
| Diluted | | | 88,971,210 | | | 88,926,543 | | | 86,837,806 | | | 77,065,076 | | | 77,007,971 | |
| Dividends paid per common share | | $ | 0.135 | | $ | 0.135 | | $ | 0.135 | | $ | 0.135 | | $ | 0.130 | |
| BROOKLINE BANCORP, INC. AND SUBSIDIARIES |
| Consolidated Statements of Income (Unaudited) |
| |
| | | Nine Months Ended September 30, |
| | | | 2023 | | | 2022 | |
| | | (In Thousands Except Share Data) |
| Interest and dividend income: | | | |
| Loans and leases | | $ | 390,791 | | $ | 230,383 | |
| Debt securities | | | 22,703 | | | 9,582 | |
| Restricted equity securities | | | 4,238 | | | 1,132 | |
| Short-term investments | | | 7,236 | | | 686 | |
| Total interest and dividend income | | | 424,968 | | | 241,783 | |
| Interest expense: | | | |
| Deposits | | | 121,631 | | | 15,407 | |
| Borrowed funds | | | 47,181 | | | 6,635 | |
| Total interest expense | | | 168,812 | | | 22,042 | |
| Net interest income | | | 256,156 | | | 219,741 | |
| Provision for credit losses | | | 34,017 | | | 2,854 | |
| Provision for investment losses | | | 415 | | | 48 | |
| Net interest income after provision for credit losses | | | 221,724 | | | 216,839 | |
| Non-interest income: | | | |
| Deposit Fees | | | 8,547 | | | 8,003 | |
| Loan Fees | | | 1,521 | | | 1,762 | |
| Loan level derivative income, net | | | 3,112 | | | 3,576 | |
| Gain on investment securities, net | | | 1,704 | | | — | |
| Gain on sales of loans and leases held-for-sale | | | 2,171 | | | 1,524 | |
| Other | | | 6,852 | | | 4,426 | |
| Total non-interest income | | | 23,907 | | | 19,291 | |
| Non-interest expense: | | | |
| Compensation and employee benefits | | | 103,494 | | | 83,962 | |
| Occupancy | | | 15,076 | | | 11,997 | |
| Equipment and data processing | | | 19,759 | | | 15,075 | |
| Professional services | | | 5,784 | | | 3,514 | |
| FDIC insurance | | | 6,005 | | | 2,176 | |
| Advertising and marketing | | | 3,966 | | | 3,928 | |
| Amortization of identified intangible assets | | | 5,875 | | | 374 | |
| Merger and acquisition expense | | | 7,411 | | | 1,608 | |
| Other | | | 12,910 | | | 9,683 | |
| Total non-interest expense | | | 180,280 | | | 132,317 | |
| Income before provision for income taxes | | | 65,351 | | | 103,813 | |
| Provision for income taxes | | | 13,240 | | | 23,764 | |
| Net income | | $ | 52,111 | | $ | 80,049 | |
| Earnings per common share: | | | |
| Basic | | $ | 0.59 | | $ | 1.04 | |
| Diluted | | $ | 0.59 | | $ | 1.04 | |
| Weighted average common shares outstanding during the period: | |
| Basic | | | 88,016,190 | | | 77,159,356 | |
| Diluted | | | 88,253,361 | | | 77,448,290 | |
| Dividends paid per common share | | $ | 0.405 | | $ | 0.385 | |
| BROOKLINE BANCORP, INC. AND SUBSIDIARIES |
| Asset Quality Analysis (Unaudited) |
| | | At and for the Three Months Ended |
| | | September 30,
2023 | June 30,
2023 | March 31,
2023 | December 31,
2022 | September 30,
2022 |
| | | (Dollars in Thousands) |
| NONPERFORMING ASSETS: | | | | | | |
| Loans and leases accounted for on a nonaccrual basis: | | | | | | |
| Commercial real estate mortgage | | $ | 23,263 | | $ | 8,737 | | $ | 4,589 | | $ | 607 | | $ | 3,136 | |
| Multi-family mortgage | | | 1,318 | | | — | | | — | | | — | | | — | |
| Construction | | | 2,316 | | | 3,828 | | | 3,883 | | | 707 | | | — | |
| Total commercial real estate loans | | | 26,897 | | | 12,565 | | | 8,472 | | | 1,314 | | | 3,136 | |
| | | | | | | |
| Commercial | | | 5,406 | | | 16,023 | | | 5,495 | | | 464 | | | 618 | |
| Equipment financing | | | 13,974 | | | 12,809 | | | 9,908 | | | 9,653 | | | 10,544 | |
| Condominium association | | | — | | | — | | | 51 | | | 58 | | | 64 | |
| Total commercial loans and leases | | | 19,380 | | | 28,832 | | | 15,454 | | | 10,175 | | | 11,226 | |
| | | | | | | |
| Residential mortgage | | | 4,249 | | | 4,343 | | | 3,449 | | | 2,680 | | | 2,741 | |
| Home equity | | | 713 | | | 583 | | | 1,079 | | | 723 | | | 616 | |
| Other consumer | | | 2 | | | — | | | — | | | 2 | | | 2 | |
| Total consumer loans | | | 4,964 | | | 4,926 | | | 4,528 | | | 3,405 | | | 3,359 | |
| | | | | | | |
| Total nonaccrual loans and leases | | | 51,241 | | | 46,323 | | | 28,454 | | | 14,894 | | | 17,721 | |
| | | | | | | |
| Other repossessed assets | | | 299 | | | 602 | | | 508 | | | 408 | | | 591 | |
| Total nonperforming assets | | $ | 51,540 | | $ | 46,925 | | $ | 28,962 | | $ | 15,302 | | $ | 18,312 | |
| | | | | | | |
| Loans and leases past due greater than 90 days and still accruing | | $ | 1,175 | | $ | 490 | | $ | 726 | | $ | 33 | | $ | 9,583 | |
| | | | | | | |
| Nonperforming loans and leases as a percentage of total loans and leases | | | 0.55 | % | | 0.50 | % | | 0.31 | % | | 0.19 | % | | 0.24 | % |
| Nonperforming assets as a percentage of total assets | | | 0.46 | % | | 0.42 | % | | 0.25 | % | | 0.17 | % | | 0.21 | % |
| | | | | | | |
| PROVISION AND ALLOWANCE FOR LOAN AND LEASE LOSSES: | | | | | | | |
| Allowance for loan and lease losses at beginning of period | | $ | 125,817 | | $ | 120,865 | | $ | 98,482 | | $ | 94,169 | | $ | 93,188 | |
| Charge-offs | | | (10,978 | ) | | (1,690 | ) | | (845 | ) | | (658 | ) | | (598 | ) |
| Recoveries | | | 4 | | | 593 | | | 394 | | | 348 | | | 777 | |
| Net (charge-offs) recoveries | | | (10,974 | ) | | (1,097 | ) | | (451 | ) | | (310 | ) | | 179 | |
Provision (credit) for loan and lease losses
excluding unfunded commitments * | | | 4,238 | | | 6,049 | | | 22,834 | | | 4,623 | | | 802 | |
| Allowance for loan and lease losses at end of period | | $ | 119,081 | | $ | 125,817 | | $ | 120,865 | | $ | 98,482 | | $ | 94,169 | |
| | | | | | | |
| Allowance for loan and lease losses as a percentage of total loans and leases | | | 1.27 | % | | 1.35 | % | | 1.31 | % | | 1.29 | % | | 1.27 | % |
| | | | | | | |
| NET CHARGE-OFFS (RECOVERIES): | | | | | | |
| Commercial real estate loans | | $ | (3 | ) | $ | (6 | ) | $ | (6 | ) | $ | (6 | ) | $ | (6 | ) |
| Commercial loans and leases | | | 10,958 | | | 1,108 | | | 457 | | | 320 | | | (179 | ) |
| Consumer loans | | | 19 | | | (5 | ) | | — | | | (4 | ) | | 6 | |
| Total net charge-offs (recoveries) | | $ | 10,974 | | $ | 1,097 | | $ | 451 | | $ | 310 | | $ | (179 | ) |
| | | | | | | |
| Net loan and lease charge-offs as a percentage of average loans and leases (annualized) | | | 0.47 | % | | 0.05 | % | | 0.02 | % | | 0.02 | % | | (0.01 | )% |
| | | | | | | |
| *Provision for loan and lease losses does not include (credit) provision of $(1.3 million), $(0.3) million, $2.5 million, $1.0 million, and $2.0 million for credit losses on unfunded commitments during the three months ended September 30, 2023, June 30, 2023, March 31, 2023, December 31, 2022, and September 30, 2022, respectively. |
| BROOKLINE BANCORP, INC. AND SUBSIDIARIES |
| Average Yields / Costs (Unaudited) |
| | | Three Months Ended |
| | | September 30, 2023 | June 30, 2023 | September 30, 2022 |
| | | Average
Balance | Interest (1) | Average
Yield/ Cost | Average
Balance | Interest (1) | Average
Yield/ Cost | Average
Balance | Interest (1) | Average
Yield/ Cost |
| | | (Dollars in Thousands) |
| Assets: | | | | | | | | | | |
| Interest-earning assets: | | | | | | | | | | |
| Investments: | | | | | | | | | | |
| Debt securities (2) | | $ | 887,612 | $ | 6,840 | 3.08 | % | $ | 1,000,440 | $ | 8,091 | 3.23 | % | $ | 714,226 | $ | 3,337 | 1.87 | % |
| Marketable and restricted equity securities (2) | | | 67,824 | | 1,310 | 7.73 | % | | 77,364 | | 1,673 | 8.65 | % | | 36,525 | | 467 | 5.12 | % |
| Short-term investments | | | 172,483 | | 2,390 | 5.54 | % | | 229,474 | | 3,351 | 5.84 | % | | 66,257 | | 464 | 2.80 | % |
| Total investments | | | 1,127,919 | | 10,540 | 3.74 | % | | 1,307,278 | | 13,115 | 4.01 | % | | 817,008 | | 4,268 | 2.09 | % |
| Loans and Leases: | | | | | | | | | | |
| Commercial real estate loans (3) | | | 5,667,373 | | 78,750 | 5.44 | % | | 5,640,491 | | 79,582 | 5.58 | % | | 4,239,155 | | 44,729 | 4.13 | % |
| Commercial loans (3) | | | 939,492 | | 15,295 | 6.38 | % | | 913,732 | | 13,502 | 5.85 | % | | 731,095 | | 8,492 | 4.55 | % |
| Equipment financing (3) | | | 1,280,033 | | 23,331 | 7.29 | % | | 1,253,199 | | 22,357 | 7.14 | % | | 1,157,829 | | 19,042 | 6.58 | % |
| Consumer loans (3) | | | 1,471,985 | | 19,237 | 5.21 | % | | 1,482,799 | | 16,903 | 4.56 | % | | 1,206,968 | | 12,165 | 4.02 | % |
| Total loans and leases | | | 9,358,883 | | 136,613 | 5.84 | % | | 9,290,221 | | 132,344 | 5.70 | % | | 7,335,047 | | 84,428 | 4.60 | % |
| Total interest-earning assets | | | 10,486,802 | | 147,153 | 5.61 | % | | 10,597,499 | | 145,459 | 5.49 | % | | 8,152,055 | | 88,696 | 4.35 | % |
| Non-interest-earning assets | | | 693,833 | | | | 675,173 | | | | 434,365 | | |
| Total assets | | $ | 11,180,635 | | | $ | 11,272,672 | | | $ | 8,586,420 | | |
| | | | | | | | | | | |
| Liabilities and Stockholders' Equity: | | | | | | | | | | |
| Interest-bearing liabilities: | | | | | | | | | | |
| Deposits: | | | | | | | | | | |
| NOW accounts | | $ | 681,929 | | 1,159 | 0.67 | % | $ | 735,001 | | 1,069 | 0.58 | % | $ | 607,210 | | 579 | 0.38 | % |
| Savings accounts | | | 1,557,911 | | 8,859 | 2.26 | % | | 1,374,337 | | 5,917 | 1.73 | % | | 881,988 | | 664 | 0.30 | % |
| Money market accounts | | | 2,177,528 | | 15,785 | 2.88 | % | | 2,140,522 | | 13,989 | 2.62 | % | | 2,423,920 | | 4,038 | 0.66 | % |
| Certificates of deposit | | | 1,444,269 | | 12,128 | 3.33 | % | | 1,390,913 | | 10,021 | 2.89 | % | | 964,112 | | 1,803 | 0.74 | % |
| Brokered deposit accounts | | | 882,351 | | 11,185 | 5.03 | % | | 975,700 | | 12,151 | 5.00 | % | | 117,058 | | 270 | 0.92 | % |
| Total interest-bearing deposits | | | 6,743,988 | | 49,116 | 2.89 | % | | 6,616,473 | | 43,147 | 2.62 | % | | 4,994,288 | | 7,354 | 0.58 | % |
| Borrowings | | | | | | | | | | |
| Advances from the FHLBB | | | 954,989 | | 11,706 | 4.80 | % | | 1,191,424 | | 14,287 | 4.74 | % | | 331,840 | | 1,700 | 2.00 | % |
| Subordinated debentures and notes | | | 84,134 | | 1,378 | 6.55 | % | | 84,098 | | 1,363 | 6.49 | % | | 83,989 | | 1,295 | 6.17 | % |
| Other borrowed funds | | | 117,531 | | 790 | 2.67 | % | | 86,896 | | 523 | 2.41 | % | | 89,019 | | 268 | 1.20 | % |
| Total borrowings | | | 1,156,654 | | 13,874 | 4.69 | % | | 1,362,418 | | 16,173 | 4.70 | % | | 504,848 | | 3,263 | 2.53 | % |
| Total interest-bearing liabilities | | | 7,900,642 | | 62,990 | 3.16 | % | | 7,978,891 | | 59,320 | 2.98 | % | | 5,499,136 | | 10,617 | 0.77 | % |
| Non-interest-bearing liabilities: | | | | | | | | | | |
| Demand checking accounts | | | 1,794,225 | | | | 1,849,393 | | | | 1,908,459 | | |
| Other non-interest-bearing liabilities | | | 318,041 | | | | 270,221 | | | | 197,446 | | |
| Total liabilities | | | 10,012,908 | | | | 10,098,505 | | | | 7,605,041 | | |
| Stockholders’ equity | | | 1,167,727 | | | | 1,174,167 | | | | 981,379 | | |
| Total liabilities and equity | | $ | 11,180,635 | | | | | $ | 11,272,672 | | | | | $ | 8,586,420 | | |
| Net interest income (tax-equivalent basis) /Interest-rate spread (4) | | | | 84,163 | 2.45 | % | | | 86,139 | 2.51 | % | | | 78,079 | 3.58 | % |
| Less adjustment of tax-exempt income | | | | 93 | | | | 102 | | | | 53 | |
| Net interest income | | | $ | 84,070 | | | $ | 86,037 | | | $ | 78,026 | |
| Net interest margin (5) | | | | 3.18 | % | | | 3.26 | % | | | 3.80 | % |
| | | | | | | | | | | |
| (1) Tax-exempt income on debt securities, equity securities and revenue bonds included in commercial real estate loans is included on a tax-equivalent basis. |
| (2) Average balances include unrealized gains (losses) on investment securities. Dividend payments may not be consistent and average yield on equity securities may vary from month to month. |
| (3) Loans on nonaccrual status are included in the average balances. |
| (4) Interest rate spread represents the difference between the yield on interest-earning assets and the cost of interest-bearing liabilities. |
| (5) Net interest margin represents net interest income (tax-equivalent basis) divided by average interest-earning assets on an actual/actual basis. |
| BROOKLINE BANCORP, INC. AND SUBSIDIARIES |
| Average Yields / Costs (Unaudited) |
| | | Nine Months Ended |
| | | September 30, 2023 | September 30, 2022 |
| | | Average
Balance | Interest (1) | Average
Yield/ Cost | Average
Balance | Interest (1) | Average
Yield/ Cost |
| | | (Dollars in Thousands) |
| Assets: | | | | | | | |
| Interest-earning assets: | | | | | | | |
| Investments: | | | | | | | |
| Debt securities (2) | | $ | 971,855 | $ | 22,905 | 3.14 | % | $ | 720,266 | $ | 9,582 | 1.77 | % |
| Marketable and restricted equity securities (2) | | | 74,000 | | 4,238 | 7.64 | % | | 31,663 | | 1,132 | 4.77 | % |
| Short-term investments | | | 183,295 | | 7,236 | 5.26 | % | | 119,083 | | 686 | 0.77 | % |
| Total investments | | | 1,229,150 | | 34,379 | 3.73 | % | | 871,012 | | 11,400 | 1.75 | % |
| Loans and Leases: | | | | | | | |
| Commercial real estate loans (3) | | | 5,629,600 | | 225,999 | 5.29 | % | | 4,204,260 | | 119,723 | 3.76 | % |
| Commercial loans (3) | | | 915,420 | | 42,814 | 6.17 | % | | 727,333 | | 23,564 | 4.28 | % |
| Equipment financing (3) | | | 1,253,512 | | 66,901 | 7.12 | % | | 1,131,069 | | 54,951 | 6.48 | % |
| Consumer loans (3) | | | 1,469,025 | | 55,210 | 5.01 | % | | 1,191,294 | | 32,304 | 3.62 | % |
| Total loans and leases | | | 9,267,557 | | 390,924 | 5.62 | % | | 7,253,956 | | 230,542 | 4.24 | % |
| Total interest-earning assets | | | 10,496,707 | | 425,303 | 5.40 | % | | 8,124,968 | | 241,942 | 3.97 | % |
| Non-interest-earning assets | | | 698,273 | | | | 419,501 | | |
| Total assets | | $ | 11,194,980 | | | | | $ | 8,544,469 | | |
| | | | | | | | |
| Liabilities and Stockholders' Equity: | | | | | | | |
| Interest-bearing liabilities: | | | | | | | |
| Deposits: | | | | | | | |
| NOW accounts | | $ | 741,951 | | 3,129 | 0.56 | % | $ | 603,243 | | 898 | 0.20 | % |
| Savings accounts | | | 1,365,541 | | 17,290 | 1.69 | % | | 915,185 | | 1,073 | 0.16 | % |
| Money market accounts | | | 2,227,404 | | 41,914 | 2.52 | % | | 2,423,207 | | 7,681 | 0.42 | % |
| Certificates of deposit | | | 1,394,338 | | 29,605 | 2.84 | % | | 1,024,303 | | 5,345 | 0.70 | % |
| Brokered deposit accounts | | | 798,800 | | 29,693 | 4.97 | % | | 121,724 | | 410 | 0.45 | % |
| Total interest-bearing deposits | | | 6,528,034 | | 121,631 | 2.49 | % | | 5,087,662 | | 15,407 | 0.40 | % |
| Borrowings | | | | | | | |
| Advances from the FHLBB | | | 1,135,845 | | 40,524 | 4.70 | % | | 207,090 | | 2,376 | 1.51 | % |
| Subordinated debentures and notes | | | 84,098 | | 4,095 | 6.49 | % | | 83,952 | | 3,801 | 6.04 | % |
| Other borrowed funds | | | 120,825 | | 2,562 | 2.83 | % | | 108,337 | | 458 | 0.57 | % |
| Total borrowings | | | 1,340,768 | | 47,181 | 4.64 | % | | 399,379 | | 6,635 | 2.19 | % |
| Total interest-bearing liabilities | | | 7,868,802 | | 168,812 | 2.87 | % | | 5,487,041 | | 22,042 | 0.54 | % |
| Non-interest-bearing liabilities: | | | | | | | |
| Demand checking accounts | | | 1,857,429 | | | | 1,891,698 | | |
| Other non-interest-bearing liabilities | | | 301,543 | | | | 180,842 | | |
| Total liabilities | | | 10,027,774 | | | | 7,559,581 | | |
| Stockholders’ equity | | | 1,167,206 | | | | 984,888 | | |
| Total liabilities and equity | | $ | 11,194,980 | | | | | $ | 8,544,469 | | |
| Net interest income (tax-equivalent basis) /Interest-rate spread (4) | | | | 256,491 | 2.53 | % | | | 219,900 | 3.43 | % |
| Less adjustment of tax-exempt income | | | | 335 | | | | 159 | |
| Net interest income | | | $ | 256,156 | | | | | $ | 219,741 | |
| Net interest margin (5) | | | | 3.27 | % | | | 3.62 | % |
| | | | | | | | |
| (1) Tax-exempt income on debt securities, equity securities and revenue bonds included in commercial real estate loans is included on a tax-equivalent basis. |
| (2) Average balances include unrealized gains (losses) on investment securities. Dividend payments may not be consistent and average yield on equity securities may vary from month to month. |
| (3) Loans on nonaccrual status are included in the average balances. |
| (4) Interest rate spread represents the difference between the yield on interest-earning assets and the cost of interest-bearing liabilities. |
| (5) Net interest margin represents net interest income (tax-equivalent basis) divided by average interest-earning assets on an actual/actual basis. |
| BROOKLINE BANCORP, INC. AND SUBSIDIARIES |
| Non-GAAP Financial Information (Unaudited) |
| | At and for the Three Months Ended
September 30, | At and for the Nine Months Ended
September 30, |
| | | 2023 | | | 2022 | | | 2023 | | | 2022 | |
| Reconciliation Table - Non-GAAP Financial Information | (Dollars in Thousands Except Share Data) | (Dollars in Thousands Except Share Data) |
| | |
| Reported Pretax Income | $ | 28,868 | | $ | 37,066 | | $ | 65,351 | | $ | 103,813 | |
| Less: | | | | | |
| Security gains | | — | | | — | | | 1,704 | | | — | |
| Add: | | | | | |
| Day 1 PCSB CECL provision | | — | | | — | | | 16,744 | | | — | |
| Merger and acquisition expense | | — | | | 1,073 | | | 7,411 | | | 1,608 | |
| Operating Pretax Income | | $ | 28,868 | | $ | 38,139 | | $ | 87,802 | | $ | 105,421 | |
| Effective tax rate | | | 21.4 | % | | 18.7 | % | | 20.3 | % | | 22.9 | % |
| Provision for income taxes | | | 6,167 | | | 7,118 | | | 17,789 | | | 24,132 | |
| Operating earnings after tax | $ | 22,701 | | $ | 31,021 | | $ | 70,013 | | $ | 81,289 | |
| | | | | | |
| Operating earnings per common share: | | | | | |
| Basic | | $ | 0.26 | | $ | 0.40 | | $ | 0.80 | | $ | 1.05 | |
| Diluted | | $ | 0.26 | | $ | 0.40 | | $ | 0.79 | | $ | 1.05 | |
| | | | | | |
| Weighted average common shares outstanding during the period: | | | | |
| Basic | | | 88,795,270 | | | 76,779,038 | | | 88,016,190 | | | 77,159,356 | |
| Diluted | | | 88,971,210 | | | 77,007,971 | | | 88,253,361 | | | 77,448,290 | |
| | | | | | |
| | | | | | |
| Return on average assets * | | 0.81 | % | | 1.40 | % | | 0.62 | % | | 1.25 | % |
| Less: | | | | | |
| Security gains (after-tax) * | | — | % | | — | % | | 0.02 | % | | — | % |
| Add: | | | | | |
| Day 1 PCSB CECL provision * | | — | % | | — | % | | 0.16 | % | | — | % |
| Merger and acquisition expense (after-tax) * | | — | % | | 0.04 | % | | 0.07 | % | | 0.02 | % |
| Operating return on average assets * | | 0.81 | % | | 1.44 | % | | 0.83 | % | | 1.27 | % |
| | | | | | |
| | | | | | |
| Return on average tangible assets * | | 0.83 | % | | 1.43 | % | | 0.64 | % | | 1.27 | % |
| Less: | | | | | |
| Security gains (after-tax) * | | — | % | | — | % | | 0.02 | % | | — | % |
| Add: | | | | | |
| Day 1 PCSB CECL provision * | | — | % | | — | % | | 0.16 | % | | — | % |
| Merger and acquisition expense (after-tax) * | | — | % | | 0.04 | % | | 0.07 | % | | 0.02 | % |
| Operating return on average tangible assets * | | 0.83 | % | | 1.47 | % | | 0.85 | % | | 1.29 | % |
| | | | | | |
| | | | | | |
| Return on average stockholders' equity * | | 7.78 | % | | 12.29 | % | | 5.95 | % | | 10.84 | % |
| Less: | | | | | |
| Security gains (after-tax) * | | — | % | | — | % | | 0.16 | % | | — | % |
| Add: | | | | | |
| Day 1 PCSB CECL provision * | | — | % | | — | % | | 1.53 | % | | — | % |
| Merger and acquisition expense (after-tax) * | | — | % | | 0.36 | % | | 0.68 | % | | 0.17 | % |
| Operating return on average stockholders' equity * | | 7.78 | % | | 12.65 | % | | 8.00 | % | | 11.01 | % |
| | | | | | |
| | | | | | |
| Return on average tangible stockholders' equity * | | 10.09 | % | | 14.72 | % | | 7.76 | % | | 12.98 | % |
| Less: | | | | | |
| Security gains (after-tax) * | | — | % | | — | % | | 0.20 | % | | — | % |
| Add: | | | | | |
| Day 1 PCSB CECL provision * | | — | % | | — | % | | 1.99 | % | | — | % |
| Merger and acquisition expense (after-tax) * | | — | % | | 0.43 | % | | 0.88 | % | | 0.20 | % |
| Operating return on average tangible stockholders' equity * | | 10.09 | % | | 15.15 | % | | 10.43 | % | | 13.18 | % |
| | | | | | |
* Ratios at and for the three and nine months ended are annualized.
|
| |
| | At and for the Three Months Ended |
| | September 30,
2023 | June 30,
2023 | March 31,
2023 | December 31,
2022 | September 30,
2022 |
| | (Dollars in Thousands) |
| |
| Net income, as reported | $ | 22,701 | | $ | 21,850 | | $ | 7,560 | | $ | 29,695 | | $ | 30,149 | |
| | | | | | |
| Average total assets | $ | 11,180,635 | | $ | 11,272,672 | | $ | 11,131,087 | | $ | 8,857,631 | | $ | 8,586,420 | |
| Less: Average goodwill and average identified intangible assets, net | | 268,199 | | | 270,147 | | | 278,135 | | | 162,266 | | | 162,387 | |
| Average tangible assets | $ | 10,912,436 | | $ | 11,002,525 | | $ | 10,852,952 | | $ | 8,695,365 | | $ | 8,424,033 | |
| | | | | | |
| Return on average tangible assets (annualized) | | 0.83 | % | | 0.79 | % | | 0.28 | % | | 1.37 | % | | 1.43 | % |
| | | | | | |
| Average total stockholders’ equity | $ | 1,167,727 | | $ | 1,174,167 | | $ | 1,159,635 | | $ | 982,306 | | $ | 981,379 | |
| Less: Average goodwill and average identified intangible assets, net | | 268,199 | | | 270,147 | | | 278,135 | | | 162,266 | | | 162,387 | |
| Average tangible stockholders’ equity | $ | 899,528 | | $ | 904,020 | | $ | 881,500 | | $ | 820,040 | | $ | 818,992 | |
| | | | | | |
| Return on average tangible stockholders’ equity (annualized) | | 10.09 | % | | 9.67 | % | | 3.43 | % | | 14.48 | % | | 14.72 | % |
| | | | | | |
| Total stockholders’ equity | $ | 1,157,871 | | $ | 1,162,308 | | $ | 1,165,066 | | $ | 992,125 | | $ | 963,618 | |
| Less: | | | | | |
| Goodwill | | 241,222 | | | 241,222 | | | 241,222 | | | 160,427 | | | 160,427 | |
| Identified intangible assets, net | | 26,172 | | | 28,126 | | | 30,080 | | | 1,781 | | | 1,902 | |
| Tangible stockholders' equity | $ | 890,477 | | $ | 892,960 | | $ | 893,764 | | $ | 829,917 | | $ | 801,289 | |
| | | | | | |
| Total assets | $ | 11,180,555 | | $ | 11,206,078 | | $ | 11,522,485 | | $ | 9,185,836 | | $ | 8,695,708 | |
| Less: | | | | | |
| Goodwill | | 241,222 | | | 241,222 | | | 241,222 | | | 160,427 | | | 160,427 | |
| Identified intangible assets, net | | 26,172 | | | 28,126 | | | 30,080 | | | 1,781 | | | 1,902 | |
| Tangible assets | $ | 10,913,161 | | $ | 10,936,730 | | $ | 11,251,183 | | $ | 9,023,628 | | $ | 8,533,379 | |
| | | | | | |
| Tangible stockholders’ equity to tangible assets | | 8.16 | % | | 8.16 | % | | 7.94 | % | | 9.20 | % | | 9.39 | % |
| | | | | | |
| Tangible stockholders' equity | $ | 890,477 | | $ | 892,960 | | $ | 893,764 | | $ | 829,917 | | $ | 801,289 | |
| | | | | | |
| Number of common shares issued | | 96,998,075 | | | 96,998,075 | | | 96,998,075 | | | 85,177,172 | | | 85,177,172 | |
| Less: | | | | | |
| Treasury shares | | 7,350,981 | | | 7,734,891 | | | 7,734,891 | | | 7,731,445 | | | 7,730,945 | |
| Unallocated ESOP shares | | — | | | — | | | — | | | — | | | 4,833 | |
| Unvested restricted shares | | 780,859 | | | 598,049 | | | 598,049 | | | 601,495 | | | 601,995 | |
| Number of common shares outstanding | | 88,866,235 | | | 88,665,135 | | | 88,665,135 | | | 76,844,232 | | | 76,839,399 | |
| | | | | | |
| Tangible book value per common share | $ | 10.02 | | $ | 10.07 | | $ | 10.08 | | $ | 10.80 | | $ | 10.43 | |
| | | | | | | | | | | | | | | | |
PDF Available: http://ml.globenewswire.com/Resource/Download/c6ac4fa8-5a96-44a5-8af8-720ca790c975
Exhibit 99.2

October 25, 2023 1 3Q 2023 Financial Results
Forward Looking Statements 2 Certain statements contained in this press release that are not historical facts may constitute forward - looking statements within the meaning of Section 27A of the Securities Act of 1933, as amended, and Section 21E of the Securities Exchange Act of 1934, as amended, and are intended to be covered by the safe harbor provisions of the Private Securities Litigation Reform Act of 1995. We may also make forward - looking statements in other documents we file with the Securities and Exchange Commission ("SEC"), in our annual reports to shareholders, in press releases and other written materials, and in oral statements made by our officers, directors or employees. You can identify forward looking statements by the use of the words “believe,” “expect,” “anticipate,” “intend,” “estimate,” “assume,” “outlook,” “will,” “should,” and other expressions that predict or indicate future events and trends and which do not relate to historical matters, including statements regarding the Company’s business, credit quality, financial condition, liquidity and results of operations. Forward - looking statements may differ, possibly materially, from what is included in this press release due to factors and future developments that are uncertain and beyond the scope of the Company’s control. These include, but are not limited to, the Company’s ability to achieve the synergies and value creation contemplated by the acquisition of PCSB; turbulence in the capital and debt markets; changes in interest rates and concerns about liquidity; competitive pressures from other financial institutions; general economic conditions (including inflation) on a national basis or in the local markets in which the Company operates; changes in consumer behavior due to changing political, business and economic conditions, or legislative or regulatory initiatives; changes in the value of securities and other assets in the Company’s investment portfolio; increases in loan and lease default and charge - off rates; the adequacy of allowances for loan and lease losses; decreases in deposit levels that necessitate increases in borrowing to fund loans and investments; operational risks including, but not limited to, cybersecurity incidents, fraud, natural disasters, and future pandemics; changes in regulation; the possibility that future credit losses may be higher than currently expected due to changes in economic assumptions and adverse economic developments; the risk that goodwill and intangibles recorded in the Company’s financial statements will become impaired; and changes in assumptions used in making such forward - looking statements. Forward - looking statements involve risks and uncertainties which are difficult to predict. The Company’s actual results could differ materially from those projected in the forward - looking statements as a result of, among others, the risks outlined in the Company’s Annual Report on Form 10 - K, as updated by its Quarterly Reports on Form 10 - Q and other filings submitted to the SEC. The Company does not undertake any obligation to update any forward - looking statement to reflect circumstances or events that occur after the date the forward - looking statements are made.
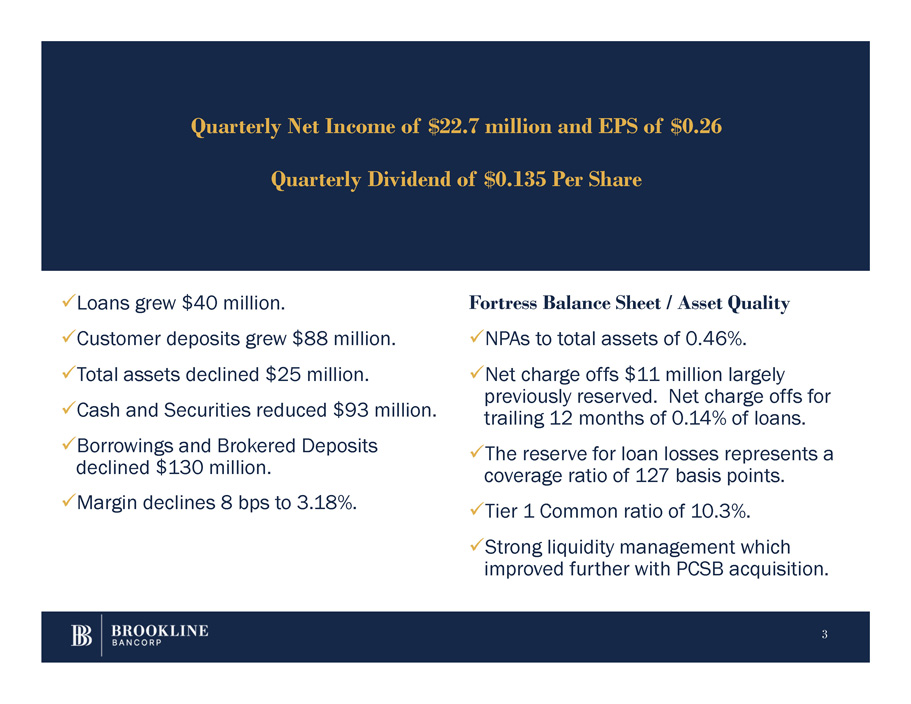
x Loans grew $40 million. x Customer deposits grew $88 million. x Total assets declined $25 million. x Cash and Securities reduced $93 million. x Borrowings and Brokered Deposits declined $130 million. x Margin declines 8 bps to 3.18%. 3 Fortress Balance Sheet / Asset Quality x NPAs to total assets of 0.46%. x Net charge offs $11 million largely previously reserved. Net charge offs for trailing 12 months of 0.14% of loans. x The reserve for loan losses represents a coverage ratio of 127 basis points. x Tier 1 Common ratio of 10.3%. x Strong liquidity management which improved further with PCSB acquisition. Quarterly Net Income of $22.7 million and EPS of $0.26 Quarterly Dividend of $0.135 Per Share
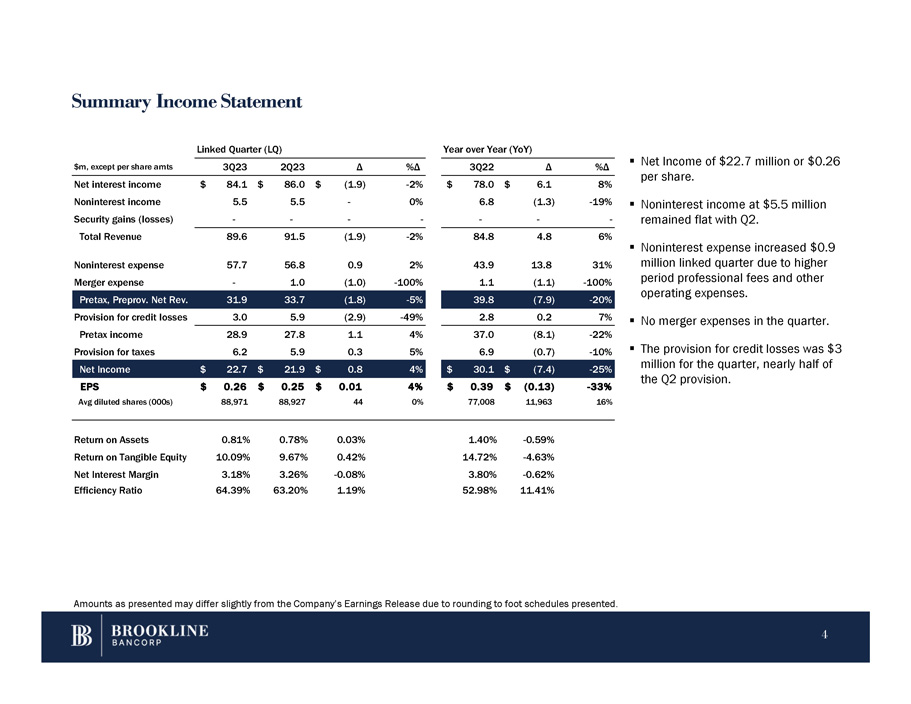
Summary Income Statement ▪ Net Income of $22.7 million or $0.26 per share. ▪ Noninterest income at $5.5 million remained flat with Q2. Noninterest expense increased $0.9 million linked quarter due to higher period professional fees and other operating expenses. ▪ No merger expenses in the quarter. million for the quarter, nearly half of the Q2 provision. %Δ Δ 3Q22 %Δ Δ 2Q23 3Q23 $m, except per share amts 8% $ 6.1 $ 78.0 - 2% $ (1.9) $ 86.0 $ 84.1 Net interest income - 19% (1.3) 6.8 0% - 5.5 5.5 Noninterest income - - - - - - Security gains (losses) - 6% 4.8 84.8 - 2% (1.9) 91.5 Total Revenue 89.6 ▪ 31% 13.8 43.9 2% 0.9 56.8 57.7 Noninterest expense - 100% (1.1) 1.1 - 100% (1.0) 1.0 - Merger expense - 20% (7.9) 39.8 - 5% (1.8) 33.7 31.9 Pretax, Preprov. Net Rev. 7% 0.2 2.8 - 49% (2.9) 5.9 3.0 Provision for credit losses - 22% (8.1) 37.0 4% 1.1 27.8 28.9 Pretax income ▪ The provision for credit losses was $3 - 10% (0.7) 6.9 5% 0.3 5.9 6.2 Provision for taxes - 25% $ (7.4) $ 30.1 4% $ 0.8 $ 21.9 $ 22.7 Net Income - 33% $ (0.13) $ 0.39 4% $ 0.01 $ 0.25 $ 0.26 EPS 16% 11,963 77,008 0% 44 88,927 88,971 Avg diluted shares (000s) - 0.59% 1.40% 0.03% 0.78% 0.81% Return on Assets - 4.63% 14.72% 0.42% 9.67% 10.09% Return on Tangible Equity - 0.62% 3.80% - 0.08% 3.26% 3.18% Net Interest Margin 11.41% 52.98% 1.19% 63.20% 64.39% Efficiency Ratio Linked Quarter (LQ) Year over Year (YoY) Amounts as presented may differ slightly from the Company’s Earnings Release due to rounding to foot schedules presented. 4
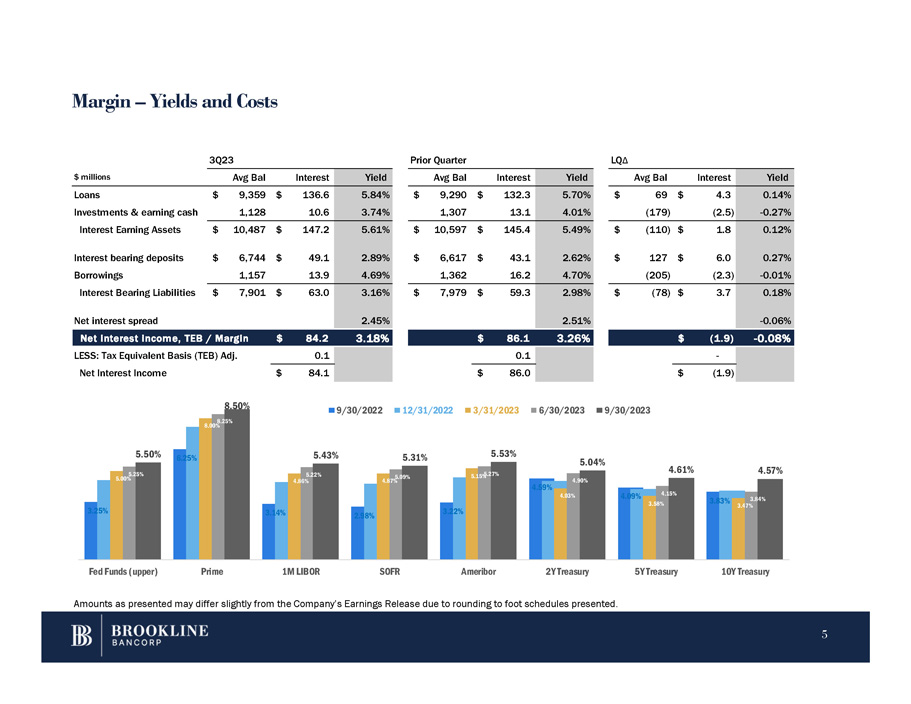
Margin – Yields and Costs LQ Δ Prior Quarter 3Q23 Yield Interest Avg Bal Yield Interest Avg Bal Yield Interest Avg Bal $ millions 0.14% $ 4.3 $ 69 5.70% $ 132.3 $ 9,290 5.84% $ 136.6 $ 9,359 Loans - 0.27% (2.5) (179) 4.01% 13.1 1,307 3.74% 10.6 1,128 Investments & earning cash 0.12% $ 1.8 $ (110) 5.49% $ 145.4 $ 10,597 5.61% $ 147.2 $ 10,487 Interest Earning Assets 0.27% $ 6.0 $ 127 2.62% $ 43.1 $ 6,617 2.89% $ 49.1 $ 6,744 Interest bearing deposits - 0.01% (2.3) (205) 4.70% 16.2 1,362 4.69% 13.9 1,157 Borrowings 0.18% $ 3.7 $ (78) 2.98% $ 59.3 $ 7,979 3.16% $ 63.0 $ 7,901 Interest Bearing Liabilities - 0.06% 2.51% 2.45% Net interest spread - 0.08% $ (1.9) 3.26% $ 86.1 3.18% $ 84.2 Net interest income, TEB / Margin - 0.1 0.1 LESS: Tax Equivalent Basis (TEB) Adj. (1.9) $ 86.0 $ 84.1 $ Net Interest Income 3.25% 6.25% 3.14% 2.98% 3.22% 4.59% 4.09% 3.83% 5.00% 8.00% 4.86% 4.87% 4.03% 3.58% 3.47% 5.25% 8.25% 5.22% 5.09% 5.15% 5.27% 4.90% 4.15% 3.84% 5.50% 8.50% 5.43% 5.31% 5.53% 5.04% 4.61% 4.57% Fed Funds (upper) Prime 1M LIBOR SOFR Ameribor 2Y Treasury 5Y Treasury 10Y Treasury 9/30/2022 12/31/2022 3/31/2023 6/30/2023 9/30/2023 Amounts as presented may differ slightly from the Company’s Earnings Release due to rounding to foot schedules presented. 5
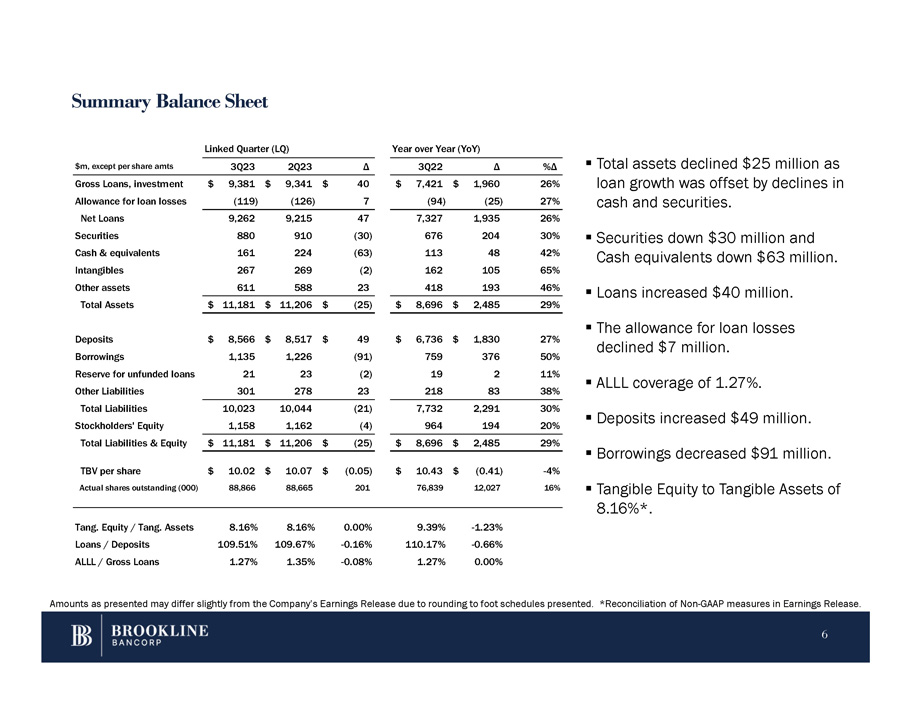
Summary Balance Sheet ▪ Total assets declined $25 million as %Δ Δ 3Q22 Δ 2Q23 3Q23 $m, except per share amts loan growth was offset by declines in 26% $ 1,960 $ 7,421 $ 40 $ 9,341 $ 9,381 Gross Loans, investment cash and securities. 27% (25) (94) 7 (126) (119) Allowance for loan losses 26% 1,935 7,327 47 9,215 9,262 Net Loans ▪ Securities down $30 million and Cash equivalents down $63 million. ▪ Loans increased $40 million. ▪ The allowance for loan losses declined $7 million. ▪ ALLL coverage of 1.27%. ▪ Deposits increased $49 million. ▪ Borrowings decreased $91 million. ▪ Tangible Equity to Tangible Assets of 8.16%*. 30% 204 676 (30) 910 880 Securities 42% 48 113 (63) 224 161 Cash & equivalents 65% 105 162 (2) 269 267 Intangibles 46% 193 418 23 588 611 Other assets 29% $ 2,485 $ 8,696 $ (25) $ 11,206 $ 11,181 Total Assets 27% $ 1,830 $ 6,736 $ 49 $ 8,517 $ 8,566 Deposits 50% 376 759 (91) 1,226 1,135 Borrowings 11% 2 19 (2) 23 21 Reserve for unfunded loans 38% 83 218 23 278 301 Other Liabilities 30% 2,291 7,732 (21) 10,044 10,023 Total Liabilities 20% 194 964 (4) 1,162 1,158 Stockholders' Equity 29% $ 2,485 $ 8,696 $ (25) $ 11,206 $ 11,181 Total Liabilities & Equity - 4% $ (0.41) $ 10.43 $ (0.05) $ 10.07 $ 10.02 TBV per share 16% 12,027 76,839 201 88,665 88,866 Actual shares outstanding (000) - 1.23% 9.39% 0.00% 8.16% 8.16% Tang. Equity / Tang. Assets - 0.66% 110.17% - 0.16% 109.67% 109.51% Loans / Deposits 0.00% 1.27% - 0.08% 1.35% 1.27% ALLL / Gross Loans Linked Quarter (LQ) Year over Year (YoY) Amounts as presented may differ slightly from the Company’s Earnings Release due to rounding to foot schedules presented. *Reconciliation of Non - GAAP measures in Earnings Release. 6
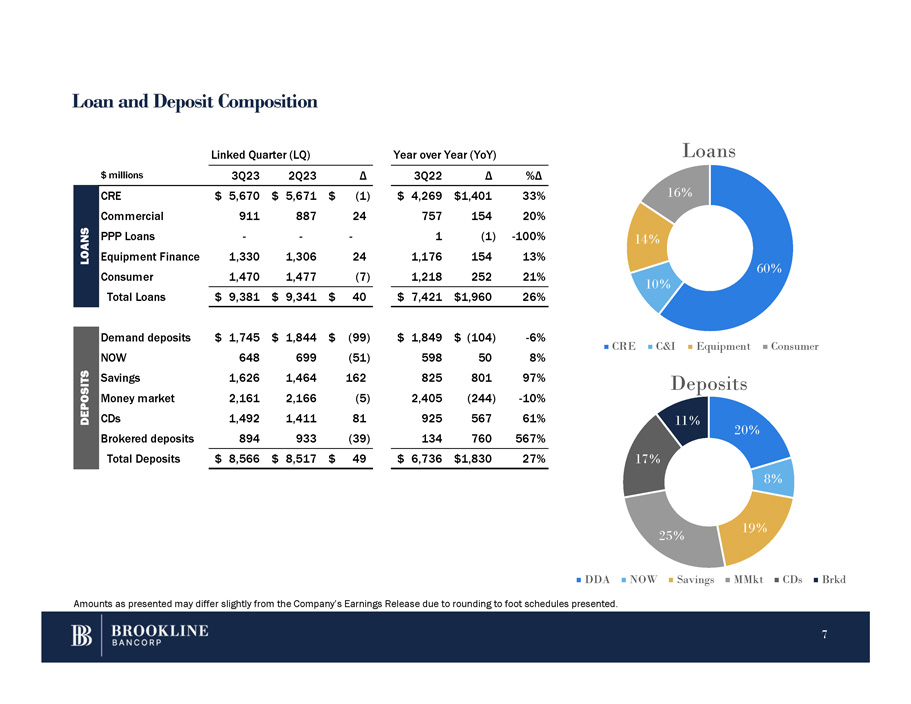
Loan and Deposit Composition 60% 10% 14% 16% Loans 20% 8% 19% 25% 17% 11% CRE C&I Equipment Consumer Deposits DDA NOW Savings MMkt CDs Brkd Amounts as presented may differ slightly from the Company’s Earnings Release due to rounding to foot schedules presented. $ millions Δ %Δ $ 5,670 911 $ 5,671 $ (1) 887 24 $ 4,269 757 1 1,176 1,218 $1,401 33% 154 20% (1) - 100% 154 13% 252 21% Year over Year (YoY) 3Q22 Δ - - - 1,330 1,470 1,306 1,477 24 (7) CRE Commercial PPP Loans Equipment Finance Consumer Total Loans $ 9,381 $ 9,341 $ 40 Linked Quarter (LQ) 3Q23 2Q23 $ 7,421 $1,960 26% Demand deposits NOW Savings Money market CDs Brokered deposits Total Deposits $ 1,745 648 1,626 2,161 1,492 894 $ 1,844 $ (99) 699 (51) 1,464 162 2,166 (5) 1,411 81 933 (39) $ 1,849 $ (104) - 6% 598 50 8% 825 801 97% 2,405 (244) - 10% 925 567 61% 134 760 567% $ 8,566 $ 8,517 $ 49 $ 6,736 $1,830 27% LOANS DEPOSITS 7
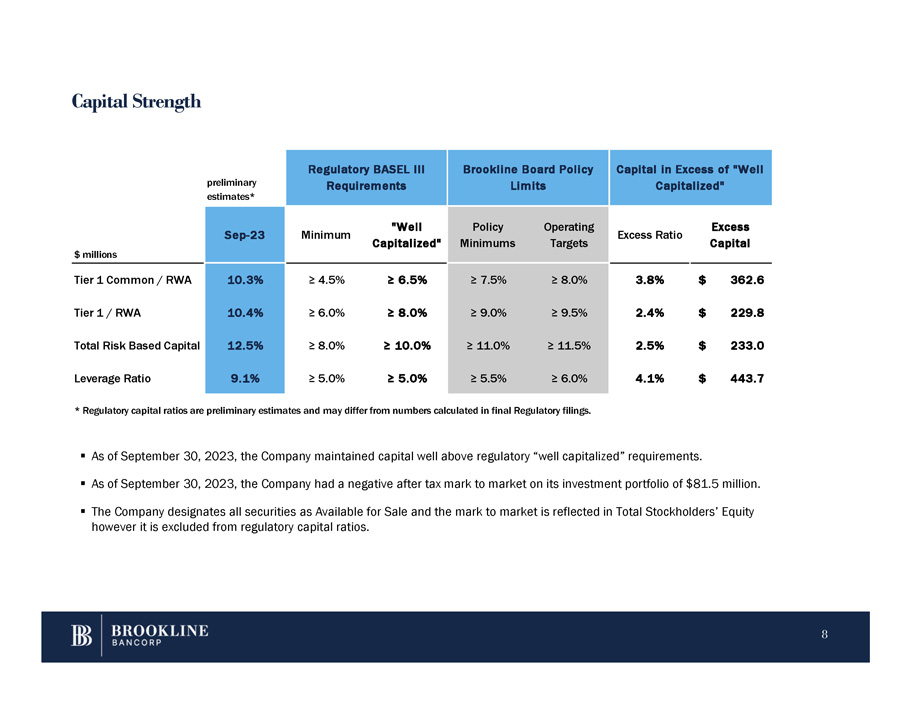
Capital Strength 8 ▪ As of September 30, 2023, the Company maintained capital well above regulatory “well capitalized” requirements. ▪ As of September 30, 2023, the Company had a negative after tax mark to market on its investment portfolio of $81.5 million. ▪ The Company designates all securities as Available for Sale and the mark to market is reflected in Total Stockholders’ Equity however it is excluded from regulatory capital ratios. Capital in Excess of "Well Capitalized" Brookline Board Policy Limits Regulatory BASEL III Requirements preliminary estimates* Excess Capital Excess Ratio Operating Targets Policy Minimums "Well Capitalized" Minimum Sep - 23 $ millions $ 362.6 3.8% ≥ 8.0% ≥ 7.5% ≥ 6.5% ≥ 4.5% 10.3% Tier 1 Common / RWA $ 229.8 2.4% ≥ 9.5% ≥ 9.0% ≥ 8.0% ≥ 6.0% 10.4% Tier 1 / RWA $ 233.0 2.5% ≥ 11.5% ≥ 11.0% ≥ 10.0% ≥ 8.0% 12.5% Total Risk Based Capital $ 443.7 4.1% ≥ 6.0% ≥ 5.5% ≥ 5.0% ≥ 5.0% 9.1% Leverage Ratio * Regulatory capital ratios are preliminary estimates and may differ from numbers calculated in final Regulatory filings.
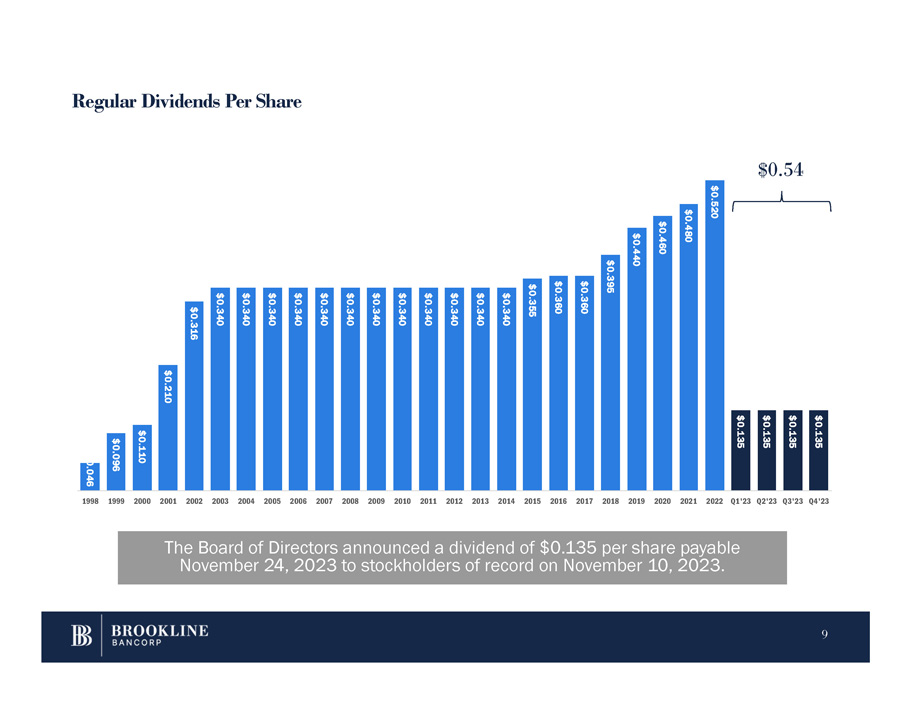
Regular Dividends Per Share The Board of Directors announced a dividend of $0.135 per share payable November 24, 2023 to stockholders of record on November 10, 2023. $0.046 $0.096 $0.110 $0.210 $0.316 $0.340 $0.340 $0.340 $0.340 $0.340 $0.340 $0.340 $0.340 $0.340 $0.340 $0.340 $0.340 $0.355 $0.360 $0.360 $0.395 $0.440 $0.460 $0.480 $0.520 $0.135 $0.135 $0.135 $0.135 1998 1999 2000 2001 2002 2003 2004 2005 2006 2007 2008 2009 2010 2011 2012 2013 2014 2015 2016 2017 2018 2019 2020 2021 2022 Q1'23 Q2'23 Q3'23 Q4'23 $0.54 9

QUESTIONS Paul A. Perrault, Chairman and Chief Executive Officer Carl M. Carlson, Co - President and Chief Financial Officer Thank You. 10
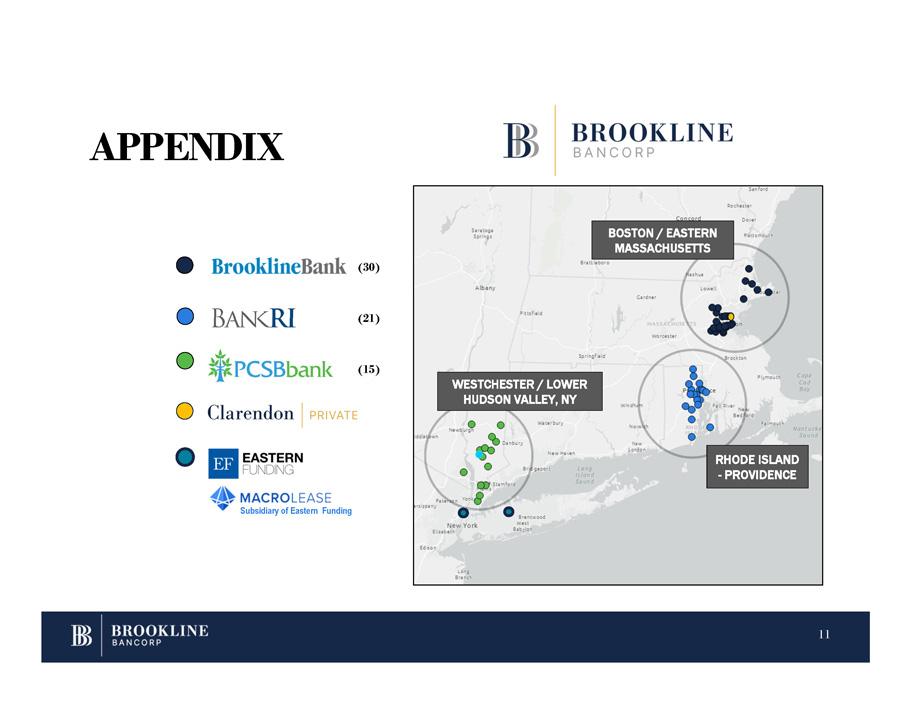
APPENDIX RHODE ISLAND - PROVIDENCE BOSTON / EASTERN MASSACHUSETTS (15) WESTCHESTER / LOWER HUDSON VALLEY, NY (30) (21) Subsidiary of Eastern Funding 11
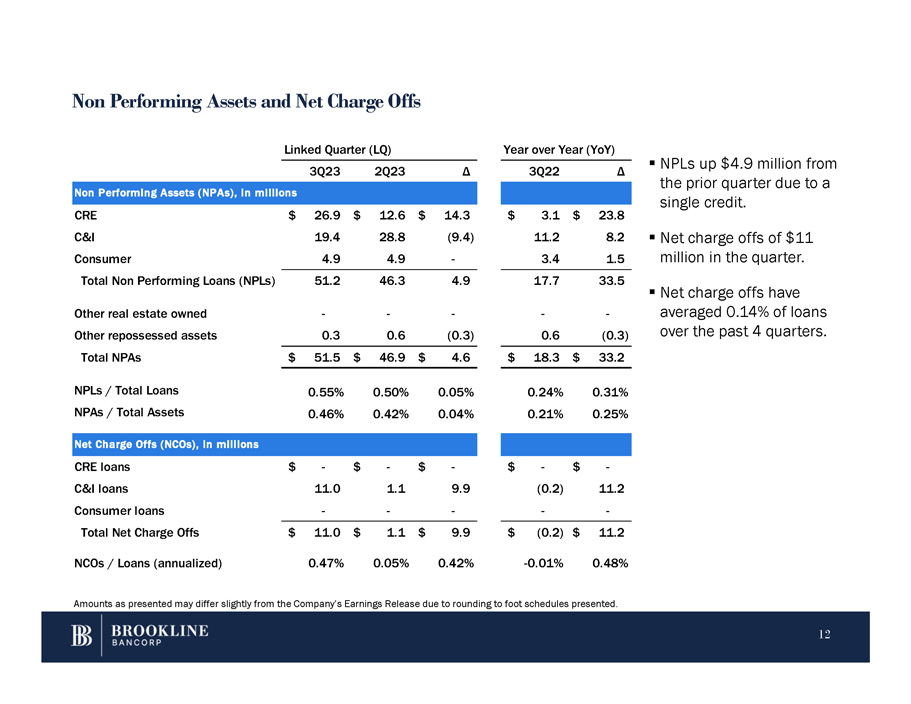
Non Performing Assets and Net Charge Offs ▪ Net charge offs of $11 8.2 11.2 (9.4) 28.8 19.4 C&I million in the quarter. 1.5 3.4 - 4.9 4.9 Consumer 33.5 17.7 4.9 46.3 51.2 Total Non Performing Loans (NPLs) ▪ Net charge offs have averaged 0.14% of loan - - - - - Other real estate owned over the past 4 quarter (0.3) 0.6 (0.3) 0.6 0.3 Other repossessed assets $ 33.2 $ 18.3 $ 4.6 $ 46.9 $ 51.5 Total NPAs 0.31% 0.24% 0.05% 0.50% 0.55% NPLs / Total Loans 0.25% 0.21% 0.04% 0.42% 0.46% NPAs / Total Assets Net Charge Offs (NCOs), in millions $ - $ - $ - $ - $ - CRE loans 11.2 (0.2) 9.9 1.1 11.0 C&I loans - - - - - Consumer loans $ 11.2 $ (0.2) $ 9.9 $ 1.1 $ 11.0 Total Net Charge Offs 0.48% - 0.01% 0.42% 0.05% 0.47% NCOs / Loans (annualized) Linked Quarter (LQ) 3Q23 2Q23 Δ Year over Year (YoY) 3Q22 Δ Non Performing Assets (NPAs), in millions CRE $ 26.9 $ 12.6 $ 14.3 $ 3.1 $ 23.8 Amounts as presented may differ slightly from the Company’s Earnings Release due to rounding to foot schedules presented. 12 ▪ NPLs up $4.9 million from the prior quarter due to a single credit. s s.
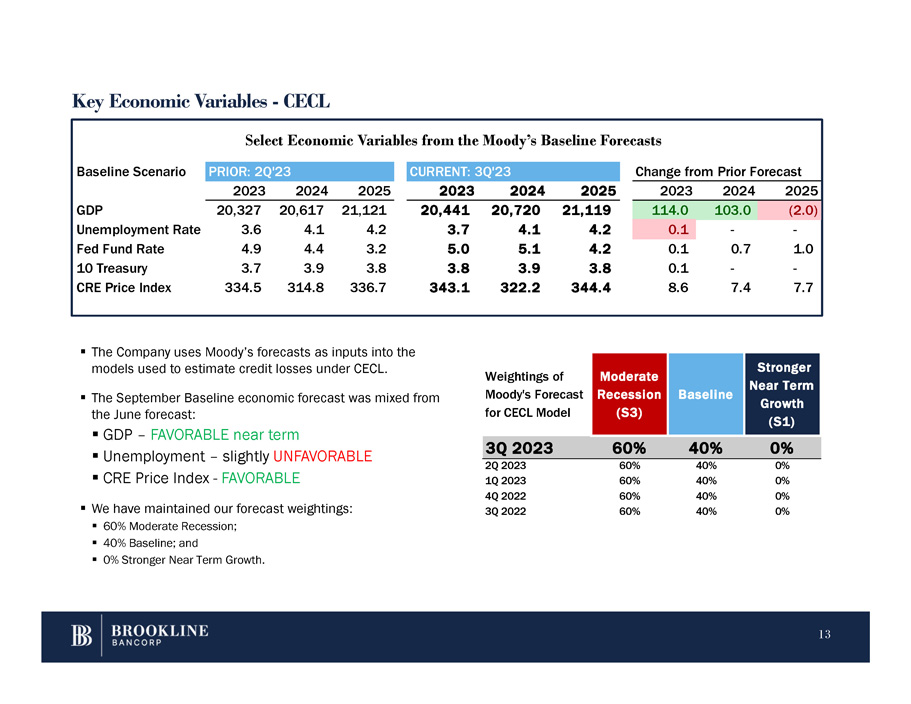
Key Economic Variables - CECL Select Economic Variables from the Moody’s Baseline Forecasts ▪ The Company uses Moody’s forecasts as inputs into the models used to estimate credit losses under CECL. ▪ The September Baseline economic forecast was mixed from the June forecast: ▪ GDP – FAVORABLE near term ▪ Unemployment – slightly UNFAVORABLE ▪ CRE Price Index - FAVORABLE ▪ We have maintained our forecast weightings: ▪ 60% Moderate Recession; ▪ 40% Baseline; and ▪ 0% Stronger Near Term Growth. om Prior Forecast Change fr Q'23 CURRENT: 3 '23 PRIOR: 2Q Baseline Scenario 2025 2024 2023 2025 2024 2023 2025 2024 2023 (2.0) 103.0 114.0 21,119 20,720 20,441 21,121 20,617 20,327 GDP - - 0.1 4.2 4.1 3.7 4.2 4.1 3.6 Unemployment Rate 1.0 0.7 0.1 4.2 5.1 5.0 3.2 4.4 4.9 Fed Fund Rate - - 0.1 3.8 3.9 3.8 3.8 3.9 3.7 10 Treasury 7.7 7.4 8.6 344.4 322.2 343.1 336.7 314.8 334.5 CRE Price Index 13 Stronger Near Term Growth (S1) Baseline Moderate Recession (S3) Weightings of Moody's Forecast for CECL Model 3Q 2023 60% 40% 0% 0% 40% 60% 2Q 2023 0% 40% 60% 1Q 2023 0% 40% 60% 4Q 2022 0% 40% 60% 3Q 2022
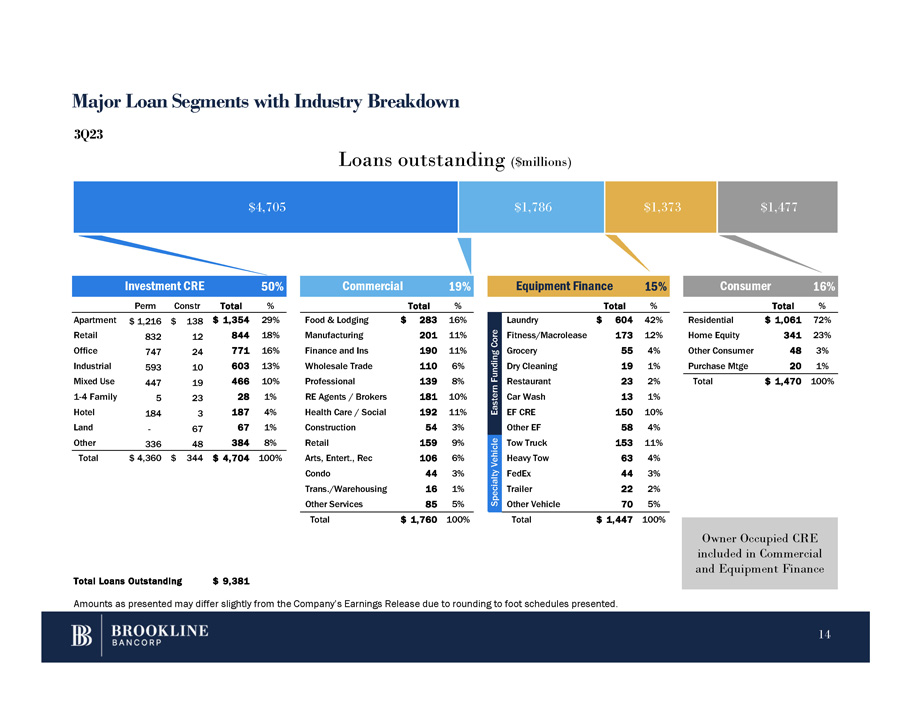
Investment CRE 50% Commercial 19% Equipment Finance 15% Consumer 16% Perm Constr Total % Total % Total % Total % Food & Lodging Manufacturing Finance and Ins Wholesale Trade Professional RE Agents / Brokers Health Care / Social Construction Retail Arts, Entert., Rec Condo Trans./Warehousing Other Services $ 283 16% 201 11% 190 11% 110 6% 139 8% 181 10% 192 11% 54 3% 159 9% 106 6% 44 3% 16 1% 85 5% Residential Home Equity Other Consumer Purchase Mtge $ 1,061 72% 341 23% 48 3% 20 1% Total $ 1,470 100% - Apartment Retail Office Industrial Mixed Use 1 - 4 Family Hotel Land Other 336 $ 1,216 $ 138 832 12 747 24 593 10 447 19 5 23 184 3 67 48 $ 1,354 29% 844 18% 771 16% 603 13% 466 10% 28 1% 187 4% 67 1% 384 8% Total $ 4,360 $ 344 $ 4,704 100% Total $ 1,760 100% Total $ 1,447 100% 42% $ 604 Laundry Eastern Funding Core 12% 173 Fitness/Macrolease 4% 55 Grocery 1% 19 Dry Cleaning 2% 23 Restaurant 1% 13 Car Wash 10% 150 EF CRE 4% 58 Other EF 11% 153 Tow Truck Specialty Vehicle 4% 63 Heavy Tow 3% 44 FedEx 2% 22 Trailer 5% 70 Other Vehicle Total Loans Outstanding $ 9,381 Amounts as presented may differ slightly from the Company’s Earnings Release due to rounding to foot schedules presented. Major Loan Segments with Industry Breakdown $4,705 $1,786 $1,373 $1,477 3Q23 Loans outstanding ($millions) Owner Occupied CRE included in Commercial and Equipment Finance 14
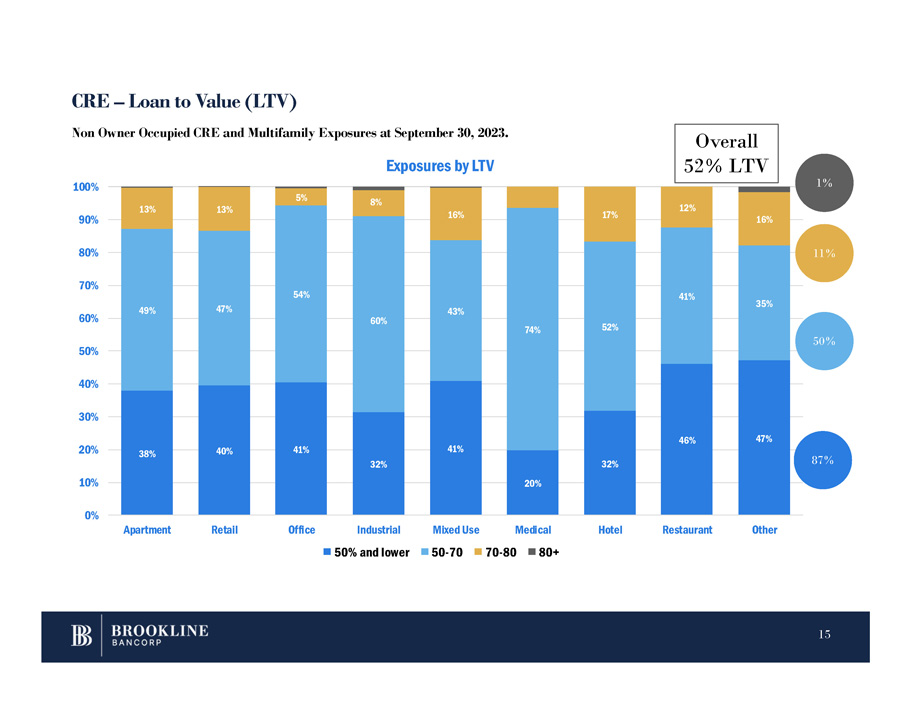
CRE – Loan to Value (LTV) 38% 40% 41% 32% 41% 20% 32% 46% 47% 49% 47% 54% 60% 43% 74% 52% 41% 35% 13% 13% 5% 8% 16% 17% 12% 16% 0% 10% 20% 30% 40% 50% 60% 70% 80% 90% 100% Apartment Retail Office Medical Hotel Restaurant Other Exposures by LTV Industrial 50% and lower Mixed Use 50 - 70 70 - 80 80+ Non Owner Occupied CRE and Multifamily Exposures at September 30, 2023. 87% 50% 1% 11% Overall 52% LTV 15
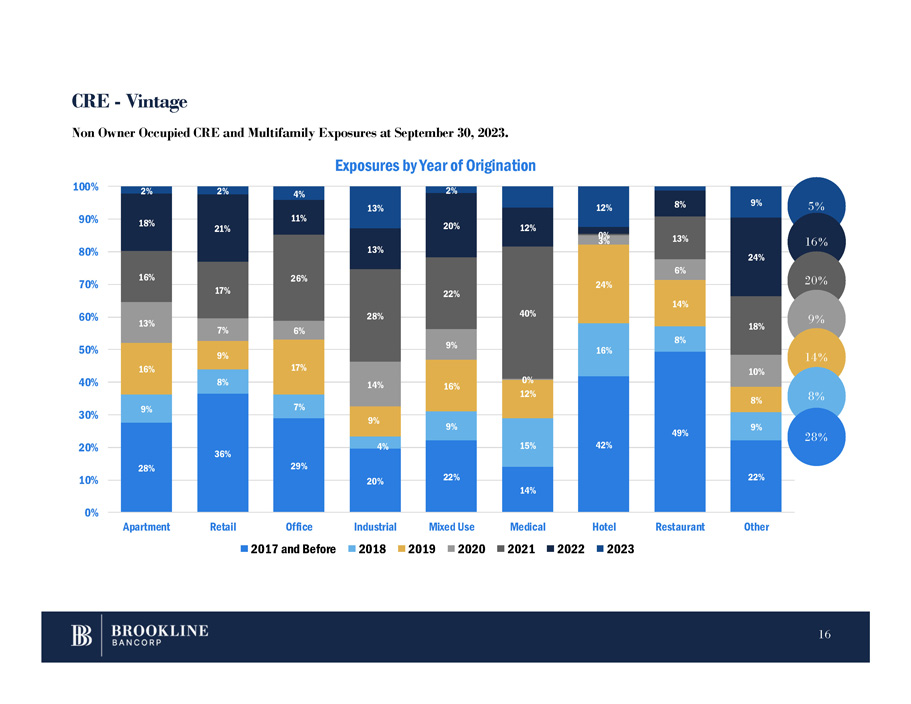
28% 36% 29% 20% 22% 14% 42% 49% 22% 9% 8% 7% 4% 9% 15% 16% 8% 9% 16% 9% 17% 9% 16% 24% 14% 8% 13% 7% 6% 14% 9% 0% 12% 6% 10% 16% 17% 26% 28% 22% 40% 3 0% 13% 18% 18% 21% 11% 13% 20% 12% 8% 24% 2% 2% 4% 13% 2% 12% 9% 0% 10% 20% 30% 40% 50% 60% 70% 80% 90% 100% Apartment Retail Office 2017 and Before Restaurant Other Non Owner Occupied CRE and Multifamily Exposures at September 30, 2023. Exposures by Year of Origination Industrial Mixed Use Medical Hotel 2018 2019 2020 2021 2022 2023 5 % CRE - Vintage 16 % 20 % 9 % 14 % 8 % 28 % 16
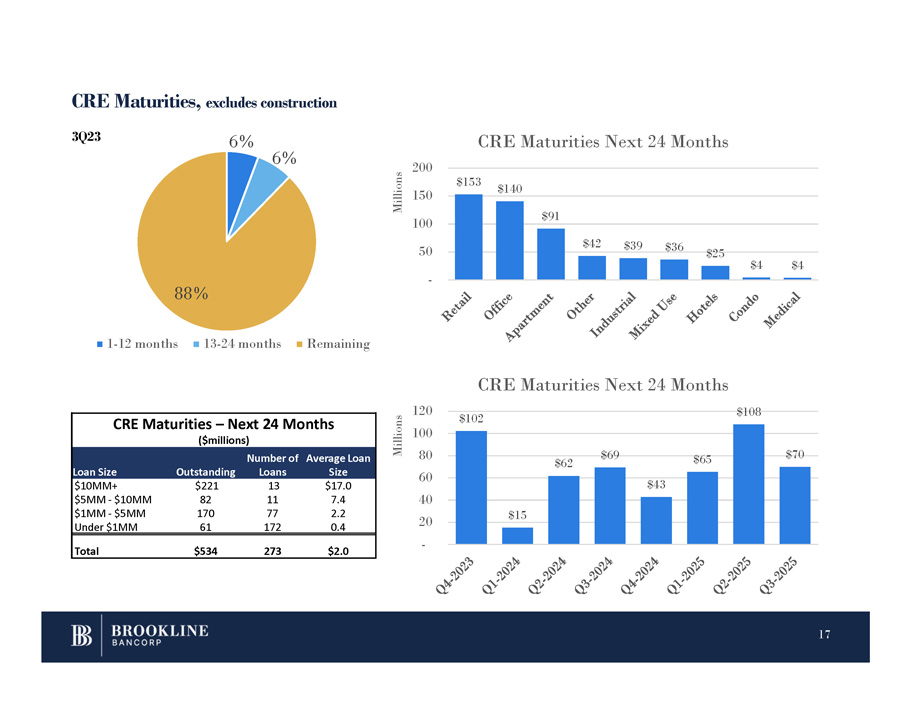
CRE Maturities, excludes construction 6% 6% 88% 1 - 12 months 13 - 24 months Remaining $153 $140 $91 $42 $39 $36 $25 $4 $4 - 200 150 100 50 Millions CRE Maturities Next 24 Months $102 $15 $62 $69 $43 $65 $108 $70 - 120 100 80 60 40 20 Millions 17 CRE Maturities Next 24 Months CRE Maturities – Next 24 Months ($millions) Average Loan Size Number of Loans Outstanding Loan Size $17.0 13 $221 $10MM+ 7.4 11 82 $5MM - $10MM 2.2 77 170 $1MM - $5MM 0.4 172 61 Under $1MM $2.0 273 $534 Total 3Q23
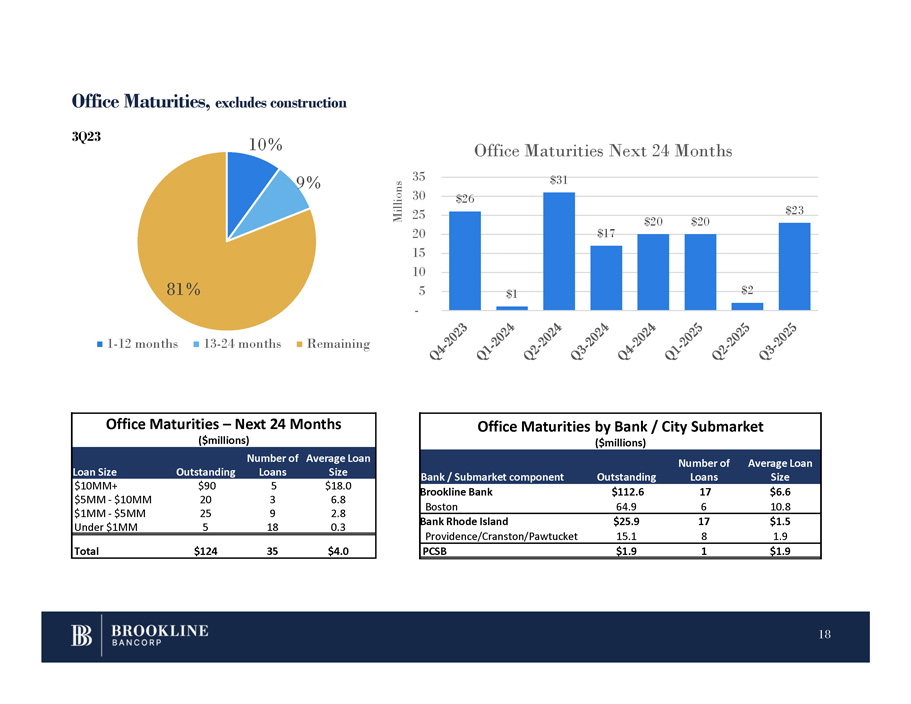
Office Maturities, excludes construction 10% 9% 81% 1 - 12 months 13 - 24 months Remaining $26 $1 Office Maturities Next 24 Months $31 $17 $20 $20 $2 $23 - 35 30 25 20 15 10 5 Millions 18 Office Maturities – Next 24 Months ($millions) Average Loan Size Number of Loans Outstanding Loan Size $18.0 5 $90 $10MM+ 6.8 3 20 $5MM - $10MM 2.8 9 25 $1MM - $5MM 0.3 18 5 Under $1MM $4.0 35 $124 Total Office Maturities by Bank / City Submarket ($millions) Average Loan Size Number of Loans Outstanding Bank / Submarket component $6.6 17 $112.6 Brookline Bank 10.8 6 64.9 Boston $1.5 17 $25.9 Bank Rhode Island 1.9 8 15.1 Providence/Cranston/Pawtucket $1.9 1 $1.9 PCSB 3Q23
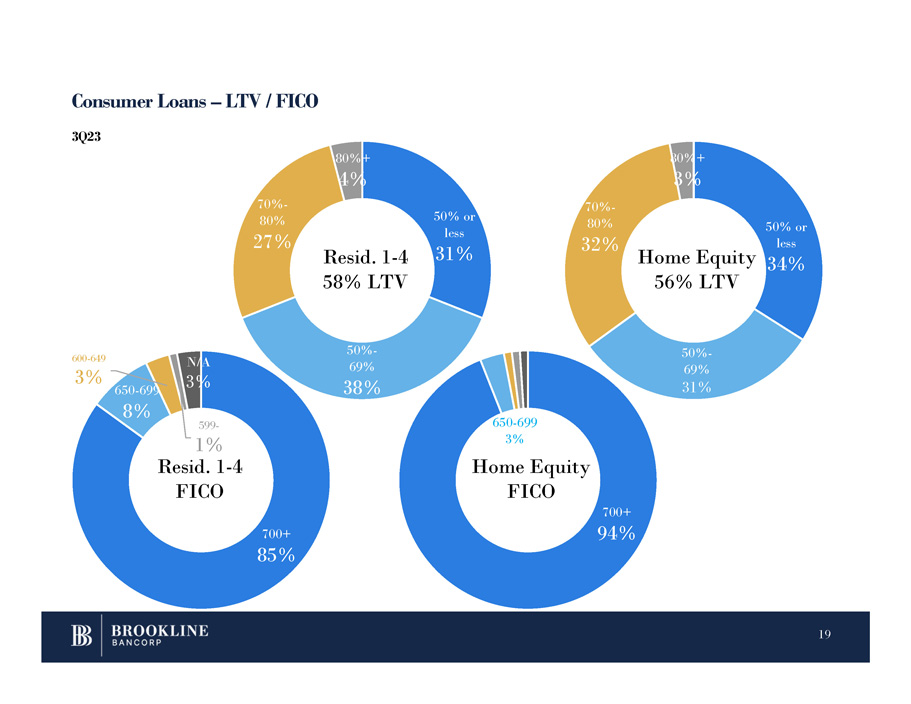
Consumer Loans – LTV / FICO 19 700+ 85% 650 - 699 8% 600 - 649 3% 599 - N/A 3% 50% or less 31% 50% - 69% 38% 70% - 80% 27% 80%+ 4% 700+ 94% 50% or less 34% 50% - 69% 31% 70% - 80% 32% 80%+ 3% Resid. 1 - 4 58% LTV 1% Resid. 1 - 4 FICO 650 - 699 3% Home Equity FICO Home Equity 56% LTV 3Q23
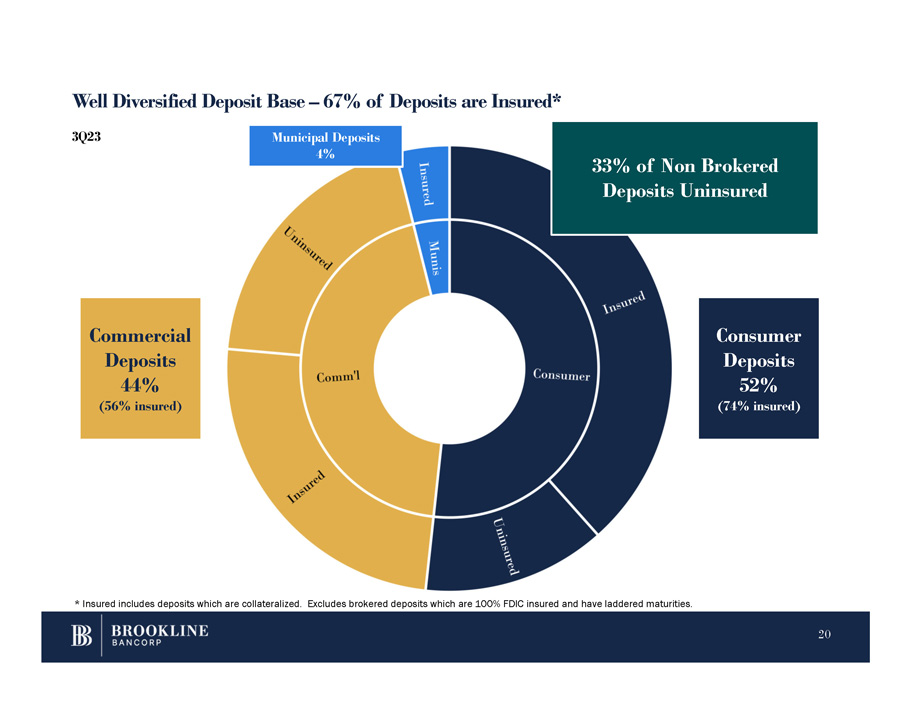
Well Diversified Deposit Base – 67% of Deposits are Insured* Consumer Deposits 52% (74% insured) Commercial Deposits 44% (56% insured) Municipal Deposits 4% * Insured includes deposits which are collateralized. Excludes brokered deposits which are 100% FDIC insured and have laddered maturities. 33% of Non Brokered Deposits Uninsured 20 3Q23
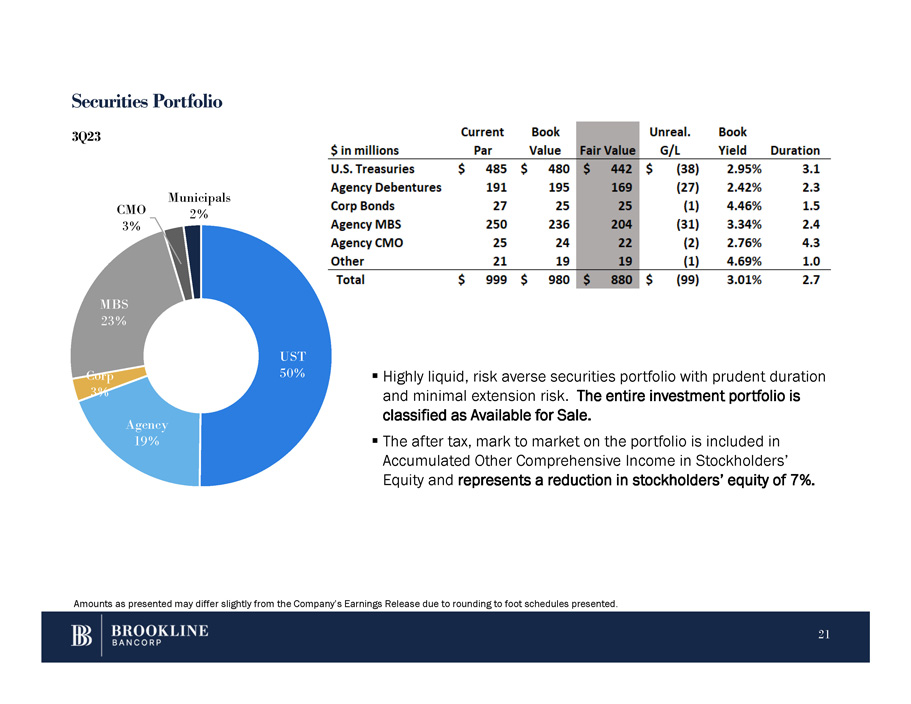
Securities Portfolio ▪ Highly liquid, risk averse securities portfolio with prudent duration and minimal extension risk. The entire investment portfolio is classified as Available for Sale. ▪ The after tax, mark to market on the portfolio is included in Accumulated Other Comprehensive Income in Stockholders’ Equity and represents a reduction in stockholders’ equity of 7%. UST 50% Agency 19% Corp 3% MBS 23% CMO 3% Municipals 2% 3Q23 Amounts as presented may differ slightly from the Company’s Earnings Release due to rounding to foot schedules presented. 21
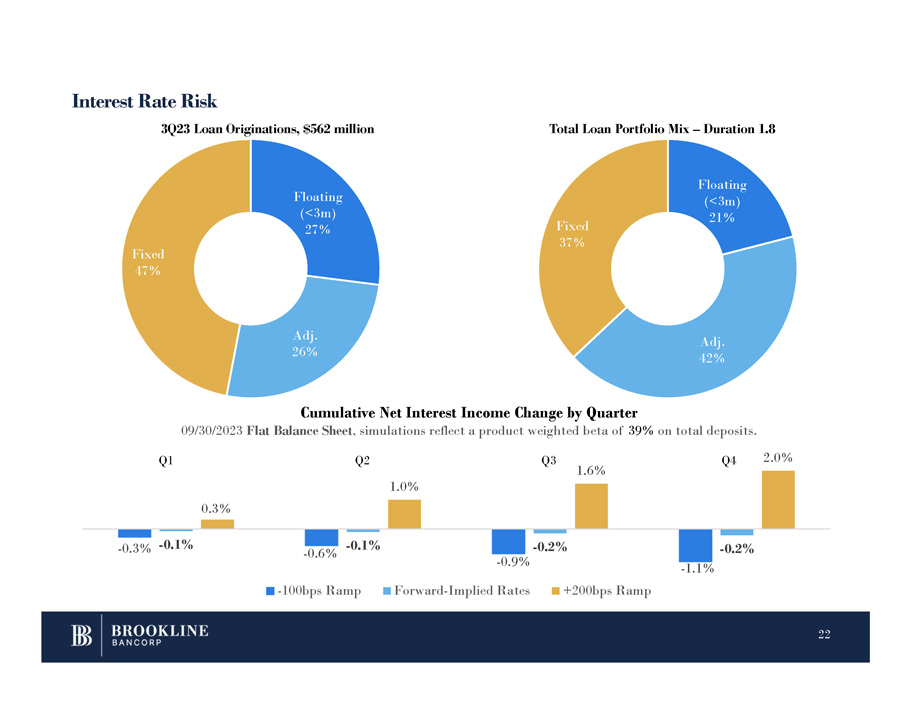
Interest Rate Risk Floating (<3m) 27% Adj. 26% Fixed 47% 3Q23 Loan Originations, $562 million Total Loan Portfolio Mix – Duration 1.8 - 1.1% - 0.3% - 0.1% - 0.6% - 0.1% - 0.2% - 0.9% - 0.2% 0.3% 1.0% 1.6% 2.0% Cumulative Net Interest Income Change by Quarter 09/30/2023 Flat Balance Sheet , simulations reflect a product weighted beta of 39% on total deposits. - 100bps Ramp Forward - Implied Rates +200bps Ramp Q1 Q2 Q3 Q4 Floating (<3m) 21% 22 Adj. 42% Fixed 37%
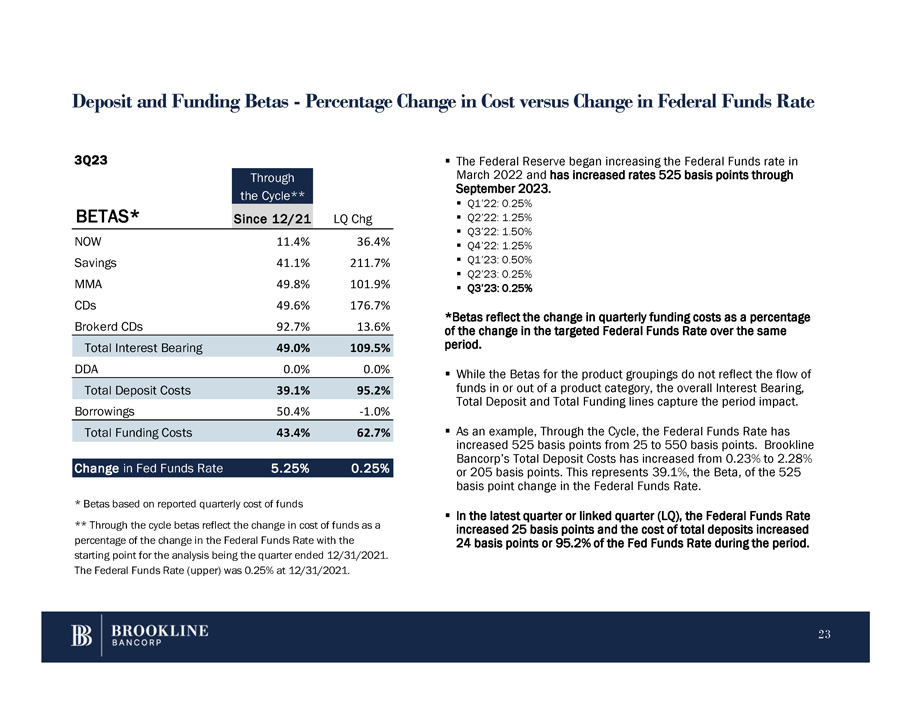
Deposit and Funding Betas - Percentage Change in Cost versus Change in Federal Funds Rate ▪ The Federal Reserve began increasing the Federal Funds rate in March 2022 and has increased rates 525 basis points through September 2023. ▪ Q1’22: 0.25% ▪ Q2’22: 1.25% ▪ Q3’22: 1.50% ▪ Q4’22: 1.25% ▪ Q1’23: 0.50% ▪ Q2’23: 0.25% ▪ Q3’23: 0.25% *Betas reflect the change in quarterly funding costs as a percentage of the change in the targeted Federal Funds Rate over the same period. ▪ While the Betas for the product groupings do not reflect the flow of funds in or out of a product category, the overall Interest Bearing, Total Deposit and Total Funding lines capture the period impact. ▪ As an example, Through the Cycle, the Federal Funds Rate has increased 525 basis points from 25 to 550 basis points. Brookline Bancorp’s Total Deposit Costs has increased from 0.23% to 2.28% or 205 basis points. This represents 39.1%, the Beta, of the 525 basis point change in the Federal Funds Rate. ▪ In the latest quarter or linked quarter (LQ), the Federal Funds Rate increased 25 basis points and the cost of total deposits increased 24 basis points or 95 . 2 % of the Fed Funds Rate during the period . Through the Cycle** LQ Chg Since 12/21 BETAS* 36.4% 11.4% NOW 211.7% 41.1% Savings 101.9% 49.8% MMA 176.7% 49.6% CDs 13.6% 92.7% Brokerd CDs 109.5% 49.0% Total Interest Bearing 3Q23 DDA 0.0% 0.0% Total Deposit Costs 39.1% 95.2% Borrowings 50.4% -1.0% Total Funding Costs 43.4% 62.7% Change in Fed Funds Rate 5.25% 0.25% * Betas based on reported quarterly cost of funds ** Through the cycle betas reflect the change in cost of funds as a percentage of the change in the Federal Funds Rate with the starting point for the analysis being the quarter ended 12/31/2021. The Federal Funds Rate (upper) was 0.25% at 12/31/2021. 23
v3.23.3
| X |
- DefinitionBoolean flag that is true when the XBRL content amends previously-filed or accepted submission.
| Name: |
dei_AmendmentFlag |
| Namespace Prefix: |
dei_ |
| Data Type: |
xbrli:booleanItemType |
| Balance Type: |
na |
| Period Type: |
duration |
|
| X |
- DefinitionFor the EDGAR submission types of Form 8-K: the date of the report, the date of the earliest event reported; for the EDGAR submission types of Form N-1A: the filing date; for all other submission types: the end of the reporting or transition period. The format of the date is YYYY-MM-DD.
| Name: |
dei_DocumentPeriodEndDate |
| Namespace Prefix: |
dei_ |
| Data Type: |
xbrli:dateItemType |
| Balance Type: |
na |
| Period Type: |
duration |
|
| X |
- DefinitionThe type of document being provided (such as 10-K, 10-Q, 485BPOS, etc). The document type is limited to the same value as the supporting SEC submission type, or the word 'Other'.
| Name: |
dei_DocumentType |
| Namespace Prefix: |
dei_ |
| Data Type: |
dei:submissionTypeItemType |
| Balance Type: |
na |
| Period Type: |
duration |
|
| X |
- DefinitionAddress Line 1 such as Attn, Building Name, Street Name
| Name: |
dei_EntityAddressAddressLine1 |
| Namespace Prefix: |
dei_ |
| Data Type: |
xbrli:normalizedStringItemType |
| Balance Type: |
na |
| Period Type: |
duration |
|
| X |
- Definition
+ References
+ Details
| Name: |
dei_EntityAddressCityOrTown |
| Namespace Prefix: |
dei_ |
| Data Type: |
xbrli:normalizedStringItemType |
| Balance Type: |
na |
| Period Type: |
duration |
|
| X |
- DefinitionCode for the postal or zip code
| Name: |
dei_EntityAddressPostalZipCode |
| Namespace Prefix: |
dei_ |
| Data Type: |
xbrli:normalizedStringItemType |
| Balance Type: |
na |
| Period Type: |
duration |
|
| X |
- DefinitionName of the state or province.
| Name: |
dei_EntityAddressStateOrProvince |
| Namespace Prefix: |
dei_ |
| Data Type: |
dei:stateOrProvinceItemType |
| Balance Type: |
na |
| Period Type: |
duration |
|
| X |
- DefinitionA unique 10-digit SEC-issued value to identify entities that have filed disclosures with the SEC. It is commonly abbreviated as CIK. Reference 1: http://www.xbrl.org/2003/role/presentationRef
-Publisher SEC
-Name Exchange Act
-Number 240
-Section 12
-Subsection b-2
| Name: |
dei_EntityCentralIndexKey |
| Namespace Prefix: |
dei_ |
| Data Type: |
dei:centralIndexKeyItemType |
| Balance Type: |
na |
| Period Type: |
duration |
|
| X |
- DefinitionIndicate if registrant meets the emerging growth company criteria. Reference 1: http://www.xbrl.org/2003/role/presentationRef
-Publisher SEC
-Name Exchange Act
-Number 240
-Section 12
-Subsection b-2
| Name: |
dei_EntityEmergingGrowthCompany |
| Namespace Prefix: |
dei_ |
| Data Type: |
xbrli:booleanItemType |
| Balance Type: |
na |
| Period Type: |
duration |
|
| X |
- DefinitionCommission file number. The field allows up to 17 characters. The prefix may contain 1-3 digits, the sequence number may contain 1-8 digits, the optional suffix may contain 1-4 characters, and the fields are separated with a hyphen.
| Name: |
dei_EntityFileNumber |
| Namespace Prefix: |
dei_ |
| Data Type: |
dei:fileNumberItemType |
| Balance Type: |
na |
| Period Type: |
duration |
|
| X |
- DefinitionTwo-character EDGAR code representing the state or country of incorporation.
| Name: |
dei_EntityIncorporationStateCountryCode |
| Namespace Prefix: |
dei_ |
| Data Type: |
dei:edgarStateCountryItemType |
| Balance Type: |
na |
| Period Type: |
duration |
|
| X |
- DefinitionThe exact name of the entity filing the report as specified in its charter, which is required by forms filed with the SEC. Reference 1: http://www.xbrl.org/2003/role/presentationRef
-Publisher SEC
-Name Exchange Act
-Number 240
-Section 12
-Subsection b-2
| Name: |
dei_EntityRegistrantName |
| Namespace Prefix: |
dei_ |
| Data Type: |
xbrli:normalizedStringItemType |
| Balance Type: |
na |
| Period Type: |
duration |
|
| X |
- DefinitionThe Tax Identification Number (TIN), also known as an Employer Identification Number (EIN), is a unique 9-digit value assigned by the IRS. Reference 1: http://www.xbrl.org/2003/role/presentationRef
-Publisher SEC
-Name Exchange Act
-Number 240
-Section 12
-Subsection b-2
| Name: |
dei_EntityTaxIdentificationNumber |
| Namespace Prefix: |
dei_ |
| Data Type: |
dei:employerIdItemType |
| Balance Type: |
na |
| Period Type: |
duration |
|
| X |
- DefinitionLocal phone number for entity.
| Name: |
dei_LocalPhoneNumber |
| Namespace Prefix: |
dei_ |
| Data Type: |
xbrli:normalizedStringItemType |
| Balance Type: |
na |
| Period Type: |
duration |
|
| X |
- DefinitionBoolean flag that is true when the Form 8-K filing is intended to satisfy the filing obligation of the registrant as pre-commencement communications pursuant to Rule 13e-4(c) under the Exchange Act. Reference 1: http://www.xbrl.org/2003/role/presentationRef
-Publisher SEC
-Name Exchange Act
-Number 240
-Section 13e
-Subsection 4c
| Name: |
dei_PreCommencementIssuerTenderOffer |
| Namespace Prefix: |
dei_ |
| Data Type: |
xbrli:booleanItemType |
| Balance Type: |
na |
| Period Type: |
duration |
|
| X |
- DefinitionBoolean flag that is true when the Form 8-K filing is intended to satisfy the filing obligation of the registrant as pre-commencement communications pursuant to Rule 14d-2(b) under the Exchange Act. Reference 1: http://www.xbrl.org/2003/role/presentationRef
-Publisher SEC
-Name Exchange Act
-Number 240
-Section 14d
-Subsection 2b
| Name: |
dei_PreCommencementTenderOffer |
| Namespace Prefix: |
dei_ |
| Data Type: |
xbrli:booleanItemType |
| Balance Type: |
na |
| Period Type: |
duration |
|
| X |
- DefinitionTitle of a 12(b) registered security. Reference 1: http://www.xbrl.org/2003/role/presentationRef
-Publisher SEC
-Name Exchange Act
-Number 240
-Section 12
-Subsection b
| Name: |
dei_Security12bTitle |
| Namespace Prefix: |
dei_ |
| Data Type: |
dei:securityTitleItemType |
| Balance Type: |
na |
| Period Type: |
duration |
|
| X |
- DefinitionName of the Exchange on which a security is registered. Reference 1: http://www.xbrl.org/2003/role/presentationRef
-Publisher SEC
-Name Exchange Act
-Number 240
-Section 12
-Subsection d1-1
| Name: |
dei_SecurityExchangeName |
| Namespace Prefix: |
dei_ |
| Data Type: |
dei:edgarExchangeCodeItemType |
| Balance Type: |
na |
| Period Type: |
duration |
|
| X |
- DefinitionBoolean flag that is true when the Form 8-K filing is intended to satisfy the filing obligation of the registrant as soliciting material pursuant to Rule 14a-12 under the Exchange Act. Reference 1: http://www.xbrl.org/2003/role/presentationRef
-Publisher SEC
-Name Exchange Act
-Section 14a
-Number 240
-Subsection 12
| Name: |
dei_SolicitingMaterial |
| Namespace Prefix: |
dei_ |
| Data Type: |
xbrli:booleanItemType |
| Balance Type: |
na |
| Period Type: |
duration |
|
| X |
- DefinitionTrading symbol of an instrument as listed on an exchange.
| Name: |
dei_TradingSymbol |
| Namespace Prefix: |
dei_ |
| Data Type: |
dei:tradingSymbolItemType |
| Balance Type: |
na |
| Period Type: |
duration |
|
| X |
- DefinitionBoolean flag that is true when the Form 8-K filing is intended to satisfy the filing obligation of the registrant as written communications pursuant to Rule 425 under the Securities Act. Reference 1: http://www.xbrl.org/2003/role/presentationRef
-Publisher SEC
-Name Securities Act
-Number 230
-Section 425
| Name: |
dei_WrittenCommunications |
| Namespace Prefix: |
dei_ |
| Data Type: |
xbrli:booleanItemType |
| Balance Type: |
na |
| Period Type: |
duration |
|
Brookline Bancorp (NASDAQ:BRKL)
Historical Stock Chart
From Mar 2024 to Apr 2024

Brookline Bancorp (NASDAQ:BRKL)
Historical Stock Chart
From Apr 2023 to Apr 2024
