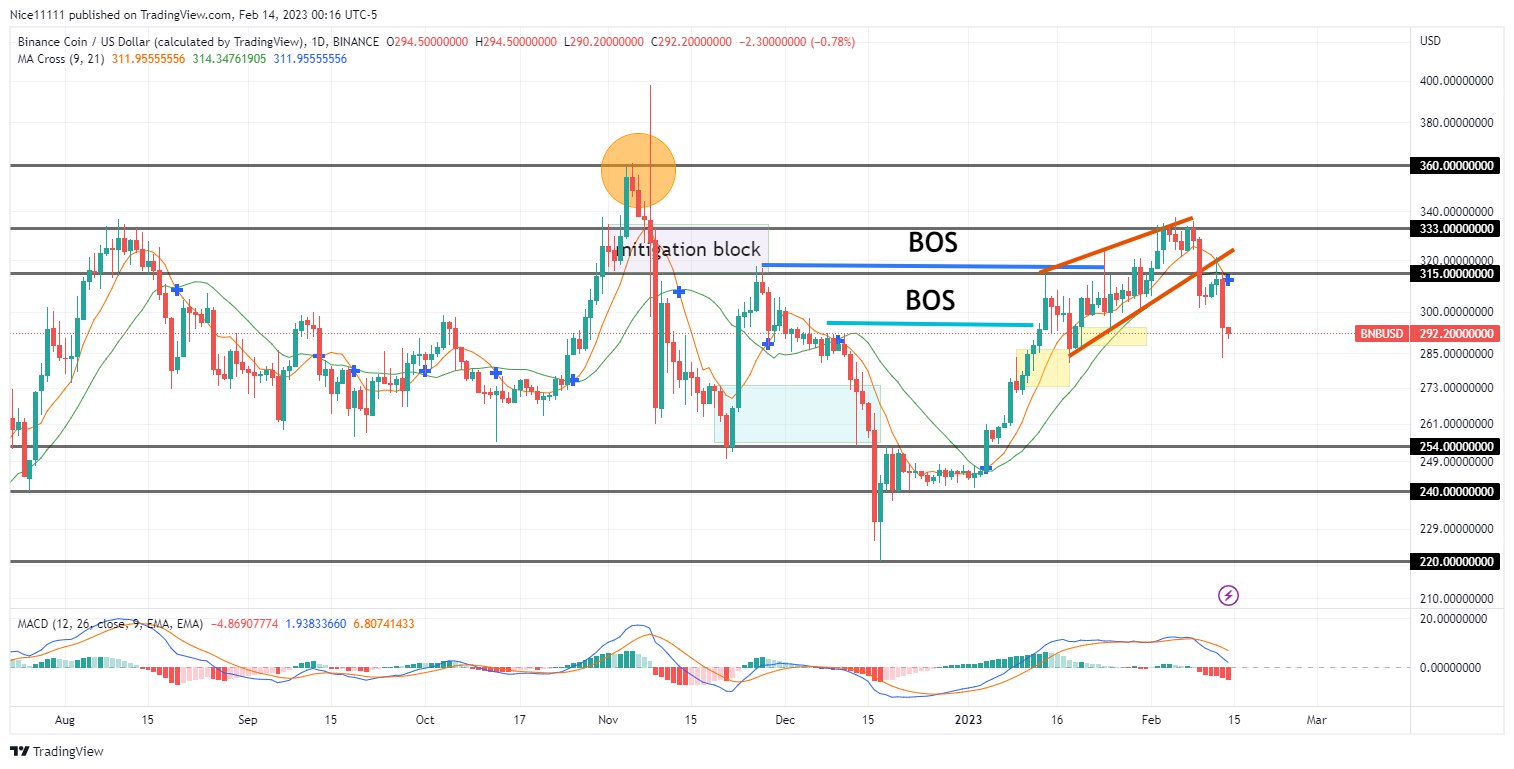
The BNBUSD market structure has turned bearish since the test of the supply level at $333.00. The new year started with the price of Binance Coin at a deep discount. The buyers took advantage and filled buy orders at the $240.0 demand level. This buying pressure fostered the prompt rise in price. The price soared valiantly until the first draw on liquidity was fulfilled. The buyers faced resistance at $315.0. The market ascended sluggishly to the next resistance level at $333.0. A rising wedge formed due to the slower ascension after the reach of $315.0. The selloff at the supply level delivered the first bearish displacement that broke out of the ascending wedge. A retest of the lower border of the wedge has delivered another bearish impulsive motion.
BNBUSD Key Levels
Demand Levels: $254.0, $240.0, $220.0
Supply Levels: $315.0, $333.0, $360.0
What Are the Indicators Saying?
The year started with the crossing of the Moving Averages of Periods nine and twenty-one above the $240.0 demand level The market was oversold, as indicated by the MACD (Moving Average Convergence and Divergence) indicator. This fostered a rally to the $333.00 resistance level. The MACD indicated the weakness of the buyers at the resistance level. The MACD has crossed in the overbought region to signify a bearish trend reversal. The price is expected to decline toward $254.0.
Learn from market wizards: Books to take your trading to the next level