0001484769
false
fuboTV Inc. /FL
0001484769
2023-08-04
2023-08-04
iso4217:USD
xbrli:shares
iso4217:USD
xbrli:shares
UNITED
STATES
SECURITIES
AND EXCHANGE COMMISSION
Washington,
D.C. 20549
FORM
8-K
CURRENT
REPORT
Pursuant
to Section 13 or 15(d)
of
the Securities Exchange Act of 1934
Date
of report (Date of earliest event reported): August 4, 2023
FUBOTV
INC.
(Exact
name of registrant as specified in its charter)
| Florida |
|
001-39590 |
|
26-4330545 |
(State
or other jurisdiction
of
incorporation) |
|
(Commission
File
Number) |
|
(IRS
Employer
Identification
Number) |
1290
Avenue of the Americas
New York, NY 10104
(Address
of principal executive offices) (Zip Code)
(212)
672-0055
(Registrant’s
telephone number, including area code)
N/A
(Former
Name or Former Address, if Changed Since Last Report)
Check
the appropriate box below if the Form 8-K filing is intended to simultaneously satisfy the filing obligation of the registrant under
any of the following provisions:
| ☐ |
Written
communications pursuant to Rule 425 under the Securities Act (17 CFR 230.425) |
| ☐ |
Soliciting
material pursuant to Rule 14a-12 under the Exchange Act (17 CFR 240.14a-12) |
| ☐ |
Pre-commencement
communications pursuant to Rule 14d-2(b) under the Exchange Act (17 CFR 240.14d-2(b)) |
| ☐ |
Pre-commencement
communications pursuant to Rule 13e-4(c) under the Exchange Act (17 CFR 240.13e-4(c)) |
Securities
registered pursuant to Section 12(b) of the Act:
Title of each class |
|
Trading
Symbol(s) |
|
Name
of each exchange on which registered |
| Common Stock, par value $0.0001 per share |
|
FUBO |
|
New
York Stock Exchange |
Indicate
by check mark whether the registrant is an emerging growth company as defined in Rule 405 of the Securities Act of 1933 (§230.405
of this chapter) or Rule 12b-2 of the Securities Exchange Act of 1934 (§240.12b-2 of this chapter).
Emerging
growth company ☐
If
an emerging growth company, indicate by check mark if the registrant has elected not to use the extended transition period for complying
with any new or revised financial accounting standards provided pursuant to Section 13(a) of the Exchange Act. ☐
| Item
2.02. |
Results
of Operations and Financial Condition. |
On
August 4, 2023, fuboTV Inc. announced its financial results for the three months ended June 30, 2023. The full text of the shareholder
letter and press release issued in connection with the announcement are attached as Exhibits 99.1 and 99.2, respectively, to this Current
Report on Form 8-K.
The
information in this Item 2.02, including the information contained in Exhibits 99.1 and 99.2 of this Current Report on Form 8-K, shall
not be deemed “filed” for purposes of Section 18 of the Securities Exchange Act of 1934, as amended (the “Exchange
Act”), or otherwise subject to the liabilities of that section, nor shall it be deemed incorporated by reference in any filing
under the Exchange Act or the Securities Act of 1933, as amended, except as expressly set forth by specific reference in such a filing.
Item
9.01 Financial Statements and Exhibits.
(d)
Exhibits
The
following exhibits relating to Item 2.02 shall be deemed to be furnished, and not filed:
SIGNATURES
Pursuant
to the requirements of the Securities Exchange Act of 1934, the registrant has duly caused this report to be signed on its behalf by
the undersigned hereunto duly authorized.
| |
FUBOTV
INC. |
| |
|
| Date:
August 4, 2023 |
By: |
/s/
David Gandler |
| |
|
David
Gandler |
| |
|
Chief
Executive Officer |
Exhibit
99.1

August
4, 2023
Fellow
Shareholders:
The
momentum in our business continued in the second quarter, with Fubo posting results that exceeded guidance, including 23% year-over-year
growth in subscribers and 41% year-over-year revenue growth in North America (NA). The results for the quarter also marked a healthy
year-over-year improvement in cash usage, demonstrating our focus on unit economics, cost control and profitability while strategically
supporting our growth initiatives. In addition, we maintained a strong balance sheet and liquidity position, ending the quarter with
$299.7 million in cash, cash equivalents and restricted cash. We are confident that we have sufficient liquidity to fund our operating
plan and that the momentum in our business will continue as we raise our full year 2023 revenue and subscriber guidance in NA and make
further progress towards our goal of achieving positive cash flow in 2025.
Q2
2023 Highlights1:
| ● |
Posted
Q2 NA subscribers of 1.167 million, meaningfully exceeding the midpoint of our Q2 NA subscriber guidance of 1.130 million,
and revenue of $305 million, ahead of the midpoint of our guidance of $295 million. |
| ● |
Achieved
a 1,380 bps year-over-year improvement in Gross Margin to 7%. |
| ● |
Expanded
NA ARPU by 13% year-over-year to $81.62, an all-time record. |
| ● |
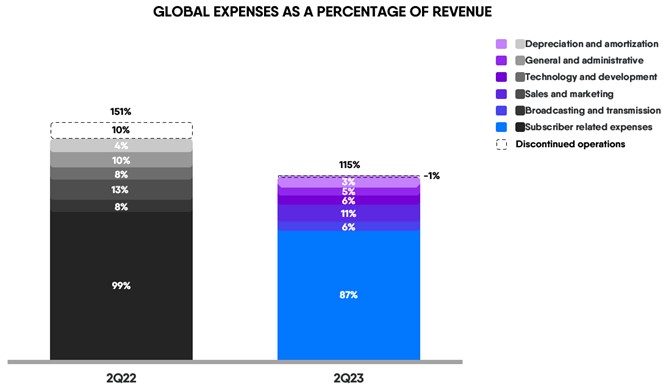
Made
marked progress in optimizing our content costs as reflected in a 1,193 bps reduction in Subscriber-related expenses (SRE) as a percentage
of revenue to 87%. |
| ● |
Achieved
year-over-year improvement in Net Loss of $41 million and a $12 million improvement in net cash used in operating activities. |
| ● |
Continued
to make considerable progress toward becoming cash flow and Adjusted EBITDA (AEBITDA) positive in 2025, with a Q2 AEBITDA
improvement of $40 million and a Q2 Free Cash Flow improvement of $9 million, in each case as compared to Q2 of 2022. |
Q2
Performance
Fubo
posted Q2 North America subscriber growth ahead of guidance, reaffirming the pricing power and strong appeal of our sports-first content
offering. Notably, we achieved this growth efficiently, with total sales and marketing expense as a percentage of revenue declining year-over-year
from ~13% to ~11%.
1 Except
as otherwise indicated, financial information presented in this letter reflects Fubo’s results on acontinuing operations
basis, which excludes our former wagering reportable segment. See “Basis of Presentation – Continuing Operations”
below.

North
America Subscription revenue growth of 45% year-over-year was driven by both expansion in ARPU, on the back of recent price increases,
and the addition of regional sports networks (RSNs).
North
America Advertising revenue grew 5% year-over-year, despite headwinds across ad budgets, highlighting both the appeal and resilience
of our content and subscriber base for advertisers. We expect to see an acceleration in the back half of the year in connection with
an anticipated recovery of ad budgets.
Note:
Except as otherwise indicated, financial information presented and discussed in this letter reflects Fubo’s results on a continuing
operations basis, which excludes our former wagering reportable segment. See “Basis of Presentation – Continuing Operations”
below for further detail.
Q2
2023 Results and Guidance2
Summary Financials (millions) (GLOBAL) | |
| 2Q22 | | |
| 2Q23 | | |
| 2Q23 YoY % | |
| Revenue | |
$ | 222.1 | | |
$ | 312.7 | | |
| +41 | % |
| Total Operating Expenses | |
$ | 313.5 | | |
$ | 365.2 | | |
| +17 | % |
| Net Loss | |
$ | -95.0 | | |
$ | -54.2 | | |
| -43 | % |
| Net Loss Margin | |
| -42.8 | % | |
| -17.3 | % | |
| +2,543 bps | |
| Adjusted EBITDA | |
$ | -70.1 | | |
$ | -30.5 | | |
| -56 | % |
| Adjusted EBITDA Margin | |
| -31.6 | % | |
| -9.8 | % | |
| +2,180 bps | |
Key Operating Metrics (NORTH AMERICA STREAMING) | |
| 2Q22 | | |
| 2Q23 | | |
| 2Q23 YoY % | |
| Subscribers (thousands) | |
| 947 | | |
| 1,167 | | |
| +23 | % |
| Revenue ($ in millions) | |
$ | 216.2 | | |
$ | 304.6 | | |
| +41 | % |
| ARPU | |
$ | 72.19 | | |
$ | 81.62 | | |
| +13 | % |
Key
Operating Metrics (REST
OF WORLD STREAMING) | |
| 2Q22 | | |
| 2Q23 | | |
| 2Q23
YoY % | |
| Subscribers
(thousands) | |
| 347 | | |
| 394 | | |
| +14 | % |
| Revenue
($ in millions) | |
$ | 5.8 | | |
$ | 8.2 | | |
| +40 | %3 |
| ARPU | |
$ | 5.97 | | |
$ | 6.91 | | |
| +16 | % |
2
Our consolidated Net Loss for 2Q23 was $49.9 million, which includes $4.3 million in income from discontinued operations. Net Loss
from continuing operations was $54.2 million.
3
Excluding a favorable $0.17 million foreign currency impact in 2Q23, revenue growth was 37% at constant currency compared to the
prior year. See Key Performance Metrics and Non-GAAP Measures below.
| Guidance (NA) | |
| 3Q23 | | |
| FY23 | |
| Revenue ($ in millions) | |
$ | 272.5-$277.5 | | |
$ | 1,260-$1,280 | |
| Subscribers (thousands) | |
| 1,327-1,347 | | |
| 1,565-1,585 | |
| Guidance (ROW) | |
| 3Q23 | | |
| FY23 | |
| Revenue ($ in millions) | |
$ | 7.2-$8.2 | | |
$ | 29.4-$33.4 | |
| Subscribers (thousands) | |
| 382.5-387.5 | | |
| 380-400 | |
Net
Loss from continuing operations in the second quarter was $54.2 million, leading to an earnings per share (EPS) loss of $0.19. This compares
favorably to a Net Loss from continuing operations of $95.0 million and an EPS loss of $0.51 in the second quarter of 2022. Adjusted
EPS in the second quarter of 2023 improved to a loss of $0.12, compared to an adjusted EPS loss of $0.39 in 2Q22. Adjusted EPS excludes
the impact of stock-based compensation, amortization of intangibles, amortization of debt discount and other non-cash items.
Our
ongoing efforts to drive operating leverage across the business led to the second consecutive quarter of year-over-year improvements
in both Free Cash Flow and AEBITDA of $9 million and $40 million, respectively.
We
maintained a strong balance sheet and healthy liquidity position, ending the quarter with $299.7 million in cash, cash equivalents and
restricted cash. We remain confident we have sufficient liquidity to achieve our stated profitability goals.
Q2
2023 Operational Highlights
North
America Ad Sales
Fubo
delivered North America ad revenue of $22.8 million in the quarter, an increase of 5% year-over-year, reflecting the appeal of our highly
sought-after audience and our premium sports-first content.
We
believe Fubo is poised to continue to benefit from the ongoing market dynamics driving a decline in linear TV advertising alongside the
growing appeal of connected TV (CTV). Accordingly, our focus has been on investing in our advertising team, technology and infrastructure
in order to optimize our unique value proposition to advertisers. We are accelerating our direct sales business alongside our successful
programmatic business and leveraging the Regional Sports Networks (RSNs) inventory to cater to ad categories that have both national
and regional advertising needs.
North
America Content
We
continue to gain added leverage over our subscriber related expenses (SRE), which decreased from 99% to 87% of revenue in Q2 versus the
same prior year period. We expect this year-over-year trend to continue as we work towards meaningfully growing subscribers, optimizing
our pricing and further improving our mix of premium plans.
The
launch of MLB.TV exceeded expectations and offers further support that fully integrated add-on products perform very well on the Fubo
platform and drive ARPU expansion. On the back of the February launch of the Bally Sports RSNs across the country, Fubo is the only streaming
platform carrying all four major sports league channels, along with all of their premium add-ons.
We
also expanded our FAST channel offering and continue to see positive results from this initiative, including record hours watched, and
ad revenue earned during the second quarter.
As
part of our long-term partnership with Ryan Reynolds, we launched the Maximum Effort Channel at the end of the quarter. The channel is
home to original content in addition to classic TV and movies distributed across Fubo and nearly a dozen streaming platforms. The network’s
first original show, Bedtime Stories with Ryan, secured Autodesk as the Official Imagination Sponsor. The Maximum Effort Channel
has introduced innovative sponsor opportunities, including whisper content breaks, enabling us to work creatively with ad partners.
The
Maximum Effort Channel is an important component of our overall FAST channels strategy, which continues to gain momentum on our platform.
With free ad-supported television networks like Maximum Effort Channel, we believe we can grow ad revenue and expand our entertainment
programming with minimal incremental content costs.
Product
Roadmap
We
continue to focus on our proprietary tech stack to build the most intuitive and personalized TV experience for the consumer, while also
driving a revenue fly-wheel for our business. Our goal remains to enhance the DVR experience by introducing AI product features designed
to revolutionize how consumers engage with streaming video. Our recently launched Instant Highlights beta, which we tested during the
NBA playoffs, is the first example of new Fubo products leveraging our AI technology. We are taking those learnings and applying them
to a broader release planned for this fall for the football season.
In
the coming weeks, we will begin the rollout of our global Unified Platform (UP) initiative. Under
UP, every Fubo app has been re-designed and re-built to leverage technology synergies across our global company. We believe UP
will provide a number of new critical capabilities that neither Fubo nor Molotov have today - which
we expect will increase product velocity, innovation and cost savings.
Guidance
North
America Streaming
We
are raising our prior FY 2023 revenue and subscriber guidance.
Our
FY 2023 guidance now projects 1,565,000 to 1,585,000 subscribers, representing 9% year-over-year growth at the midpoint, and revenue
of $1,260 to $1,280 million, representing 29% year-over-year growth at the midpoint. This FY 2023 revenue guidance implies $648 million
of revenue at the midpoint in the second half of the year, $10.4 million higher than as implied by our prior guidance.
Q3
2023 guidance projects 1,327,000 to 1,347,000 subscribers, representing 9% year-over-year growth
at the midpoint, and revenue of $272.5 to $277.5 million, representing 25% year-over-year growth at the midpoint.
ROW
Streaming
Our
FY 2023 guidance projects 380,000 to 400,000 subscribers, representing a 7% year-over-year decline at the midpoint, and revenue of $29.4
to $33.4 million, representing 29% year-over-year growth at the midpoint and an increase to our previous
guidance. Note that our FY 2022 subscriber count was positively impacted by the 2022 World Cup.
Q3
2023 guidance projects 382,500 to 387,500 subscribers, representing 7% year-over-year growth at the midpoint, and revenue of $7.2 to
$8.2 million, representing 34% year-over-year growth at the midpoint.
Conclusion
We
are encouraged by our execution in the second quarter, exceeding our forecasts across a number of KPIs, including revenue and subscriber
growth, as well as seeing improvements across other key operational metrics such as ARPU, SRE and Gross Margin. While we have much work
ahead of us, we are as excited and as confident as ever about the opportunities ahead to leverage our resources on the back of key strategic
additions to our platform, including over 35 RSNs and over 125 FAST channels, as well as the Maximum Effort Channel. We are confident
we are on the right path to achieve our profitability goals.
We
look forward to keeping you updated on our progress in the quarters to come.
Sincerely,
| David
Gandler, co-founder and CEO |
|
Edgar
Bronfman Jr., executive chairman |
Q2
2023 Earnings Live Conference Call
Fubo
CEO David Gandler and CFO John Janedis will host a live conference call today at 8:30 a.m. ET to deliver brief remarks followed by Q&A.
The live call will be available on the Events & Presentations page of Fubo’s investor relations website. A replay
will be available on Fubo’s website following the call. Participants should join the call 10 minutes prior to ensure that they
are connected prior to the event.
More
Information
We
encourage you to read our full set of financial statements and SEC filings, and to sign up for email alerts, on the investor relations
section of our website at ir.fubo.tv.
Additional
information is available at www.sec.gov under FuboTV Inc.’s filings, as well as https://ir.fubo.tv.
Fubo
intends to use its website as a disclosure channel and investors are encouraged to refer to it, as well as press releases and SEC filings.
The company encourages reading the full set of financial statements and related disclosures in its Annual Report on Form 10-K for the
year ended December 31, 2022 that has been filed with the SEC.
About
Fubo
With
a mission to build the world’s leading global live TV streaming platform with the greatest breadth of premium content and interactivity,
FuboTV Inc. (NYSE: FUBO) aims to transcend the industry’s current TV model. The company operates Fubo in the U.S., Canada and Spain
and Molotov in France.
In
the U.S., Fubo is a sports-first cable TV replacement product that aggregates more than 175 live sports, news and entertainment networks
and is the only live TV streaming platform with every Nielsen-rated sports channel (source: Nielsen Total Viewers, 2022). Leveraging
Fubo’s proprietary data and technology platform optimized for live TV and sports viewership, subscribers can engage with
the content they are watching through interactive product features like FanView, an in-video experience showcasing live game, team and
player stats and scores in real time. Fubo was also the first virtual MVPD to enable simultaneous viewing of up to four live channels
(Multiview on Apple TV) as well the first to stream in 4K HDR.
Ranked
#1 in Customer Satisfaction among Live TV Streaming Providers by J.D. Power (2022), Fubo has been called “a force in sports streaming”
by Forbes, “the best streaming service for sports aficionados” by Tom’s Guide and was heralded by CNET
for its “ease of use.” Learn more at https://fubo.tv
Forward-Looking
Statements
This
letter contains forward-looking statements of FuboTV Inc. (“Fubo”) that involve substantial risks and uncertainties. All
statements contained in this letter that do not relate to matters of historical fact are forward-looking statements within the meaning
of The Private Securities Litigation Reform Act of 1995, including statements regarding our business strategy and plans, including content
partnerships, market opportunity, expectations regarding innovation, growth, profitability and becoming cash flow positive in 2025, industry,
advertising and broader economic trends, planned product offerings, our anticipated cash requirements, our financial condition and our
anticipated financial performance, including quarterly and annual guidance, and cash flow and Adjusted EBITDA targets. The words “could,”
“will,” “plan,” “intend,” “anticipate,” “approximate,” “expect,”
“potential,” “believe” or the negative of these terms or other similar expressions are intended to identify forward-looking
statements, although not all forward-looking statements contain these identifying words. Actual results or events could differ materially
from the plans, intentions and expectations disclosed in the forward-looking statements that Fubo makes due to a number of important
factors, including but not limited to the following: our ability to achieve or maintain profitability; risks related to our access to
capital and fundraising prospects to fund our financial operations and support our planned business growth; our revenue and gross profit
are subject to seasonality; our operating results may fluctuate; our ability to effectively manage our growth; the long-term nature of
our content commitments; our ability to renew our long-term content contracts on sufficiently favorable terms; our ability to attract
and retain subscribers; obligations imposed on us through our agreements with certain distribution partners; we may not be able to license
streaming content or other rights on acceptable terms; the restrictions imposed by content providers on our distribution and marketing
of our products and services; our reliance on third party platforms to operate certain aspects of our business; risks related to our
reporting obligations; risks related to the difficulty in measuring key metrics related to our business; risks related to preparing and
forecasting our financial results; risks related to the highly competitive nature of our industry; risks related to our technology, as
well as cybersecurity and data privacy-related risks; risks related to ongoing or future legal proceedings; and other risks, including
the effects of industry, market, economic, political or regulatory conditions, future exchange and interest rates, and changes in tax
and other laws, regulations, rates and policies. Further risks that could cause actual results to differ materially from those matters
expressed in or implied by such forward-looking statements are discussed in our Quarterly Report on Form 10-Q for the quarterly period
ended March 31, 2023 filed with the Securities and Exchange Commission (“SEC”), our Quarterly Report on Form 10-Q for the
quarterly period ended June 30, 2023 to be filed with the SEC, and our other periodic filings with the SEC. We encourage you to read
such risks in detail. The forward-looking statements in this letter represent Fubo’s views as of the date of this letter. Fubo
anticipates that subsequent events and developments will cause its views to change. However, while it may elect to update these forward-looking
statements at some point in the future, it specifically disclaims any obligation to do so. You should, therefore, not rely on these forward-looking
statements as representing Fubo’s views as of any date subsequent to the date of this letter.
(FuboTV
Inc. Financial Statements begin on the following pages)
fuboTV
Inc.
Condensed
Consolidated Statements of Operations and Comprehensive Loss
(in
thousands, except share and per share amounts)
| | |
For the Three Months Ended | |
| | |
June 30, | |
| | |
2023 | | |
2022 | |
| | |
Unaudited | | |
Unaudited | |
| Revenues | |
| | | |
| | |
| Subscription | |
$ | 288,994 | | |
$ | 199,943 | |
| Advertising | |
| 23,070 | | |
| 22,020 | |
| Other | |
| 671 | | |
| 109 | |
| Total revenues | |
| 312,735 | | |
| 222,072 | |
| Operating expenses | |
| | | |
| | |
| Subscriber related expenses | |
| 270,953 | | |
| 218,900 | |
| Broadcasting and transmission | |
| 18,327 | | |
| 17,157 | |
| Sales and marketing | |
| 33,819 | | |
| 28,159 | |
| Technology and development | |
| 17,778 | | |
| 18,040 | |
| General and administrative | |
| 15,460 | | |
| 22,790 | |
| Depreciation and amortization | |
| 8,913 | | |
| 8,410 | |
| Total operating expenses | |
| 365,250 | | |
| 313,456 | |
| Operating loss | |
| (52,515 | ) | |
| (91,384 | ) |
| | |
| | | |
| | |
| Other income (expense) | |
| | | |
| | |
| Interest expense, net of interest income | |
| (457 | ) | |
| (3,511 | ) |
| Amortization of debt discount | |
| (645 | ) | |
| (619 | ) |
| Other income (expense) | |
| (713 | ) | |
| 195 | |
| Total other expense | |
| (1,815 | ) | |
| (3,935 | ) |
| | |
| | | |
| | |
| Loss from continuing operations before income taxes | |
| (54,330 | ) | |
| (95,319 | ) |
| Income tax benefit | |
| 121 | | |
| 355 | |
| Net loss from continuing operations | |
| (54,209 | ) | |
| (94,964 | ) |
| | |
| | | |
| | |
| Discontinued operations | |
| | | |
| | |
| Income (loss) from discontinued operations before income taxes | |
| 4,259 | | |
| (21,310 | ) |
| Income tax benefit | |
| - | | |
| - | |
| Net income (loss) from discontinued operations | |
| 4,259 | | |
| (21,310 | ) |
| | |
| | | |
| | |
| Net loss | |
| (49,950 | ) | |
| (116,274 | ) |
| | |
| | | |
| | |
| Less: Net loss attributable to non-controlling interest | |
| 10 | | |
| 150 | |
| Net loss attributable to common shareholders | |
$ | (49,940 | ) | |
$ | (116,124 | ) |
| | |
| | | |
| | |
| Other comprehensive income (loss) | |
| | | |
| | |
| Foreign currency translation adjustment | |
| (137 | ) | |
| (844 | ) |
| Comprehensive loss attributable to common shareholders | |
$ | (50,077 | ) | |
$ | (116,968 | ) |
| | |
| | | |
| | |
| Net loss per share attributable to common shareholders | |
| | | |
| | |
| Basic and diluted loss per share from continuing operations | |
$ | (0.19 | ) | |
$ | (0.51 | ) |
| Basic and diluted loss per share from discontinued operations | |
$ | 0.02 | | |
$ | (0.12 | ) |
| Basic and diluted net loss per share | |
$ | (0.17 | ) | |
$ | (0.63 | ) |
| Weighted average shares outstanding: | |
| | | |
| | |
| Basic and diluted | |
| 291,720,400 | | |
| 185,103,005 | |
| | |
| | | |
| | |
| Stock-based compensation was allocated as follows: | |
| | | |
| | |
| Subscriber related expenses | |
| 57 | | |
| 36 | |
| Sales and marketing | |
| 5,990 | | |
| 4,334 | |
| Technology and development | |
| 2,980 | | |
| 2,659 | |
| General and administrative | |
| 4,029 | | |
| 5,835 | |
| Total stock-based compensation | |
| 13,056 | | |
| 12,864 | |
fuboTV
Inc.
Condensed
Consolidated Balance Sheets
(in
thousands)
| | |
June 30, | | |
December 31, | |
| | |
2023 | | |
2022 | |
| | |
Unaudited | | |
Audited | |
| ASSETS | |
| | | |
| | |
| Cash and cash equivalents | |
$ | 293,515 | | |
$ | 337,087 | |
| Accounts receivable, net | |
| 48,885 | | |
| 43,996 | |
| Prepaid sports rights | |
| 36,900 | | |
| 37,668 | |
| Prepaid and other current assets | |
| 15,632 | | |
| 13,508 | |
| Assets of discontinued operations | |
| 2,151 | | |
| 4,643 | |
| Total current assets | |
| 397,083 | | |
| 436,902 | |
| | |
| | | |
| | |
| Property and equipment, net | |
| 5,015 | | |
| 4,975 | |
| Restricted cash | |
| 6,141 | | |
| 6,139 | |
| Intangible assets, net | |
| 166,407 | | |
| 171,832 | |
| Goodwill | |
| 621,076 | | |
| 618,506 | |
| Right-of-use assets | |
| 37,592 | | |
| 35,888 | |
| Other non-current assets | |
| 6,936 | | |
| 3,532 | |
| Total assets | |
$ | 1,240,250 | | |
$ | 1,277,774 | |
| | |
| | | |
| | |
| LIABILITIES, TEMPORARY EQUITY AND SHAREHOLDERS’ EQUITY | |
| | | |
| | |
| Current liabilities | |
| | | |
| | |
| Accounts payable | |
| 49,247 | | |
| 66,952 | |
| Accrued expenses and other current liabilities | |
| 242,894 | | |
| 264,415 | |
| Notes payable | |
| 5,997 | | |
| 5,687 | |
| Deferred revenue | |
| 60,746 | | |
| 65,370 | |
| Long-term borrowings - current portion | |
| 1,700 | | |
| 1,986 | |
| Current portion of lease liabilities | |
| 3,887 | | |
| 1,763 | |
| Liabilities of discontinued operations | |
| 26,761 | | |
| 32,581 | |
| Total current liabilities | |
| 391,232 | | |
| 438,754 | |
| | |
| | | |
| | |
| Convertible notes, net of discount | |
| 395,362 | | |
| 394,094 | |
| Deferred income taxes | |
| 530 | | |
| 765 | |
| Lease liabilities | |
| 39,611 | | |
| 39,266 | |
| Other long-term liabilities | |
| 3,401 | | |
| 1,565 | |
| Total liabilities | |
| 830,136 | | |
| 874,444 | |
| | |
| | | |
| | |
| Redeemable non-controlling interest | |
| - | | |
| 1,648 | |
| | |
| | | |
| | |
| Shareholders’ equity: | |
| | | |
| | |
| Common stock par value $0.0001: 400,000,000 shares authorized; 292,559,125 and 209,684,548 shares issued and outstanding at June 30, 2023 and December 31, 2022, respectively | |
| 29 | | |
| 21 | |
| Additional paid-in capital | |
| 2,110,746 | | |
| 1,972,006 | |
| Accumulated deficit | |
| (1,691,641 | ) | |
| (1,558,088 | ) |
| Non-controlling interest | |
| (11,309 | ) | |
| (11,662 | ) |
| Accumulated other comprehensive income (loss) | |
| 2,289 | | |
| (595 | ) |
| Total shareholders’ equity | |
| 410,114 | | |
| 401,682 | |
| TOTAL LIABILITIES AND SHAREHOLDERS’ EQUITY | |
$ | 1,240,250 | | |
$ | 1,277,774 | |
fuboTV
Inc.
Condensed
Consolidated Statements of Cash Flows
(in
thousands)
| | |
For the Six Months Ended | |
| | |
June 30, | |
| | |
2023 | | |
2022 | |
| | |
Unaudited | | |
Unaudited | |
| Cash flows from operating activities | |
| | | |
| | |
| Net loss | |
$ | (133,574 | ) | |
$ | (257,091 | ) |
| Less: Income (loss) from discontinued operations, net of tax | |
| 4,003 | | |
| (33,764 | ) |
| Net loss from continuing operations | |
| (137,577 | ) | |
| (223,327 | ) |
| Adjustments to reconcile net loss to net cash used in operating activities: | |
| | | |
| | |
| Depreciation and amortization | |
| 17,755 | | |
| 19,766 | |
| Stock-based compensation | |
| 26,744 | | |
| 30,291 | |
| Amortization of debt discount | |
| 1,268 | | |
| 1,219 | |
| Deferred income tax benefit | |
| (235 | ) | |
| (758 | ) |
| Change in fair value of warrant liabilities | |
| - | | |
| 1,701 | |
| Amortization of right-of-use assets | |
| 1,359 | | |
| 1,721 | |
| Other adjustments | |
| 319 | | |
| 653 | |
| Changes in operating assets and liabilities of business, net of acquisitions: | |
| | | |
| | |
| Accounts receivable, net | |
| (4,828 | ) | |
| 2,465 | |
| Prepaid expenses and other assets | |
| (5,169 | ) | |
| 13,669 | |
| Prepaid sports rights | |
| 1,127 | | |
| (38,687 | ) |
| Accounts payable | |
| (20,716 | ) | |
| (3,284 | ) |
| Accrued expenses and other liabilities | |
| (22,845 | ) | |
| (6,700 | ) |
| Deferred revenue | |
| (4,659 | ) | |
| (1,962 | ) |
| Lease liabilities | |
| (610 | ) | |
| 604 | |
| Net cash used in operating activities - continuing operations | |
| (148,067 | ) | |
| (202,629 | ) |
| Net cash used in operating activities - discontinued operations | |
| (1,232 | ) | |
| (14,369 | ) |
| Net cash used in operating activities | |
| (149,299 | ) | |
| (216,998 | ) |
| | |
| | | |
| | |
| Cash flows from investing activities | |
| | | |
| | |
| Purchases of short term investments | |
| - | | |
| (100,000 | ) |
| Purchases of property and equipment | |
| (267 | ) | |
| (962 | ) |
| Capitalization of Internal Use Software | |
| (8,404 | ) | |
| (1,949 | ) |
| Net cash used in investing activities - continuing operations | |
| (8,671 | ) | |
| (102,911 | ) |
| Net cash used in investing activities - discontinued operations | |
| - | | |
| (4,255 | ) |
| Net cash used in investing activities | |
| (8,671 | ) | |
| (107,166 | ) |
| | |
| | | |
| | |
| Cash flows from financing activities | |
| | | |
| | |
| Proceeds from sale of common stock, net of fees | |
| 116,903 | | |
| 220,188 | |
| Redemption of NCI | |
| (2,147 | ) | |
| - | |
| Vested restricted stock unit settled for cash | |
| (125 | ) | |
| - | |
| Proceeds from exercise of stock options | |
| 95 | | |
| 572 | |
| Proceeds from the exercise of warrants | |
| - | | |
| 5,000 | |
| Repayments of notes payable and long-term borrowings | |
| (326 | ) | |
| (1,359 | ) |
| Net cash provided by financing activities - continuing operations | |
| 114,400 | | |
| 224,401 | |
| Net cash provided by financing activities - discontinued operations | |
| - | | |
| - | |
| Net cash provided by financing activities | |
| 114,400 | | |
| 224,401 | |
| | |
| | | |
| | |
| Net decrease in cash, cash equivalents and restricted cash | |
| (43,570 | ) | |
| (99,763 | ) |
| Cash, cash equivalents and restricted cash at beginning of period | |
| 343,226 | | |
| 376,080 | |
| Cash, cash equivalents and restricted cash at end of period | |
$ | 299,656 | | |
$ | 276,317 | |
| | |
| | | |
| | |
| Supplemental disclosure of cash flows information: | |
| | | |
| | |
| Interest paid | |
| 6,579 | | |
| 6,639 | |
| Income tax paid | |
| 6 | | |
| - | |
| | |
| | | |
| | |
| Non cash financing and investing activities: | |
| | | |
| | |
| Shares settled liability | |
| 3,670 | | |
| - | |
| Reclassification of the equity components of the 2026 Convertible Notes to liability upon adoption of ASU 2020-06 | |
| - | | |
| 75,264 | |
| Cashless exercise of warrants | |
| - | | |
| 5,249 | |
| Accrued expenses - At-the-market offering | |
| 9 | | |
| - | |
Basis
of Presentation – Continuing Operations
In
connection with the dissolution of Fubo Gaming, Inc. and termination of Fubo Sportsbook, the assets and liabilities and the operations
of our former wagering reportable segment, are presented as discontinued operations in our consolidated financial statements. With respect
to our continuing operations, we operate as a single reportable segment. Financial information presented in this letter reflects Fubo’s
results on a continuing operations basis, which excludes our former wagering reportable segment. Prior periods have been recast to conform
to this presentation.
Key
Performance Metrics and Non-GAAP Measures
Paid
Subscribers
We
believe the number of paid subscribers is a relevant measure to gauge the size of our user base. Paid subscribers is defined as total
subscribers that have completed registration with Fubo, have activated a payment method (only reflects one paying user per plan), from
which Fubo has collected payment from in the month ending the relevant period. Users who are on a free (trial) period are not included
in this metric.
Average
Revenue per User (ARPU)
Beginning
in the third quarter of 2022, Average Revenue Per User (ARPU) is calculated using Subscription revenue and Advertising revenue on a GAAP
basis. Previously, ARPU was calculated using Platform Bookings, which consisted of Subscription revenue and Advertising revenue, adjusted
for deferred revenue.
We
believe ARPU provides useful information for investors to gauge the revenue generated per subscriber on a monthly basis. ARPU, with respect
to a given period, is defined as total Subscription revenue and Advertising revenue recognized in such period, divided by the average
daily paid subscribers in such period, divided by the number of months in such period. Advertising revenue, like Subscription revenue,
is primarily driven by the number of subscribers to our platform and per-subscriber viewership such as the type of, and duration of,
content watched on platform. We believe ARPU is an important metric for both management and investors to evaluate the Company’s
core operating performance and measure our subscriber monetization, as well as evaluate unit economics, payback on subscriber acquisition
cost and lifetime value per subscriber. In addition, we believe that presenting a geographic breakdown for North America ARPU and ROW
ARPU allows for a more meaningful assessment of the business because of the significant differences in both Subscription revenue and
Advertising revenue generated on a per subscriber basis in North America when compared to ROW due to our current subscription pricing
models and advertising monetization in the two geographic regions.
Adjusted
EBITDA
Adjusted
EBITDA is a non-GAAP measure defined as Net Loss from Continuing Operations, adjusted for depreciation and amortization, stock-based
compensation, income tax benefit, other expenses, and one-time non-cash expenses.
Adjusted
EBITDA Margin
Adjusted
EBITDA Margin is a non-GAAP measure defined as Adjusted EBITDA divided by Revenue.
Adjusted
Net Loss
Adjusted
Net Loss is a non-GAAP measure defined as Net Loss Attributable to Common Shareholders, adjusting for discontinued operations, stock-based
compensation, change in fair value of warrants, amortization of debt discount, amortization of intangible assets and other non-cash items.
Adjusted
EPS (Earnings per Share)
Adjusted
EPS is a non-GAAP measure defined as Adjusted Net Loss divided by weighted average shares outstanding.
Free
Cash Flow
Free
Cash Flow is a non-GAAP measure defined as net cash used in operating activities - continuing operations, reduced by capital expenditures
(consisting of purchases of property and equipment and capitalization of internal use software). We believe Free Cash Flow is an important
liquidity measure of the cash that is available, after capital expenditures, for operational expenses, investments in our business, strategic
acquisitions, and for certain other activities such as repaying debt obligations and stock repurchases. Free Cash Flow is a key financial
indicator used by management. Free Cash Flow is useful to investors as a liquidity measure because it measures our ability to generate
or use cash. The use of Free Cash Flow as an analytical tool has limitations due to the fact that it does not represent the residual
cash flow available for discretionary expenditures. Because of these limitations, Free Cash Flow should be considered along with other
operating and financial performance measures presented in accordance with GAAP.
Gross
Profit and Gross Margin (GAAP)
Gross
Profit is defined as Revenue less Subscriber related expenses and Broadcasting and transmission. Gross Margin is defined as Gross Profit
divided by Revenue. We believe these measures are useful because they represent key profitability metrics for our business and are used
by management to evaluate the performance of our business, including measuring the cost to deliver our product to subscribers against
revenue.
Revenue
Growth Presented on a Constant Currency Basis
Revenue
growth presented on a constant currency basis is a non-GAAP measure defined as revenues for a given period restated at the comparative
period’s foreign currency exchange rates measured against the comparative period’s revenues.
Subscriber
Acquisition Cost
Subscriber
Acquisition Cost (SAC) reflects total GAAP sales and marketing expenses less headcount related to sales and marketing spend for a given
period divided by Gross Paid Subscriber Additions for the same period.
Reconciliation
of Key Performance Metrics and Non-GAAP Financial Measures
Certain
measures used in this letter, including Adjusted EBITDA, Adjusted EBITDA Margin, Adjusted Net Loss, Adjusted EPS and Free Cash Flow,
as well as revenue growth presented on a constant currency basis, are non-GAAP financial measures. We believe these are useful financial
measures for investors as they are supplemental measures used by management in evaluating our core operating performance. Our non-GAAP
financial measures have limitations as analytical tools and you should not consider them in isolation or as a substitute for an analysis
of our results under GAAP. There are a number of limitations related to the use of these non-GAAP financial measures versus their nearest
GAAP equivalents. First, these non-GAAP financial measures are not a substitute for GAAP financial measures. Second, these non-GAAP financial
measures may not provide information directly comparable to measures provided by other companies in our industry, as those other companies
may calculate their non-GAAP financial measures differently.
The
following tables include reconciliations of the non-GAAP financial measures used in this letter to their most directly comparable GAAP
financial measures. We have recast our previously disclosed non-GAAP financial measures to only reflect the results from continuing operations,
thereby removing the discontinued operations of our former wagering reportable segment.
fuboTV
Inc.
Reconciliation
of GAAP Subscription and Advertising Revenue to North America ARPU
(in
thousands, except average subscribers and average per user amounts)
Year-over-Year
Comparison
| | |
Three Months Ended | |
| | |
June 30, 2023 | | |
June 30, 2022 | |
| | |
As-Reported | | |
As-Reported | |
| Subscription Revenue (GAAP) | |
$ | 288,994 | | |
$ | 199,943 | |
| Advertising Revenue (GAAP) | |
| 23,070 | | |
| 22,020 | |
| Subtract: | |
| | | |
| | |
| ROW Subscription Revenue | |
| (7,906 | ) | |
| (5,540 | ) |
| ROW Advertising Revenue | |
| (250 | ) | |
| (303 | ) |
| Total | |
| 303,908 | | |
| 216,120 | |
| Divide: | |
| | | |
| | |
| Average Subscribers (North America) | |
| 1,241,218 | | |
| 997,979 | |
| Months in Period | |
| 3 | | |
| 3 | |
| North America Monthly Average Revenue per User (NA ARPU) | |
$ | 81.62 | | |
$ | 72.19 | |
fuboTV
Inc.
Reconciliation
of GAAP Subscription and Advertising Revenue to ROW ARPU
(in
thousands, except average subscribers and average per user amounts)
Year-over-Year
Comparison
| | |
Three Months Ended | |
| | |
June 30, 2023 | | |
June 30, 2022 | |
| | |
As-Reported | | |
As-Reported | |
| Subscription Revenue (GAAP) | |
$ | 288,994 | | |
$ | 199,943 | |
| Advertising Revenue (GAAP) | |
| 23,070 | | |
| 22,020 | |
| Subtract: | |
| | | |
| | |
| North America Subscription Revenue | |
| (281,088 | ) | |
| (194,403 | ) |
| North America Advertising Revenue | |
| (22,820 | ) | |
| (21,717 | ) |
| Total | |
| 8,156 | | |
| 5,843 | |
| Divide: | |
| | | |
| | |
| Average Subscribers (ROW) | |
| 393,601 | | |
| 326,162 | |
| Months in Period | |
| 3 | | |
| 3 | |
| ROW Monthly Average Revenue per User (ROW ARPU) | |
$ | 6.91 | | |
$ | 5.97 | |
fuboTV
Inc.
Reconciliation
of Net Loss from Continuing Operations to Non-GAAP Adjusted EBITDA
(in
thousands)
Year-over-Year
Comparison
| | |
Three Months Ended | |
| | |
June 30, 2023 | | |
June 30, 2022 | |
| | |
As-Reported | | |
As-Reported | |
| Reconciliation of Net Loss from Continuing Operations to Adjusted EBITDA | |
| | |
| |
| Net loss from continuing operations | |
$ | (54,209 | ) | |
$ | (94,964 | ) |
| Depreciation and amortization | |
| 8,913 | | |
| 8,410 | |
| Stock-based Compensation | |
| 13,057 | | |
| 12,864 | |
| Other expense | |
| 1,815 | | |
| 3,935 | |
| Income tax benefit | |
| (121 | ) | |
| (355 | ) |
| Adjusted EBITDA | |
| (30,545 | ) | |
| (70,110 | ) |
| | |
| | | |
| | |
| Adjusted EBITDA | |
| (30,545 | ) | |
| (70,110 | ) |
| Divide: | |
| | | |
| | |
| Revenue | |
| 312,735 | | |
| 222,072 | |
| Adjusted EBITDA Margin | |
| -9.8 | % | |
| -31.6 | % |
fuboTV
Inc.
Reconciliation
of Net Cash Used in Operating Activities - Continuing Operations to Free Cash Flow
(in
thousands)
Year-over-Year
Comparison
| | |
Three Months Ended | |
| | |
June 30, 2023 | | |
June 30, 2022 | |
| | |
As-Reported | | |
As-Reported | |
| Net cash used in operating activities - continuing operations | |
$ | (71,028 | ) | |
$ | (83,430 | ) |
| Subtract: | |
| | | |
| | |
| Purchases of property and equipment | |
| (165 | ) | |
| (164 | ) |
| Capitalization of internal use software | |
| (4,588 | ) | |
| (923 | ) |
| Free Cash Flow | |
| (75,781 | ) | |
| (84,517 | ) |
fuboTV
Inc.
Reconciliation
of Net Loss Attributable to Common Shareholders to Non-GAAP Adjusted Net Loss and Adjusted EPS
(in
thousands)
Year-over-Year
Comparison
| | |
Three Months Ended | |
| | |
June 30, 2023 | | |
June 30, 2022 | |
| | |
As-Reported | | |
As-Reported | |
| Net loss attributable to common shareholders | |
$ | (49,940 | ) | |
$ | (116,124 | ) |
| Subtract: | |
| | | |
| | |
| Net income (loss) from discontinued operations | |
| 4,259 | | |
| (21,310 | ) |
| Net loss from continuing operations attributable to common shareholders | |
| (54,199 | ) | |
| (94,814 | ) |
| | |
| | | |
| | |
| Net loss from continuing operations attributable to common shareholders | |
| (54,199 | ) | |
| (94,814 | ) |
| Stock-based Compensation | |
| 13,056 | | |
| 14,208 | |
| Amortization of debt discount | |
| 645 | | |
| 619 | |
| Amortization of intangibles | |
| 8,497 | | |
| 8,098 | |
| Adjusted net loss from continuing operations | |
| (32,001 | ) | |
| (71,888 | ) |
| | |
| | | |
| | |
| Weighted average shares outstanding: | |
| | | |
| | |
| Basic and diluted | |
| 291,720,400 | | |
| 185,103,005 | |
| | |
| | | |
| | |
| Adjusted EPS from continuing operations | |
$ | (0.12 | ) | |
$ | (0.39 | ) |
#
# #
Contacts
Investor
Contacts:
Alison
Sternberg, Fubo
asternberg@fubo.tv
JCIR
for Fubo
ir@fubo.tv
Media
Contacts:
Jennifer
L. Press, Fubo
jpress@fubo.tv
Bianca
Illion, Fubo
billion@fubo.tv
Exhibit
99.2
FOR
IMMEDIATE RELEASE

FUBO
DELIVERED $305 MILLION TOTAL REVENUE IN NORTH AMERICA IN Q2 2023, ACHIEVED DOUBLE DIGIT YEAR-OVER-YEAR REVENUE, SUBSCRIBER GROWTH AND
EXCEEDED GUIDANCE
Live
TV Streaming Platform’s Q2 Progress Toward 2025 Profitability Goal:
| |
● |
Raised
Full Year 2023 Guidance for North America |
| |
● |
Reduced
Net Loss by $41M |
| |
● |
Achieved
7% Gross Margin |
| |
● |
Posted
Record Average Revenue Per User (ARPU) in North America |
NEW
YORK – AUGUST 4, 2023 – FuboTV Inc. (NYSE: FUBO), the leading sports-first live TV streaming platform, today announced
its financial results for the second quarter ended June 30, 2023 and raised its previously stated full year 2023 guidance for North America.
Fubo
exceeded North American guidance, achieving $305 million in revenue, up 41% year-over-year, and 1,167,000 paid subscribers, up 23% year-over-year.
The Company delivered ad revenue in North America of $22.8 million in the second quarter, up 5% year-over-year. This marks an expected
return to growth despite a challenged advertising market.
Double
digit year-over-year growth was also posted by Fubo’s Rest of World (ROW) streaming business. Total revenue achieved was $8.2 million,
up 40% year-over-year, while paid subscribers reached 394,000, up 14% year-over-year. ROW includes the results of Molotov, the French
live TV streaming service acquired by Fubo in December 2021.
Notably,
Fubo made marked progress toward its 2025 positive free cash flow goal. Compared to prior year, the company reduced net loss by $41 million
(with a $12 million improvement in net cash used in operating activities), grew gross margin to 7% and, in North America, expanded ARPU
by 13% to $81.62, marking an all-time record. Fubo also delivered a second quarter Adjusted EBITDA
(AEBITDA) improvement of $40 million and a Free Cash Flow improvement of $9 million, compared to the second quarter of 2022.
Fubo
closed the quarter with $299.7 million in cash, cash equivalents and restricted cash, and is confident that its cash position provides
the company with sufficient liquidity to fund its operating plan until achieving expected positive cash flow in 2025.
Looking
ahead to the third quarter 2023 in North America, Fubo is projecting 1,327,000 to 1,347,000 paid subscribers, representing 9% year-over-year
growth at the midpoint, and revenue of $272.5 million to $277.5 million, representing 25% year-over-year growth at the midpoint.
The
Company is also raising its previously stated full year 2023 guidance for North America. Fubo projects 1,565,000 to 1,585,000 million
paid subscribers, representing 9% year-over-year growth at the midpoint, and revenue of $1.26 billion to $1.28 billion, representing
29% year-over-year growth at the midpoint.
Complete
second quarter 2023 results are detailed in Fubo’s shareholder letter available on the company’s IR site.
“We
are encouraged with our execution in the first half of the year, including posting year-over-year double digit revenue and subscriber
growth in the second quarter, while meaningfully reducing our net loss by $41 million,” said David Gandler, co-founder and CEO,
Fubo. “With an improving ad sales backdrop we remain on track to achieve our 2025 positive free cash flow target. We are as excited
and as confident as ever about the opportunities ahead to leverage our resources on the back of key strategic additions to our platform,
including over 35 regional sports networks (RSNs) and more than 125 FAST channels, as well as the Maximum Effort Channel in partnership
with Ryan Reynolds and Maximum Effort.”
“Significant
in Fubo’s strong second quarter results was our year-over-year revenue and subscriber growth in North America, which came in ahead
of guidance,” said Edgar Bronfman Jr., executive chairman, Fubo. “This growth reaffirms the pricing power and strong appeal
of our aggregated, sports-first content offering. As we significantly progress our path to profitability, Fubo is poised to continue
to benefit from the ongoing market dynamics driving a decline in cable TV alongside the growing appeal of CTV. We are confident we are
on the right path to achieve our 2025 profitability goal and create exceptional value for our shareholders.”
Live
Webcast
Gandler
and CFO John Janedis will host a live conference call today at 8:30 a.m. ET to deliver brief remarks followed by Q&A. The live webcast
will be available on the Events & Presentations page of Fubo’s investor relations website. An archived replay
will be available on Fubo’s website following the call. Participants should join the call 10 minutes in advance to ensure that
they are connected prior to the event.
About
Fubo
With
a mission to build the world’s leading global live TV streaming platform with the greatest breadth of premium content and interactivity,
FuboTV Inc. (NYSE: FUBO) aims to transcend the industry’s current TV model. The company operates Fubo in the U.S., Canada and Spain
and Molotov in France.
In
the U.S., Fubo is a sports-first cable TV replacement product that aggregates more than 175 live sports, news and entertainment networks
and is the only live TV streaming platform with every Nielsen-rated sports channel (source: Nielsen Total Viewers, 2022). Leveraging
Fubo’s proprietary data and technology platform optimized for live TV and sports viewership, subscribers can engage with the content
they are watching through interactive product features like FanView, an in-video experience showcasing live game, team and player stats
and scores in real time. Fubo was also the first virtual MVPD to enable simultaneous viewing of up to four live channels (Multiview on
Apple TV) as well the first to stream in 4K HDR.
Ranked
#1 in Customer Satisfaction among Live TV Streaming Providers by J.D. Power (2022), Fubo has been called “a force in sports streaming”
by Forbes, “the best streaming service for sports aficionados” by Tom’s Guide and was heralded by CNET
for its “ease of use.” Learn more at https://fubo.tv.
Basis
of Presentation – Continuing Operations
In
connection with the dissolution of Fubo Gaming, Inc. and termination of Fubo Sportsbook in October 2022, the assets and liabilities and
the operations of our former wagering reportable segment have been presented as discontinued operations in our consolidated financial
statements. With respect to our continuing operations, we operate as a single reportable segment. Financial information presented in
this release reflects Fubo’s results on a continuing operations basis, which excludes our former wagering reportable segment. Prior
periods have been recast to conform to this presentation.
Key
Performance Metrics and Non-GAAP Measures
Paid
Subscribers
We
believe the number of paid subscribers is a relevant measure to gauge the size of our user base. Paid subscribers is defined as total
subscribers that have completed registration with Fubo, have activated a payment method (only reflects one paying user per plan), from
which Fubo has collected payment from in the month ending the relevant period. Users who are on a free (trial) period are not included
in this metric.
Average
Revenue per User (ARPU)
Beginning
in the third quarter of 2022, Average Revenue Per User (ARPU) is calculated using Subscription revenue and Advertising revenue on a GAAP
basis. Previously, ARPU was calculated using Platform Bookings, which consisted of Subscription revenue and Advertising revenue, adjusted
for deferred revenue.
We
believe ARPU provides useful information for investors to gauge the revenue generated per subscriber on a monthly basis. ARPU, with respect
to a given period, is defined as total Subscription revenue and Advertising revenue recognized in such period, divided by the average
daily paid subscribers in such period, divided by the number of months in such period. Advertising revenue, like Subscription revenue,
is primarily driven by the number of subscribers to our platform and per-subscriber viewership such as the type of, and duration of,
content watched on platform. We believe ARPU is an important metric for both management and investors to evaluate the Company’s
core operating performance and measure our subscriber monetization, as well as evaluate unit economics, payback on subscriber acquisition
cost and lifetime value per subscriber. In addition, we believe that presenting a geographic breakdown for North America ARPU and ROW
ARPU allows for a more meaningful assessment of the business because of the significant differences in both Subscription revenue and
Advertising revenue generated on a per subscriber basis in North America when compared to ROW due to our current subscription pricing
models and advertising monetization in the two geographic regions.
Adjusted
EBITDA
Adjusted
EBITDA is a non-GAAP measure defined as Net Loss from Continuing Operations, adjusted for depreciation and amortization, stock-based
compensation, income tax benefit, other expenses, and one-time non-cash expenses.
Gross
Profit and Gross Margin (GAAP)
Gross
Profit is defined as Revenue less Subscriber related expenses and Broadcasting and transmission. Gross Margin is defined as Gross Profit
divided by Revenue. We believe these measures are useful because they represent key profitability metrics for our business and are used
by management to evaluate the performance of our business, including measuring the cost to deliver our product to subscribers against
revenue.
Free
Cash Flow
Free
Cash Flow is a non-GAAP measure defined as net cash used in operating activities - continuing operations, reduced by capital expenditures
(consisting of purchases of property and equipment and capitalization of internal use software). We believe Free Cash Flow is an important
liquidity measure of the cash that is available, after capital expenditures, for operational expenses, investments in our business, strategic
acquisitions, and for certain other activities such as repaying debt obligations and stock repurchases. Free Cash Flow is a key financial
indicator used by management. Free Cash Flow is useful to investors as a liquidity measure because it measures our ability to generate
or use cash. The use of Free Cash Flow as an analytical tool has limitations due to the fact that it does not represent the residual
cash flow available for discretionary expenditures. Because of these limitations, Free Cash Flow should be considered along with other
operating and financial performance measures presented in accordance with GAAP.
Reconciliation
of Non-GAAP Financial Measures
Certain
measures used in this release, including Adjusted EBITDA and Free Cash Flow, are non-GAAP financial measures. We believe these are useful
financial measures for investors as they are supplemental measures used by management in evaluating our core operating performance. Our
non-GAAP financial measures have limitations as analytical tools and you should not consider them in isolation or as a substitute for
an analysis of our results under GAAP. There are a number of limitations related to the use of these non-GAAP financial measures versus
their nearest GAAP equivalents. First, these non-GAAP financial measures are not a substitute for GAAP financial measures. Second, these
non-GAAP financial measures may not provide information directly comparable to measures provided by other companies in our industry,
as those other companies may calculate their non-GAAP financial measures differently.
The
following table includes a reconciliation of the non-GAAP financial measures used in this press release to their most directly comparable
GAAP financial measure.
fuboTV
Inc.
Reconciliation
of GAAP Subscription and Advertising Revenue to North America ARPU
(in
thousands, except average subscribers and average per user amounts)
Year-over-Year
Comparison
| | |
Three Months Ended | |
| | |
June 30, 2023 | | |
June 30, 2022 | |
| | |
As-Reported | | |
As-Reported | |
| Subscription Revenue (GAAP) | |
$ | 288,994 | | |
$ | 199,943 | |
| Advertising Revenue (GAAP) | |
| 23,070 | | |
| 22,020 | |
| Subtract: | |
| | | |
| | |
| ROW Subscription Revenue | |
| (7,906 | ) | |
| (5,540 | ) |
| ROW Advertising Revenue | |
| (250 | ) | |
| (303 | ) |
| Total | |
| 303,908 | | |
| 216,120 | |
| Divide: | |
| | | |
| | |
| Average Subscribers (North America) | |
| 1,241,218 | | |
| 997,979 | |
| Months in Period | |
| 3 | | |
| 3 | |
| North America Monthly Average Revenue per User (NA ARPU) | |
$ | 81.62 | | |
$ | 72.19 | |
fuboTV
Inc.
Reconciliation
of Net Loss from Continuing Operations to Non-GAAP Adjusted EBITDA
(in
thousands)
Year-over-Year
Comparison
| | |
Three Months Ended | |
| | |
June 30, 2023 | | |
June 30, 2022 | |
| | |
As-Reported | | |
As-Reported | |
| Reconciliation of Net Loss from Continuing Operations to Adjusted EBITDA | |
| | |
| |
| Net loss from continuing operations | |
$ | (54,209 | ) | |
$ | (94,964 | ) |
| Depreciation and amortization | |
| 8,913 | | |
| 8,410 | |
| Stock-based Compensation | |
| 13,057 | | |
| 12,864 | |
| Other expense | |
| 1,815 | | |
| 3,935 | |
| Income tax benefit | |
| (121 | ) | |
| (355 | ) |
| Adjusted EBITDA | |
| (30,545 | ) | |
| (70,110 | ) |
fuboTV
Inc.
Reconciliation
of Net Cash Used in Operating Activities - Continuing Operations to Free Cash Flow
(in
thousands)
Year-over-Year
Comparison
| | |
Three Months Ended | |
| | |
June 30, 2023 | | |
June 30, 2022 | |
| | |
As-Reported | | |
As-Reported | |
| Net cash used in operating activities - continuing operations | |
$ | (71,028 | ) | |
$ | (83,430 | ) |
| Subtract: | |
| | | |
| | |
| Purchases of property and equipment | |
| (165 | ) | |
| (164 | ) |
| Capitalization of internal use software | |
| (4,588 | ) | |
| (923 | ) |
| Free Cash Flow | |
| (75,781 | ) | |
| (84,517 | ) |
Cautionary
Note Regarding Forward-Looking Statements
This
press release contains forward-looking statements of FuboTV Inc. (“Fubo”) that involve substantial risks and uncertainties.
All statements contained in this press release that do not relate to matters of historical fact are forward-looking statements within
the meaning of The Private Securities Litigation Reform Act of 1995, including statements regarding our business strategy and plans,
market opportunity, our financial condition, our anticipated financial performance, our anticipated cash requirements, our expectations
regarding profitability and becoming cash flow positive in 2025. The words “could,” “will,” “plan,”
“intend,” “anticipate,” “approximate,” “expect,” “potential,” “believe”
or the negative of these terms or other similar expressions are intended to identify forward-looking statements, although not all forward-looking
statements contain these identifying words. Actual results or events could differ materially from the plans, intentions and expectations
disclosed in the forward-looking statements that Fubo makes due to a number of important factors, including but not limited to the following:
our ability to achieve or maintain profitability; risks related to our access to capital and fundraising prospects to fund our financial
operations and support our planned business growth; our revenue and gross profit are subject to seasonality; our operating results may
fluctuate; the long-term nature of our content commitments; our ability to renew our long-term content contracts on sufficiently favorable
terms; our ability to effectively manage our growth; our ability to attract and retain subscribers; obligations imposed on us through
our agreements with certain distribution partners; we may not be able to license streaming content or other rights on acceptable terms;
the restrictions imposed by content providers on our distribution and marketing of our products and services; our reliance on third party
platforms to operate certain aspects of our business; risks related to our reporting obligations; risks related to the difficulty in
measuring key metrics related to our business; risks related to preparing and forecasting our financial results; risks related to the
highly competitive nature of our industry; risks related to our technology, as well as cybersecurity and data privacy-related risks;
risks related to ongoing or future legal proceedings; and other risks, including the effects of industry, market, economic, political
or regulatory conditions, future exchange and interest rates, and changes in tax and other laws, regulations, rates and policies. Further
risks that could cause actual results to differ materially from those matters expressed in or implied by such forward-looking statements
are discussed in our Quarterly Report on Form 10-Q for the quarter ended March 31, 2023 filed with the Securities and Exchange Commission
(“SEC”), our Quarterly Report on Form 10-Q for the quarterly period ended June 30, 2023 to be filed with the SEC, and our
other periodic filings with the SEC. We encourage you to read such risks in detail. The forward-looking statements in this press release
represent Fubo’s views as of the date of this press release. Fubo anticipates that subsequent events and developments will cause
its views to change. However, while it may elect to update these forward-looking statements at some point in the future, it specifically
disclaims any obligation to do so. You should, therefore, not rely on these forward-looking statements as representing Fubo’s views
as of any date subsequent to the date of this press release.
#
# #
Investor
Contacts
Alison
Sternberg, Fubo
asternberg@fubo.tv
JCIR
for Fubo
ir@fubo.tv
Media
Contacts
Jennifer
L. Press, Fubo
jpress@fubo.tv
Bianca
Illion, Fubo
billion@fubo.tv
v3.23.2
| X |
- DefinitionBoolean flag that is true when the XBRL content amends previously-filed or accepted submission.
| Name: |
dei_AmendmentFlag |
| Namespace Prefix: |
dei_ |
| Data Type: |
xbrli:booleanItemType |
| Balance Type: |
na |
| Period Type: |
duration |
|
| X |
- DefinitionFor the EDGAR submission types of Form 8-K: the date of the report, the date of the earliest event reported; for the EDGAR submission types of Form N-1A: the filing date; for all other submission types: the end of the reporting or transition period. The format of the date is YYYY-MM-DD.
| Name: |
dei_DocumentPeriodEndDate |
| Namespace Prefix: |
dei_ |
| Data Type: |
xbrli:dateItemType |
| Balance Type: |
na |
| Period Type: |
duration |
|
| X |
- DefinitionThe type of document being provided (such as 10-K, 10-Q, 485BPOS, etc). The document type is limited to the same value as the supporting SEC submission type, or the word 'Other'.
| Name: |
dei_DocumentType |
| Namespace Prefix: |
dei_ |
| Data Type: |
dei:submissionTypeItemType |
| Balance Type: |
na |
| Period Type: |
duration |
|
| X |
- DefinitionAddress Line 1 such as Attn, Building Name, Street Name
| Name: |
dei_EntityAddressAddressLine1 |
| Namespace Prefix: |
dei_ |
| Data Type: |
xbrli:normalizedStringItemType |
| Balance Type: |
na |
| Period Type: |
duration |
|
| X |
- Definition
+ References
+ Details
| Name: |
dei_EntityAddressCityOrTown |
| Namespace Prefix: |
dei_ |
| Data Type: |
xbrli:normalizedStringItemType |
| Balance Type: |
na |
| Period Type: |
duration |
|
| X |
- DefinitionCode for the postal or zip code
| Name: |
dei_EntityAddressPostalZipCode |
| Namespace Prefix: |
dei_ |
| Data Type: |
xbrli:normalizedStringItemType |
| Balance Type: |
na |
| Period Type: |
duration |
|
| X |
- DefinitionName of the state or province.
| Name: |
dei_EntityAddressStateOrProvince |
| Namespace Prefix: |
dei_ |
| Data Type: |
dei:stateOrProvinceItemType |
| Balance Type: |
na |
| Period Type: |
duration |
|
| X |
- DefinitionA unique 10-digit SEC-issued value to identify entities that have filed disclosures with the SEC. It is commonly abbreviated as CIK. Reference 1: http://www.xbrl.org/2003/role/presentationRef
-Publisher SEC
-Name Exchange Act
-Number 240
-Section 12
-Subsection b-2
| Name: |
dei_EntityCentralIndexKey |
| Namespace Prefix: |
dei_ |
| Data Type: |
dei:centralIndexKeyItemType |
| Balance Type: |
na |
| Period Type: |
duration |
|
| X |
- DefinitionIndicate if registrant meets the emerging growth company criteria. Reference 1: http://www.xbrl.org/2003/role/presentationRef
-Publisher SEC
-Name Exchange Act
-Number 240
-Section 12
-Subsection b-2
| Name: |
dei_EntityEmergingGrowthCompany |
| Namespace Prefix: |
dei_ |
| Data Type: |
xbrli:booleanItemType |
| Balance Type: |
na |
| Period Type: |
duration |
|
| X |
- DefinitionCommission file number. The field allows up to 17 characters. The prefix may contain 1-3 digits, the sequence number may contain 1-8 digits, the optional suffix may contain 1-4 characters, and the fields are separated with a hyphen.
| Name: |
dei_EntityFileNumber |
| Namespace Prefix: |
dei_ |
| Data Type: |
dei:fileNumberItemType |
| Balance Type: |
na |
| Period Type: |
duration |
|
| X |
- DefinitionTwo-character EDGAR code representing the state or country of incorporation.
| Name: |
dei_EntityIncorporationStateCountryCode |
| Namespace Prefix: |
dei_ |
| Data Type: |
dei:edgarStateCountryItemType |
| Balance Type: |
na |
| Period Type: |
duration |
|
| X |
- DefinitionThe exact name of the entity filing the report as specified in its charter, which is required by forms filed with the SEC. Reference 1: http://www.xbrl.org/2003/role/presentationRef
-Publisher SEC
-Name Exchange Act
-Number 240
-Section 12
-Subsection b-2
| Name: |
dei_EntityRegistrantName |
| Namespace Prefix: |
dei_ |
| Data Type: |
xbrli:normalizedStringItemType |
| Balance Type: |
na |
| Period Type: |
duration |
|
| X |
- DefinitionThe Tax Identification Number (TIN), also known as an Employer Identification Number (EIN), is a unique 9-digit value assigned by the IRS. Reference 1: http://www.xbrl.org/2003/role/presentationRef
-Publisher SEC
-Name Exchange Act
-Number 240
-Section 12
-Subsection b-2
| Name: |
dei_EntityTaxIdentificationNumber |
| Namespace Prefix: |
dei_ |
| Data Type: |
dei:employerIdItemType |
| Balance Type: |
na |
| Period Type: |
duration |
|
| X |
- DefinitionLocal phone number for entity.
| Name: |
dei_LocalPhoneNumber |
| Namespace Prefix: |
dei_ |
| Data Type: |
xbrli:normalizedStringItemType |
| Balance Type: |
na |
| Period Type: |
duration |
|
| X |
- DefinitionBoolean flag that is true when the Form 8-K filing is intended to satisfy the filing obligation of the registrant as pre-commencement communications pursuant to Rule 13e-4(c) under the Exchange Act. Reference 1: http://www.xbrl.org/2003/role/presentationRef
-Publisher SEC
-Name Exchange Act
-Number 240
-Section 13e
-Subsection 4c
| Name: |
dei_PreCommencementIssuerTenderOffer |
| Namespace Prefix: |
dei_ |
| Data Type: |
xbrli:booleanItemType |
| Balance Type: |
na |
| Period Type: |
duration |
|
| X |
- DefinitionBoolean flag that is true when the Form 8-K filing is intended to satisfy the filing obligation of the registrant as pre-commencement communications pursuant to Rule 14d-2(b) under the Exchange Act. Reference 1: http://www.xbrl.org/2003/role/presentationRef
-Publisher SEC
-Name Exchange Act
-Number 240
-Section 14d
-Subsection 2b
| Name: |
dei_PreCommencementTenderOffer |
| Namespace Prefix: |
dei_ |
| Data Type: |
xbrli:booleanItemType |
| Balance Type: |
na |
| Period Type: |
duration |
|
| X |
- DefinitionTitle of a 12(b) registered security. Reference 1: http://www.xbrl.org/2003/role/presentationRef
-Publisher SEC
-Name Exchange Act
-Number 240
-Section 12
-Subsection b
| Name: |
dei_Security12bTitle |
| Namespace Prefix: |
dei_ |
| Data Type: |
dei:securityTitleItemType |
| Balance Type: |
na |
| Period Type: |
duration |
|
| X |
- DefinitionName of the Exchange on which a security is registered. Reference 1: http://www.xbrl.org/2003/role/presentationRef
-Publisher SEC
-Name Exchange Act
-Number 240
-Section 12
-Subsection d1-1
| Name: |
dei_SecurityExchangeName |
| Namespace Prefix: |
dei_ |
| Data Type: |
dei:edgarExchangeCodeItemType |
| Balance Type: |
na |
| Period Type: |
duration |
|
| X |
- DefinitionBoolean flag that is true when the Form 8-K filing is intended to satisfy the filing obligation of the registrant as soliciting material pursuant to Rule 14a-12 under the Exchange Act. Reference 1: http://www.xbrl.org/2003/role/presentationRef
-Publisher SEC
-Name Exchange Act
-Section 14a
-Number 240
-Subsection 12
| Name: |
dei_SolicitingMaterial |
| Namespace Prefix: |
dei_ |
| Data Type: |
xbrli:booleanItemType |
| Balance Type: |
na |
| Period Type: |
duration |
|
| X |
- DefinitionTrading symbol of an instrument as listed on an exchange.
| Name: |
dei_TradingSymbol |
| Namespace Prefix: |
dei_ |
| Data Type: |
dei:tradingSymbolItemType |
| Balance Type: |
na |
| Period Type: |
duration |
|
| X |
- DefinitionBoolean flag that is true when the Form 8-K filing is intended to satisfy the filing obligation of the registrant as written communications pursuant to Rule 425 under the Securities Act. Reference 1: http://www.xbrl.org/2003/role/presentationRef
-Publisher SEC
-Name Securities Act
-Number 230
-Section 425
| Name: |
dei_WrittenCommunications |
| Namespace Prefix: |
dei_ |
| Data Type: |
xbrli:booleanItemType |
| Balance Type: |
na |
| Period Type: |
duration |
|
fuboTV (NYSE:FUBO)
Historical Stock Chart
From Apr 2024 to May 2024

fuboTV (NYSE:FUBO)
Historical Stock Chart
From May 2023 to May 2024
