TIDMJUP
RNS Number : 6564D
Jupiter Fund Management PLC
11 October 2018
Jupiter Fund Management plc
Trading Update and Notice of Results
11 October 2018
Jupiter Fund Management plc ("Jupiter", the "Group") today
issues its trading update in respect of the three months to 30
September 2018.
HIGHLIGHTS
   -- Net outflows in the quarter of GBP0.8bn.

   -- AUM at 30 September 2018 was GBP47.7bn.
ASSETS UNDER MANAGEMENT AND FLOWS
                       30 June                Market/FX  30 September
                        2018    Q3 net flows   movement   2018
                        GBPm     GBPm          GBPm       GBPm
 ====================  =======  ============  =========  ============
 Mutual funds          41,998   (773)         248        41,473
 ====================  =======  ============  =========  ============
 Segregated mandates   4,961    (62)          2          4,901
 ====================  =======  ============  =========  ============
 Investment trusts     1,276    2             69         1,347
 ====================  =======  ============  =========  ============
 Total                 48,235   (833)         319        47,721
 ====================  =======  ============  =========  ============
Q3 2018 saw AUM decrease from the half year to GBP47.7bn as a
result of GBP0.8bn net outflows, partly offset by positive
performance of GBP0.3bn.
Net mutual fund outflows were GBP0.8bn during the quarter,
GBP0.6bn of which were from our Fixed Income strategy, principally
in Continental Europe. We also saw negative flows in our European
Opportunities and Fund of Funds strategies, partially offset by
positive flows in our European Growth, Value Equities and Absolute
Return strategies.
In keeping with our strategy of continued diversification, the
Merlin Real Return (Unit Trust), Eurozone Equity (SICAV) and
Flexible Income (SICAV) Funds were all launched in the quarter,
strengthening our Fund of Funds, European Opportunities and Multi
Asset strategies respectively. Within our Alternatives strategy, we
launched the US Equity Long Short (SICAV) Fund in October.
NOTICE OF RESULTS
Jupiter will be issuing results for the period ended 31 December
2018 on 1 March 2019 and will host an analyst presentation to
discuss the results at 9:00am. The presentation will be held at The
Zig Zag Building, 70 Victoria Street, London, SW1E 6SQ.
For further information              Investors                    Media
please contact:
  Jupiter                      Alex Sargent/Investor     Kate O'Neill/Corporate
                                     Relations                Communications
                              +44 (0)20 3817 1534/1065   +44 (0)20 3817 1196/1278

  Powerscourt                    Justin Griffiths            Matthew Attwood
                                +44 (0)20 7549 0741        +44 (0)20 3328 9383
LEI Number: 5493003DJ1G01IMQ7S28
Forward-looking statements
This announcement contains forward-looking statements with
respect to the financial condition, results and business of the
Group. By their nature, forward-looking statements involve risk and
uncertainty because they relate to events, and depend on
circumstances, that will occur in the future. Jupiter's actual
results may differ materially from the results expressed or implied
in these forward-looking statements. Nothing in this announcement
should be construed as a profit forecast.
 Historic flow and AUM data by quarter
--------------------------------------


 Flows and
 AUM by
 quarter
 ===========  ===============  =======  ================  =======  ==================  =======  ==================  ====
                      Q1 2017  Q2 2017           Q3 2017  Q4 2017             Q1 2018  Q2 2018             Q3 2018    Q4
                         GBPm     GBPm              GBPm     GBPm                GBPm     GBPm                GBPm  2018
                                                                                                                    GBPm
 ===========  ===============  =======  ================  =======  ==================  =======  ==================  ====
 Total
 ===========  ===============  =======  ================  =======  ==================  =======  ==================  ====
 Opening AUM           40,543   43,533            46,907   48,431              50,180   46,853              48,235
 Gross
  inflows               3,981    4,799             3,801    3,880               3,224    3,154               2,760
 Gross
  outflows            (2,675)  (2,540)           (2,458)  (3,310)             (4,474)  (4,171)             (3,593)
 Net flows              1,306    2,259             1,343      570             (1,250)  (1,017)               (833)
 Market / FX
  movements             1,684    1,115               181    1,179             (2,077)    2,399                 319
 Closing AUM           43,533   46,907            48,431   50,180              46,853   48,235              47,721

 Mutual
 funds
 ===========  ===============  =======  ================  =======  ==================  =======  ==================  ====
 Opening AUM           35,216   37,986            40,930   42,319              43,745   41,072              41,998
 Gross
  inflows               3,864    4,410             3,656    3,624               3,093    3,051               2,600
 Gross
  outflows            (2,462)  (2,415)           (2,411)  (3,166)             (4,022)  (4,046)             (3,373)
 Net flows              1,402    1,995             1,245      458               (929)    (995)               (773)
 Market / FX
  movements             1,368      949               144      968             (1,744)    1,921                 248
 Closing AUM           37,986   40,930            42,319   43,745              41,072   41,998              41,473

 Segregated
 mandates
 ===========  ===============  =======  ================  =======  ==================  =======  ==================  ====
 Opening AUM            4,244    4,394             4,708    4,896               5,208    4,614               4,961
 Gross
  inflows                 117      308               142      231                 129      100                 155
 Gross
  outflows              (210)    (119)              (31)     (74)               (435)    (117)               (217)
 Net flows               (93)      189               111      157               (306)     (17)                (62)
 Market / FX
  movements               243      125                77      155               (288)      364                   2
 Closing AUM            4,394    4,708             4,896    5,208               4,614    4,961               4,901

 Investment
 trusts
 ===========  ===============  =======  ================  =======  ==================  =======  ==================  ====
 Opening AUM            1,083    1,153             1,269    1,216               1,227    1,167               1,276
 Gross
  inflows                   -       81                 3       25                   2        3                   5
 Gross
  outflows                (3)      (6)              (16)     (70)                (17)      (8)                 (3)
 Net flows                (3)       75              (13)     (45)                (15)      (5)                   2
 Market / FX
  movements                73       41              (40)       56                (45)      114                  69
 Closing AUM            1,153    1,269             1,216    1,227               1,167    1,276               1,347
This information is provided by RNS, the news service of the
London Stock Exchange. RNS is approved by the Financial Conduct
Authority to act as a Primary Information Provider in the United
Kingdom. Terms and conditions relating to the use and distribution
of this information may apply. For further information, please
contact rns@lseg.com or visit www.rns.com.
END
TSTFFEFMSFASEFS
(END) Dow Jones Newswires
October 11, 2018 02:00 ET (06:00 GMT)
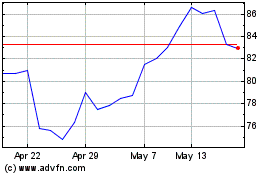
Jupiter Fund Management (LSE:JUP)
Historical Stock Chart
From Apr 2024 to May 2024

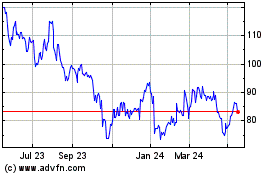
Jupiter Fund Management (LSE:JUP)
Historical Stock Chart
From May 2023 to May 2024
