Interim Results
June 10 2004 - 3:00AM
UK Regulatory
RNS Number:6099Z
Dewhurst PLC
10 June 2004


Dewhurst plc

Directors' Interim Report

FIRST HALF

Turnover at the Group increased by 8% to #14.3 million. Profit before tax rose
to #1.4 million (#955,000). Earnings per share rose to 9.01p (6.33p), an
increase of 42%.

The gain in sales was evenly spread between the Lift and Keypad Divisions. At
the Lift Division there were improvements in sales both in the UK and overseas.
For the Keypad Division, the growth was in overseas sales offset by a decline in
the UK, with a major customer transferring more of its manufacturing offshore.

The first half improvement in profit was assisted by the absence of the major
redundancy costs incurred last year. This effect is likely to lead to this year
being more evenly balanced between the first and second half than last year.

OUTLOOK

Worldwide the Lift market is expected to remain reasonable for the second half.
Inflationary clouds on the horizon are not anticipated to have any material
impact for this year at least. The strength in keypad sales is currently
underpinned by the demand for EPP pinpads, which are being retrofitted to
existing bank cash machines to meet new security and encryption requirements.
This demand is expected to continue during the second half and into next year
before tailing off.

DIVIDENDS

The Directors have declared an interim dividend of 1.55p, compared with 1.46p
last year. The interim dividend is payable on 31st August 2004 and warrants will
be posted on 26th August 2004 to shareholders appearing in the Register at 3:00
p.m. on 16th July 2004.

By Order of the Board
M N GREEN
Secretary

10th June 2004

Dewhurst plc

The unaudited consolidated profit and loss account, balance sheet and cash flow
statement of Dewhurst plc and its subsidiaries for the half-year ended 31st
March 2004, as compared with the corresponding half-year ended 31st March 2003
and the year ended 30th September 2003, shows the following results:

Consolidated profit and loss account

                          Half year ended     Half year ended             Year
                                                                         ended
                          31st March 2004     31st March 2003     30th September
                                                                          2003
                               #(000)'s            #(000)'s           #(000)'s
 -----------------------       ----------          ----------        -----------

Turnover                         14,343              13,290             27,205

Operating costs                 (12,986)            (12,337)           (24,764)
 -----------------------       ----------          ----------        -----------
Operating profit                  1,357                 953              2,441

Net interest                         44                   2                 24
-----------------------        ----------          ----------        -----------

Profit on ordinary
activities before
tax                               1,401                 955              2,465
Taxation                     Est. (513)          Est. (331)               (814)
-----------------------        ----------          ----------        -----------

Profit for the
financial period                    888                 624              1,651
Dividends                          (153)               (144)              (431)
-----------------------        ----------          ----------        -----------

Retained profit for
the period                          735                 480              1,220
-----------------------        ----------          ----------        -----------

Basic earnings per
share                              9.01p               6.33p             16.76p
Diluted earnings per
share                              9.01p               6.33p             16.76p
Dividends per share                1.55p               1.46p              4.38p

All disclosures relate only to continuing operations


Dewhurst plc

Consolidated balance sheet
                                  Half year           Half year           Year
                                      ended               ended          ended
                                 31st March   31st March        30th September
                                       2004         2003                 2003
                                   #(000)'s     #(000)'s            #(000)'s
        ------------------------    ---------   ----------         -----------
Fixed assets
Intangible                              936        1,025                 999
Tangible
- Land and buildings                  1,541        1,480               1,572
- Plant and machinery                 1,686        1,563               1,534
------------------------            ---------   ----------         -----------
                                      3,227        3,043               3,106
        ------------------------    ---------   ----------         -----------
                                      4,163        4,068               4,105

Current assets
Stocks                                3,683        4,466               4,107
Debtors                               5,493        4,724               4,589
Short-term deposits                   2,015          213               1,224
Cash                                  1,272        1,838               2,301
------------------------            ---------   ----------         -----------
                                     12,463       11,241              12,221
Creditors: amounts falling due
within one year                      (4,052)      (4,058)             (4,355)
------------------------            ---------   ----------         -----------

Net current assets                    8,411        7,183               7,866
------------------------            ---------   ----------         -----------

Total assets less current
liabilities                          12,574       11,251              11,971

Creditors: amounts falling due
after one year                            -         (303)                 (7)
Provisions for liabilities and
charges                                (250)        (109)               (250)
------------------------            ---------   ----------         -----------

Net assets                           12,324       10,839              11,714
------------------------            ---------   ----------         -----------

Capital and reserves
Called up share capital                 985          985                 985
Share premium account                   157          157                 157
Revaluation reserve                     423          423                 423
Capital redemption reserve              152          152                 152
Profit and loss account              10,607        9,122               9,997
------------------------            ---------   ----------         -----------

Equity shareholders' funds           12,324       10,839              11,714
------------------------            ---------   ----------         -----------

The results for the 2003 year set out above are abridged. Full accounts for that
year, on which the auditors of the company made an unqualified report, have been
delivered to the Registrar of Companies.


Dewhurst plc

Consolidated cash flow statement

                                  Half year ended Half year ended         Year
                                                                         ended
                                  31st March 2004 31st March 2003 30th September
                                                                          2003
                                       #(000)'s        #(000)'s       #(000)'s
          -----------------------      ----------     -----------     ----------

Net cash inflow from
operating activities                      1,108           1,217          4,133

Returns on investment and
servicing of finance:
Interest and
dividends received                           44              18             61
Interest paid                                 -             (15)           (36)
Interest element
from finance lease
rental payments                               -              (1)            (1)
-----------------------                ----------     -----------     ----------
Net cash
inflow/(outflow)
from returns on
investment and
servicing of finance                         44               2             24

Taxation:
UK taxation                                (416)           (120)          (442)
Overseas taxation                          (185)           (182)          (358)
-----------------------                ----------     -----------     ----------
Net cash outflow
from taxation                              (601)           (302)          (800)

Capital expenditure and financial
investment:
Purchase of fixed
assets                                     (531)           (434)          (724)
Sale of tangible
fixed assets                                 37             101             63
-----------------------                ----------     -----------     ----------
Net cash outflow
from capital
expenditure &
financial investment                       (494)           (333)          (661)

Equity dividends
paid                                       (288)           (274)          (418)
          -----------------------      ----------     -----------     ----------
Net cash
inflow/(outflow)
before use of liquid
resources and
financing                                  (231)            310          2,278

Management of liquid resources
(Placed)/withdrawn
from short-term
deposit                                    (791)            190           (821)
-----------------------                ----------     -----------     ----------
                                           (791)            190           (821)
Financing
Bank loan repayments                          -             (45)          (546)
Capital element of
finance lease rental
payments                                     (7)            (19)           (13)
-----------------------                ----------     -----------     ----------
                                             (7)            (64)          (559)

Increase/(decrease)
in cash in period                        (1,029)            436            898
-----------------------                ----------     -----------     ----------


                      This information is provided by RNS
            The company news service from the London Stock Exchange

END
IR MGGGVRLLGDZM
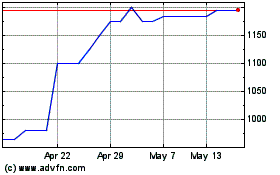
Dewhurst (LSE:DWHT)
Historical Stock Chart
From Jun 2024 to Jul 2024

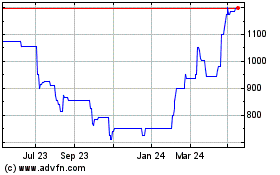
Dewhurst (LSE:DWHT)
Historical Stock Chart
From Jul 2023 to Jul 2024
