Interim Results
June 14 2001 - 7:25AM
UK Regulatory
RNS Number:2515F
Dewhurst PLC
14 June 2001

                                 DEWHURST PLC

            INTERIM RESULTS FOR THE SIX MONTHS ENDED 31 MARCH 2001

Directors' Interim Report

FIRST HALF

Turnover at the Group increased by 9% to #11.3 million with sales growth at
all companies. Operating profit before exceptional costs was #811,000 (#
802,000) a rise of 1%. Profit before tax fell to #678,000 (#823,000) after
exceptional items of #134,000. These exceptional items were the costs to date
of the refurbishment of the Hounslow factory, which was outlined in last
year's annual report. Earnings per share fell to 4.30p (5.50p) with the lower
profit.

Direct Lift Division exports from the UK fell back sharply in the first half,
as projected. However sales at overseas companies were reasonably buoyant,
helped by the full 6 months' contribution from ALC in Australia. Last year's
first half only had 2 months' contribution from ALC.

Rail sales were down, but this was more than made up for by a significant
increase in keypad sales. These were particularly strong in North America and
were helped by the introduction of a new range of keypads for Automatic Teller
Machines.

Our ability to pass on cost increases is limited. We have partially offset
this adverse affect through productivity improvements and product design.

OUTLOOK

The refurbishment project is now well underway. A significant portion of the
electrical work was carried out in the first half and the bulk of the
remainder is planned for completion this year. Some of the stores
reorganisation has been carried out and the production reorganisation has now
commenced. It is still expected that the total exceptional cost for this
project will be in the range #500,000 to #600,000.

The lower export demand for lift products is expected to continue through the
second half, but demand at overseas subsidiaries and for keypads is forecast
to remain firm.

 DIVIDENDS

The Directors have declared an interim dividend of 1.32p, compared with 1.25p
last year. The interim dividend is payable on 3rd September 2001 and warrants
will be posted on 30th August 2001 to shareholders appearing in the Register
at 3:00 p.m. on 20th July 2001.

By Order of the Board


M N GREEN

Secretary

14th June 2001


The unaudited consolidated profit and loss account, balance sheet and cash
flow statement of Dewhurst plc and its subsidiaries for the half year ended
31st March 2001, as compared with the corresponding half year ended 2nd April
2000 and the year ended 30th September 2000, shows the following results:

 Consolidated profit and loss account
                                       Half year     Half year             Year
                                           ended         ended
                                                                          ended
                                      31st March     2nd April   30th September
                                            2001                           2000
                                                          2000
                                        #(000)'s      #(000)'s         #(000)'s

Turnover                                  11,304        10,370           21,660

Operating costs                         (10,493)       (9,568)         (19,665)
                                      __________   ___________     ____________
Operating profit before                      811           802            1,995
exceptional costs

Exceptional costs                          (134)             -                -
                                      __________   ___________     ____________
Operating profit                             677           802            1,995

Net interest                                   1            21               10
                                      __________   ___________     ____________
Profit on ordinary activities                678           823            2,005
before tax
Taxation                              Est. (242)    Est. (256)            (663)
                                      __________   ___________     ____________
Profit for the financial period              436           567            1,342
Dividends                                  (133)         (129)            (383)
                                      __________   ___________     ____________
Retained profit for the period               303           438              959
                                      ==========   ===========     ============

Basic earnings per share                   4.30p         5.50p           13.01p
Diluted earnings per share                 4.26p         5.45p           12.90p
Dividends per share                        1.32p         1.25p            3.75p

All disclosures relate only to continuing operations

Consolidated balance sheet
                              Half year              Half
                                  year               Year                  Year
                                  ended             ended                 ended
                                   31st               2nd        30th September
                                  March             April
                                    2001             2000                  2000
                                #(000)'s         #(000)'s              #(000)'s

Fixed assets
Intangible                         1,174            1,376                 1,327
Tangible
- Land and buildings               1,385            1,386                 1,389
- Plant and machinery              1,576            1,765                 1,769
                              __________      ___________           ___________
                                   2,961            3,151                 3,158
                              __________      ___________           ___________
                                   4,135            4,527                 4,485

Current assets
Stocks                             4,048            4,112                 4,151
Debtors                            4,710            4,246                 4,050
Investments                            -               25                    27
Cash                               1,357              757                 1,707
                              __________     ____________             _________
                                  10,115            9,140                 9,935
Creditors: amounts falling due    (3,894)          (3,399)               (4,053)
within one year
                                ________          ________             ________
Net current assets                 6,221            5,741                 5,882
                                ________          ________             ________
Total assets less current         10,356           10,268                10,367
liabilities

Creditors: amounts falling due      (631)          (1,135)                (734)
after one year
Provisions for liabilities and      (145)            (185)                (145)
charges
                                 ________        _________             ________
Net assets                         9,580            8,948                9,488
                                 ========        =========             ========

Capital and reserves
Called up share capital            1,015            1,032                1,032
Share premium account                127              127                  127
Revaluation reserve                  423              423                  423
Capital redemption reserve           114               97                   97
Profit and loss account            7,901            7,269                7,809
                                ________       __________             ________
Equity shareholders' funds         9,580            8,948                9,488
                                ========       ==========             ========


Consolidated cash flow statement
                                              Half year  Half year         Year
                                                  ended      ended        Ended
                                             31st March  2nd April         30th
                                                                      September
                                                   2001       2000         2000
                                               #(000)'s   #(000)'s     #(000)'s

Net cash inflow from operating activities           542        192        1,982

Returns on investment and servicing of
finance:
Interest and dividends received                      32         21           57
Interest paid                                      (30)          -         (46)
Interest element from finance lease rental          (1)          -          (1)
payments
                                             __________ __________   __________
Net cash inflow from returns on investment            1         21           10
and servicing of finance

Taxation:
UK taxation                                       (238)       (53)        (336)
Overseas taxation                                  (62)       (44)        (135)
                                             __________ __________   __________
Net cash outflow from taxation                    (300)       (97)        (471)

Capital expenditure and financial
investment:
Purchase of fixed assets                          (112)      (170)        (403)
Sale of tangible fixed assets                        12         20           53
                                             __________ __________   __________
Net cash outflow from capital expenditure &       (100)      (150)        (350)
financial investment

Acquisitions and disposals:
Purchase of subsidiary undertakings                   -    (1,664)      (1,664)
                                             __________ __________   __________
Net cash outflow from acquisitions                    -    (1,664)      (1,664)

Equity dividends paid                             (254)      (237)        (366)
                                             __________ __________   __________

Net cash outflow before use of liquid             (111)    (1,935)        (859)
resources and financing

Management of liquid resources
(Purchase)/sale of short-term deposits            (203)        752          752

Financing
Bank loan                                             -      1,000        1,000
Bank loan repayments                               (76)          -         (93)
Capital element of finance lease rental            (23)       (10)         (42)
payments
Repurchase of shares                              (140)          -            -
                                             __________ __________   __________
                                                  (239)        990          865

(Decrease)/increase in cash in period             (553)      (193)          758
                                             ========== ==========  ===========


The results for the 2000 year set out above are abridged. Full accounts for
that year, on which the auditors of the company made an unqualified report,
have been delivered to the Registrar of Companies.
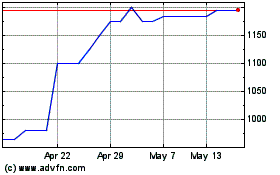
Dewhurst (LSE:DWHT)
Historical Stock Chart
From Jun 2024 to Jul 2024

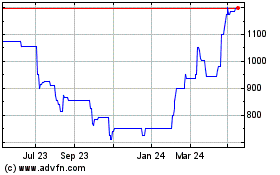
Dewhurst (LSE:DWHT)
Historical Stock Chart
From Jul 2023 to Jul 2024
