InterRent REIT Results for the First Quarter of 2011
June 06 2011 - 5:49PM
Marketwired Canada
NOT FOR DISTRIBUTION TO UNITED STATES NEWSWIRE SERVICES OR FOR DISSEMINATION IN
THE UNITED STATES


InterRent Real Estate Investment Trust (TSX:IIP.UN)(TSX:IIP.DB) ("InterRent")
today reported financial results for the first quarter ended March 31, 2011
continuing to demonstrate significant progress in repositioning the REIT and
preparing for future growth.


Highlights from operations


--  Operating revenue for the quarter was $9.4 million, up 9.5% compared to
    Q1 2010. The average monthly rent for March 2011 increased to $810 per
    suite from $780 (March 2010), an increase of 3.8%.

--  Reduction in economic vacancy to 4.5% for March 2011 from 11.5% for
    March 2010.

--  Net Operating Income (NOI) has improved significantly increasing to $4.3
    million for Q1 2011 compared to $2.9 million for Q1 2010 - an increase
    of 47.4%.

--  As a result of the capital investments of over $20 million in 2010, the
    REIT began a process of preparing applications for Above Guideline
    Increases (AGIs). As of June 3, 2011, 35 applications have been
    submitted to the Landlord and Tenant Board and 8 more are in the final
    stages of preparation representing approximately two-thirds of the
    portfolio.

--  For the quarter, Funds From Operation (FFO) increased to $0.6 million
    (or $0.02 per unit) compared to a negative $0.9 million (or negative
    $0.03 per unit) for Q1 2010.

--  Distributable Income (DI) for the quarter of $1.1 million (or $0.03 per
    unit) was an improvement of $1.8 million (or $0.05 per unit) over Q1
    2010.

--  The fair market revaluation of investment properties under International
    Financial Reporting Standards (IFRS) resulted in an increase of the
    carrying value of the assets as at January 1, 2010 of $17 million (an
    increase of 6.1%). For December 31, 2010, the carrying value increased
    from $270 million (as reported under previous GAAP for the fourth
    quarter of 2010) to $332 million - an increase of $62 million, or 23%.

--  As part of the continuing strategy of re-aligning the assets of the
    portfolio, 5 non-core properties were sold in the quarter (totaling 84
    suites) and 1 property was acquired (70 suites) in Sarnia (Western
    Region) that is well aligned to the growth strategy of the REIT.


Financial Highlights

Selected Financial Information
In $000's, except per Unit amounts           3 Months Ended  3 Months Ended
and Units outstanding                        March 31, 2011  March 31, 2010
----------------------------------------------------------------------------

Operating revenue                            $        9,421  $        8,604
Operating NOI                                         4,335           2,940
NOI %                                                  46.0%           34.2%
NOI per unit                                 $         0.14  $         0.11
----------------------------------------------------------------------------
Funds from operations (FFO)                  $          593  $         (867)
FFO per unit                                 $         0.02  $        (0.03)
----------------------------------------------------------------------------
Adjusted funds from operations (AFFO)        $        1,121  $         (661)
AFFO per unit                                $         0.03  $        (0.02)
----------------------------------------------------------------------------
Distributable income (DI)                    $        1,108  $         (679)
DI per unit                                  $         0.03  $        (0.02)
----------------------------------------------------------------------------
Weighted average units outstanding (WAU)         32,296,780      28,045,435
----------------------------------------------------------------------------


Results for the Quarter

The first quarter of the year is never an easy one as we encounter the
unpredictable effects of mother nature. Winter weather has not only an impact on
our utility costs, but also on operating revenue (as vacancies are more
difficult to fill than during the summer months) and operating expenses (as
heating and snow removal costs increased in many regions).


The REIT has now experienced five consecutive quarters of gross revenue growth
and three consecutive quarters of net revenue growth. This continued increase in
gross and net revenues is as a result of management executing on its strategic
plan that was put in place in late 2009. Management believes that occupancy is
now, for the most part, stabilized and that the repositioning strategy has
positioned InterRent to achieve market rents at the properties as suites
turnover. Furthermore, management is aggressively pursuing above guideline
increases for 2011 based on the capital expenditures in 2010. To date, 35
applications have been submitted to the Landlord and Tenant Board and 8 more are
in the final stages of preparation. The increases being applied for (without
including the guideline increase) range from 1.8% to 9%.


The economic vacancy increased slightly from December 2010 to March 2011. The
0.8% increase was expected as management removed some tenants after completing a
second round of tenant reviews in an ongoing effort to improve the properties.
Improving the tenant base during the off-peak season makes the most sense given
that many of the suites required maintenance. The suites will be repaired and
ready for peak rental season. Management expects some modest increases in the
vacancy rate for the next quarter as it drives gross rents on suite turnover,
rolls out the AGIs and increases parking and locker charges.


Operating expenses decreased by $0.3 million for the quarter compared to 2010.
The decrease in operating expenses was driven mainly by reductions in staffing
as operations were ramping up in 2010 given the deferred maintenance in the
property and the REIT's repositioning strategy. Management believes that the
staffing levels are adequate to address not only the current requirements but
also the integration of planned strategic acquisitions.


NOI for Q1 of 2011 saw significant improvement over Q1 2010 increasing by $1.4
million, or 49.5%. NOI for the stabilized portfolio was 46.1% for the quarter
and NOI excluding the assets held for sale was 47.5%. "We are pleased to see
continued improvement in our NOI for comparative quarters, especially factoring
in the difficult winter we experienced. We believe the improvements in NOI
quarter over comparative quarter will continue. We will continue to grow our NOI
organically by driving out unnecessary costs and increasing our top line through
AGIs and bringing units to market rent on turnover. Our valued team members are
extremely focused on growing our bottom line and on providing a superior level
of customer service that sets us apart." said Mike McGahan.


FFO were $0.6 million, and increase of $1.5 million from the negative $0.9
million of Q1 2010. FFO per REIT unit was $0.02 for the quarter compared to a
negative $0.03 for Q1 2010.


AFFO, which is calculated by adjusting FFO for standardized maintenance capital
expenditure as well as non-cash items affecting earnings (such as straight-line
rent, accretion of discount in convertible debenture, amortization of deferred
finance fee and unit based compensation expense), was $1.1 million for the
quarter compared to negative $0.7 million for Q1 2010. The increase of $1.8
million improves our AFFO from a negative $0.02 per unit in Q1 2010 to $0.03 per
unit for Q1 2011, which matches our distribution in the quarter.


DI was $1.1 million for Q1 2011 as compared to a negative $0.7 million for Q1
2010. The DI of $1.1 million equates to $0.03 per unit which matches the
distributions paid by the REIT in the quarter.


In keeping with management's strategy of maximizing returns for unitholders and
focusing on clusters of buildings within geographical proximity to each other in
order to build operational efficiencies and attract focused, professional staff,
properties are reviewed on a regular basis to determine if they should be kept
or disposed of. Five properties (totalling 84 suites) were sold in the quarter
and sixteen others (totalling 439 suites) were listed for sale. On March 24,
2011 the Trust acquired an investment property (70 suites) for a purchase price
of $3.67 million, or approximately $52,500 per suite.


About InterRent

InterRent is a real estate investment trust engaged in building unitholder value
through the accretive acquisition, ownership and operation of strategically
located income producing multi-residential real estate in Canada.


(i)Non-GAAP Measures

InterRent prepares and releases unaudited quarterly and audited consolidated
annual financial statements prepared in accordance with IFRS (GAAP). In this and
other earnings releases, as a complement to results provided in accordance with
IFRS, InterRent also discloses and discusses certain non-GAAP financial
measures, including NOI, FFO, AFFO, DI and weighted average units. These
non-GAAP measures are further defined and discussed in the MD&A released on June
6, 2011, which should be read in conjunction with this press release. Since NOI,
FFO, AFFO and weighted average units are not determined by IFRS, they may not be
comparable to similar measures reported by other issuers. InterRent has
presented such non-GAAP measures as Management believes these measures are
relevant measures of the ability of InterRent to earn and distribute cash
returns to Unitholders and to evaluate InterRent's performance. These non-IFRS
measures should not be construed as alternatives to net income (loss) or cash
flow from operating activities determined in accordance with GAAP as an
indicator of InterRent's performance.


Cautionary Statements

The comments and highlights herein should be read in conjunction with the most
recently filed annual information form as well as our consolidated financial
statements and management's discussion and analysis for the same period.
InterRent's publicly filed information is located at www.sedar.com.


This news release contains "forward-looking statements" within the meaning
applicable to Canadian securities legislation. Generally, these forward-looking
statements can be identified by the use of forward-looking terminology such as
"plans", "anticipated", "expects" or "does not expect", "is expected", "budget",
"scheduled", "estimates", "forecasts", "intends", "anticipates" or "does not
anticipate", or "believes", or variations of such words and phrases or state
that certain actions, events or results "may", "could", "would", "might" or
"will be taken", "occur" or "be achieved". InterRent is subject to significant
risks and uncertainties which may cause the actual results, performance or
achievements to be materially different from any future results, performance or
achievements expressed or implied by the forward looking statements contained in
this release. A full description of these risk factors can be found in
InterRent's most recently publicly filed information located at www.sedar.com.
InterRent cannot assure investors that actual results will be consistent with
these forward looking statements and InterRent assumes no obligation to update
or revise the forward looking statements contained in this release to reflect
actual events or new circumstances.
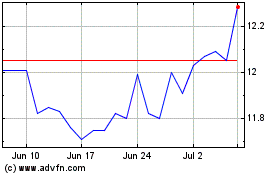
InterRent Real Estate In... (TSX:IIP.UN)
Historical Stock Chart
From Jun 2024 to Jul 2024

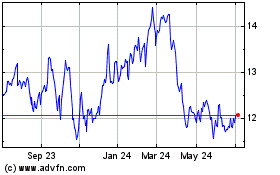
InterRent Real Estate In... (TSX:IIP.UN)
Historical Stock Chart
From Jul 2023 to Jul 2024
