Banks Log Lower or Negative Provisions for Credit Losses
April 15 2021 - 10:08AM
Dow Jones News
By Allison Prang
Here's a look at what credit quality looked like at some major
financial firms for the first quarter as the Covid-19 pandemic
continues to weigh on consumers and businesses:
TRUIST FINANCIAL:
--Truist's provision for credit losses was $48 million in the
first quarter. In fourth quarter of last year, it was $177 million
and in 1Q a year earlier it was $893 million.
--Nonperforming loans and leases as a percentage of loans and
leases held for investment were 0.4%, lower than 0.44% in 4Q and
higher than 0.32% in 1Q a year ago.
--Net charge-offs as a percentage of average loans and leases on
an annualized basis was 0.33%. It rose from 0.27% in 4Q and fell
from 0.36% in 1Q a year ago.
BANK OF AMERICA:
--The company had a negative provision for credit losses of
$1.86 billion. In 4Q, its provision was $53 million and in 1Q a
year ago, it was $4.76 billion.
--Nonperforming loans and leases to total loans and leases was
0.58%, from 0.54% in 4Q and from 0.39% the comparable 1Q a year
ago.
--The net charge-off ratio was 0.37%. It narrowed from 0.38% in
4Q and from 0.46% in 1Q a year ago.
U.S. BANCORP:
--The provision for credit losses was negative $827 million,
compared with a provision of $441 million in 4Q and $993 million in
1Q a year ago.
--The net charge-off ratio was 0.31%. It narrowed from 4Q's
0.58% and from 0.53% in 1Q a year ago.
CITIGROUP:
--Citigroup's provision for credit losses and for benefits and
claims was negative $2.06 billion, compared with negative $46
million in 4Q and compared with a provision $6.96 billion in 1Q a
year earlier.
--Nonaccrual loans as a percentage of total loans was 0.76%,
compared with 0.84% in 4Q and 0.58% in 1Q a year ago.
Write to Allison Prang at allison.prang@wsj.com
(END) Dow Jones Newswires
April 15, 2021 09:53 ET (13:53 GMT)
Copyright (c) 2021 Dow Jones & Company, Inc.
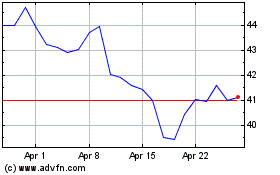
US Bancorp (NYSE:USB)
Historical Stock Chart
From Jun 2024 to Jul 2024

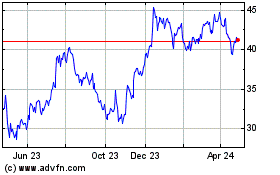
US Bancorp (NYSE:USB)
Historical Stock Chart
From Jul 2023 to Jul 2024
