- TMS light trucks set new February
record
- RAV4 charges ahead, marks best-ever
February
- Lexus LX, RX, and NX see
double-digit gains
Please replace the release with the following corrected version
due to multiple revisions.
The corrected release reads:
TOYOTA MOTOR SALES
REPORTS 4.1 PERCENT FEBRUARY INCREASE
- TMS light trucks set new February
record
- RAV4 charges ahead, marks best-ever
February
- Lexus LX, RX, and NX see
double-digit gains
Toyota Motor Sales (TMS), U.S.A., Inc. today reported February
2016 sales of 187,954 vehicles, an increase of 4.1 percent from
February 2015 on a volume basis. With the same number of selling
days in February 2016 and 2015, sales were also up 4.1 percent on a
daily selling rate (DSR) basis.
Toyota division February 2016 sales were up 4.7 percent on both
a DSR and volume basis with sales of 164.864 units.
“Light trucks continue to drive strong demand in 2016,” said
Bill Fay, group vice president and general manager for the Toyota
division. “The Toyota division had back-to-back, best-ever light
truck monthly records, supported by another best-ever month in
February for RAV4.”
Lexus reported February 2016 sales of 23,090 units.
“As leaders in luxury crossover vehicles, it’s no surprise to us
that our SUV lineup continues to propel our sales performance,”
said Jeff Bracken, group vice president and general manager for the
Lexus division. “It wasn’t just a good month for SUVs, however—IS,
CT and RC have exceeded our sales expectations for the month of
February, validating the appeal of these models to the next
generation of luxury consumer.”
February 2016 Highlights:
- Combined TMS light truck sales of
94,864 units, up 9.7 percent
- RAV4 posts best-ever February with
sales of 25,523 units; up more than 16 percent
- Highlander reports best-ever February
sales with sales of 12,466 units
- 4Runner and Sienna up 32 and 5.5
percent respectively
- Tacoma up 14.5 percent with sales of
14,172 units
- NX up 39.1 percent
- RX up 10.8 percent with sales of 7,192
units
- LX up more than 81 percent
*Note: Unless otherwise stated, all figures reflect unadjusted
sales volume
About Toyota
Toyota (NYSE:TM), the world's top automaker and creator of the
Prius and the Mirai fuel cell vehicle, is committed to building
vehicles for the way people live through our Toyota, Lexus and
Scion brands. Over the past 50 years, we’ve built more than 30
million cars and trucks in North America, where we operate 14
manufacturing plants (10 in the U.S.) and directly employ more than
44,000 people (more than 34,000 in the U.S.). Our 1,800 North
American dealerships (1,500 in the U.S.) sold more than 2.8 million
cars and trucks (nearly 2.5 million in the U.S.) in 2015 – and
about 80 percent of all Toyota vehicles sold over the past 20 years
are still on the road today.
Toyota partners with philanthropic organizations across the
country, with a focus on education, safety and the environment. As
part of this commitment, we share the company’s extensive know-how
garnered from building great cars and trucks to help community
organizations and other nonprofits expand their ability to do good.
For more information about Toyota, visit
www.toyotanewsroom.com.
TOYOTA U.S. SALES SUMMARY February, 2016
-- CURRENT MONTH
-- -- CALENDAR YEAR TO DATE -- DSR % VOL %
DSR % VOL % 2016
2015 CHG CHG
2016 2015
CHG CHG TOTAL TOYOTA
187,954 180,467 4.1 4.1 349,237
349,661 4.0 -0.1 TOTAL TOYOTA DIV. 164,864
157,472 4.7 4.7 305,214 303,535 4.7 0.6 TOTAL LEXUS 23,090
22,995 0.4 0.4
44,023 46,126 -0.6
-4.6 YARIS 908 1,364 -33.4 -33.4 1,456 2,806 -45.9 -48.1
COROLLA 29,342 27,839 5.4 5.4 51,704 55,196 -2.4 -6.3 MIRAI 30 0
N/A N/A 56 0 N/A N/A PRIUS 10,550 12,018 -12.2 -12.2 19,861 24,262
-14.7 -18.1 CAMRY 32,405 32,942 -1.6 -1.6 59,253 59,705 3.4 -0.8
AVALON 3,961 4,102 -3.4 -3.4 7,558 8,883 -11.4 -14.9 SCION FR-S 554
806 -31.3 -31.3 1,061 1,552 -28.8 -31.6 SCION iA 2,305 0 N/A N/A
4,145 0 N/A N/A SCION iM 1,317 0 N/A N/A 2,567 0 N/A N/A SCION iQ 1
90 -98.9 -98.9 3 167 -98.1 -98.2 SCION xD 1 122 -99.2 -99.2 4 342
-98.8 -98.8 SCION xB 787 1,469 -46.4 -46.4 1,569 2,897 -43.6 -45.8
SCION tC 917 1,377 -33.4 -33.4 1,632 2,596 -34.5 -37.1 TOTAL SCION
5,882 3,864 52.2 52.2 10,981 7,554 51.4 45.4
TOTAL TOYOTA DIV.
CAR 83,078 82,129
1.2 1.2
150,869 158,406
-0.8 -4.8 CT 762 978 -22.1 -22.1
1,384 1,983 -27.3 -30.2 IS 2,961 3,383 -12.5 -12.5 5,139 6,758
-20.8 -24.0 RC 920 984 -6.5 -6.5 1,675 1,831 -4.7 -8.5 ES 3,826
4,192 -8.7 -8.7 7,226 8,272 -9.0 -12.6 GS 1,167 1,851 -37.0 -37.0
2,465 3,530 -27.3 -30.2 LS 374 506 -26.1 -26.1 771 1,172 -31.5
-34.2 LFA 2 1 100.0 100.0 3 3 4.2 0.0
TOTAL LEXUS CAR
10,012 11,895
-15.8 -15.8 18,663
23,549 -17.4
-20.7 TOTAL TOYOTA CAR 93,090
94,024 -1.0
-1.0 169,532
181,955 -2.9 -6.8
RAV4 25,523 21,943 16.3 16.3 47,077 41,767 17.4 12.7 FJ
CRUISER 0 25 -100.0 -100.0 1 183 -99.4 -99.5 VENZA 124 2,272 -94.5
-94.5 308 4,377 -92.7 -93.0 HIGHLANDER 12,466 11,263 10.7 10.7
23,724 22,323 10.7 6.3 4RUNNER 8,476 6,420 32.0 32.0 15,972 13,365
24.5 19.5 SIENNA 11,541 10,935 5.5 5.5 22,533 19,868 18.1 13.4
SEQUOIA 954 856 11.4 11.4 1,806 1,760 6.9 2.6 LAND CRUISER 229 205
11.7 11.7 502 456 14.7 10.1 TOTAL TOYOTA DIV. SUV 47,772
42,984 11.1 11.1
89,390 84,231 10.5
6.1 TACOMA 14,172 12,372 14.5 14.5 26,889 23,781 17.8 13.1
TUNDRA 8,301 9,052 -8.3 -8.3 15,533 17,249 -6.2 -9.9 TOTAL TOYOTA
DIV. PICKUP 22,473 21,424 4.9
4.9 42,422 41,030
7.7 3.4
TOTAL TOYOTA DIV. TRUCK
81,786 75,343 8.6
8.6 154,345
145,129 10.8 6.4
NX 3,709 2,666 39.1 39.1 6,842 5,478 30.1 24.9 RX 7,192
6,490 10.8 10.8 14,148 13,059 12.9 8.3 GX 1,650 1,653 -0.2 -0.2
3,258 3,456 -1.8 -5.7 LX 527 291 81.1 81.1 1,112 584 98.3 90.4
TOTAL LEXUS TRUCK 13,078
11,100 17.8 17.8
25,360 22,577
17.0 12.3 TOTAL TOYOTA
TRUCK 94,864 86,443
9.7 9.7
179,705 167,706
11.6 7.2 SELLING DAYS 24
24
48 50
DSR = DAILY SELLING RATE
TOYOTA U.S. SALES
SUMMARY February, 2016
-- CURRENT MONTH -- -- CALENDAR YEAR TO
DATE -- DSR % VOL % DSR % VOL %
2016 2015
CHG CHG 2016
2015 CHG
CHG * NORTH AMERICAN BUILT VEHICLES COROLLA
29,342 27,839 5.4 5.4 51,704 55,196 -2.4 -6.3 CAMRY 32,396 32,927
-1.6 -1.6 59,236 59,673 3.4 -0.7 AVALON 3,961 4,102 -3.4 -3.4 7,558
8,883 -11.4 -14.9 SCION iA 2,305 0 N/A N/A 4,145 0 N/A N/A RAV4
15,011 15,844 -5.3 -5.3 27,474 30,165 -5.1 -8.9 VENZA 124 2,272
-94.5 -94.5 308 4,377 -92.7 -93.0 HIGHLANDER 12,070 11,007 9.7 9.7
22,953 21,799 9.7 5.3 SIENNA 11,541 10,935 5.5 5.5 22,533 19,868
18.1 13.4 SEQUOIA 954 856 11.4 11.4 1,806 1,760 6.9 2.6 TACOMA
14,172 12,372 14.5 14.5 26,889 23,781 17.8 13.1 TUNDRA 8,301 9,052
-8.3 -8.3 15,533 17,249 -6.2 -9.9 ES 1,590 0 N/A N/A 2,594 0
N/A N/A RX 6,544 6,127 6.8 6.8 12,448 12,136 6.8 2.6
TOTAL 138,311 133,333 3.7 3.7
255,181 254,887 4.3 0.1 N.A.
VEHICLES % OF TOTAL 73.6%
73.9%
73.1% 72.9%
TOYOTA DIV. IMPORT CAR 15,074 17,261
-12.7 -12.7 28,226 34,654 -15.2 -18.5 LEXUS IMPORT CAR 8,422 11,895
-29.2 -29.2 16,069 23,549 -28.9 -31.8 TOYOTA DIV NA BUILT CARS
68,004 64,868 4.8 4.8 122,643 123,752 3.2 -0.9 LEXUS NA BUILT CARS
1,590 0 N/A N/A 2,594 0 N/A N/A
TOTAL TOYOTA CARS
93,090 94,024 -1.0
-1.0 169,532
181,955 -2.9
-6.8 TOYOTA DIV. IMPORT TRUCK 19,613 13,005 50.8 50.8
36,849 26,130 46.9 41.0 LEXUS IMPORT TRUCK 6,534 4,973 31.4 31.4
12,912 10,441 28.8 23.7 TOYOTA DIV NA BUILT TRUCK 62,173 62,338
-0.3 -0.3 117,496 118,999 2.9 -1.3 LEXUS NA BUILT TRUCK 6,544 6,127
6.8 6.8 12,448 12,136 6.8 2.6
TOTAL TOYOTA TRUCK
94,864 86,443 9.7
9.7 179,705
167,706 11.6 7.2
SELLING DAYS 24 24
48 50
DSR = DAILY SELLING RATE
--CURRENT MONTH-- --CALENDAR YEAR TO DATE--
Memo: 2016 1905
DSR 2016 1905 DSR Toyota Prius Sedan 7,169 7,070 1.4% 13,502 14,386
-2.2% Toyota Prius V (only) 1,112 1,850 -39.9% 2,317 3,763 -35.9%
Toyota Prius C (only) 2,263 2,701 -16.2% 4,026 5,315 -21.1% Toyota
Prius Phv (only) 6 397 -98.5% 16 798 -97.9% Toyota Rav4 Hybrid
2,438 0 N/A 4,411 0 N/A
View source
version on businesswire.com: http://www.businesswire.com/news/home/20160301006652/en/
Toyota Business CommunicationsToni
Honsowetz, 310-468-4291Amanda Rice, 310-468-1745Aaron Fowles,
469-292-1097orLexus Public
RelationsMoe Durand, 310-468-1601orMedia Web
sites:http://www.toyotanewsroom.comhttp://www.lexusnewsroom.comhttp://www.scionnewsroom.com
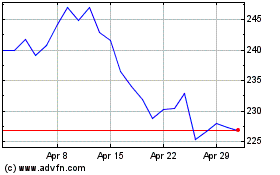
Toyota Motor (NYSE:TM)
Historical Stock Chart
From Jun 2024 to Jul 2024

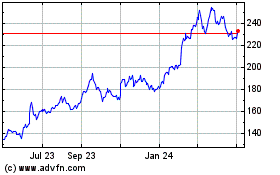
Toyota Motor (NYSE:TM)
Historical Stock Chart
From Jul 2023 to Jul 2024
