BorgWarner Profits Fall 2.5% - Analyst Blog
February 19 2013 - 6:40AM
Zacks
BorgWarner Inc. (BWA) posted a 2.5% decrease in
profits to $1.16 per share (excluding non-recurring items) in the
fourth quarter of 2012 from $1.19 in the same quarter of 2011.
However, EPS in the quarter surpassed the Zacks Consensus Estimate
by 4 cents.
Revenues dipped 3.1% to $1.72 billion, but were ahead of the Zacks
Consensus Estimate of $1.69 billion. Global light vehicle
production inched up 1%, while production in Europe, which
comprises over half of the company’s sales, declined 11%. Excluding
the impact of foreign currencies and dispositions in 2011 and 2012,
revenues remained flat year over year.
Operating income declined 11.7% to $188.0 million or 10.9% of net
sales from $212.8 million or 12.0% in the fourth quarter of 2011
(all excluding non-recurring items).
BorgWarner reported a profit of $4.97 per share for 2012, up 11.7%
from $4.45 a year ago. The company’s revenues for the year edged up
1% to $7.2 billion. Excluding the impact of foreign currencies and
dispositions, net sales went up 6% in the year.
Segment Details
Revenues in the Engine segment dropped 6.3% to
$1.2 billion as increase in light vehicle turbocharger sales in
China and variable cam timing systems sales in Japan were more than
offset by lower volumes in Europe due to the economic weakness.
Excluding the negative impact of foreign currencies and
dispositions, net sales went down 2%. Adjusted earnings before
interest, income taxes and non-controlling interest (adjusted EBIT)
decreased 10.3% to $182.0 million in the quarter from $202.8
million in the fourth quarter of 2011.
Revenues in the Drivetrain segment increased 4.7%
to $559.0 million on better sales volume of all-wheel drive system
in North America and India together with improved sales of
traditional transmission components in Korea. Excluding the impact
of foreign currency, revenues went up 5% in the segment. Adjusted
EBIT increased 5.1% to $49.2 million from $46.8 million in the
fourth quarter of 2011.
Share Repurchase
In the fourth quarter of 2012, BorgWarner repurchased 1.5 million
shares. For the full year 2012, the company repurchased 4.2 million
shares of common stock.
Financial Position
BorgWarner had $715.7 million in cash as of Dec 31, 2012 compared
with $359.6 million as of Dec 31, 2011. Total debt including notes
payable at the end of the quarter decreased to $1.1 billion from
$1.3 billion as of Dec 31, 2011. Consequently,
debt-to-capitalization ratio deteriorated to 25.7% from 35.8% as of
Dec 31, 2011.
For full year 2012, net cash provided by operating activities
improved to $878.7 million from $708.2 million in 2011. Capital
expenditures, including tooling outlays, increased to $407.4
million from $393.7 million in 2011.
Outlook
For 2013, BorgWarner anticipates annual sales growth between 2% and
6% compared with 2012. Excluding the impact of 2012 dispositions,
net sales growth is expected between 3% and 7%.
The company also expects net earnings between $5.15 and $5.45 per
share for the year. It expects operating margin to be higher than
11.5% in 2013.
Our Take
BorgWarner is a leading manufacturer of powertrain products for the
world's major automakers. The company’s products are capable of
improving vehicle performance and stability meeting fuel-efficiency
and emission standards. It currently retains a Zacks Rank #3
(Hold).
The company operates in 57 locations in 19 countries. These
products are manufactured and sold worldwide, primarily to original
equipment manufacturers of passenger cars, SUVs, trucks and
commercial transportation products. The company’s largest customers
include Ford Motor Co. (F), Toyota Motor
Corp. (TM) and Honda Motor Co. (HMC).
BORG WARNER INC (BWA): Free Stock Analysis Report
FORD MOTOR CO (F): Free Stock Analysis Report
HONDA MOTOR (HMC): Free Stock Analysis Report
TOYOTA MOTOR CP (TM): Free Stock Analysis Report
To read this article on Zacks.com click here.
Zacks Investment Research
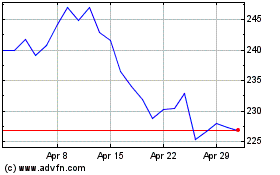
Toyota Motor (NYSE:TM)
Historical Stock Chart
From Jun 2024 to Jul 2024

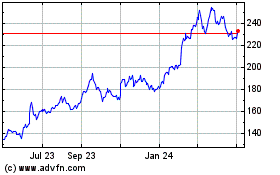
Toyota Motor (NYSE:TM)
Historical Stock Chart
From Jul 2023 to Jul 2024
