ALLETE (NYSE:ALE) today reported third quarter 2010 earnings of
56 cents per share on net income of $19.6 million and revenue of
$224.1 million.
In the third quarter of 2009, company earnings were 49 cents per
share and net income was $16 million on revenue of $178.8 million.
Higher industrial sales were a primary reason for the 23 percent
year-over-year increase in net income.
“We’re pleased with these financial results,” said ALLETE CEO
and President Alan R. Hodnik. “And we are particularly pleased that
economic improvement was seen by customers in our service territory
compared to what was experienced a year ago.”
Quarterly net income in ALLETE’s Regulated Operations
segment improved from $16.6 million in 2009 to $22.1 million in
2010, due to a number of factors. The combination of higher rates
and electric sales were partially offset by significant increases
in operating, interest and depreciation expenses.
The Investments and Other segment recorded a quarterly
net loss of $2.5 million versus a net loss of $600,000 in the same
period a year ago. Higher operating expenses were a primary
contributor to the period over period decrease.
An increase in the average number of common shares outstanding,
with issuance proceeds used to fund the capital expenditure
program, had a dilutive impact of four cents per share for the
quarter.
Hodnik said he expects ALLETE to finish 2010 by recording
earnings in a range between $2.25 and $2.35 per share, excluding
the first quarter 12 cent per share non-recurring charge as a
result of the Patient Protection and Affordable Care Act.
ALLETE’s corporate headquarters are located in Duluth,
Minnesota. In addition to its electric utilities, Minnesota Power
in northeast Minnesota and Superior Water, Light & Power Co. in
northwest Wisconsin, ALLETE owns BNI Coal in Center, N.D. and has
an 8 percent equity interest in the American Transmission Co. In
late 2009, it purchased a 465-mile direct current transmission line
between Duluth, Minn. and Center, N.D. to transport renewable wind
energy from its Bison I Wind Energy Center, which is currently
under construction near New Salem, N.D. More information about the
company is available on ALLETE’s Web site at www.allete.com.
The statements contained in this release and statements that
ALLETE may make orally in connection with this release that are not
historical facts, are forward-looking statements. Actual results
may differ materially from those projected in the forward-looking
statements. These forward-looking statements involve risks and
uncertainties and investors are directed to the risks discussed in
documents filed by ALLETE with the Securities and Exchange
Commission.
ALLETE’s press releases and other communications may include
certain non-Generally Accepted Accounting Principles
(GAAP) financial measures. A “non-GAAP financial measure” is
defined as a numerical measure of a company’s financial
performance, financial position or cash flows that excludes (or
includes) amounts that are included in (or excluded from) the most
directly comparable measure calculated and presented in accordance
with GAAP in the company’s financial statements.
Non-GAAP financial measures utilized by the Company include
presentations of earnings (loss) per share. ALLETE’s
management believes that these non-GAAP financial measures provide
useful information to investors by removing the effect of variances
in GAAP reported results of operations that are not indicative of
changes in the fundamental earnings power of the Company’s
operations. Management believes that the presentation of the
non-GAAP financial measures is appropriate and enables investors
and analysts to more accurately compare the company’s ongoing
financial performance over the periods presented.
ALLETE, Inc.
Consolidated Statement of
Income
For the Periods Ended September 30,
2010 and 2009
Millions Except Per Share Amounts –
Unaudited
Quarter Ended Year to
Date
2010
2009 2010 2009 Operating Revenue
Operating Revenue $ 224.1 $ 178.8 $ 668.9 $ 550.7 Prior Year Rate
Refunds – –
– (7.6 ) Total Operating Revenue
224.1 178.8 668.9
543.1
Operating Expenses Fuel
and Purchased Power 79.0 69.8 233.1 199.4 Operating and Maintenance
89.8 67.5 262.9 224.7 Depreciation 20.0
16.1 59.8 46.8
Total Operating Expenses 188.8
153.4 555.8 470.9
Operating Income 35.3
25.4 113.1 72.2
Other Income (Expense) Interest Expense (9.7 ) (8.3 )
(28.1 ) (25.4 ) Equity Earnings in ATC 4.5 4.4 13.4 12.9 Other
0.6 0.8 3.8
3.8 Total Other Income (Expense)
(4.6 ) (3.1 ) (10.9 )
(8.7 )
Income Before Non-Controlling Interest and
Income Taxes 30.7 22.3 102.2 63.5
Income Tax Expense
11.2 6.5
40.5 21.5
Net Income
19.5 15.8 61.7
42.0 Less: Non-Controlling Interest in
Subsidiaries (0.1 ) (0.2 )
(0.3 ) (0.3 )
Net Income Attributable to
ALLETE $ 19.6 $ 16.0 $ 62.0
$ 42.3
Average Shares of Common
Stock Basic 34.4 32.8 34.1 31.8 Diluted 34.5
32.9 34.2
31.9
Basic Earnings Per Share of Common
Stock $ 0.57 $ 0.49 $ 1.82 $ 1.33
Diluted Earnings Per Share
of Common Stock $ 0.56 $ 0.49
$ 1.81 $ 1.33
Dividends Per Share of
Common Stock $ 0.44 $ 0.44 $
1.32 $ 1.32
Consolidated Balance Sheet
Millions – Unaudited
Sep. 30, Dec. 31,
Sep. 30, Dec. 31,
2010 2009
2010 2009
Assets Liabilities and Equity
Cash and Short-Term Investments
$ 92.3 $ 25.7 Current Liabilities $ 131.0 $ 133.1 Other Current
Assets 201.7 199.8 Long-Term Debt 784.2 695.8 Property, Plant and
Equipment 1,742.6 1,622.7 Other Liabilities 312.8 325.0 Regulatory
Assets 282.5 293.2 Regulatory Liabilities 46.0 47.1 Investment in
ATC 92.0 88.4 Deferred Income Taxes 321.0 253.1 Investments 134.4
130.5 Equity 984.1 939.0 Other 33.6
32.8
Total Assets $ 2,579.1 $ 2,393.1
Total Liabilities and Equity $
2,579.1 $ 2,393.1
Quarter Ended Year to Date September
30, September 30, ALLETE, Inc. 2010
2009 2010 2009 Income (Loss) Millions
Regulated Operations $ 22.1 $ 16.6 $ 65.2 $ 45.0 Investments and
Other (2.5 ) (0.6 )
(3.2 ) (2.7 ) Net Income Attributable to
ALLETE $ 19.6 $ 16.0 $
62.0 $ 42.3
Diluted Earnings Per Share
$ 0.56 $ 0.49 $ 1.81 $ 1.33
Statistical Data
Corporate Common Stock High $ 37.75 $ 34.57 $ 37.87 $ 34.57 Low $
33.16 $ 27.75 $ 29.99 $ 23.35 Close $ 36.43 $ 33.57 $ 36.43 $ 33.57
Book Value $ 27.23 $ 25.95 $ 27.23 $ 25.95
Kilowatt-hours
Sold Millions Regulated Utility Retail and Municipals
Residential 262 240 847 857 Commercial 374 352 1,074 1,061
Municipals 253 243 746 729 Industrial 1,799
984 4,956
3,182 Total Retail and Municipal 2,688 1,819 7,623
5,829 Other Power Suppliers 629
1,051 2,168 3,075
Total Regulated Utility 3,317 2,870 9,791 8,904
Non-regulated Energy Operations 27
56 87 162
Total Kilowatt-hours Sold 3,344
2,926 9,878
9,066
This exhibit has been furnished and shall not be deemed
“filed” for purposes of Section 18 of the Securities Exchange
Act of 1934, nor shall it be deemed incorporated by reference in
any filing under the Securities Act of 1933, except as shall be
expressly set forth by specific reference in such filing.
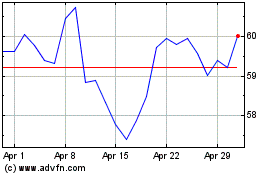
Allete (NYSE:ALE)
Historical Stock Chart
From May 2024 to Jun 2024

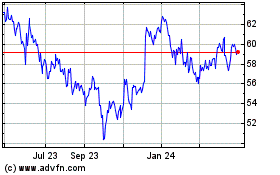
Allete (NYSE:ALE)
Historical Stock Chart
From Jun 2023 to Jun 2024
