false
0000754811
0000754811
2023-11-16
2023-11-16
UNITED STATES
SECURITIES AND EXCHANGE COMMISSION
Washington, D.C. 20549
FORM 8-K
CURRENT REPORT
Pursuant to Section 13 Or 15(d) Of
The Securities Exchange Act of 1934
Date of Report (Date of earliest event reported): November 16, 2023
U.S. GLOBAL INVESTORS, INC.
(Exact name of registrant as specified in its charter)
|
Texas
|
0-13928
|
74-1598370
|
|
(State of other jurisdiction of incorporation)
|
(Commission File Number)
|
(IRS Employer Identification No.)
|
7900 Callaghan Road, San Antonio, Texas 78229
(Address of principal executive offices) (Zip Code)
Registrant's telephone number, including area code: 210-308-1234
(Former name or former address, if changed since last report)
Check the appropriate box below if the Form 8-K filing is intended to simultaneously satisfy the filing obligation of the registrant under any of the following provisions:
☐ Written communications pursuant to Rule 425 under the Securities Act (17 CFR230.425)
☐ Soliciting material pursuant to Rule 14a-12 under the Exchange Act (17 CFR240.14a-12)
☐ Pre-commencement communications pursuant to Rule 14d-2(b) under the Exchange Act (17 CFR 240.14d-2(b))
☐ Pre-commencement communications pursuant to Rule 13e-4(c) under the Exchange Act (17 CFR 240.13e-4(c))
Securities registered pursuant to Section 12(b) of the Act:
|
Title of each class
|
Trading Symbol(s)
|
Name of each exchange on which registered
|
|
Class A common stock, $0.25 par value per share
|
GROW
|
NASDAQ Capital Market
|
Indicate by check mark whether the registrant is an emerging growth company as defined in Rule 405 of the Securities Act of 1934 (§240.12b-2 of this chapter)
Emerging growth company ☐
If an emerging growth company, indicate by check mark if the registrant has elected not to use the extended transition period for complying with any new or revised financial accounting standards provided pursuant to Section 13(a) of the Exchange Act. ☐
Item 2.02 Results of Operations and Financial Condition.
On November 16, 2023, U.S. Global Investors, Inc. issued a press release reporting earnings and other financial results for its fiscal year ended June 30, 2023. A copy of the press release is attached and being furnished as Exhibit 99.1.
The information in this current report on Form 8-K, including the accompanying Exhibit 99.1, shall not be deemed "filed" for purposes of Section 18 of the Securities Exchange Act of 1934 (the "Exchange Act"), or otherwise subject to the liability of such section, nor shall such information be deemed incorporated by reference in any filing under the Securities Act of 1933 or the Exchange Act, regardless of the general incorporation language of such filing, except as shall be expressly set forth by specific reference in such filing.
Item 9.01 Financial Statements and Exhibits.
(d) Exhibits
Exhibit 104 - Cover Page Interactive Data File (embedded within the Inline XBRL document)
SIGNATURES
Pursuant to the requirements of the Securities Exchange Act of 1934, the registrant has duly caused this report to be signed on its behalf by the undersigned hereunto duly authorized.
|
|
U.S. Global Investors, Inc.
|
|
|
|
|
|
|
|
|
|
|
|
|
|
By:
|
/s/ Lisa Callicotte
|
|
|
|
|
Lisa Callicotte
|
|
|
|
|
CFO
|
|
Dated: December 7, 2023
Exhibit 99.1
|
Contact:
Holly Schoenfeldt
Director of Marketing and Public Relations
210.308.1268
hschoenfeldt@usfunds.com
|
|
For Immediate Release
U.S. Global Investors Announces Solid Financial Results for Fiscal Year 2023, with Net Income Per Share of $0.22, 23% Operating Margin and Increased Working Capital
*************************************************************************************
SAN ANTONIO–November 16, 2023–U.S. Global Investors, Inc. (NASDAQ: GROW) (the “Company”), a registered investment advisory firm with longstanding experience in global markets and specialized sectors from gold to airlines, is pleased to report financial results for the fiscal year ended June 30, 2023. For the 12-month period, net income was $3.1 million, or $0.22 per share, and operating income was $3.5 million. Operating margin was a healthy 23% on operating revenues of $15.1 million, despite average assets under management (AAUM) declining 35.6%, from $3.9 billion during fiscal 2022 to $2.5 billion during the fiscal year ended June 30, 2023.
As of June 30, 2023, the Company had net working capital of approximately $37.4 million, over a 10% increase from June 30, 2022. With approximately $25.4 million in cash and cash equivalents and $12.9 million in securities recorded at fair value, excluding convertible securities, the Company has adequate liquidity to meet its current obligations.
Now that this 10-K is filed, the Company will begin working diligently on the September 10-Q. The 10-Q is typically filed about 45 days after quarter end, and the Company believes it will file the September 30, 2023, 10-Q within 45 days after filing the 10-K.
Enhanced Share Repurchase Program, Monthly GROW Dividends
For the quarter ended June 30, 2023, the Company purchased a total of 91,845 class A shares using cash of $257,000. This is more than double the number of shares that the Company repurchased during the same period a year earlier. The repurchase program has been in place since December 2012, and the Board of Directors (the “Board”) has renewed the repurchase program each calendar year. The Company buys back stock on flat or down days.
The Board has authorized payment of the $0.0075 per share per month dividend beginning in October 2023 and continuing through December 2023. The record dates were October 9, November 13 and December 11, and the payment dates were October 23, November 27 and December 26. Payment of cash dividends is within the discretion of the Board and is dependent on earnings, operations, capital requirements, general financial condition of the Company and general business conditions. Dividends totaling $1.1 million were paid to holders of class A common stock in fiscal year 2023.
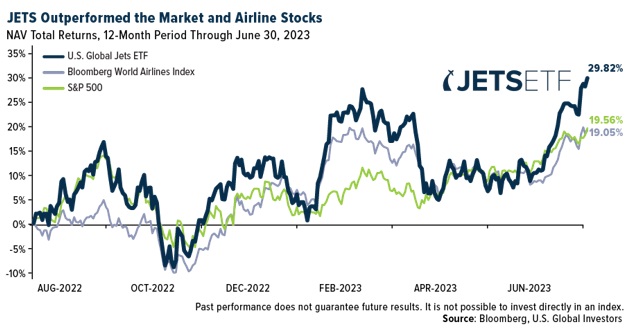
JETS Has Remained Resilient in the Face of Negative Sentiment
Fiscal year 2023 was a challenging one for attracting new assets, as investors exercised caution in the face of stubborn inflation, decades-high interest rates, geopolitical risks and recession fears. In the first eight months of 2023, investors pulled more than $90 billion from U.S. stock mutual funds and ETFs, according to Morningstar. Short-term bond funds lost $6 billion in August, extending the selloff to a record 21 months, while commodities funds lost $25 billion in the 12 months ended August 31.
“Like the rest of the market, the U.S. Global Jets ETF (NYSE: JETS), our largest ETF, saw outflows in the first half of fiscal 2023 as investors took some risk off the table,” says Frank Holmes, the Company’s CEO and Chief Investment Officer. “However, we remain optimistic that investors will return now that demand for commercial air travel continues to match and even exceed pre-pandemic levels. Due to the summer travel boom, American Airlines, Delta Air Lines and United Airlines—three of the top four holdings in JETS—all reported sustainable revenue growth and record net income for the quarter ended June 30, 2023, a testament to the industry’s resilience and ability to navigate economic uncertainty. Carriers are also reporting rising free cash flow quarter-over-quarter, which may help offset higher fuel and labor costs. JETS has defied the doomsayers, beating global airline stocks and the S&P 500 for the 12-month period ended June 30.”
“JETS is truly a global ETF, currently available to trade in New York City; Mexico City; Lima, Peru; Europe; and the United Kingdom,” Mr. Holmes continues. “It can also be found on multiple trading platforms, including Merrill, which was the latest platform to add the airlines ETF to its list of offerings earlier this year.”
Selected Financial Data-: (dollars in thousands, except per share data)
| |
|
Year ended June 30,
|
|
| |
|
2023
|
|
|
2022
|
|
|
Operating Revenues
|
|
$ |
15,074 |
|
|
$ |
24,714 |
|
|
Operating Expenses
|
|
|
11,549 |
|
|
|
13,601 |
|
|
Operating Income
|
|
|
3,525 |
|
|
|
11,113 |
|
| |
|
|
|
|
|
|
|
|
|
Total Other Income (Loss)
|
|
|
558 |
|
|
|
(6,145 |
) |
|
Income Before Income Taxes
|
|
|
4,083 |
|
|
|
4,968 |
|
| |
|
|
|
|
|
|
|
|
|
Income Tax Expense
|
|
|
934 |
|
|
|
1,528 |
|
|
Net Income
|
|
$ |
3,149 |
|
|
$ |
3,440 |
|
| |
|
|
|
|
|
|
|
|
|
Net income per share (basic and diluted)
|
|
$ |
0.22 |
|
|
$ |
0.23 |
|
| |
|
|
|
|
|
|
|
|
|
Weighted avg. common shares outstanding (basic)
|
|
|
14,638,833 |
|
|
|
15,010,138 |
|
|
Weighted avg. common shares outstanding (diluted)
|
|
|
14,639,069 |
|
|
|
15,011,128 |
|
| |
|
|
|
|
|
|
|
|
|
Avg. assets under management (billions)
|
|
$ |
2.5 |
|
|
$ |
3.9 |
|
####
About U.S. Global Investors, Inc.
The story of U.S. Global Investors goes back more than 50 years when it began as an investment club. Today, U.S. Global Investors, Inc. (www.usfunds.com) is a registered investment adviser that focuses on niche markets around the world. Headquartered in San Antonio, Texas, the Company provides investment advisory services to U.S. Global Investors Funds and U.S. Global ETFs.
Forward-Looking Statements and Disclosure
This news release and other statements by U.S. Global Investors may include certain “forward-looking statements,” including statements relating to revenues, expenses and expectations regarding market conditions. You can identify these forward-looking statements by the use of words such as “outlook,” “believes,” “expects,” “potential,” “opportunity,” “seeks,” “anticipates” or other comparable words. Such statements involve certain risks and uncertainties and should be read with corporate filings and other important information on the Company’s website, www.usfunds.com, or the Securities and Exchange Commission’s website at www.sec.gov.
These filings, such as the Company’s annual report and Form 10-Q, should be read in conjunction with the other cautionary statements that are included in this release. Future events could differ materially from those anticipated in such statements and there can be no assurance that such statements will prove accurate and actual results may vary. The Company undertakes no obligation to publicly update or review any forward-looking statements, whether as a result of new information, future developments or otherwise.
Please consider carefully a fund’s investment objectives, risks, charges and expenses. For this and other important information, obtain a fund prospectus by visiting www.usfunds.com. Read it carefully before investing. U.S. Global mutual funds are distributed by Foreside Fund Services, LLC, Distributor. U.S. Global Investors is the investment adviser.
Past performance does not guarantee future results.
Total Annualized Returns as of 06/30/2023:
|
Fund
|
One-Year
|
Five-Year
|
Ten-Year
|
Since Inception
|
Expense Ratio
|
|
U.S. Global Jets ETF (JETS)
NAV
|
30.09%
|
-5.34%
|
n/a
|
-1.29%
(4/28/2015)
|
0.60%
|
|
U.S. Global Jets ETF (JETS)
Market Price
|
29.82%
|
-5.33%
|
n/a
|
-1.29%
(4/28/2015)
|
0.60%
|
|
S&P 500 Index
|
19.59%
|
12.31%
|
12.86%
|
n/a
|
n/a
|
|
Bloomberg World Airlines Index
|
18.52%
|
-22.16%
|
33.80%
|
10.86%
(12/31/1999)
|
n/a
|
The performance data quoted represents past performance. Past performance does not guarantee future results. The investment return and principal value of an investment will fluctuate so that an investor's shares, when sold or redeemed, may be worth more or less than their original cost and current performance may be lower or higher than the performance quoted. Short term performance, in particular, is not a good indication of the fund’s future performance, and an investment should not be made based solely on returns. For SEA performance data current to the most recent month-end, please visit www.usglobaletfs.com, or call 617.786.3000.
Foreside Fund Services, LLC, Distributor. U.S. Global Investors is the investment adviser. JETS is distributed by Quasar Distributors, LLC. U.S. Global Investors is the investment adviser to JETS. Foreside Fund Services, LLC and Quasar Distributors, LLC are affiliated.
Investing involves risk, including the possible loss of principal. Shares of any ETF are bought and sold at market price (not NAV), may trade at a discount or premium to NAV and are not individually redeemed from the funds. Brokerage commissions will reduce returns. Because the funds concentrate their investments in specific industries, the funds may be subject to greater risks and fluctuations than a portfolio representing a broader range of industries. The funds are non-diversified, meaning they may concentrate more of their assets in a smaller number of issuers than diversified funds. The funds invest in foreign securities which involve greater volatility and political, economic and currency risks and differences in accounting methods. These risks are greater for investments in emerging markets. The funds may invest in the securities of smaller-capitalization companies, which may be more volatile than funds that invest in larger, more established companies. The performance of the funds may diverge from that of the index. Because the funds may employ a representative sampling strategy and may also invest in securities that are not included in the index, the funds may experience tracking error to a greater extent than funds that seek to replicate an index. The funds are not actively managed and may be affected by a general decline in market segments related to the index. Airline Companies may be adversely affected by a downturn in economic conditions that can result in decreased demand for air travel and may also be significantly affected by changes in fuel prices, labor relations and insurance costs.
Foreign and emerging market investing involves special risks such as currency fluctuation and less public disclosure, as well as economic and political risk. By investing in a specific geographic region, such as China and/or Taiwan, a regional ETFs returns and share price may be more volatile than those of a less concentrated portfolio.
All opinions expressed and data provided are subject to change without notice. Some of these opinions may not be appropriate to every investor.
The S&P 500 is widely regarded as the best single gauge of large-cap U.S. equities and serves as the foundation for a wide range of investment products. The index includes 500 leading companies and captures approximately 80% coverage of available market capitalization. The Bloomberg World Airlines Index is a capitalization-weighted index of the leading airlines stocks in the World.
It is not possible to invest in an index.
v3.23.3
Document And Entity Information
|
Nov. 16, 2023 |
| Document Information [Line Items] |
|
| Entity, Registrant Name |
U.S. GLOBAL INVESTORS, INC.
|
| Document, Type |
8-K
|
| Document, Period End Date |
Nov. 16, 2023
|
| Entity, Incorporation, State or Country Code |
TX
|
| Entity, File Number |
0-13928
|
| Entity, Tax Identification Number |
74-1598370
|
| Entity, Address, Address Line One |
7900 Callaghan Road
|
| Entity, Address, City or Town |
San Antonio
|
| Entity, Address, State or Province |
TX
|
| Entity, Address, Postal Zip Code |
78229
|
| City Area Code |
210
|
| Local Phone Number |
308-1234
|
| Written Communications |
false
|
| Soliciting Material |
false
|
| Pre-commencement Tender Offer |
false
|
| Pre-commencement Issuer Tender Offer |
false
|
| Title of 12(b) Security |
Class A common stock
|
| Trading Symbol |
GROW
|
| Security Exchange Name |
NASDAQ
|
| Entity, Emerging Growth Company |
false
|
| Amendment Flag |
false
|
| Entity, Central Index Key |
0000754811
|
| X |
- DefinitionBoolean flag that is true when the XBRL content amends previously-filed or accepted submission.
| Name: |
dei_AmendmentFlag |
| Namespace Prefix: |
dei_ |
| Data Type: |
xbrli:booleanItemType |
| Balance Type: |
na |
| Period Type: |
duration |
|
| X |
- DefinitionFor the EDGAR submission types of Form 8-K: the date of the report, the date of the earliest event reported; for the EDGAR submission types of Form N-1A: the filing date; for all other submission types: the end of the reporting or transition period. The format of the date is YYYY-MM-DD.
| Name: |
dei_DocumentPeriodEndDate |
| Namespace Prefix: |
dei_ |
| Data Type: |
xbrli:dateItemType |
| Balance Type: |
na |
| Period Type: |
duration |
|
| X |
- DefinitionThe type of document being provided (such as 10-K, 10-Q, 485BPOS, etc). The document type is limited to the same value as the supporting SEC submission type, or the word 'Other'.
| Name: |
dei_DocumentType |
| Namespace Prefix: |
dei_ |
| Data Type: |
dei:submissionTypeItemType |
| Balance Type: |
na |
| Period Type: |
duration |
|
| X |
- DefinitionAddress Line 1 such as Attn, Building Name, Street Name
| Name: |
dei_EntityAddressAddressLine1 |
| Namespace Prefix: |
dei_ |
| Data Type: |
xbrli:normalizedStringItemType |
| Balance Type: |
na |
| Period Type: |
duration |
|
| X |
- Definition
+ References
+ Details
| Name: |
dei_EntityAddressCityOrTown |
| Namespace Prefix: |
dei_ |
| Data Type: |
xbrli:normalizedStringItemType |
| Balance Type: |
na |
| Period Type: |
duration |
|
| X |
- DefinitionCode for the postal or zip code
| Name: |
dei_EntityAddressPostalZipCode |
| Namespace Prefix: |
dei_ |
| Data Type: |
xbrli:normalizedStringItemType |
| Balance Type: |
na |
| Period Type: |
duration |
|
| X |
- DefinitionName of the state or province.
| Name: |
dei_EntityAddressStateOrProvince |
| Namespace Prefix: |
dei_ |
| Data Type: |
dei:stateOrProvinceItemType |
| Balance Type: |
na |
| Period Type: |
duration |
|
| X |
- DefinitionA unique 10-digit SEC-issued value to identify entities that have filed disclosures with the SEC. It is commonly abbreviated as CIK. Reference 1: http://www.xbrl.org/2003/role/presentationRef
-Publisher SEC
-Name Exchange Act
-Number 240
-Section 12
-Subsection b-2
| Name: |
dei_EntityCentralIndexKey |
| Namespace Prefix: |
dei_ |
| Data Type: |
dei:centralIndexKeyItemType |
| Balance Type: |
na |
| Period Type: |
duration |
|
| X |
- DefinitionIndicate if registrant meets the emerging growth company criteria. Reference 1: http://www.xbrl.org/2003/role/presentationRef
-Publisher SEC
-Name Exchange Act
-Number 240
-Section 12
-Subsection b-2
| Name: |
dei_EntityEmergingGrowthCompany |
| Namespace Prefix: |
dei_ |
| Data Type: |
xbrli:booleanItemType |
| Balance Type: |
na |
| Period Type: |
duration |
|
| X |
- DefinitionCommission file number. The field allows up to 17 characters. The prefix may contain 1-3 digits, the sequence number may contain 1-8 digits, the optional suffix may contain 1-4 characters, and the fields are separated with a hyphen.
| Name: |
dei_EntityFileNumber |
| Namespace Prefix: |
dei_ |
| Data Type: |
dei:fileNumberItemType |
| Balance Type: |
na |
| Period Type: |
duration |
|
| X |
- DefinitionTwo-character EDGAR code representing the state or country of incorporation.
| Name: |
dei_EntityIncorporationStateCountryCode |
| Namespace Prefix: |
dei_ |
| Data Type: |
dei:edgarStateCountryItemType |
| Balance Type: |
na |
| Period Type: |
duration |
|
| X |
- DefinitionThe exact name of the entity filing the report as specified in its charter, which is required by forms filed with the SEC. Reference 1: http://www.xbrl.org/2003/role/presentationRef
-Publisher SEC
-Name Exchange Act
-Number 240
-Section 12
-Subsection b-2
| Name: |
dei_EntityRegistrantName |
| Namespace Prefix: |
dei_ |
| Data Type: |
xbrli:normalizedStringItemType |
| Balance Type: |
na |
| Period Type: |
duration |
|
| X |
- DefinitionThe Tax Identification Number (TIN), also known as an Employer Identification Number (EIN), is a unique 9-digit value assigned by the IRS. Reference 1: http://www.xbrl.org/2003/role/presentationRef
-Publisher SEC
-Name Exchange Act
-Number 240
-Section 12
-Subsection b-2
| Name: |
dei_EntityTaxIdentificationNumber |
| Namespace Prefix: |
dei_ |
| Data Type: |
dei:employerIdItemType |
| Balance Type: |
na |
| Period Type: |
duration |
|
| X |
- DefinitionLocal phone number for entity.
| Name: |
dei_LocalPhoneNumber |
| Namespace Prefix: |
dei_ |
| Data Type: |
xbrli:normalizedStringItemType |
| Balance Type: |
na |
| Period Type: |
duration |
|
| X |
- DefinitionBoolean flag that is true when the Form 8-K filing is intended to satisfy the filing obligation of the registrant as pre-commencement communications pursuant to Rule 13e-4(c) under the Exchange Act. Reference 1: http://www.xbrl.org/2003/role/presentationRef
-Publisher SEC
-Name Exchange Act
-Number 240
-Section 13e
-Subsection 4c
| Name: |
dei_PreCommencementIssuerTenderOffer |
| Namespace Prefix: |
dei_ |
| Data Type: |
xbrli:booleanItemType |
| Balance Type: |
na |
| Period Type: |
duration |
|
| X |
- DefinitionBoolean flag that is true when the Form 8-K filing is intended to satisfy the filing obligation of the registrant as pre-commencement communications pursuant to Rule 14d-2(b) under the Exchange Act. Reference 1: http://www.xbrl.org/2003/role/presentationRef
-Publisher SEC
-Name Exchange Act
-Number 240
-Section 14d
-Subsection 2b
| Name: |
dei_PreCommencementTenderOffer |
| Namespace Prefix: |
dei_ |
| Data Type: |
xbrli:booleanItemType |
| Balance Type: |
na |
| Period Type: |
duration |
|
| X |
- DefinitionTitle of a 12(b) registered security. Reference 1: http://www.xbrl.org/2003/role/presentationRef
-Publisher SEC
-Name Exchange Act
-Number 240
-Section 12
-Subsection b
| Name: |
dei_Security12bTitle |
| Namespace Prefix: |
dei_ |
| Data Type: |
dei:securityTitleItemType |
| Balance Type: |
na |
| Period Type: |
duration |
|
| X |
- DefinitionName of the Exchange on which a security is registered. Reference 1: http://www.xbrl.org/2003/role/presentationRef
-Publisher SEC
-Name Exchange Act
-Number 240
-Section 12
-Subsection d1-1
| Name: |
dei_SecurityExchangeName |
| Namespace Prefix: |
dei_ |
| Data Type: |
dei:edgarExchangeCodeItemType |
| Balance Type: |
na |
| Period Type: |
duration |
|
| X |
- DefinitionBoolean flag that is true when the Form 8-K filing is intended to satisfy the filing obligation of the registrant as soliciting material pursuant to Rule 14a-12 under the Exchange Act. Reference 1: http://www.xbrl.org/2003/role/presentationRef
-Publisher SEC
-Name Exchange Act
-Section 14a
-Number 240
-Subsection 12
| Name: |
dei_SolicitingMaterial |
| Namespace Prefix: |
dei_ |
| Data Type: |
xbrli:booleanItemType |
| Balance Type: |
na |
| Period Type: |
duration |
|
| X |
- DefinitionTrading symbol of an instrument as listed on an exchange.
| Name: |
dei_TradingSymbol |
| Namespace Prefix: |
dei_ |
| Data Type: |
dei:tradingSymbolItemType |
| Balance Type: |
na |
| Period Type: |
duration |
|
| X |
- DefinitionBoolean flag that is true when the Form 8-K filing is intended to satisfy the filing obligation of the registrant as written communications pursuant to Rule 425 under the Securities Act. Reference 1: http://www.xbrl.org/2003/role/presentationRef
-Publisher SEC
-Name Securities Act
-Number 230
-Section 425
| Name: |
dei_WrittenCommunications |
| Namespace Prefix: |
dei_ |
| Data Type: |
xbrli:booleanItemType |
| Balance Type: |
na |
| Period Type: |
duration |
|
US Global Investors (NASDAQ:GROW)
Historical Stock Chart
From Apr 2024 to May 2024

US Global Investors (NASDAQ:GROW)
Historical Stock Chart
From May 2023 to May 2024
