false 0001057352 0001057352 2024-02-21 2024-02-21
UNITED STATES
SECURITIES AND EXCHANGE COMMISSION
Washington, D.C. 20549
FORM 8-K
CURRENT REPORT
Pursuant to Section 13 or 15(d)
of the Securities Exchange Act of 1934
Date of Report (Date of earliest event reported): February 21, 2024
COSTAR GROUP, INC.
(Exact name of registrant as specified in its charter)
|
|
|
|
|
| Delaware |
|
0-24531 |
|
52-2091509 |
| (State or other jurisdiction of incorporation or organization) |
|
(Commission File Number) |
|
(I.R.S. Employer Identification No.) |
|
|
|
| 1331 L Street, NW, Washington, DC |
|
20005 |
| (Address of principal executive offices) |
|
(Zip Code) |
Registrant’s telephone number, including area code: (202) 346-6500
Not Applicable
(Former name or former address, if changed since last report.)
Check the appropriate box below if the Form 8-K filing is intended to simultaneously satisfy the filing obligation of the registrant under any of the following provisions (see General Instruction A.2. below):
| ☐ |
Written communications pursuant to Rule 425 under the Securities Act (17 CFR 230.425) |
| ☐ |
Soliciting material pursuant to Rule 14a-12 under the Exchange Act (17 CFR 240.14a-12) |
| ☐ |
Pre-commencement communications pursuant to Rule 14d-2(b) under the Exchange Act (17 CFR 240.14d-2(b)) |
| ☐ |
Pre-commencement communications pursuant to Rule 13e-4(c) under the Exchange Act (17 CFR 240.13e-4(c)) |
Securities registered pursuant to Section 12(b) of the Act:
|
|
|
|
|
| Title of each class |
|
Trading
Symbol |
|
Name of each exchange on which registered |
| Common Stock ($0.01 par value) |
|
CSGP |
|
Nasdaq Global Select Market |
Indicate by check mark whether the registrant is an emerging growth company as defined in Rule 405 of the Securities Act of 1933 (§230.405 of this chapter) or Rule 12b-2 of the Securities Exchange Act of 1934 (§240.12b-2 of this chapter).
Emerging Growth Company ☐
If an emerging growth company, indicate by check mark if the registrant has elected not to use the extended transition period for complying with any new or revised financial accounting standards provided pursuant to Section 13(a) of the Exchange Act. ☐
| Item 7.01 |
Regulation FD Disclosure. |
CoStar Group, Inc. (“CoStar” or the “Company”) hereby furnishes the presentation (the “Investor Presentation”) that the Company intends to use from time to time on or after February 21, 2024. CoStar may use the Investor Presentation with investors, analysts, lenders, insurers, vendors, clients, employees and others. The Investor Presentation is furnished herewith as Exhibit 99.1 and also will be made available on the Company’s website at costargroup.com.
The information contained in the Investor Presentation is summary information that should be considered in the context of the Company’s filings with the SEC and other public announcements that the Company may make, by press release or otherwise, from time to time. The Investor Presentation is current as of February 21, 2024. To the extent that estimates, targets or other forward-looking statements are included in the Investor Presentation, the Company specifically disclaims any duty or obligation to publicly update or revise such information.
The information contained in this Item 7.01 and the Investor Presentation shall be considered “furnished” and shall not be deemed “filed” for purposes of Section 18 of the Securities Exchange Act of 1934, as amended, or otherwise subject to the liabilities of that Section or Sections 11 and 12(a)(2) of the Securities Act of 1933, as amended, nor shall it be deemed incorporated by reference into any reports or filings with the Securities and Exchange Commission, whether made before or after the date hereof, except as expressly set forth by specific reference in such a filing.
| Item 9.01 |
Financial Statements and Exhibits. |
(d) Exhibits.
SIGNATURES
Pursuant to the requirements of the Securities Exchange Act of 1934, the registrant has duly caused this report to be signed on its behalf by the undersigned hereunto duly authorized.
|
|
|
|
|
|
|
|
|
|
|
COSTAR GROUP, INC. |
|
|
|
|
| Date: February 21, 2024 |
|
|
|
By: |
|
/s/ Scott T. Wheeler |
|
|
|
|
Name: |
|
Scott T. Wheeler |
|
|
|
|
Title: |
|
Chief Financial Officer |

Exhibit 99.1 Fourth Quarter and Full Year 2023 Investor
Presentation

Legal Disclaimer Certain information in this presentation includes
“forward-looking statements” within the meaning of federal securities laws, including financial projections of CoStar Group, Inc. (“CoStar Group” or the “Company”), addressable markets, statements about
management’s plans, growth strategy, goals and objectives for future operations and similar statements regarding expected future events. These statements are not guarantees of future performance and involve risks and uncertainties that could
cause actual results to differ materially. Factors that could cause or contribute to such differences include: general economic conditions; the risk that our projections about revenue, EBITDA, Adjusted EBITDA, net income per share, Non-GAAP net
income, Non-GAAP net income per share, site traffic or the number of users on our sites are not as expected; product development and releases; planned sales and marketing activities and investments; the anticipated benefits of completed or proposed
acquisitions; trends in customer behavior; effective tax rates; the anticipated benefits of cross-selling efforts; planned service enhancements; legal and regulatory issues; methods that we use to measure unique visitors to our portals, including
Google Analytics, may misstate the actual number of unique persons who visit our network of mobile applications and websites for a given changes in accounting policies or practices and current economic conditions, including the potential impacts of
the COVID-19 pandemic, on the commercial real estate industry and our customer base. Additionally, annualization of historical results from short periods of time or small sample sizes may differ materially from actual results realized in future
periods and may not take into account other future market conditions that may negatively affect those results. More information about potential risks that could cause actual results to differ from those contemplated by the forward-looking statements
is included in our filings with the Securities Exchange Commission (the “SEC”), including our most recent Annual Report on Form 10-K and Quarterly Reports on Form 10-Q. All forward- looking statements are based on information available
to us on the date of this presentation, and we assume no obligation to publicly update such statements whether as a result of new information, future events or otherwise. This presentation includes certain non-GAAP financial measures, including
EBITDA, Adjusted EBITDA, Adjusted EBITDA margin, Non-GAAP Net Income, Non- GAAP Net Income per Share, Organic Revenues and Acquired Revenues, which are used by our management and board of directors to measure operating performance and trends and to
prepare our annual budget. You should not consider these measures in isolation or as a substitute for analysis of our results as reported under GAAP. Reconciliation tables and other important information about the Company’s financial results
and operating metrics used herein are included in the Appendix to this presentation. This presentation also contains estimates and statistical data made by independent parties and by CoStar Group related to market size, the housing rental market,
agent users, site traffic, growth and other data about CoStar Group’s industry and performance. These data involve a number of assumptions and limitations, which may significantly impact their accuracy, and you are cautioned not to give undue
weight to such estimates. Projections, assumptions and estimates of future performance are necessarily subject to a high degree of uncertainty and risk. This presentation is not an offer or a solicitation of an offer to purchase any
securities.

Fourth Quarter and Full Year 2023 Highlights

Fourth Quarter and Full Year 2023 Highlights • Full year 2023
revenue increased 13% year-over-year and 12% in the fourth quarter 2023, exceeding the high end of our guidance range. • Commercial information and marketplace businesses grew revenue 14% in 2023, with profit margins improving to 40% for the
full year. • Apartments.com delivered 23% year-over-year revenue growth in 2023. Annual run rate revenue crossed $1 billion in January 2024, making Apartments.com our first billion-dollar business. • Costar Group’s residential
network traffic reached 95 million average monthly unique visitors in the fourth quarter of 2023 to become the second most trafficked network of residential sites in the U.S. • Homes.com is the fastest growing residential property site in the
U.S., with average monthly unique visitors increasing 600% year-over-year. • Homes.com launched the industry's biggest brand campaign during Super Bowl LVIII. Subscription membership sales began ahead of schedule in February with almost $4.5
million in annualized net new bookings sold in the first week. Commercial information and marketplace businesses are our consolidated financial position and results excluding the impact of our Residential brands which are Homes.com and OnTheMarket,
plc. Apartments network traffic as measured by Google Analytics; Zillow’s network as reported in its Earnings Press Releases and Shareholder letters posted to their website for the prior eight quarters. Rent. traffic per Comscore.

Fourth Quarter and Full Year 2023 Results Fourth Quarter Full Year $640
million $2.46 billion Revenue 12% year-over-year growth 13% year-over-year growth $96 million $375 million Net income $0.24 per diluted share $0.92 per diluted share Net new bookings $58 million $286 million $130 million $492 million Adjusted EBITDA
20% margin 20% margin $133 million $498 million Non-GAAP net income $0.33 per diluted share $1.22 per diluted share

2024 Outlook First Quarter Full Year $645 billion to $650 billion $2.75
billion to $2.77 billion Revenue 10% to 11% year-over-year growth 12% to13% year-over-year growth ($5) million to ($2) million $115 million to $129 million Net income ($0.01) to $0.00 per diluted share $0.28 to $0.32 per diluted share ($12) million
to ($8) million $170 million to $190 million Adjusted EBITDA (1) % margin 7% margin Non-GAAP $26 million to $29 million $232 million to $246 million net income $.06 to $.07 per diluted share $0.57 to $0.60 per diluted share

Traffic Growth Accelerating to 62% Year over Year in Q4 2023 160 140 120
100 80 60 40 20 - 2013 2014 2015 2016 2017 2018 2019 2020 2021 2022 2023 2024 Source: Google Analytics Unique Visitors – All CoStar Sites. Growth rate based on 4Q23 vs 4Q22.. Unique Visitors in Millions

Company Overview

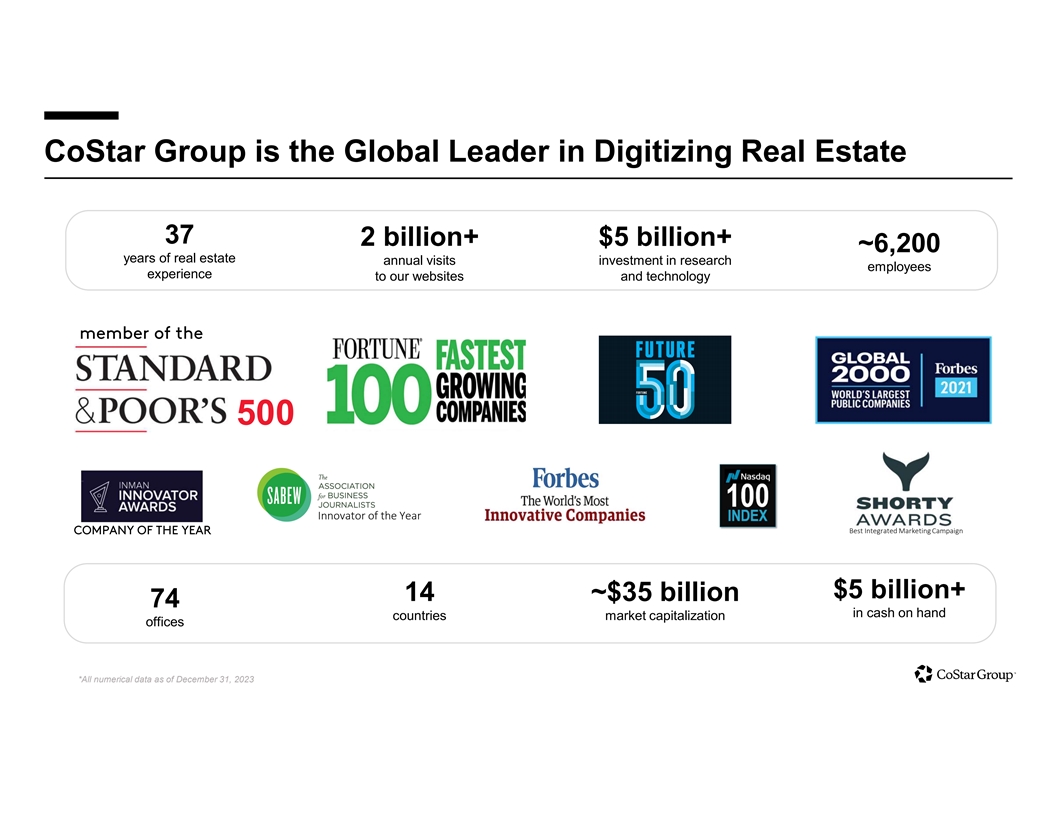
CoStar Group is the Global Leader in Digitizing Real Estate 37 2
billion+ $5 billion+ ~6,200 years of real estate annual visits investment in research employees experience to our websites and technology 500 Innovator of the Year Best Integrated Marketing Campaign $5 billion+ 14 ~$35 billion 74 in cash on hand
countries market capitalization offices *All numerical data as of December 31, 2023
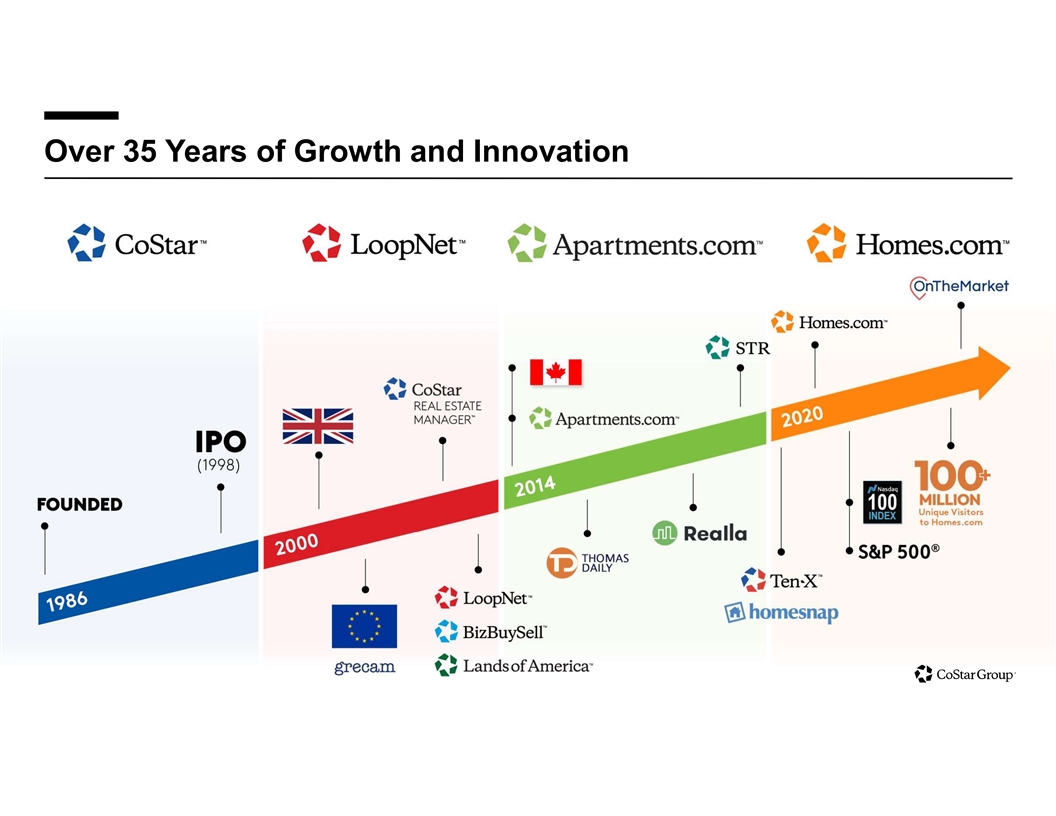
Over 35 Years of Growth and Innovation

A Global Leader in the Digital Transformation of the $300+ Trillion
Real Estate Industry • Long growth runway: Global addressable market for real estate information and marketplaces estimated at > $100 billion. • Strong competitive position: Massive proprietary dataset built over 37 years with > $5
billion invested in research. • Leading Property Marketplaces: Hundreds of millions shop our online real estate marketplaces. • Successful growth track record: 51 consecutive quarters of double- digit revenue growth, both organic and
through acquisitions. • Attractive financial model: 95% subscription revenue. 90% renewal rates*. Strong margins, high free cash flow and a fortress balance sheet. *All data as of December 31, 2023. Subscription revenue includes all contracts
regardless of term. Renewal rate refers to contracts with 12 month or longer terms.

Global Real Estate: A $300 Trillion Asset Class U.S. REAL ESTATE GLOBAL
REAL ESTATE $70 TRILLION $300 TRILLION (Year CoStar entered market) Office (1986) Industrial (1994) United States Retail (2004) Rural Land (2011) Apartment (2014) Single Family Hotel Residential/ (2019) Canada New Homes China (2020) France UK CoStar
Group Offices India Germany U.S. Real Estate Sources: Apartment – CoStar estimate Global Real Estate Sources: Office – CoStar estimate Hotel – CoStar estimate Global real estate value calculated by scaling Industrial – CoStar
estimate Single Family – Federal Reserve Flow of Funds and U.S. real estate value based on the U.S. Retail – CoStar estimate Urban Institute share of global GDP, Global GDP data from Based on 2023 Data Rural Land – U.S. Department
of Agriculture New Homes – Federal Reserve Economic Data (FRED) The World Bank

~$40B North American Addressable Market, Global Market > $100B Total
North American Addressable Market $4 Billion $9 Billion $5 Billion $6 Billion >$15 Billion 0% 10% 20% 30% 40% 50% 60% 70% 80% 90% 100% TAM Sources: CoStar, Apartments, LoopNet and Ten-X – CoStar estimate Homes.com – extrapolation of
Borrell Associates “2019 Real Estate Advertisement Outlook” combined with CoStar estimate

Strong Double-Digit Growth with Two Brands Over $1 Billion 5 YEAR CAGR
$2.8B 15% 20% $2.5B 9% TOTAL 5 YEAR REVENUE CAGR 150% 2023-2024 only $2.2B 13% $1.9B $1.7B $1.1B 17% $1.4B $1.0B 11% 2019 2020 2021 2022 2023 2024E Costar Multifamily LoopNet Residential Information Services Other Marketplaces

51 Consecutive Quarters of Double-Digit Revenue Growth Regardless of
Commercial Property Transaction Volumes High Inflation Quarterly Revenue Transaction Volumes 700 450 2022-2023: +12% Growth 400 Pandemic 600 2020-2021: +18% Growth • • 9 95 5% % s su ub bs sc cr riip pttiio on n r re ev ve en nu ue e 350
• • 8 81 1% % a an nn nu ua all c co on nttr ra ac ctts s 500 300 • • R Re es siilliie en ntt tth hr ro ou ug gh h m ma ar rk ke ett c cy yc clle es s • • S Siin ng glle e,, iin ntte eg gr ra atte ed d g gllo ob
ba all p plla attffo or rm m 400 250 200 300 150 Great Recession 200 2009 Revenue: -1% 100 100 50 - - 2005 2006 2007 2008 2009 2010 2011 2012 2013 2014 2015 2016 2017 2018 2019 2020 2021 2022 2023 All data as of December 31, 2023. Organic revenue
excludes revenue from acquired companies at time of acquisition. Quarterly Revenue (in millions)

More Diversified with More Countercyclical Business Mix Since the Great
Recession 2008 REVENUE 2023 REVENUE Other Marketplaces Other 5% Information Residential Revenue 2% Services LoopNet 11% CoStar 38% Information CoStar Marketplaces & Analytics 92% 55% 45% Information Multifamily & Analytics Information 37%
100% Services 7% Based on internal CoStar data.
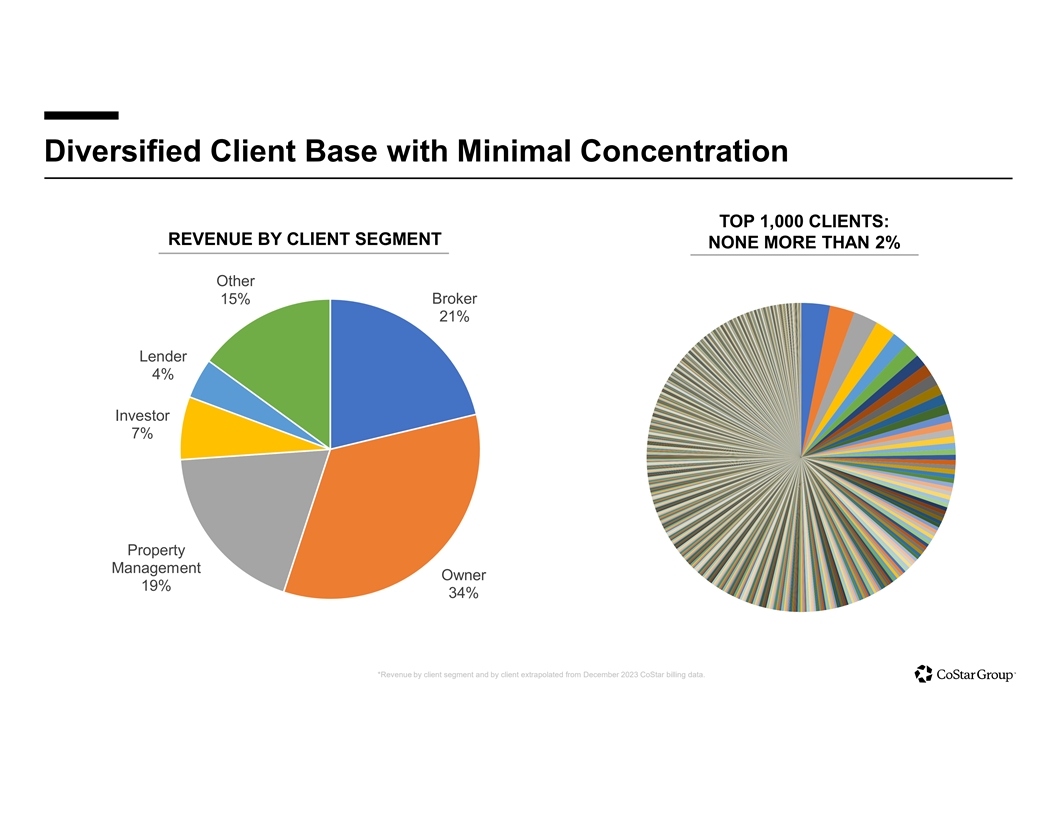
Diversified Client Base with Minimal Concentration TOP 1,000 CLIENTS:
REVENUE BY CLIENT SEGMENT NONE MORE THAN 2% Other 15% Broker 21% Lender 4% Investor 7% Property Management Owner 19% 34% *Revenue by client segment and by client extrapolated from December 2023 CoStar billing data.

Successful Acquisition and Integration Track Record 2023 REVENUE
COMPOSITION Acquired 24% $600 $500 $400 Organic 76% $300 $200 $100 $0 2009 2010 2011 2012 2013 2014 2015 2016 2017 2018 2019 2020 2021 2022 2023 Organic Revenue Acquired Revenue for the year following acquisition Millions

High Growth, High Margin Subscription Business Model ü 23% Revenue
CAGR since IPO 24 years ago Double-Digit Revenue and ü Net Income CAGR of 29% over the last 10 years Adjusted EBITDA Growth ü Adjusted EBITDA CAGR of 14% over the last 10 years ü 95% subscription revenue with 81%+ annual contracts
Predictable Subscription ü 95% renewal rate for clients > 5 years Services Revenue ü Double-digit revenue growth for 51 straight quarters 80%+ gross margin ü Strong Operating Leverage ü Commercial information and marketplace
businesses 40% margin ü Net cash provided by operating activities of $490M for 2023 Highly Cash Generative with Strong Balance Sheet ü $5.2B cash versus $1B of debt Note: All data as of 12/31/23.

Discover your new home. Helping 100 million renters find their perfect
fit.

Apartments.com by the Numbers 23% $1B Year-over-Year Revenue Run Rate
Revenue Growth 1M+ #1 Rank in Brand Rental Awareness Availabilities 44M 1B Average Monthly Annual Visits Unique Visitors *All data except revenue as of 12/31/23. Revenue Run Rate based on January 2024 annualized.. Traffic data from Google Analytics
FY 2023.

Multifamily Revenue Growth Fully Recovered in 2023 From the Post
Pandemic Downturn 25% 24% 23% 23% 23% 21% 20% 20% 18% 16% 15% 11% 10% 10% 6% 6% 6% 5% 0% Q4 20 Q1 21 Q2 21 Q3 21 Q4 21 Q1 22 Q2 22 Q3 22 Q4 22 Q1 23 Q2 23 Q3 23 Q4 23

Our Biggest Customer Count Ever! ~71,000 APARTMENT COMMUNITIES now
advertise on Apartments.com

Apartments.com Beats Competition on the Metrics That Matter to
Advertisers 2X 2X 3X more time higher more per visit conversion leases Sources: Traffic from Comscore Media Matrix, January - December 2023; Lease data from Rent Dynamics, January - September 2023

Unaided Brand Awareness at All Time Highs 52% Source: Dynata a leading
market research sampling provider

Success of Apartments.com Growth Since Acquisition 2014 2024 th 5 place
in highly fragmented The leading online rental Industry Rank #1 online rental search industry marketplace Revenue $75 million $1 billion revenue run rate 13X 4 million average monthly unique Traffic 44 million monthly unique visitors 11X visitors
Customers 18,000 communities 71,000 communities 4X #1 in Brand Awareness per Dynata for 2023. #1 in revenue in 2023 vs. competitors. Revenue Run Rate based on January 2024 annualized including transactional revenue. 2014 ComScore traffic data. 01/24
Google Analytics traffic data. Customer data from internal database.

Tremendous Opportunity Ahead in the Small to Medium Property Space
Annual Revenue Revenue Unit Range Universe (Units) Client Units TAM ($M) Run Rate ($M) Penetration 1-49 29M 296K $60M 1% $6B $7B opportunity 50-99 5M 836K $112M 11% $1B 100+ 24M 11M $793M 40% $2B Grand Total 58M 12M $965M 11% $9B Data as of December
2023 based on CoStar internal estimates. Annual revenue run rate based on annualized December 2023. Excludes transactional revenue for Independent Owners.

The fastest growing U.S. residential marketplace

Our Vision Establish Homes.com as the #1 residential real estate
marketplace

Homes.com by the Numbers 100M+ Millions Leads Monthly Unique Visitors
per Quarter 20K+ 2M+ Residential For Sale Neighborhood and Rental Listings Content 512K 1M+ Agents with Registered Agents 1+ Listing * Sources: Homes.com surpassed 100 million monthly unique visitors, according to Google Analytics for September
2023. All other based on Internal data as of February 2024.

A Better Business Model – “Your Listing, Your Lead”
• • O On nlly y H Ho om me es s..c co om m c co on nn ne ec ctts s y yo ou u tto o tth he e lliis sttiin ng g a ag ge en ntt w wh ho o k kn no ow ws s tth he e h ho om me e b be es stt • • N No o c co olld d c ca alllls s,, r
ro ob bo oc ca alllls s,, o or r s sp pa am m ffr ro om m r ra an nd do om m a ag ge en ntts s • • C Co om mp pe ettiitto or r m mo od de ells s m mo on ne ettiiz ze e b bu uy ye er r a ag ge en nc cy y,, tta ak kiin ng g o on ne e tth
hiir rd d o off a ag ge en ntt’’s s c co om mm miis ss siio on ns s • • H Ho om me es s..c co om m iis s p pr ro ov viid diin ng g m miilllliio on ns s o off ffr re ee e lle ea ad ds s tto o lliis sttiin ng g a ag ge en ntts
s tto o h he ellp p s se ellll tth he e h ho om me e

Our Proprietary Content Sets Us Apart. Consumers Aren’t Just
Looking for a Home, They’re Looking for a Community. Homes.com is digitizing rich content for communities across the U.S. 20,000+ Neighborhoods 40,000+ Parks 125,000+ Schools 65,000+ Condo Buildings

The Real Estate Portals Adhering to the Your Listing Your Lead
Principal are the Most Successful Not Your Listing Your Listing Your Lead Your Lead $2.0 $2.0 $1.5 $1.5 $1.0 $1.0 $0.5 $0.5 $0.0 $0.0 Zillow Redfin CoStar Rightmove REA Group Scout24 Lifull ($0.5) ($0.5) Group ($1.0) ($1.0) ($1.5) ($1.5) Billions in
Net income (loss) for 10-year period from 2014-2023 from publicly filed financial statements. When full year 2023 was not available, trailing twelve months was used.

“ “W We e’’v ve e d do on ne e y yo ou ur r h
ho om me e w wo or rk k..” ” 2 20 02 24 4 S Su up pe er rc ch ha ar rg ge ed d M Ma ar rk ke et tiin ng g C Ca am mp pa aiig gn n

BIGGEST Real Estate Campaign Ever Working on behalf of the industry to
help agents sign more buyer and seller agreements, drive demand for their listings and close more transactions. Over a Reaching BILLION 80 90% DOLLARS BILLION of households invested impressions

We Kicked Off The Biggest Advertising Stage In America 4 QUARTERS, 4 4
C Co om mm me er rc ciia alls s Launch Mascot Salon

Homes.com will be EVERYWHERE. No other competitors come close to our
investment to drive leads to all agents
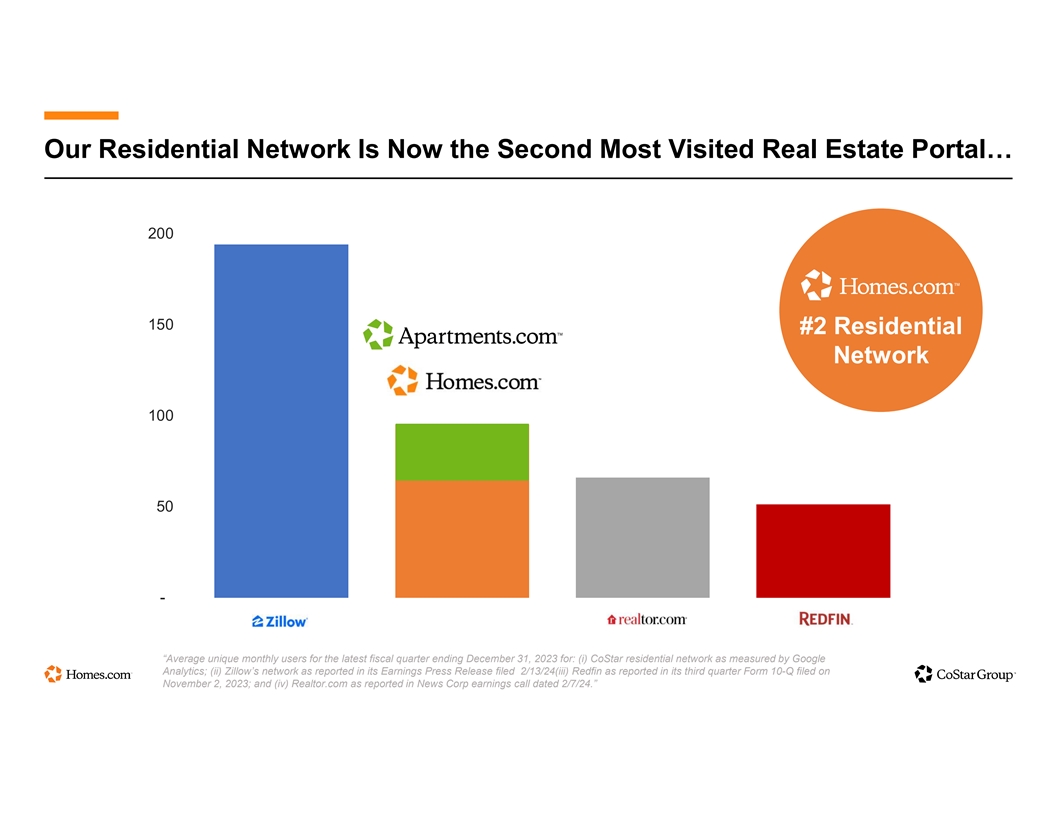
Our Residential Network Is Now the Second Most Visited Real Estate
Portal… 200 150 #2 Residential Network 100 50 - “Average unique monthly users for the latest fiscal quarter ending December 31, 2023 for: (i) CoStar residential network as measured by Google Analytics; (ii) Zillow’s network as
reported in its Earnings Press Release filed 2/13/24(iii) Redfin as reported in its third quarter Form 10-Q filed on November 2, 2023; and (iv) Realtor.com as reported in News Corp earnings call dated 2/7/24.”

Investing to Create the #1 Residential Portal in the UK üAverage
monthly unique visitors since acquisition up 143% üListings up 57,000 since acquisition üAgent advertisers up 1,000 since acquisition üLeads have grown 81% since acquisition ü2024 Revenue Forecast of $40 million

The global leader in commercial real estate information, analytics, and
data-driven news
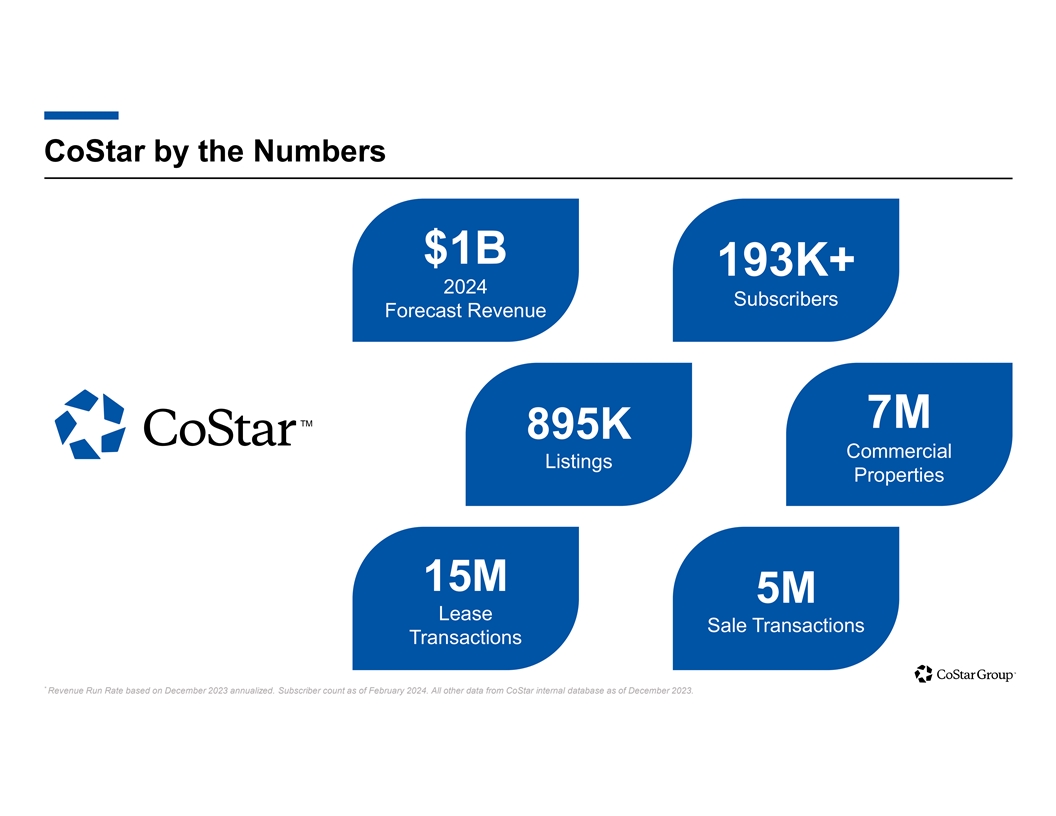
CoStar by the Numbers $1B 193K+ 2024 Subscribers Forecast Revenue 7M
895K Commercial Listings Properties 15M 5M Lease Sale Transactions Transactions * Revenue Run Rate based on December 2023 annualized. Subscriber count as of February 2024. All other data from CoStar internal database as of December 2023.

CoStar Product Investments Expand the Market Size, Resulting in
Long-Term Double-Digit Growth $250 12% Revenue Growth Rate $4B U.S. MARKET SIZE Ten Year CAGR Tenants Hospitality $200 Lenders Owners / $150 Investors Brokers / Appraisers $100 $50 $0 2004 2005 2006 2007 2008 2009 2010 2011 2012 2013 2014 2015 2016
2017 2018 2019 2020 2021 2022 2023 Total addressable market for CoStar – CoStar estimate. CAGR based on trailing twelve-month revenue as of 12/31/23. Quarterly Revenue (in millions)

Unparalleled Research Methodology 1,000+ Drones 70 400 Analysts and
In-market Economists canvassers 1 1,600 Cessna capturing Researchers aerial insights Automated data 1,200 extraction Software Developers To facilitate the gathering of data 50 Data feeds and Journalists Across third-party data North America &
Europe 1 Based on 12/31/23 Internal Data

The #1 global commercial real estate marketplace

LoopNet by the Numbers 16% $277M 5 Year Revenue Revenue Run Rate CAGR
14M ~370K Monthly Unique CRE Brokers & Visitors Worldwide Owners Advertising 18X 96% #1 Google Fortune 1000 keywords than Companies closest competitor Active on Site *All data as of December 2023. Run Rate based on December 2023 annualized.
Traffic data from Google Analytics.

Commanding Share of Traffic vs. Marketplace Competitors LoopNet Network
vs. Competitors LoopNet Network crexi propertyshark commercialcafe officespace 64x vts commercialsearch Unique Visitors of the Avg. reonomy CRE Marketplace Competitor buildout commercialexchange 5x Instantoffices propertycapsule Unique Visitors of
the Nearest Competitor rcm1 catylist realnex thebrokerlist 0 1,000,000 2,000,000 3,000,000 4,000,000 5,000,000 6,000,000 7,000,000 8,000,000 Source: SEMRush unique visitors for calendar month ending 12/31/23

LoopNet Revenue Up 5x Since Acquisition $70 Early Stages of a Massive
Domestic International Global Opportunity $60 $5 Billion North American TAM $50 $15 Billion $40 Global TAM $30 $20 $10 $0 2011 2012 2013 2014 2015 2016 2017 2018 2019 2020 2021 2022 2023 Quarterly Revenue in Millions

LoopNet International Expansion Underway LoopNet Canada loopnet.ca
LoopNet UK loopnet.co.uk LoopNet Spain loopnet.es LoopNet France loopnet.fr

The global leader in hospitality information, analytics and
benchmarking
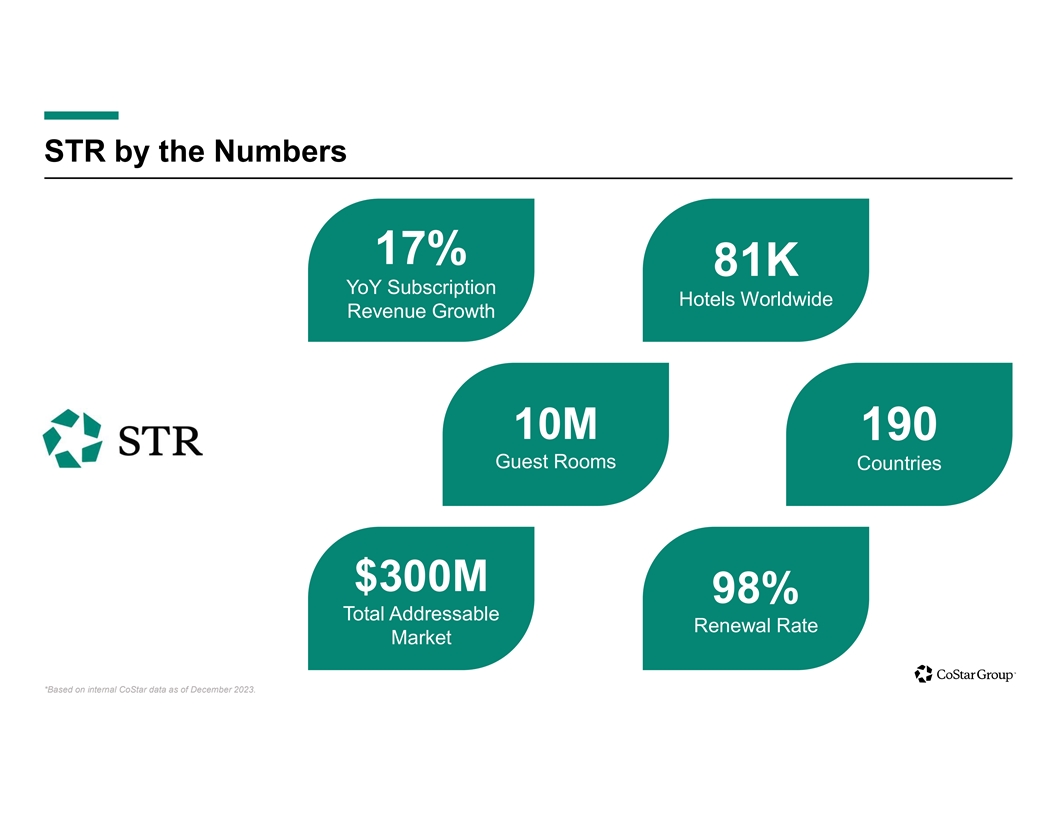
STR by the Numbers 17% 81K YoY Subscription Hotels Worldwide Revenue
Growth 10M 190 Guest Rooms Countries $300M 98% Total Addressable Renewal Rate Market *Based on internal CoStar data as of December 2023.

STR Data Includes 81,000+ Hotels Across 190 Countries

The leading platform for lease accounting and management

Real Estate Manager by the Numbers 12% 97% 5 Year Revenue Customer CAGR
Retention Rate $10B Monthly Lease Payments Managed 625K 33K Real Estate System Users Leases Revenue CAGR 2018-2023. Retention Rate for fourth quarter 2023. All other data from internal database as of December 2023.

Platform for Managing the Tenant’s Entire Lease Lifecycle The
Most Comprehensive Portfolio Management Platform with Integrated CoStar Real Estate Data Drive Cost Savings Optimize Real Estate Portfolios Achieve Lease Accounting Compliance

The SMARTER, BETTER, FASTER way to transact commercial real
estate

Ten-X by the Numbers 92% $31B Properties Sold in Assets Sold 90 Days or
Less 58% Trade Rate Since 2020 85% 94% Non-Distressed Close Rate Assets Assets sold since inception in 2009. Trade rate since acquisition in 2020. Close rate, time to close and non-distressed assets sold are for the full year of 2023.

Ten-X Platform Closes Deals 2-3x Faster than Offline Transactions Asset
Marketing & Asset Evaluation Bidder Qualification Contracts & Closing + - 10 Days Onboarding & Due Diligence Online Auction

Ten-X Revenue Opportunity is >$3 Billion at Current Transaction
Levels Market Penetration % Revenue Opportunity ($1M - $10M Property Size) Current 1.5% $50 Million 5% $155 Million 10% $310 Million 25% $775 Million 33% $1 Billion 100% $3.1 Billion 0 500 1,000 1,500 2,000 2,500 3,000 Annual Revenue (in Millions)
Revenue opportunity based on CoStar estimates.

Commercial Property Sales Transaction Volumes Up 6.4% Year-Over-Year in
January; First Year over Year Gain in 14 Months Office, Retail, Industrial, Multifamily, and Hotel Sales Volume 125 400% 100 300% 75 200% 50 100% 20.9 22.3 25 0% 0 -100% Sales Volume Change from Previous Year Billions of Dollars Change from Previous
Year

The largest rural real estate marketplace in the country

Land.com by the Numbers 15% 10M 5 Year Revenue Average Monthly CAGR
Visitors 8K+ Paid Clients 450K 50K Land Sale Comps Paid Listings in Database *CAGR 2018-2023. Traffic data from Google Analytics for Q4 23 Paid listing and client data from internal database as of 12/31/23.

Land.com Leads All Competitors in Traffic Share Land.com Network
LandSearch LandFlip Network 7 7 7...7 7 7M M M AcreValue v v viiis s siiittts s s p p pe e er r r m m mo o on n nttth h h Homes And Land 3 3 3...3 3 3X X X Land Broker MLS o o ou u ur r r llla a ar r rg g ge e es s sttt c c co o om m mp p pe e
etttiiittto o or r r Farm And Ranch LandHub - 1,000,000 2,000,000 3,000,000 4,000,000 5,000,000 6,000,000 7,000,000 8,000,000 Source: SimilarWeb, Monthly Visits, December2023

The largest business-for-sale marketplace in the U.S.

BizBuySell by the Numbers 10% 38M 5 Year Revenue Annual Visits CAGR
2.8M Annual Leads Delivered 120K 150K Annual Sold Business Comps in Database Paid Listings *CAGR based on 12/31/23. Traffic data for 2023 from Google Analytics. Listing, Lead and Comp data from internal database as of 12/31/23.

Our Network Has More Traffic Than All Competitors Combined BizBuySell
Network BusinessesForSale.com FranchiseDirect 4M FranchiseGator visits per month BusinessBroker.net 15X BizBen our largest competitor GlobalBX BusinessMart * BizBuySell Network traffic vs similar sites; Google Analytics; SimilarWeb, December
2023

Appendix

Non-GAAP Measures For information regarding the purpose for which
management uses the non-GAAP financial measures disclosed in this release and why management believes they provide useful information to investors regarding the CoStar Group Inc.’s (the “Company” of “CoStar Group”)
financial condition and results of operations, please refer to the Company’s latest periodic report filed with the Securities and Exchange Commission at www.sec.gov. EBITDA is a non-GAAP financial measure that represents GAAP net income
attributable to CoStar Group before interest income or expense, net and other income or expense, net; loss on debt extinguishment; income taxes; depreciation and amortization. Adjusted EBITDA is a non-GAAP financial measure that represents EBITDA
before stock-based compensation expense, acquisition- and integration-related costs, restructuring costs, and settlements and impairments incurred outside the Company’s ordinary course of business. Adjusted EBITDA margin represents adjusted
EBITDA divided by revenues for the period. Non-GAAP net income is a non-GAAP financial measure determined by adjusting GAAP net income attributable to CoStar Group for stock-based compensation expense, acquisition- and integration-related costs,
restructuring costs, settlement and impairment costs incurred outside the Company's ordinary course of business and loss on debt extinguishment, as well as amortization of acquired intangible assets and other related costs, and then subtracting an
assumed provision for income taxes. In 2023, the Company is assuming a 26% tax rate in order to approximate its statutory corporate tax rate excluding the impact of discrete items. Non-GAAP net income per diluted share is a non-GAAP financial
measure that represents non-GAAP net income divided by the number of diluted shares outstanding for the period used in the calculation of GAAP net income per diluted share. For periods with GAAP net losses and non-GAAP net income, the weighted
average outstanding shares used to calculate non-GAAP net income per share includes potentially dilutive securities that were excluded from the calculation of GAAP net income per share as the effect was anti-dilutive. Organic revenues and acquired
revenues are non-GAAP measures for reporting financial performance of the business. Organic revenues represent total company revenues excluding net revenues from acquired companies for the first four full quarters since the entities’
acquisition date. Acquired revenues represents revenues from acquired companies for the first four full quarters since the entities' acquisition date. After the completion of four full fiscal quarters, changes in revenues of acquired is treated as
organic for future periods. For products discontinued after an acquisition, the lesser of the reported revenues or the actual revenues reported is included in acquired revenues.

Reconciliation of Net Income to Non-GAAP Net Income - Unaudited The
following table presents a reconciliation of CoStar Group’s, Non-GAAP Net Income, including forward-looking guidance Non-GAAP Net Income, to the most directly comparable GAAP financial measure, net income. For the Year Ended For the Year Ended
December 31, For the Three Months Ended January 31, 2024 - January 31, 2024 - December 31, December 31, (in millions) except per share amounts (1) (1) (1) (1) Low 2024 High 2024 Low High 2023 2023 Net income $ 115.0 $ 129.0 $ (5.0) $ (2.0) $ 96.4 $
374.7 Income tax (benefit) expense 40.0 46.0 (2.0) (1.0) 36.3 126.6 Income before income taxes 155.0 175.0 (7.0) (3.0) 132.7 501.3 Amortization of acquired intangible assets 59.0 59.0 18.0 18.0 19.3 73.7 Stock-based compensation expense 99.0 99.0
24.0 24.0 21.2 85.0 Acquisition and integration related costs - - - - 10.7 12.9 Restructuring and related costs - - - - 0.2 4.1 Settlements and impairments - - - - - (0.1) Other income (expense), net - - - - (3.8) (3.8) Non-GAAP income before income
taxes 313.0 333.0 35.0 39.0 180.3 673.0 (2) Asssumed rate for income tax expense 26% 26% 26% 26% 26% 26% Assumed provision for income tax expesne (81.0) (87.0) (9.0) (10.0) (46.9) (175.0) Non-GAAP net income $ 232.0 $ 246.0 $ 26.0 $ 29.0 $ 133.4 $
498.0 $ 0.28 $ 0.32 $ (0.01) $ - $ 0.24 $ 0.92 Net income per share - diluted $ 0.57 $ 0.60 $ 0.06 $ 0.07 $ 0.33 $ 1.22 Non-GAAP net income per share - diluted Weighted average outstanding shares - diluted 409.4 409.4 409.0 409.0 407.5 406.9 (1)
Represents forward-looking guidance.

Reconciliation of Net Income to Adjusted EBITDA - Unaudited The
following table presents a reconciliation of CoStar Group’s Adjusted EBITDA, including forward-looking guidance range Adjusted EBITDA for the full year ending December 31, 2023, to the most directly comparable GAAP financial measure, net
income. For the Three For the Three For the Three For the Year Ending December 31, Months Ended Months Ended Months Ended January 31, 2024 - January 31, 2024 - December 31, (in millions) (1) (1) (1) (1) 2013 2023 Low 2024 High 2024 Low High 2023 Net
income $ 29.7 $ 374.7 $ 115.0 $ 129.0 $ (5.0) $ (2.0) $ 96.4 Amortization of acquired intangible assets 27.1 73.7 59.0 59.0 18.0 18.0 19.3 Depreciation and other amortization 13.0 33.8 53.0 53.0 12.0 12.0 9.4 Interest income, net 6.6 (213.6) (198.0)
(198.0) (56.0) (56.0) (59.7) Other (income) expense, net - (5.4) 2.0 2.0 (3.0) (3.0) (3.7) Income tax (benefit) expense 17.8 126.6 40.0 45.0 (2.0) (1.0) 36.3 EBITDA 94.2 389.8 71.0 90.0 (36.0) (32.0) 98.0 Stock-based compensation expense 41.5 85.0
99.0 99.0 24.0 24.0 21.2 Acquisition and integration related costs 0.6 12.9 - - - - 10.7 Restructuring and related costs 0.4 4.1 - - - - 0.2 Settlements and impairments - (0.1) - - - - - Adjusted EBITDA $ 136.7 $ 491.7 $ 170.0 $ 190.0 $ (12.0) $
(8.0) $ 130.1 (1) Represents forward-looking guidance.

Use of Operating Metrics and Other Definititions CoStar Group reviews a
number of operating metrics to evaluate its business, measure performance, identify trends, formulate business plans and make strategic decisions. This presentation includes Net New Bookings. Going forward, CoStar Group expects to use these
operating metrics on a periodic basis to evaluate and provide investors with insight into the performance of the Company’s subscription-based services. Net New Bookings are calculated based on the annualized amount of change in the Company's
sales bookings, resulting from new subscription-based contracts, changes to existing subscription-based contracts and cancellations of subscription-based contracts for the period reported. Information regarding net new bookings is not comparable to,
nor should it be substituted for, an analysis of the Company's revenues over time. Other Definitions References to “commercial information and marketplace businesses” refer to our consolidated financial position and results excluding the
impact of our Residential brands, which are Homes.com and OnTheMarket, plc. Our “Residential Network” consists of the following list of brands: Apartments.com, ApartmentFinder, FinderSites, ApartmentHomeLiving, WestSideRentals, ForRent,
After55, CorporateHousing, ForRentUniversity, Move.com (ending in December 2022), Cozy.com, Off Campus Partners, Homes.com, Homesnap, CitySnap, and OnTheMarket,plc (beginning in January 2024).
v3.24.0.1
| X |
- DefinitionBoolean flag that is true when the XBRL content amends previously-filed or accepted submission.
| Name: |
dei_AmendmentFlag |
| Namespace Prefix: |
dei_ |
| Data Type: |
xbrli:booleanItemType |
| Balance Type: |
na |
| Period Type: |
duration |
|
| X |
- DefinitionFor the EDGAR submission types of Form 8-K: the date of the report, the date of the earliest event reported; for the EDGAR submission types of Form N-1A: the filing date; for all other submission types: the end of the reporting or transition period. The format of the date is YYYY-MM-DD.
| Name: |
dei_DocumentPeriodEndDate |
| Namespace Prefix: |
dei_ |
| Data Type: |
xbrli:dateItemType |
| Balance Type: |
na |
| Period Type: |
duration |
|
| X |
- DefinitionThe type of document being provided (such as 10-K, 10-Q, 485BPOS, etc). The document type is limited to the same value as the supporting SEC submission type, or the word 'Other'.
| Name: |
dei_DocumentType |
| Namespace Prefix: |
dei_ |
| Data Type: |
dei:submissionTypeItemType |
| Balance Type: |
na |
| Period Type: |
duration |
|
| X |
- DefinitionAddress Line 1 such as Attn, Building Name, Street Name
| Name: |
dei_EntityAddressAddressLine1 |
| Namespace Prefix: |
dei_ |
| Data Type: |
xbrli:normalizedStringItemType |
| Balance Type: |
na |
| Period Type: |
duration |
|
| X |
- DefinitionAddress Line 2 such as Street or Suite number
| Name: |
dei_EntityAddressAddressLine2 |
| Namespace Prefix: |
dei_ |
| Data Type: |
xbrli:normalizedStringItemType |
| Balance Type: |
na |
| Period Type: |
duration |
|
| X |
- Definition
+ References
+ Details
| Name: |
dei_EntityAddressCityOrTown |
| Namespace Prefix: |
dei_ |
| Data Type: |
xbrli:normalizedStringItemType |
| Balance Type: |
na |
| Period Type: |
duration |
|
| X |
- DefinitionCode for the postal or zip code
| Name: |
dei_EntityAddressPostalZipCode |
| Namespace Prefix: |
dei_ |
| Data Type: |
xbrli:normalizedStringItemType |
| Balance Type: |
na |
| Period Type: |
duration |
|
| X |
- DefinitionName of the state or province.
| Name: |
dei_EntityAddressStateOrProvince |
| Namespace Prefix: |
dei_ |
| Data Type: |
dei:stateOrProvinceItemType |
| Balance Type: |
na |
| Period Type: |
duration |
|
| X |
- DefinitionA unique 10-digit SEC-issued value to identify entities that have filed disclosures with the SEC. It is commonly abbreviated as CIK. Reference 1: http://www.xbrl.org/2003/role/presentationRef
-Publisher SEC
-Name Exchange Act
-Number 240
-Section 12
-Subsection b-2
| Name: |
dei_EntityCentralIndexKey |
| Namespace Prefix: |
dei_ |
| Data Type: |
dei:centralIndexKeyItemType |
| Balance Type: |
na |
| Period Type: |
duration |
|
| X |
- DefinitionIndicate if registrant meets the emerging growth company criteria. Reference 1: http://www.xbrl.org/2003/role/presentationRef
-Publisher SEC
-Name Exchange Act
-Number 240
-Section 12
-Subsection b-2
| Name: |
dei_EntityEmergingGrowthCompany |
| Namespace Prefix: |
dei_ |
| Data Type: |
xbrli:booleanItemType |
| Balance Type: |
na |
| Period Type: |
duration |
|
| X |
- DefinitionCommission file number. The field allows up to 17 characters. The prefix may contain 1-3 digits, the sequence number may contain 1-8 digits, the optional suffix may contain 1-4 characters, and the fields are separated with a hyphen.
| Name: |
dei_EntityFileNumber |
| Namespace Prefix: |
dei_ |
| Data Type: |
dei:fileNumberItemType |
| Balance Type: |
na |
| Period Type: |
duration |
|
| X |
- DefinitionTwo-character EDGAR code representing the state or country of incorporation.
| Name: |
dei_EntityIncorporationStateCountryCode |
| Namespace Prefix: |
dei_ |
| Data Type: |
dei:edgarStateCountryItemType |
| Balance Type: |
na |
| Period Type: |
duration |
|
| X |
- DefinitionThe exact name of the entity filing the report as specified in its charter, which is required by forms filed with the SEC. Reference 1: http://www.xbrl.org/2003/role/presentationRef
-Publisher SEC
-Name Exchange Act
-Number 240
-Section 12
-Subsection b-2
| Name: |
dei_EntityRegistrantName |
| Namespace Prefix: |
dei_ |
| Data Type: |
xbrli:normalizedStringItemType |
| Balance Type: |
na |
| Period Type: |
duration |
|
| X |
- DefinitionThe Tax Identification Number (TIN), also known as an Employer Identification Number (EIN), is a unique 9-digit value assigned by the IRS. Reference 1: http://www.xbrl.org/2003/role/presentationRef
-Publisher SEC
-Name Exchange Act
-Number 240
-Section 12
-Subsection b-2
| Name: |
dei_EntityTaxIdentificationNumber |
| Namespace Prefix: |
dei_ |
| Data Type: |
dei:employerIdItemType |
| Balance Type: |
na |
| Period Type: |
duration |
|
| X |
- DefinitionLocal phone number for entity.
| Name: |
dei_LocalPhoneNumber |
| Namespace Prefix: |
dei_ |
| Data Type: |
xbrli:normalizedStringItemType |
| Balance Type: |
na |
| Period Type: |
duration |
|
| X |
- DefinitionBoolean flag that is true when the Form 8-K filing is intended to satisfy the filing obligation of the registrant as pre-commencement communications pursuant to Rule 13e-4(c) under the Exchange Act. Reference 1: http://www.xbrl.org/2003/role/presentationRef
-Publisher SEC
-Name Exchange Act
-Number 240
-Section 13e
-Subsection 4c
| Name: |
dei_PreCommencementIssuerTenderOffer |
| Namespace Prefix: |
dei_ |
| Data Type: |
xbrli:booleanItemType |
| Balance Type: |
na |
| Period Type: |
duration |
|
| X |
- DefinitionBoolean flag that is true when the Form 8-K filing is intended to satisfy the filing obligation of the registrant as pre-commencement communications pursuant to Rule 14d-2(b) under the Exchange Act. Reference 1: http://www.xbrl.org/2003/role/presentationRef
-Publisher SEC
-Name Exchange Act
-Number 240
-Section 14d
-Subsection 2b
| Name: |
dei_PreCommencementTenderOffer |
| Namespace Prefix: |
dei_ |
| Data Type: |
xbrli:booleanItemType |
| Balance Type: |
na |
| Period Type: |
duration |
|
| X |
- DefinitionTitle of a 12(b) registered security. Reference 1: http://www.xbrl.org/2003/role/presentationRef
-Publisher SEC
-Name Exchange Act
-Number 240
-Section 12
-Subsection b
| Name: |
dei_Security12bTitle |
| Namespace Prefix: |
dei_ |
| Data Type: |
dei:securityTitleItemType |
| Balance Type: |
na |
| Period Type: |
duration |
|
| X |
- DefinitionName of the Exchange on which a security is registered. Reference 1: http://www.xbrl.org/2003/role/presentationRef
-Publisher SEC
-Name Exchange Act
-Number 240
-Section 12
-Subsection d1-1
| Name: |
dei_SecurityExchangeName |
| Namespace Prefix: |
dei_ |
| Data Type: |
dei:edgarExchangeCodeItemType |
| Balance Type: |
na |
| Period Type: |
duration |
|
| X |
- DefinitionBoolean flag that is true when the Form 8-K filing is intended to satisfy the filing obligation of the registrant as soliciting material pursuant to Rule 14a-12 under the Exchange Act. Reference 1: http://www.xbrl.org/2003/role/presentationRef
-Publisher SEC
-Name Exchange Act
-Section 14a
-Number 240
-Subsection 12
| Name: |
dei_SolicitingMaterial |
| Namespace Prefix: |
dei_ |
| Data Type: |
xbrli:booleanItemType |
| Balance Type: |
na |
| Period Type: |
duration |
|
| X |
- DefinitionTrading symbol of an instrument as listed on an exchange.
| Name: |
dei_TradingSymbol |
| Namespace Prefix: |
dei_ |
| Data Type: |
dei:tradingSymbolItemType |
| Balance Type: |
na |
| Period Type: |
duration |
|
| X |
- DefinitionBoolean flag that is true when the Form 8-K filing is intended to satisfy the filing obligation of the registrant as written communications pursuant to Rule 425 under the Securities Act. Reference 1: http://www.xbrl.org/2003/role/presentationRef
-Publisher SEC
-Name Securities Act
-Number 230
-Section 425
| Name: |
dei_WrittenCommunications |
| Namespace Prefix: |
dei_ |
| Data Type: |
xbrli:booleanItemType |
| Balance Type: |
na |
| Period Type: |
duration |
|
CoStar (NASDAQ:CSGP)
Historical Stock Chart
From Apr 2024 to May 2024

CoStar (NASDAQ:CSGP)
Historical Stock Chart
From May 2023 to May 2024
