
Follow - On Offering Investor Presentation December 2021 Issuer Free Writing Prospectus Dated December 13, 2021 Filed Pursuant to Rule 433 Registration Statement No. 333 - 255210

Forward - Looking Statements and Other Information This presentation and oral statements made regarding the subject of this presentation contain forward - looking statements within the m eaning of the Private Securities Litigation Reform Act of 1995. These forward - looking statements reflect the current views of Coastal Financial Corporation (“ Coastal ”, “CFC ”, “we”, “us”, or the “Company ”) with respect to, among other things, future events and Coastal’s financial performance. Any statements about Coastal’s expectations, beliefs, plans, predictions, forecasts, objectives, assumptions or future events or performance are not historical facts and may be forward - looking. These statements ar e often, but not always, made through the use of words or phrases such as “anticipate,” “believes,” “can,” “could,” “may,” “predicts,” “potential,” “should,” “will,” “estimate,” “plans,” “projects,” “continuing,” “ongoing,” “expects,” “intends” and si milar words or phrases. Any or all of the forward - looking statements in (or conveyed orally regarding) this presentation may tur n out to be inaccurate. The inclusion of or reference to forward - looking information in this presentation should not be regarded a s a representation by Coastal or any other person that the future plans, estimates or expectations contemplated by Coastal wi ll be achieved. Coastal has based these forward - looking statements largely on its current expectations and projections about future ev ents and financial trends that Coastal believes may affect its financial condition, results of operations, business strategy and financial needs. Coastal’s actual results could differ materially from those anticipated in such forward - looking statements as a result of risks, uncertai nties and assumptions that are difficult to predict. Factors that could cause actual results to differ materially from those in the forward - looking statements include, without limitation, the risks and uncertainties discussed under “Risk Factors” in Form 10 - K for the year ended December 31, 2020, Coastal’s Quarterly Reports on Form 10 - Q, and in any of Coastal’s subsequent filings with the Securities and Exchange Commission (the “SEC”). If one or more events related to these or other risks or uncertainties materialize, or if Coastal’s underlying assumptions prove to be incorrect, actual results may differ materially from what Coastal anticipates. You are cau ti oned not to place undue reliance on forward - looking statements. Further, any forward - looking statement speaks only as of the date on which it is made and Coastal un dertakes no obligation to update or revise any forward - looking statement to reflect events or circumstances after the date on which the statement is made or to reflect the occurrence of unanticipated events, except as required by applicable law. This presentation includes industry and trade association data, forecasts and information that Coastal has prepared based, in pa rt, upon data, forecasts and information obtained from independent trade associations, industry publications and surveys, government agencies and other information publicly available to Coastal, which information may be specific to particular mark ets or geographic locations. Some data is also based on Coastal’s good faith estimates, which are derived from management’s knowledge of the industry and independent sources. Industry publications, surveys and forecasts generally state that the info rma tion contained therein has been obtained from sources believed to be reliable. Statements as to Coastal’s market position are based on market data currently available to Coastal. Although Coastal believes these sources are reliable, Coastal has not in dep endently verified the information contained therein. While Coastal is not aware of any misstatements regarding the industry d ata presented in this presentation, Coastal’s estimates involve risks and uncertainties and are subject to change based on various factors. Similarly, Coastal believes tha t its internal research is reliable, even though such research has not been verified by independent sources. Trademarks referred to in this presentation are the property of their respective owners, although for presentational convenie nce we may not use the ® or the TM symbols to identify such trademarks. Non - GAAP Financial Measures This presentation includes certain non - GAAP financial measures for 2017 to exclude the impact of a deferred tax asset revaluatio n due to the enactment of the Tax Cuts and Jobs Act of 2017 (the “Tax Cuts and Jobs Act”), including adjusted net income, adjusted earnings per share - diluted, adjusted return on average assets and adjusted return on average shareholders’ equity. Thes e non - GAAP financial measures and any other non - GAAP financial measures that we discuss in this presentation should not be considered in isolation, and should be considered as additions to, and not substitutes for or superior to, measures of fin anc ial performance prepared in accordance with GAAP. There are a number of limitations related to the use of these non - GAAP financial measures versus their most directly comparable GAAP equivalents. For example, other companies may calculate non - GAAP f inancial measures differently or may use other measures to evaluate their performance, all of which could reduce the usefulness of Coastal’s non - GAAP financial measures as tools for comparison. See the Appendix to this presentation for a reconciliation of the non - GAAP financial measures used in (or conveyed orally during) this presentation to their most directly comparable GAAP financial measures. This presentation also contains certain non - GAAP financial measures in addition to results presented in accordance with GAAP rel ating to “pre - tax, pre - provision net income” and “pre - tax, pre - provision return on average assets” to illustrate the impact of provision for loan losses and provision for income taxes on net income and return on average assets. The most directly compar abl e GAAP measure to “pre - tax, pre - provision net income” is net income. The most directly comparable GAAP measure to “pre - tax, pre - provision return on average assets” is return on average assets. See the Appendix to this presentation for a reconcili ation of the non - GAAP financial measures used in (or conveyed orally during) this presentation to their most directly comparable GAAP financial measures. This presentation also contains certain non - GAAP financial measures in addition to results presented in accordance with GAAP to illustrate and identify the impact of Paycheck Protection Program (“PPP”) loans, Paycheck Protection Program Liquidity Facility (“PPPLF”) borrowings, customer deposits from PPP loans, and related earnings and expenses. By removing these signif ica nt items and show what the results would have been without them we are providing investors with the information to better compare results with periods that did not have these significant items. "Adjusted Tier 1 leverage capital ratio, excluding PP P l oans" is a non - GAAP measure that excludes the impact of PPP loans on balance sheet. The most directly comparable GAAP measure is Tier 1 leverage capital ratio. See the Appendix to this presentation for a reconciliation of the non - GAAP financial m easures used in (or conveyed orally during) this presentation to their most directly comparable GAAP financial measures . Registration Statement This presentation is not an offer to sell securities, nor is it a solicitation of an offer to buy securities, in any locality , s tate, country or other jurisdiction where such distribution, publication, availability or use would be contrary to law or reg ula tion or which would require any registration or licensing within such jurisdiction. Neither theSEC nor any other regulatory body has approved or disapproved of the securities of the Company or passed upon the accuracy or ade qu acy of this presentation. Any representation to the contrary is a criminal offense. Except as otherwise indicated, this presentation speaks as to the date her eof. The delivery of this presentation shall not, under any circumstances, create any implication that there has been no chan ge in the affairs of the Company after the date hereof . Coastal has filed a shelf registration statement on Form S - 3 (File No. 333 - 255210) (including a base prospectus) and related preliminary prospectus supplement dated April 22, 2021 with the SEC fo r the offering to which this communication relates. Before you invest, you should read the prospectus in that registration statement, the related prospectus supplement and other docume nts that we have filed with the SEC for more complete information about Coastal and this offering. You may get these documents for free by visiting the SEC’s website at www.sec.gov. Alternatively, we, the underwriters or any dealers participating in th e o ffering will arrange to send you the base prospectus and the related preliminary prospectus supplement if you request it by c all ing Keefe, Bruyette & Woods, Inc. toll free at ( 800) 966 - 1559 or emailing USCapitalMarkets@kbw.com. 2 Legal Information and Disclaimer

3 Offering Summary Company Exchange / Ticker Security Overallotment Option Lock - up Period Use of Proceeds Sole Bookrunner Co - Managers Coastal Financial Corporation Nasdaq / CCB Common Stock 15% (100% Primary) 90 days for the Company directors & executive officers General corporate purposes, including, without limitation, supporting investment opportunities and Coastal Community Bank’s growth Keefe, Bruyette & Woods, A Stifel Company Raymond James & Associates, Stephens Inc., and Hovde Group LLC Base Deal Size $30 million (100% Primary) Expected Pricing Date December 14 th , 2021 (post - close)

Today’s Presenters Eric M. Sprink | President and Chief Executive Officer Eric M. Sprink joined the Company in late 2006 as President and Chief Operating Officer and became Chief Executive Officer in 2010. Mr. Sprink began his banking career working for Security Pacific Bank while enrolled at Arizona State University. He assumed increasing le vels of responsibility in the areas of retail operations, consumer and commercial lending and wealth management with Security Paci fic Bank and its successor, Bank of America. He then moved to Centura Bank, where he held management positions in retail operations and corporate finance. After Centura Bank was acquired, he held senior management positions at Washington Trust Bank and Global Credit Union. Mr . Sprink is active in industry trade groups and is a director and past chairman of the Community Bankers of Washington. Mr. Sprink received a bachelor’s degree from Arizona State University and an M.B.A. from the University of North Carolina . Joel G. Edwards | Executive Vice President and Chief Financial Officer Joel G. Edwards has served as Executive Vice President and Chief Financial Officer of the Company since 2012. Mr. Edwards is als o the Executive Vice President and Chief Financial Officer of the Company’s wholly - owned banking subsidiary, Coastal Community Bank (the “Bank”) . Prior to joining the Company and Bank, Mr. Edwards was a Senior Vice President and Administration Officer at AmericanWest Bank. Prior to that experience, he was Executive Vice President and Chief Financial Officer at Viking Bank, Vice President an d C hief Financial Officer at Rainier Pacific Bank, and President of the Washington Credit Union Share Guaranty Association. He also w as employed in the Farm Credit System for eight years including positions as vice president responsible for administration, budg et and policy. Mr . Edwards graduated magna cum laude with a bachelor’s degree in business and concentration in economics from, and completed p ost - graduate studies in accounting at, Eastern Washington University. He also received an M.B.A. from Eastern Washington Universi ty. 4

5 “CCB” The Community Bank “CCBX” Banking as a Service ( BaaS ) “CCDB” Coastal’s Digital Bank • Best - in - class community bank that offers lending and deposit products to commercial and retail customers • Loan portfolio consists primarily of CRE and C&I loans (89% of loans receivable) with 81% originated in the state of Washington • Attractive funding mix with 58% noninterest - bearing deposits and total deposit cost of 0.10% • Conservative credit culture with strong NCO performance (0.00% YTD) • Asset - sensitive balance sheet that is well - positioned for rising interest rate environment • Provides Banking as a Service ( BaaS ) to broker dealers and digital financial services providers • 16 active partners with 10 more currently in the implementation / onboarding or signed LOI stage • Robust sourcing capabilities and thorough due diligence of potential partner relationships • Exceptional growth in fee income of 297% YoY and 61% QoQ • Strong deposit generation platform with total balance of $607.2 million (127% growth QoQ ) • Shifting from Google banking collaboration to other opportunities in the digital banking sector Long - Term Strategic Verticals Note: Data as of or for the quarter ended September 30, 2021, unless otherwise noted. (1) Total CRE loans include commercial real estate loans, multifamily and construction, land and land development loans .

$649 $703 $804 $968 $1,421 $2,224 2016 2017 2018 2019 2020 2021Q3 $596 $657 $768 $939 $1,547 $1,706 2016 2017 2018 2019 2020 2021Q3 $741 $806 $952 $1,129 $1,766 $2,452 2016 2017 2018 2019 2020 2021Q3 6 Consolidated Financial Highlights $60 $66 $109 $124 $140 $161 2016 2017 2018 2019 2020 2021Q3 (1) Pre - tax, pre - provision return on average assets ( “PTPP ROAA”) represents a non - GAAP financial measure. Refer to “Non - GAAP Reconciliation” in the Appendix for additional details. (2) Tangible common equity and tangible assets represent non - GAAP financial measures . Since there is no goodwill or other intangible assets as of the dates indicated, tangible common equity and tangible assets are the same as common equity and total assets, respectively, as of the date indicated. Total Assets Loans Receivable Total Deposits Shareholder Equity Balance Sheet ($ in millions) Total Assets $2,452 Loans Receivable 1,706 Total Deposits 2,224 Total Shareholder Equity 161 Profitability Metrics (%) Return on Average Assets ("ROAA") 1.21 PTPP ROAA(1) 1.59 Return on Average Equity ("ROAE") 16.77 Net Interest Margin 3.48 Asset Quality (%) NPAs / Total Assets 0.03 NPLs / Loans Receivable 0.04 NCOs / Average Loans 0.00 ALLL / Loans Receivable 1.19 Capital Ratios (%) Tangible Common Equity / Tangible Assets(2) 6.57 Common Equity Tier 1 Risk-Based Capital 9.94 Tier 1 Leverage 7.48 Tier 1 Risk-Based Capital 10.15 Total Risk-Based Capital 12.95 For the Quarter Ended September 30, 2021 (Dollars in millions)

7 Strong Financial Performance Has Led to Impressive Returns Revenue CAGR Since CCB’s IPO (%) EPS (1) CAGR Since CCB’s IPO (%) TBVPS CAGR Since CCB’s IPO (%) 29.6% 16.4% 2.5% CCB Specialty Peers KRX Index 28.3% 27.5% 7.8% CCB Specialty Peers KRX Index 19.7% 17.3% 8.5% CCB Specialty Peers KRX Index Relative Stock Price Performance Since IPO CCB 206% Specialty Peers 107% KRX 10% Source: S&P Global. Market data as of December 6, 2021. Note I : Specialty Peers include AX, CASH, GDOT, INBK, LOB, MCB, MVBF, SI , TBBK and TBK. Note II : CCB priced IPO on July 17, 2018. CAGR’s calculated using Q2 2018 and Q3 2021 quarterly financial metrics. (1) Based on diluted EPS. (2) Tangible book value per share is a non - GAAP measure. Since there is no goodwill or other intangible assets as of the dates indicated, tan gible book value per share is the same as book value per share as of each of the dates indicated. (100.0%) (50.0%) 0.0% 50.0% 100.0% 150.0% 200.0% 250.0% 7/17/2018 1/17/2019 7/17/2019 1/17/2020 7/17/2020 1/17/2021 7/17/2021 (2)

8 Environmental, Social and Governance (ESG) Initiatives For Coastal, ESG is a complex initiative across the whole organization. Addressing the issue of the 14.1 million unbanked people (1) in the United states cannot be tackled with merely adding products or doing diversity, equity and inclusion training. Nor can real environmental impact happen through mere board level policies and simply changing our investment portfolio. We are choosing to tackle ESG throughout our company with mea ningful actions and collaboration. CCBX – Working with our CCBX partners allows us to provide a broader range of services for different demographics through their offerings. D eve loping the kind of unique offerings to specific under - served or under - banked populations would be difficult for a bank our size, but by partnering with third - party fintech partners like FAIR, Brigit and Greenwood we are able to use our banking charter to support this effort in a much broader scope . Coastal Community Bank – Our community bank has always had close ties to the communities we serve and has been recognized as a corporate philanthropis t by the Puget Sound Business Journal. We are now evolving to offer affiliated products through our third - party fintech partners that are more inclusive and meet their needs of a broader range of consumers. Once again, our scope and reach is multiplied by collaborating with our third - party fintech partners to offer inclusive products. ESG Across Coastal Environmental Responsibility Social Responsibility (1) Source: National Survey of Unbanked and Underbanked Households by the Federal Deposit Insurance Corporation (FDIC) in June 2021. Financial Inclusion We see financial inclusion as providing access to useful and affordable financial products and services to meet the needs of the under - served. However, overcoming a widespread distrust of banks, lack of financial education, and barriers to entry are all part of the process to bring the underserved in our communities the financial products and services they need to thrive. We are actively working to address : • Accessibility to services • Needs based solution • Education Climate Change Coastal is approaching our responsibility in many ways from understanding our carbon footprint and identifying offsets to developing strong partnerships with ESG focused fintechs . In 2022, we will complete a Sustainable Impact Survey with Aspiration to understand our GHG impact and ways we can offset it. Working with Aspiration, we are exploring ways to develop customer facing - solutions that enable climate action . Additionally, we have and will continue to consider climate change and its impact on our loan portfolio and customers .

9 Coastal Community Bank (CCB) Overview CCB was established in 1997 with a focus on serving small to medium - sized businesses within the Puget Sound region Offers traditional lending and deposit products to commercial and retail customers • Lending products : Commercial real estate, Small Business Administration (“SBA”), business lines of credit and term, residential mortgage, and credit card and other consumer loans • Deposit products : Checking, savings, money market, CD’s & IRA’s Provides business services such as treasury management, remote deposit capture and credit card processing 2014 - 2021 Recipient of the prestigious “5 - Star Rating” from BauerFinancial , Inc. Stanwood & Camano News “Best Bank” 2013 - 2021 2019 - 2021 American Banker Top 200 Community Bank” Everett Herald – 2014 - 2019 Readers Choice – “Best Bank” Raymond James “Community Bankers Cup Award” 2019 - 2020 "Bank and Thrift Sm - All Stars" 2019 - 2021 - Piper Sandler CCB’s Core Markets Dedication to Community Banking Largest community bank by deposit market share in Snohomish County • Headquartered in Everett, Washington – the largest city in and county seat of Snohomish County 14 full - service banking locations in Washington • 12 in Snohomish County • 1 in Island County • 1 in King County Accolades and Recognitions Notable Employers Note: Data as of or for the quarter ended September 30, 2021, unless otherwise noted.
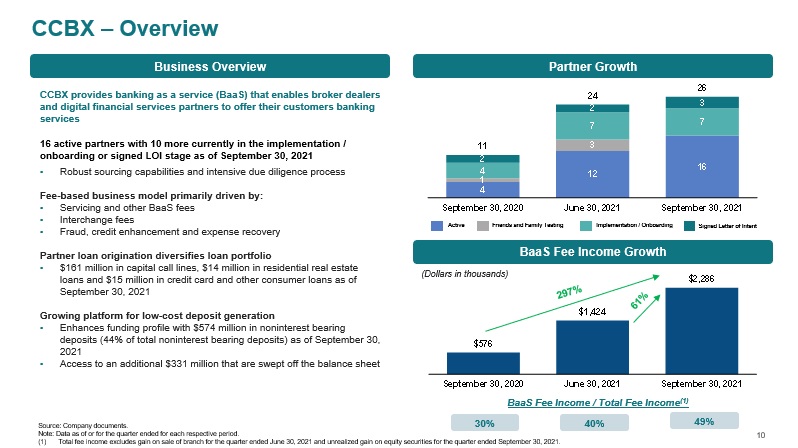
CCBX – Overview Business Overview Partner Growth CCBX provides banking as a service ( BaaS ) that enables broker dealers and digital financial services partners to offer their customers banking services 16 active partners with 10 more currently in the implementation / onboarding or signed LOI stage as of September 30, 2021 • Robust sourcing capabilities and intensive due diligence process Fee - based business model primarily driven by: • Servicing and other BaaS fees • Interchange fees • Fraud, credit enhancement and expense recovery Partner loan o rigination d iversifies l oan p ortfolio • $161 million in capital call lines, $14 million in residential real estate loans and $15 million in credit card and other consumer loans as of September 30, 2021 Growing platform for low - cost deposit generation • Enhances funding profile with $574 million in noninterest bearing deposits (44% of total noninterest bearing deposits) as of September 30, 2021 • Access to an additional $331 million that are swept off the balance sheet BaaS Fee Income Growth Active Implementation / Onboarding Friends and Family Testing Signed Letter of Intent 4 12 16 1 3 4 7 7 2 2 3 11 24 26 September 30, 2020 June 30, 2021 September 30, 2021 $576 $1,424 $2,286 September 30, 2020 June 30, 2021 September 30, 2021 BaaS Fee Income / Total Fee Income (1) 30 % 40 % 49% Source: Company documents. Note : Data as of or for the quarter ended for each respective period. (1) Total fee income excludes gain on sale of branch for the quarter ended June 30, 2021 and unrealized gain on equity securities for the quarter ended September 30, 2021. 10 (Dollars in thousands)

CCBX – Partner Overview 11 Challenger Banks Business Focused Neobanks Lending Marketplace Niche Consumer Lending Family Law Lending Solution Neobank Financial Wellness Consumer Neobank Neobank Denotes signed LOI with partners Note: Data as of December 10, 2021 .

CCBX – Partner Timeline 12 Q1 2019 2017 Q2 2019 Q3 2019 Q4 2019 Q1 2020 Q2 2020 Q3 2020 Q4 2020 Q1 2021 Q2 2021 Q3 2021 Q4 2021 Neobank Neobank Family Law Lending Solution Financial Wellness Consumer Neobank Q1 2022 Denotes signed LOI with partners 2018 Note: Data as of December 10, 2021 .

CCBX – Robust Sourcing Capabilities and Partnering • Focused points of view and research with experts • Proactive market mapping and product identification • Diversity and inclusion 13 Thesis - Driven Sourcing Intensive Filtering Deep Diligence Onboarding to Date • Visionary management teams • Strong execution teams • Compelling unit economics • Bankable size (scalable) • Rigorous vendor process of review • Proud of “slow and thorough” approach – SPA risked based • Leverage advisors and network for diverse insights • Integrate/leverage strategic eco - system partners • Involve board members • Fintech experts and partners • Integrate Coastal LPs

Debt Financing Private Equity Investors Venture Investors Growth Investors Coastal is mainly partnering in this area CCBX – Fintech Company Stage Seed Early Mid/Expansion Late/Mezzanine Exit Early – Stage: Between Seed and Series A: Partner with companies early and obtain long term loyal relationships Company Stage Fintech’s Time Horizon 3 – 5 years in business 5 – 15 years in business Growth Later – Stage: Between Series B and D: • Leverage strong customer position and apply operational leverage to help partners achieve meaningful profitability • Multiple banking partners • Tighter bank profitability Angel Investors 14

$65,626 $103,476 $190,144 December 31, 2020 June 30, 2021 September 30, 2021 CCBX – Loans and Deposits CCBX Loans Receivable CCBX Deposits Note : Data as of or for the quarter ended for each respective period. 15 $68,687 $267,382 $607,217 December 31, 2020 June 30, 2021 September 30, 2021 • Commercial and industrial capital call line commitments increased $60.6 million, or 21.1%, to $347.4 million as of September 30, 2021, compared to $286.8 million as of June, 30 2021 • Access to $331.1 million in CCBX deposits that are swept off the balance sheet as of September 30, 2021 Commercial and Industrial Residential Credit Card Other Consumer Interest Bearing Noninterest Bearing Baas - Brokered 5 % 26% 44% CCBX Noninterest Bearing Deposits / Total Noninterest Bearing Deposits (Dollars in thousands) (Dollars in thousands)

Efficiency Ratio (%) and Noninterest Expense / Average Assets (%) 16 Profitability and Efficiency Net Income ($ in millions) and Return on Average Assets (%) $2.3 $3.0 $5.0 $6.7 $9.7 $13.2 $15.1 $10.5 $19.7 0.49% 0.52% 0.76% 0.90% 1.14% 1.28% 0.98% 0.96% 1.28% 2014 2015 2016 2017 2018 2019 2020 Q3 2020 YTD Q3 2021 YTD Net Income ROAA 78.5% 79.0% 69.7% 67.2% 65.1% 61.8% 58.1% 59.3% 61.5% 3.92% 3.51% 3.28% 3.00% 3.09% 3.01% 2.47% 2.52% 2.74% 2014 2015 2016 2017 2018 2019 2020 Q3 2020 YTD Q3 2021 YTD Efficiency Ratio NIE / Avg. Assets Note: Annual data is as of and for the year ended December 31 of each respective year. (1) Adjusted to exclude the impact of deferred tax asset revaluation due to the enactment of the Tax Cuts and Jobs Act. Refer to “No n - GAAP Reconciliation” in the Appendix for additional details. (1)

17 Diversified Fee Income Streams Historical Fee Income Trends (1)(3) Q3 2021 Fee Income Breakdown (1)(2)(3) $2.1 $3.6 $3.5 $5.0 $4.2 $5.5 $8.1 $8.2 $11.2 $14.9 10.9% 14.9% 13.6% 16.1% 12.4% 13.6% 16.1% 12.5% 16.9% 2013 2014 2015 2016 2017 2018 2019 2020 2021 YTD Fee Income Annualized Fee Income Fee Income / Total Revenue (3) BaaS Fees $2,286 49% Deposit Service Charges and Fees $956 21% Loan Referral Fees $723 16% Gain on Sale of Loans, net $206 4% Mortgage Broker Fees $187 4% Other $302 6% Note : Annual data is as of and for the year ended December 31 of each respective year, unless otherwise noted. (1) Source: S&P Global. (2) Source: Company documents. (3) Excludes unrealized gain on equity securities, net, realized gain on sale of treasury securities, net and gain on sale of bra nch . (Dollars in millions) (Dollars in thousands)

18 Loan Composition by Type and County Loan Composition by County Overall Loan Portfolio • 2.70 years weighted average reprice • 6.46 years weighted average maturity Commercial & Industrial (“C&I”) Portfolio • $536.9 million total C&I loans – $267.3 million in SBA PPP loans – $161.5 million in capital call lines – $101.6 million in other C&I loans – $6.5 million in other SBA C&I loans Commercial Real Estate (“CRE”) Portfolio • $996.1 million total CRE loans (1) • 344% regulatory aggregate CRE to total risk - based capital (2) • $49.6 million of SBA 504 loans in portfolio 1 - 4 Family Real Estate Portfolio • $170.2 million total 1 - 4 family loans • $13.5 million purchased from financial institutions, all of which were individually re - underwritten Legal Lending Limit • $39.8 million as of September 30, 2021 CRE - Owner Occupied 21.7% C&I 31.2% Consumer and Other 1.0% 1 - 4 Family 9.9% CRE - Non - Owner Occupied 17.4% Multifamily 9.6% Construction, Land and Land Dev. 9.2% Owner Operated Businesses 52.9% Investor Real Estate 36.2% Snohomish 37% King 26% Whatcom 3% Skagit 2% Pierce 4% Thurston 1% Island 1% Other WA Counties 8% Out of State 19% Loan Composition by Type Note : Data as of or for the quarter ended September 30, 2021, unless otherwise noted. (1) Total CRE loans include commercial real estate loans, multifamily and construction, land and land development loans. (2) Calculated on Bank - level Tier 1 Capital + Allowance for Loan Losses as of September 30, 2021.

Noninterest - bearing Demand 58.3% NOW and Money Market 34.0% Savings 4.3% Time Deposits < $100K 0.7% Time Deposits > $100K 1.4% BaaS - brokered 1.3% 19 Deposit Composition Cor e Deposit Driven Funding Emphasis on core deposits has helped generate an attractive funding mix • Core deposits are all deposits excluding time deposits and brokered deposits • Core deposits were 126.0% of loans receivable as of September 30, 2021 • Core deposits were 96.6% of total deposits as of September 30, 2021 • Cost of total deposits was 0.10% for the quarter ended September 30, 2021 compared to 0.14% for the quarter ended June 30, 2021, and 0.27% for the quarter ended September 30, 2020 • We continue to focus on managing interest rates, lowering deposit rates when possible, to maintain and/or reduce cost of deposits • No internet - sourced deposits • Ability to use funding from BaaS program and to transfer or sweep deposits off the balance sheet when not needed. Deposit Composition Core Deposits: 96.6% 74.8% 77.0% 96.6% 126.0% Core Deposits / Total Deposits Core Deposits / Loans Receivable December 31, 2013 September 30, 2021 Note : Data as of or for the quarter ended September 30, 2021, unless otherwise noted.

20 Strong Asset Quality NPAs / Assets NPLs / Loans NCOs / Average Loans ALLL / NPLs 1.24% 1.90% 1.52% 1.11% 0.26% 0.19% 0.09% 0.04% 0.03% 2013 2014 2015 2016 2017 2018 2019 2020 2021Q3 0.72% 0.35% 0.54% 0.27% 0.32% 0.24% 0.11% 0.05% 0.04% 2013 2014 2015 2016 2017 2018 2019 2020 2021Q3 0.33% 0.10% 0.11% 0.07% 0.06% 0.06% 0.06% 0.04% 0.00% 2013 2014 2015 2016 2017 2018 2019 2020 2021Q3 164% 365% 221% 468% 378% 515% 1,114% 2,705% 2,733% 2013 2014 2015 2016 2017 2018 2019 2020 2021Q3 Note : Data as of or for the year ended December 31 of each respective year, unless otherwise noted.

8.16% 11.46% 11.00% 7.94% 7.23% 7.68% 6.57% 9.98% 13.70% 12.78% 11.27% 10.89% 10.92% 9.94% 8.95% 12.46% 11.64% 9.05% 8.62% 8.00% 7.48% 10.50% 14.13% 13.14% 11.55% 11.15% 11.16% 10.15% 13.24% 16.58% 15.40% 13.61% 13.15% 13.12% 12.95% 2017 2018 2019 2020 2021Q1 2021Q2 2021Q3 Tangible Common Equity / Tangible Assets Common Equity Tier 1 Risk-based Capital Tier 1 Leverage Capital Tier 1 Risk-based Capital Total Risk-based Capital 21 Consolidated Capital Ratios Source: Company documents. (1) Tangible common equity and tangible assets represent non - GAAP financial measures. Since there is no goodwill or other intangible assets a s of the dates indicated, tangible common equity and tangible assets are the same as common equity and total assets, respectively, as of each of the dates indicated. (1)

22 Investor Highlights • Experienced management team with heavy digital vision • Differentiated business model creates competitive advantage in the rapidly changing banking landscape • CCBX’s s ubstantial growth in recent quarters reinforces positive growth and earnings outlook in the medium and long - term • Increase in partners and new partners going live in 2021 and 2022, especially in Q4 2021 and Q1 2022, reinforces revenue growth potential in future quarters • Diversified revenue streams and partners provide support for consistent earnings growth in a low rate environment • Leading community bank in Snohomish County , the 3 rd largest county by population in the state of Washington (1) • Disciplined underwriting and credit culture demonstrated with a track record of stable asset quality metrics • Emphasis on core deposits has created an attractive funding profile with 96.6% core deposits / total deposits (2) • Large insider ownership (~20%) aligns shareholder interest with day - to - day management and decision - making (1) Source: Washington Office of Financial Management as of November 30, 2021. (2) As of the quarter ended September 30, 2021.

Appendix

24 Significant Growth in Shareholder Value Since IPO (1) Total Revenue (2) ($ in thousands) $10,444 $11,440 $12,612 $13,378 $13,936 $14,272 $15,088 $15,791 $16,946 $18,336 $20,147 $21,342 $23,090 $24,268 2018Q2 2018Q3 2018Q4 2019Q1 2019Q2 2019Q3 2019Q4 2020Q1 2020Q2 2020Q3 2020Q4 2021Q1 2021Q2 2021Q3 Diluted Earnings Per Share ($) $0.24 $0.22 $0.25 $0.23 $0.27 $0.29 $0.30 $0.22 $0.30 $0.34 $0.38 $0.49 $0.56 $0.54 2018Q2 2018Q3 2018Q4 2019Q1 2019Q2 2019Q3 2019Q4 2020Q1 2020Q2 2020Q3 2020Q4 2021Q1 2021Q2 2021Q3 Tangible Book Value Per Share (3) ($) $7.47 $8.86 $9.18 $9.44 $9.79 $10.11 $10.42 $10.66 $10.98 $11.34 $11.73 $12.24 $12.83 $13.41 2018Q2 2018Q3 2018Q4 2019Q1 2019Q2 2019Q3 2019Q4 2020Q1 2020Q2 2020Q3 2020Q4 2021Q1 2021Q2 2021Q3 Source: S&P Global. (1) CCB priced IPO on July 17, 2018. (2) Excludes unrealized gain on equity securities, net, realized gain on sale of treasury securities, net and gain on sale of bra nch . (3) Tangible book value per share is a non - GAAP measure. Since there is no goodwill or other intangible assets as of the dates indicated, tan gible book value per share is the same as book value per share as of each of the dates indicated.

25 Loan Portfolio Statistics Significant CRE Loan Sub - Categories Total Commitments Weighted Average Seasoning (Months) Weighted Average FICO Score (1) Weighted Average LTV (2) Weighted Average DSCR (3) Multifamily $168,202,496 29.2 767.57 60.45% 3.15x Hotels $118,152,315 35.6 762.39 57.07% 2.15x Retail $93,131,280 39.2 775.19 54.39% 2.27x Convenience Stores $79,454,196 36.4 780.31 56.73% 3.27x Mixed Use $80,394,511 43.2 758.79 53.75% 2.68x Warehouse $77,263,937 36.3 777.59 55.12% 3.15x Office - General $60,874,076 44.8 774.87 58.90% 3.28x Mini Storage $40,017,337 16.2 790.09 60.42% 4.89x Manufacturing $37,728,294 49.0 762.90 57.94% 2.57x Office - Professional $35,838,213 32.6 778.52 59.72% 2.22x Loan Category Commitments Weighted Average Seasoning (Months) Weighted Average FICO Score Weighted Average LTV Weighted Average DSCR Commercial Real Estate $858,248,012 36.9 771.17 57% 2.91x C&I (excludes PPP loans & CCL) $176,609,681 39.6 771.04 50% 5.04x Construction/Land $311,257,606 9.4 780.57 47% 3.99x Note: Data as of or for the quarter ended September 30, 2021, unless otherwise noted. (1) Based on best available data. If a loan has multiple guarantors, FICO score represented is highest of the guarantors. FICO scores a re based off origination unless updated through annual term loan review or other credit action . (2) Loan to Value (“LTV”) data is based on best available data. LTV at origination is used unless updated information was made av ail able through an annual term loan review or other credit action . (3) Debt Service Coverage Ratio (“DSCR”) data is based on best available data. DSCR at origination is used unless updated informa tio n was made available through an annual term loan review or other credit action . (4) Source: https://www.statista.com/statistics/206546/us - hotels - occupancy - rate - by - month /. Hotel Portfolio Occupancy Rates (4) (weighted avg )

Commercial Real Estate Composition $837.3 million (1) Outstanding Balance $20.9 million Available Loan Commitment 40.3% % of Loans Receivable (Outstanding Balance & Available L oan Commitment) $1.4 million Average Loan Balance 0.00% NPLs / Loans Outstanding Apartments $140.6 17% Hotel / Motel $117.9 14% Office $92.2 11% Retail $84.9 10% Convenience Store $78.4 9% Warehouse $76.4 9% Mixed Use $74.5 9% Mini Storage $39.9 5% Manufacturing $37.1 5% Other $95.4 11% Note : Data as of or for the quarter ended September 30, 2021. (1) Excludes $158.7 million of construction, land and land development loans. 26 (Dollars in millions)

Commercial and Industrial Composition $269.6 million (1) Outstanding Balance $415.9 million Available Loan Commitment 32.2% % of Loans Receivable (Outstanding Balance & Available Loan Commitment) $0.4 million Average Loan Balance 0.21% NPLs / Loans Outstanding Capital Call Lines $161.5 60% Financial Institutions $20.2 7% Construction / Contractor Services $15.0 6% Medical / Dental / Other Care $12.4 5% Manufacturing $12.2 4% Retail $9.6 4% Other $38.8 14% 27 Note : Data as of or for the quarter ended September 30, 2021. (1) Excludes $267.3 million of Paycheck Protection Program loans. (Dollars in millions)

28 Construction, Land and Land Development Composition Commercial Construction $63.8 40% Undeveloped Land Loans $37.7 24% Residential Construction $25.4 16% Developed Land Loans $17.9 11% Land Development $13.9 9% $158.7 million Outstanding Balance $152.6 million Available Loan Commitment 14.6% % of Loans Receivable (Outstanding Balance & Available Loan Commitment) $1.2 million Average Loan Balance 0.00% NPLs / Loans Outstanding Note: Data as of or for the quarter ended September 30, 2021. (Dollars in millions)

29 COVID - 19 Response – PPP Loans Net Deferred SBA Fees on PPP Loans Status of PPP Loans Round 1 and 2 Outstanding $16.2 2.1% Round 3 Outstanding $251.1 32.9% Forgiven $496.6 65.0% PPP Loans: • F unded $ 763.9 million in assistance to existing and new small business customers in 2020 and 2021 • As of September 30, 2021, we have $267.3 million in PPP loans outstanding Repaid all amounts borrowed from the Federal Reserve Bank of San Francisco under the Paycheck Protection Program Liquidity Facility (“PPPLF”) as of June 30, 2021, which was utilized to fund PPP loans Total Net Deferred SBA Fees on PPP Loans: • Total of $26.3 million on all PPP loans, as of September 30, 2021 • Earned $2.9 million in net deferred SBA fees on PPP loans in the quarter ended September 30, 2021 • $9.4 million in these net deferred SBA fees remain as of September 30, 2021, and will be earned over the remaining life of the PPP loans Unearned Earned 2020 Earned 1Q2021 Earned 2Q2021 Earned 3Q2021 $9.4 $7.1 $3.2 $3.6 $2.9 Note : Data as of or for the quarter ended September 30, 2021. (1) Total does not sum to $26.3 million due to rounding. (1) (Dollars in millions) (Dollars in millions)

30 COVID - 19 Response – Company and Washington State Re - Opening Status of Company and Washington State Re - Opening • As of September 30, 2021, Washington state re - opened under the Washington Ready plan. All industry sectors previously covered by the Roadmap to Recovery or the Safe Start plan, with limited exceptions, returned to usual capacity and operations . • Effective July 19, 2021, the Company’s corporate offices officially re - opened, which included non - remote and hybrid workers returning to the office and in - person gatherings/trainings resuming. • We are serving customers through branch lobbies, drive throughs , call center, mobile banking, online banking and ATMs.

31 COVID - 19 Response – Loan Modifications Status of All Deferred or Modified Loans • All loans that were deferred or modified due to the COVID - 19 pandemic have returned to active status or paid off as of September 30, 2021 . • We have had no charge - offs, repossessions, or moves to TDR as a result of these deferrals or modifications given to customers impacted by the COVID - 19 pandemic. • Total of $246.4 million, or 250 loans, were placed on deferred or modified status, pursuant to federal guidance, since the beginning of the COVID - 19 response program.

32 Interest Rate Sensitivity Change in Net Interest Income Change in 12 Month Projection as of Market Interest Rate 12/31/2020 9/30/2021 +400 bps 18% 52% +300 bps 14% 39% +200 bps 9% 26% +100 bps 5% 13% -100 bps (4%) (8%) -200 bps (7%) (12%) -300 bps (10%) (16%) Source: Company 10 - Q for the quarter ended September 30, 2021.

33 Diversity, Equity, and Inclusion (DEI) and ESG Initiatives Source: Company documents. Underserved Small Business Black Young Adults Latinx Asian Women ESG Muslim Immigrants

34 Corporate ESG Initiatives Coastal Financial Corporation Inclusive Affiliate offerings BaaS for ESG challenger Banks Sustainability Strategy Customer - facing solutions Local community initiatives Governance - Board diversity

35 Financial Inclusion Initiatives Fintech ESG focused providers supported by CCBX on Coastal balance sheet New Coastal bank products, services and education ( BankOn ) Best in breed offering to CCB clients through affiliation relationships Credit cards and consumer loans Focusing on other opportunities in the digital banking sector including education and new product offerings CCBX CCB CCDB CCBX / CCB / CCDB collaboration

Christopher D. Adams, Chairman of the Board Christopher D. Adams is a partner in the law firm of Adams & Duncan, Inc., P.S. in Everett, Washington. Mr. Adams practices i n t he areas of corporate law, commercial real estate and tax matters. He graduated from the University of Washington with a bachelor’s degree in business and received his J.D. and M.B.A. from Gonzag a U niversity. Mr. Adams also holds a Masters in Tax Law from the University of Washington School of Law. Mr. Adams brings to the board of directors legal expertise and familiarity with our market area. Mr . A dams has been a member of our board of directors since 2016. Board of Directors Andrew P. Skotdal , Vice Chairman of the Board Andrew P. Skotdal serves as President of the commercial and industrial portfolios of Skotdal Real Estate, a private commercial real estate development company that develops projects as long - term investments in the northern Puget Sound region and that also operates retail and multi - family portfolios. He is also the Preside nt and co - owner of S - R Broadcasting Co., Inc., which operates radio stations serving the northern Puget Sound region. He is a member of Young Presidents Organization, a global network of young chief exe cut ives. Mr. Skotdal graduated from the University of Virginia with a bachelor’s degree in history. Mr. Skotdal brings to the board of directors leadership experience, expertise in finance and real estate and familiarity with our market ar ea. Mr. Skotdal , who was one of the founders of the Bank, has been a member of our board of directors since 1997. Eric M. Sprink , President, CEO & Board Director Eric M. Sprink serves as our President and Chief Executive Officer. Mr. Sprink joined the Company in late 2006 as President and Chief Operating Officer and became Chief Executive Officer in 2010. Mr. Sprink began his banking career working for Security Pacific Bank while enrolled at Arizona State University. He assumed increasing le vels of responsibility in the areas of retail operations, consumer and commercial lending and wealth management with Security Pacific Bank and its successor, Bank of America. He then moved to Centura Bank, where he held management positions in retail operations and corporate finance. After Centura Bank was acquired, he held senior management positions at Washington Trust Bank and Global Credit Union. Mr. Sprink is active in industry trade groups and is a director and past chairman of the Community Bankers of Washington. Mr. Sprink received a bachelor’s degree from Arizona State University and an M.B.A. from the University of North Carolina. Mr. Sprink brings to our board of directors leadership experience, significant experience in many facets of the financial services business, and f ami liarity with our market area. Mr. Sprink has been a member of our board of directors since 2006. Sadhana Akella - Mishra, Board Director Sadhana Akella - Mishra has served as the Chief Information Security and Compliance Officer for Finxact , Inc., a core banking software company, since July 2018. From May 2018 to June 2018, Ms. Akella - Mishra was the Chief Compliance Officer for Sunlight Payments (now Purposeful), an electronic payments company. Prior to that ti me, Ms. Akella - Mishra served as the Chief Compliance Officer (Global) of Geoswift Ltd. from June 2017 to April 2018 and as the U.S. Head of Compliance for Geoswift US Inc. from November 2016 to June 2017. From April 2016 to November 2016, Ms. Akella - Mishra served as the Senior Manager, General Compliance of Ripple, Inc. Prior to that time, she served as the Chief Compliance Officer of Zenbanx Holding Ltd. from March 2014 to April 2016 and as a Senior Compliance Manager for Zenbanx Holding Ltd. from August 2013 to February 2014. From July 2007 to July 2013, Ms. Akella - Mishra served in various positions with Deutsche Bank, including as Americas Regional Head, Anti Financial Crime - Fraud from September 2012 to July 2013. Ms. Akella - Mishra brings to the Board of Directors compliance and information security expertise and familiarity with the financial serv ic es industry. 36

Rilla Delorier , Board Director Rilla Delorier is an experienced C - suite leader with more than 30 years of executive experience and has served in a range of capacities includ ing managing the P&L of a $2.7 billion retail banking business, Chief Strategy and Digital Transformation Officer, Chief Marketing Officer, healthcare business leader, and strategy consulti ng with Bain & Co. A graduate of the University of Virginia, with an MBA from Harvard, Delorier lead innovation initiatives at Umpqua Bank and SunTrust Bank and is a sought - after speaker on leadership, purpose, innovation, and business transformation. Delorier’s experience in developing new products, automating operations, implementing enhanced cyber - security practices, establishing strategic partnersh ips, and modernized use of analytics will help advise Coastal as it navigates within the highly regulated and ever - changing banking environment. Board of Directors (cont.) Steven D. Hovde , Board Director Steven D. Hovde is the Chairman and Chief Executive Officer at Hovde Group, LLC, an investment banking and advisory firm that serves bank and thrift clients across the United States, where he is responsible for managing its investment banking activities, the strategic development of mergers and acquisitions of bank and th rift institutions, and its private equity activities. He serves as a director of H Bancorp and as a trustee of several charitable foundations. Before co - founding Hovde Group in 1987, Mr. Hovde was Regional General Counsel and Vice President of a national commercial real estate development firm. Previous to that, Mr. Hovde served as an attorney with, Rudnick & Wolfe, which is today DLA Piper, specializing in real estate law. Prior to that, Mr. Hovde practiced accounting in Chicago as a Certified Public Accountant with Touche Ross LLP, which is today Deloitte & Touche LLP. Mr. Hovde graduated summa cum laude with a Bachelor of Business Administration, majoring in Accounting, from the School of Business at the University of Wisconsin, Madison. He also earned his law degree, cum laude, at Northwester n U niversity. Mr. Hovde provides the board of directors with important experience and insight into the financial services industry. Mr. Hovde has been a member of our board of directors since 2011. Stephan Klee, Board Director Stephan Klee is the Chief Financial Officer at Portag3 Ventures, which makes investments in innovative financial services com pan ies. Prior to joining Portag3, Mr. Klee served as Chief Financial Officer of Zenbanx Holding, Inc. and remained in an executive capacity after its merger with SoFi , Inc., one of the largest U.S. fintech companies. Previously, Mr. Klee served as a Senior Vice President at Bank of Nova Scotia, at ING Direct Canada, where he was CFO and Treasurer from 2011 to 2014, and at ING Direct USA, where he served as Chi ef of Staff from 2002 to 2011. He began his career at Deutsche Bank in Germany. Mr. Klee attended the University of Applied Sciences in Germany before earning an MBA at the Ivey Business School. H e i s also an AMP graduate from Harvard Business School. Mr. Klee adds his expertise in emerging technologies and digital banking to the company’s board, bringing a new perspective as banking and cust ome r access to banking services continues to evolve. He joined our board of directors in July 2018. 37

Thomas D. Lane, Board Director Thomas D. Lane is the owner and president and chief executive officer of Dwayne Lane’s Auto Family, which operates six automo bil e dealerships. He is active in community organizations and currently serves on the Economic Alliance Snohomish County board of trustees. Mr. Lane graduated from Western Washington University with a bac hel or’s degree in business administration. Mr. Lane brings to the board of directors leadership experience and familiarity with our market area. Mr. Lane has been a member of our board of directors si nce the Bank’s formation in 1997. Board of Directors (cont.) Michael Patterson, Board Director Michael Patterson is a seasoned global business leader with more than 38 years of cross - sector experience in strategy, P&L manag ement, and international operations with deep expertise in risk management, compliance, governance, and financial control. A graduate of Pace University, he led EY LLP's Compliance Risk Management busi nes s in the firm's Financial Services Office and was appointed to the role at the height of the 2008 crisis. Before that he served as the First VP of the Risk and Control function in the institutional bu sin ess for Merrill Lynch & Co and served several leadership roles at other leading consulting firms. Gregory A. Tisdel , Board Director Gregory A. Tisdel is the owner of Tiz’s Door Sales, Inc. and a member of the City of Everett Planning Commission. He serves on the Advisory Board of the Puget Sound Cl ean Air Agency and is past Special Advisor to the Economic Alliance Snohomish County. Mr. Tisdel is an active supporter of social, civic and cultural programs and was honored with the 2008 Henry M. Jackson Citizen of the Y ea r Award. Mr. Tisdel has been active in community organization, including the YMCA, American Red Cross Snohomish County Chapter and Volunteers of Am erica. Mr. Tisdel brings to the board of directors leadership experience and familiarity with our market area. Mr. Tisdel has been a member of our board of directors since 2002. Pamela Unger, Board Director Pamela Unger is a Certified Public Accountant who supports venture capital funds with tax planning, compliance, and related i nve stor issues and inquiries. She is currently the Managing Director and was previously the Tax Director at Belltower Fund Group, Ltd the Seattle based fund administrator for over 4,000 venture capital funds launched on the AngelList Venture platform. She has been employed with Belltower since January 2019. From September 2007 to January 2019, Ms. Unger held various positions at PwC, a network of accounting fir ms . While at PWC she worked in the broader asset management sector handling taxes for a variety of clients within the industry, with a focus on venture capital, private equity, and heav y e xperience related to foreign investing inbound and outbound compliance. Ms. Unger graduated from the University of Washington with a bachelor's degree in business, and a masters in tax. She brings to the Boa rd of Directors financial expertise and familiarity with the financial services industry. 38

39 Selected Year - end Financials As of and for the Year Ended December 31, (Dollars in thousands, except per share data) 2020 2019 2018 2017 2016 Statement of Income Data: Total interest income $ 63,038 $ 48,587 $ 38,743 $ 32,113 $ 28,460 Total interest expense 5,652 6,576 3,926 2,875 2,523 Provision for loan losses 8,308 2,544 1,826 870 1,919 Net interest income after provision for loan losses 49,078 39,467 32,991 28,368 24,018 Total noninterest income 8,182 8,258 5,467 4,154 4,977 Total noninterest expense 38,119 31,063 26,216 22,433 21,538 Provision for income taxes 3,995 3,461 2,541 4,653 2,454 Net income 15,146 13,201 9,701 5,436 5,003 Adjusted net income (1) N/A N/A N/A 6,731 N/A Balance Sheet Data: Cash and cash equivalents $ 163,117 $ 127,814 $ 125,782 $ 89,751 $ 86,975 Investment securities 23,247 32,710 37,922 38,336 34,994 Loans Receivable 1,547,138 939,103 767,899 656,788 596,128 Allowance for loan losses 19,262 11,470 9,407 8,017 7,544 Total assets 1,766,122 1,128,526 952,110 805,753 740,611 Interest - bearing deposits 829,046 596,716 510,089 460,937 424,707 Noninterest - bearing deposits 592,261 371,243 293,525 242,358 223,955 Total deposits 1,421,307 967,959 803,614 703,295 648,662 Total borrowings 192,292 23,562 33,546 33,529 28,513 Total shareholders’ equity 140,217 124,173 109,156 65,711 59,897 Share and Per Share Data: (2) Shares outstanding at end of period 11,954,327 11,913,885 11,893,203 9,248,901 9,238,788 Weighted average common shares outstanding – diluted 12,209,371 12,196,120 10,608,764 9,237,629 9,227,216 Book value per share $ 11.73 $ 10.42 $ 9.18 $ 7.11 $ 6.48 Tangible book value per share (3) 11.73 10.42 9.18 7.11 6.48 Earnings per share – basic 1.27 1.11 0.93 0.59 0.54 Earnings per share – diluted 1.24 1.08 0.91 0.59 0.54 Adjusted earnings per share – diluted (1) N/A N/A N/A 0.73 N/A Performance Ratios: Return on average assets 0.98 % 1.28 % 1.14 % 0.73 % 0.76 % Adjusted return on average assets (1) N/A N/A N/A 0.90 % N/A Return on average shareholders’ equity 11.44 % 11.29 % 11.40 % 8.27 % 8.56 % Adjusted return on average shareholders’ equity (1) N/A N/A N/A 10.24 % N/A Credit Quality Ratios: Nonperforming assets to total assets 0.04 % 0.09 % 0.19 % 0.26 % 1.11 % Nonperforming assets to loans receivable and OREO 0.05 % 0.11 % 0.24 % 0.32 % 1.38 % Nonperforming loans to loans receivable 0.05 % 0.11 % 0.24 % 0.32 % 0.27 % Allowance for loan losses to loans receivable 1.25 % 1.22 % 1.23 % 1.22 % 1.27 % Net charge - offs to average loans receivable 0.04 % 0.06 % 0.06 % 0.06 % 0.07 % (1) Refer to “Non - GAAP Reconciliation” in this Appendix for additional details . (2) Share and per share amounts are based on total common shares outstanding, which includes common stock . (3) Tangible book value per share is a non - GAAP measure. Since there is no goodwill or other intangible assets as of the dates indic ated, tangible book value per share is the same as book value per share as of each of the dates indicated.

40 Selected Quarterly Financials As of and for the Quarter Ended (Dollars in thousands, except per share data) 3Q 2021 2Q 2021 1Q 2021 4Q 2020 3Q 2020 2Q 2020 Statement of Income Data: Total interest income $ 19,608 $ 19,573 $ 18,328 $ 18,098 $ 16,394 $ 15,426 Total interest expense 801 959 1,043 1,165 1,298 1,433 Provision for loan losses 255 361 357 2,600 2,200 1,930 Net interest income after provision for loan losses 18,552 18,251 16,928 14,333 12,896 12,063 Total noninterest income 6,132 4,782 3,013 2,049 1,942 1,520 Total noninterest expense 16,130 13,731 12,352 10,489 9,666 8,945 Provision for income taxes 1,870 2,289 1,572 1,232 1,082 967 Net Income 6,684 7,013 6,018 4,661 4,090 3,671 Balance Sheet Data: Cash and cash equivalents $ 669,725 $ 282,889 $ 204,314 $ 163,117 $ 182,170 $ 174,176 Investment securities 34,924 27,443 22,894 23,247 23,782 24,318 Loans Receivable 1,705,682 1,658,149 1,766,723 1,547,138 1,509,389 1,447,144 Allowance for loan losses (20,222 ) (19,966 ) (19,610 ) (19,262 ) (17,046 ) (14,847 ) Total assets 2,451,568 2,007,138 2,029,359 1,766,122 1,749,619 1,678,956 Interest - bearing deposits 927,097 913,782 903,025 829,046 789,347 742,633 Noninterest - bearing deposits 1,296,443 887,896 768,690 592,261 570,664 563,794 Total deposits 2,223,540 1,801,678 1,671,715 1,421,307 1,360,011 1,306,427 Core deposits (1) 2,148,445 1,724,134 1,590,850 1,328,195 1,270,249 1,212,215 Total borrowings 52,854 38,584 197,099 192,292 241,167 228,725 Total shareholders’ equity 161,086 154,100 146,739 140,217 135,232 130,977 Share and Per Share Data: (2) Shares outstanding at end of period 12,012,107 12,007,669 11,988,636 11,954,327 11,930,243 11,926,263 Weighted average common shares outstanding – diluted 12,456,674 12,459,467 12,393,493 12,280,191 12,181,272 12,190,284 Book value per share $ 13.41 $ 12.83 $ 12.24 $ 11.73 $ 11.34 $ 10.98 Tangible book value per share (3) 13.41 12.83 12.24 11.73 11.34 10.98 Earnings per share – basic 0.56 0.59 0.50 0.39 0.34 0.31 Earnings per share – diluted 0.54 0.56 0.49 0.38 0.34 0.30 Performance Ratios: Return on average assets 1.21 % 1.36 % 1.28 % 1.04 % 0.95 % 0.96 % Return on average shareholders’ equity 16.77 % 18.60 % 16.84 % 13.36 % 12.14 % 11.37 % Credit Quality Ratios: Nonperforming assets to total assets 0.0 3 % 0.03 % 0.03 % 0.04 % 0.26 % 0.26 % Nonperforming assets to loans receivable and OREO 0.0 4 % 0.04 % 0.04 % 0.05 % 0.30 % 0.31 % Nonperforming loans to loans receivable 0.04 % 0.04 % 0.04 % 0.05 % 0.30 % 0.31 % Allowance for loan losses to loans receivable 1.19 % 1.20 % 1.11 % 1.25 % 1.13 % 1.03 % Net charge - offs to average loans receivable 0.00 % 0.00 % 0.00 % 0.10 % 0.00 % 0.00 % Other Key Ratios: Yield on Loans Receivable 4.57 % 4.44 % 4.51 % 4.64 % 4.33 % 4.57 % Cost of Deposits 0.10 % 0.14 % 0.16 % 0.22 % 0.27 % 0.35 % Net Interest Margin 3.48 % 3.70 % 3.76 % 3.89 % 3.62 % 3.78 % Efficiency Ratio 64.68 % 58.69 % 60.85 % 55.26 % 56.73 % 57.66 % Loans Receivable to Deposits 76.71 % 92.03 % 105.68 % 108.85 % 110.98 % 110.77 % Cost of Funds 0.16 % 0.20 % 0.24 % 0.29 % 0.33 % 0.41 % (1) Core deposits are defined as all deposits excluding time and brokered deposits. (2) Share and per share amounts are based on total common shares outstanding, which includes common stock and nonvoting common st ock . (3) Tangible book value per share is a non - GAAP measure. Since there is no goodwill or other intangible assets as of the dates indic ated, tangible book value per share is the same as book value per share as of each of the dates indicated.

41 Non - GAAP Reconciliation – PPP Loan Impact Some of the financial measures included in this presentation are not measures of financial performance recognized by GAAP . The following non - GAAP financial measures are presented to illustrate and identify the impact of PPP loans on Tier 1 Capital, we are providing investors with this information to better compare results with periods that did not have these significant impacts. These me asu res include the following : “Adjusted Tier 1 leverage capital ratio, excluding PPP loans” is a non - GAAP measure that excludes the impact of PPP loans on bal ance sheet. The most directly comparable GAAP measure is Tier 1 leverage capital ratio. Reconciliations of the GAAP and non - GAAP measures follow. (Dollars in thousands, unaudited) As of September 30, 2021 As of June 30, 2021 Adjusted Tier 1 leverage capital ratio, excluding PPP loans: Company: Tier 1 capital $ 164,437 $ 157,450 Average assets for the leverage capital ratio $ 2,198,406 $ 1,967,646 Less: Average PPP loans (322,595 ) (509,265 ) Plus: Average PPPLF borrowings — 107,047 Adjusted average assets for the leverage capital ratio $ 1,875,812 $ 1,565,428 Tier 1 leverage capital ratio 7.48 % 8.00 % Adjusted Tier 1 leverage capital ratio, excluding PPP loans 8.77 % 10.06 %

42 Non - GAAP Reconciliation – Pre - tax, Pre - Provision Some of the financial measures included in this presentation are not measures of financial performance recognized by GAAP . The following non - GAAP measures are presented to illustrate the impact of provision for loan losses and provision for income tax es on net income and return on average assets . “Pre - tax, pre - provision net income” is a non - GAAP measure that excludes the impact of provision for loan losses and provision fo r income taxes from net income. The most directly comparable GAAP measure is net income “Pre - tax, pre - provision return on average assets” is a non - GAAP measure that excludes the impact of provision for loan losses an d provision for income taxes from return on average assets. The most directly comparable GAAP measure is return on average assets . Reconciliations of the GAAP and non - GAAP measures are presented below. As of and for the Three Months Ended As of and for the Nine Months Ended (Dollars in thousands, unaudited) September 30, 2021 June 30, 2021 March 31, 2021 December 31, 2020 September 30, 2020 September 30, 2021 September 30, 2020 Pre - tax, pre - provision net income and pre - tax, pre - provision return on average assets: Total average assets $ 2,198,550 $ 2,074,841 $ 1,912,202 $ 1,774,723 $ 1,704,874 $ 2,062,913 $ 1,462,512 Total net income 6,684 7,013 6,018 4,661 4,090 19,715 10,485 Plus: provision for loan losses 255 361 357 2,600 2,200 973 5,708 Plus: provision for income taxes 1,870 2,289 1,572 1,232 1,082 5,731 2,763 Pre - tax, pre - provision net income $ 8,809 $ 9,663 $ 7,947 $ 8,493 $ 7,372 $ 26,419 $ 18,956 Return on average assets 1.21 % 1.36 % 1.28 % 1.04 % 0.95 % 1.28 % 0.96 % Pre - tax, pre - provision return on average assets: 1.59 % 1.87 % 1.69 % 1.90 % 1.72 % 1.71 % 1.73 %

43 Non - GAAP Reconciliation – 2017 Adjusted Measures Some of the financial measures included in this presentation are not measures of financial performance recognized by GAAP. Ou r m anagement uses the non - GAAP financial measures set forth below in its analysis of our performance for 2017 to exclude the impact of a deferred tax asset revaluatio n d ue to the enactment of the Tax Cuts and Jobs Act. “Adjusted net income” is a non - GAAP measure defined as net income increased by the additional income tax expense that resulted f rom the revaluation of deferred tax assets as a result of the reduction in the corporate income tax rate under the recently enacted Tax Cuts and Jobs Act. The most directly com parable GAAP measure is net income. “Adjusted earnings per share - diluted” is a non - GAAP measure defined as net income, plus additional income tax expense as noted a bove, divided by weighted average outstanding shares (diluted). The most directly comparable GAAP measure is earnings per share. “Adjusted return on average assets” is a non - GAAP measure defined as net income, plus additional income tax expense as noted abo ve, divided by average assets. The most directly comparable GAAP measure is return on average assets. “Adjusted return on average shareholders’ equity” is a non - GAAP measure defined as net income, plus additional income tax expens e as noted above, divided by average shareholders’ equity. The most directly comparable GAAP measure is return on average shareholders’ equity. (Dollars in thousands, except share and per share data) As of or for the Year Ended, December 31, 2017 Adjusted net income: Net income $ 5,436 Plus: additional income tax expense 1,295 Adjusted net income $ 6,731 Adjusted earnings per share – diluted Net income $ 5,436 Plus: additional income tax expense for deferred tax asset revaluation 1,295 Adjusted net income $ 6,731 Weighted average common shares outstanding – diluted (1) 9,237,629 Adjusted earnings per share – diluted (1) $ 0.73 Adjusted return on average assets Net income $ 5,436 Plus: additional income tax expense for deferred tax asset revaluation 1,295 Adjusted net income $ 6,731 Average assets $ 748,940 Adjusted return on average assets 0.90 % Adjusted return on average shareholders’ equity Net income $ 5,436 Plus: additional income tax expense for deferred tax asset revaluation 1,295 Adjusted net income $ 6,731 Average shareholders’ equity $ 65,720 Adjusted return on average shareholders’ equity 10.24 %
This regulatory filing also includes additional resources:
e21659_ccb-fwpcourtesy.pdf
Coastal Financial (NASDAQ:CCB)
Historical Stock Chart
From Aug 2024 to Sep 2024

Coastal Financial (NASDAQ:CCB)
Historical Stock Chart
From Sep 2023 to Sep 2024
