Looking Deeper: Can ATOM Sustain Its 13% Surge Beyond The Network Buzz?
December 26 2023 - 5:00AM
NEWSBTC
ATOM has ascended to the summit of network activity within the
inter-Blockchain ecosystem. However, upon closer inspection, the
narrative surrounding Cosmos unveils a more nuanced story. Despite
the accolade of being at the forefront of blockchain network
activity, a discerning analysis reveals a dip in actual user
engagement and transaction volumes. Surprisingly, against the
backdrop of these statistics, Cosmos has witnessed a remarkable 13%
surge in its token price over the past week, prompting a deeper
inquiry into the factors propelling its momentum. Related Reading:
NEAR: 3 Reasons This Crypto Is Up 80% While Others Hibernate In The
Run-Up To 2024 Digging Deeper: Beyond Buzzwords Although Cosmos
received accolades for its network activity, the narrative quickly
unravels when scrutinizing actual user statistics. Daily Active
Addresses and Transactions for ATOM, tracked by Artemis,
experienced a noticeable decline, painting a different picture than
the headline numbers suggest. Similarly, fees and revenue for the
Cosmos network dipped during this period, further dampening the
celebratory mood. Source: Artemis Despite the declining activity
metrics, ATOM’s price defied the trend, showcasing a 6% gain over
the last 24 hours, data from Coingecko shows. This disconnect
highlights the influence of factors beyond user engagement,
including the broader market bullishness and potentially,
speculation fueled by a spike in ATOM’s MVRV ratio, a profitability
indicator. The Power Of Partnerships And Policy: Catalysts For
Growth While the overall market sentiment played a role, key
developments within the Cosmos ecosystem also contributed to ATOM’s
ascent. The recent merger between Osmosis and UX Chain solidified
their foothold within the Cosmos landscape, bolstering cross-chain
DeFi capabilities. ATOM market cap currently at $4.58 billion.
Chart: TradingView.com Additionally, the Cosmos Hub’s governance
decision to reduce ATOM’s inflation rate from 14% to 10% addressed
concerns surrounding stability and security, potentially attracting
further investment. Despite the recent rally, ATOM’s technical
indicators paint a somewhat cautious picture. The daily chart
presents a bearish MACD signal, and the Chaikin Money Flow’s
sideways movement suggests a potential extension of the current
price consolidation. The Road Ahead: A Balancing Act Cosmos faces
the challenge of bridging the gap between headline-grabbing network
activity metrics and actual user engagement. The recent decline in
transactions and addresses raises questions about long-term
sustainability. Nevertheless, the ecosystem’s strategic
partnerships, focus on DeFi integration, and proactive governance
decisions provide promising counterpoints. ATOM price action in the
last week. Source: Coingecko As the new year approaches, ATOM’s
trajectory will likely hinge on its ability to address user-centric
metrics while leveraging its strategic alliances and proactive
governance. Whether it can translate its headline dominance into
sustained user engagement and price growth remains to be seen.
Related Reading: Shiba Inu Climbs 12% On Christmas Day – Brewing
Bull Run Or False Dawn? As Cosmos (ATOM) revels in its recent
ascent to the peak of network activity within the inter-blockchain
ecosystem, the question looms: can this momentum be sustained
beyond the current buzz? The enigma surrounding Cosmos deepens as
its 13% surge in value defies conventional metrics, prompting a
cautious examination of the factors at play. Featured image from
Shutterstock
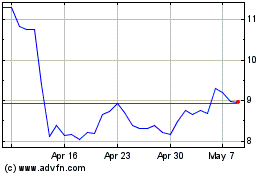
Cosmos Atom (COIN:ATOMUSD)
Historical Stock Chart
From Dec 2024 to Jan 2025

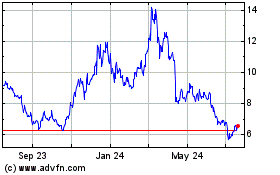
Cosmos Atom (COIN:ATOMUSD)
Historical Stock Chart
From Jan 2024 to Jan 2025
