Aave Might Retrace Further Due To This Formation On Its Chart
February 27 2023 - 1:30PM
NEWSBTC
The price of Aave has dropped significantly in the last month after
the altcoin fell below the $90 mark. The altcoin consolidated on
its chart with a 0.2% loss in the past 24 hours. The altcoin has
depreciated by close to 9% in the past week. Related Reading:
Crypto Market Crawls To A Standstill As Investors Remain Neutral
The technical outlook for the coin depicted bearish strength on the
chart. Demand for the coin dipped, and accumulation continued to
fall owing to the altcoin’s decline in value over the past few
weeks. This could mean that before Aave starts to recover, the coin
could take another plunge over the subsequent trading sessions.
Although the coin exceeded the $80 price, it was still in the
woods. Still, Aave needs to start its bullish recovery. Major
altcoins remain wobbly as Bitcoin hovers in the $23,000 price zone,
and a lot depends on how the king coin behaves over the subsequent
trading sessions. Aave Subsequent Analysis: One-Day Chart The
altcoin was trading at $81 at the time of writing. Aave is trading
in a wide range that has stretched between $76 and $92 over the
past few weeks. The middle point of the range is where Aave stands
at the moment. Aave is trading close to its support line of $77.
The next trading sessions remain crucial, as they could decide the
altcoin’s next course of movement. The resistance to the coin stood
at $86. If the altcoin breaches the resistance above, a bullish
recovery will be on the way. The amount of Aave traded in the last
session was red, indicating increased selling pressure. Technical
Analysis The buying pressure has remained low since the beginning
of February as Aave could not manage to turn the price around. The
Relative Strength Index was below the 50-mark, indicating an
increased number of sellers compared to buyers. The daily chart
also paints a bearish signal. The price of Aave fell below the
20-Simple Moving Average line (SMA), which implied that sellers
were driving the price momentum in the market. Additionally, Aave
formed a death cross, with the 200-SMA (green) crossing over the
50-SMA (yellow), which suggests bearishness. The price could fall
over the upcoming trading sessions before it starts to recover.
Following the death cross, Aave also displayed sell signals. The
Moving Average Convergence Divergence indicated the price momentum
and formed red signal bars that were increasing in size. These
histograms were tied to sell signals. Related Reading: BNB Price
Prints Bearish Technical Pattern, Why It Could Revisit $280 The
Bollinger Bands were wide and parallel, denoting the chance of
increased price volatility over the subsequent trading sessions.
Featured Image From UnSplash, Charts From TradingView.com.
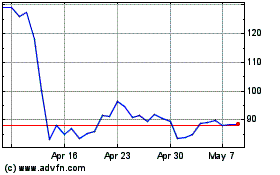
Aave Token (COIN:AAVEUSD)
Historical Stock Chart
From Oct 2024 to Nov 2024

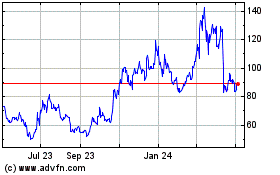
Aave Token (COIN:AAVEUSD)
Historical Stock Chart
From Nov 2023 to Nov 2024
