0001368622false00013686222024-03-042024-03-04


UNITED STATES

SECURITIES AND EXCHANGE COMMISSION

Washington, D.C. 20549


FORM 8-K


CURRENT REPORT

Pursuant to Section 13 or 15(d) of the Securities Exchange Act of 1934


Date of Report (Date of earliest event reported): March 4, 2024


AEROVIRONMENT, INC.

(Exact name of registrant as specified in its charter)


Delaware


001-33261


95-2705790

(State or other jurisdiction of


(Commission File Number)


(I.R.S. Employer Identification No.)

incorporation or organization)


241 18th Street South, Suite 415


Arlington, Virginia


22202

(Address of Principal Executive Offices)


(Zip Code)


Registrant’s telephone number, including area code: (805) 520-8350

 Securities registered pursuant to Section 12(b) of the Act:

Title of each class

Trading Symbol(s)

Name of each exchange on which registered

Common Stock, par value $0.0001 per share

AVAV

The NASDAQ Stock Market LLC

Check the appropriate box below if the Form 8-K filing is intended to simultaneously satisfy the filing obligation of the registrant under any of the following provisions (see General Instruction A.2. below):


   Written communications pursuant to Rule 425 under the Securities Act (17 CFR 230.425)


    Soliciting material pursuant to Rule 14a-12 under the Exchange Act (17 CFR 240.14a-12)


    Pre-commencement communications pursuant to Rule 14d-2(b) under the Exchange Act (17 CFR 240.14d-2(b))


    Pre-commencement communications pursuant to Rule 13e-4(c) under the Exchange Act (17 CFR 240.13e-4(c))


Indicate by check mark whether the registrant is an emerging growth company as defined in Rule 405 of the Securities Act of 1933 (§230.405 of this chapter) or Rule 12b-2 of the Securities Exchange Act of 1934 (§240.12b-2 of this chapter).

Emerging growth company   

If an emerging growth company, indicate by check mark if the registrant has elected not to use the extended transition period for complying with any new or revised financial accounting standards provided pursuant to Section 13(a) of the Exchange Act.   

Item 2.02.  Results of Operations and Financial Condition


On March 4, 2024, AeroVironment, Inc. (the “Company”) issued a press release announcing third quarter financial results for the period ended January 27, 2024, a copy of which is attached hereto as Exhibit 99.1.

Item 7.01. Regulation FD Disclosure

The information under Item 2.02 above is incorporated herein by reference.

Attached as Exhibit 99.2 hereto is a presentation containing additional information regarding the Company’s third quarter fiscal 2024 financial results for the period ended January 27, 2024. A copy of the presentation is also available on the investor relations section of the Company’s website at https://investor.avinc.com/events-and-presentations. The information contained on the Company’s website is not incorporated by reference into, and does not form a part of, this Current Report on Form 8-K.


In addition to historic information, this report, including the exhibits, contains forward-looking statements regarding events, performance and financial trends. Various factors could affect future results and could cause actual results to differ materially from those expressed in or implied by the forward-looking statements. Some of those factors are identified in the exhibits, and in our periodic reports filed with the Securities and Exchange Commission.

The information in this Current Report on Form 8-K, including the exhibits, is furnished pursuant to Items 2.02 and 7.01 and shall not be deemed “filed” for purposes of Section 18 of the Securities Exchange Act of 1934, as amended (the “Exchange Act”), or otherwise subject to the liabilities of that section, nor shall it be deemed incorporated by reference in any filing of AeroVironment, Inc. under the Securities Act of 1933, as amended, or the Exchange Act, whether made before or after the date hereof, except as shall be expressly set forth by specific reference in such filing.


Item 9.01.  Financial Statements and Exhibits


(d)  Exhibits.


Exhibit


Number


Description

99.1


Press release issued by AeroVironment, Inc., dated March 4, 2024.

99.2

Presentation regarding AeroVironment, Inc.’s third quarter fiscal 2024 financial results dated March 4, 2024.

104

Cover Page Interactive Data File (embedded within the Inline XBRL document).

2

SIGNATURE


Pursuant to the requirements of the Securities Exchange Act of 1934, the Registrant has duly caused this report to be signed on its behalf by the undersigned hereunto duly authorized.


AEROVIRONMENT, INC.


Date: March 4, 2024

By:

/s/ Wahid Nawabi


Wahid Nawabi


Chairman, President and Chief Executive Officer

3

Exhibit 99.1

Graphic

AeroVironment Announces Fiscal 2024 Third Quarter Results

ARLINGTON, VA, March 4, 2024 — AeroVironment, Inc. (“AeroVironment” or the “Company”) reported today financial results for the fiscal third quarter ended January 27, 2024.

Third Quarter Highlights:

Record third quarter revenue of $186.6 million, up 39% year-over-year
Third quarter net income of $13.9 million and adjusted EBITDA of $28.8 million, increases of $14.6 million and $5.1 million, year-over-year, respectively
Funded backlog of $462.8 million as of January 27, 2024

“Once again, AeroVironment has delivered outstanding results, including a record for third quarter revenue that’s nearly 40% above the same period last fiscal year,” said Wahid Nawabi, AeroVironment chairman, president and chief executive officer. “Solid bottom-line results, fueled by record demand and strong operating execution, have us on track for our best year ever. In addition, the Company continues to show tremendous growth in the Loitering Munition Systems segment, which delivered record revenue in the quarter.

With the increased global demand for our solutions, strong backlog and growing pipeline, AeroVironment remains well positioned for continued growth. As such, we are raising and narrowing our fiscal year revenue guidance for 2024 to between $700 million and $710 million, and we continue to anticipate double-digit revenue growth in fiscal year 2025.”

FISCAL 2024 THIRD QUARTER RESULTS

Revenue for the third quarter of fiscal 2024 was $186.6 million, an increase of 39% as compared to $134.4 million for the third quarter of fiscal 2023, reflecting higher product sales of $64.7 million, partially offset by lower service revenue of $12.5 million. From a segment standpoint, the year-over-year increase was due to revenue growth in Loitering Munitions Systems (“LMS”) of 140% and Unmanned Systems (“UMS”) of 23%, partially offset by a decrease in MacCready Works (“MW”) of 13%.

Gross margin for the third quarter of fiscal 2024 was $67.3 million, an increase of 48% as compared to $45.5 million for the third quarter of fiscal 2023, reflecting higher product margin of $20.1 million and higher service gross margin of $1.7 million. As a percentage of revenue, gross margin increased to 36% from 34%, primarily due to an increase in the proportion of product revenue to total revenue, partially offset by an unfavorable product mix. Gross margin was favorably impacted by a decrease in depreciation charges for in-service assets of $5.3 million related to the closure of COCO site locations during fiscal year 2023. Gross margin was negatively impacted by $4.0 million of intangible amortization expense and other related non-cash purchase accounting expenses in the third quarter of fiscal 2024 as compared to $3.3 million in the third quarter of fiscal 2023.

Income from operations for the third quarter of fiscal 2024 was $14.3 million as compared to $4.6 million for the third quarter of last fiscal year. The increase year-over-year was primarily due higher gross margin of $21.8 million, partially offset by increases in research and development (“R&D”) expense of $9.0 million and selling, general and administrative (“SG&A”) expense of $3.1 million.

Other income, net, for the third quarter of fiscal 2024 was $0.9 million, as compared to other loss, net of $5.4 million for the third quarter of last fiscal year. The increase in other income, net was primarily due to increases in net unrealized gains on investment holdings and interest income and a decrease in interest expense.

1


Provision for income taxes for the third quarter of fiscal 2024 was $1.3 million, as compared to a benefit of $(0.5) million for the third quarter of last fiscal year. The increase in provision for income taxes was primarily attributable to an increase in income before income taxes.

Net income attributable to AeroVironment for the third quarter of fiscal 2024 was $13.9 million, or $0.50 per diluted share, as compared to net loss attributable to AeroVironment of $(0.7) million, or $(0.03) per diluted share, in the prior-year period, respectively.

Non-GAAP adjusted EBITDA for the third quarter of fiscal 2024 was $28.8 million and non-GAAP earnings per diluted share were $0.63, as compared to $23.7 million and $0.33, respectively, for the third quarter of fiscal 2023.

BACKLOG

As of January 27, 2024, funded backlog (defined as remaining performance obligations under firm orders for which funding is currently appropriated to us under a customer contract) was $462.8 million, as compared to $424.1 million as of April 30, 2023.

FISCAL 2024 — OUTLOOK FOR THE FULL YEAR

For fiscal year 2024, the Company now expects revenue of between $700 million and $710 million, net income of between $51 million and $55 million, Non-GAAP adjusted EBITDA of between $122 million and $127 million, earnings per diluted share of between $1.86 and $2.00 and non-GAAP earnings per diluted share, which excludes amortization of intangible assets, other non-cash purchase accounting expenses and equity securities investments gains or losses, of between $2.69 and $2.83.

The foregoing estimates are forward-looking and reflect management’s view of current and future market conditions, subject to certain risks and uncertainties, including certain assumptions with respect to our ability to efficiently and on a timely basis integrate acquisitions, obtain and retain government contracts, changes in the timing and/or amount of government spending, react to changes in the demand for our products and services, activities of competitors, changes in the regulatory environment, and general economic and business conditions in the United States and elsewhere in the world. Investors are reminded that actual results may differ materially from these estimates.

CONFERENCE CALL AND PRESENTATION

In conjunction with this release, AeroVironment, Inc. will host a conference call today, Monday, March 4, 2024, at 4:30 pm Eastern Time that will be webcast live. Wahid Nawabi, chairman, president and chief executive officer, Kevin P. McDonnell, chief financial officer and Jonah Teeter-Balin, senior director corporate development and investor relations, will host the call.

Investors may access the call by registering via the following participant registration link up to ten minutes prior to the start time.

Participant registration URL: https://register.vevent.com/register/BI2e69517f68da41c0ade849312a1992e2

Investors may also listen to the live audio webcast via the Investor Relations page of the AeroVironment, Inc. website, http://investor.avinc.com. Please allow 15 minutes prior to the call to download and install any necessary audio software.

2


A supplementary investor presentation for the third quarter fiscal year 2024 can be accessed at https://investor.avinc.com/events-and-presentations.

Audio Replay

An audio replay of the event will be archived on the Investor Relations section of the Company's website at http://investor.avinc.com.

ABOUT AEROVIRONMENT, INC.

AeroVironment (NASDAQ: AVAV) provides technology solutions at the intersection of robotics, sensors, software analytics and connectivity that deliver more actionable intelligence so you can Proceed with Certainty. Headquartered in Virginia, AeroVironment is a global leader in intelligent, multi-domain robotic systems, and serves defense, government and commercial customers. For more information, visit www.avinc.com.

FORWARD-LOOKING STATEMENTS

This press release contains "forward-looking statements" as that term is defined in the Private Securities Litigation Reform Act of 1995. Forward-looking statements include, without limitation, any statement that may predict, forecast, indicate or imply future results, performance or achievements, and may contain words such as “believe,” “anticipate,” “expect,” “estimate,” “intend,” “project,” “plan,” or words or phrases with similar meaning. Forward-looking statements are based on current expectations, forecasts and assumptions that involve risks and uncertainties, including, but not limited to, economic, competitive, governmental and technological factors outside of our control, that may cause our business, strategy or actual results to differ materially from the forward-looking statements.

Factors that could cause actual results to differ materially from the forward-looking statements include, but are not limited to, the impact of our ability to successfully close and integrate acquisitions into our operations and avoid disruptions from acquisition transactions that will harm our business, including the acquisition of Tomahawk Robotics; the recording of goodwill and other intangible assets as part of acquisitions that are subject to potential impairments in the future and any realization of such impairments; any actual or threatened disruptions to our relationships with our distributors, suppliers, customers and employees, including shortages in components for our products; the ability to timely and sufficiently integrate international operations into our ongoing business and compliance programs; reliance on sales to the U.S. government, including uncertainties in classification, pricing or potentially burdensome imposed terms for certain types of government contracts; availability of U.S. government funding for defense procurement and R&D programs; changes in the timing and/or amount of government spending, including due to continuing resolutions; adverse impacts of a U.S. government shutdown; our reliance on limited relationships to fund our development of HAPS UAS; our ability to perform under existing contracts and obtain new contracts; risks related to our international business, including compliance with export control laws; the extensive and increasing regulatory requirements governing our contracts with the U.S. government and international customers; the consequences to our financial position, business and reputation that could result from failing to comply with such regulatory requirements; unexpected technical and marketing difficulties inherent in major research and product development efforts; the impact of potential security and cyber threats or the risk of unauthorized access to and resulting misuse of our, our customers’ and/or our suppliers’ information and systems; uncertainty in the customer adoption rate of commercial use unmanned aircraft systems; failure to remain a market innovator, to create new market opportunities or to expand into new markets; unexpected changes in significant operating expenses, including components and raw materials; failure to develop new products or integrate new technology into current products; any increase in litigation activity or unfavorable results in legal proceedings, including pending class actions; our ability to respond and adapt to legal, regulatory and government budgetary changes, including those resulting from the impact of pandemics and similar outbreaks; our ability to comply with the covenants in our loan documents; our ability to attract and retain skilled employees; the impact of inflation; and general economic and business conditions in the United States and elsewhere in the world; and the failure to establish and maintain effective internal control over financial reporting. For a further list and description of such risks and uncertainties, see the reports we file with the Securities and Exchange Commission. We do not intend, and undertake no obligation, to update any forward-looking statements, whether as a result of new information, future events or otherwise.

NON-GAAP MEASURES

In addition to the financial measures prepared in accordance with generally accepted accounting principles (GAAP), this earnings release also contains non-GAAP financial measures. See in the financial tables below the calculation of these

3


measures, the reasons why we believe these measures provide useful information to investors, and a reconciliation of these measures to the most directly comparable GAAP measures.

– Financial Tables Follow –

4


AeroVironment, Inc.

Consolidated Statements of Operations

(In thousands except share and per share data)

Three Months Ended

Nine Months Ended


January 27,

January 28,

January 27,

January 28,


2024

2023


2024


2023


(Unaudited)

(Unaudited)

Revenue:

Product sales

$

155,923

$

91,216

$

421,173

$

211,533

Contract services


30,655

43,179


98,568


142,962


186,578

134,395


519,741


354,495

Cost of sales:

Product sales


99,486

54,866


240,126


127,210

Contract services


19,805

34,019


71,318


122,171


119,291

88,885


311,444


249,381

Gross margin:


Product sales

56,437

36,350

181,047

84,323

Contract services

10,850

9,160

27,250

20,791

67,287

45,510

208,297

105,114

Selling, general and administrative


27,826

24,746


79,800


70,302

Research and development


25,127

16,157


62,618


47,793

Income (loss) from operations


14,334

4,607


65,879


(12,981)

Other income (loss):

Interest expense, net


(114)

(2,810)


(4,072)


(6,722)

Other income (expense), net


1,004

(2,587)


(2,983)


(2,183)

Income (loss) before income taxes


15,224

(790)


58,824


(21,886)

Provision for (benefit from) income taxes


1,259

(531)


3,710


(8,382)

Equity method investment loss, net of tax

(80)

(417)

(1,494)

(2,190)

Net income (loss)

13,885

(676)

53,620

(15,694)

Net income attributable to noncontrolling interest

(45)

Net income (loss) attributable to AeroVironment, Inc.

$

13,885

$

(676)

$

53,620

$

(15,739)

Net income (loss) per share attributable to AeroVironment, Inc.

Basic

$

0.50

$

(0.03)

$

1.99

$

(0.63)

Diluted

$

0.50

$

(0.03)

$

1.98

$

(0.63)

Weighted-average shares outstanding:

Basic


27,907,568

25,012,412


26,957,061


24,906,977

Diluted


28,044,127

25,012,412


27,061,409


24,906,977

5


AeroVironment, Inc.

Consolidated Balance Sheets

(In thousands except share data)

January 27,


April 30,

2024

2023


(Unaudited)


Assets

Current assets:

Cash and cash equivalents

$

107,694

$

132,859

Accounts receivable, net of allowance for doubtful accounts of $88 at January 27, 2024 and $156 at April 30, 2023


53,236


87,633

Unbilled receivables and retentions


148,588


105,653

Inventories, net


161,384


138,814

Income taxes receivable

8,081

Prepaid expenses and other current assets


21,708


12,043

Total current assets


500,691


477,002

Long-term investments

21,282

23,613

Property and equipment, net


45,053


39,795

Operating lease right-of-use assets

28,904

27,363

Deferred income taxes


21,378


27,206

Intangibles, net

77,597

43,577

Goodwill

275,189

180,801

Other assets


10,205


5,220

Total assets

$

980,299

$

824,577

Liabilities and stockholders’ equity

Current liabilities:

Accounts payable

$

26,969

$

31,355

Wages and related accruals


28,443


35,637

Customer advances


17,536


16,645

Current portion of long-term debt

7,500

7,500

Current operating lease liabilities

8,934

8,229

Income taxes payable

797

2,342

Other current liabilities


17,352


19,626

Total current liabilities


107,531


121,334

Long-term debt, net of current portion

31,292

125,904

Non-current operating lease liabilities

21,978

21,189

Other non-current liabilities

2,105

746

Liability for uncertain tax positions


2,705


2,705

Deferred income taxes

1,703

1,729

Commitments and contingencies

Stockholders’ equity:

Preferred stock, $0.0001 par value:

Authorized shares—10,000,000; none issued or outstanding at January 27, 2024 and April 30, 2023


Common stock, $0.0001 par value:

Authorized shares—100,000,000

Issued and outstanding shares—28,136,735 shares at January 27, 2024 and 26,216,897 shares at April 30, 2023


4


4

Additional paid-in capital


593,228


384,397

Accumulated other comprehensive loss


(4,888)


(4,452)

Retained earnings


224,641


171,021

Total stockholders' equity

812,985

550,970

Total liabilities and stockholders’ equity

$

980,299

$

824,577

6


AeroVironment, Inc.

Consolidated Statements of Cash Flows

(In thousands)

Nine Months Ended


January 27,


January 28,


2024

2023

(Unaudited)

Operating activities

Net income (loss)

$

53,620

$

(15,694)

Adjustments to reconcile net income (loss) to cash provided by operating activities:

Depreciation and amortization


24,969


48,109

Loss from equity method investments

1,494

2,190

Amortization of debt issuance costs

638

634

Provision for doubtful accounts


(67)


5

Reserve for inventory excess and obsolescence

11,668

3,787

Other non-cash expense, net

783

935

Non-cash lease expense

6,923

5,866

Loss on foreign currency transactions


54


38

Unrealized loss on available-for-sale equity securities, net

2,712

1,798

Deferred income taxes


(1,604)


(1,250)

Stock-based compensation


12,425


7,108

Loss on disposal of property and equipment

115

1,193

Amortization of debt securities discount

125

Changes in operating assets and liabilities, net of acquisitions:

Accounts receivable


36,387


6,847

Unbilled receivables and retentions


(41,950)


(5,098)

Inventories


(31,901)


(43,111)

Income taxes receivable

(8,081)

(9,388)

Prepaid expenses and other assets


(15,896)


(3,114)

Accounts payable


(10,003)


7,789

Other liabilities

(15,321)

(157)

Net cash provided by operating activities


26,965


8,612

Investing activities

Acquisition of property and equipment


(13,901)


(10,116)

Equity method investments

(1,875)

(2,774)

Equity security investments

(5,100)

Acquisition of intangibles

(1,500)

Business acquisitions, net of cash acquired

(24,156)

(5,105)

Proceeds from deconsolidation of previously controlled subsidiary, net of cash deconsolidated

(635)

Redemptions of available-for-sale investments


25,945

Purchases of available-for-sale investments

(1,326)

Net cash (used in) provided by investing activities


(41,432)


889

Financing activities

Principal payments of term loan

(95,000)

(22,500)

Holdback and retention payments for business acquisition

(500)

Payment of contingent consideration

(2,132)

Proceeds from shares issued, net of issuance costs

88,437

20,104

Payment of debt issuance costs

(37)

Tax withholding payment related to net settlement of equity awards

(1,370)

(853)

Exercise of stock options

868

Other

(19)

(21)

Net cash used in financing activities


(10,621)


(2,402)

Effects of currency translation on cash and cash equivalents

(77)

695

Net (decrease) increase in cash, cash equivalents, and restricted cash


(25,165)


7,794

Cash, cash equivalents and restricted cash at beginning of period


132,859


77,231

Cash, cash equivalents and restricted cash at end of period

$

107,694

$

85,025

Supplemental disclosures of cash flow information

Cash paid, net during the period for:

Income taxes

$

15,195

$

1,192

Interest

$

5,850

$

5,697

Non-cash activities

Issuance of common stock for business acquisition

$

109,820

$

Unrealized gain on available-for-sale investments, net of deferred tax expense of $0 for the nine months ended January 27, 2024 and January 28, 2023, respectively

$

$

(26)

Change in foreign currency translation adjustments

$

(436)

$

1,433

Issuances of inventory to property and equipment, ISR in-service assets

$

$

4,677

Acquisitions of property and equipment included in accounts payable

$

2,519

$

731

7


AeroVironment, Inc.

Reportable Segment Results (Unaudited)

(In thousands)

Three Months Ended January 27, 2024


UMS


LMS


MW

Total

Revenue:

Product sales

$

104,522

$

51,338

$

63

$

155,923

Contract services

8,768

6,320

15,567

30,655

$

113,290

$

57,658

$

15,630

$

186,578

Segment adjusted income (loss) from operations

$

20,417

$

7,562

$

(8,103)

Three Months Ended January 28, 2023


UMS


LMS


MW

Total

Revenue:

Product sales

$

74,966

$

16,203

$

47

$

91,216

Contract services

17,363

7,812

18,004

43,179

$

92,329

$

24,015

$

18,051

$

134,395

Segment adjusted income (loss) from operations

$

11,792

$

(129)

$

376

8


AeroVironment, Inc.

Reconciliation of non-GAAP Earnings per Diluted Share (Unaudited)

Three Months Ended

Three Months Ended

Nine Months Ended

Nine Months Ended


January 27, 2024

January 28, 2023

January 27, 2024

January 28, 2023

Earnings (loss) per diluted share

$

0.50

$

(0.03)

$

1.98

$

(0.63)

Acquisition-related expenses

0.01

0.05

0.04

Amortization of acquired intangible assets and other purchase accounting adjustments

0.16

0.22

0.38

0.69

Equity method and equity securities investments activity, net

(0.03)

0.13

0.16

0.16

Earnings per diluted share as adjusted (Non-GAAP)

$

0.63

$

0.33

$

2.57

$

0.26

Reconciliation of non-GAAP adjusted EBITDA (Unaudited)

Three Months Ended

Three Months Ended

Nine Months Ended

Nine Months Ended

(in millions)

January 27, 2024

January 28, 2023

January 27, 2024

January 28, 2023

Net income (loss)

$

13.9

$

(0.7)

$

53.6

$

(15.7)

Interest expense, net

0.1

2.8

4.1

6.7

Provision for (benefit from) income taxes

1.3

(0.5)

3.7

(8.4)

Depreciation and amortization

9.6

15.8

25.0

48.1

EBITDA (Non-GAAP)

24.9

17.4

86.4

30.7

Stock-based compensation

4.2

2.7

12.4

7.1

Equity method and equity securities investments activity, net

(0.7)

3.2

4.2

4.0

Amortization of cloud computing arrangement implementation

0.5

0.1

0.9

0.4

Acquisition-related expenses

(0.1)

0.3

1.7

1.2

Adjusted EBITDA (Non-GAAP)

$

28.8

$

23.7

$

105.6

$

43.4

9


Reconciliation of Forecast Earnings per Diluted Share (Unaudited)

Fiscal year ending


April 30, 2024

Forecast earnings per diluted share

$

1.86 - 2.00

Acquisition-related expenses

0.05

Amortization of acquired intangible assets and other purchase accounting adjustments

0.54

Equity method and equity securities investments activity, net

0.24

Forecast earnings per diluted share as adjusted (Non-GAAP)

$

2.69 - 2.83

Reconciliation of 2024 Forecast and Fiscal Year 2023 Actual Non-GAAP adjusted EBITDA (Unaudited)

Fiscal year ending

Fiscal year ended

(in millions)

April 30, 2024

April 30, 2023

Net income (loss)

$

51 - 55

$

(176)

Interest expense, net

5

9

Provision for (benefit from) income taxes

3 - 4

(15)

Depreciation and amortization

36

100

EBITDA (Non-GAAP)

95 - 100

(82)

Amortization of cloud computing arrangement implementation

1

1

Stock-based compensation

17

11

Equity method and equity securities investments activity, net

7

3

Acquisition-related expenses

2

1

Goodwill impairment

156

Adjusted EBITDA (Non-GAAP)

$

122 - 127

$

90

10


Statement Regarding Non-GAAP Measures

The non-GAAP measures set forth above should be considered in addition to, and not as a replacement for or superior to, the comparable GAAP measures, and may not be comparable to similarly titled measures reported by other companies. Management believes that these measures provide useful information to investors by offering additional ways of viewing our results that, when reconciled to the corresponding GAAP measures, help our investors to understand the long-term profitability trends of our business and compare our profitability to prior and future periods and to our peers. In addition, management uses these non-GAAP measures to evaluate our operating and financial performance.

Non-GAAP Adjusted Operating Income

Adjusted operating income is defined as operating income before intangible amortization, amortization of non-cash purchase accounting adjustments, goodwill impairment and acquisition related expenses.

Non-GAAP Earnings per Diluted Share

We exclude the acquisition-related expenses, amortization of acquisition-related intangible assets, equity securities investments gains or losses, goodwill impairment and one-time non-operating items because we believe this facilitates more consistent comparisons of operating results over time between our newly acquired and existing businesses, and with our peer companies. We believe, however, that it is important for investors to understand that such intangible assets contribute to revenue generation and that intangible asset amortization will recur in future periods until such intangible assets have been fully amortized.

Adjusted EBITDA (Non-GAAP)

Adjusted EBITDA is defined as net income before interest income, interest expense, income tax expense (benefit) and depreciation and amortization including amortization of purchase accounting adjustments, adjusted for the impact of certain other non-cash items, including amortization of implementation of cloud computing arrangements, stock-based compensation, acquisition related expenses, equity method investment gains or losses, equity securities investments gains or losses, goodwill impairment and one-time non-operating gains or losses. We present Adjusted EBITDA, which is not a recognized financial measure under U.S. GAAP, because we believe it is frequently used by analysts, investors and other interested parties to evaluate companies in our industry. We believe this facilitates more consistent comparisons of operating results over time between our newly acquired and existing businesses, and with our peer companies. We believe, however, that it is important for investors to understand that such intangible assets contribute to revenue generation, intangible asset amortization will recur in future periods until such intangible assets have been fully amortized and that interest and income tax expenses will recur in future periods. In addition, Adjusted EBITDA may not be comparable to similarly titled measures used by other companies in our industry or across different industries.

11


/////////////////////////////////////////////////////////////////////////////////////////////////////////////////////////////////////

For additional media and information, please follow us

GraphicGraphicGraphicGraphicGraphic

CONTACT

Jonah Teeter-Balin

+1 (805) 520-8350 x4278

https://investor.avinc.com/contact-and-faq/contact-us

12


Exhibit 99.2

GRAPHIC

Slide 1 | © 2024 AeroVironment, Inc. Third Quarter Fiscal Year 2024 Earnings Presentation March 4, 2024

GRAPHIC

Slide 2 052620 | © 2024 AeroVironment, Inc. Safe Harbor Statement This press release contains "forward-looking statements" as that term is defined in the Private Securities Litigation Reform Act of 1995. Forward-looking statements include, without limitation, any statement that may predict, forecast, indicate or imply future results, performance or achievements, and may contain words such as “believe,” “anticipate,” “expect,” “estimate,” “intend,” “project,” “plan,” or words or phrases with similar meaning. Forward-looking statements are based on current expectations, forecasts and assumptions that involve risks and uncertainties, including, but not limited to, economic, competitive, governmental and technological factors outside of our control, that may cause our business, strategy or actual results to differ materially from the forward-looking statements. Factors that could cause actual results to differ materially from the forward-looking statements include, but are not limited to, the impact of our ability to successfully close and integrate acquisitions into our operations and avoid disruptions from acquisition transactions that will harm our business, including the acquisition of Tomahawk Robotics; the recording of goodwill and other intangible assets as part of acquisitions that are subject to potential impairments in the future and any realization of such impairments; any actual or threatened disruptions to our relationships with our distributors, suppliers, customers and employees, including shortages in components for our products; the ability to timely and sufficiently integrate international operations into our ongoing business and compliance programs; reliance on sales to the U.S. government, including uncertainties in classification, pricing or potentially burdensome imposed terms for certain types of government contracts; availability of U.S. government funding for defense procurement and R&D programs; changes in the timing and/or amount of government spending, including due to continuing resolutions; adverse impacts of a U.S. government shutdown; our reliance on limited relationships to fund our development of HAPS UAS; our ability to perform under existing contracts and obtain new contracts; risks related to our international business, including compliance with export control laws; the extensive and increasing regulatory requirements governing our contracts with the U.S. government and international customers; the consequences to our financial position, business and reputation that could result from failing to comply with such regulatory requirements; unexpected technical and marketing difficulties inherent in major research and product development efforts; the impact of potential security and cyber threats or the risk of unauthorized access to and resulting misuse of our, our customers’ and/or our suppliers’ information and systems; uncertainty in the customer adoption rate of commercial use unmanned aircraft systems; failure to remain a market innovator, to create new market opportunities or to expand into new markets; unexpected changes in significant operating expenses, including components and raw materials; failure to develop new products or integrate new technology into current products; any increase in litigation activity or unfavorable results in legal proceedings, including pending class actions; our ability to respond and adapt to legal, regulatory and government budgetary changes, including those resulting from the impact of pandemics and similar outbreaks; our ability to comply with the covenants in our loan documents; our ability to attract and retain skilled employees; the impact of inflation; and general economic and business conditions in the United States and elsewhere in the world; and the failure to establish and maintain effective internal control over financial reporting. For a further list and description of such risks and uncertainties, see the reports we file with the Securities and Exchange Commission. We do not intend, and undertake no obligation, to update any forward-looking statements, whether as a result of new information, future events or otherwise.

GRAPHIC

Slide 3 052620 | © 2024 AeroVironment, Inc. Third Quarter Fiscal Year 2024 Key Messages Achieved record third-quarter revenue of $187 million, a nearly 40% increase YoY with strong bottom-line results Loitering munitions segment delivered record quarterly revenue and continues to ramp production to meet surging demand Given strong performance, raising and tightening guidance Continue to expect double-digit revenue growth in fiscal year 2025

GRAPHIC

Slide 4 052620 | © 2024 AeroVironment, Inc. Third Quarter Results Fiscal Year 2024 1 Q3 GAAP EPS was $0.50 per diluted share. Refer to Reconciliation of Non-GAAP Earnings Per Diluted Share on Appendix A 2.Q3 GAAP Net income was $13.9M. Refer to Adjusted EBITDA reconciliation on Appendix D. * Figures include impact from Tomahawk acquisition Slide 4 | © 2024 AeroVironment, Inc. Metric Q3 FY24 Year-Over-Year Change Notes Revenue $186.6 m +39% Overall increase driven by higher sales in UMS segment and record sales in LMS segment. GAAP Gross Margin $67.3 m +48% Increase driven by higher sales volume, greater mix of product sales, and higher service margins. Adjusted EBITDA2 $28.8 m +21% Increase due to higher gross profit partially offset by higher R&D and SG&A expenditures. Non-GAAP EPS (diluted)1 $0.63 +91% Increase due to higher gross profit partially offset by higher R&D and SG&A expenditures. Funded Backlog $462.8 m +12% Strong backlog driven by increasing global demand and LMS orders.

GRAPHIC

Slide 5 052620 | © 2024 AeroVironment, Inc. backlog of Slide 5 QUARTERLY REVENUE BY SEGMENT QUARTERLY REVENUE BY TYPE Revenue Mix by Segment and Type 68% 76% 78% 81% 84% 32% 24% 22% 19% 16% 34% 37% 43% 42% 36% 0% 10% 20% 30% 40% 50% 60% 0% 10% 20% 30% 40% 50% 60% 70% 80% 90% 100% Q3 FY23 Q4 FY23 Q1 FY24 Q2 FY24 Q3 FY24 Gross Margin Percentage Quarterly Revenue Product Revenue Service Revenue GAAP Gross Margin Q3 FY23 Q4 FY23 Q1 FY24 Q2 FY24 Q3 FY24 MW $18.1 $21.4 $23.2 $17.8 $15.6 LMS $24.0 $42.5 $30.9 $30.2 $57.7 UMS $92.3 $122.2 $98.2 $132.8 $113.3 $- $20.0 $40.0 $60.0 $80.0 $100.0 $120.0 $140.0 $160.0 $180.0 $200.0 Revenue in millions MW LMS UMS $186.6 $134.4 $152.3 $186.0 $180.8 Prior quarter segments reclassified to conform to the current year segments | UMS: Unmanned Systems (includes Tomahawk) | LMS: Loitering Munitions Systems | MW: MacCready Works

GRAPHIC

Slide 6 052620 | © 2024 AeroVironment, Inc. Adjusted Profitability by Type and Non-GAAP EPS 41% 47% 49% 47% 38% 26% 13% 28% 28% 40% 36% 39% 45% 43% 38% 0% 10% 20% 30% 40% 50% 60% Q3 FY23 Q4 FY23 Q1 FY24 Q2 FY24 Q3 FY24 Adj Product Margin Adj Service Margin Total Adj Gross Margin 1 Q3 GAAP Product Margin of 36% and Service Margin of 35%. Refer to GAAP to NON-GAAP reconciliation on Appendix C. | 2 Refer to Reconciliation of Non-GAAP Diluted Earnings Per Share on Appendix A. $0.33 $0.63 $- $0.10 $0.20 $0.30 $0.40 $0.50 $0.60 $0.70 Q3 FY23 Q3 FY24 Slide 6 | © 2024 AeroVironment, Inc. NON-GAAP DILUTED EPS2 PERCENTAGE ADJUSTED GROSS MARGIN1

GRAPHIC

Slide 7 052620 | © 2024 AeroVironment, Inc. Updated Guidance: Fiscal 2024 Outlook AS OF 03/04/2024 FY23 RESULTS FY24 REVISED GUIDANCE EXPECTED % CHANGE (TO MIDPOINT) Revenue $541 million $700 million - $710 million 30% Net (Loss)/Income5 ($176 million) $51 million – $55 million --- Adjusted EBITDA 2 $90 million $122 million–$127 million4 38% Earnings/(Loss) 5 Per Share (diluted) ($7.04) $1.86 – $2.00 --- Non-GAAP Earnings Per Share (diluted) $1.26 3 $2.69 – $2.83 1 119% 1 Refer to Reconciliation of Fiscal Year 2024 Non-GAAP Diluted Earnings Per Share Expectations on Appendix B. 2 Refer to Adjusted EBITDA reconciliation on Appendix D. 3 Refer to Reconciliation of Fiscal Year 2023 Non-GAAP Diluted Earnings Per Share on Appendix F. 4 Refer to Reconciliation of Non-GAAP Fiscal Year 2024 Adjusted EBITDA Expectations on Appendix E. R&D investment increasing to between 13%-14% for FY24. 5 FY23 net loss and GAAP EPS impacted by the following non-cash charges related to the MUAS segment: $156m goodwill impairment charge, $34m accelerated intangible amortization, and $12m accelerated depreciation. Increasing and narrowing FY24 Guidance ranges due to record Q3 revenue performance and strong visibility. Expect R&D Expenses between 13%-14% of Revenues in FY24.

GRAPHIC

Slide 8 052620 | © 2024 AeroVironment, Inc. Visibility for FY24 $152.3 $333.2 $519.7 $384.0 $433.2 $327.8 $180.8 $103.6 $0.7 $8.0 $17.9 $38.8 $14.7 $3.3 $- $100 $200 $300 $400 $500 $600 $700 $800 $900 Q4 FY23 (6/27/23) Q1 FY24 (9/5/23) Q2 FY24 (12/5/23) Q3 FY24 (3/4/24) Revenue Anticipated This FY from Unfunded Backlog Revenue Anticipated This FY from Qtr-To-Date Bookings Revenue Anticipated This FY from Funded Backlog Revenue Year-To-Date 1 Based on prior midpoint of guidance range of $630-$660 million |2 Based on midpoint of revised guidance range of $645-$675 million | 3 Based on midpoint of revised guidance range of $685-$705 million | 4 Based on midpoint of revised guidance range of $700-$710 million Revenue Guidance Range: $645m to $675m Guidance revised three times in FY2024. Record Q3 revenue and strong visibility supports revised revenue guidance range. REVENUE (MILLIONS) Revenue Guidance Range: $630m to $660m 100%+ visibility2 78% visibility1 98% visibility3 Revenue Guidance Range: $685m to $705m 100% visibility4 Revenue Guidance Range: $700m to $710m $1.2

GRAPHIC

Slide 9 © 2024 AeroVironment, Inc. Financial Tables

GRAPHIC

Slide 10 | © 2024 AeroVironment, Inc. APPENDIX A – RECONCILIATION OF NON-GAAP EARNINGS PER DILUTED SHARE (UNAUDITED)

GRAPHIC

Slide 11 052620 | © 2024 AeroVironment, Inc. Fiscal year ending April 30, 2024 Forecast earnings per diluted share $ 1.86 - 2.00 Acquisition-related expenses 0.05 Amortization of acquired intangible assets and other purchase accounting adjustments 0.54 Equity method and equity securities investments activity, net 0.24 Forecast earnings per diluted share as adjusted (Non-GAAP) $ 2.69 - 2.83 APPENDIX B – RECONCILIATION OF FISCAL YEAR 2024 NON-GAAP DILUTED EARNINGS PER SHARE EXPECTATIONS (UNAUDITED)

GRAPHIC

Slide 12 052620 | © 2024 AeroVironment, Inc. (in thousands) Fiscal 3rd Quarter FY2023 Fiscal 4th Quarter FY2023 Fiscal 1st Quarter FY2024 Fiscal 2nd Quarter FY2024 Fiscal 3rd Quarter FY2024 Products Gross Margin $ 36,350 $ 65,320 $ 57,863 $ 66,747 $ 56,437 Intangible Amortization $ 1,026 $ 1,034 $ 1,041 $ 1,856 $ 2,681 Adjusted Gross Margin $ 37,376 $ 66,354 $ 58,904 $ 68,603 $ 59,118 Adj. Prod GM% 41.0% 46.9% 49.3% 47.1% 37.9% Services Gross Margin $ 9,160 $ 3,080 $ 7,797 $ 8,603 $ 10,850 Intangible Amortization $ 2,282 $ 2,584 $ 1,356 $ 1,356 $ 1,356 Adjusted Gross Margin $ 11,442 $ 5,664 $ 9,153 $ 9,959 $ 12,206 Adj. Service GM% 26.5% 12.7% 27.8% 28.4% 39.8% APPENDIX C – GAAP TO NON-GAAP RECONCILIATION OF ADJUSTED GROSS MARGIN

GRAPHIC

Slide 13 052620 | © 2024 AeroVironment, Inc. 
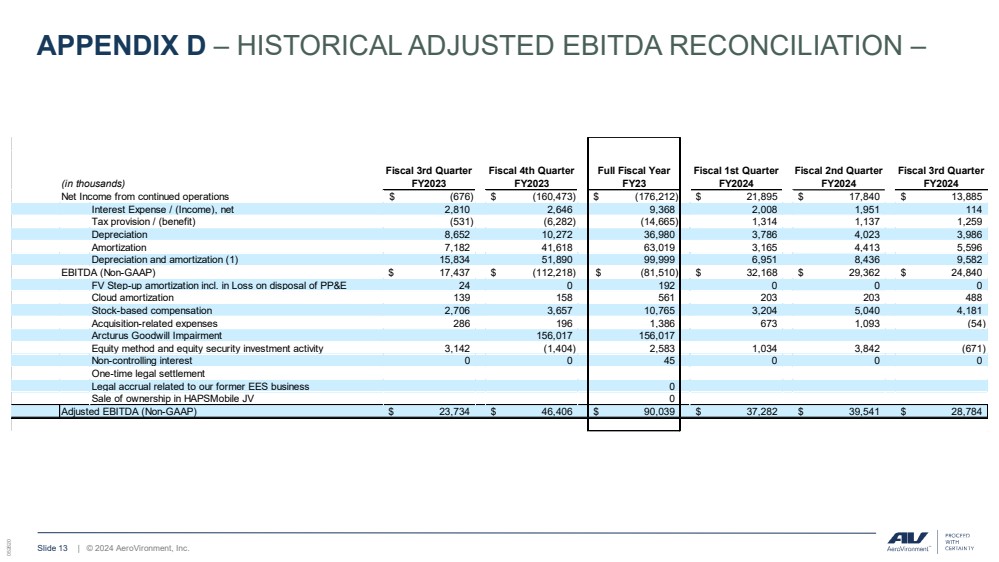
APPENDIX D – HISTORICAL ADJUSTED EBITDA RECONCILIATION – (in thousands) Fiscal 3rd Quarter FY2023 Fiscal 4th Quarter FY2023 Full Fiscal Year FY23 Fiscal 1st Quarter FY2024 Fiscal 2nd Quarter FY2024 Fiscal 3rd Quarter FY2024 Net Income from continued operations $ (676) $ (160,473) $ (176,212) $ 21,895 $ 17,840 $ 13,885 Interest Expense / (Income), net 2,810 2,646 9,368 2,008 1,951 114 Tax provision / (benefit) (531) (6,282) (14,665) 1,314 1,137 1,259 Depreciation 8,652 10,272 36,980 3,786 4,023 3,986 Amortization 7,182 41,618 63,019 3,165 4,413 5,596 Depreciation and amortization (1) 15,834 51,890 99,999 6,951 8,436 9,582 EBITDA (Non-GAAP) $ 17,437 $ (112,218) $ (81,510) $ 32,168 $ 29,362 $ 24,840 FV Step-up amortization incl. in Loss on disposal of PP&E 24 0 192 0 0 0 Cloud amortization 139 158 561 203 203 488 Stock-based compensation 2,706 3,657 10,765 3,204 5,040 4,181 Acquisition-related expenses 286 196 1,386 673 1,093 (54) Arcturus Goodwill Impairment 156,017 156,017 Equity method and equity security investment activity 3,142 (1,404) 2,583 1,034 3,842 (671) Non-controlling interest 0 0 45 0 0 0 One-time legal settlement Legal accrual related to our former EES business 0 Sale of ownership in HAPSMobile JV 0 Adjusted EBITDA (Non-GAAP) $ 23,734 $ 46,406 $ 90,039 $ 37,282 $ 39,541 $ 28,784

GRAPHIC

Slide 14 052620 | © 2024 AeroVironment, Inc. APPENDIX E – RECONCILIATION OF NON-GAAP FISCAL YEAR 2024 ADJUSTED EBITDA EXPECTATIONS Fiscal year ending Fiscal year ended (in millions) April 30, 2024 April 30, 2023 Net income (loss) $ 51 - 55 $ (176) Interest expense, net 5 9 Provision for (benefit from) income taxes 3 - 4 (15) Depreciation and amortization 36 100 EBITDA (Non-GAAP) 95 - 100 (82) Amortization of cloud computing arrangement implementation 1 1 Stock-based compensation 17 11 Equity method and equity securities investments activity, net 7 3 Acquisition-related expenses 2 1 Goodwill impairment — 156 Adjusted EBITDA (Non-GAAP) $ 122 - 127 $ 90

GRAPHIC

Slide 15 052620 | © 2024 AeroVironment, Inc. APPENDIX F – RECONCILIATION OF FISCAL YEAR 2023 NON-GAAP EARNINGS PER DILUTED SHARE (UNAUDITED)

v3.24.0.1
Document and Entity Information
Mar. 04, 2024
Document and Entity Information [Abstract]  
Document Type 8-K
Document Period End Date Mar. 04, 2024
Entity File Number 001-33261
Entity Registrant Name AEROVIRONMENT, INC.
Entity Incorporation, State or Country Code DE
Entity Tax Identification Number 95-2705790
Entity Address, Address Line One 241 18th Street South, Suite 415
Entity Address, City or Town Arlington
Entity Address, State or Province VA
Entity Address, Postal Zip Code 22202
City Area Code 805
Local Phone Number 520-8350
Written Communications false
Soliciting Material false
Pre-commencement Tender Offer false
Pre-commencement Issuer Tender Offer false
Title of 12(b) Security Common Stock, par value $0.0001 per share
Trading Symbol AVAV
Security Exchange Name NASDAQ
Entity Emerging Growth Company false
Entity Central Index Key 0001368622
Amendment Flag false

AeroVironment (NASDAQ:AVAV)
Historical Stock Chart
From Mar 2024 to Apr 2024 Click Here for more AeroVironment Charts.
AeroVironment (NASDAQ:AVAV)
Historical Stock Chart
From Apr 2023 to Apr 2024 Click Here for more AeroVironment Charts.