UNITED STATES
SECURITIES AND EXCHANGE COMMISSION
WASHINGTON, D.C. 20549
FORM 6-K
REPORT OF FOREIGN PRIVATE ISSUER
PURSUANT TO RULE 13a-16 OR 15d-16 UNDER
THE SECURITIES EXCHANGE ACT OF 1934
For the month of February, 2024
Commission File No.: 001-37911
Anheuser-Busch InBev SA/NV
(Translation of registrant’s name into English)
Brouwerijplein 1
3000
Leuven, Belgium
(Address of principal executive offices )
Indicate by check mark whether the registrant files or will file annual reports under cover of
Form 20-F or Form 40-F:
SIGNATURE
Pursuant to the requirements of the Securities Exchange Act of 1934, the registrant has duly caused this report to be signed on its behalf by
the undersigned, thereunto duly authorized.
|
|
|
|
|
|
|
ANHEUSER-BUSCH INBEV SA/NV
(Registrant)
|
|
|
|
| Dated: February 29, 2024 |
|
By: |
|
/s/ Jan Vandermeersch
|
|
|
|
|
Name: Jan Vandermeersch
|
|
|
|
|
Title: Global Legal Director Corporate |

Exhibit 99.1 ANNUAL REPORT 2023

LETTER TO OUR WHO WE ARE OUR DIVERSIFIED OUR IMPACT SHAREHOLDERS KEY
FIGURES 2023 OUR GLOBAL PURPOSE AND WHAT WE BREW OUR ROUTE TO MARKET FOOTPRINT 2023 IN REVIEW OUR STRATEGY IN OUR COMMUNITIES TABLE OF CONTENTS 02 07 12 50 LETTER TO OUR SHAREHOLDERS WHO WE ARE 2023 IN REVIEW FINANCIAL REPORT 7 AND WHAT WE BREW 04
21 158 10 KEY FIGURES 2023 OUR STRATEGY SUSTAINABILITY STATEMENTS OUR ROUTE TO MARKET LEAD AND GROW THE CATEGORY 25 DIGITIZE AND MONETIZE OUR ECOSYSTEM 31 OPTIMIZE OUR BUSINESS 34 06 188 11 OUR GLOBAL PURPOSE CORPORATE GOVERNANCE OUR DIVERSIFIED
FOOTPRINT 37 STATEMENT OUR IMPACT IN OUR COMMUNITIES THIS IS AN INTERACTIVE REPORT: WHEN YOU SEE THIS ICON, CLICK TO LEARN MORE AB InBev - Annual report 2023 - 1
LETTER TO OUR WHO WE ARE OUR DIVERSIFIED OUR IMPACT SHAREHOLDERS KEY
FIGURES 2023 OUR GLOBAL PURPOSE AND WHAT WE BREW OUR ROUTE TO MARKET FOOTPRINT 2023 IN REVIEW OUR STRATEGY IN OUR COMMUNITIES LETTER TO OUR SHAREHOLDERS marketing investments. Underlying EPS was 3.05 USD, Creating a future with more an increase of
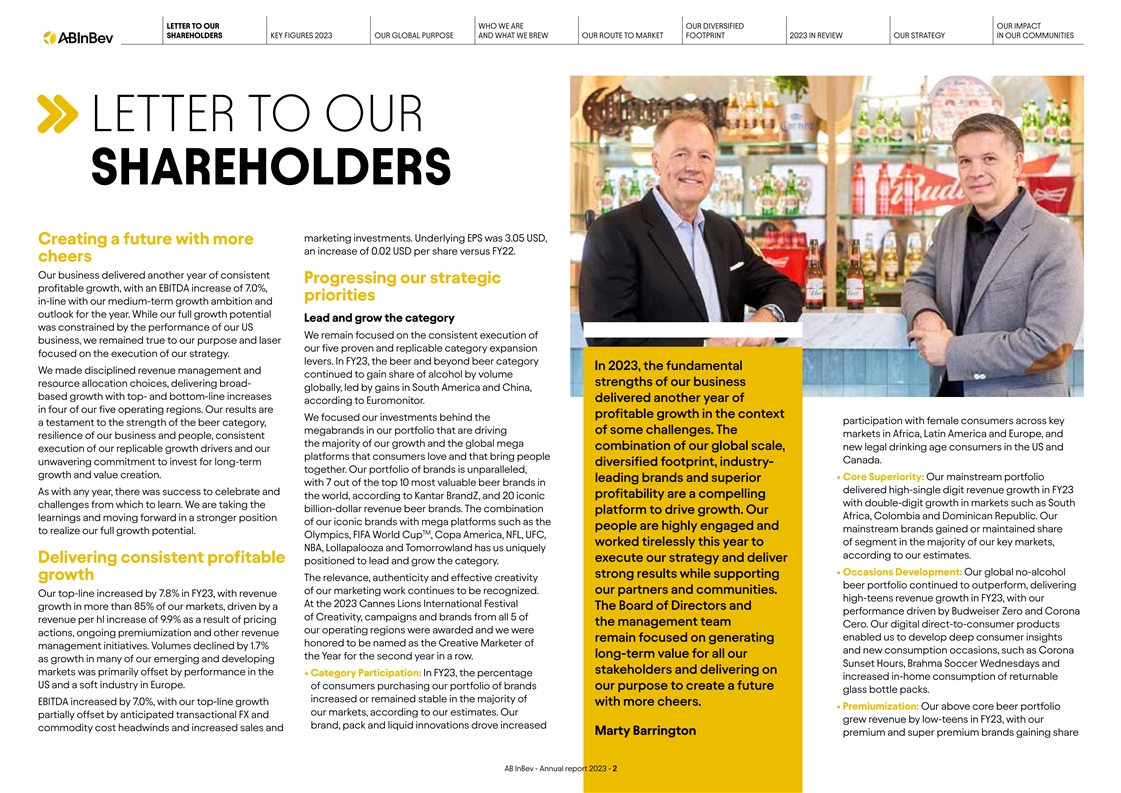
0.02 USD per share versus FY22. cheers Our business delivered another year of consistent Progressing our strategic profitable growth, with an EBITDA increase of 7.0%, priorities in-line with our medium-term growth ambition and outlook for the year.
While our full growth potential Lead and grow the category was constrained by the performance of our US We remain focused on the consistent execution of business, we remained true to our purpose and laser our five proven and replicable category
expansion focused on the execution of our strategy. levers. In FY23, the beer and beyond beer category In 2023, the fundamental We made disciplined revenue management and continued to gain share of alcohol by volume resource allocation choices,
delivering broad- strengths of our business globally, led by gains in South America and China, based growth with top- and bottom-line increases delivered another year of according to Euromonitor. in four of our five operating regions. Our results
are profitable growth in the context We focused our investments behind the participation with female consumers across key a testament to the strength of the beer category, megabrands in our portfolio that are driving of some challenges. The markets
in Africa, Latin America and Europe, and resilience of our business and people, consistent the majority of our growth and the global mega combination of our global scale, new legal drinking age consumers in the US and execution of our replicable
growth drivers and our platforms that consumers love and that bring people Canada. unwavering commitment to invest for long-term diversified footprint, industry- together. Our portfolio of brands is unparalleled, growth and value creation. •
Cor e Superiority: Our mainstream portfolio leading brands and superior with 7 out of the top 10 most valuable beer brands in delivered high-single digit revenue growth in FY23 As with any year, there was success to celebrate and profitability are a
compelling the world, according to Kantar BrandZ, and 20 iconic with double-digit growth in markets such as South challenges from which to learn. We are taking the billion-dollar revenue beer brands. The combination platform to drive growth. Our
Africa, Colombia and Dominican Republic. Our learnings and moving forward in a stronger position of our iconic brands with mega platforms such as the people are highly engaged and mainstream brands gained or maintained share to realize our full
growth potential. TM Olympics, FIFA World Cup , Copa America, NFL, UFC, of segment in the majority of our key markets, worked tirelessly this year to NBA, Lollapalooza and Tomorrowland has us uniquely according to our estimates. Delivering
consistent profitable execute our strategy and deliver positioned to lead and grow the category. • Oc casions Development: Our global no-alcohol strong results while supporting growth The relevance, authenticity and effective creativity beer
portfolio continued to outperform, delivering of our marketing work continues to be recognized. our partners and communities. Our top-line increased by 7.8% in FY23, with revenue high-teens revenue growth in FY23, with our At the 2023 Cannes Lions
International Festival growth in more than 85% of our markets, driven by a The Board of Directors and performance driven by Budweiser Zero and Corona of Creativity, campaigns and brands from all 5 of revenue per hl increase of 9.9% as a result of
pricing the management team Cero. Our digital direct-to-consumer products our operating regions were awarded and we were actions, ongoing premiumization and other revenue enabled us to develop deep consumer insights remain focused on generating
honored to be named as the Creative Marketer of management initiatives. Volumes declined by 1.7% and new consumption occasions, such as Corona long-term value for all our the Year for the second year in a row. as growth in many of our emerging and
developing Sunset Hours, Brahma Soccer Wednesdays and stakeholders and delivering on markets was primarily offset by performance in the • C ategory Participation: In FY23, the percentage increased in-home consumption of returnable US and a
soft industry in Europe. of consumers purchasing our portfolio of brands our purpose to create a future glass bottle packs. increased or remained stable in the majority of EBITDA increased by 7.0%, with our top-line growth with more cheers. •
Pr emiumization: Our above core beer portfolio our markets, according to our estimates. Our partially offset by anticipated transactional FX and grew revenue by low-teens in FY23, with our brand, pack and liquid innovations drove increased commodity
cost headwinds and increased sales and Marty Barrington premium and super premium brands gaining share AB InBev - Annual report 2023 - 2

LETTER TO OUR WHO WE ARE OUR DIVERSIFIED OUR IMPACT SHAREHOLDERS KEY
FIGURES 2023 OUR GLOBAL PURPOSE AND WHAT WE BREW OUR ROUTE TO MARKET FOOTPRINT 2023 IN REVIEW OUR STRATEGY IN OUR COMMUNITIES of segment in a number of key markets, including more than 550 million USD in FY23, growth of 15% of our sites in high
stress areas, with 56% of sites in South Africa, Mexico and Brazil, according to our versus FY22. scope for our 2025 goal already seeing measurable estimates. Our global megabrands grew revenue by improvement in watershed health. For Circular
• Unl ocking value from our ecosystem: We continue 18.2% outside of their home markets led by Corona Packaging, 77.5% of our products were in to explore opportunities to generate scalable which grew by 22.1%. Budweiser delivered a revenue
packaging that was returnable or made incremental revenue streams for our business increase of 17.1%, with broad-based growth in more from majority recycled content. We are through EverGrain, our upcycled barley ingredients than 25 markets, Stella
Artois grew by 18.8% and also progressing on our ambition to company, and Biobrew, our precision fermentation Michelob Ultra by 7.5%. achieve net zero by 2040, with 36 venture. lighthouse projects implemented • Beyond Beer: In FY23, our Beyond
Beer business Optimize our business worldwide in 2023. contributed approximately 1.5 billion USD of revenue • Maximizing value creation: Our objective to and grew by mid-single digits, as growth globally In recognition of our leadership
maximize long-term value creation is driven by was partially offset by the performance of malt- in corporate transparency and our focus on three areas: optimized resource based seltzer in the US. Growth was primarily driven performance on climate
change allocation, robust risk management and an by Brutal Fruit and Flying Fish in Africa, our spirits and water security, we were efficient capital structure. Our culture of everyday based ready-to-drink portfolio in the US and Beats in awarded a
double A score by CDP. financial discipline enables us to optimize Brazil, all of which grew revenue by double-digits. We are committed to Smart resource allocation and invest for growth. In FY23, Drinking and improving moderation Digitize and
monetize our ecosystem we invested 11.6 billion USD in capex and sales habits all over the world. Since 2016, The digital transformation of our route to consumer and marketing while delivering free cash flow of we have invested 900 million USD is a
fundamental evolution in how we do business approximately 8.8 billion USD, a 0.3 billion USD in social norms marketing and are on and serve our customers. Our digital platforms increase versus FY22. track to deliver our 1 billion USD goal by are
enabling us to increase the distribution of our We continued to deleverage, reducing gross 2025. We have also undertaken the largest brands, reduce our cost to serve and improve our debt by 1.8 billion USD to reach 78.1 billion USD, voluntary
guidance labeling initiative, with relationship with customers and consumers. It is resulting in a net debt to EBITDA ratio of 3.38x as of 100% of our labels now featuring Smart Drinking a key competitive advantage, and we continue 31 December 2023.
Our robust risk management icons and moderation actionable messages in 26 to explore new ways to monetize our digital and was recognized earlier this year with a credit rating markets. physical assets to create additional profitable upgrade from
Baa1 to A3 by Moody’s and from BBB+ PLEA SE REFER TO OUR SUSTAINABILITY STATEMENTS IN OUR 2023 revenue streams. to A- by S&P. ANNUAL REPORT HERE FOR FURTHER DETAILS. • Digitizing our relationships with our more As a result, we have
additional flexibility in our than six million customers globally: As of 31 capital allocation choices. The AB InBev Board of Looking forward unwavering, and we thank all our colleagues globally December 2023, BEES was live in 26 markets, with
Directors has proposed a full year dividend of As we reflect on 2023, while our full potential was for their hard work and dedication. approximately 70% of our 4Q23 revenues captured 0.82 EUR per share, a 9% increase versus FY22. through B2B digital
platforms. In FY23, BEES reached constrained, the fundamental strengths of our rd Looking ahead to 2024, our purpose as a company In addition, as of 23 February 2024 we have 3.7 million monthly active users and captured 39.8 business drove another
year of consistent profitable remains as relevant as ever. Guided by our strategy completed nearly 90% of our 1 billion USD share billion USD in gross merchandise value (GMV), growth. Beer is a large, profitable and growing and our focus on customer
and consumer centricity, buyback program announced on 31 October 2023. growth of 27% versus FY22. category, gaining share of alcohol globally and we are energized about the opportunities ahead to • A dvancing our sustainability priorities: In
FY23, with significant headroom for premiumization. Our activate the category through our megabrands and BEES Marketplace was live in 15 markets with 67% we continued to make progress towards our diversified footprint, global scale and unparalleled
platforms. We believe in the potential of the beer of BEES customers also Marketplace buyers. ambitious 2025 Sustainability Goals. We contracted ecosystem uniquely position us to lead and grow the category, the fundamentals of our company and our
Marketplace captured approximately 1.5 billion USD the equivalent of 100% of our global purchased category. We have replicable growth drivers such as people, and our ability to generate superior long- in GMV from sales of third-party products this
year, electricity volume from renewable sources with our portfolio of megabrands that consumers love, term value and create a future with more cheers. growth of 52% versus FY22. 73.6% operational. Since 2017, we reduced our digital products that
unlock value and a category • Leading the way in DTC solutions: Our absolute GHG emissions across Scopes 1 and 2 by expansion model that drives organic growth. Our omnichannel direct-to-consumer (DTC) ecosystem 44% and GHG emissions intensity
across Scopes business generates superior profitability and cash of digital and physical products generated revenue 1, 2 and 3 by 24.2%. In Sustainable Agriculture, generation, and our dynamic capital allocation Marty Barrington Michel Doukeris of
approximately 1.5 billion USD this year. Our DTC 95% of our direct farmers met our criteria for framework provides us flexibility to maximize value Chairman of the Board Chief Executive Officer megabrands, Zé Delivery, TaDa and PerfectDraft
skilled, 92% for connected and 86% for financially creation. The resilience, relentless commitment are available in 21 markets, fulfilled over 69 million empowered. In Water Stewardship, we are investing and deep ownership culture of our people is
truly e-commerce orders and generated revenue of in restoration and conservation efforts across 100% AB InBev - Annual report 2023 - 3

LETTER TO OUR WHO WE ARE OUR DIVERSIFIED OUR IMPACT SHAREHOLDERS KEY
FIGURES 2023 OUR GLOBAL PURPOSE AND WHAT WE BREW OUR ROUTE TO MARKET FOOTPRINT 2023 IN REVIEW OUR STRATEGY IN OUR COMMUNITIES KEY FIGURES 2023 PERFORMANCE DIGITAL INNOVATION TRANSFORMATION 59.4 billion USD ~6 billion USD revenue revenue
contributions ~70% from our innovations global annual revenue comes from digital channels 505.90 million hl beer volume 39.8 billion USD MARKETING AWARDS of gross merchandise value 20.0 billion USD captured through BEES EBITDA 48 Cannes Lions
awards, including Creative Marketer of the Year for BRAND AWARDS 7.0% the second consecutive year organic EBITDA growth 308 22 10 16 beer awards won at major $3.05 SILVER GOLD BRONZE international competitions in 2023 underlying EPS CREATIVE
MARKETER OF THE YEAR 150+ medals OPERATIONS at the 2023 World Beer Awards, with seven beers earning 'World's Best' status 172 major breweries 7 out of the top 10 most valuable beer brands in the world are ~50 countries with operations brewed by us
AB InBev - Annual report 2023 - 4

LETTER TO OUR WHO WE ARE OUR DIVERSIFIED OUR IMPACT SHAREHOLDERS KEY
FIGURES 2023 OUR GLOBAL PURPOSE AND WHAT WE BREW OUR ROUTE TO MARKET FOOTPRINT 2023 IN REVIEW OUR STRATEGY IN OUR COMMUNITIES SUSTAINABILITY SMART DRINKING PEOPLE 17.9% 900 million USD 155,000 improvements in water investment in social norms
marketing colleagues efficiency since 2017 since 2016* 24.2% 135 54% nationalities represented reduction in Scopes 1, 2, and of our portfolio is 4.5% 3 emissions per hectoliter of ABV or below production since 2017 Implemented Women in leadership
largest voluntary beverage 44.0% alcohol labeling initiative reduction in Scopes 1 and 2 absolute by placing smart drinking icons and emissions since 2017 actionable messages in all our beers in 26 countries where labeling is not required 100%
renewable electricity contracted COMMUNITY SUPPORT 2017 2018 2019 2020 2021 2022 2023 ~6.5 million cans of emergency drinking water Women in senior management in our company delivered to those in need *472 million USD of the total amount has been
validated through an independent external auditor. The remaining investment figures are under review. Total investment could potentially change based on results of external assurance process results. These sustainability key figures are subject to
the same caveats as stated in the full disclosure of our sustainability statements. For more information, see the full disclosures in the sustainability statements on page 158. AB InBev - Annual report 2023 - 5 19% 20% 22% 24% 26% 28% 29%

LETTER TO OUR WHO WE ARE OUR DIVERSIFIED OUR IMPACT SHAREHOLDERS KEY
FIGURES 2023 OUR GLOBAL PURPOSE AND WHAT WE BREW OUR ROUTE TO MARKET FOOTPRINT 2023 IN REVIEW OUR STRATEGY IN OUR COMMUNITIES OUR GLOBAL PURPOSE We dream big to create a future with more cheers. AB InBev always dreams big. It’s our culture,
our heritage and our future. We provide opportunities for our people, lift our neighbors and make a meaningful impact on the world. We’re creating a future that everyone can celebrate and share. A future with more cheers. AB InBev - Annual
report 2023 - 6
LETTER TO OUR WHO WE ARE OUR DIVERSIFIED OUR IMPACT SHAREHOLDERS KEY
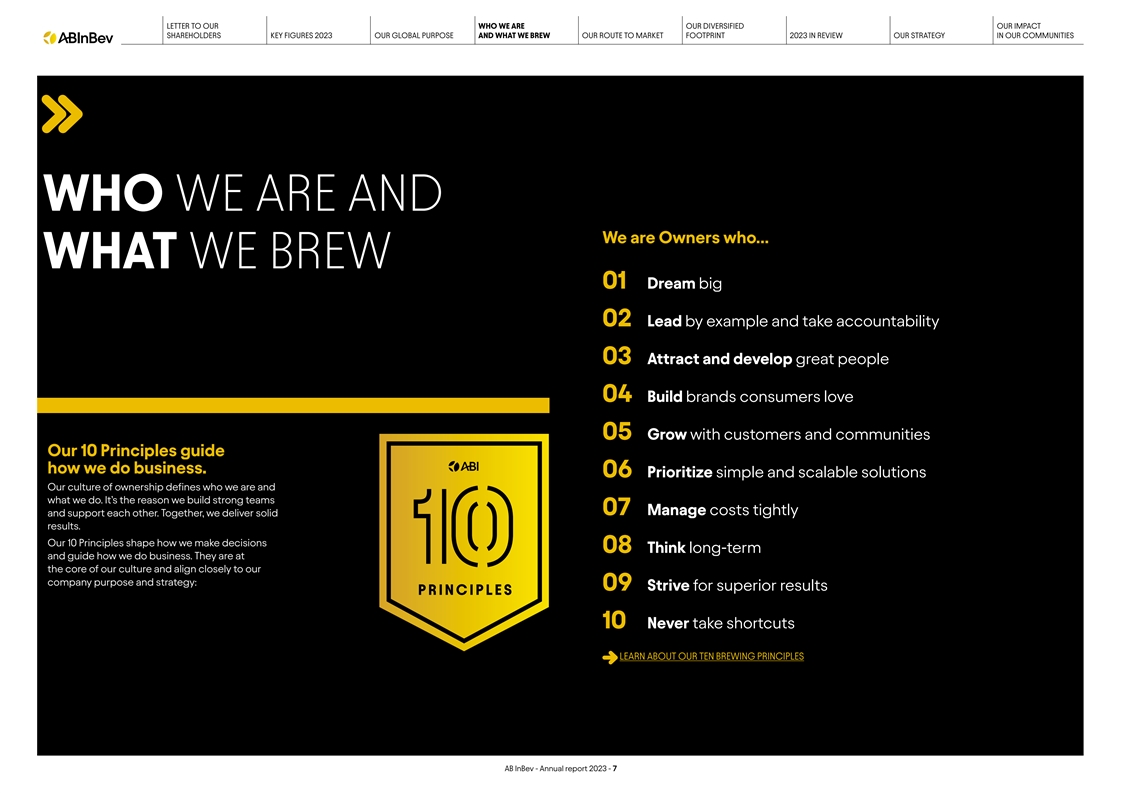
FIGURES 2023 OUR GLOBAL PURPOSE AND WHAT WE BREW OUR ROUTE TO MARKET FOOTPRINT 2023 IN REVIEW OUR STRATEGY IN OUR COMMUNITIES WHO WE ARE AND We are Owners who… WHAT WE BREW 01 Dream big 02 Lead by example and take accountability 03 A ttract
and develop great people 04 Build brands consumers love 05 Grow with customers and communities Our 10 Principles guide how we do business. 06 Prioritize simple and scalable solutions Our culture of ownership defines who we are and what we do.
It’s the reason we build strong teams 07 Manage costs tightly and support each other. Together, we deliver solid results. Our 10 Principles shape how we make decisions 08 Think long-term and guide how we do business. They are at the core of
our culture and align closely to our company purpose and strategy: 09 Striv e for superior results 10 Never take shortcuts LEARN ABOUT OUR TEN BREWING PRINCIPLES AB InBev - Annual report 2023 - 7
LETTER TO OUR WHO WE ARE OUR DIVERSIFIED OUR IMPACT SHAREHOLDERS KEY
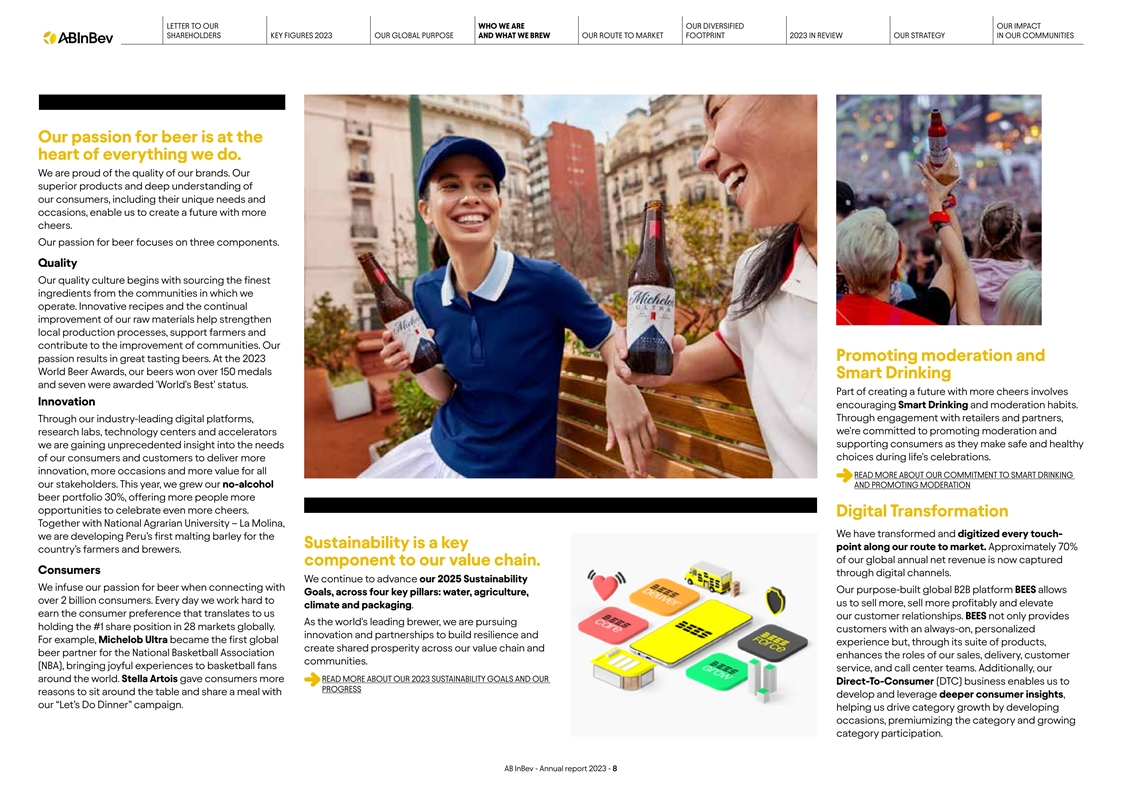
FIGURES 2023 OUR GLOBAL PURPOSE AND WHAT WE BREW OUR ROUTE TO MARKET FOOTPRINT 2023 IN REVIEW OUR STRATEGY IN OUR COMMUNITIES Our passion for beer is at the heart of everything we do. We are proud of the quality of our brands. Our superior products
and deep understanding of our consumers, including their unique needs and occasions, enable us to create a future with more cheers. Our passion for beer focuses on three components. Quality Our quality culture begins with sourcing the finest
ingredients from the communities in which we operate. Innovative recipes and the continual improvement of our raw materials help strengthen local production processes, support farmers and contribute to the improvement of communities. Our Promoting
moderation and passion results in great tasting beers. At the 2023 World Beer Awards, our beers won over 150 medals Smart Drinking and seven were awarded 'World's Best' status. Part of creating a future with more cheers involves Innovation
encouraging Smart Drinking and moderation habits. Through engagement with retailers and partners, Through our industry-leading digital platforms, we're committed to promoting moderation and research labs, technology centers and accelerators we are
gaining unprecedented insight into the needs supporting consumers as they make safe and healthy of our consumers and customers to deliver more choices during life's celebrations. innovation, more occasions and more value for all READ MORE ABOUT OUR
COMMITMENT TO SMART DRINKING our stakeholders. This year, we grew our no-alcohol AND PROMOTING MODERATION beer portfolio 30%, offering more people more opportunities to celebrate even more cheers. Digital Transformation Together with National
Agrarian University – La Molina, We have transformed and digitized every touch- we are developing Peru’s first malting barley for the Sustainability is a key point along our route to market. Approximately 70% country’s farmers and
brewers. of our global annual net revenue is now captured component to our value chain. Consumers through digital channels. We continue to advance our 2025 Sustainability We infuse our passion for beer when connecting with Our purpose-built global
B2B platform BEES allows Goals, across four key pillars: water, agriculture, over 2 billion consumers. Every day we work hard to us to sell more, sell more profitably and elevate climate and packaging. earn the consumer preference that translates to
us our customer relationships. BEES not only provides As the world's leading brewer, we are pursuing holding the #1 share position in 28 markets globally. customers with an always-on, personalized innovation and partnerships to build resilience and
For example, Michelob Ultra became the first global experience but, through its suite of products, create shared prosperity across our value chain and beer partner for the National Basketball Association enhances the roles of our sales, delivery,
customer communities. (NBA), bringing joyful experiences to basketball fans service, and call center teams. Additionally, our around the world. Stella Artois gave consumers more READ MORE ABOUT OUR 2023 SUSTAINABILITY GOALS AND OUR
Direct-To-Consumer (DTC) business enables us to PROGRESS reasons to sit around the table and share a meal with develop and leverage deeper consumer insights, our “Let’s Do Dinner” campaign. helping us drive category growth by
developing occasions, premiumizing the category and growing category participation. AB InBev - Annual report 2023 - 8
LETTER TO OUR WHO WE ARE OUR DIVERSIFIED OUR IMPACT SHAREHOLDERS KEY
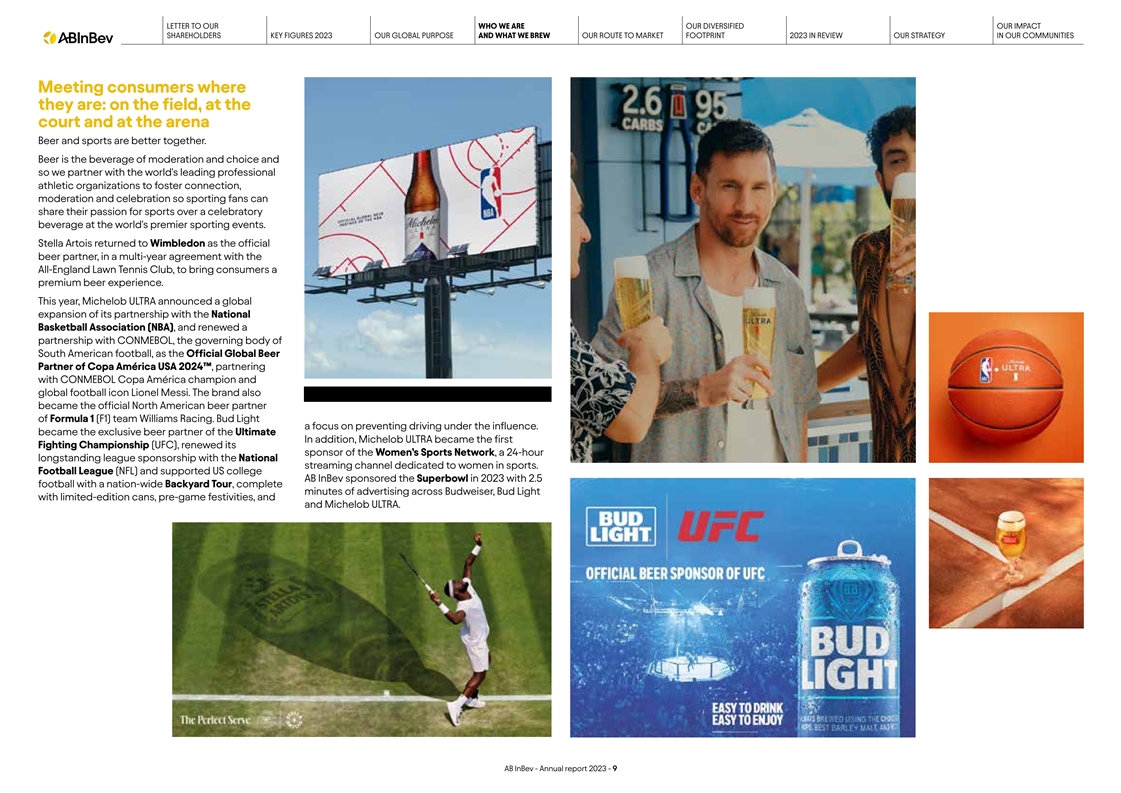
FIGURES 2023 OUR GLOBAL PURPOSE AND WHAT WE BREW OUR ROUTE TO MARKET FOOTPRINT 2023 IN REVIEW OUR STRATEGY IN OUR COMMUNITIES Meeting consumers where they are: on the field, at the court and at the arena Beer and sports are better together. Beer is
the beverage of moderation and choice and so we partner with the world's leading professional athletic organizations to foster connection, moderation and celebration so sporting fans can share their passion for sports over a celebratory beverage at
the world's premier sporting events. Stella Artois returned to Wimbledon as the official beer partner, in a multi-year agreement with the All-England Lawn Tennis Club, to bring consumers a premium beer experience. This year, Michelob ULTRA announced
a global expansion of its partnership with the National Basketball Association (NBA), and renewed a partnership with CONMEBOL, the governing body of South American football, as the Official Global Beer Partner of Copa América USA 2024™,
partnering with CONMEBOL Copa América champion and global football icon Lionel Messi. The brand also became the official North American beer partner of Formula 1 (F1) team Williams Racing. Bud Light a focus on preventing driving under the
influence. became the exclusive beer partner of the Ultimate In addition, Michelob ULTRA became the first Fighting Championship (UFC), renewed its sponsor of the Women’s Sports Network, a 24-hour longstanding league sponsorship with the
National streaming channel dedicated to women in sports. Football League (NFL) and supported US college AB InBev sponsored the Superbowl in 2023 with 2.5 football with a nation-wide Backyard Tour, complete minutes of advertising across Budweiser,
Bud Light with limited-edition cans, pre-game festivities, and and Michelob ULTRA. AB InBev - Annual report 2023 - 9
LETTER TO OUR WHO WE ARE OUR DIVERSIFIED OUR IMPACT SHAREHOLDERS KEY
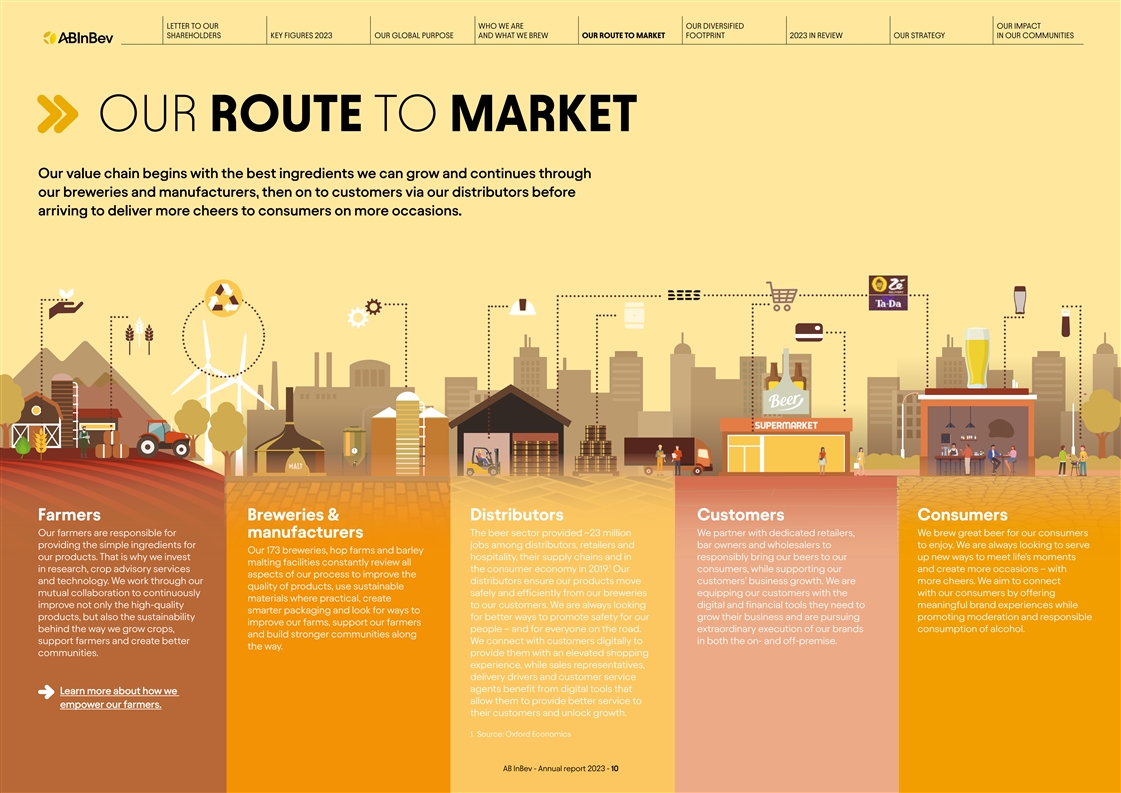
FIGURES 2023 OUR GLOBAL PURPOSE AND WHAT WE BREW OUR ROUTE TO MARKET FOOTPRINT 2023 IN REVIEW OUR STRATEGY IN OUR COMMUNITIES OUR ROUTE TO MARKET Our value chain begins with the best ingredients we can grow and continues through our breweries and
manufacturers, then on to customers via our distributors before arriving to deliver more cheers to consumers on more occasions. Farmers Breweries & Distributors Customers Consumers Our farmers are responsible for The beer sector provided ~23
million We partner with dedicated retailers, We brew great beer for our consumers manufacturers providing the simple ingredients for jobs among distributors, retailers and bar owners and wholesalers to to enjoy. We are always looking to serve Our
173 breweries, hop farms and barley our products. That is why we invest hospitality, their supply chains and in responsibly bring our beers to our up new ways to meet life’s moments malting facilities constantly review all 1 in research, crop
advisory services the consumer economy in 2019. Our consumers, while supporting our and create more occasions – with aspects of our process to improve the and technology. We work through our distributors ensure our products move
customers’ business growth. We are more cheers. We aim to connect quality of products, use sustainable mutual collaboration to continuously safely and efficiently from our breweries equipping our customers with the with our consumers by
offering materials where practical, create improve not only the high-quality to our customers. We are always looking digital and financial tools they need to meaningful brand experiences while smarter packaging and look for ways to products, but
also the sustainability for better ways to promote safety for our grow their business and are pursuing promoting moderation and responsible improve our farms, support our farmers behind the way we grow crops, people – and for everyone on the
road. extraordinary execution of our brands consumption of alcohol. and build stronger communities along support farmers and create better We connect with customers digitally to in both the on- and off-premise. the way. communities. provide them
with an elevated shopping experience, while sales representatives, delivery drivers and customer service agents benefit from digital tools that L earn more about how we allow them to provide better service to empower our farmers. their customers and
unlock growth. 1. Source: Oxford Economics AB InBev - Annual report 2023 - 10
LETTER TO OUR WHO WE ARE OUR DIVERSIFIED OUR IMPACT SHAREHOLDERS KEY
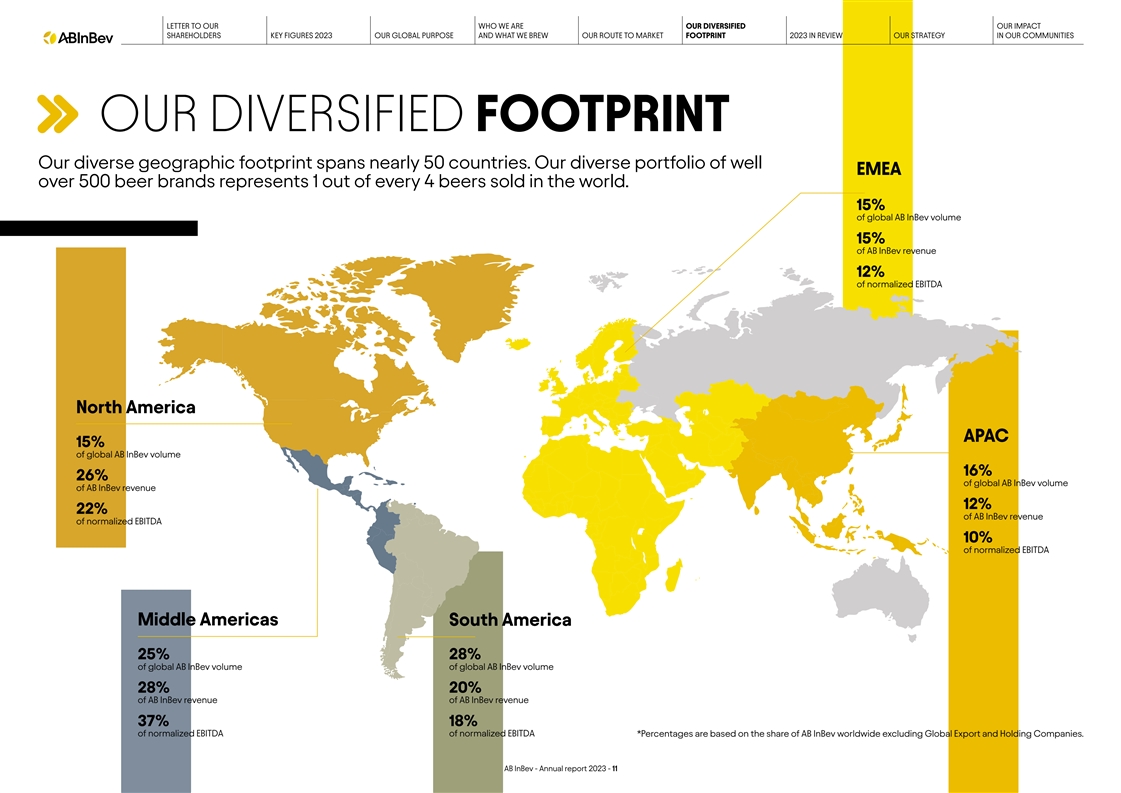
FIGURES 2023 OUR GLOBAL PURPOSE AND WHAT WE BREW OUR ROUTE TO MARKET FOOTPRINT 2023 IN REVIEW OUR STRATEGY IN OUR COMMUNITIES OUR DIVERSIFIED FOOTPRINT Our diverse geographic footprint spans nearly 50 countries. Our diverse portfolio of well EMEA
over 500 beer brands represents 1 out of every 4 beers sold in the world. 15% of global AB InBev volume 15% of AB InBev revenue 12% of normalized EBITDA North America APAC 15% of global AB InBev volume 16% 26% of global AB InBev volume of AB InBev
revenue 12% 22% of AB InBev revenue of normalized EBITDA 10% of normalized EBITDA Middle Americas South America 25% 28% of global AB InBev volume of global AB InBev volume 28% 20% of AB InBev revenue of AB InBev revenue 37% 18% of normalized EBITDA
of normalized EBITDA *Percentages are based on the share of AB InBev worldwide excluding Global Export and Holding Companies. AB InBev - Annual report 2023 - 11
LETTER TO OUR WHO WE ARE OUR DIVERSIFIED OUR IMPACT SHAREHOLDERS KEY
FIGURES 2023 OUR GLOBAL PURPOSE AND WHAT WE BREW OUR ROUTE TO MARKET FOOTPRINT 2023 IN REVIEW OUR STRATEGY IN OUR COMMUNITIES 2023 2023 IN IN REVIEW REVIEW AB InBev - Annual report 2023 - 12
LETTER TO OUR WHO WE ARE OUR DIVERSIFIED OUR IMPACT SHAREHOLDERS KEY
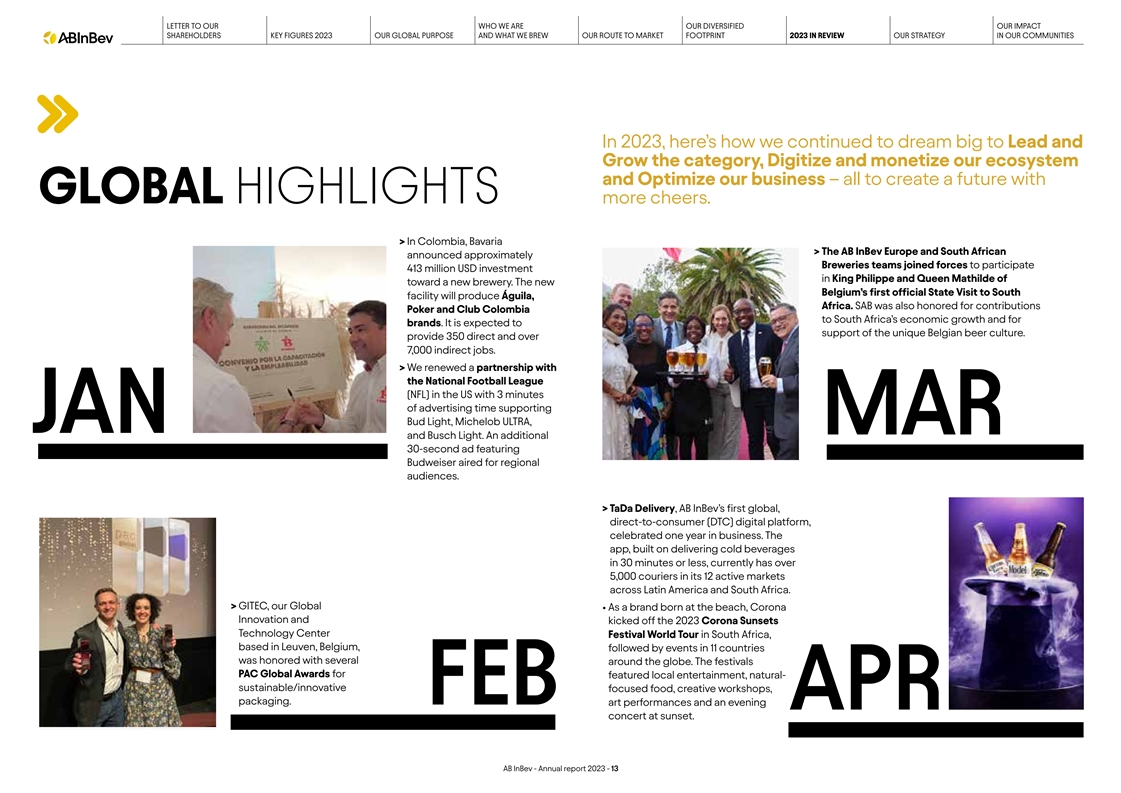
FIGURES 2023 OUR GLOBAL PURPOSE AND WHAT WE BREW OUR ROUTE TO MARKET FOOTPRINT 2023 IN REVIEW OUR STRATEGY IN OUR COMMUNITIES In 2023, here’s how we continued to dream big to Lead and Grow the category, Digitize and monetize our ecosystem and
Optimize our business – all to create a future with GLOBAL HIGHLIGHTS more cheers. > In Colombia, Bavaria > The AB InBe v Europe and South African announced approximately Breweries teams joined forces to participate 413 million USD
investment in King Philippe and Queen Mathilde of toward a new brewery. The new Belgium’s first official State Visit to South facility will produce Águila, Africa. SAB was also honored for contributions Poker and Club Colombia to South
Africa’s economic growth and for brands. It is expected to support of the unique Belgian beer culture. provide 350 direct and over 7,000 indirect jobs. > We renewed a partnership with the National Football League (NFL) in the US with 3
minutes of advertising time supporting Bud Light, Michelob ULTRA, JAN MAR and Busch Light. An additional 30-second ad featuring Budweiser aired for regional audiences. > TaDa Delivery, AB InBev’s first global, direct-to-consumer (DTC)
digital platform, celebrated one year in business. The app, built on delivering cold beverages in 30 minutes or less, currently has over 5,000 couriers in its 12 active markets across Latin America and South Africa. > GITEC , our Global •
As a brand born at the beach, Corona Innovation and kicked off the 2023 Corona Sunsets Technology Center Festival World Tour in South Africa, based in Leuven, Belgium, followed by events in 11 countries was honored with several around the globe. The
festivals PAC Global Awards for featured local entertainment, natural- sustainable/innovative focused food, creative workshops, packaging. FEB art performances and an evening APR concert at sunset. AB InBev - Annual report 2023 - 13
LETTER TO OUR WHO WE ARE OUR DIVERSIFIED OUR IMPACT SHAREHOLDERS KEY
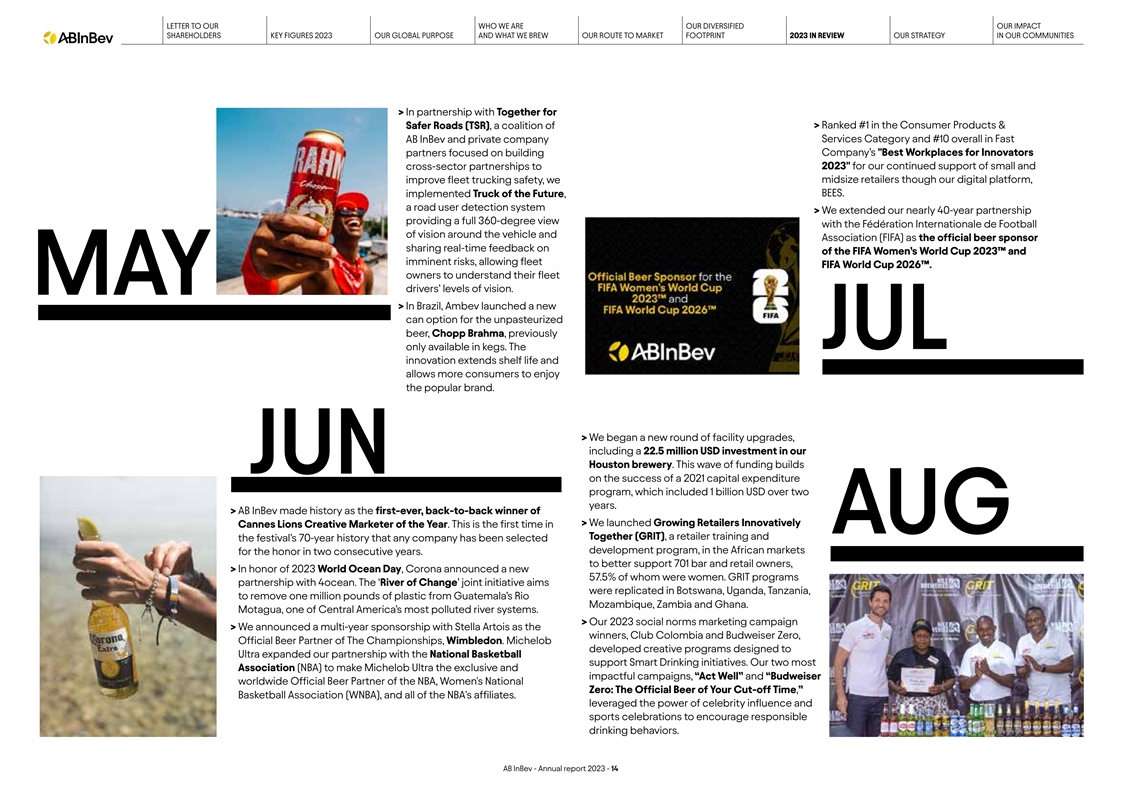
FIGURES 2023 OUR GLOBAL PURPOSE AND WHAT WE BREW OUR ROUTE TO MARKET FOOTPRINT 2023 IN REVIEW OUR STRATEGY IN OUR COMMUNITIES > In partnership with Together for > Ranked #1 in the Consumer Products & Safer Roads (TSR), a coalition of AB
InBev and private company Services Category and #10 overall in Fast partners focused on building Company’s Best Workplaces for Innovators cross-sector partnerships to 2023 for our continued support of small and midsize retailers though our
digital platform, improve fleet trucking safety, we BEES. implemented Truck of the Future, a road user detection system > W e extended our nearly 40-year partnership providing a full 360-degree view with the Fédération Internationale de
Football of vision around the vehicle and Association (FIFA) as the official beer sponsor sharing real-time feedback on of the FIFA Women’s World Cup 2023™ and imminent risks, allowing fleet FIFA World Cup 2026™. owners to
understand their fleet drivers’ levels of vision. MAY > In Br azil, Ambev launched a new can option for the unpasteurized beer, Chopp Brahma, previously JUL only available in kegs. The innovation extends shelf life and allows more consumers
to enjoy the popular brand. > W e began a new round of facility upgrades, including a 22.5 million USD investment in our Houston brewery. This wave of funding builds JUN on the success of a 2021 capital expenditure program, which included 1
billion USD over two years. > AB InBe v made history as the first-ever, back-to-back winner of > W e launched Growing Retailers Innovatively Cannes Lions Creative Marketer of the Year. This is the first time in AUG Together (GRIT), a retailer
training and the festival’s 70-year history that any company has been selected development program, in the African markets for the honor in two consecutive years. to better support 701 bar and retail owners, > In honor o f 2023 World Ocean
Day, Corona announced a new 57.5% of whom were women. GRIT programs partnership with 4ocean. The ‘River of Change’ joint initiative aims were replicated in Botswana, Uganda, Tanzania, to remove one million pounds of plastic from
Guatemala’s Rio Mozambique, Zambia and Ghana. Motagua, one of Central America’s most polluted river systems. > Our 202 3 social norms marketing campaign > W e announced a multi-year sponsorship with Stella Artois as the winners,
Club Colombia and Budweiser Zero, Official Beer Partner of The Championships, Wimbledon. Michelob developed creative programs designed to Ultra expanded our partnership with the National Basketball support Smart Drinking initiatives. Our two most
Association (NBA) to make Michelob Ultra the exclusive and impactful campaigns, “Act Well” and “Budweiser worldwide Official Beer Partner of the NBA, Women's National Zero: The Official Beer of Your Cut-off Time,” Basketball
Association (WNBA), and all of the NBA's affiliates. leveraged the power of celebrity influence and sports celebrations to encourage responsible drinking behaviors. AB InBev - Annual report 2023 - 14
LETTER TO OUR WHO WE ARE OUR DIVERSIFIED OUR IMPACT SHAREHOLDERS KEY
FIGURES 2023 OUR GLOBAL PURPOSE AND WHAT WE BREW OUR ROUTE TO MARKET FOOTPRINT 2023 IN REVIEW OUR STRATEGY IN OUR COMMUNITIES > We invested 300 million USD in a Mexican processing facility for locally-grown corn. The project is expected to create
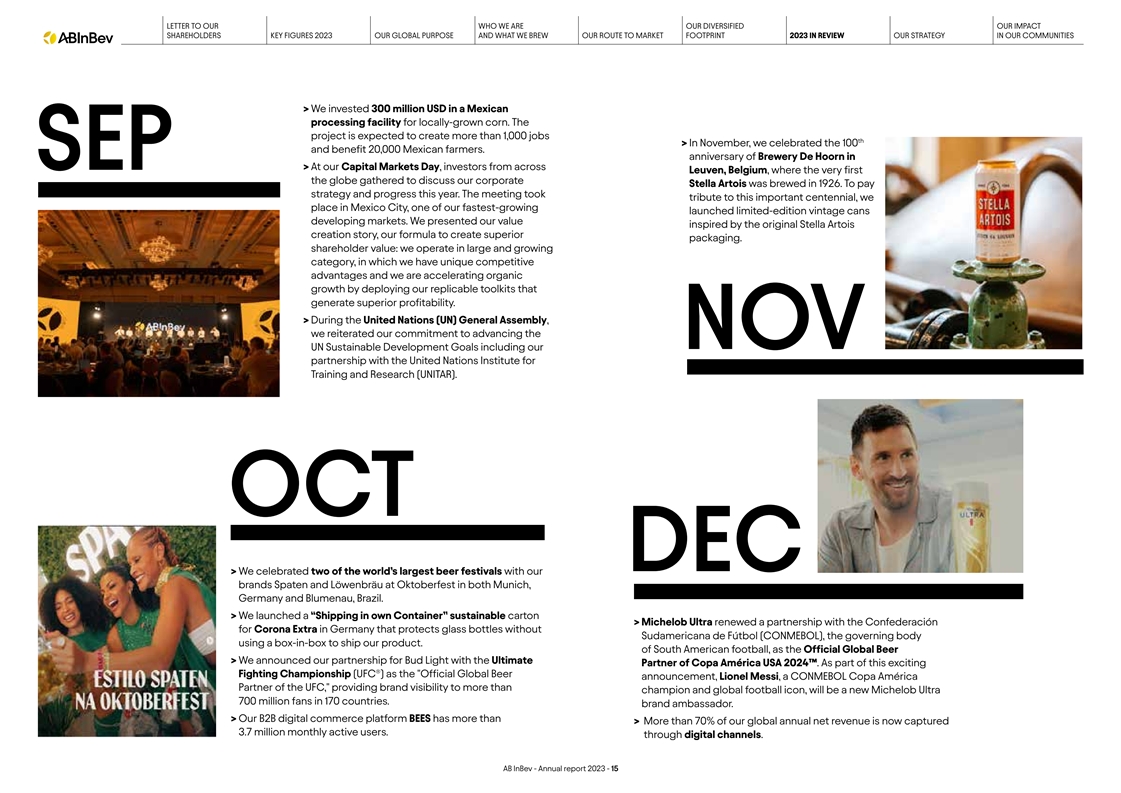
more than 1,000 jobs th > In November, we celebrated the 100 and benefit 20,000 Mexican farmers. anniversary of Brewery De Hoorn in SEP > At our Capital Markets Day, investors from across Leuven, Belgium, where the very first the globe
gathered to discuss our corporate Stella Artois was brewed in 1926. To pay strategy and progress this year. The meeting took tribute to this important centennial, we place in Mexico City, one of our fastest-growing launched limited-edition vintage
cans developing markets. We presented our value inspired by the original Stella Artois creation story, our formula to create superior packaging. shareholder value: we operate in large and growing category, in which we have unique competitive
advantages and we are accelerating organic growth by deploying our replicable toolkits that generate superior profitability. > During the United Nations (UN) General Assembly, we reiterated our commitment to advancing the NOV UN Sustainable
Development Goals including our partnership with the United Nations Institute for Training and Research (UNITAR). OCT DEC > W e celebrated two of the world’s largest beer festivals with our brands Spaten and Löwenbräu at
Oktoberfest in both Munich, Germany and Blumenau, Brazil. > W e launched a “Shipping in own Container” sustainable carton > Michel ob Ultra renewed a partnership with the Confederación for Corona Extra in Germany that protects
glass bottles without Sudamericana de Fútbol (CONMEBOL), the governing body using a box-in-box to ship our product. of South American football, as the Official Global Beer > W e announced our partnership for Bud Light with the Ultimate
Partner of Copa América USA 2024™. As part of this exciting Fighting Championship (UFC(R)) as the Official Global Beer announcement, Lionel Messi, a CONMEBOL Copa América Partner of the UFC, providing brand visibility to more than
champion and global football icon, will be a new Michelob Ultra 700 million fans in 170 countries. brand ambassador. > Our B2B digital c ommerce platform BEES has more than > Mor e than 70% of our global annual net revenue is now captured 3.7
million monthly active users. through digital channels. AB InBev - Annual report 2023 - 15
LETTER TO OUR WHO WE ARE OUR DIVERSIFIED OUR IMPACT SHAREHOLDERS KEY
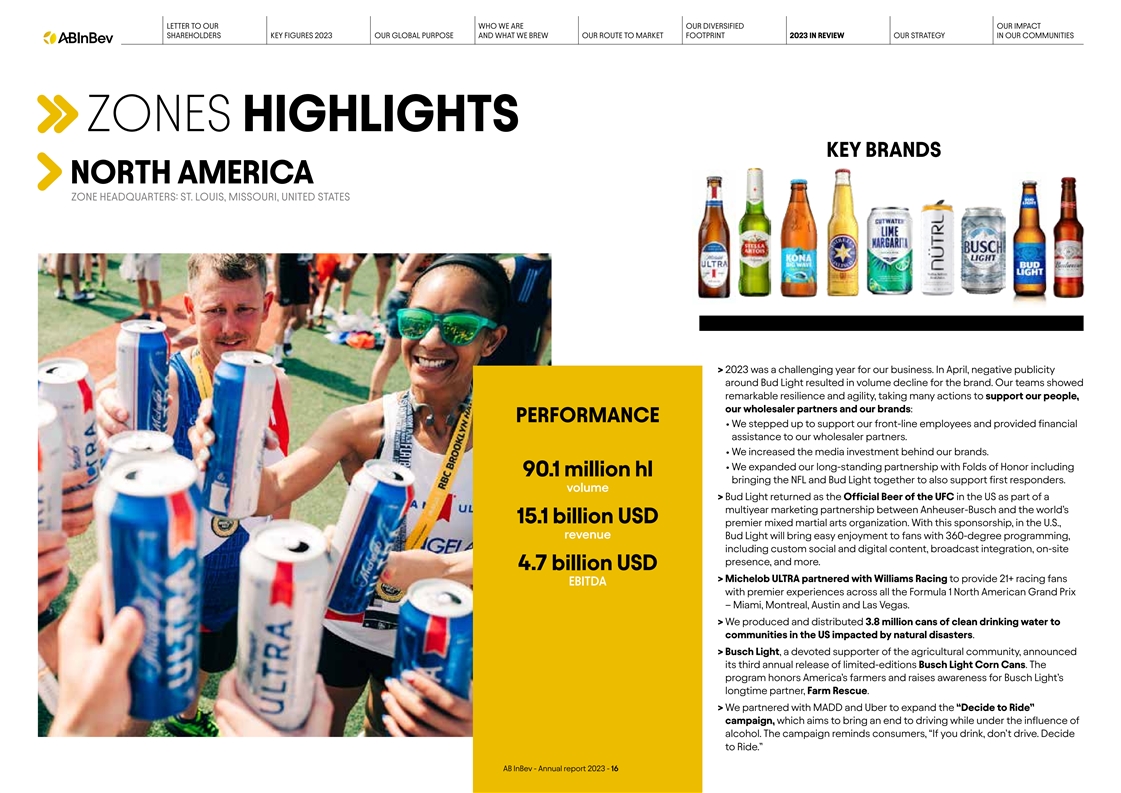
FIGURES 2023 OUR GLOBAL PURPOSE AND WHAT WE BREW OUR ROUTE TO MARKET FOOTPRINT 2023 IN REVIEW OUR STRATEGY IN OUR COMMUNITIES ZONES HIGHLIGHTS KEY BRANDS NORTH AMERICA ZONE HEADQUARTERS: ST. LOUIS, MISSOURI, UNITED STATES > 202 3 was a
challenging year for our business. In April, negative publicity around Bud Light resulted in volume decline for the brand. Our teams showed remarkable resilience and agility, taking many actions to support our people, our wholesaler partners and our
brands: PERFORMANCE • We stepped up to support our front-line employees and provided financial assistance to our wholesaler partners. • We increased the media investment behind our brands. • W e expanded our long-standing
partnership with Folds of Honor including 90.1 million hl bringing the NFL and Bud Light together to also support first responders. volume > Bud Ligh t returned as the Official Beer of the UFC in the US as part of a multiyear marketing
partnership between Anheuser-Busch and the world’s 15.1 billion USD premier mixed martial arts organization. With this sponsorship, in the U.S., revenue Bud Light will bring easy enjoyment to fans with 360-degree programming, including custom
social and digital content, broadcast integration, on-site presence, and more. 4.7 billion USD > Michel ob ULTRA partnered with Williams Racing to provide 21+ racing fans EBITDA with premier experiences across all the Formula 1 North American
Grand Prix – Miami, Montreal, Austin and Las Vegas. > W e produced and distributed 3.8 million cans of clean drinking water to communities in the US impacted by natural disasters. > Busch Light, a devoted supporter of the agricultural
community, announced its third annual release of limited-editions Busch Light Corn Cans. The program honors America’s farmers and raises awareness for Busch Light’s longtime partner, Farm Rescue. > W e partnered with MADD and Uber to
expand the “Decide to Ride” campaign, which aims to bring an end to driving while under the influence of alcohol. The campaign reminds consumers, “If you drink, don’t drive. Decide to Ride.” AB InBev - Annual report
2023 - 16
LETTER TO OUR WHO WE ARE OUR DIVERSIFIED OUR IMPACT SHAREHOLDERS KEY
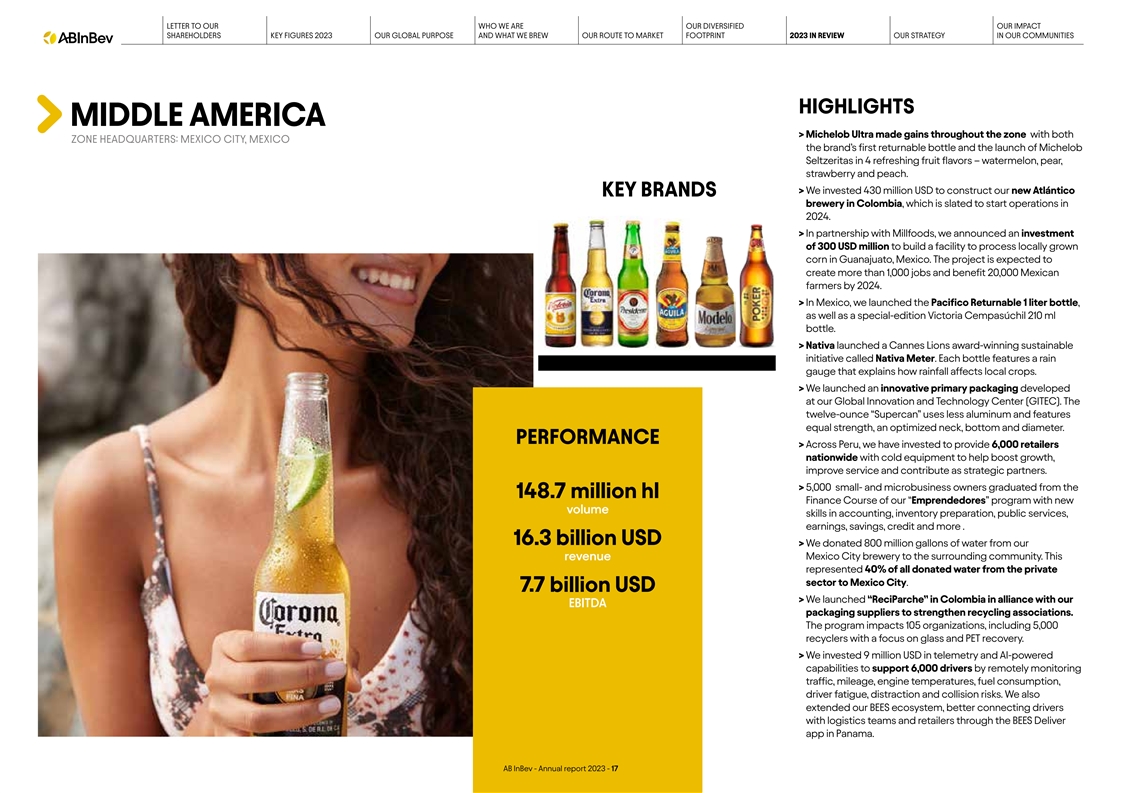
FIGURES 2023 OUR GLOBAL PURPOSE AND WHAT WE BREW OUR ROUTE TO MARKET FOOTPRINT 2023 IN REVIEW OUR STRATEGY IN OUR COMMUNITIES HIGHLIGHTS MIDDLE AMERICA > Michelob Ultra made gains throughout the zone with both ZONE HEADQUARTERS: MEXICO CITY,
MEXICO the brand’s first returnable bottle and the launch of Michelob Seltzeritas in 4 refreshing fruit flavors – watermelon, pear, strawberry and peach. > W e invested 430 million USD to construct our new Atlántico KEY BRANDS
brewery in Colombia, which is slated to start operations in 2024. > In partner ship with Millfoods, we announced an investment of 300 USD million to build a facility to process locally grown corn in Guanajuato, Mexico. The project is expected to
create more than 1,000 jobs and benefit 20,000 Mexican farmers by 2024. > In Me xico, we launched the Pacifico Returnable 1 liter bottle, as well as a special-edition Victoria Cempasúchil 210 ml bottle. > Na tiva launched a Cannes Lions
award-winning sustainable initiative called Nativa Meter. Each bottle features a rain gauge that explains how rainfall affects local crops. > We launched an innovative primary packaging developed at our Global Innovation and Technology Center
(GITEC). The twelve-ounce “Supercan” uses less aluminum and features equal strength, an optimized neck, bottom and diameter. PERFORMANCE > Across Peru, we have invested to provide 6,000 retailers nationwide with cold equipment to help
boost growth, improve service and contribute as strategic partners. > 5 ,000 small- and microbusiness owners graduated from the 148.7 million hl Finance Course of our “Emprendedores” program with new volume skills in accounting,
inventory preparation, public services, earnings, savings, credit and more . 16.3 billion USD > W e donated 800 million gallons of water from our Mexico City brewery to the surrounding community. This revenue represented 40% of all donated water
from the private sector to Mexico City. 7.7 billion USD > W e launched “ReciParche” in Colombia in alliance with our EBITDA packaging suppliers to strengthen recycling associations. The program impacts 105 organizations, including
5,000 recyclers with a focus on glass and PET recovery. > We invested 9 million USD in telemetry and AI-powered capabilities to support 6,000 drivers by remotely monitoring traffic, mileage, engine temperatures, fuel consumption, driver fatigue,
distraction and collision risks. We also extended our BEES ecosystem, better connecting drivers with logistics teams and retailers through the BEES Deliver app in Panama. AB InBev - Annual report 2023 - 17
LETTER TO OUR WHO WE ARE OUR DIVERSIFIED OUR IMPACT SHAREHOLDERS KEY
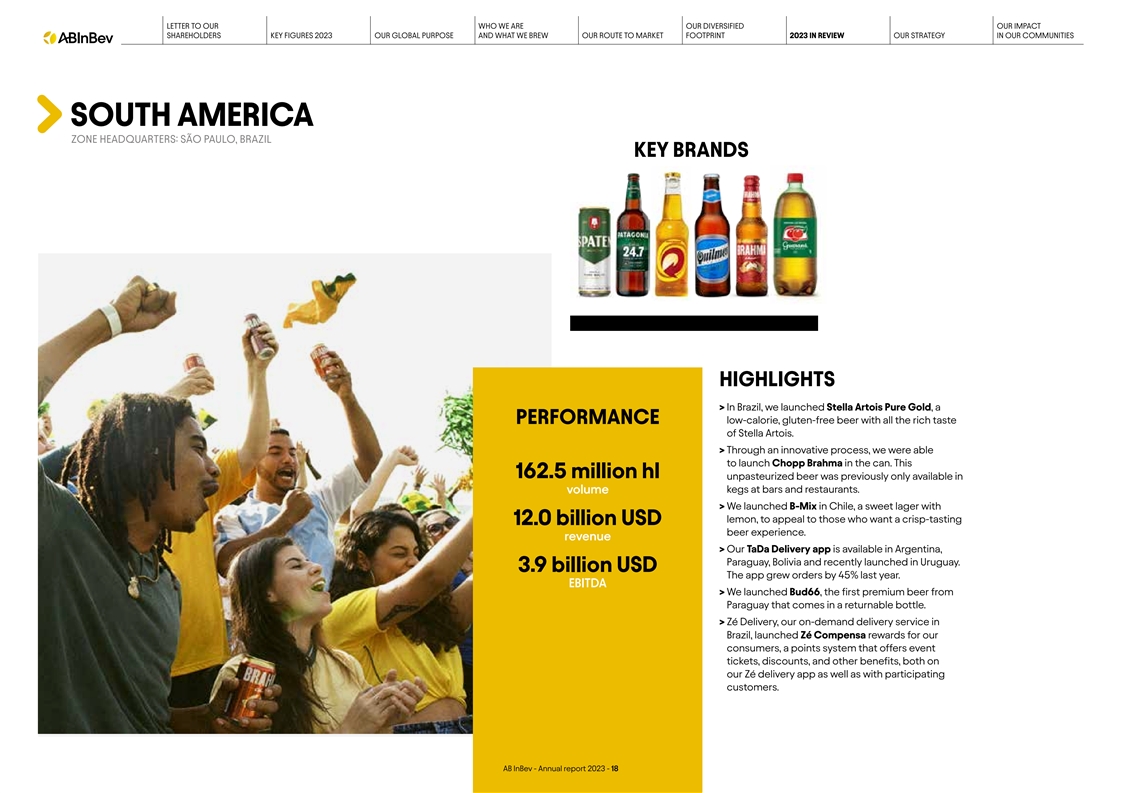
FIGURES 2023 OUR GLOBAL PURPOSE AND WHAT WE BREW OUR ROUTE TO MARKET FOOTPRINT 2023 IN REVIEW OUR STRATEGY IN OUR COMMUNITIES SOUTH AMERICA ZONE HEADQUARTERS: SÃO PAULO, BRAZIL KEY BRANDS HIGHLIGHTS > In Brazil, we launched Stella Artois
Pure Gold, a PERFORMANCE low-calorie, gluten-free beer with all the rich taste of Stella Artois. > Thr ough an innovative process, we were able to launch Chopp Brahma in the can. This 162.5 million hl unpasteurized beer was previously only
available in volume kegs at bars and restaurants. > We launched B-Mix in Chile, a sweet lager with lemon, to appeal to those who want a crisp-tasting 12.0 billion USD beer experience. revenue > Our TaDa Delivery app is available in Argentina,
Paraguay, Bolivia and recently launched in Uruguay. 3.9 billion USD The app grew orders by 45% last year. EBITDA > W e launched Bud66, the first premium beer from Paraguay that comes in a returnable bottle. > Zé Delivery, our on-demand
delivery service in Brazil, launched Zé Compensa rewards for our consumers, a points system that offers event tickets, discounts, and other benefits, both on our Zé delivery app as well as with participating customers. AB InBev - Annual
report 2023 - 18
LETTER TO OUR WHO WE ARE OUR DIVERSIFIED OUR IMPACT SHAREHOLDERS KEY
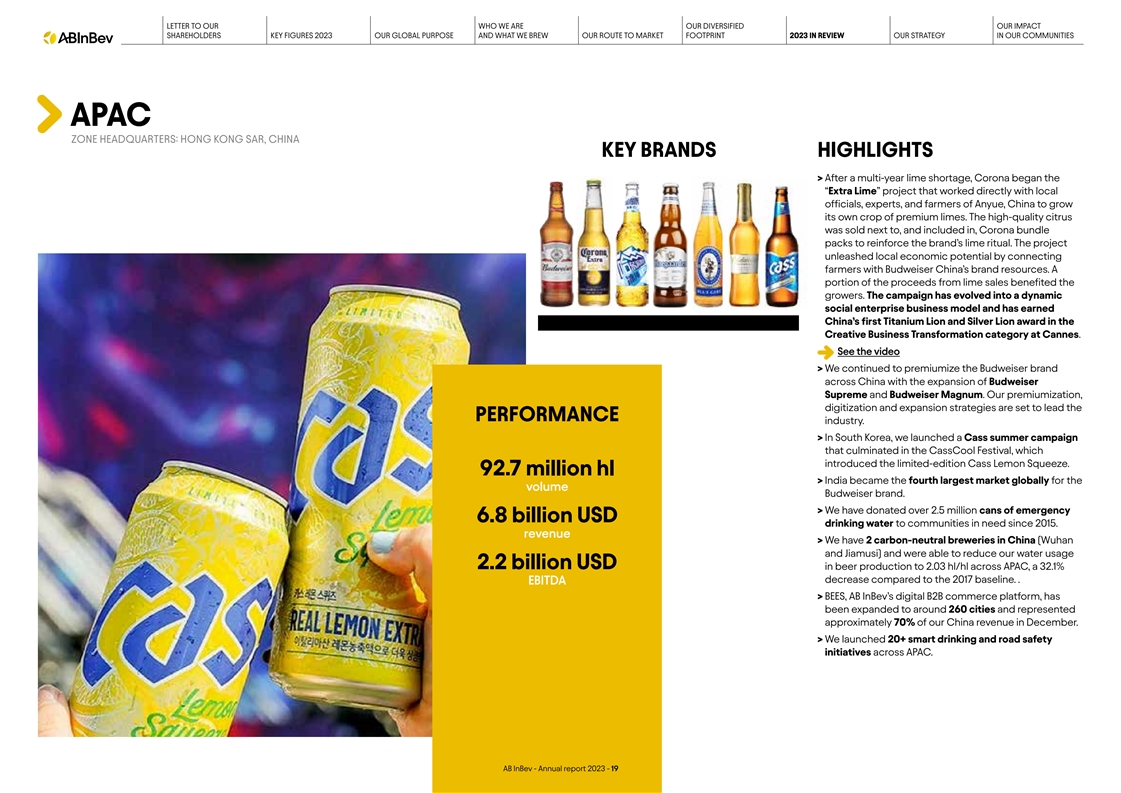
FIGURES 2023 OUR GLOBAL PURPOSE AND WHAT WE BREW OUR ROUTE TO MARKET FOOTPRINT 2023 IN REVIEW OUR STRATEGY IN OUR COMMUNITIES APAC ZONE HEADQUARTERS: HONG KONG SAR, CHINA KEY BRANDS HIGHLIGHTS > A fter a multi-year lime shortage, Corona began the
“Extra Lime” project that worked directly with local officials, experts, and farmers of Anyue, China to grow its own crop of premium limes. The high-quality citrus was sold next to, and included in, Corona bundle packs to reinforce the
brand’s lime ritual. The project unleashed local economic potential by connecting farmers with Budweiser China’s brand resources. A portion of the proceeds from lime sales benefited the growers. The campaign has evolved into a dynamic
social enterprise business model and has earned China’s first Titanium Lion and Silver Lion award in the Creative Business Transformation category at Cannes. See the video > W e continued to premiumize the Budweiser brand across China with
the expansion of Budweiser Supreme and Budweiser Magnum. Our premiumization, digitization and expansion strategies are set to lead the PERFORMANCE industry. > In South Korea, we launched a Cass summer campaign that culminated in the CassCool
Festival, which introduced the limited-edition Cass Lemon Squeeze. 92.7 million hl > India be came the fourth largest market globally for the volume Budweiser brand. > We have donated over 2.5 million cans of emergency 6.8 billion USD drinking
water to communities in need since 2015. revenue > We have 2 carbon-neutral breweries in China (Wuhan and Jiamusi) and were able to reduce our water usage 2.2 billion USD in beer production to 2.03 hl/hl across APAC, a 32.1% decrease compared to
the 2017 baseline. . EBITDA > BEES, AB InBev’s digital B2B commerce platform, has been expanded to around 260 cities and represented approximately 70% of our China revenue in December. > W e launched 20+ smart drinking and road safety
initiatives across APAC. AB InBev - Annual report 2023 - 19
LETTER TO OUR WHO WE ARE OUR DIVERSIFIED OUR IMPACT SHAREHOLDERS KEY
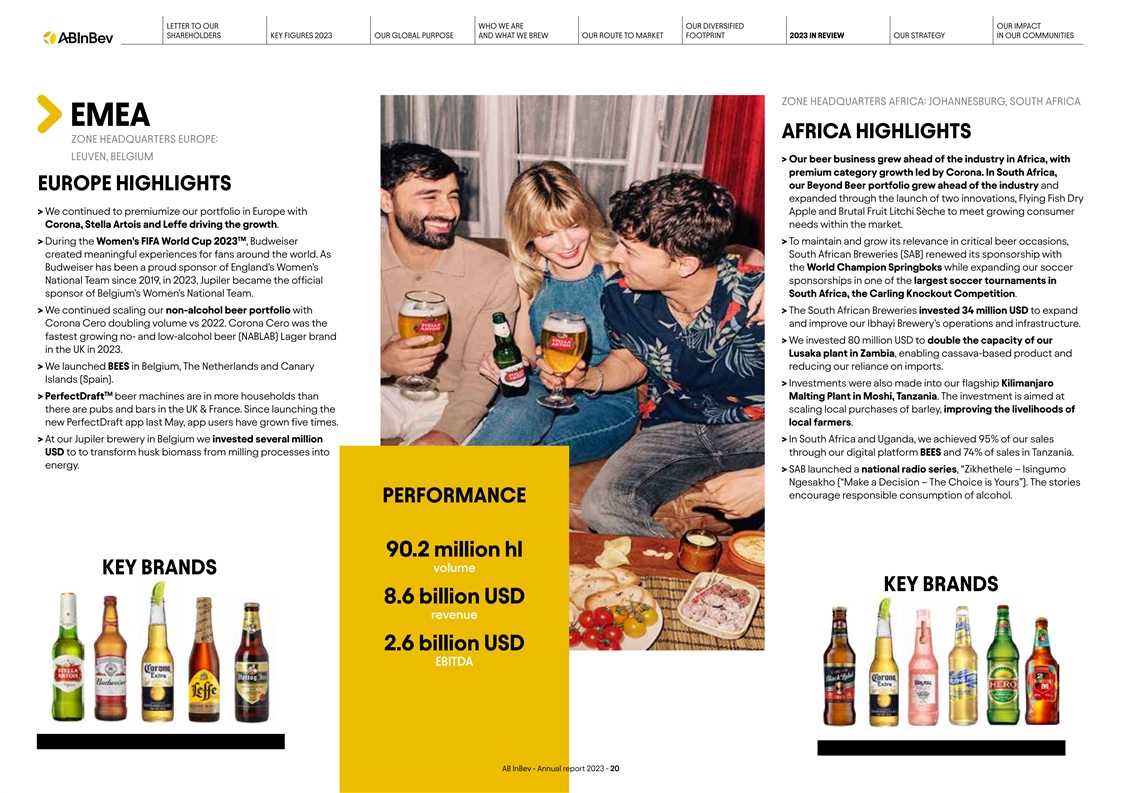
FIGURES 2023 OUR GLOBAL PURPOSE AND WHAT WE BREW OUR ROUTE TO MARKET FOOTPRINT 2023 IN REVIEW OUR STRATEGY IN OUR COMMUNITIES ZONE HEADQUARTERS AFRICA: JOHANNESBURG, SOUTH AFRICA EMEA AFRICA HIGHLIGHTS ZONE HEADQUARTERS EUROPE: LEUVEN, BELGIUM >
Our be er business grew ahead of the industry in Africa, with premium category growth led by Corona. In South Africa, our Beyond Beer portfolio grew ahead of the industry and EUROPE HIGHLIGHTS expanded through the launch of two innovations, Flying
Fish Dry > We continued to premiumize our portfolio in Europe with Apple and Brutal Fruit Litchi Sèche to meet growing consumer Corona, Stella Artois and Leffe driving the growth. needs within the market. TM > During the Women’s
FIFA World Cup 2023 , Budweiser > To maintain and grow its relevance in critical beer occasions, created meaningful experiences for fans around the world. As South African Breweries (SAB) renewed its sponsorship with Budweiser has been a proud
sponsor of England’s Women’s the World Champion Springboks while expanding our soccer National Team since 2019, in 2023, Jupiler became the official sponsorships in one of the largest soccer tournaments in sponsor of Belgium’s
Women’s National Team. South Africa, the Carling Knockout Competition. > W e continued scaling our non-alcohol beer portfolio with > The South African Breweries invested 34 million USD to expand Corona Cero doubling volume vs 2022.
Corona Cero was the and improve our Ibhayi Brewery’s operations and infrastructure. fastest growing no- and low-alcohol beer (NABLAB) Lager brand > We invested 80 million USD to double the capacity of our in the UK in 2023. Lusaka plant in
Zambia, enabling cassava-based product and > W e launched BEES in Belgium, The Netherlands and Canary reducing our reliance on imports. Islands (Spain). > Investments were also made into our flagship Kilimanjaro TM > PerfectDraft beer
machines are in more households than Malting Plant in Moshi, Tanzania. The investment is aimed at there are pubs and bars in the UK & France. Since launching the scaling local purchases of barley, improving the livelihoods of new PerfectDraft
app last May, app users have grown five times. local farmers. > A t our Jupiler brewery in Belgium we invested several million > In South A frica and Uganda, we achieved 95% of our sales USD to to transform husk biomass from milling processes
into through our digital platform BEES and 74% of sales in Tanzania. energy. > SAB launched a national radio series, “Zikhethele – Isingumo Ngesakho (“Make a Decision – The Choice is Yours”). The stories encourage
responsible consumption of alcohol. PERFORMANCE 90.2 million hl volume KEY BRANDS KEY BRANDS 8.6 billion USD revenue 2.6 billion USD EBITDA AB InBev - Annual report 2023 - 20
LETTER TO OUR WHO WE ARE OUR DIVERSIFIED OUR IMPACT SHAREHOLDERS KEY
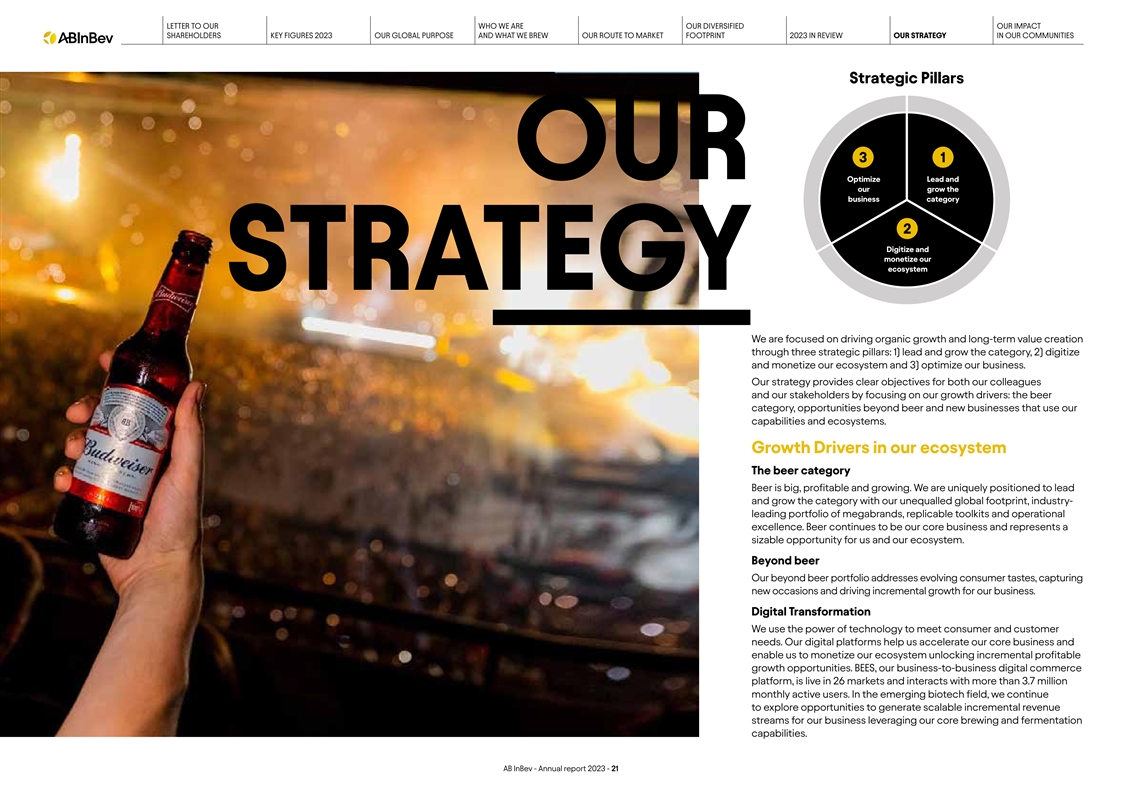
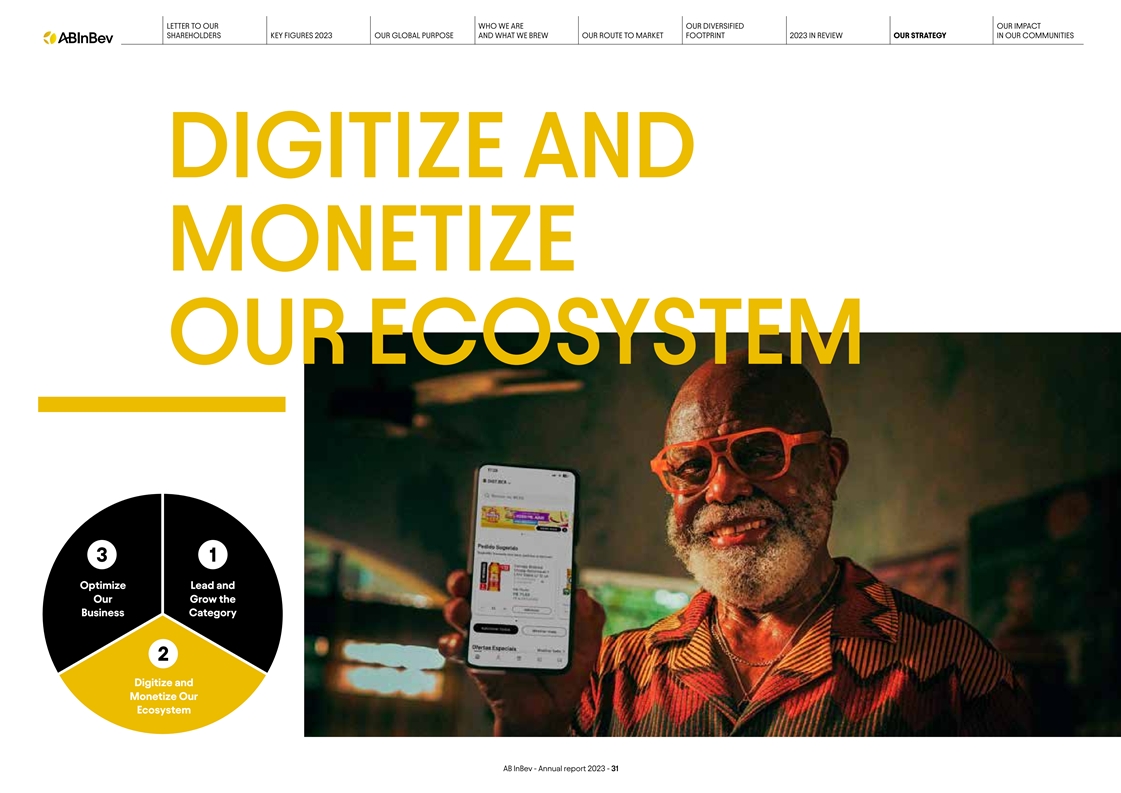
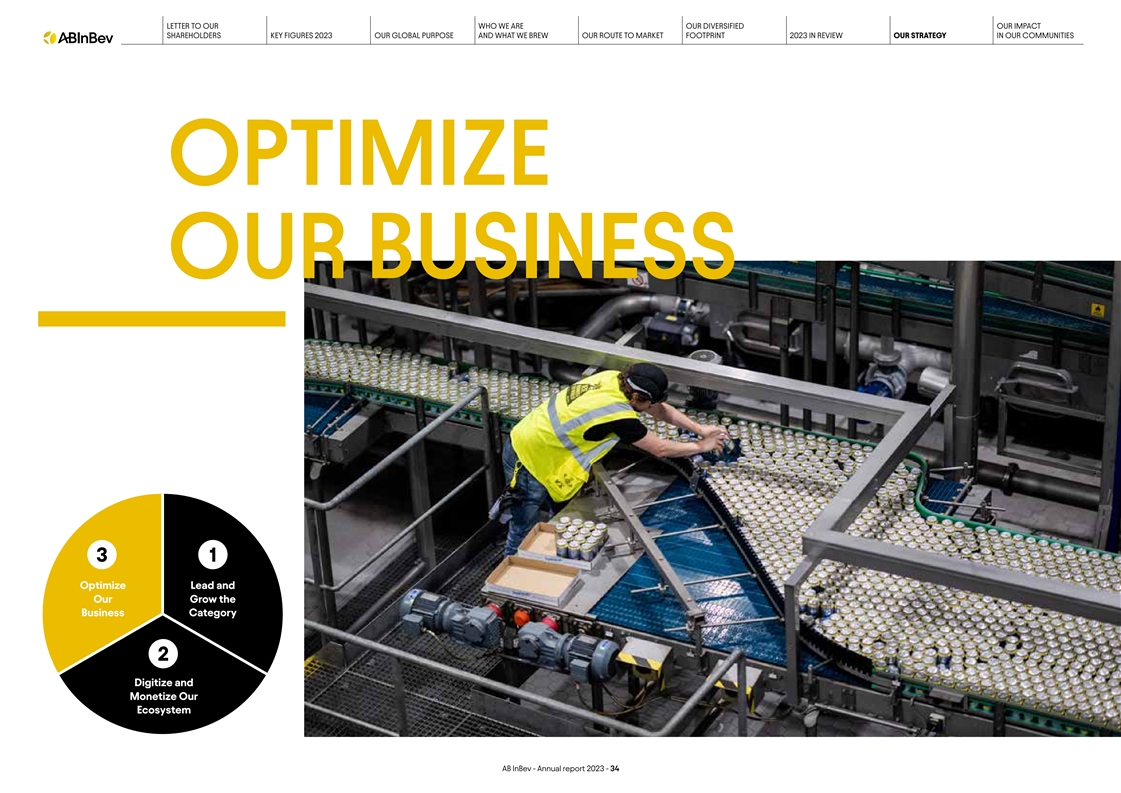
FIGURES 2023 OUR GLOBAL PURPOSE AND WHAT WE BREW OUR ROUTE TO MARKET FOOTPRINT 2023 IN REVIEW OUR STRATEGY IN OUR COMMUNITIES Strategic Pillars 3 1 OUR Lead and Optimize our grow the business category 2 Digitize and monetize our ecosystem STRATEGY
We are focused on driving organic growth and long-term value creation through three strategic pillars: 1) lead and grow the category, 2) digitize and monetize our ecosystem and 3) optimize our business. Our strategy provides clear objectives for
both our colleagues and our stakeholders by focusing on our growth drivers: the beer category, opportunities beyond beer and new businesses that use our capabilities and ecosystems. Growth Drivers in our ecosystem The beer category Beer is big,
profitable and growing. We are uniquely positioned to lead and grow the category with our unequalled global footprint, industry- leading portfolio of megabrands, replicable toolkits and operational excellence. Beer continues to be our core business
and represents a sizable opportunity for us and our ecosystem. Beyond beer Our beyond beer portfolio addresses evolving consumer tastes, capturing new occasions and driving incremental growth for our business. Digital Transformation We use the power
of technology to meet consumer and customer needs. Our digital platforms help us accelerate our core business and enable us to monetize our ecosystem unlocking incremental profitable growth opportunities. BEES, our business-to-business digital
commerce platform, is live in 26 markets and interacts with more than 3.7 million monthly active users. In the emerging biotech field, we continue to explore opportunities to generate scalable incremental revenue streams for our business leveraging
our core brewing and fermentation capabilities. AB InBev - Annual report 2023 - 21
LETTER TO OUR WHO WE ARE OUR DIVERSIFIED OUR IMPACT SHAREHOLDERS KEY
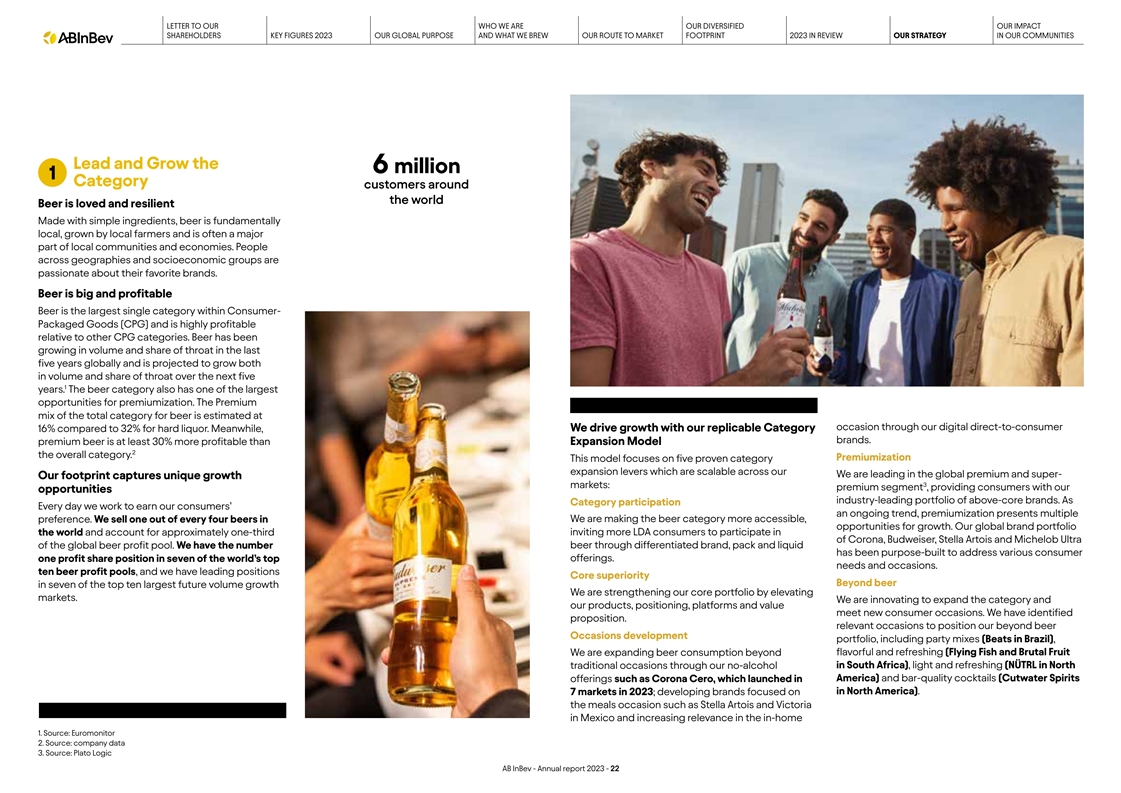
FIGURES 2023 OUR GLOBAL PURPOSE AND WHAT WE BREW OUR ROUTE TO MARKET FOOTPRINT 2023 IN REVIEW OUR STRATEGY IN OUR COMMUNITIES Lead and Grow the 6 million 1 Category customers around the world Beer is loved and resilient Made with simple ingredients,
beer is fundamentally local, grown by local farmers and is often a major part of local communities and economies. People across geographies and socioeconomic groups are passionate about their favorite brands. Beer is big and profitable Beer is the
largest single category within Consumer- Packaged Goods (CPG) and is highly profitable relative to other CPG categories. Beer has been growing in volume and share of throat in the last five years globally and is projected to grow both in volume and
share of throat over the next five 1 years. The beer category also has one of the largest opportunities for premiumization. The Premium mix of the total category for beer is estimated at occasion through our digital direct-to-consumer 16% compared
to 32% for hard liquor. Meanwhile, We drive growth with our replicable Category brands. premium beer is at least 30% more profitable than Expansion Model 2 the overall category. Premiumization This model focuses on five proven category expansion
levers which are scalable across our We are leading in the global premium and super- Our footprint captures unique growth 3 markets: premium segment , providing consumers with our opportunities industry-leading portfolio of above-core brands. As
Category participation Every day we work to earn our consumers’ an ongoing trend, premiumization presents multiple preference. We sell one out of every four beers in We are making the beer category more accessible, opportunities for growth.
Our global brand portfolio the world and account for approximately one-third inviting more LDA consumers to participate in of Corona, Budweiser, Stella Artois and Michelob Ultra of the global beer profit pool. We have the number beer through
differentiated brand, pack and liquid has been purpose-built to address various consumer offerings. one profit share position in seven of the world’s top needs and occasions. ten beer profit pools, and we have leading positions Core
superiority Beyond beer in seven of the top ten largest future volume growth We are strengthening our core portfolio by elevating markets. We are innovating to expand the category and our products, positioning, platforms and value meet new consumer
occasions. We have identified proposition. relevant occasions to position our beyond beer Occasions development portfolio, including party mixes (Beats in Brazil), We are expanding beer consumption beyond flavorful and refreshing (Flying Fish and
Brutal Fruit traditional occasions through our no-alcohol in South Africa), light and refreshing (NÜTRL in North America) and bar-quality cocktails (Cutwater Spirits offerings such as Corona Cero, which launched in in North America). 7 markets
in 2023; developing brands focused on the meals occasion such as Stella Artois and Victoria in Mexico and increasing relevance in the in-home 1. Source: Euromonitor 2. Source: company data 3. Source: Plato Logic AB InBev - Annual report 2023 -
22
LETTER TO OUR WHO WE ARE OUR DIVERSIFIED OUR IMPACT SHAREHOLDERS KEY
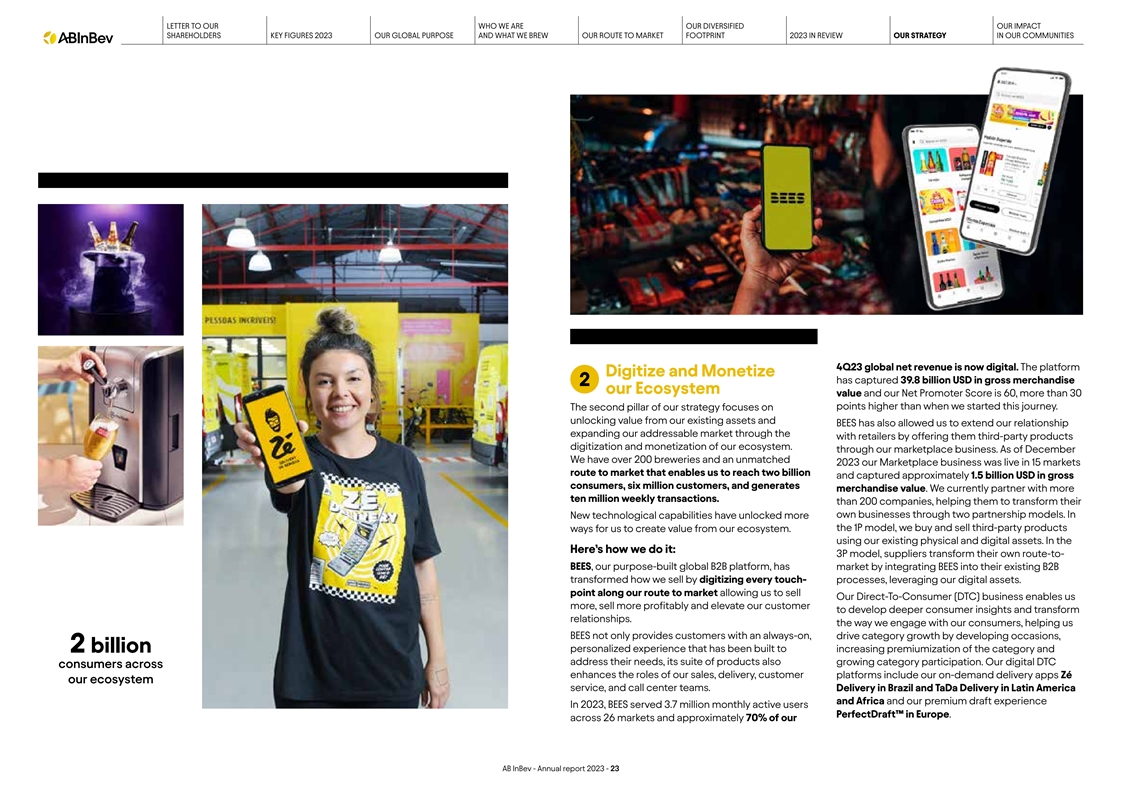
FIGURES 2023 OUR GLOBAL PURPOSE AND WHAT WE BREW OUR ROUTE TO MARKET FOOTPRINT 2023 IN REVIEW OUR STRATEGY IN OUR COMMUNITIES 4Q23 global net revenue is now digital. The platform Digitize and Monetize has captured 39.8 billion USD in gross
merchandise 2 our Ecosystem value and our Net Promoter Score is 60, more than 30 points higher than when we started this journey. The second pillar of our strategy focuses on unlocking value from our existing assets and BEES has also allowed us to
extend our relationship expanding our addressable market through the with retailers by offering them third-party products digitization and monetization of our ecosystem. through our marketplace business. As of December We have over 200 breweries and
an unmatched 2023 our Marketplace business was live in 15 markets route to market that enables us to reach two billion and captured approximately 1.5 billion USD in gross consumers, six million customers, and generates merchandise value. We
currently partner with more ten million weekly transactions. than 200 companies, helping them to transform their New technological capabilities have unlocked more own businesses through two partnership models. In the 1P model, we buy and sell
third-party products ways for us to create value from our ecosystem. using our existing physical and digital assets. In the Here’s how we do it: 3P model, suppliers transform their own route-to- BEES, our purpose-built global B2B platform, has
market by integrating BEES into their existing B2B transformed how we sell by digitizing every touch- processes, leveraging our digital assets. point along our route to market allowing us to sell Our Direct-To-Consumer (DTC) business enables us
more, sell more profitably and elevate our customer to develop deeper consumer insights and transform relationships. the way we engage with our consumers, helping us BEES not only provides customers with an always-on, drive category growth by
developing occasions, personalized experience that has been built to 2 billion increasing premiumization of the category and address their needs, its suite of products also growing category participation. Our digital DTC consumers across enhances
the roles of our sales, delivery, customer platforms include our on-demand delivery apps Zé our ecosystem service, and call center teams. Delivery in Brazil and TaDa Delivery in Latin America and Africa and our premium draft experience In 2023,
BEES served 3.7 million monthly active users PerfectDraft™ in Europe. across 26 markets and approximately 70% of our AB InBev - Annual report 2023 - 23
LETTER TO OUR WHO WE ARE OUR DIVERSIFIED OUR IMPACT SHAREHOLDERS KEY
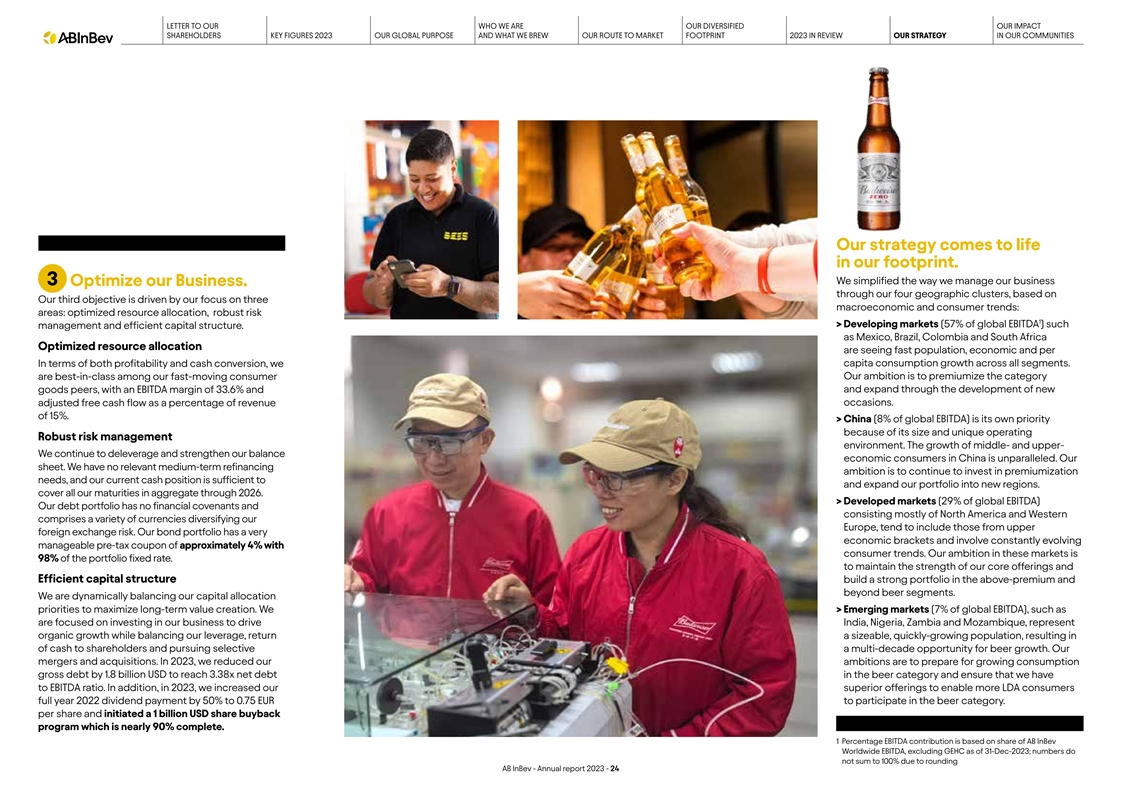
FIGURES 2023 OUR GLOBAL PURPOSE AND WHAT WE BREW OUR ROUTE TO MARKET FOOTPRINT 2023 IN REVIEW OUR STRATEGY IN OUR COMMUNITIES Our strategy comes to life in our footprint. We simplified the way we manage our business 3 Optimize our Business. through
our four geographic clusters, based on Our third objective is driven by our focus on three macroeconomic and consumer trends: areas: optimized resource allocation, robust risk 1 > De veloping markets (57% of global EBITDA ) such management and
efficient capital structure. as Mexico, Brazil, Colombia and South Africa Optimized resource allocation are seeing fast population, economic and per In terms of both profitability and cash conversion, we capita consumption growth across all
segments. are best-in-class among our fast-moving consumer Our ambition is to premiumize the category goods peers, with an EBITDA margin of 33.6% and and expand through the development of new occasions. adjusted free cash flow as a percentage of
revenue of 15%. > China (8% of global EBITDA) is its own priority because of its size and unique operating Robust risk management environment. The growth of middle- and upper- We continue to deleverage and strengthen our balance economic
consumers in China is unparalleled. Our sheet. We have no relevant medium-term refinancing ambition is to continue to invest in premiumization needs, and our current cash position is sufficient to and expand our portfolio into new regions. cover all
our maturities in aggregate through 2026. > De veloped markets (29% of global EBITDA) Our debt portfolio has no financial covenants and consisting mostly of North America and Western comprises a variety of currencies diversifying our Europe, tend
to include those from upper foreign exchange risk. Our bond portfolio has a very economic brackets and involve constantly evolving manageable pre-tax coupon of approximately 4% with consumer trends. Our ambition in these markets is 98% of the
portfolio fixed rate. to maintain the strength of our core offerings and Efficient capital structure build a strong portfolio in the above-premium and beyond beer segments. We are dynamically balancing our capital allocation priorities to maximize
long-term value creation. We > Emer ging markets (7% of global EBITDA), such as are focused on investing in our business to drive India, Nigeria, Zambia and Mozambique, represent organic growth while balancing our leverage, return a sizeable,
quickly-growing population, resulting in of cash to shareholders and pursuing selective a multi-decade opportunity for beer growth. Our mergers and acquisitions. In 2023, we reduced our ambitions are to prepare for growing consumption gross debt by
1.8 billion USD to reach 3.38x net debt in the beer category and ensure that we have to EBITDA ratio. In addition, in 2023, we increased our superior offerings to enable more LDA consumers full year 2022 dividend payment by 50% to 0.75 EUR to
participate in the beer category. per share and initiated a 1 billion USD share buyback program which is nearly 90% complete. 1 Percentage EBITDA contribution is based on share of AB InBev Worldwide EBITDA, excluding GEHC as of 31-Dec-2023; numbers
do not sum to 100% due to rounding AB InBev - Annual report 2023 - 24
LETTER TO OUR WHO WE ARE OUR DIVERSIFIED OUR IMPACT SHAREHOLDERS KEY
FIGURES 2023 OUR GLOBAL PURPOSE AND WHAT WE BREW OUR ROUTE TO MARKET FOOTPRINT 2023 IN REVIEW OUR STRATEGY IN OUR COMMUNITIES LEAD AND GROW THE CATEGORY 3 1 Optimize Lead and Our Grow the Business Category 2 Digitize and Monetize Our Ecosystem AB
InBev - Annual report 2023 - 25
LETTER TO OUR WHO WE ARE OUR DIVERSIFIED OUR IMPACT SHAREHOLDERS KEY
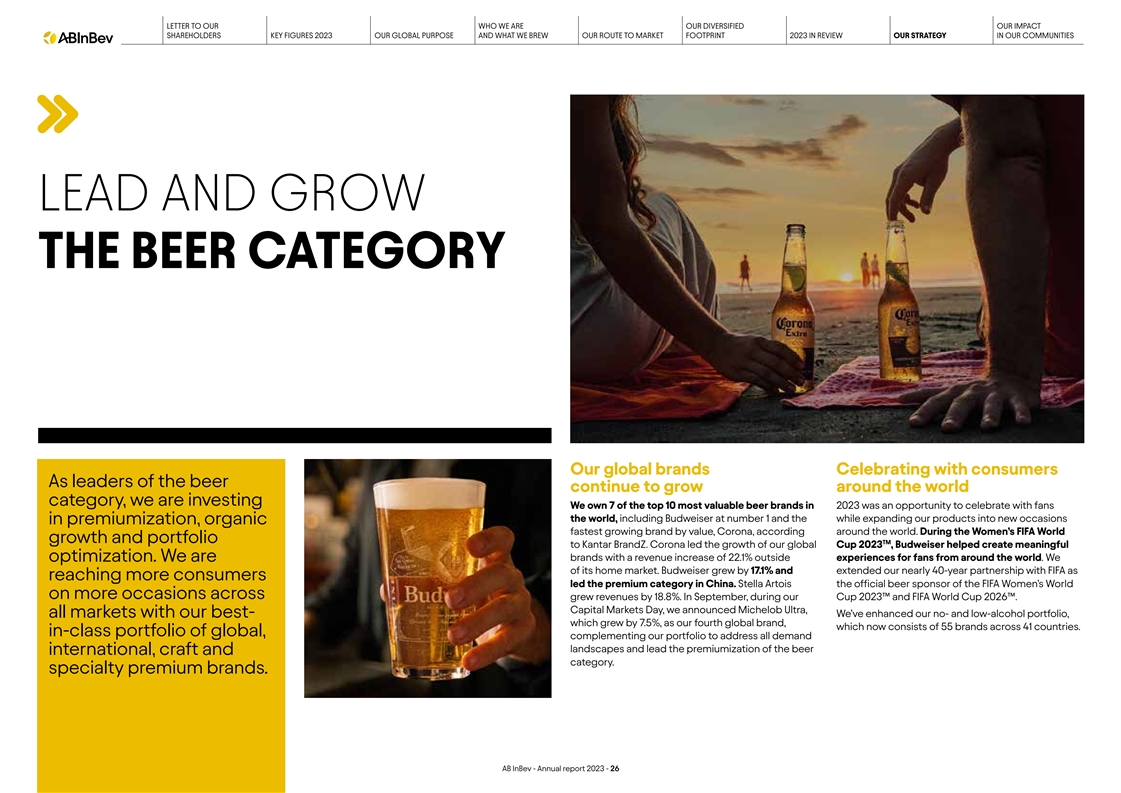
FIGURES 2023 OUR GLOBAL PURPOSE AND WHAT WE BREW OUR ROUTE TO MARKET FOOTPRINT 2023 IN REVIEW OUR STRATEGY IN OUR COMMUNITIES LEAD AND GROW THE BEER CATEGORY Our global brands Celebrating with consumers As leaders of the beer continue to grow around
the world category, we are investing We own 7 of the top 10 most valuable beer brands in 2023 was an opportunity to celebrate with fans the world, including Budweiser at number 1 and the while expanding our products into new occasions in
premiumization, organic fastest growing brand by value, Corona, according around the world. During the Women’s FIFA World growth and portfolio TM to Kantar BrandZ. Corona led the growth of our global Cup 2023 , Budweiser helped create
meaningful brands with a revenue increase of 22.1% outside experiences for fans from around the world. We optimization. We are of its home market. Budweiser grew by 17.1% and extended our nearly 40-year partnership with FIFA as reaching more
consumers led the premium category in China. Stella Artois the official beer sponsor of the FIFA Women’s World on more occasions across grew revenues by 18.8%. In September, during our Cup 2023™ and FIFA World Cup 2026™. Capital
Markets Day, we announced Michelob Ultra, We’ve enhanced our no- and low-alcohol portfolio, all markets with our best- which grew by 7.5%, as our fourth global brand, which now consists of 55 brands across 41 countries. in-class portfolio of
global, complementing our portfolio to address all demand landscapes and lead the premiumization of the beer international, craft and category. specialty premium brands. AB InBev - Annual report 2023 - 26
LETTER TO OUR WHO WE ARE OUR DIVERSIFIED OUR IMPACT SHAREHOLDERS KEY
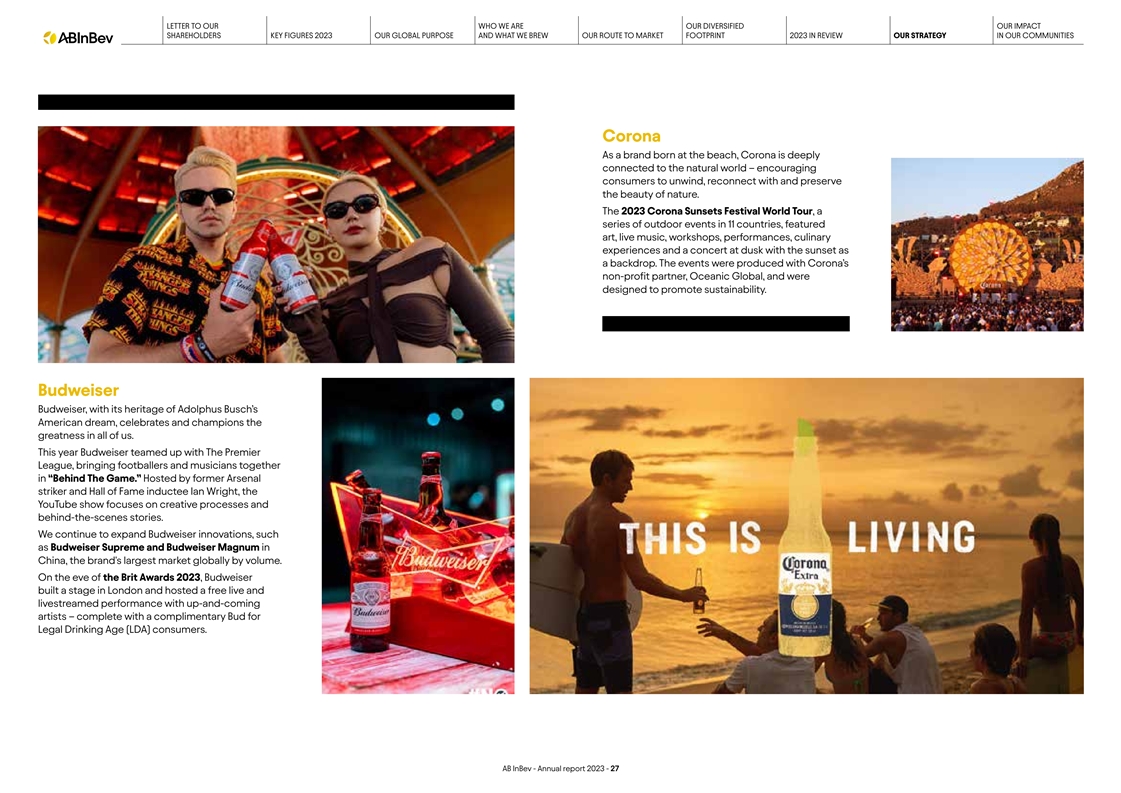
FIGURES 2023 OUR GLOBAL PURPOSE AND WHAT WE BREW OUR ROUTE TO MARKET FOOTPRINT 2023 IN REVIEW OUR STRATEGY IN OUR COMMUNITIES Corona As a brand born at the beach, Corona is deeply connected to the natural world – encouraging consumers to
unwind, reconnect with and preserve the beauty of nature. The 2023 Corona Sunsets Festival World Tour, a series of outdoor events in 11 countries, featured art, live music, workshops, performances, culinary experiences and a concert at dusk with the
sunset as a backdrop. The events were produced with Corona’s non-profit partner, Oceanic Global, and were designed to promote sustainability. Budweiser Budweiser, with its heritage of Adolphus Busch’s American dream, celebrates and
champions the greatness in all of us. This year Budweiser teamed up with The Premier League, bringing footballers and musicians together in “Behind The Game.” Hosted by former Arsenal striker and Hall of Fame inductee Ian Wright, the
YouTube show focuses on creative processes and behind-the-scenes stories. We continue to expand Budweiser innovations, such as Budweiser Supreme and Budweiser Magnum in China, the brand's largest market globally by volume. On the eve of the Brit
Awards 2023, Budweiser built a stage in London and hosted a free live and livestreamed performance with up-and-coming artists – complete with a complimentary Bud for Legal Drinking Age (LDA) consumers. AB InBev - Annual report 2023 -
27
LETTER TO OUR WHO WE ARE OUR DIVERSIFIED OUR IMPACT SHAREHOLDERS KEY
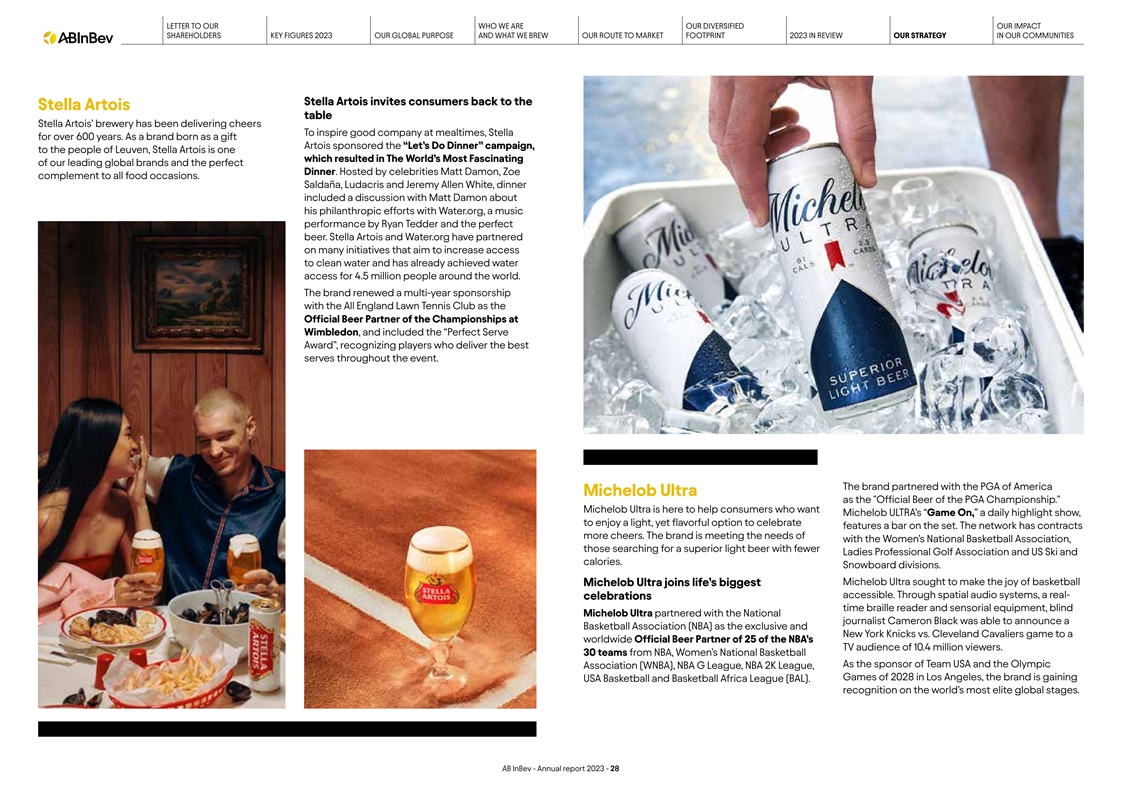
FIGURES 2023 OUR GLOBAL PURPOSE AND WHAT WE BREW OUR ROUTE TO MARKET FOOTPRINT 2023 IN REVIEW OUR STRATEGY IN OUR COMMUNITIES Stella Artois invites consumers back to the Stella Artois table Stella Artois’ brewery has been delivering cheers To
inspire good company at mealtimes, Stella for over 600 years. As a brand born as a gift Artois sponsored the “Let’s Do Dinner” campaign, to the people of Leuven, Stella Artois is one which resulted in The World’s Most
Fascinating of our leading global brands and the perfect Dinner. Hosted by celebrities Matt Damon, Zoe complement to all food occasions. Saldaña, Ludacris and Jeremy Allen White, dinner included a discussion with Matt Damon about his
philanthropic efforts with Water.org, a music performance by Ryan Tedder and the perfect beer. Stella Artois and Water.org have partnered on many initiatives that aim to increase access to clean water and has already achieved water access for 4.5
million people around the world. The brand renewed a multi-year sponsorship with the All England Lawn Tennis Club as the Official Beer Partner of the Championships at Wimbledon, and included the “Perfect Serve Award”, recognizing players
who deliver the best serves throughout the event. The brand partnered with the PGA of America Michelob Ultra as the Official Beer of the PGA Championship. Michelob Ultra is here to help consumers who want Michelob ULTRA’s “Game
On,” a daily highlight show, to enjoy a light, yet flavorful option to celebrate features a bar on the set. The network has contracts more cheers. The brand is meeting the needs of with the Women’s National Basketball Association, those
searching for a superior light beer with fewer Ladies Professional Golf Association and US Ski and calories. Snowboard divisions. Michelob Ultra sought to make the joy of basketball Michelob Ultra joins life’s biggest accessible. Through
spatial audio systems, a real- celebrations time braille reader and sensorial equipment, blind Michelob Ultra partnered with the National journalist Cameron Black was able to announce a Basketball Association (NBA) as the exclusive and New York
Knicks vs. Cleveland Cavaliers game to a worldwide Official Beer Partner of 25 of the NBA’s TV audience of 10.4 million viewers. 30 teams from NBA, Women’s National Basketball As the sponsor of Team USA and the Olympic Association
(WNBA), NBA G League, NBA 2K League, Games of 2028 in Los Angeles, the brand is gaining USA Basketball and Basketball Africa League (BAL). recognition on the world’s most elite global stages. AB InBev - Annual report 2023 - 28
LETTER TO OUR WHO WE ARE OUR DIVERSIFIED OUR IMPACT SHAREHOLDERS KEY
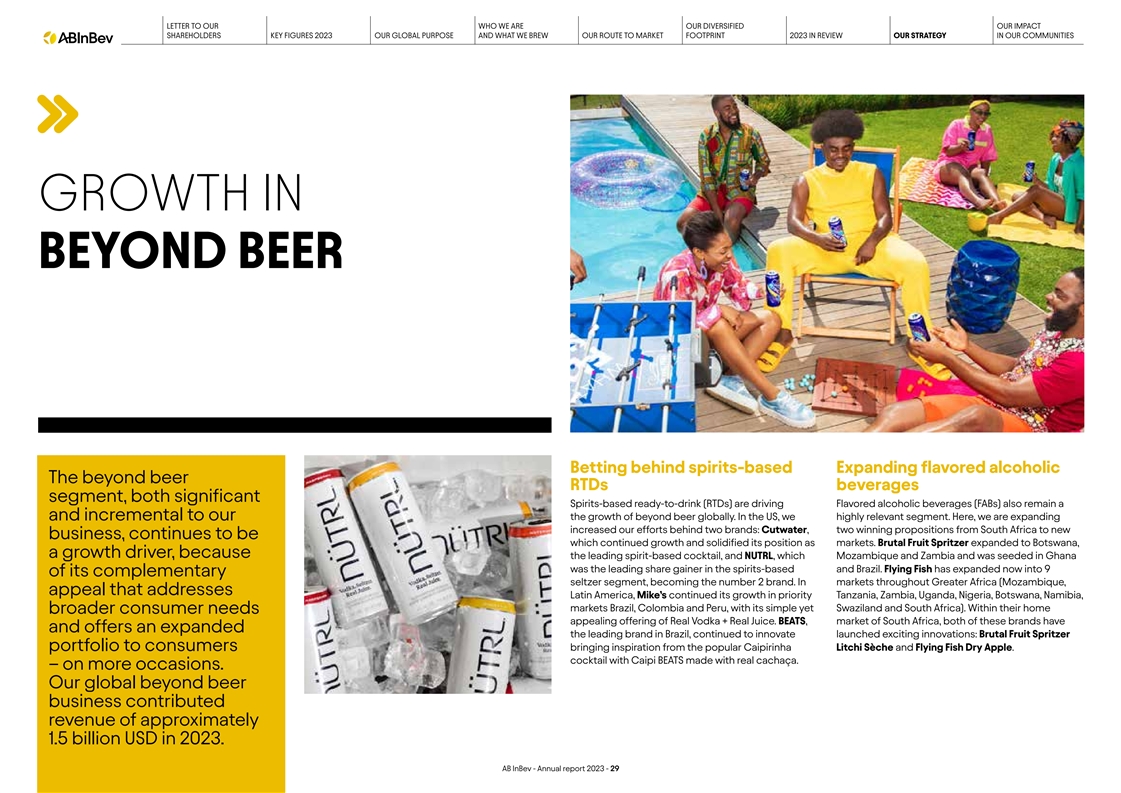
FIGURES 2023 OUR GLOBAL PURPOSE AND WHAT WE BREW OUR ROUTE TO MARKET FOOTPRINT 2023 IN REVIEW OUR STRATEGY IN OUR COMMUNITIES GROWTH IN BEYOND BEER Betting behind spirits-based Expanding flavored alcoholic The beyond beer RTDs beverages segment,
both significant Spirits-based ready-to-drink (RTDs) are driving Flavored alcoholic beverages (FABs) also remain a the growth of beyond beer globally. In the US, we highly relevant segment. Here, we are expanding and incremental to our increased our
efforts behind two brands: Cutwater, two winning propositions from South Africa to new business, continues to be which continued growth and solidified its position as markets. Brutal Fruit Spritzer expanded to Botswana, a growth driver, because the
leading spirit-based cocktail, and NUTRL, which Mozambique and Zambia and was seeded in Ghana was the leading share gainer in the spirits-based and Brazil. Flying Fish has expanded now into 9 of its complementary seltzer segment, becoming the number
2 brand. In markets throughout Greater Africa (Mozambique, appeal that addresses Latin America, Mike’s continued its growth in priority Tanzania, Zambia, Uganda, Nigeria, Botswana, Namibia, markets Brazil, Colombia and Peru, with its simple
yet Swaziland and South Africa). Within their home broader consumer needs appealing offering of Real Vodka + Real Juice. BEATS, market of South Africa, both of these brands have and offers an expanded the leading brand in Brazil, continued to
innovate launched exciting innovations: Brutal Fruit Spritzer bringing inspiration from the popular Caipirinha Litchi Sèche and Flying Fish Dry Apple. portfolio to consumers cocktail with Caipi BEATS made with real cachaça. – on more
occasions. Our global beyond beer business contributed revenue of approximately 1.5 billion USD in 2023. AB InBev - Annual report 2023 - 29
LETTER TO OUR WHO WE ARE OUR DIVERSIFIED OUR IMPACT SHAREHOLDERS KEY
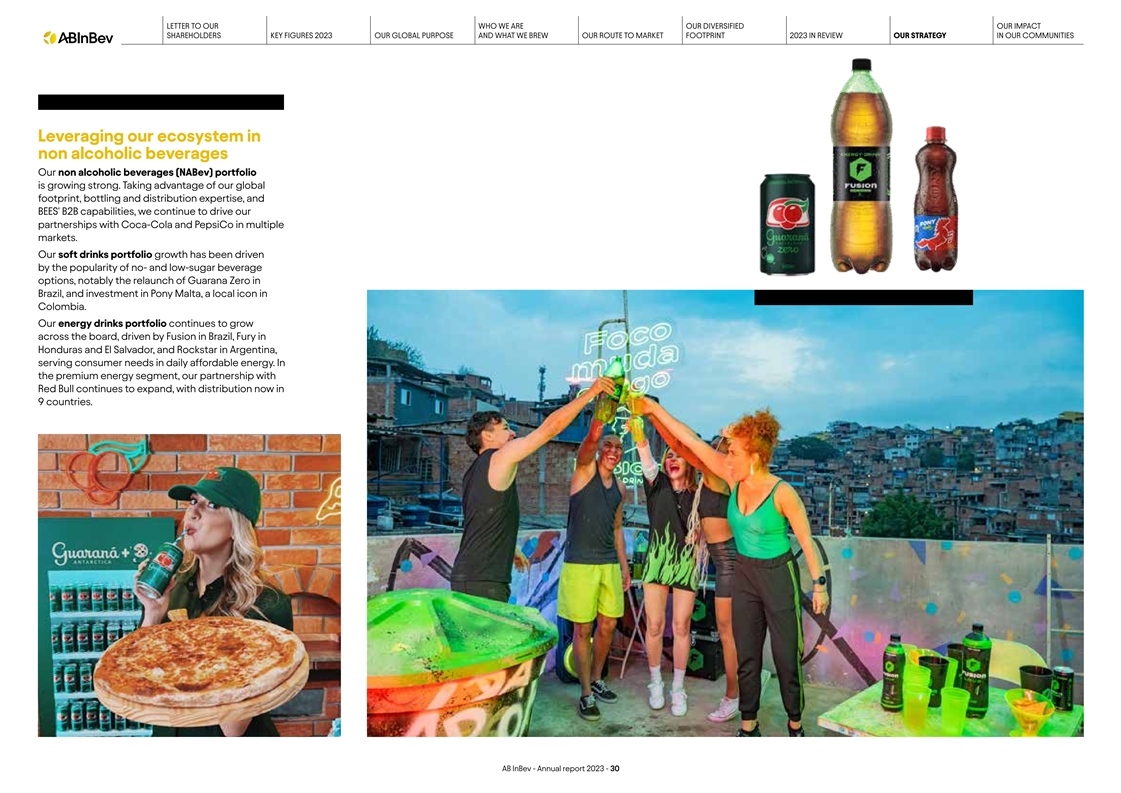
FIGURES 2023 OUR GLOBAL PURPOSE AND WHAT WE BREW OUR ROUTE TO MARKET FOOTPRINT 2023 IN REVIEW OUR STRATEGY IN OUR COMMUNITIES Leveraging our ecosystem in non alcoholic beverages Our non alcoholic beverages (NABev) portfolio is growing strong. Taking
advantage of our global footprint, bottling and distribution expertise, and BEES' B2B capabilities, we continue to drive our partnerships with Coca-Cola and PepsiCo in multiple markets. Our soft drinks portfolio growth has been driven by the
popularity of no- and low-sugar beverage options, notably the relaunch of Guarana Zero in Brazil, and investment in Pony Malta, a local icon in Colombia. Our energy drinks portfolio continues to grow across the board, driven by Fusion in Brazil,
Fury in Honduras and El Salvador, and Rockstar in Argentina, serving consumer needs in daily affordable energy. In the premium energy segment, our partnership with Red Bull continues to expand, with distribution now in 9 countries. AB InBev - Annual
report 2023 - 30
LETTER TO OUR WHO WE ARE OUR DIVERSIFIED OUR IMPACT SHAREHOLDERS KEY
FIGURES 2023 OUR GLOBAL PURPOSE AND WHAT WE BREW OUR ROUTE TO MARKET FOOTPRINT 2023 IN REVIEW OUR STRATEGY IN OUR COMMUNITIES DIGITIZE AND 2023 MONETIZE IN REVIEW OUR ECOSYSTEM 3 1 Optimize Lead and Our Grow the Business Category 2 Digitize and
Monetize Our Ecosystem AB InBev - Annual report 2023 - 31
LETTER TO OUR WHO WE ARE OUR DIVERSIFIED OUR IMPACT SHAREHOLDERS KEY
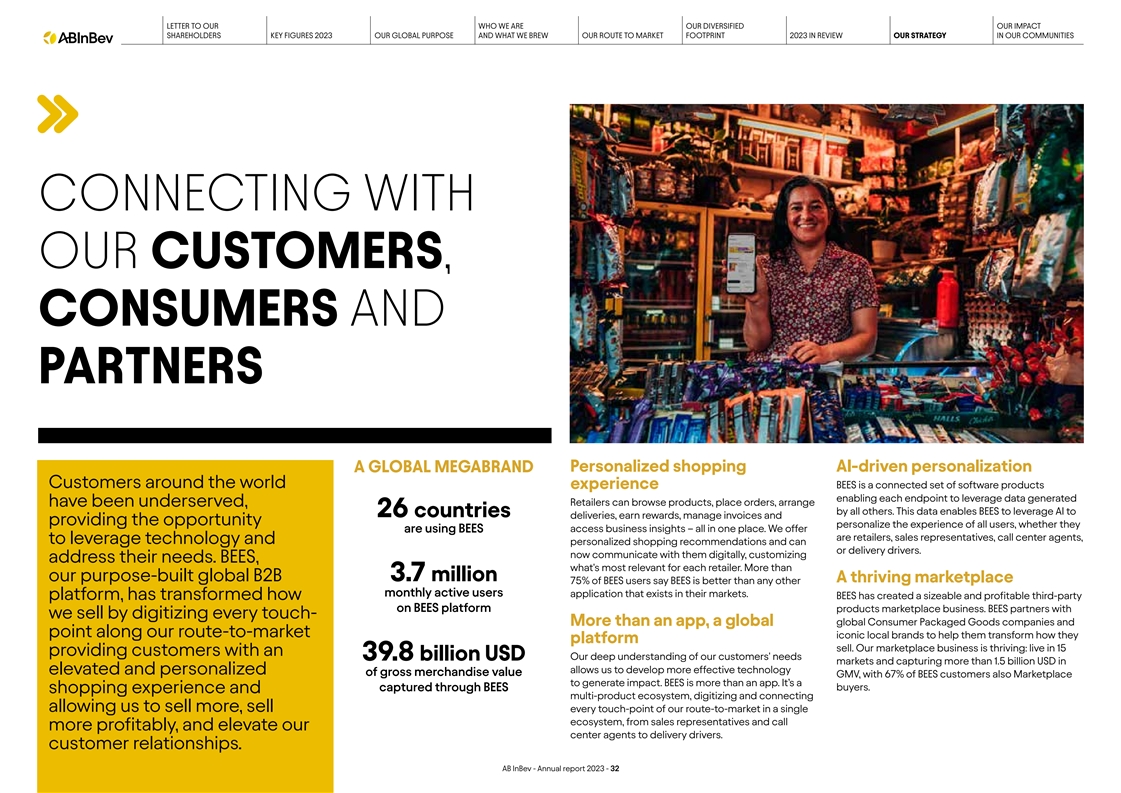
FIGURES 2023 OUR GLOBAL PURPOSE AND WHAT WE BREW OUR ROUTE TO MARKET FOOTPRINT 2023 IN REVIEW OUR STRATEGY IN OUR COMMUNITIES CONNECTING WITH OUR CUSTOMERS, CONSUMERS AND PARTNERS A GLOBAL MEGABRAND Personalized shopping AI-driven personalization
Customers around the world experience BEES is a connected set of software products enabling each endpoint to leverage data generated have been underserved, Retailers can browse products, place orders, arrange by all others. This data enables BEES to
leverage AI to 26 countries deliveries, earn rewards, manage invoices and providing the opportunity personalize the experience of all users, whether they access business insights – all in one place. We offer are using BEES are retailers, sales
representatives, call center agents, to leverage technology and personalized shopping recommendations and can or delivery drivers. now communicate with them digitally, customizing address their needs. BEES, what's most relevant for each retailer.
More than our purpose-built global B2B 3.7 million A thriving marketplace 75% of BEES users say BEES is better than any other monthly active users application that exists in their markets. platform, has transformed how BEES has created a sizeable
and profitable third-party on BEES platform products marketplace business. BEES partners with we sell by digitizing every touch- global Consumer Packaged Goods companies and More than an app, a global point along our route-to-market iconic local
brands to help them transform how they platform sell. Our marketplace business is thriving: live in 15 providing customers with an Our deep understanding of our customers' needs 39.8 billion USD markets and capturing more than 1.5 billion USD in
allows us to develop more effective technology elevated and personalized of gross merchandise value GMV, with 67% of BEES customers also Marketplace to generate impact. BEES is more than an app. It’s a buyers. captured through BEES shopping
experience and multi-product ecosystem, digitizing and connecting allowing us to sell more, sell every touch-point of our route-to-market in a single ecosystem, from sales representatives and call more profitably, and elevate our center agents to
delivery drivers. customer relationships. AB InBev - Annual report 2023 - 32
LETTER TO OUR WHO WE ARE OUR DIVERSIFIED OUR IMPACT SHAREHOLDERS KEY
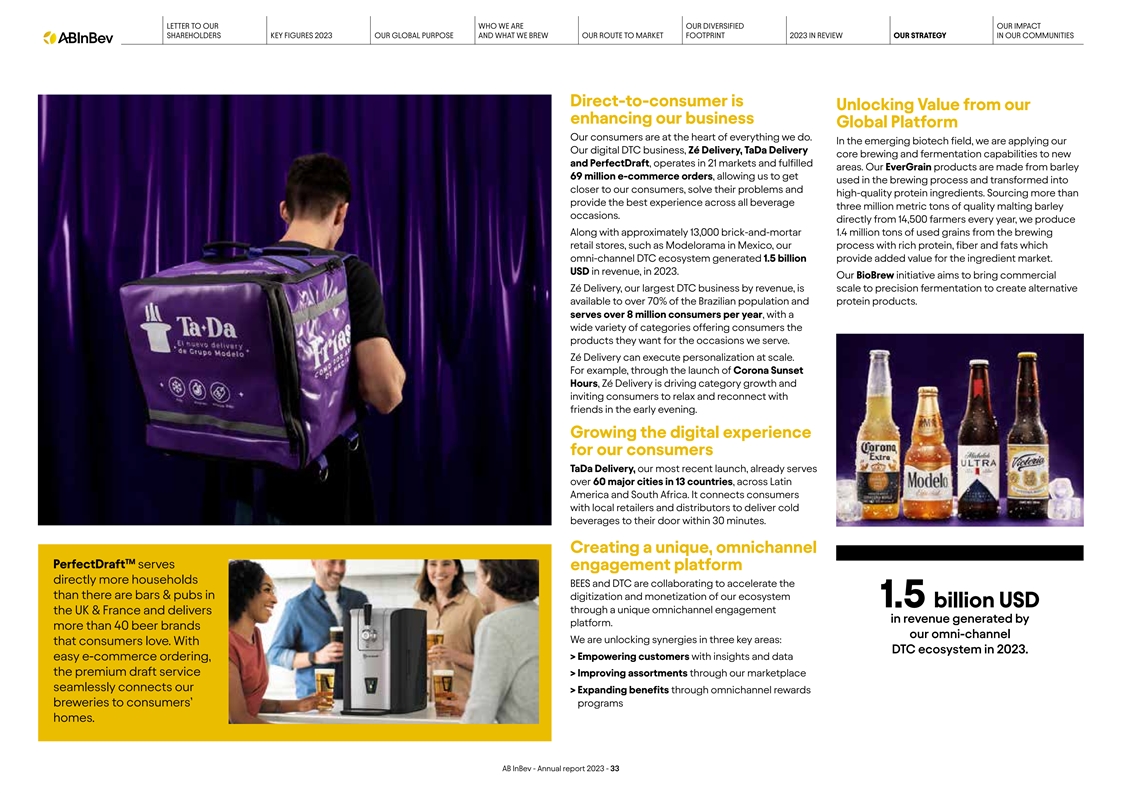
FIGURES 2023 OUR GLOBAL PURPOSE AND WHAT WE BREW OUR ROUTE TO MARKET FOOTPRINT 2023 IN REVIEW OUR STRATEGY IN OUR COMMUNITIES Direct-to-consumer is Unlocking Value from our enhancing our business Global Platform Our consumers are at the heart of
everything we do. In the emerging biotech field, we are applying our Our digital DTC business, Zé Delivery, TaDa Delivery core brewing and fermentation capabilities to new and PerfectDraft, operates in 21 markets and fulfilled areas. Our
EverGrain products are made from barley 69 million e-commerce orders, allowing us to get used in the brewing process and transformed into closer to our consumers, solve their problems and high-quality protein ingredients. Sourcing more than provide
the best experience across all beverage three million metric tons of quality malting barley occasions. directly from 14,500 farmers every year, we produce Along with approximately 13,000 brick-and-mortar 1.4 million tons of used grains from the
brewing retail stores, such as Modelorama in Mexico, our process with rich protein, fiber and fats which omni-channel DTC ecosystem generated 1.5 billion provide added value for the ingredient market. USD in revenue, in 2023. Our BioBrew initiative
aims to bring commercial Zé Delivery, our largest DTC business by revenue, is scale to precision fermentation to create alternative available to over 70% of the Brazilian population and protein products. serves over 8 million consumers per
year, with a wide variety of categories offering consumers the products they want for the occasions we serve. Zé Delivery can execute personalization at scale. For example, through the launch of Corona Sunset Hours, Zé Delivery is driving
category growth and inviting consumers to relax and reconnect with friends in the early evening. Growing the digital experience for our consumers TaDa Delivery, our most recent launch, already serves over 60 major cities in 13 countries, across
Latin America and South Africa. It connects consumers with local retailers and distributors to deliver cold beverages to their door within 30 minutes. Creating a unique, omnichannel TM PerfectDraft serves engagement platform directly more households
BEES and DTC are collaborating to accelerate the than there are bars & pubs in digitization and monetization of our ecosystem 1.5 billion USD through a unique omnichannel engagement the UK & France and delivers in revenue generated by
platform. more than 40 beer brands our omni-channel We are unlocking synergies in three key areas: that consumers love. With DTC ecosystem in 2023. > Empowering customers with insights and data easy e-commerce ordering, the premium draft service
> Improving assortments through our marketplace seamlessly connects our > Expanding benefits through omnichannel rewards breweries to consumers’ programs homes. AB InBev - Annual report 2023 - 33
LETTER TO OUR WHO WE ARE OUR DIVERSIFIED OUR IMPACT SHAREHOLDERS KEY
FIGURES 2023 OUR GLOBAL PURPOSE AND WHAT WE BREW OUR ROUTE TO MARKET FOOTPRINT 2023 IN REVIEW OUR STRATEGY IN OUR COMMUNITIES OPTIMIZE 2023 OUR BUSINESS IN REVIEW 3 1 Optimize Lead and Our Grow the Business Category 2 Digitize and Monetize Our
Ecosystem AB InBev - Annual report 2023 - 34
2060 2059 2058 2057 2056 2055 2054 2053 2052 2051 2050 2049 2048 2047
2046 2045 2044 2043 2042 2041 2040 2039 2038 2037 2036 2035 2034 2033 2032 2031 2030 2029 2028 2027 2026 2025 2024 LETTER TO OUR WHO WE ARE OUR DIVERSIFIED OUR IMPACT SHAREHOLDERS KEY FIGURES 2023 OUR GLOBAL PURPOSE AND WHAT WE BREW OUR ROUTE TO
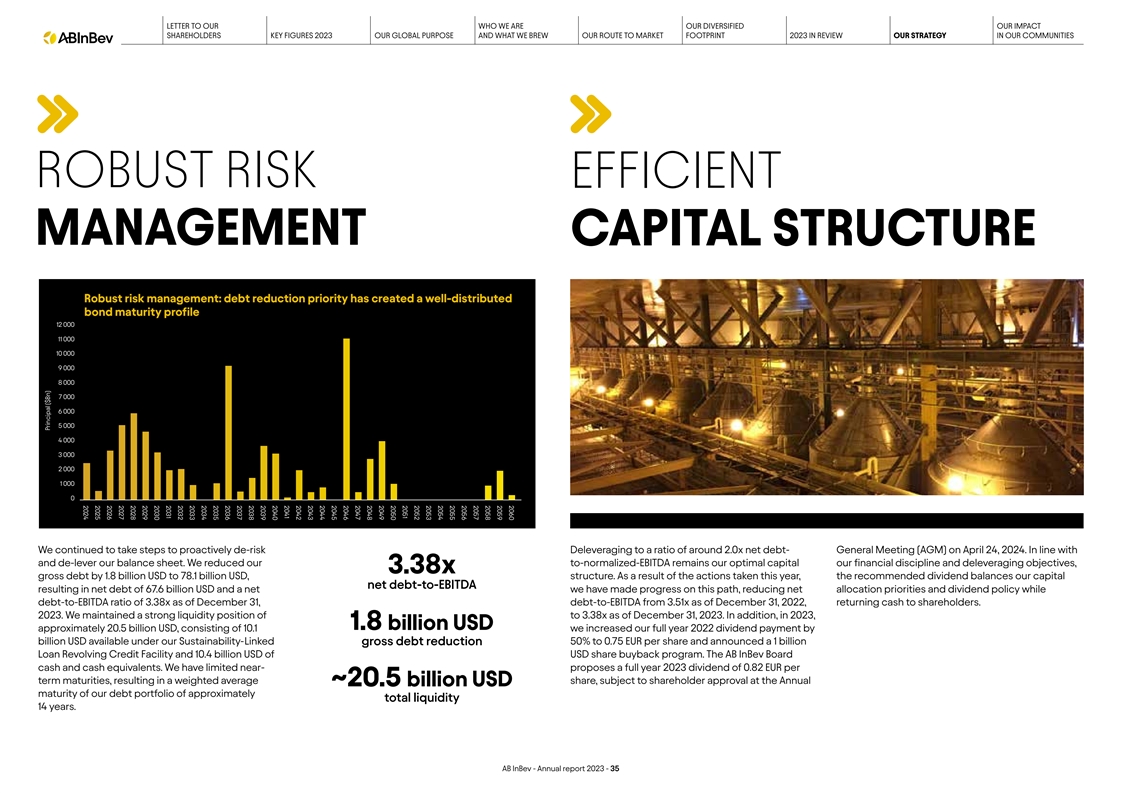
MARKET FOOTPRINT 2023 IN REVIEW OUR STRATEGY IN OUR COMMUNITIES ROBUST RISK EFFICIENT MANAGEMENT CAPITAL STRUCTURE Robust risk management: debt reduction priority has created a well-distributed bond maturity profile 12 000 11 000 10 000 9 000 8 000
7 000 6 000 5 000 4 000 3 000 2 000 1 000 0 We continued to take steps to proactively de-risk Deleveraging to a ratio of around 2.0x net debt- General Meeting (AGM) on April 24, 2024. In line with and de-lever our balance sheet. We reduced our
to-normalized-EBITDA remains our optimal capital our financial discipline and deleveraging objectives, 3.38x gross debt by 1.8 billion USD to 78.1 billion USD, structure. As a result of the actions taken this year, the recommended dividend balances
our capital net debt-to-EBITDA resulting in net debt of 67.6 billion USD and a net we have made progress on this path, reducing net allocation priorities and dividend policy while debt-to-EBITDA ratio of 3.38x as of December 31, debt-to-EBITDA from
3.51x as of December 31, 2022, returning cash to shareholders. 2023. We maintained a strong liquidity position of to 3.38x as of December 31, 2023. In addition, in 2023, 1.8 billion USD approximately 20.5 billion USD, consisting of 10.1 we increased
our full year 2022 dividend payment by billion USD available under our Sustainability-Linked gross debt reduction 50% to 0.75 EUR per share and announced a 1 billion Loan Revolving Credit Facility and 10.4 billion USD of USD share buyback program.
The AB InBev Board cash and cash equivalents. We have limited near- proposes a full year 2023 dividend of 0.82 EUR per term maturities, resulting in a weighted average share, subject to shareholder approval at the Annual ~20.5 billion USD maturity
of our debt portfolio of approximately total liquidity 14 years. AB InBev - Annual report 2023 - 35 Principal ($Bn)
LETTER TO OUR WHO WE ARE OUR DIVERSIFIED OUR IMPACT SHAREHOLDERS KEY
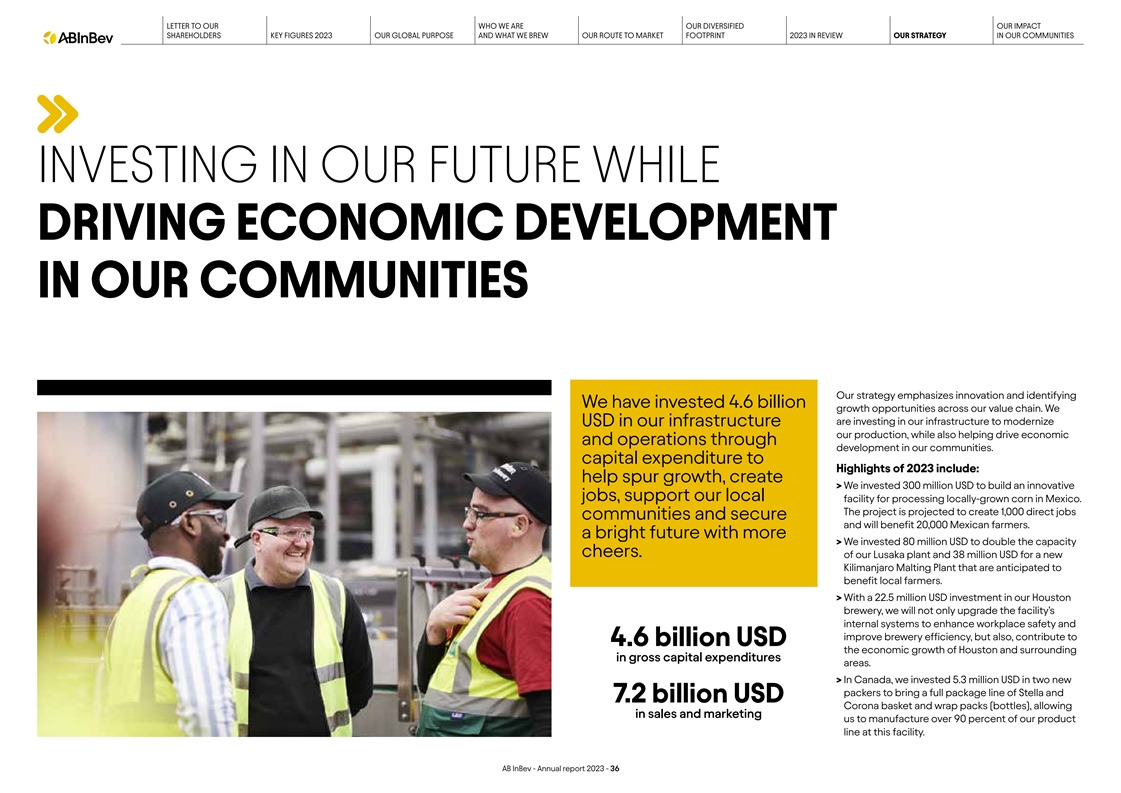
FIGURES 2023 OUR GLOBAL PURPOSE AND WHAT WE BREW OUR ROUTE TO MARKET FOOTPRINT 2023 IN REVIEW OUR STRATEGY IN OUR COMMUNITIES INVESTING IN OUR FUTURE WHILE DRIVING ECONOMIC DEVELOPMENT IN OUR COMMUNITIES Our strategy emphasizes innovation and
identifying We have invested 4.6 billion growth opportunities across our value chain. We are investing in our infrastructure to modernize USD in our infrastructure our production, while also helping drive economic and operations through development
in our communities. capital expenditure to Highlights of 2023 include: help spur growth, create > We invested 300 million USD to build an innovative jobs, support our local facility for processing locally-grown corn in Mexico. The project is
projected to create 1,000 direct jobs communities and secure and will benefit 20,000 Mexican farmers. a bright future with more > W e invested 80 million USD to double the capacity cheers. of our Lusaka plant and 38 million USD for a new
Kilimanjaro Malting Plant that are anticipated to benefit local farmers. > With a 22.5 million USD in vestment in our Houston brewery, we will not only upgrade the facility’s internal systems to enhance workplace safety and improve brewery
efficiency, but also, contribute to 4.6 billion USD the economic growth of Houston and surrounding in gross capital expenditures areas. > In C anada, we invested 5.3 million USD in two new packers to bring a full package line of Stella and 7.2
billion USD Corona basket and wrap packs (bottles), allowing in sales and marketing us to manufacture over 90 percent of our product line at this facility. AB InBev - Annual report 2023 - 36
LETTER TO OUR WHO WE ARE OUR DIVERSIFIED OUR IMPACT SHAREHOLDERS KEY
FIGURES 2023 OUR GLOBAL PURPOSE AND WHAT WE BREW OUR ROUTE TO MARKET FOOTPRINT 2023 IN REVIEW OUR STRATEGY IN OUR COMMUNITIES OUR IMPACT 2023 IN OUR IN REVIEW COMMUNITIES AB InBev - Annual report 2023 - 37
LETTER TO OUR WHO WE ARE OUR DIVERSIFIED OUR IMPACT SHAREHOLDERS KEY
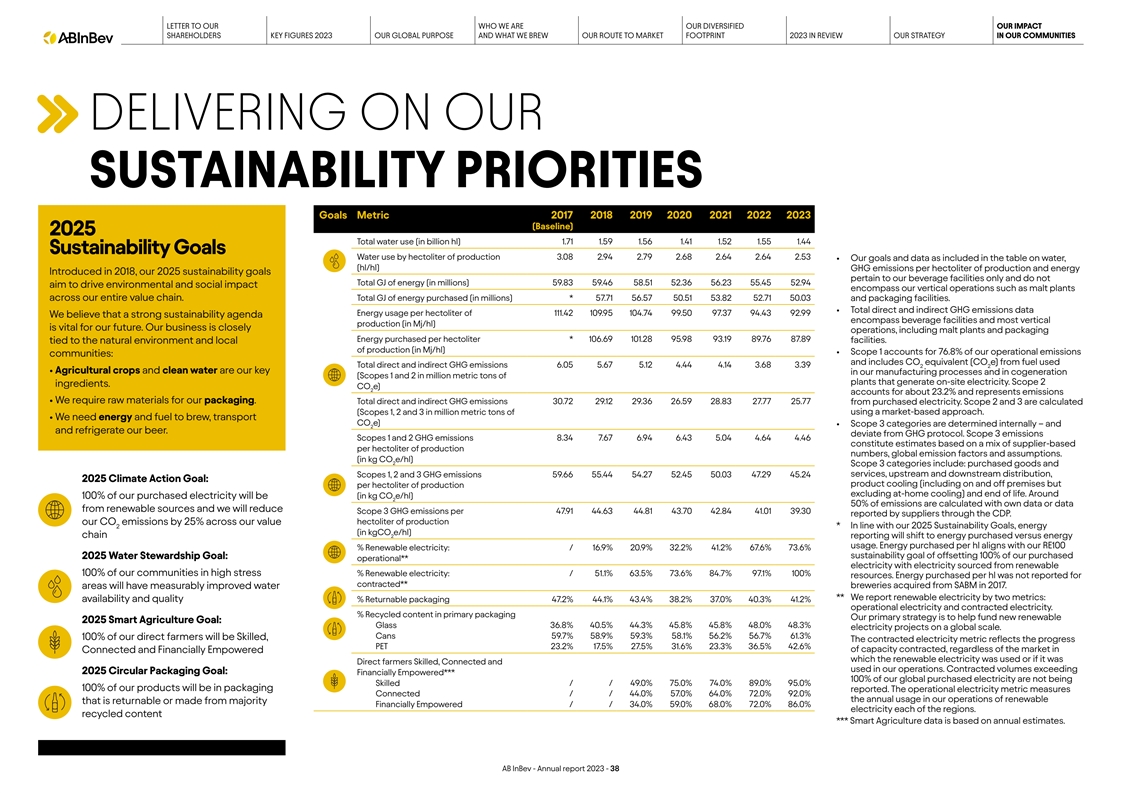
FIGURES 2023 OUR GLOBAL PURPOSE AND WHAT WE BREW OUR ROUTE TO MARKET FOOTPRINT 2023 IN REVIEW OUR STRATEGY IN OUR COMMUNITIES DELIVERING ON OUR SUSTAINABILITY PRIORITIES Goals Metric 2017 2018 2019 2020 2021 2022 2023 (Baseline) 2025 Total water use
(in billion hl) 1.71 1.59 1.56 1.41 1.52 1.55 1.44 Sustainability Goals Water use by hectoliter of production 3.08 2.94 2.79 2.68 2.64 2.64 2.53 • Our goals and data as included in the table on water, (hl/hl) GHG emissions per hectoliter of
production and energy Introduced in 2018, our 2025 sustainability goals pertain to our beverage facilities only and do not Total GJ of energy (in millions) 59.83 59.46 58.51 52.36 56.23 55.45 52.94 aim to drive environmental and social impact
encompass our vertical operations such as malt plants across our entire value chain. Total GJ of energy purchased (in millions) * 57.71 56.57 50.51 53.82 52.71 50.03 and packaging facilities. • Total direct and indirect GHG emissions data
Energy usage per hectoliter of 111.42 109.95 104.74 99.50 97.37 94.43 92.99 We believe that a strong sustainability agenda encompass beverage facilities and most vertical production (in Mj/hl) is vital for our future. Our business is closely
operations, including malt plants and packaging Energy purchased per hectoliter * 106.69 101.28 95.98 93.19 89.76 87.89 facilities. tied to the natural environment and local of production (in Mj/hl) • Scope 1 accounts for 76.8% of our
operational emissions communities: and includes CO equivalent (CO e) from fuel used Total direct and indirect GHG emissions 6.05 5.67 5.12 4.44 4.14 3.68 3.39 2 2 • Agricultur al crops and clean water are our key in our manufacturing processes
and in cogeneration (Scopes 1 and 2 in million metric tons of plants that generate on-site electricity. Scope 2 ingredients. CO e) 2 accounts for about 23.2% and represents emissions • W e require raw materials for our packaging. Total direct
and indirect GHG emissions 30.72 29.12 29.36 26.59 28.83 27.77 25.77 from purchased electricity. Scope 2 and 3 are calculated (Scopes 1, 2 and 3 in million metric tons of using a market-based approach. • We need energy and fuel to brew,
transport CO e) • Scope 3 categories are determined internally – and 2 and refrigerate our beer. deviate from GHG protocol. Scope 3 emissions Scopes 1 and 2 GHG emissions 8.34 7.67 6.94 6.43 5.04 4.64 4.46 constitute estimates based on a
mix of supplier-based per hectoliter of production numbers, global emission factors and assumptions. (in kg CO e/hl) 2 Scope 3 categories include: purchased goods and Scopes 1, 2 and 3 GHG emissions 59.66 55.44 54.27 52.45 50.03 47.29 45.24
services, upstream and downstream distribution, 2025 Climate Action Goal: product cooling (including on and off premises but per hectoliter of production excluding at-home cooling) and end of life. Around 100% of our purchased electricity will be
(in kg CO e/hl) 2 50% of emissions are calculated with own data or data from renewable sources and we will reduce Scope 3 GHG emissions per 47.91 44.63 44.81 43.70 42.84 41.01 39.30 reported by suppliers through the CDP. our CO emissions by 25%
across our value hectoliter of production 2 * In line with our 2025 Sustainability Goals, energy (in kgCO e/hl) chain 2 reporting will shift to energy purchased versus energy usage. Energy purchased per hl aligns with our RE100 % Renewable
electricity: / 16.9% 20.9% 32.2% 41.2% 67.6% 73.6% sustainability goal of offsetting 100% of our purchased 2025 Water Stewardship Goal: operational** electricity with electricity sourced from renewable 100% of our communities in high stress %
Renewable electricity: / 51.1% 63.5% 73.6% 84.7% 97.1% 100% resources. Energy purchased per hl was not reported for contracted** areas will have measurably improved water breweries acquired from SABM in 2017. ** We report renewable electricity by
two metrics: availability and quality % Returnable packaging 47.2% 44.1% 43.4% 38.2% 37.0% 40.3% 41.2% operational electricity and contracted electricity. % Recycled content in primary packaging Our primary strategy is to help fund new renewable
2025 Smart Agriculture Goal: Glass 36.8% 40.5% 44.3% 45.8% 45.8% 48.0% 48.3% electricity projects on a global scale. Cans 59.7% 58.9% 59.3% 58.1% 56.2% 56.7% 61.3% 100% of our direct farmers will be Skilled, The contracted electricity metric
reflects the progress PET 23.2% 17.5% 27.5% 31.6% 23.3% 36.5% 42.6% of capacity contracted, regardless of the market in Connected and Financially Empowered which the renewable electricity was used or if it was Direct farmers Skilled, Connected and
used in our operations. Contracted volumes exceeding 2025 Circular Packaging Goal: Financially Empowered*** 100% of our global purchased electricity are not being Skilled / / 49.0% 75.0% 74.0% 89.0% 95.0% 100% of our products will be in packaging
reported. The operational electricity metric measures Connected / / 44.0% 57.0% 64.0% 72.0% 92.0% the annual usage in our operations of renewable that is returnable or made from majority Financially Empowered / / 34.0% 59.0% 68.0% 72.0% 86.0%
electricity each of the regions. recycled content *** Smart Agricultur e data is based on annual estimates. AB InBev - Annual report 2023 - 38

LETTER TO OUR WHO WE ARE OUR DIVERSIFIED OUR IMPACT SHAREHOLDERS KEY
FIGURES 2023 OUR GLOBAL PURPOSE AND WHAT WE BREW OUR ROUTE TO MARKET FOOTPRINT 2023 IN REVIEW OUR STRATEGY IN OUR COMMUNITIES Climate Action Smart Agriculture We are working to actively decarbonize our global We take a local, farmer-centric approach
to operations, including our breweries and our vertical supporting sustainable agriculture and reaching our operations that produce packaging and brewing Smart Agriculture Goal. material, and continue to scale technologies that In 2023, we worked
with more than 23,500 farmers help us reduce Scope 1 and 2 emissions. In addition, globally. Between 2022 and 2023, the percentage of Scope 3 is where we see the greatest opportunities Skilled farmers increased by 6 percentage points. for emissions
reduction, representing 87% of our The number of Connected farmers increased by emissions in 2023. We continue to engage suppliers 20% percentage points and Financially Empowered through Eclipse, our collaboration platform that farmers increased by
14 percentage points. supports supply chain partners by providing the In Uganda, we piloted a digital training platform that tools needed to measure and track decarbonization allows us to work with remote farmers at scale. We while also building
capabilities and sharing best registered and trained more than 6,000 farmers from practices. six key barley sourcing areas. The trainings covered Our absolute emissions in Scopes 1 and 2 decreased both agricultural and financial topics to help
farmers in 2023 by 44.0% versus a 2017 baseline, a reduction optimize their operations. of 2.66 million metric tons CO e. We also saw a 4.3% 2 reduction in emissions intensity across our value chain (Scopes 1, 2 and 3), going from 47.29 kgCO e/hl 2
in 2022 to 45.24 kgCO e/hl in 2023. 2 Water Stewardship Circular Packaging Water is the number one ingredient in beer and a key We are on a mission to create a more sustainable, resource in the communities where we live and work. circular future. By
focusing on innovative packaging solutions, we drive progress in our industry and As the world’s leading brewer, we are focused on beyond. In 2023, our total volume in returnable finding solutions to global water challenges across packaging
increased by nearly 1% compared to our communities and supply chain. For example, we the previous year. Recycled content across our are partnering with The Nature Conservancy in South packaging materials increased compared to our Africa to support
conservation efforts of the Greater baseline 2017 by almost 12 percentage points Cape Town Water Fund. To date, 278 hectares of for glass, 2 percentage points for cans and 20 invasive species have been cleared in connection with 44.0% percentage
points for PET. the Fund directly linked to AB InBev's contribution. reduction in Scopes 1, 2, An example of how we continued to promote Since 2017, our water efficiency efforts within our and 3 emissions per returnable packaging in 2023 was a
nationwide breweries have resulted in a reduction of water hectoliter of production returnable bottle campaign launched by our consumption by 17.9%, achieving a water efficiency ratio since 2017 business in Brazil to help increase the use of of 2.53
hectoliter/hectoliter across our sites globally. This returnable packaging by promoting affordability and brings us closer to our goal of 2.5 hectoliter/hectoliter sustainability. by 2025. One way we reduced water use in 2023 was by 17.9% installing
new vacuum pump technology in breweries improvements in water across several markets to reduce water usage in bottle fillers by approximately 50%. efficiency since 2017 AB InBev - Annual report 2023 - 39
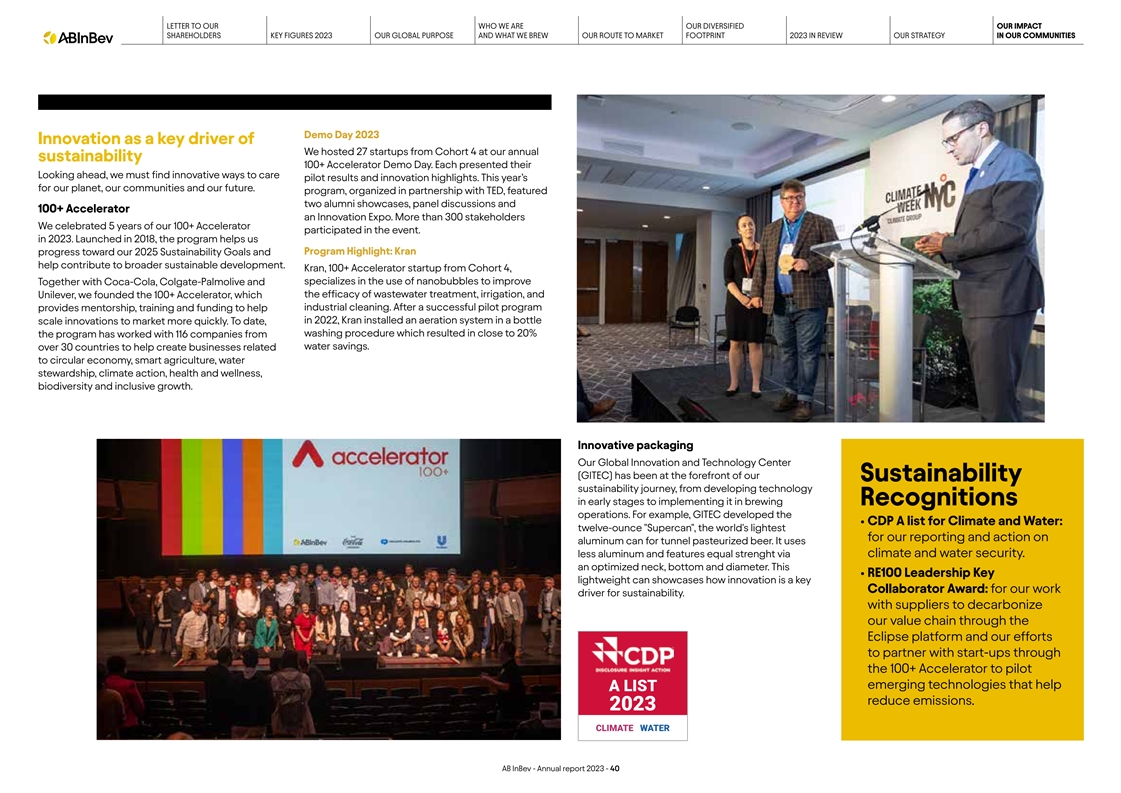
LETTER TO OUR WHO WE ARE OUR DIVERSIFIED OUR IMPACT SHAREHOLDERS KEY
FIGURES 2023 OUR GLOBAL PURPOSE AND WHAT WE BREW OUR ROUTE TO MARKET FOOTPRINT 2023 IN REVIEW OUR STRATEGY IN OUR COMMUNITIES Demo Day 2023 Innovation as a key driver of We hosted 27 startups from Cohort 4 at our annual sustainability 100+
Accelerator Demo Day. Each presented their Looking ahead, we must find innovative ways to care pilot results and innovation highlights. This year’s for our planet, our communities and our future. program, organized in partnership with TED,
featured two alumni showcases, panel discussions and 100+ Accelerator an Innovation Expo. More than 300 stakeholders We celebrated 5 years of our 100+ Accelerator participated in the event. in 2023. Launched in 2018, the program helps us Program
Highlight: Kran progress toward our 2025 Sustainability Goals and help contribute to broader sustainable development. Kran, 100+ Accelerator startup from Cohort 4, specializes in the use of nanobubbles to improve Together with Coca-Cola,
Colgate-Palmolive and the efficacy of wastewater treatment, irrigation, and Unilever, we founded the 100+ Accelerator, which industrial cleaning. After a successful pilot program provides mentorship, training and funding to help scale innovations to
market more quickly. To date, in 2022, Kran installed an aeration system in a bottle the program has worked with 116 companies from washing procedure which resulted in close to 20% water savings. over 30 countries to help create businesses related
to circular economy, smart agriculture, water stewardship, climate action, health and wellness, biodiversity and inclusive growth. Innovative packaging Our Global Innovation and Technology Center (GITEC) has been at the forefront of our
Sustainability sustainability journey, from developing technology in early stages to implementing it in brewing Recognitions operations. For example, GITEC developed the • CDP A list for Climate and Water: twelve-ounce Supercan , the world's
lightest for our reporting and action on aluminum can for tunnel pasteurized beer. It uses less aluminum and features equal strenght via climate and water security. an optimized neck, bottom and diameter. This • RE100 L eadership Key
lightweight can showcases how innovation is a key Collaborator Award: for our work driver for sustainability. with suppliers to decarbonize our value chain through the Eclipse platform and our efforts to partner with start-ups through the 100+
Accelerator to pilot emerging technologies that help A LIST reduce emissions. 2023 CLIMATE WATER AB InBev - Annual report 2023 - 40
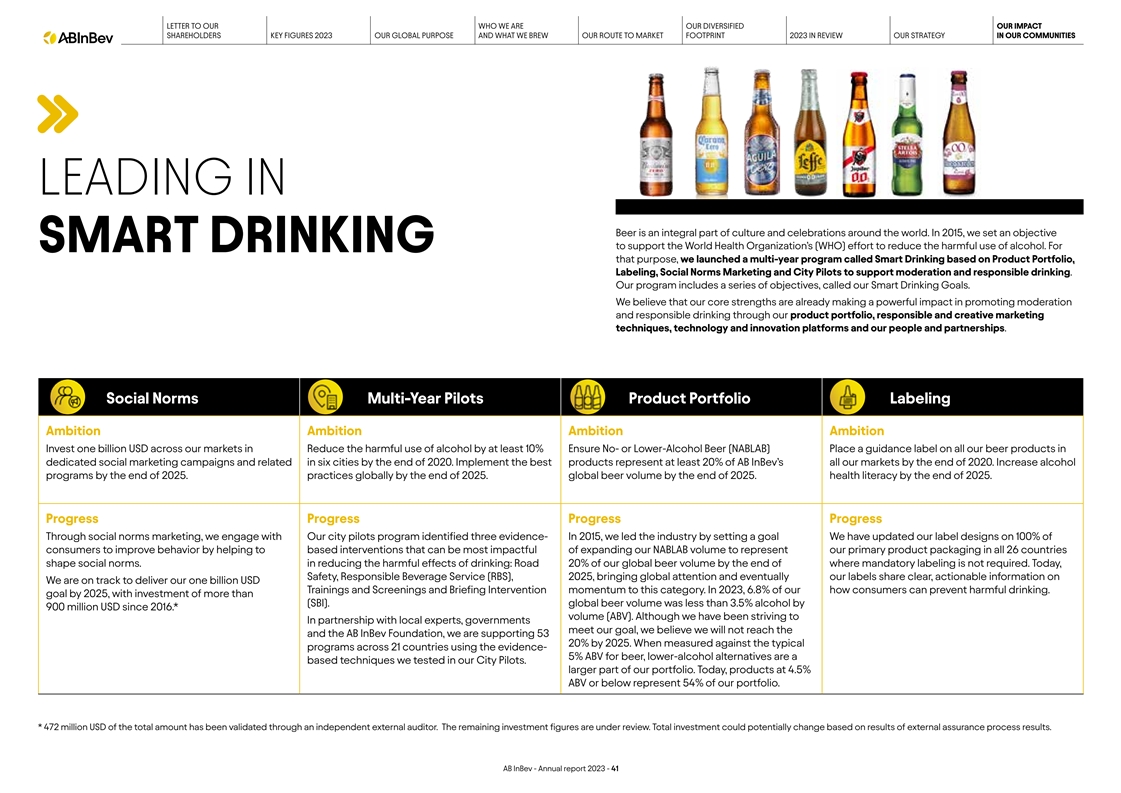
LETTER TO OUR WHO WE ARE OUR DIVERSIFIED OUR IMPACT SHAREHOLDERS KEY
FIGURES 2023 OUR GLOBAL PURPOSE AND WHAT WE BREW OUR ROUTE TO MARKET FOOTPRINT 2023 IN REVIEW OUR STRATEGY IN OUR COMMUNITIES LEADING IN Beer is an integral part of culture and celebrations around the world. In 2015, we set an objective to support
the World Health Organization’s (WHO) effort to reduce the harmful use of alcohol. For SMART DRINKING that purpose, we launched a multi-year program called Smart Drinking based on Product Portfolio, Labeling, Social Norms Marketing and City
Pilots to support moderation and responsible drinking. Our program includes a series of objectives, called our Smart Drinking Goals. We believe that our core strengths are already making a powerful impact in promoting moderation and responsible
drinking through our product portfolio, responsible and creative marketing techniques, technology and innovation platforms and our people and partnerships. Social Norms Multi-Year Pilots Product Portfolio Labeling Ambition Ambition Ambition Ambition
Invest one billion USD across our markets in Reduce the harmful use of alcohol by at least 10% Ensure No- or Lower-Alcohol Beer (NABLAB) Place a guidance label on all our beer products in dedicated social marketing campaigns and related in six
cities by the end of 2020. Implement the best products represent at least 20% of AB InBev’s all our markets by the end of 2020. Increase alcohol programs by the end of 2025. practices globally by the end of 2025. global beer volume by the end
of 2025. health literacy by the end of 2025. Progress Progress Progress Progress Through social norms marketing, we engage with Our city pilots program identified three evidence- In 2015, we led the industry by setting a goal We have updated our
label designs on 100% of consumers to improve behavior by helping to based interventions that can be most impactful of expanding our NABLAB volume to represent our primary product packaging in all 26 countries shape social norms. in reducing the
harmful effects of drinking: Road 20% of our global beer volume by the end of where mandatory labeling is not required. Today, Safety, Responsible Beverage Service (RBS), 2025, bringing global attention and eventually our labels share clear,
actionable information on We are on track to deliver our one billion USD Trainings and Screenings and Briefing Intervention momentum to this category. In 2023, 6.8% of our how consumers can prevent harmful drinking. goal by 2025, with investment of
more than (SBI). global beer volume was less than 3.5% alcohol by 900 million USD since 2016.* volume (ABV). Although we have been striving to In partnership with local experts, governments meet our goal, we believe we will not reach the and the AB
InBev Foundation, we are supporting 53 20% by 2025. When measured against the typical programs across 21 countries using the evidence- 5% ABV for beer, lower-alcohol alternatives are a based techniques we tested in our City Pilots. larger part of
our portfolio. Today, products at 4.5% ABV or below represent 54% of our portfolio. * 472 million USD of the total amount has been validated through an independent external auditor. The remaining investment figures are under review. Total investment
could potentially change based on results of external assurance process results. AB InBev - Annual report 2023 - 41
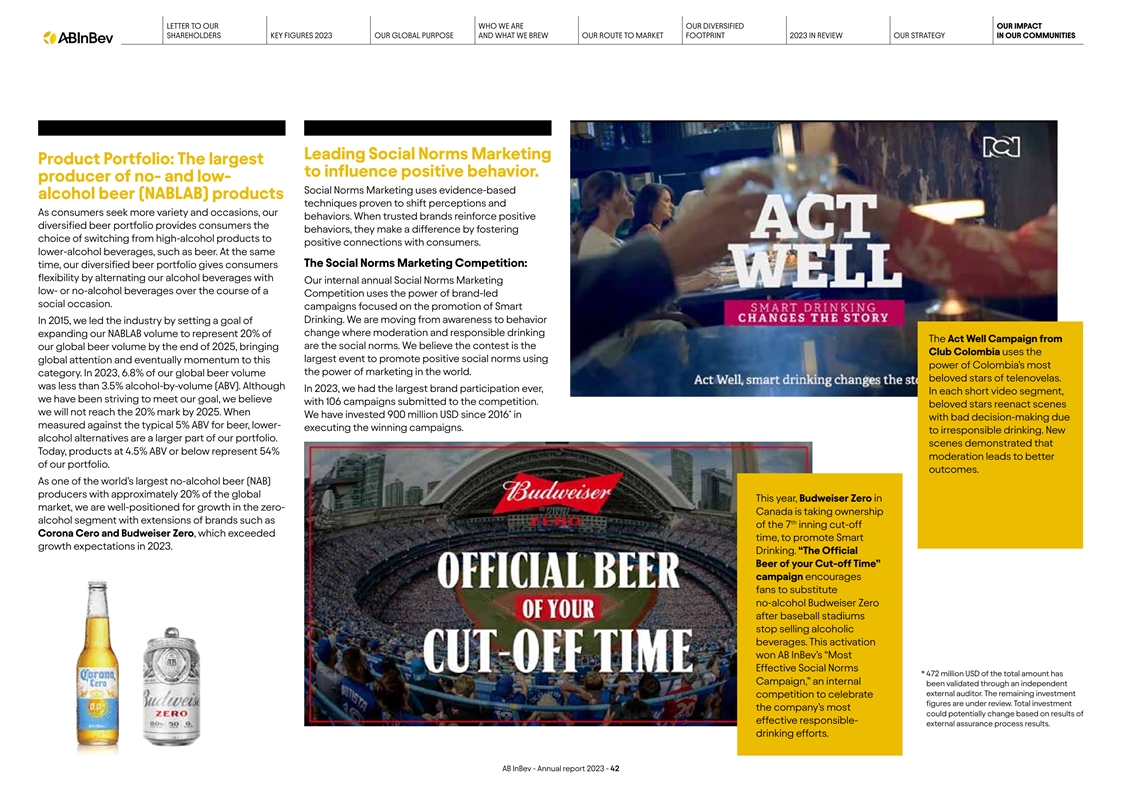
LETTER TO OUR WHO WE ARE OUR DIVERSIFIED OUR IMPACT SHAREHOLDERS KEY
FIGURES 2023 OUR GLOBAL PURPOSE AND WHAT WE BREW OUR ROUTE TO MARKET FOOTPRINT 2023 IN REVIEW OUR STRATEGY IN OUR COMMUNITIES Leading Social Norms Marketing Product Portfolio: The largest to influence positive behavior. producer of no- and low-
Social Norms Marketing uses evidence-based alcohol beer (NABLAB) products techniques proven to shift perceptions and As consumers seek more variety and occasions, our behaviors. When trusted brands reinforce positive diversified beer portfolio
provides consumers the behaviors, they make a difference by fostering choice of switching from high-alcohol products to positive connections with consumers. lower-alcohol beverages, such as beer. At the same The Social Norms Marketing Competition:
time, our diversified beer portfolio gives consumers flexibility by alternating our alcohol beverages with Our internal annual Social Norms Marketing low- or no-alcohol beverages over the course of a Competition uses the power of brand-led social
occasion. campaigns focused on the promotion of Smart Drinking. We are moving from awareness to behavior In 2015, we led the industry by setting a goal of change where moderation and responsible drinking expanding our NABLAB volume to represent 20%
of The Act Well Campaign from are the social norms. We believe the contest is the our global beer volume by the end of 2025, bringing Club Colombia uses the largest event to promote positive social norms using global attention and eventually
momentum to this power of Colombia’s most category. In 2023, 6.8% of our global beer volume the power of marketing in the world. beloved stars of telenovelas. was less than 3.5% alcohol-by-volume (ABV). Although In 2023, we had the largest
brand participation ever, In each short video segment, we have been striving to meet our goal, we believe with 106 campaigns submitted to the competition. beloved stars reenact scenes * we will not reach the 20% mark by 2025. When We have invested
900 million USD since 2016 in with bad decision-making due measured against the typical 5% ABV for beer, lower- executing the winning campaigns. to irresponsible drinking. New alcohol alternatives are a larger part of our portfolio. scenes
demonstrated that Today, products at 4.5% ABV or below represent 54% moderation leads to better of our portfolio. outcomes. As one of the world’s largest no-alcohol beer (NAB) producers with approximately 20% of the global This year, Budweiser
Zero in market, we are well-positioned for growth in the zero- Canada is taking ownership alcohol segment with extensions of brands such as th of the 7 inning cut-off Corona Cero and Budweiser Zero, which exceeded time, to promote Smart growth
expectations in 2023. Drinking. “The Official Beer of your Cut-off Time” campaign encourages fans to substitute no-alcohol Budweiser Zero after baseball stadiums stop selling alcoholic beverages. This activation won AB InBev’s
“Most Effective Social Norms * 4 72 million USD of the total amount has Campaign,” an internal been validated through an independent external auditor. The remaining investment competition to celebrate figures are under review. Total
investment the company’s most could potentially change based on results of effective responsible- external assurance process results. drinking efforts. AB InBev - Annual report 2023 - 42
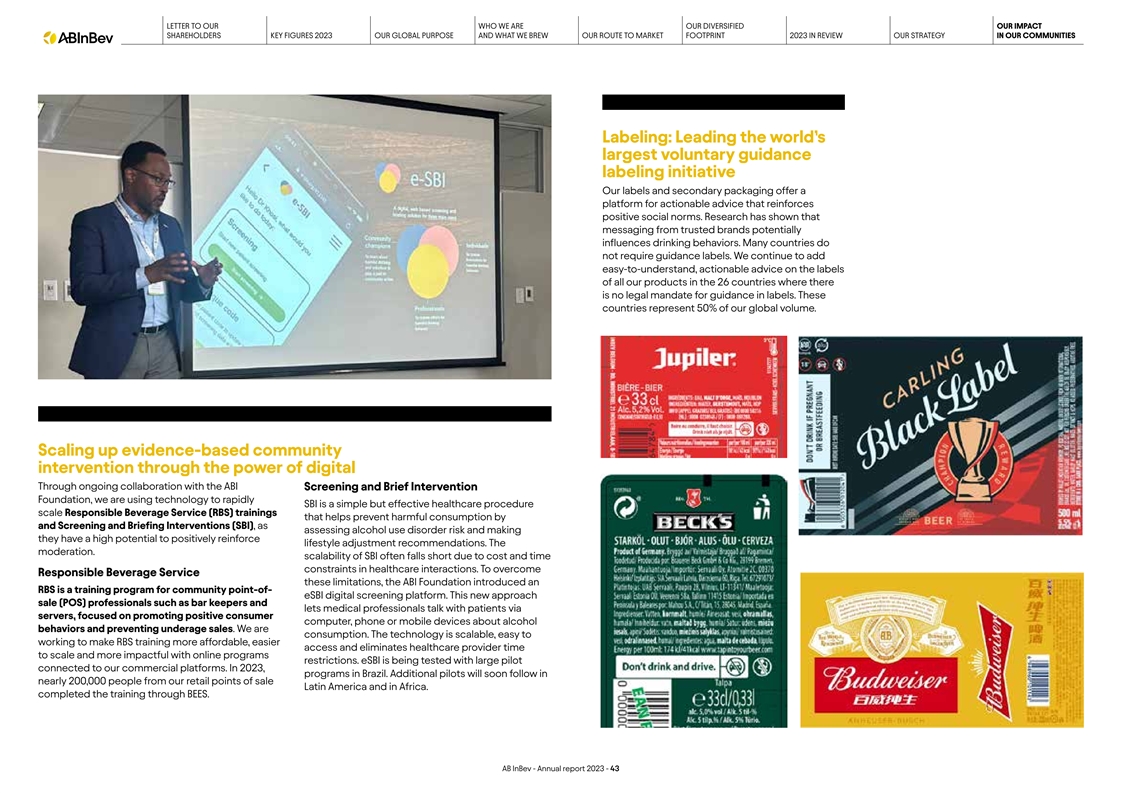
LETTER TO OUR WHO WE ARE OUR DIVERSIFIED OUR IMPACT SHAREHOLDERS KEY
FIGURES 2023 OUR GLOBAL PURPOSE AND WHAT WE BREW OUR ROUTE TO MARKET FOOTPRINT 2023 IN REVIEW OUR STRATEGY IN OUR COMMUNITIES Labeling: Leading the world’s largest voluntary guidance labeling initiative Our labels and secondary packaging offer
a platform for actionable advice that reinforces positive social norms. Research has shown that messaging from trusted brands potentially influences drinking behaviors. Many countries do not require guidance labels. We continue to add
easy-to-understand, actionable advice on the labels of all our products in the 26 countries where there is no legal mandate for guidance in labels. These countries represent 50% of our global volume. Scaling up evidence-based community intervention
through the power of digital Through ongoing collaboration with the ABI Screening and Brief Intervention Foundation, we are using technology to rapidly SBI is a simple but effective healthcare procedure scale Responsible Beverage Service (RBS)
trainings that helps prevent harmful consumption by and Screening and Briefing Interventions (SBI), as assessing alcohol use disorder risk and making they have a high potential to positively reinforce lifestyle adjustment recommendations. The
moderation. scalability of SBI often falls short due to cost and time constraints in healthcare interactions. To overcome Responsible Beverage Service these limitations, the ABI Foundation introduced an RBS is a training program for community
point-of- eSBI digital screening platform. This new approach sale (POS) professionals such as bar keepers and lets medical professionals talk with patients via servers, focused on promoting positive consumer computer, phone or mobile devices about
alcohol behaviors and preventing underage sales. We are consumption. The technology is scalable, easy to working to make RBS training more affordable, easier access and eliminates healthcare provider time to scale and more impactful with online
programs restrictions. eSBI is being tested with large pilot connected to our commercial platforms. In 2023, programs in Brazil. Additional pilots will soon follow in nearly 200,000 people from our retail points of sale Latin America and in Africa.
completed the training through BEES. AB InBev - Annual report 2023 - 43
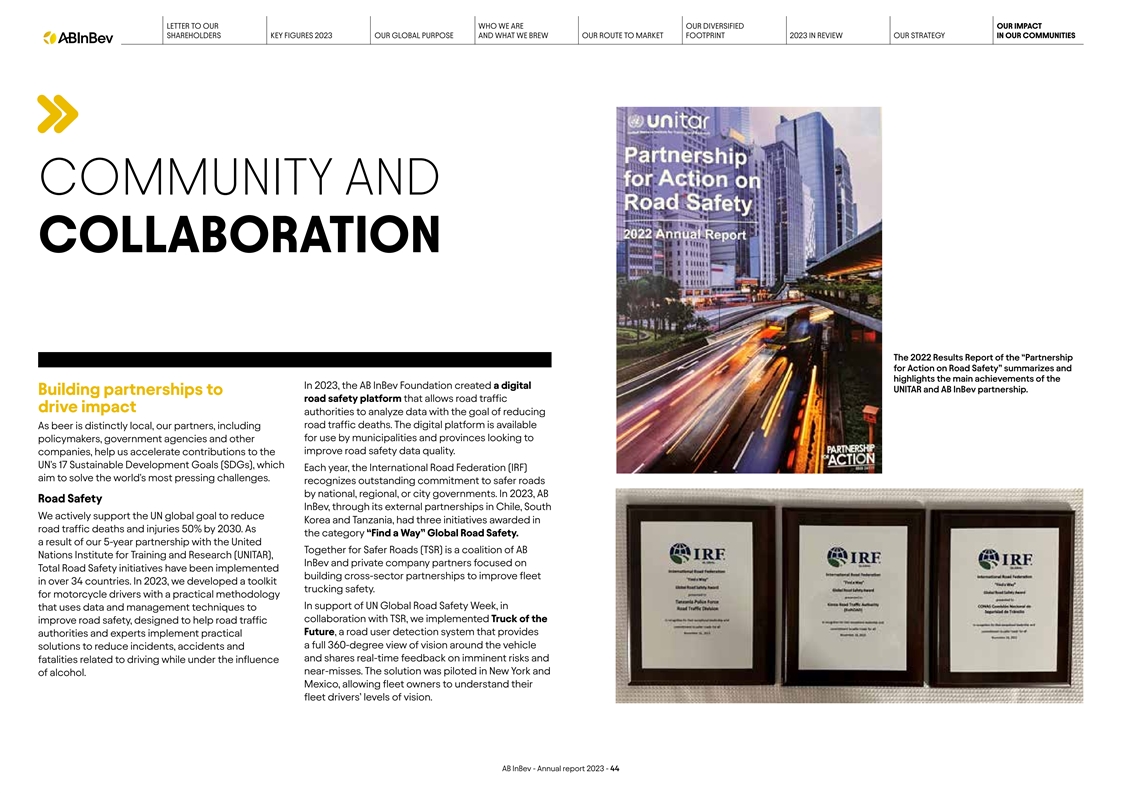
LETTER TO OUR WHO WE ARE OUR DIVERSIFIED OUR IMPACT SHAREHOLDERS KEY
FIGURES 2023 OUR GLOBAL PURPOSE AND WHAT WE BREW OUR ROUTE TO MARKET FOOTPRINT 2023 IN REVIEW OUR STRATEGY IN OUR COMMUNITIES COMMUNITY AND COLLABORATION The 2022 Results Report of the “Partnership for Action on Road Safety” summarizes
and highlights the main achievements of the In 2023, the AB InBev Foundation created a digital UNITAR and AB InBev partnership. Building partnerships to road safety platform that allows road traffic drive impact authorities to analyze data with the
goal of reducing road traffic deaths. The digital platform is available As beer is distinctly local, our partners, including for use by municipalities and provinces looking to policymakers, government agencies and other improve road safety data
quality. companies, help us accelerate contributions to the UN's 17 Sustainable Development Goals (SDGs), which Each year, the International Road Federation (IRF) aim to solve the world's most pressing challenges. recognizes outstanding commitment
to safer roads by national, regional, or city governments. In 2023, AB Road Safety InBev, through its external partnerships in Chile, South We actively support the UN global goal to reduce Korea and Tanzania, had three initiatives awarded in road
traffic deaths and injuries 50% by 2030. As the category “Find a Way” Global Road Safety. a result of our 5-year partnership with the United Together for Safer Roads (TSR) is a coalition of AB Nations Institute for Training and Research
(UNITAR), InBev and private company partners focused on Total Road Safety initiatives have been implemented building cross-sector partnerships to improve fleet in over 34 countries. In 2023, we developed a toolkit trucking safety. for motorcycle
drivers with a practical methodology In support of UN Global Road Safety Week, in that uses data and management techniques to collaboration with TSR, we implemented Truck of the improve road safety, designed to help road traffic Future, a road user
detection system that provides authorities and experts implement practical a full 360-degree view of vision around the vehicle solutions to reduce incidents, accidents and and shares real-time feedback on imminent risks and fatalities related to
driving while under the influence near-misses. The solution was piloted in New York and of alcohol. Mexico, allowing fleet owners to understand their fleet drivers’ levels of vision. AB InBev - Annual report 2023 - 44

LETTER TO OUR WHO WE ARE OUR DIVERSIFIED OUR IMPACT SHAREHOLDERS KEY
FIGURES 2023 OUR GLOBAL PURPOSE AND WHAT WE BREW OUR ROUTE TO MARKET FOOTPRINT 2023 IN REVIEW OUR STRATEGY IN OUR COMMUNITIES Global Economic Impact of Beer The beer sector's contribution to jobs and countries' In a recent report, Oxford Economics
noted Gross Domestic Product (GDP) across the world is the economic paradox that beer’s economic contribution is higher in emerging markets despite substantial. In emerging markets, that contribution beer consumption per person being lower.
could be even greater, if their market conditions matched international best practice to ensure One reason is that beer is a higher-value good in consumers shift away from higher alcohol content emerging markets than it is in developed markets.
beverages and towards beer. The study also revealed that beer tends to be less affordable in emerging markets largely because it A 2022 report from Oxford Economics, one of the world’s leading economic consultancies, for the is often taxed
more steeply than cheaper higher World Brewing Alliance (WBA), found that the beer alcohol-content spirits and at the same time, very category, across 70 countries representing 89% cheap and dangerous illicit alcohol tends to be more prominent than
beer in emerging markets. of beer sold globally, contributed 555 billion USD Without this taxation distortion, beer's potential for toward GDP and is associated with 23 million jobs. economic development would be even greater in To put that in
perspective, that's one in every 110 jobs those markets. - and 1 in 72 for emerging markets. READ MORE ABOUT THE GLOBAL ECONOMIC IMPACT OF BEER The beer sector’s share of GDP in emerging markets is almost double its share of GDP in developed
markets (average 1.6% vs 0.9% of national GDP). Similarly, the beer sector supported more jobs in both absolute and relative terms (1.4% versus 1.1% of all jobs), with less internationalization and more domestic production than in developed
economies. Beer’s contribution to GDP could rise from 1.6% to 2.2% 23 million if it took share from higher jobs ABV categories, with taxation worldwide are associated with policies and availability of the beer industry illicit alcohol
representing important influences, 555 billion USD according to Oxford contributed toward GDP globally Economics. AB InBev - Annual report 2023 - 45
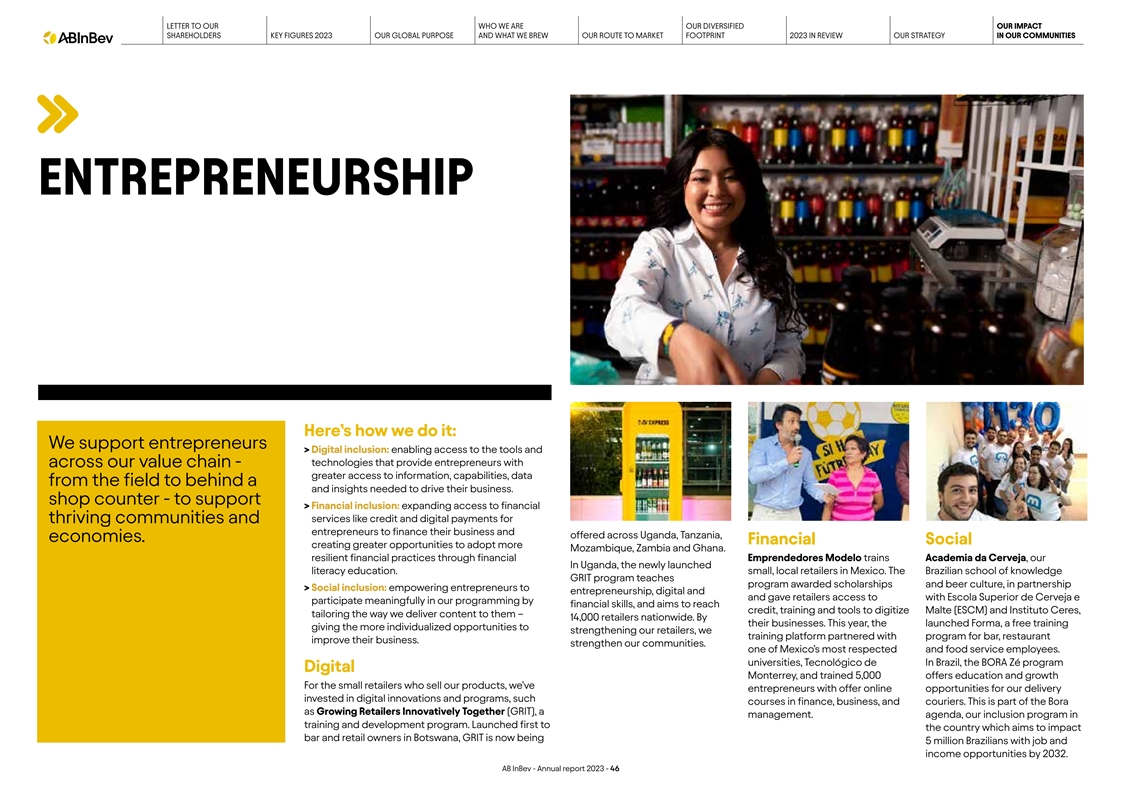
LETTER TO OUR WHO WE ARE OUR DIVERSIFIED OUR IMPACT SHAREHOLDERS KEY
FIGURES 2023 OUR GLOBAL PURPOSE AND WHAT WE BREW OUR ROUTE TO MARKET FOOTPRINT 2023 IN REVIEW OUR STRATEGY IN OUR COMMUNITIES ENTREPRENEURSHIP Here’s how we do it: We support entrepreneurs > Digital inclusion: enabling access to the tools
and technologies that provide entrepreneurs with across our value chain - greater access to information, capabilities, data from the field to behind a and insights needed to drive their business. shop counter - to support > Financial inclusion:
expanding access to financial services like credit and digital payments for thriving communities and entrepreneurs to finance their business and offered across Uganda, Tanzania, economies. Financial Social creating greater opportunities to adopt
more Mozambique, Zambia and Ghana. resilient financial practices through financial Emprendedores Modelo trains Academia da Cerveja, our In Uganda, the newly launched literacy education. small, local retailers in Mexico. The Brazilian school of
knowledge GRIT program teaches program awarded scholarships and beer culture, in partnership > Social inclusion: empowering entrepreneurs to entrepreneurship, digital and and gave retailers access to with Escola Superior de Cerveja e participate
meaningfully in our programming by financial skills, and aims to reach credit, training and tools to digitize Malte (ESCM) and Instituto Ceres, tailoring the way we deliver content to them – 14,000 retailers nationwide. By their businesses.
This year, the launched Forma, a free training giving the more individualized opportunities to strengthening our retailers, we training platform partnered with program for bar, restaurant improve their business. strengthen our communities. one of
Mexico’s most respected and food service employees. universities, Tecnológico de In Brazil, the BORA Zé program Digital Monterrey, and trained 5,000 offers education and growth For the small retailers who sell our products,
we’ve entrepreneurs with offer online opportunities for our delivery invested in digital innovations and programs, such courses in finance, business, and couriers. This is part of the Bora as Growing Retailers Innovatively Together (GRIT), a
management. agenda, our inclusion program in training and development program. Launched first to the country which aims to impact bar and retail owners in Botswana, GRIT is now being 5 million Brazilians with job and income opportunities by 2032. AB
InBev - Annual report 2023 - 46
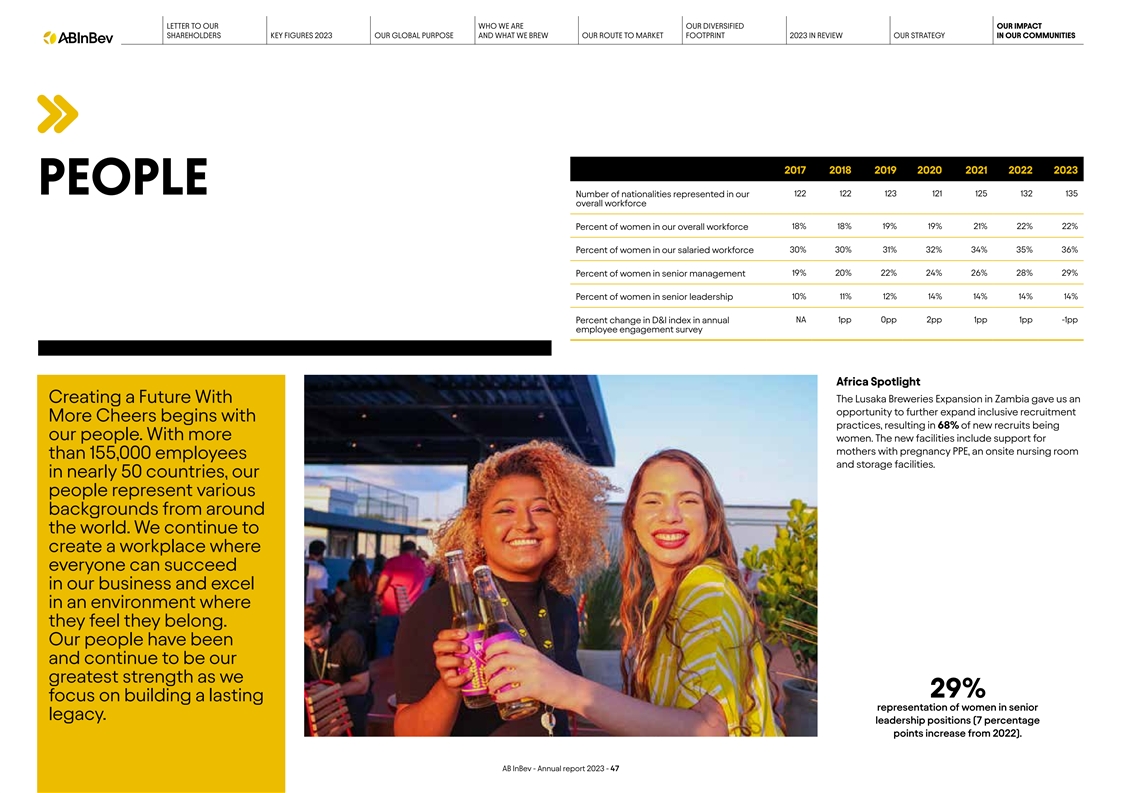
LETTER TO OUR WHO WE ARE OUR DIVERSIFIED OUR IMPACT SHAREHOLDERS KEY
FIGURES 2023 OUR GLOBAL PURPOSE AND WHAT WE BREW OUR ROUTE TO MARKET FOOTPRINT 2023 IN REVIEW OUR STRATEGY IN OUR COMMUNITIES 2017 2018 2019 2020 2021 2022 2023 PEOPLE 122 122 123 121 125 132 135 Number of nationalities represented in our overall
workforce Percent of women in our overall workforce 18% 18% 19% 19% 21% 22% 22% 30% 30% 31% 32% 34% 35% 36% Percent of women in our salaried workforce Percent of women in senior management 19% 20% 22% 24% 26% 28% 29% Percent of women in senior
leadership 10% 11% 12% 14% 14% 14% 14% NA 1pp 0pp 2pp 1pp 1pp -1pp Percent change in D&I index in annual employee engagement survey Africa Spotlight Creating a Future With The Lusaka Breweries Expansion in Zambia gave us an opportunity to
further expand inclusive recruitment More Cheers begins with practices, resulting in 68% of new recruits being our people. With more women. The new facilities include support for mothers with pregnancy PPE, an onsite nursing room than 155,000
employees and storage facilities. in nearly 50 countries, our people represent various backgrounds from around the world. We continue to create a workplace where everyone can succeed in our business and excel in an environment where they feel they
belong. Our people have been and continue to be our greatest strength as we 29% focus on building a lasting representation of women in senior legacy. leadership positions (7 percentage points increase from 2022). AB InBev - Annual report 2023 -
47
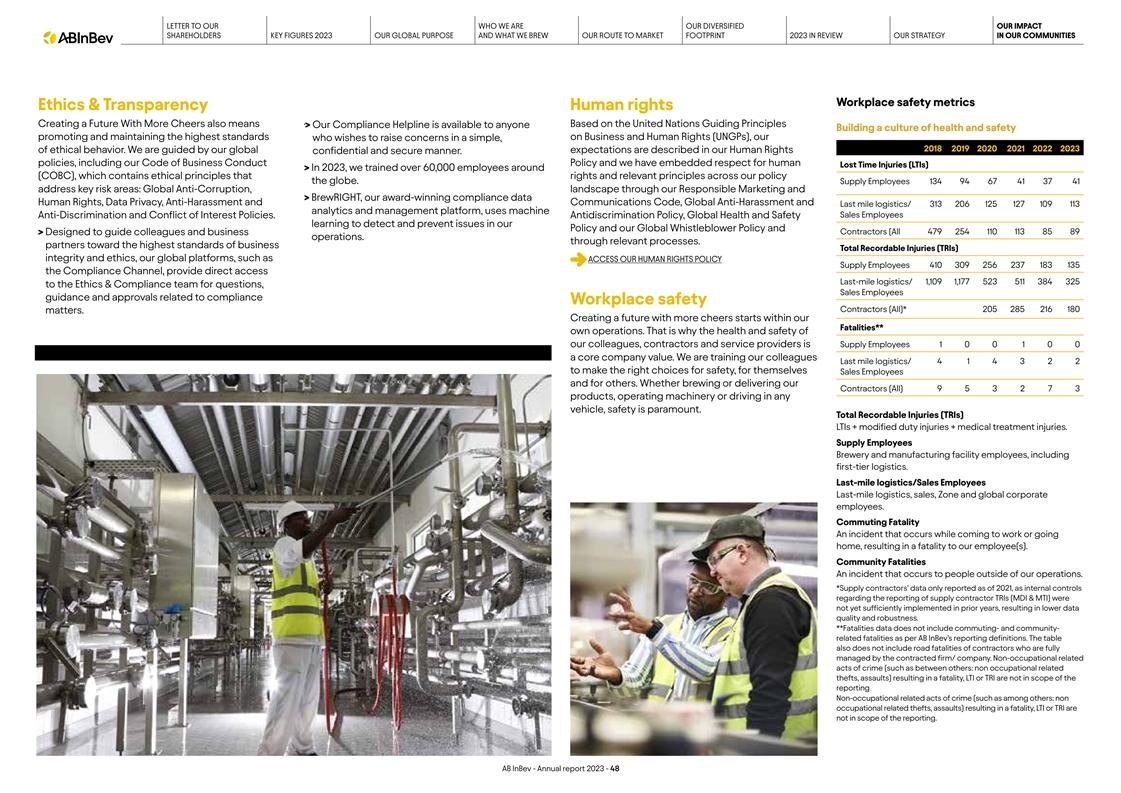
LETTER TO OUR WHO WE ARE OUR DIVERSIFIED OUR IMPACT SHAREHOLDERS KEY
FIGURES 2023 OUR GLOBAL PURPOSE AND WHAT WE BREW OUR ROUTE TO MARKET FOOTPRINT 2023 IN REVIEW OUR STRATEGY IN OUR COMMUNITIES Workplace safety metrics Ethics & Transparency Human rights Creating a Future With More Cheers also means Based on the
United Nations Guiding Principles ·> Our Compliance Helpline is available to anyone Building a culture of health and safety promoting and maintaining the highest standards on Business and Human Rights (UNGPs), our who wishes to raise
concerns in a simple, 2018 2019 2020 2021 2022 2023 of ethical behavior. We are guided by our global expectations are described in our Human Rights confidential and secure manner. policies, including our Code of Business Conduct Policy and we have
embedded respect for human Lost Time Injuries (LTIs) > In 202 3, we trained over 60,000 employees around (COBC), which contains ethical principles that rights and relevant principles across our policy the globe. Supply Employees 134 94 67 41 37
41 address key risk areas: Global Anti-Corruption, landscape through our Responsible Marketing and > BrewRIGHT, our award-winning compliance data Human Rights, Data Privacy, Anti-Harassment and Communications Code, Global Anti-Harassment and Last
mile logistics/ 313 206 125 127 109 113 analytics and management platform, uses machine Sales Employees Anti-Discrimination and Conflict of Interest Policies. Antidiscrimination Policy, Global Health and Safety learning to detect and prevent issues
in our Policy and our Global Whistleblower Policy and > Designe d to guide colleagues and business Contractors (All 479 254 110 113 85 89 operations. through relevant processes. partners toward the highest standards of business Total Recordable
Injuries (TRIs) integrity and ethics, our global platforms, such as A CCESS OUR HUMAN RIGHTS POLICY Supply Employees 410 309 256 237 183 135 the Compliance Channel, provide direct access Last-mile logistics/ 1,109 1,177 523 511 384 325 to the Ethics
& Compliance team for questions, Sales Employees guidance and approvals related to compliance Workplace safety Contractors (All)* 205 285 216 180 matters. Creating a future with more cheers starts within our Fatalities** own operations. That is
why the health and safety of our colleagues, contractors and service providers is Supply Employees 1 0 0 1 0 0 a core company value. We are training our colleagues Last mile logistics/ 4 1 4 3 2 2 to make the right choices for safety, for themselves
Sales Employees and for others. Whether brewing or delivering our Contractors (All) 9 5 3 2 7 3 products, operating machinery or driving in any vehicle, safety is paramount. Total Recordable Injuries (TRIs) LTIs + modified duty injuries + medical
treatment injuries. Supply Employees Brewery and manufacturing facility employees, including first-tier logistics. Last-mile logistics/Sales Employees Last-mile logistics, sales, Zone and global corporate employees. Commuting Fatality An incident
that occurs while coming to work or going home, resulting in a fatality to our employee(s). Community Fatalities An incident that occurs to people outside of our operations. *Supply contractors’ data only reported as of 2021, as internal
controls regarding the reporting of supply contractor TRIs (MDI & MTI) were not yet sufficiently implemented in prior years, resulting in lower data quality and robustness. **Fatalities data does not include commuting- and community- related
fatalities as per AB InBev’s reporting definitions. The table also does not include road fatalities of contractors who are fully managed by the contracted firm/ company. Non-occupational related acts of crime (such as between others: non
occupational related thefts, assaults) resulting in a fatality, LTI or TRI are not in scope of the reporting Non-occupational related acts of crime (such as among others: non occupational related thefts, assaults) resulting in a fatality, LTI or TRI
are not in scope of the reporting. AB InBev - Annual report 2023 - 48
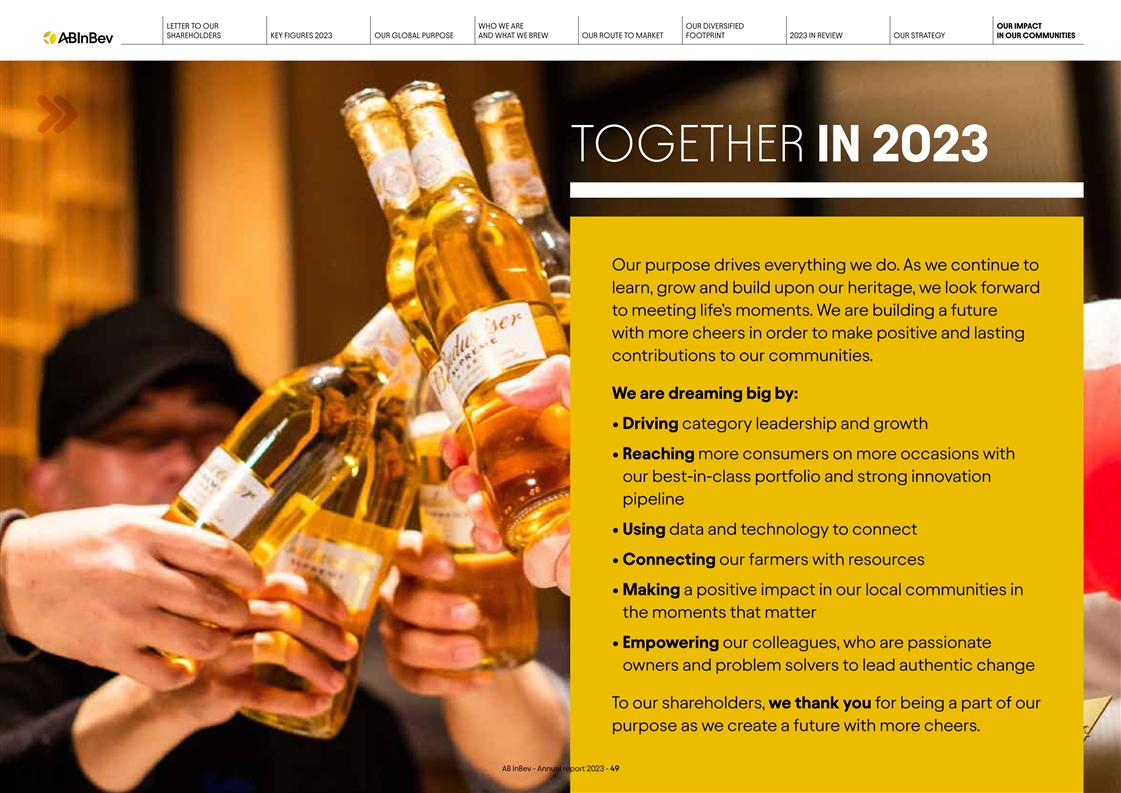
LETTER TO OUR WHO WE ARE OUR DIVERSIFIED OUR IMPACT SHAREHOLDERS KEY
FIGURES 2023 OUR GLOBAL PURPOSE AND WHAT WE BREW OUR ROUTE TO MARKET FOOTPRINT 2023 IN REVIEW OUR STRATEGY IN OUR COMMUNITIES TOGETHER IN 2023 Our purpose drives everything we do. As we continue to learn, grow and build upon our heritage, we look
forward to meeting life’s moments. We are building a future with more cheers in order to make positive and lasting contributions to our communities. We are dreaming big by: • Driving category leadership and growth • R eaching more
consumers on more occasions with our best-in-class portfolio and strong innovation pipeline • Using data and technology to connect • Connecting our farmers with resources • Making a positive impact in our local communities in the
moments that matter • Empo wering our colleagues, who are passionate owners and problem solvers to lead authentic change To our shareholders, we thank you for being a part of our purpose as we create a future with more cheers. AB InBev -
Annual report 2023 - 49
FINANCIAL REPORT TABLE OF CONTENTS MANAGEMENT REPORT 51 STATEMENT OF
THE BOARD OF DIRECTORS 71 INDEPENDENT AUDITORS’ REPORT 72 CONSOLIDATED FINANCIAL STATEMENTS 76 INFORMATION TO OUR SHAREHOLDERS 152 EXCERPT FROM THE AB INBEV NV/SA SEPARATE (NON-CONSOLIDATED) FINANCIAL STATEMENTS PREPARED IN ACCORDANCE WITH
BELGIAN GAAP 154 GLOSSARY 156 AB InBev - Annual report 2023 - 50
Management report Anheuser-Busch InBev is a publicly traded company
(Euronext: ABI) based in Leuven, Belgium, with secondary listings on the Mexico (MEXBOL: ANB) and South Africa (JSE: ANH) stock exchanges and with American Depositary Receipts on the New York Stock Exchange (NYSE: BUD). As a company, we dream big to
create a future with more cheers. We are always looking to serve up new ways to meet life’s moments, move our industry forward and make a meaningful impact in the world. We are committed to building great brands that stand the test of time and
to brewing the best beers using the finest natural ingredients. Our diverse portfolio of well over 500 beer brands includes global brands Budweiser®, Corona® Stella Artois® and Michelob Ultra®; multi-country brands
Beck’s®, Hoegaarden® and Leffe®; and local champions such as Aguila®, Antarctica®, Bud Light®, Brahma®, Cass®, Castle®, Castle Lite®, Cristal®, Harbin®, Jupiler®, Modelo
Especial®, Quilmes®, Victoria®, Sedrin® and Skol®. Our brewing heritage dates back more than 600 years, spanning continents and generations. From our European roots at the Den Hoorn brewery in Leuven, Belgium. To the
pioneering spirit of the Anheuser & Co brewery in St. Louis, US. To the creation of the Castle Brewery in South Africa during the Johannesburg gold rush. To Bohemia, the first brewery in Brazil. Geographically diversified with a balanced
exposure to developed and developing markets, we leverage the collective strengths of approximately 155 000 employees based in nearly 50 countries worldwide. For 2023, our reported revenue was 59.4 billion US dollar (excluding joint ventures and
associates). The following management report should be read in conjunction with our audited consolidated financial statements. In the rest of this document, we refer to Anheuser-Busch InBev as “AB InBev”, “the company”,
“we”, “us” or “our”. Recent events On 19 December 2023, AB InBev and its joint venture partner Anadolu Efes announced that the latter agreed to acquire the entirety of AB InBev’s non-controlling interest in
AB InBev Efes BV. No amount will be paid on closing. Completion of the transaction is subject to required regulatory and governmental approvals, and other customary closing conditions. There can be no assurances on when and whether these approvals
will be obtained. Any payments received by AB InBev after completion will be subject to additional regulatory approvals and are expected to be not material. On 31 January 2024, E. León Jimenes S.A.(“ELJ”) exercised its put option to
sell to Ambev approximately 12% of the shares of Cervecería Nacional Dominicana S.A. (“CND”) for a net consideration of 0.3 billion US dollar. The closing of the transaction resulted in Ambev’s participation in CND increasing
from 85% to 97%. Selected financial figures To facilitate the understanding of our underlying performance, the comments in this management report, unless otherwise indicated, are based on organic and normalized numbers. “Organic” means
the financials are analyzed eliminating the impact of changes in currencies on translation of foreign operations, and scopes. Scopes represent the impact of acquisitions and divestitures, the start-up or termination of activities or the transfer of
activities between segments, curtailment gains and losses and year-over-year changes in accounting estimates and other assumptions that management does not consider part of the underlying performance of the business. The tables in this management
report provide the segment information per region for the period ended 31 December 2023 and 2022 in the format up to Normalized EBIT level that is used by management to monitor performance. As from 1 January 2023, mark-to-market gains/(losses) on
derivatives related to the hedging of the share-based payment programs are reported in the non-underlying net finance income/(cost). The 2022 presentation was amended to conform to the 2023 presentation. Whenever used in this report, the term
“normalized” refers to performance measures (EBITDA, EBIT, Profit, effective tax rate) before non-underlying items. Non-underlying items are either income or expenses that do not occur regularly as part of the normal activities of the
company. They are presented separately because they are important for the understanding of the underlying sustainable performance of the company due to their size or nature. Normalized measures are additional measures used by management and should
not replace the measures determined in accordance with IFRS as an indicator of the company’s performance, but rather should be used in conjunction with the most directly comparable IFRS measures. AB InBev – Annual Report 2023 51
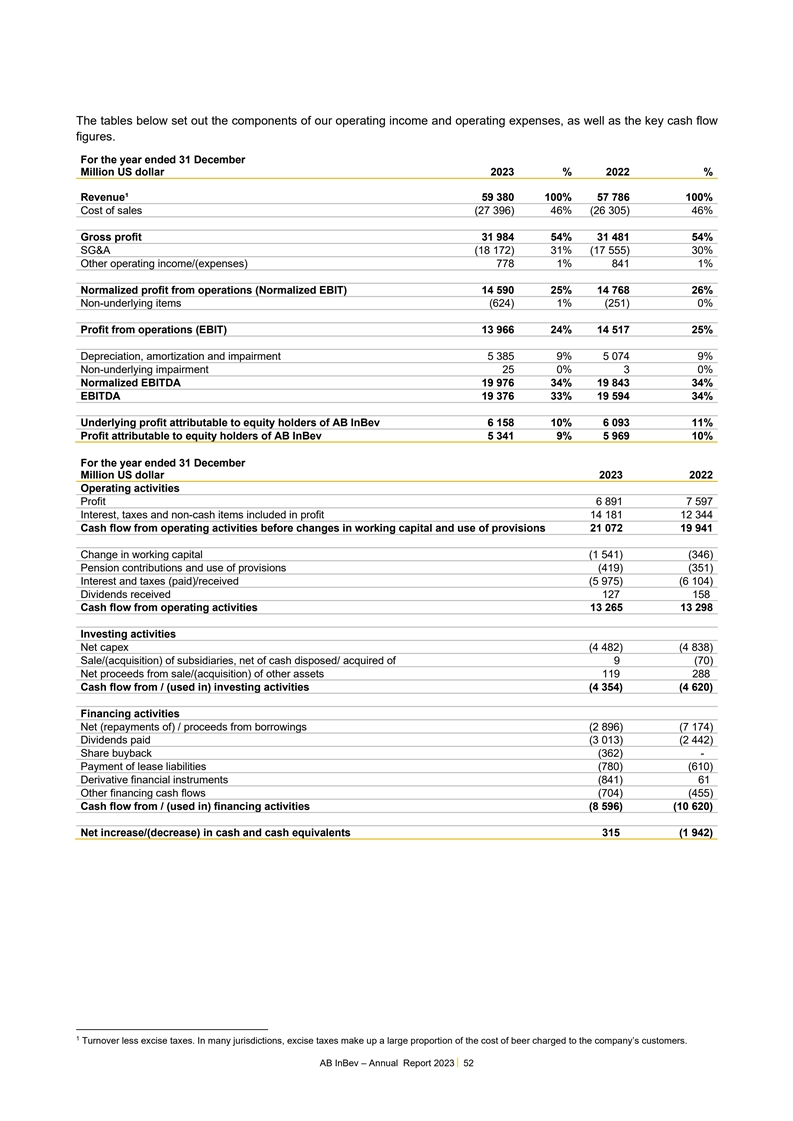
The tables below set out the components of our operating income and
operating expenses, as well as the key cash flow 1 figures.. For the year ended 31 December Million US dollar 2023 % 2022 % . Revenue¹ 59 380 100% 57 786 100% Cost of sales (27 396) 46% (26 305) 46% . Gross profit 31 984 54% 31 481 54% SG&A
(18 172) 31% (17 555) 30% Other operating income/(expenses) 778 1% 841 1% . Normalized profit from operations (Normalized EBIT) 14 590 25% 14 768 26% Non-underlying items (624) 1% (251) 0% . Profit from operations (EBIT) 13 966 24% 14 517 25% .
Depreciation, amortization and impairment 5 385 9% 5 074 9% Non-underlying impairment 25 0% 3 0% Normalized EBITDA 19 976 34% 19 843 34% EBITDA 19 376 33% 19 594 34% . Underlying profit attributable to equity holders of AB InBev 6 158 10% 6 093 11%
Profit attributable to equity holders of AB InBev 5 341 9% 5 969 10% For the year ended 31 December Million US dollar 2023 2022 Operating activities Profit 6 891 7 597 Interest, taxes and non-cash items included in profit 14 181 12 344 Cash flow
from operating activities before changes in working capital and use of provisions 21 072 19 941 Change in working capital (1 541) (346) Pension contributions and use of provisions (419) (351) Interest and taxes (paid)/received (5 975) (6 104)
Dividends received 127 158 Cash flow from operating activities 13 265 13 298 Investing activities Net capex (4 482) (4 838) Sale/(acquisition) of subsidiaries, net of cash disposed/ acquired of 9 (70) Net proceeds from sale/(acquisition) of other
assets 119 288 Cash flow from / (used in) investing activities (4 354) (4 620) Financing activities Net (repayments of) / proceeds from borrowings (2 896) (7 174) Dividends paid (3 013) (2 442) Share buyback (362) - Payment of lease liabilities
(780) (610) Derivative financial instruments (841) 61 Other financing cash flows (704) (455) Cash flow from / (used in) financing activities (8 596) (10 620) Net increase/(decrease) in cash and cash equivalents 315 (1 942) 1 Turnover less excise
taxes. In many jurisdictions, excise taxes make up a large proportion of the cost of beer charged to the company’s customers. AB InBev – Annual Report 2023 52
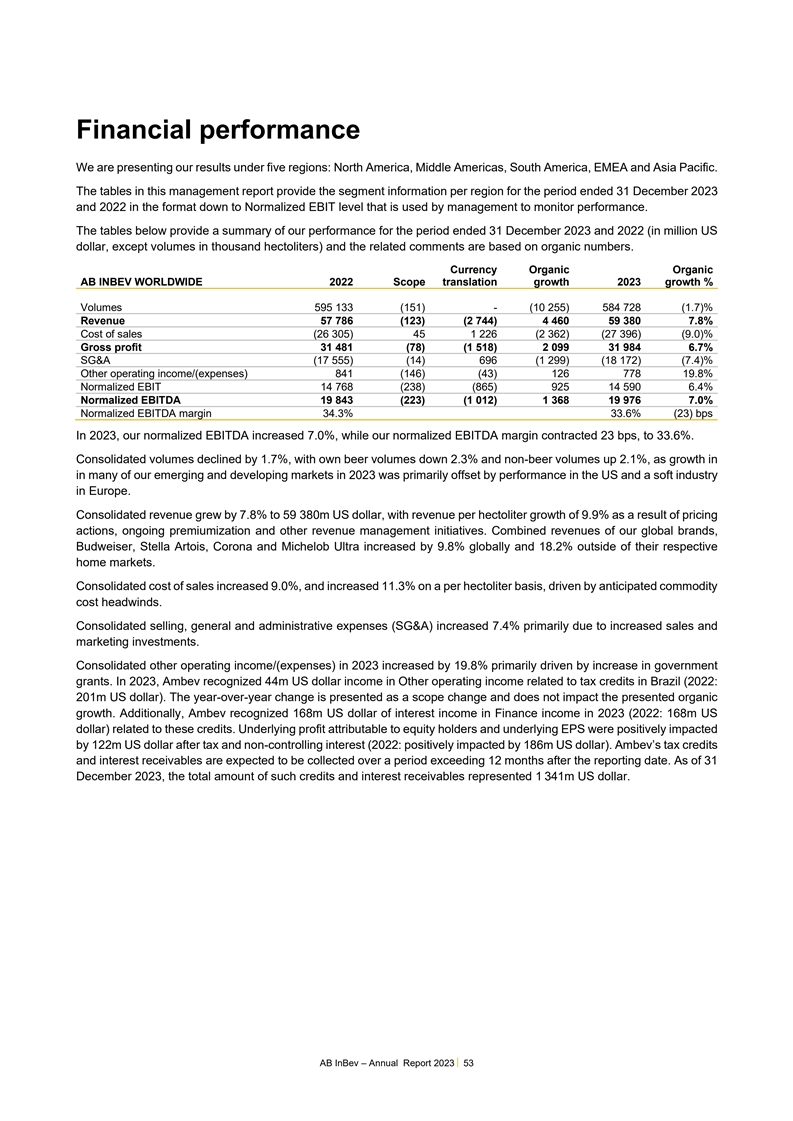
Financial performance We are presenting our results under five regions:
North America, Middle Americas, South America, EMEA and Asia Pacific. The tables in this management report provide the segment information per region for the period ended 31 December 2023 and 2022 in the format down to Normalized EBIT level that is
used by management to monitor performance. The tables below provide a summary of our performance for the period ended 31 December 2023 and 2022 (in million US dollar, except volumes in thousand hectoliters) and the related comments are based on
organic numbers. Currency Organic Organic AB INBEV WORLDWIDE 2022 Scope translation growth 2023 growth % Volumes 595 133 (151) - (10 255) 584 728 (1.7)% Revenue 57 786 (123) (2 744) 4 460 59 380 7.8% Cost of sales (26 305) 45 1 226 (2 362) (27 396)
(9.0)% Gross profit 31 481 (78) (1 518) 2 099 31 984 6.7% SG&A (17 555) (14) 696 (1 299) (18 172) (7.4)% Other operating income/(expenses) 841 (146) (43) 126 778 19.8% Normalized EBIT 14 768 (238) (865) 925 14 590 6.4% Normalized EBITDA 19 843
(223) (1 012) 1 368 19 976 7.0% Normalized EBITDA margin 34.3% 33.6% (23) bps In 2023, our normalized EBITDA increased 7.0%, while our normalized EBITDA margin contracted 23 bps, to 33.6%. Consolidated volumes declined by 1.7%, with own beer volumes
down 2.3% and non-beer volumes up 2.1%, as growth in in many of our emerging and developing markets in 2023 was primarily offset by performance in the US and a soft industry in Europe. Consolidated revenue grew by 7.8% to 59 380m US dollar, with
revenue per hectoliter growth of 9.9% as a result of pricing actions, ongoing premiumization and other revenue management initiatives. Combined revenues of our global brands, Budweiser, Stella Artois, Corona and Michelob Ultra increased by 9.8%
globally and 18.2% outside of their respective home markets. Consolidated cost of sales increased 9.0%, and increased 11.3% on a per hectoliter basis, driven by anticipated commodity cost headwinds. Consolidated selling, general and administrative
expenses (SG&A) increased 7.4% primarily due to increased sales and marketing investments. Consolidated other operating income/(expenses) in 2023 increased by 19.8% primarily driven by increase in government grants. In 2023, Ambev recognized 44m
US dollar income in Other operating income related to tax credits in Brazil (2022: 201m US dollar). The year-over-year change is presented as a scope change and does not impact the presented organic growth. Additionally, Ambev recognized 168m US
dollar of interest income in Finance income in 2023 (2022: 168m US dollar) related to these credits. Underlying profit attributable to equity holders and underlying EPS were positively impacted by 122m US dollar after tax and non-controlling
interest (2022: positively impacted by 186m US dollar). Ambev’s tax credits and interest receivables are expected to be collected over a period exceeding 12 months after the reporting date. As of 31 December 2023, the total amount of such
credits and interest receivables represented 1 341m US dollar. AB InBev – Annual Report 2023 53
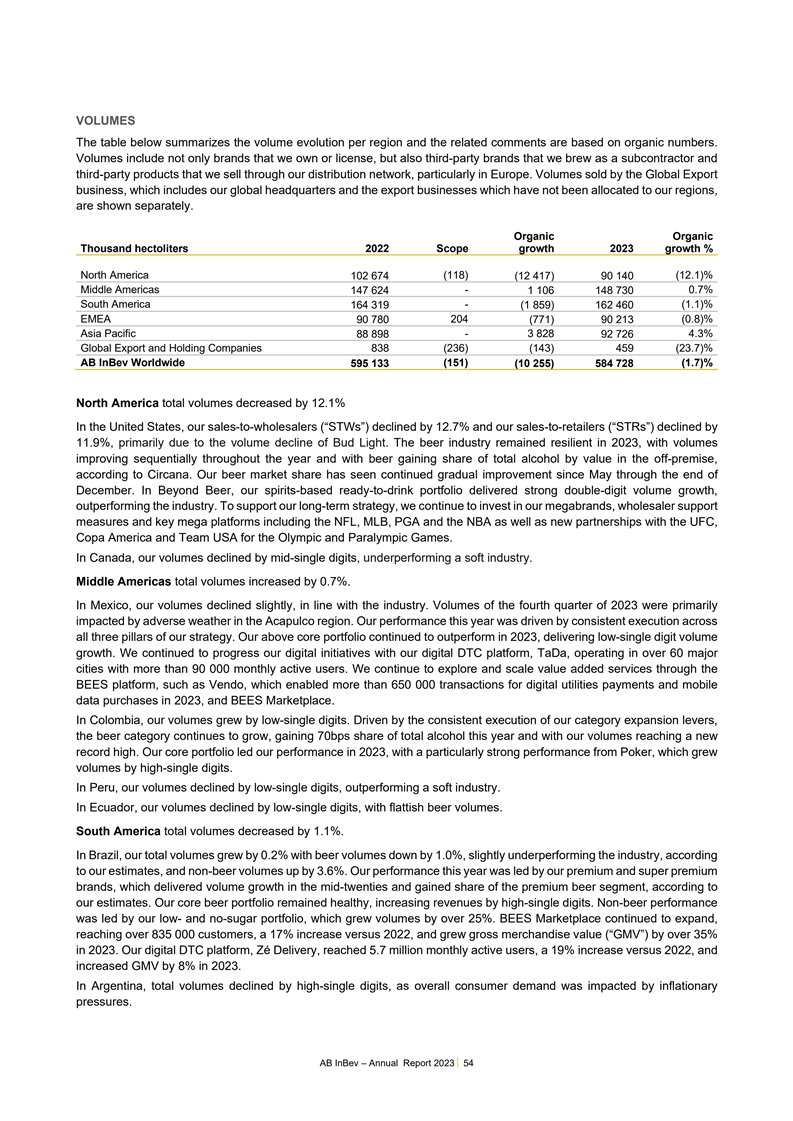
VOLUMES The table below summarizes the volume evolution per region and
the related comments are based on organic numbers. Volumes include not only brands that we own or license, but also third-party brands that we brew as a subcontractor and third-party products that we sell through our distribution network,
particularly in Europe. Volumes sold by the Global Export business, which includes our global headquarters and the export businesses which have not been allocated to our regions, are shown separately. Organic Organic Thousand hectoliters 2022 Scope
growth 2023 growth % North America 102 674 (118) (12 417) 90 140 (12.1)% Middle Americas 147 624 - 1 106 148 730 0.7% South America - (1.1)% 164 319 (1 859) 162 460 EMEA 204 (0.8)% 90 780 (771) 90 213 Asia Pacific - 3 828 4.3% 88 898 92 726 Global
Export and Holding Companies 838 (236) (143) 459 (23.7)% AB InBev Worldwide (151) (1.7)% 595 133 (10 255) 584 728 North America total volumes decreased by 12.1% In the United States, our sales-to-wholesalers (“STWs”) declined by 12.7%
and our sales-to-retailers (“STRs”) declined by 11.9%, primarily due to the volume decline of Bud Light. The beer industry remained resilient in 2023, with volumes improving sequentially throughout the year and with beer gaining share of
total alcohol by value in the off-premise, according to Circana. Our beer market share has seen continued gradual improvement since May through the end of December. In Beyond Beer, our spirits-based ready-to-drink portfolio delivered strong
double-digit volume growth, outperforming the industry. To support our long-term strategy, we continue to invest in our megabrands, wholesaler support measures and key mega platforms including the NFL, MLB, PGA and the NBA as well as new
partnerships with the UFC, Copa America and Team USA for the Olympic and Paralympic Games. In Canada, our volumes declined by mid-single digits, underperforming a soft industry. Middle Americas total volumes increased by 0.7%. In Mexico, our volumes
declined slightly, in line with the industry. Volumes of the fourth quarter of 2023 were primarily impacted by adverse weather in the Acapulco region. Our performance this year was driven by consistent execution across all three pillars of our
strategy. Our above core portfolio continued to outperform in 2023, delivering low-single digit volume growth. We continued to progress our digital initiatives with our digital DTC platform, TaDa, operating in over 60 major cities with more than 90
000 monthly active users. We continue to explore and scale value added services through the BEES platform, such as Vendo, which enabled more than 650 000 transactions for digital utilities payments and mobile data purchases in 2023, and BEES
Marketplace. In Colombia, our volumes grew by low-single digits. Driven by the consistent execution of our category expansion levers, the beer category continues to grow, gaining 70bps share of total alcohol this year and with our volumes reaching a
new record high. Our core portfolio led our performance in 2023, with a particularly strong performance from Poker, which grew volumes by high-single digits. In Peru, our volumes declined by low-single digits, outperforming a soft industry. In
Ecuador, our volumes declined by low-single digits, with flattish beer volumes. South America total volumes decreased by 1.1%. In Brazil, our total volumes grew by 0.2% with beer volumes down by 1.0%, slightly underperforming the industry, according
to our estimates, and non-beer volumes up by 3.6%. Our performance this year was led by our premium and super premium brands, which delivered volume growth in the mid-twenties and gained share of the premium beer segment, according to our estimates.
Our core beer portfolio remained healthy, increasing revenues by high-single digits. Non-beer performance was led by our low- and no-sugar portfolio, which grew volumes by over 25%. BEES Marketplace continued to expand, reaching over 835 000
customers, a 17% increase versus 2022, and grew gross merchandise value (“GMV”) by over 35% in 2023. Our digital DTC platform, Zé Delivery, reached 5.7 million monthly active users, a 19% increase versus 2022, and increased GMV by
8% in 2023. In Argentina, total volumes declined by high-single digits, as overall consumer demand was impacted by inflationary pressures. AB InBev – Annual Report 2023 54
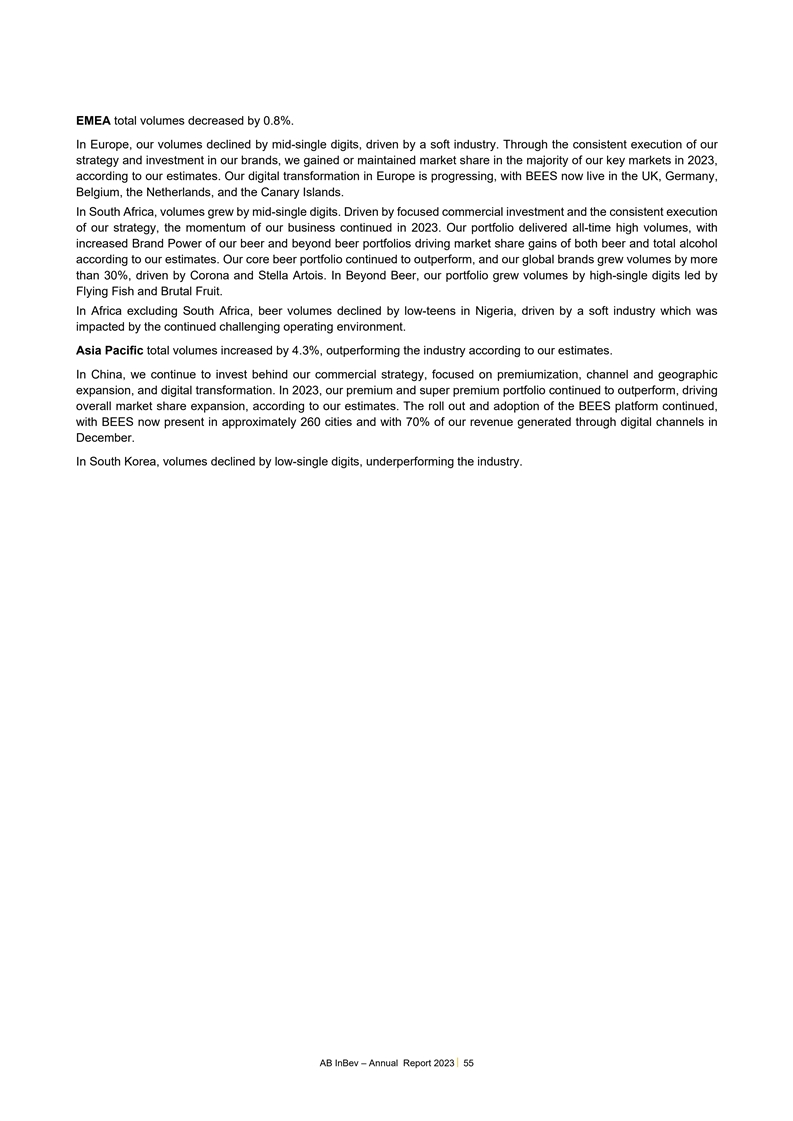
EMEA total volumes decreased by 0.8%. In Europe, our volumes declined
by mid-single digits, driven by a soft industry. Through the consistent execution of our strategy and investment in our brands, we gained or maintained market share in the majority of our key markets in 2023, according to our estimates. Our digital
transformation in Europe is progressing, with BEES now live in the UK, Germany, Belgium, the Netherlands, and the Canary Islands. In South Africa, volumes grew by mid-single digits. Driven by focused commercial investment and the consistent
execution of our strategy, the momentum of our business continued in 2023. Our portfolio delivered all-time high volumes, with increased Brand Power of our beer and beyond beer portfolios driving market share gains of both beer and total alcohol
according to our estimates. Our core beer portfolio continued to outperform, and our global brands grew volumes by more than 30%, driven by Corona and Stella Artois. In Beyond Beer, our portfolio grew volumes by high-single digits led by Flying Fish
and Brutal Fruit. In Africa excluding South Africa, beer volumes declined by low-teens in Nigeria, driven by a soft industry which was impacted by the continued challenging operating environment. Asia Pacific total volumes increased by 4.3%,
outperforming the industry according to our estimates. In China, we continue to invest behind our commercial strategy, focused on premiumization, channel and geographic expansion, and digital transformation. In 2023, our premium and super premium
portfolio continued to outperform, driving overall market share expansion, according to our estimates. The roll out and adoption of the BEES platform continued, with BEES now present in approximately 260 cities and with 70% of our revenue generated
through digital channels in December. In South Korea, volumes declined by low-single digits, underperforming the industry. AB InBev – Annual Report 2023 55
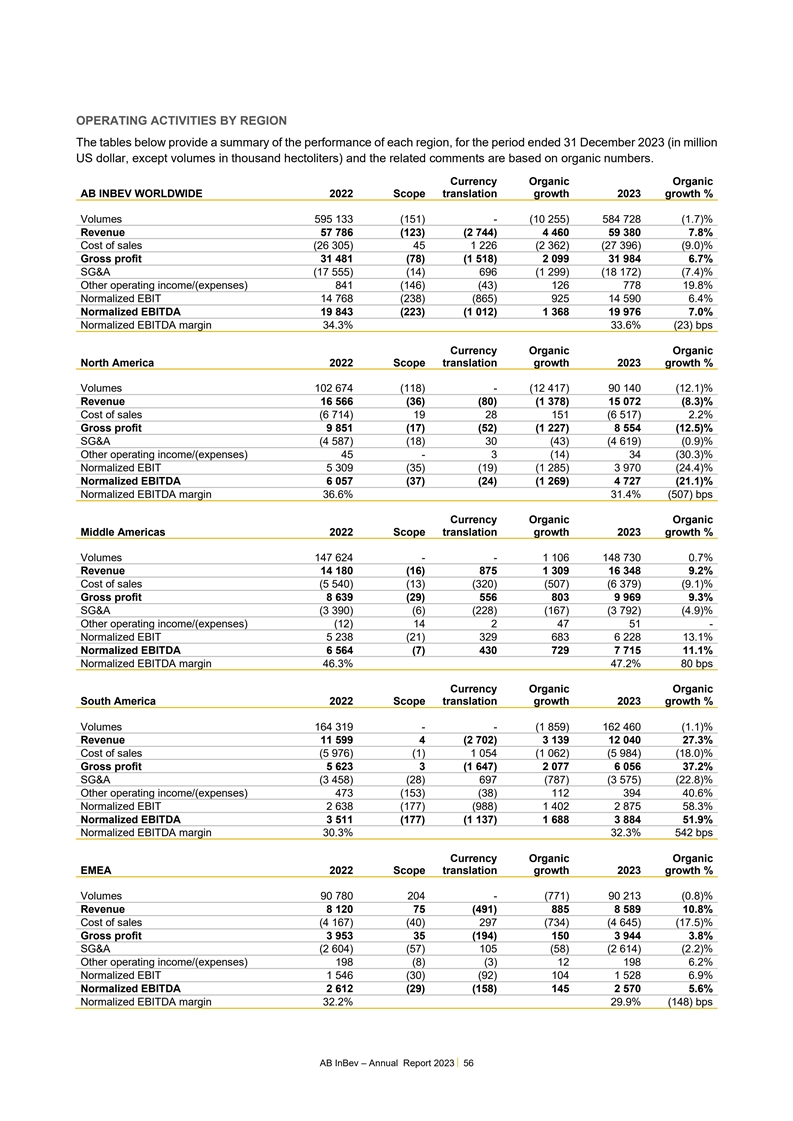
OPERATING ACTIVITIES BY REGION The tables below provide a summary of
the performance of each region, for the period ended 31 December 2023 (in million US dollar, except volumes in thousand hectoliters) and the related comments are based on organic numbers. Currency Organic Organic AB INBEV WORLDWIDE 2022 Scope
translation growth 2023 growth % Volumes 595 133 (151) - (10 255) 584 728 (1.7)% Revenue 57 786 (123) (2 744) 4 460 59 380 7.8% Cost of sales (26 305) 45 1 226 (2 362) (27 396) (9.0)% Gross profit 31 481 (78) (1 518) 2 099 31 984 6.7% SG&A (17
555) (14) 696 (1 299) (18 172) (7.4)% Other operating income/(expenses) 841 (146) (43) 126 778 19.8% Normalized EBIT 14 768 (238) (865) 925 14 590 6.4% Normalized EBITDA 19 843 (223) (1 012) 1 368 19 976 7.0% Normalized EBITDA margin 34.3% 33.6%
(23) bps Currency Organic Organic North America 2022 Scope translation growth 2023 growth % Volumes 102 674 (118) - (12 417) 90 140 (12.1)% Revenue 16 566 (36) (80) (1 378) 15 072 (8.3)% Cost of sales (6 714) 19 28 151 (6 517) 2.2% Gross profit 9
851 (17) (52) (1 227) 8 554 (12.5)% SG&A (4 587) (18) 30 (43) (4 619) (0.9)% Other operating income/(expenses) 45 - 3 (14) 34 (30.3)% Normalized EBIT 5 309 (35) (19) (1 285) 3 970 (24.4)% Normalized EBITDA 6 057 (37) (24) (1 269) 4 727 (21.1)%
Normalized EBITDA margin 36.6% 31.4% (507) bps Currency Organic Organic Middle Americas 2022 Scope translation growth 2023 growth % Volumes 147 624 - - 1 106 148 730 0.7% Revenue 14 180 (16) 875 1 309 16 348 9.2% Cost of sales (5 540) (13) (320)
(507) (6 379) (9.1)% Gross profit 8 639 (29) 556 803 9 969 9.3% SG&A (3 390) (6) (228) (167) (3 792) (4.9)% Other operating income/(expenses) (12) 14 2 47 51 - Normalized EBIT 5 238 (21) 329 683 6 228 13.1% Normalized EBITDA 6 564 (7) 430 729 7
715 11.1% Normalized EBITDA margin 46.3% 47.2% 80 bps Currency Organic Organic South America 2022 Scope translation growth 2023 growth % Volumes 164 319 - - (1 859) 162 460 (1.1)% Revenue 11 599 4 (2 702) 3 139 12 040 27.3% Cost of sales (5 976) (1)
1 054 (1 062) (5 984) (18.0)% Gross profit 5 623 3 (1 647) 2 077 6 056 37.2% SG&A (3 458) (28) 697 (787) (3 575) (22.8)% Other operating income/(expenses) 473 (153) (38) 112 394 40.6% Normalized EBIT 2 638 (177) (988) 1 402 2 875 58.3%
Normalized EBITDA 3 511 (177) (1 137) 1 688 3 884 51.9% Normalized EBITDA margin 30.3% 32.3% 542 bps Currency Organic Organic EMEA 2022 Scope translation growth 2023 growth % Volumes 90 780 204 - (771) 90 213 (0.8)% Revenue 8 120 75 (491) 885 8 589
10.8% Cost of sales (4 167) (40) 297 (734) (4 645) (17.5)% Gross profit 3 953 35 (194) 150 3 944 3.8% SG&A (2 604) (57) 105 (58) (2 614) (2.2)% Other operating income/(expenses) 198 (8) (3) 12 198 6.2% Normalized EBIT 1 546 (30) (92) 104 1 528
6.9% Normalized EBITDA 2 612 (29) (158) 145 2 570 5.6% Normalized EBITDA margin 32.2% 29.9% (148) bps AB InBev – Annual Report 2023 56
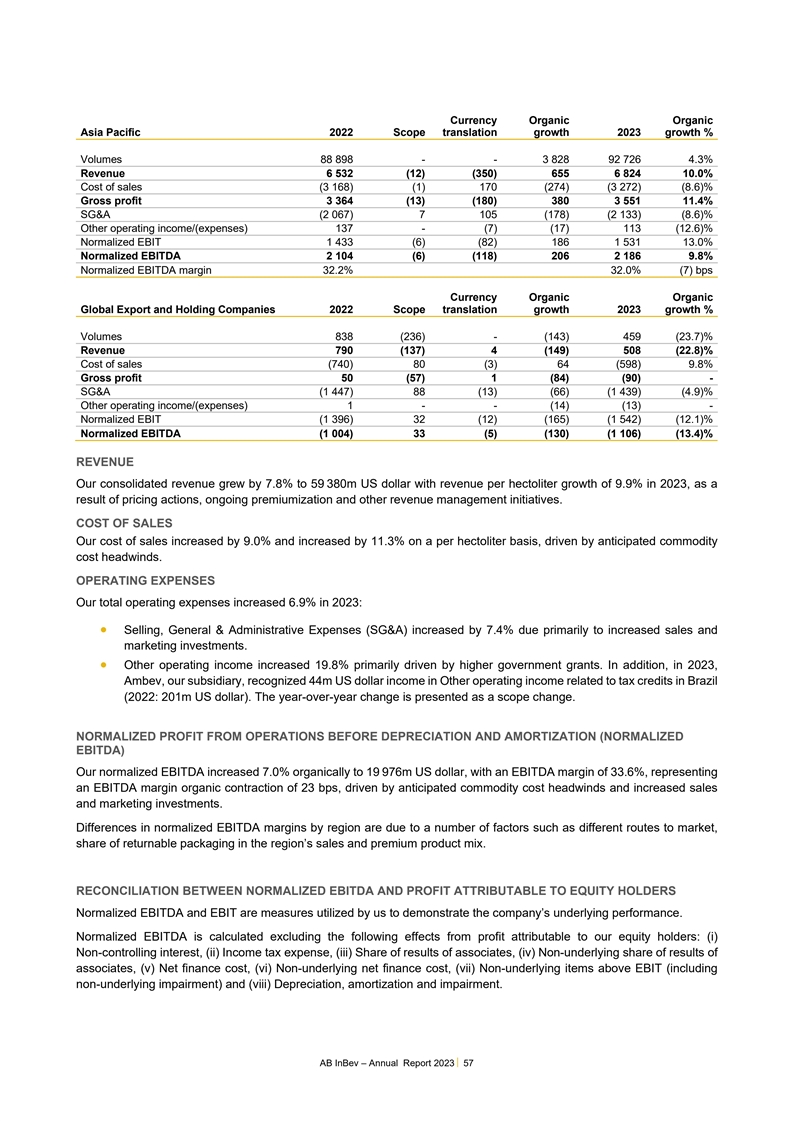
Currency Organic Organic Asia Pacific 2022 Scope translation growth
2023 growth % Volumes 88 898 - - 3 828 92 726 4.3% Revenue 6 532 (12) (350) 655 6 824 10.0% Cost of sales (3 168) (1) 170 (274) (3 272) (8.6)% Gross profit 3 364 (13) (180) 380 3 551 11.4% SG&A (2 067) 7 105 (178) (2 133) (8.6)% Other operating
income/(expenses) 137 - (7) (17) 113 (12.6)% Normalized EBIT 1 433 (6) (82) 186 1 531 13.0% Normalized EBITDA 2 104 (6) (118) 206 2 186 9.8% Normalized EBITDA margin 32.2% 32.0% (7) bps Currency Organic Organic Global Export and Holding Companies
2022 Scope translation growth 2023 growth % Volumes 838 (236) - (143) 459 (23.7)% Revenue 790 (137) 4 (149) 508 (22.8)% Cost of sales (740) 80 (3) 64 (598) 9.8% Gross profit 50 (57) 1 (84) (90) - SG&A (1 447) 88 (13) (66) (1 439) (4.9)% Other
operating income/(expenses) 1 - - (14) (13) - Normalized EBIT (1 396) 32 (12) (165) (1 542) (12.1)% Normalized EBITDA (1 004) 33 (5) (130) (1 106) (13.4)% REVENUE Our consolidated revenue grew by 7.8% to 59 380m US dollar with revenue per hectoliter
growth of 9.9% in 2023, as a result of pricing actions, ongoing premiumization and other revenue management initiatives. COST OF SALES Our cost of sales increased by 9.0% and increased by 11.3% on a per hectoliter basis, driven by anticipated
commodity cost headwinds. OPERATING EXPENSES Our total operating expenses increased 6.9% in 2023: • Selling, General & Administrative Expenses (SG&A) increased by 7.4% due primarily to increased sales and marketing investments. •
Other operating income increased 19.8% primarily driven by higher government grants. In addition, in 2023, Ambev, our subsidiary, recognized 44m US dollar income in Other operating income related to tax credits in Brazil (2022: 201m US dollar). The
year-over-year change is presented as a scope change. NORMALIZED PROFIT FROM OPERATIONS BEFORE DEPRECIATION AND AMORTIZATION (NORMALIZED EBITDA) Our normalized EBITDA increased 7.0% organically to 19 976m US dollar, with an EBITDA margin of 33.6%,
representing an EBITDA margin organic contraction of 23 bps, driven by anticipated commodity cost headwinds and increased sales and marketing investments. Differences in normalized EBITDA margins by region are due to a number of factors such as
different routes to market, share of returnable packaging in the region’s sales and premium product mix. RECONCILIATION BETWEEN NORMALIZED EBITDA AND PROFIT ATTRIBUTABLE TO EQUITY HOLDERS Normalized EBITDA and EBIT are measures utilized by us
to demonstrate the company’s underlying performance. Normalized EBITDA is calculated excluding the following effects from profit attributable to our equity holders: (i) Non-controlling interest, (ii) Income tax expense, (iii) Share of results
of associates, (iv) Non-underlying share of results of associates, (v) Net finance cost, (vi) Non-underlying net finance cost, (vii) Non-underlying items above EBIT (including non-underlying impairment) and (viii) Depreciation, amortization and
impairment. AB InBev – Annual Report 2023 57
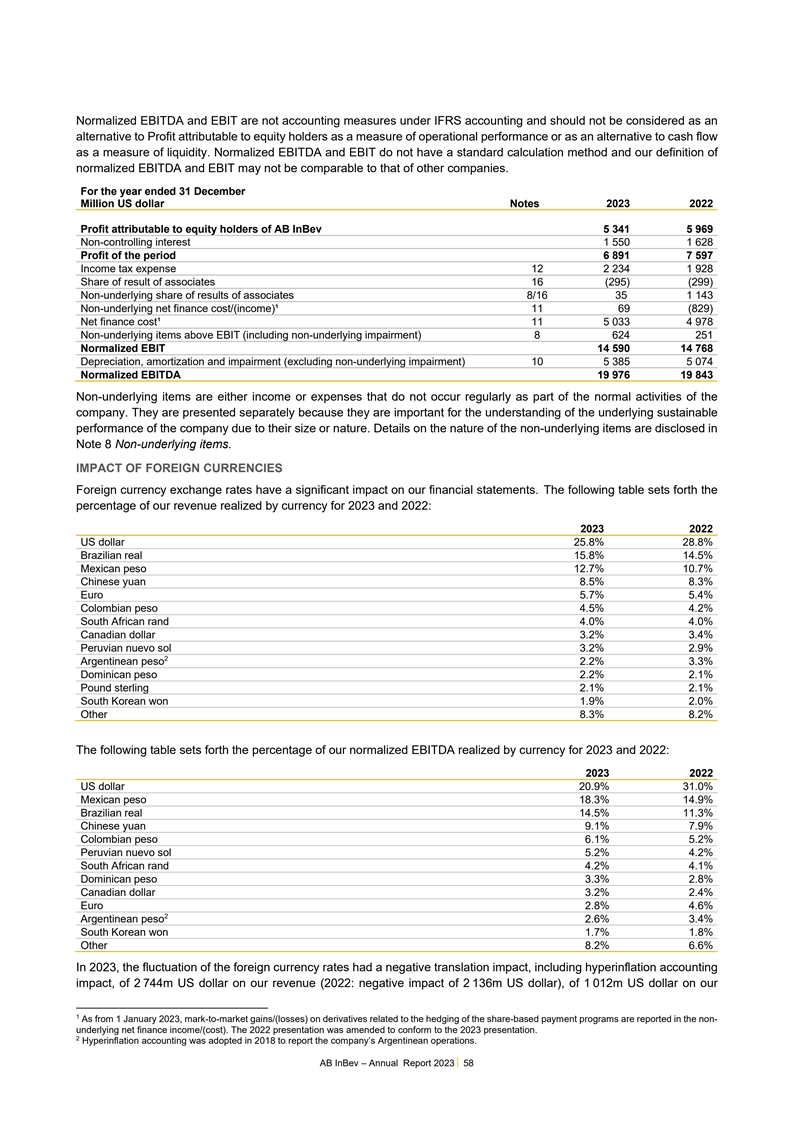
Normalized EBITDA and EBIT are not accounting measures under IFRS
accounting and should not be considered as an alternative to Profit attributable to equity holders as a measure of operational performance or as an alternative to cash flow as a measure of liquidity. Normalized EBITDA and EBIT do not have a standard
calculation method and our definition of 1 normalized EBITDA and EBIT may not be comparable to that of other companies. For the year ended 31 December Million US dollar Notes 2023 2022 . Profit attributable to equity holders of AB InBev 5 341 5 969
Non-controlling interest 1 550 1 628 Profit of the period 6 891 7 597 Income tax expense 12 2 234 1 928 Share of result of associates 16 (295) (299) Non-underlying share of results of associates 8/16 35 1 143 Non-underlying net finance
cost/(income)¹ 11 69 (829) Net finance cost¹ 11 5 033 4 978 Non-underlying items above EBIT (including non-underlying impairment) 8 624 251 Normalized EBIT 14 590 14 768 Depreciation, amortization and impairment (excluding non-underlying
impairment) 10 5 385 5 074 Normalized EBITDA 19 976 19 843 Non-underlying items are either income or expenses that do not occur regularly as part of the normal activities of the company. They are presented separately because they are important for
the understanding of the underlying sustainable performance of the company due to their size or nature. Details on the nature of the non-underlying items are disclosed in Note 8 Non-underlying items. IMPACT OF FOREIGN CURRENCIES 2 Foreign currency
exchange rates have a significant impact on our financial statements. The following table sets forth the percentage of our revenue realized by currency for 2023 and 2022: 2023 2022 US dollar 25.8% 28.8% Brazilian real 15.8% 14.5% Mexican peso 12.7%
10.7% Chinese yuan 8.5% 8.3% Euro 5.7% 5.4% Colombian peso 4.5% 4.2% South African rand 4.0% 4.0% Canadian dollar 3.2% 3.4% Peruvian nuevo sol 3.2% 2.9% 2 Argentinean peso 2.2% 3.3% Dominican peso 2.2% 2.1% Pound sterling 2.1% 2.1% South Korean won
1.9% 2.0% Other 8.3% 8.2% The following table sets forth the percentage of our normalized EBITDA realized by currency for 2023 and 2022: 2023 2022 US dollar 20.9% 31.0% Mexican peso 18.3% 14.9% Brazilian real 14.5% 11.3% Chinese yuan 9.1% 7.9%
Colombian peso 6.1% 5.2% Peruvian nuevo sol 5.2% 4.2% South African rand 4.2% 4.1% Dominican peso 3.3% 2.8% Canadian dollar 3.2% 2.4% Euro 2.8% 4.6% 2 Argentinean peso 2.6% 3.4% South Korean won 1.7% 1.8% Other 8.2% 6.6% In 2023, the fluctuation of
the foreign currency rates had a negative translation impact, including hyperinflation accounting impact, of 2 744m US dollar on our revenue (2022: negative impact of 2 136m US dollar), of 1 012m US dollar on our 1 As from 1 January 2023,
mark-to-market gains/(losses) on derivatives related to the hedging of the share-based payment programs are reported in the non- underlying net finance income/(cost). The 2022 presentation was amended to conform to the 2023 presentation. 2
Hyperinflation accounting was adopted in 2018 to report the company’s Argentinean operations. AB InBev – Annual Report 2023 58
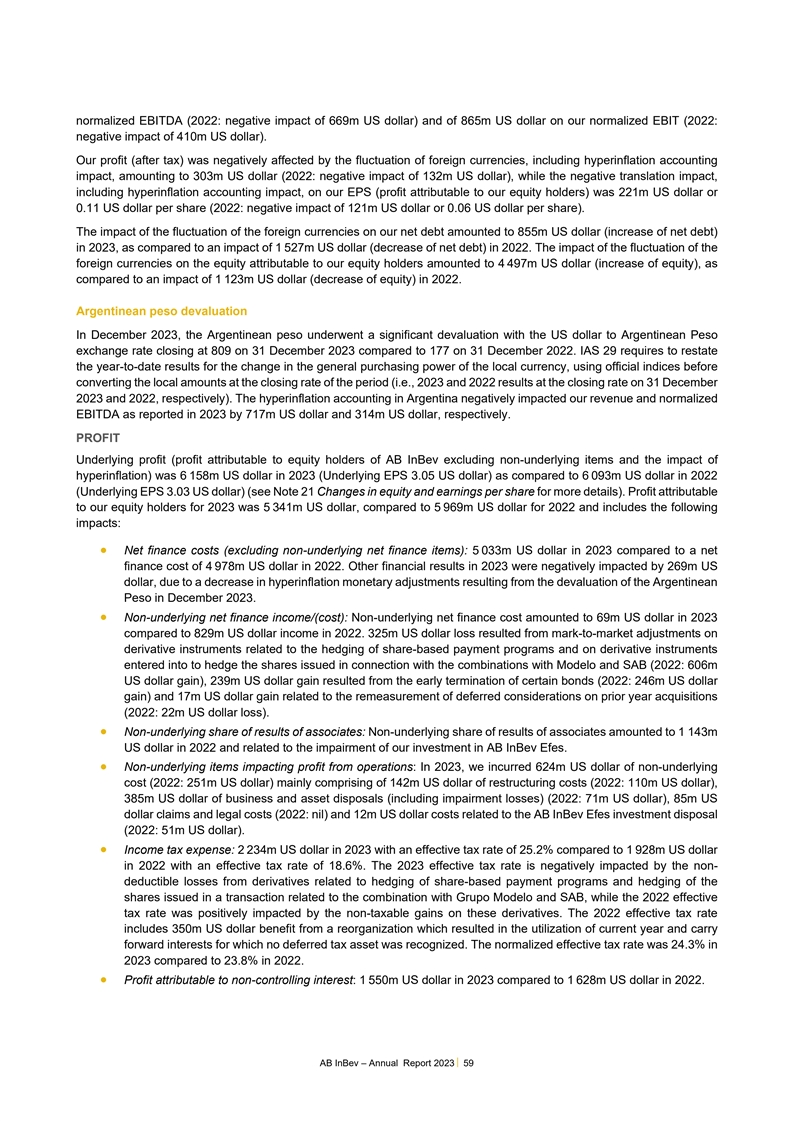
normalized EBITDA (2022: negative impact of 669m US dollar) and of 865m
US dollar on our normalized EBIT (2022: negative impact of 410m US dollar). Our profit (after tax) was negatively affected by the fluctuation of foreign currencies, including hyperinflation accounting impact, amounting to 303m US dollar (2022:
negative impact of 132m US dollar), while the negative translation impact, including hyperinflation accounting impact, on our EPS (profit attributable to our equity holders) was 221m US dollar or 0.11 US dollar per share (2022: negative impact of
121m US dollar or 0.06 US dollar per share). The impact of the fluctuation of the foreign currencies on our net debt amounted to 855m US dollar (increase of net debt) in 2023, as compared to an impact of 1 527m US dollar (decrease of net debt) in
2022. The impact of the fluctuation of the foreign currencies on the equity attributable to our equity holders amounted to 4 497m US dollar (increase of equity), as compared to an impact of 1 123m US dollar (decrease of equity) in 2022. Argentinean
peso devaluation In December 2023, the Argentinean peso underwent a significant devaluation with the US dollar to Argentinean Peso exchange rate closing at 809 on 31 December 2023 compared to 177 on 31 December 2022. IAS 29 requires to restate the
year-to-date results for the change in the general purchasing power of the local currency, using official indices before converting the local amounts at the closing rate of the period (i.e., 2023 and 2022 results at the closing rate on 31 December
2023 and 2022, respectively). The hyperinflation accounting in Argentina negatively impacted our revenue and normalized EBITDA as reported in 2023 by 717m US dollar and 314m US dollar, respectively. PROFIT Underlying profit (profit attributable to
equity holders of AB InBev excluding non-underlying items and the impact of hyperinflation) was 6 158m US dollar in 2023 (Underlying EPS 3.05 US dollar) as compared to 6 093m US dollar in 2022 (Underlying EPS 3.03 US dollar) (see Note 21 Changes in
equity and earnings per share for more details). Profit attributable to our equity holders for 2023 was 5 341m US dollar, compared to 5 969m US dollar for 2022 and includes the following impacts: • Net finance costs (excluding non-underlying
net finance items): 5 033m US dollar in 2023 compared to a net finance cost of 4 978m US dollar in 2022. Other financial results in 2023 were negatively impacted by 269m US dollar, due to a decrease in hyperinflation monetary adjustments resulting
from the devaluation of the Argentinean Peso in December 2023. • Non-underlying net finance income/(cost): Non-underlying net finance cost amounted to 69m US dollar in 2023 compared to 829m US dollar income in 2022. 325m US dollar loss
resulted from mark-to-market adjustments on derivative instruments related to the hedging of share-based payment programs and on derivative instruments entered into to hedge the shares issued in connection with the combinations with Modelo and SAB
(2022: 606m US dollar gain), 239m US dollar gain resulted from the early termination of certain bonds (2022: 246m US dollar gain) and 17m US dollar gain related to the remeasurement of deferred considerations on prior year acquisitions (2022: 22m US
dollar loss). • Non-underlying share of results of associates: Non-underlying share of results of associates amounted to 1 143m US dollar in 2022 and related to the impairment of our investment in AB InBev Efes. • Non-underlying items
impacting profit from operations: In 2023, we incurred 624m US dollar of non-underlying cost (2022: 251m US dollar) mainly comprising of 142m US dollar of restructuring costs (2022: 110m US dollar), 385m US dollar of business and asset disposals
(including impairment losses) (2022: 71m US dollar), 85m US dollar claims and legal costs (2022: nil) and 12m US dollar costs related to the AB InBev Efes investment disposal (2022: 51m US dollar). • Income tax expense: 2 234m US dollar in
2023 with an effective tax rate of 25.2% compared to 1 928m US dollar in 2022 with an effective tax rate of 18.6%. The 2023 effective tax rate is negatively impacted by the non- deductible losses from derivatives related to hedging of share-based
payment programs and hedging of the shares issued in a transaction related to the combination with Grupo Modelo and SAB, while the 2022 effective tax rate was positively impacted by the non-taxable gains on these derivatives. The 2022 effective tax
rate includes 350m US dollar benefit from a reorganization which resulted in the utilization of current year and carry forward interests for which no deferred tax asset was recognized. The normalized effective tax rate was 24.3% in 2023 compared to
23.8% in 2022. • Profit attributable to non-controlling interest: 1 550m US dollar in 2023 compared to 1 628m US dollar in 2022. AB InBev – Annual Report 2023 59
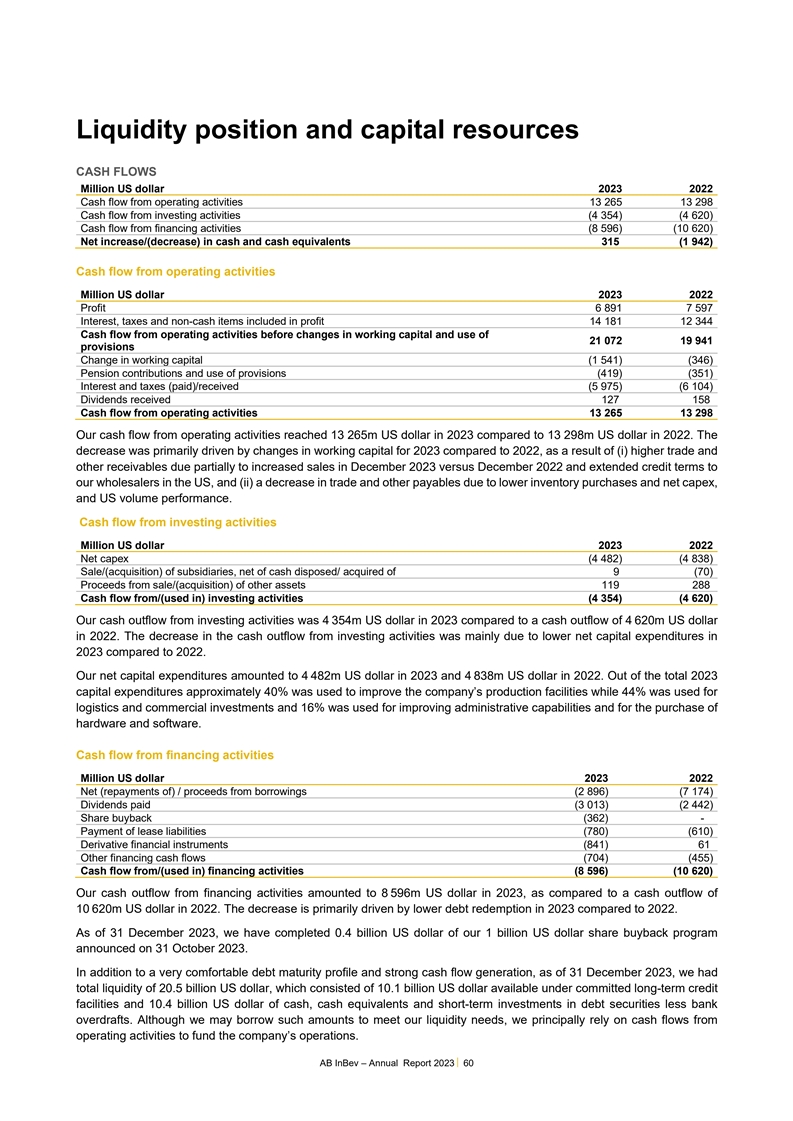
Liquidity position and capital resources CASH FLOWS Million US dollar
2023 2022 Cash flow from operating activities 13 265 13 298 Cash flow from investing activities (4 354) (4 620) Cash flow from financing activities (8 596) (10 620) Net increase/(decrease) in cash and cash equivalents 315 (1 942) Cash flow from
operating activities Million US dollar 2023 2022 Profit 6 891 7 597 Interest, taxes and non-cash items included in profit 14 181 12 344 Cash flow from operating activities before changes in working capital and use of 21 072 19 941 provisions Change
in working capital (1 541) (346) Pension contributions and use of provisions (419) (351) Interest and taxes (paid)/received (5 975) (6 104) Dividends received 127 158 Cash flow from operating activities 13 265 13 298 Our cash flow from operating
activities reached 13 265m US dollar in 2023 compared to 13 298m US dollar in 2022. The decrease was primarily driven by changes in working capital for 2023 compared to 2022, as a result of (i) higher trade and other receivables due partially to
increased sales in December 2023 versus December 2022 and extended credit terms to our wholesalers in the US, and (ii) a decrease in trade and other payables due to lower inventory purchases and net capex, and US volume performance. Cash flow from
investing activities Million US dollar 2023 2022 Net capex (4 482) (4 838) Sale/(acquisition) of subsidiaries, net of cash disposed/ acquired of 9 (70) Proceeds from sale/(acquisition) of other assets 119 288 Cash flow from/(used in) investing
activities (4 354) (4 620) Our cash outflow from investing activities was 4 354m US dollar in 2023 compared to a cash outflow of 4 620m US dollar in 2022. The decrease in the cash outflow from investing activities was mainly due to lower net capital
expenditures in 2023 compared to 2022. Our net capital expenditures amounted to 4 482m US dollar in 2023 and 4 838m US dollar in 2022. Out of the total 2023 capital expenditures approximately 40% was used to improve the company’s production
facilities while 44% was used for logistics and commercial investments and 16% was used for improving administrative capabilities and for the purchase of hardware and software. Cash flow from financing activities Million US dollar 2023 2022 Net
(repayments of) / proceeds from borrowings (2 896) (7 174) Dividends paid (3 013) (2 442) Share buyback (362) - Payment of lease liabilities (780) (610) Derivative financial instruments (841) 61 Other financing cash flows (704) (455) Cash flow
from/(used in) financing activities (8 596) (10 620) Our cash outflow from financing activities amounted to 8 596m US dollar in 2023, as compared to a cash outflow of 10 620m US dollar in 2022. The decrease is primarily driven by lower debt
redemption in 2023 compared to 2022. As of 31 December 2023, we have completed 0.4 billion US dollar of our 1 billion US dollar share buyback program announced on 31 October 2023. In addition to a very comfortable debt maturity profile and strong
cash flow generation, as of 31 December 2023, we had total liquidity of 20.5 billion US dollar, which consisted of 10.1 billion US dollar available under committed long-term credit facilities and 10.4 billion US dollar of cash, cash equivalents and
short-term investments in debt securities less bank overdrafts. Although we may borrow such amounts to meet our liquidity needs, we principally rely on cash flows from operating activities to fund the company’s operations. AB InBev –
Annual Report 2023 60
CAPITAL RESOURCES AND EQUITY Our objective to maximize long-term value
creation is driven by our focus on three areas: disciplined resource allocation, robust risk management and an efficient capital structure. We continued to deliver strong free cash flow, generating approximately 8.8 billion US dollar (2022: 8.5
billion US dollar). As a result, this year we continued to deleverage. Our net debt amounted to 67.6 billion US dollar as of 31 December 2023 as compared to 69.7 billion US dollar as of 31 December 2022. Net debt is defined as non-current and
current interest-bearing loans and borrowings and bank overdrafts minus debt securities and cash and cash equivalents. Net debt is a financial performance indicator that is used by our management to highlight changes in the company’s overall
liquidity position. We believe that net debt is meaningful for investors as it is one of the primary measures our management uses when evaluating our progress towards deleveraging toward our optimal net debt to normalized EBITDA ratio of around 2x.
Our net debt decreased by 2.1 billion US dollar as of 31 December 2023 compared to 31 December 2022. Aside from operating results that are net of capital expenditures, the net debt is impacted mainly by the payment of interests and taxes (5.8
billion US dollar increase of net debt), dividend payments to shareholders of AB InBev and Ambev (3.0 billion US dollar increase of net debt), foreign exchange impact on net debt (0.9 billion US dollar increase of net debt) and the payment for the
share buyback (0.4 billion US dollar increase of net debt). Net debt to normalized EBITDA decreased from 3.51x for the 12-month period ending 31 December 2022 to 3.38x for the 12-month period ending 31 December 2023. Our optimal capital structure is
a net debt to normalized EBITDA ratio of around 2x and we will continue to proactively manage our debt portfolio. Consolidated equity attributable to our equity holders as at 31 December 2023 was 81 848m US dollar, compared to 73 398m US dollar as
at 31 December 2022. The net increase in equity results from the profit attributable to equity shareholders and the net foreign exchange gains on translation of foreign operations primarily related to the combined effect of the appreciation of the
closing rates of the Colombian peso and the Mexican peso and the weakening of the closing rate of the Argentinean peso and the South African rand, which resulted in a foreign exchange translation adjustment of 4 497m US dollar as of 31 December 2023
(increase of equity). Further details on interest-bearing loans and borrowings, repayment schedules and liquidity risk, are disclosed in Note 22 Interest-bearing loans and borrowings and Note 27 Risks arising from financial instruments. As of 31
December 2023, the company’s credit rating from Standard & Poor’s was A- for long-term obligations and A-2 for short-term obligations, with a stable outlook, and the company’s credit rating from Moody’s Investors Service
was A3 for long-term obligations and P-2 for short-term obligations, with a stable outlook. Research and development Given our focus on innovation, we place a high value on research and development (R&D). In 2023, we spent 256m US dollar in
research and development (2022: 268m US dollar). The spend focused on product innovations, market research, as well as process optimization and product development. R&D in product innovation covers liquid, packaging and draft innovation. Product
innovation consists of breakthrough innovation, incremental innovation and reformulation. The main goal for the innovation process is to provide consumers with better products and experiences. This implies launching new liquid, new packaging and new
draught products that deliver better experience for the consumer and better performance of top-line results, by increasing our competitiveness in the relevant markets. With consumers comparing products and experiences offered across very different
drink categories and the offerings of beverages increasing, our research and development efforts also require an understanding of the strengths and weaknesses of other beverage categories, spotting opportunities for beer and developing consumer
solutions (products) that better address consumer need and deliver better experience. This requires understanding consumer emotions and expectations. Sensory experience, premiumization, convenience, sustainability and design are all central to our
R&D efforts. R&D in process optimization is primarily aimed at quality improvement, better efficiency, capacity increase (brewery debottlenecking and addressing volume issues, while minimizing capital expenditure) and improving efficiency.
Newly developed processes, materials and/or equipment are documented in best practices and shared across business regions. Current projects range from malting to bottling of finished products. Our R&D efforts are also directed towards reduction
of carbon footprint in our operations, but also of our packages. Projects range from process innovations that reduce energy in production process steps, but also focus on making packages lighter, increase the amount of recycled content, and convert
to more returnable packaging. AB InBev – Annual Report 2023 61
In the biotech space, our R&D teams are working on solutions to
upcycle co-product streams, but also to provide protein solutions through precision fermentation. Knowledge management and learning is also an integral part of R&D. We seek to continuously increase our knowledge through collaborations with
universities, startups and suppliers. We believe strongly in open innovation as an answer to rapidly changing needs and external environment, and our innovation process is designed to create an innovation ecosystem. Our R&D team is deeply
connected with the company's and the business regions' priorities and approves concepts which are subsequently prioritized for development. The R&D teams invest in both short- and long-term strategic projects for future growth, with the launch
time depending on complexity and prioritization. Launch time usually falls within the next calendar year, but at the same time new concepts are developed that will only be implemented within a time horizon of 2-5 years. The Global Innovation and
Technology Center (“GITeC”), located in Leuven, accommodates the Packaging, Product, Process Development teams and facilities such as Labs, Experimental Brewery and the European Central Lab, which also includes Sensory Analysis. In
addition to GITeC, we also have Product, Packaging and Process development teams located in each of our geographic regions focusing on the short-term needs of such regions. Risks and uncertainties Under the explicit understanding that this is not an
exhaustive list, AB InBev’s major risk factors and uncertainties are listed below. There may be additional risks which AB InBev is unaware of. There may also be risks AB InBev now believes to be immaterial, but which could turn out to have a
material adverse effect. Moreover, if and to the extent that any of the risks described below materialize, they may occur in combination with other risks which would compound the adverse effect of such risks. The sequence in which the risk factors
are presented below is not indicative of their likelihood of occurrence or of the potential magnitude of their financial consequence. AB InBev’s business, financial condition and operating results have been and may continue to be negatively
impacted by risks associated with global, regional and local economic weakness and uncertainty, including those resulting from an economic downturn, inflation, geopolitical instability (such as the ongoing conflict between Russia and Ukraine and in
the Middle East, including the conflict in the Red Sea), increases in energy prices, public health crises, changes in government policies and/or increased interest rates. Consumption of beer and other alcohol and non-alcohol beverages in many of the
jurisdictions in which AB InBev operates is closely linked to general economic conditions and changes in disposable income. Difficult macroeconomic conditions in AB InBev’s key markets have adversely affected the demand for AB InBev’s
products in the past and may in the future have a material adverse effect on the demand for AB InBev’s products, which in turn could result in lower revenue and reduced profit. Inflationary pressures and supply chain disruptions may result in
significant increases to its expenses, including direct materials, wages, energy and transportation costs. In cases of sustained and elevated inflation across several of its key markets, it may be difficult for AB InBev to effectively manage the
increases to its costs and it may not able to pass these increased costs to its customers. Significant further deterioration in economic conditions may also cause AB InBev’s suppliers, distributors and other third-party partners to experience
financial or operational difficulties that they cannot overcome, impairing their ability to satisfy their obligations to AB InBev, in which case AB InBev’s business and results of operations could be adversely affected. A continuation or
worsening of the levels of market disruption and volatility seen in the recent past could have an adverse effect on AB InBev’s ability to access capital, its business, results of operations and financial condition, and on the market price of
its shares and American Depositary Shares. AB InBev’s business, financial performance and results of operations have been, and may continue to be, adversely affected by military conflicts and their related consequences. AB InBev’s
business, financial performance and results of operations have been adversely affected by the ongoing conflict between Russia and Ukraine. In April 2022, AB InBev announced its decision to sell its non-controlling interest in the AB InBev Efes joint
venture, de-recognized the investment and reported a 1.1 billion US dollar non-cash impairment charge in non-underlying share of results of associates as of 30 June 2022. In December 2023, AB InBev announced that its joint venture partner and the
controlling shareholder of AB InBev Efes, Turkish brewer Anadolu Efes, has agreed to acquire the entirety of AB InBev’s non-controlling interest in AB InBev Efes and no amount will be paid to AB InBev on closing. The completion of the
transaction is subject to customary closing conditions, including required regulatory and governmental approvals. There can be no guarantee when or whether these approvals will be obtained. Any payments AB InBev receives after completion will be
subject to additional regulatory approvals and are expected to be not material. In connection with the ongoing conflict between Russia and Ukraine, various governmental authorities, including in the E.U. and the U.S., have imposed sanctions and
other restrictive measures AB InBev – Annual Report 2023 62
against Russia, including export controls and restrictions on carrying
out certain activities in Russia or in support of Russian businesses. As a result of the conflict and international reactions thereto, Russian authorities have also imposed various economic and financial restrictions, including currency controls and
restrictions on transacting with non-Russian parties. The implementation or expansion of these sanctions, trade restrictions, export and currency controls and other restrictive measures may make it difficult for AB InBev to divest its
non-controlling interest in the AB InBev Efes joint venture or for AB InBev Efes to remit cash from Russia to other jurisdictions. Any failure to comply with applicable sanctions and restrictions could subject AB InBev to regulatory penalties and
reputational risk. Even though AB InBev is divesting its interest in the AB InBev Efes joint venture, these developments have had, and may continue to have, an adverse impact on the company’s business, financial performance and results of
operations, and could result in damage to its reputation. The broader geopolitical and economic impacts of the ongoing conflict between Russia and Ukraine and in the Middle East, including the conflict in the Red Sea, could have the effect of
heightening other risks described herein, including, but not limited to, adverse effects on economic and political conditions in AB InBev’s key markets, further disruptions to global supply chains and increases in commodity and energy prices
with follow-on global inflationary impacts, additional sanctions and restrictive measures, increased risk of cyber incidents or other disruptions to AB InBev’s information systems, which could materially and adversely affect AB InBev’s
business and results of operations. The ultimate impact of these disruptions depends on events beyond AB InBev’s knowledge or control, including the scope and duration of the conflict and actions taken by parties other than AB InBev to respond
to them, and cannot be predicted. AB InBev’s results of operations are affected by fluctuations in exchange rates. Any change in exchange rates between AB InBev’s operating companies’ functional currencies and the US dollar will
affect its consolidated income statement and statement of financial position when the results of those operating companies are translated into US dollar for reporting purposes as translational exposures are not hedged. Additionally, there can be no
assurance that the policies in place to manage commodity price and transactional foreign currency risks to protect AB InBev’s exposure will be able to successfully hedge against the effects of such foreign exchange exposure, especially over
the long-term. Furthermore, the use of financial instruments to mitigate currency risk and any other efforts taken to better match the effective currencies of AB InBev’s liabilities to its cash flows could result in increased costs. Following
the categorization of Argentina as a country with a three-year cumulative inflation rate greater than 100%, the country is considered as a hyperinflationary economy in accordance with IFRS rules (IAS 29), resulting in the restatement of certain
results for hyperinflation accounting. If the economic or political situation in Argentina further deteriorates, AB InBev’s South America operations may be impacted by additional restrictions under new Argentinean foreign exchange, export
repatriation or expropriation regimes that could adversely affect AB InBev’s ability to access funds from Argentina, financial condition and operating results. AB InBev may not be able to obtain the necessary funding for its future capital or
refinancing needs and may face financial risks due to its level of debt and uncertain market conditions. AB InBev may be required to raise additional funds for its future capital needs or to refinance its current indebtedness through public or
private financing, strategic relationships or other arrangements and there can be no assurance that the funding, if needed, will be available or provided on attractive terms. AB InBev has incurred substantial indebtedness by accessing the bond
markets from time to time based on its financial needs, including as a result of the acquisition of SAB. For the near term, the portion of AB InBev’s consolidated statement of financial position represented by debt is expected to remain higher
as compared to its historical position. AB InBev’s increased level of debt could have significant consequences for AB InBev, including (i) increasing its vulnerability to general adverse economic and industry conditions, (ii) limiting its
flexibility in planning for, or reacting to, changes in its business and the industry in which it operates, (iii) impairing its ability to obtain additional financing in the future and limiting its ability to fund future working capital and capital
expenditures, to engage in future acquisitions or development activities or to otherwise realize the value of its assets and opportunities fully, (iv) requiring AB InBev to issue additional equity (potentially under unfavorable market conditions),
(v) limiting its ability to pay dividends or pursue other capital distributions to shareholders, and (vi) placing AB InBev at a competitive disadvantage compared to its competitors that have less debt. AB InBev’s ability to repay and
renegotiate its outstanding indebtedness will be dependent upon market conditions. Unfavorable conditions, including significant price volatility, dislocations and liquidity disruptions in the global credit markets in recent years, as well as
downward pressure on credit capacity for certain issuers without regard to those issuers’ underlying financial strength, could increase costs beyond what is currently anticipated. Such costs could have a material adverse impact on AB
InBev’s cash flows, results of operations or both. While AB InBev aims to dynamically allocate its surplus free cash flow (remaining after investments in its business) to balance its leverage, return cash to shareholders and pursue selective
mergers and acquisitions, the company’s level of debt may restrict the amount of dividends it is able to pay. Also, a credit rating downgrade could have a material adverse effect on AB InBev’s ability to finance its ongoing operations or
to refinance its existing indebtedness. In addition, an inability of AB InBev to refinance all or a substantial amount of its debt obligations when they become due, or more generally a failure to raise additional equity capital or debt financing or
AB InBev – Annual Report 2023 63
to realize proceeds from asset sales when needed, could have a material
adverse effect on its financial condition and results of operations. AB InBev’s results could be negatively affected by increasing interest rates. Although AB InBev enters into interest rate swap agreements to manage its interest rate risk and
also enters into cross-currency interest rate swap agreements to manage both its foreign currency risk and interest-rate risk on interest-bearing financial liabilities, there can be no assurance that such instruments will be successful in reducing
the risks inherent in exposures to interest rate fluctuations. The ability of AB InBev’s subsidiaries to distribute cash upstream may be subject to various conditions and limitations, including, but not limited to, currency controls and
restrictions, accounting principles and illiquidity, inconvertibility or non- transferability of a specified currency. Certain of AB InBev’s subsidiaries, including Ambev, may be required to secure their performance of potential obligations
under certain agreements and legal proceedings. If these subsidiaries experience difficulties in obtaining or renewing financial instruments required to secure their performance and AB InBev does not provide guarantees in respect of their
obligations under such financial instruments, these subsidiaries may be required to pay higher fees, post additional collateral or use a substantial portion of their cash to secure such obligations, which may adversely affect their available cash
flows and liquidity and AB InBev’s subsequent ability to receive cash upstream. The inability to obtain sufficient cash flows from its domestic and foreign subsidiaries and affiliated companies could adversely impact AB InBev’s ability
to pay dividends and otherwise negatively impact its business, results of operations and financial condition. Changes in the availability or price of raw materials, commodities, energy and water, including as a result of geopolitical instability,
inflationary pressures, currency fluctuations, constraints on sourcing and unexpected increases in tariffs on such raw materials and commodities, like aluminum, could have an adverse effect on AB InBev's results of operations to the extent that AB
InBev fails to adequately manage the risks inherent in such volatility, including if AB InBev’s hedging and derivative arrangements do not effectively or completely hedge against foreign currency risks and changes in commodity prices. AB InBev
experienced higher commodity, raw materials and logistics costs in 2022 and the first half of 2023, which may continue. Energy prices have been subject to significant price volatility in the recent past and may be again in the future, including as a
result of the ongoing conflict between Russia and Ukraine and in the Middle East, including the conflict in the Red Sea. High energy prices over an extended period of time and disruptions or constraints in the availability of shipping or
transportation services may affect the price or availability of raw materials or commodities required for AB InBev’s products, and may adversely affect AB InBev’s operations. AB InBev may not be able to increase its prices to offset
these increased costs or increase its prices without suffering reduced volume, revenue and operating income. Negative publicity surrounding the company, its brands, its activities, its advertising campaigns, its personnel or its business partners,
and consumer perception of the company’s response to political and social issues or catastrophic events could damage its reputation or the image of its brands, may decrease demand for its products and may adversely affect the company’s
business, financial condition and/or the market price of its shares and American Depositary Shares. AB InBev’s reputation and the image of its brands could be damaged as a result of consumers’ perceptions of its support of, association
with or lack of support or disapproval of certain social causes. Further, campaigns by activists or other public figures, whether or not warranted, connecting the company, its personnel, its supply chain, its products or its business partners with a
failure to maintain high ethical, business and environmental, social and governance practices, including with respect to human rights, workplace conditions and employee health and safety, whether actual or perceived, could adversely impact the
company’s reputation or the image of its brands. Social media, which accelerates and potentially amplifies the scope of negative publicity, can increase the challenges of responding to negative claims, even if such claims are untrue. AB
InBev’s sponsorship relations and promotional partnerships may also subject it to negative publicity as a result of any actual or alleged conduct, or consumers’ perceptions of socio-political views expressed, by its promotional partners
or individuals and entities associated with organizations AB InBev sponsors or supports. Negative claims or publicity involving the company’s sponsorship or promotional partners, including as a result of any of their activities that harm their
public image or reputation, could also have an adverse effect on AB InBev’s reputation or the image of its brands. These and other factors have reduced in the past, and could continue to reduce, consumers’ willingness to purchase certain
of AB InBev’s products, thereby adversely affecting its business. Certain of AB InBev's operations depend on effective distribution networks to deliver its products to consumers, and distributors play an important role in distributing a
significant proportion of beer and other beverages. Generally, distributors purchase AB InBev’s products from AB InBev and then sell them either to other distributors or points of sale. Such distributors are either government-controlled or
privately owned but independent wholesale distributors, and there can be no assurance that such distributors will not give priority to AB InBev's competitors. Further, any inability of AB InBev to replace unproductive or inefficient distributors, or
any limitations imposed on AB InBev to purchase or own any interest in distributors or wholesalers as a result of contractual restrictions, regulatory changes, changes in legislation or the interpretations of legislation by regulators or courts
could adversely impact AB InBev's business, results of operations and financial condition. AB InBev – Annual Report 2023 64
The continued consolidation of retailers in markets in which AB InBev
operates could result in reduced profitability for the beer industry as a whole and indirectly adversely affect AB InBev's financial results. AB InBev relies on key third parties, including key suppliers, for a range of raw materials for its beer,
alcoholic beverages and soft drinks, and for packaging material. The termination of or any material change to arrangements with certain key suppliers or the failure of a key supplier to meet its contractual obligations could have a material impact
on AB InBev's production, distribution and sale of beer, alcoholic beverages and soft drinks and have a material adverse effect on AB InBev's business, results of operations, cash flows or financial condition. For certain packaging supplies and raw
materials, AB InBev relies on a small number of important suppliers and certain of AB InBev’s subsidiaries may purchase nearly all of their key packaging materials from sole suppliers under multi-year contracts. The loss of or temporary
discontinuity of supply from any of these suppliers without sufficient time to develop an alternative source could cause AB InBev to spend increased amounts on such supplies in the future. In addition, a number of key brand names are both licensed
to third-party brewers and used by companies over which AB InBev does not have control. Although AB InBev monitors brewing quality to ensure its high standards, to the extent that one of these key brand names or joint ventures, companies in which AB
InBev does not own a controlling interest and/or AB InBev’s licensees are subject to negative publicity, it could have a material adverse effect on AB InBev’s business, results of operations, cash flows or financial condition. A portion
of the company’s global portfolio consists of associates in new or developing markets, including investments where the company may have a lesser degree of control over the business operations. The company faces several challenges inherent to
these various culturally and geographically diverse business interests. Although the company works with its associates on the implementation of appropriate processes and controls, the company also faces additional risks and uncertainties with
respect to these minority investments because the company may be dependent on systems, controls and personnel that are not under the company’s control, such as the risk that the company’s associates may violate applicable laws and
regulations, which could have an adverse effect on the company’s business, reputation, results of operations and financial condition. AB InBev may have a conflict of interest with its majority-owned subsidiaries. For example, a conflict of
interest could arise if a dispute arises concerning an alleged contractual breach, which could materially and adversely affect AB InBev’s financial condition. A conflict of interest may also arise as a result of any dual roles played by AB
InBev directors who may also be directors, managers or senior officers of the subsidiary. Notwithstanding policies and procedures to address the possibility of such conflicts of interest, AB InBev may not be able to resolve all such conflicts on
terms favorable to AB InBev. The size of AB InBev, contractual limitations it is subject to and its position in the markets in which it operates may decrease its ability to successfully carry out further acquisitions and business integrations. The
size of AB InBev and its position in the markets in which it operates may make it harder to identify suitable candidates for acquisitions or partnerships, including because it may be harder for AB InBev to obtain regulatory approval for future
transactions. If appropriate opportunities do become available, AB InBev may seek to acquire or invest in other businesses; however, any future acquisition may pose regulatory, antitrust and other risks. AB InBev entered into a consent decree with
the U.S. Department of Justice in relation to the combination with SAB, pursuant to which, among other matters, AB InBev’s subsidiary, Anheuser-Busch Companies, LLC, agreed not to acquire control of a distributor if doing so would result in
more than 10% of its annual volume being distributed through distributorships controlled by AB InBev in the U.S. AB InBev’s compliance with its obligations under the settlement agreement is monitored by the U.S. Department of Justice and the
Monitoring Trustee appointed by them. Were AB InBev to fail to fulfill its obligations under the consent decree, whether intentionally or inadvertently, AB InBev could be subject to monetary fines or other penalties. A substantial portion of AB
InBev’s operations are carried out in developing European, African, Asian and Latin American markets. AB InBev’s operations and equity investments in these markets are subject to the usual risks of operating in developing countries,
which include, amongst others, political instability or insurrection, human rights concerns, external interference, financial risks, changes in government policy, political and economic changes, changes in the relations between countries, actions of
governmental authorities affecting trade and foreign investment, regulations on repatriation of funds, interpretation and application of local laws and regulations, enforceability of intellectual property and contract rights, local labor conditions
and regulations, lack of upkeep of public infrastructure, potential political and economic uncertainty, application of exchange controls, nationalization or expropriation, empowerment legislation and policy, corrupt business environments, crime and
lack of law enforcement as well as financial risks, which include risk of illiquidity, inflation, devaluation, price volatility, currency convertibility and country default. Moreover, the economies of developing countries are often affected by
changes in other developing market countries, and, accordingly, adverse changes in developing markets elsewhere in the world could have a negative impact on the markets in which AB InBev operates. Such developing AB InBev – Annual Report 2023
65
market risks could adversely impact AB InBev’s business, results
of operations and financial condition. Furthermore, the global reach of AB InBev’s operations exposes it to risks associated with doing business globally, including changes in tariffs. The Office of the United States Trade Representative has
enacted tariffs on certain imports into the United States from China. If significant tariffs or other restrictions are placed on imports from China or any retaliatory trade measures are taken by China, this could have a material adverse effect on
global economic conditions and the stability of global financial markets, and may significantly reduce global trade, which in turn could have a material adverse effect on AB InBev’s business in one or more of its key markets and results of
operations. Competition and changing consumer preferences in its various markets and increased purchasing power of retailers in AB InBev’s distribution channels could cause AB InBev to reduce prices of its products, increase capital
investment, increase marketing and other expenditures or prevent AB InBev from increasing prices to recover higher costs and thereby cause AB InBev to reduce margins or lose market share. AB InBev may not be able to anticipate or respond adequately
to changes in consumer preferences and tastes or developments in new forms of media and marketing, and AB InBev’s marketing, promotional and advertising programs may not be successful in reaching consumers in the way it intends. Also,
innovation faces inherent risks, and the new products AB InBev introduces may not be successful, while competitors may be able to respond more quickly to the emerging trends, such as the increasing consumer preference for “craft beers”
produced by microbreweries and the growth of the spirit-based ready-to-drink category in certain markets. Furthermore, in recent years, many industries have seen disruption from non-traditional producers and distributors, in many cases, due to a
rapidly evolving digital landscape. AB InBev’s business could be negatively affected if it is unable to anticipate changing consumer preferences for digital platforms or fails to continuously strengthen and evolve its capabilities in digital
commerce and marketing. The success of the company’s digital commerce activities depends in part on its ability to attract wholesalers, retailers and consumers to use its offerings and retain these relationships, which may be impacted by
regulatory requirements, competitive pressures and other factors beyond its control. Any of the foregoing could have a material adverse effect on AB InBev's business, financial condition and results of operations. If any of AB InBev’s products
is defective or found to contain contaminants, AB InBev may be subject to product recalls or other associated liabilities. Although AB InBev maintains insurance against certain product liability (but not product recall) risks, it may not be able to
enforce its rights in respect of these policies and, in the event that contamination or a defect occurs, any amounts it recovers may not be sufficient to offset any damage it may suffer, which could adversely impact its business, reputation,
prospects, results of operations and financial condition. In recent years, there has been public and political attention directed at the soft drinks and alcoholic beverage industries, as a result of an increasing emphasis on health and well-being.
Concerns about the health consequences of consuming alcohol beverages and increased activity from anti-alcohol groups or other bodies, such as the World Health Organization, advocating for measures designed to reduce the consumption of alcohol
beverages may reduce demand for certain of AB InBev’s products, which could adversely affect its profitability. Despite the progress it has made on its Smart Drinking Goals, AB InBev may be criticized and experience an increase in the number
of publications and studies debating its efforts to reduce the harmful consumption of alcohol, as advocates try to shape the public discussions. AB InBev may also be subject to laws and regulations aimed at reducing the affordability or availability
of beer in some of its markets. Additional regulatory restrictions on AB InBev’s business, such as those on the legal minimum drinking age, product labeling, opening hours or marketing activities, may cause the social acceptability of beer to
decline significantly and consumption trends to shift away from it, which could have a material adverse effect on AB InBev’s business, financial condition and results of operations. Negative publicity and campaigns by activists or other public
figures, whether or not warranted, connecting AB InBev, its supply chain or its business partners with workplace and human rights issues, whether actual or perceived, could adversely impact AB InBev’s reputation and may cause its business to
suffer. AB InBev has adopted policies making a number of commitments to respect human rights, including its commitment to the principles and guidance contained in the UN Guiding Principles on Business and Human Rights. Allegations, even if untrue,
that AB InBev is not respecting its commitments or actual or perceived failure by its suppliers or other business partners to comply with applicable workplace and labor laws, including child labor laws, or their actual or perceived abuse or misuse
of migrant workers could negatively affect AB InBev’s reputation and the image of its brands and may adversely affect its business. AB InBev is now, and may in the future be, a party to legal proceedings and claims, including collective suits
(class actions), and significant damages may be asserted against it. Given the inherent uncertainty of litigation, it is possible that AB InBev might incur liabilities as a consequence of the proceedings and claims brought against it, including
those that are not currently believed by it to be reasonably possible, which could have a material adverse effect on AB InBev’s business, results of operations, cash flows or financial position. Important contingencies are disclosed in Note 29
Contingencies of the 2023 consolidated financial statements. AB InBev could incur significant costs as a result of compliance with, and/or violations of or liabilities under, various regulations that govern AB InBev’s operations or the
operations of its licensed third parties, including personal data AB InBev – Annual Report 2023 66
protection laws such as the General Data Protection Regulation adopted
in the European Union, the California Consumer Privacy Act, the Personal Information Protection Law of the People’s Republic of China and the General Personal Data Protection Law adopted in Brazil. AB InBev may be subject to adverse changes in
taxation, which makes up a large proportion of the cost of beer charged to consumers in many jurisdictions. Increases in excise and other indirect taxes applicable to AB InBev’s products tend to adversely affect AB InBev’s revenue or
margins, both by reducing overall consumption and by encouraging consumers to switch to other categories of beverages, including unrecorded or informal alcohol products, which could adversely affect the financial results of AB InBev as well as its
results of operations. Minimum pricing is another form of fiscal regulation that can affect AB InBev’s profitability. Furthermore, AB InBev may be subject to increased taxation on its operations by national, local or foreign authorities, to
higher corporate income tax rates or to new or modified taxation regulations and requirements (including potential changes in Brazil). For example, in response to the increasing globalization and digitalization of trade and business operations, the
Organization for Economic Co-operation and Development (OECD) has been working on international tax reform as an extension of its Base Erosion and Profit Shifting project. The reform initiative incorporates a two-pillar approach: Pillar One, which
is focused on the re-allocation of some of the taxable profits of multinational enterprises to the markets where consumers are located; and Pillar Two, which is focused on establishing a global minimum corporate taxation rate of 15%. In December
2021, the OECD published detailed rules to assist in the implementation of Pillar Two and in December 2022, the EU Council announced that EU Member States had reached an agreement to implement the minimum tax component (Pillar Two) of the
OECD’s global international tax reform initiative effective 1 January 2024. Most EU Member States have adopted these new rules into their domestic legislation and implementation of these rules could significantly increase compliance burdens
and complexity and may cause increased audit controversy with competent tax authorities. AB InBev is continuing to evaluate the impact of these legislative changes as new guidance becomes available, but there is no guarantee that it will be
successful in mitigating the impact of the increased compliance burden. Furthermore, on 16 August 2022, US President Joe Biden approved the Inflation Reduction Act (IRA), whereunder US companies that report over 1 US billion in profits to
shareholders are subject to a 15% minimum tax based on book income. Changes in tax treaties, the introduction of new legislation or updates to existing legislation in countries in which AB InBev operates, or changes to regulatory interpretations of
existing legislation as a result of the OECD tax reform initiatives, the IRA or otherwise could impose additional taxes on businesses and increase the complexity, burden and cost of tax compliance in countries where it operates. AB InBev is also
subject to regular reviews, examinations and audits by tax authorities in the jurisdictions in which it operates. Factors such as increased economic and political pressures to increase tax revenues have contributed to an increase in audit activity,
tax authorities becoming more aggressive in their interpretation and enforcement of tax laws, more time and difficulty to resolve any audits or disputes and an increase in new tax legislation. Although AB InBev believes its tax estimates,
methodologies and positions are reasonable and consistent with applicable law, significant judgment is required to evaluate applicable tax obligations and tax authorities may disagree, or may take increasingly aggressive positions with respect to,
the company’s judgments. A tax authority’s final determination in the event of a tax audit could materially differ from AB InBev’s tax provisions and accruals or may require the company to modify its business practices to reduce
its exposure to additional taxes going forward, any of which may have an adverse effect on its business, results of operations and financial condition. Antitrust and competition laws and changes in such laws or in the interpretation and enforcement
thereof, as well as being subject to regulatory scrutiny, could affect AB InBev's business or the businesses of its subsidiaries. For example, in connection with AB InBev’s previous acquisitions, various regulatory authorities have imposed
(and may impose in the future) conditions with which AB InBev is required to comply. The terms and conditions of certain of such authorizations, approvals and/or clearances required, among other things, the divestiture of the company’s assets
or businesses to third parties, changes to the company’s operations, or other restrictions on the company’s ability to operate in certain jurisdictions. Such actions could have a material adverse effect on AB InBev's business, results of
operations, financial condition and prospects. In addition, such conditions could diminish substantially the synergies and advantages which the company expects to achieve from such future transactions. AB InBev operates its business and markets its
products in emerging markets that, as a result of political and economic instability, a lack of well-developed legal systems and potentially corrupt business environments, present it with political, economic and operational risks. Although AB InBev
is committed to conducting business in a legal and ethical manner in compliance with local and international statutory requirements and standards applicable to its business, there is a risk that the employees or representatives of AB InBev’s
subsidiaries, affiliates, associates, joint ventures/operations or other business interests may take actions that violate applicable laws and regulations that generally prohibit the making of improper payments to foreign government officials for the
purpose of obtaining or keeping business, including laws relating to the 1997 OECD Convention on Combating Bribery of Foreign Public Officials in International Business Transactions such as the U.S. Foreign Corrupt Practices Act and the U.K. Bribery
Act. AB InBev – Annual Report 2023 67
New or expanded export control regulations, economic sanctions,
embargoes or other forms of trade restrictions imposed on Russia, Syria, Cuba, Iran or other countries in which AB InBev or its associates do business may curtail AB InBev’s existing business and may result in serious economic challenges in
these geographies, which could have an adverse effect on AB InBev and AB InBev’s associates’ operations, and may result in impairment charges on goodwill or other intangible assets or investments in associates. Although AB InBev’s
operations in Cuba through its subsidiary are quantitatively immaterial, the company’s overall business reputation may suffer, or it may face additional regulatory scrutiny as a result of Cuba being a target of U.S. economic and trade
sanctions or its subsidiary’s involvement in legal proceedings regarding its operations in Cuba. If investors decide to liquidate or otherwise divest their investments in companies that have operations of any magnitude in Cuba, the market in
and value of AB InBev’s securities could be adversely impacted. In addition, Title III of U.S. legislation known as the “Helms-Burton Act” authorizes private lawsuits for damages against anyone who traffics in property confiscated
without compensation by the Government of Cuba from persons who at the time were, or have since become, nationals of the United States. Since 2 May 2019, as a result of the activation of Title III of the Helms-Burton Act, AB InBev may be subject to
potential U.S. litigation exposure, including claims accrued during the prior suspension of Title III of the Helms-Burton Act. It remains uncertain how the activation of Title III of the Helms-Burton Act will impact AB InBev’s U.S. litigation
exposure. AB InBev has received notice of potential claims purporting to be made under the Helms-Burton Act. AB InBev relies on the reputation of its brands and its success depends on its ability to maintain and enhance the image and reputation of
its existing products and to develop a favorable image and reputation for new products. An event, or series of events, that materially damages the reputation of one or more of AB InBev's brands could have an adverse effect on the value of that brand
and subsequent revenues from that brand or business. Further, any restrictions on the permissible advertising style, media channels and messages used may constrain AB InBev’s marketing activities and thus reduce the value of its brands and
related revenues. AB InBev may not be able to protect its current and future brands and products and defend its intellectual property rights, including trademarks, patents, domain names, trade secrets and know-how, which could have a material
adverse effect on its business, results of operations, cash flows or financial condition, and in particular, on AB InBev’s ability to develop its business. If the business of AB InBev does not develop as expected, impairment charges on
goodwill or other intangible assets may be incurred in the future that could be significant and that could have an adverse effect on AB InBev's results of operations and financial condition. Climate change or other environmental concerns, or legal,
regulatory or market measures to address climate change or other environmental concerns, could have a long-term, material adverse impact on AB InBev’s business and results of operations. In the event that climate change has a negative effect
on agricultural productivity, AB InBev may be subject to decreased availability or less favorable pricing for certain agricultural commodities necessary for its products, such as barley, hops and rice. Further, climate change may also subject AB
InBev to water scarcity and quality risks due to the water required to produce its products, including water consumed in the agricultural supply chain. In the event that climate change leads to droughts or water over-exploitation or has a negative
effect on water availability or quality, the price of water may increase in certain areas and certain jurisdictions may adopt regulations restricting the use of water or enact other unfavorable changes to applicable water-related taxes and
regulations. Such measures, if adopted, could lead to increased regulatory pressures, production costs or capacity constraints. In addition, social attitudes, customer preferences and investor sentiment are increasingly influenced by sustainability
considerations, and as a result AB InBev may face pressure from its shareholders, regulators, suppliers, customers or consumers to further address sustainability-related concerns, which may require the company to incur increased costs and expose the
company to regulatory inquiry or legal action. If AB InBev fails to meet its 2025 Sustainability Goals or its ambition to achieve net zero emissions across its value chain by 2040 for any reason, its overall reputation may suffer. Public
expectations for reductions in greenhouse gas emissions, the potential adoption of legal and regulatory requirements designed to address climate change and to increase disclosures related to sustainability matters, including climate change and
mitigation efforts, and disparate and evolving standards for identifying, measuring and reporting sustainability metrics may require the company to incur increased costs, make additional investments and implement new practices and reporting
processes, and may heighten the company’s compliance burden and risks. Additionally, AB InBev’s inability to meet its compliance obligations under EU emissions trading regulations may also have an adverse impact on AB InBev’s
business and results of operations. AB InBev's operations are subject to environmental regulations, which could expose it to significant compliance costs and litigation relating to environmental issues. Further, AB InBev may be exposed to labor
strikes, disputes and work stoppages or slowdowns, within its operations or those of its suppliers, or an interruption or shortage of raw materials for any other reason that could lead to a negative impact on AB InBev’s costs, earnings,
financial condition, production level and ability to operate its business. AB InBev’s AB InBev – Annual Report 2023 68
production may also be affected by work stoppages or slowdowns that
affect its suppliers, distributors and retail delivery/logistics providers as a result of disputes under existing collective labor agreements with labor unions, in connection with negotiations of new collective labor agreements or as a result of
financial distress for its suppliers. A work stoppage or slowdown at AB InBev’s facilities could interrupt the transport of raw materials and commodities from its suppliers or the transport of its products to its customers. Such disruptions
could put a strain on AB InBev’s relationships with suppliers and customers and may have lasting effects on its business even after the disputes with its labor force have been resolved, including as a result of negative publicity. AB InBev
relies on information and operational technology systems, networks and services to support its business processes and activities, including procurement and supply chain, manufacturing, sales, human resource management, distribution, and marketing.
AB InBev relies on information systems, including through services operated or maintained by third parties, to collect, process, transmit, and store electronic information, including, but not limited to, sensitive, confidential or personal
information of customers and consumers. The integration of e-commerce, fintech and direct sales in AB InBev’s operations and their increasingly significant contribution to the company’s revenues and sales has increased the amount of
information that AB InBev processes and maintains, thereby increasing its potential exposure to a security incident. The sophistication of cybersecurity threat actors also continues to evolve and grow, including the risk associated with emerging
technologies, such as artificial intelligence, for nefarious purposes. Information systems of AB InBev’s third- party partners, including suppliers and distributors, and those of others on which they rely, are also exposed to cybersecurity
incidents which may compromise the confidentiality, integrity and availability of their information systems and result in unauthorized access to AB InBev’s or its customer’s sensitive data. Compliance with, and changes to, laws and
regulations concerning privacy, cybersecurity, and data protection could result in significant expense, and AB InBev may be required to make additional investments in security technologies. Although AB InBev takes various actions to minimize the
likelihood and impact of such cybersecurity incidents and disruptions to information systems, such incidents could impact AB InBev’s business, impact its ability to meet its contractual obligations and expose it to legal claims or regulatory
penalties. For example, if outside parties gained access to AB InBev’s confidential data or strategic information and appropriated such information or made such information public, this could harm AB InBev’s reputation or its competitive
advantage, or could expose AB InBev or its customers to a risk of loss or misuse of information. More generally, technology disruptions can have a material adverse effect on AB InBev’s business, results of operations, cash flows or financial
condition. AB InBev’s business and operating results could be negatively impacted by natural, social, technical, physical or other disasters, including public health crises and global pandemics. AB InBev’s business and results of
operations were negatively impacted by the implementation of COVID-19 restrictions in recent years. While most countries around the world have removed the restrictions implemented in response to the COVID-19 pandemic, the emergence of new global
pandemics, including new COVID-19 variants, may result in new restrictions in regions and countries where AB InBev operates, lead to further economic uncertainty and heighten many of the other risks described herein. AB InBev may not be able to
recruit or retain key personnel and successfully manage them, which could disrupt AB InBev’s business and have an unfavorable material effect on AB InBev’s financial position, its income from operations and its competitive position.
Although AB InBev maintains insurance policies to cover various risks, it also uses self-insurance for most of its insurable risks. Should an uninsured loss or a loss in excess of insured limits occur, this could adversely impact AB InBev’s
business, results of operations and financial condition. AB InBev’s ordinary shares currently trade on Euronext Brussels in euros, the Johannesburg Stock Exchange in South African rand, the Mexican Stock Exchange in Mexican pesos and its
ordinary shares represented by American Depositary Shares (the “ADSs”) trade on the New York Stock Exchange in US dollars. Fluctuations in the exchange rates between the euro, the South African rand, the Mexican peso and the US dollar
may result in temporary differences between the value of AB InBev’s ordinary shares trading in different currencies, and between its ordinary shares and its ADSs, which may result in heavy trading by investors seeking to exploit such
differences. RISKS ARISING FROM FINANCIAL INSTRUMENTS Note 27 of the 2023 consolidated financial statements on Risks arising from financial instruments contains detailed information on the company’s exposures to financial risks and its risk
management policies. AB InBev – Annual Report 2023 69
Events after the reporting date Please refer to Note 32 Events after
the reporting date of the consolidated financial statements. Corporate governance For information with respect to Corporate Governance, please refer to the Corporate Governance section, which forms an integral part of our annual report. 2024
presentation update For 2024, the definition of organic revenue growth has been amended to cap the price growth in Argentina to a maximum of 2% per month. Corresponding adjustments will be made to all income statement related items in the organic
growth calculations. AB InBev – Annual Report 2023 70

Statement of the Board of Directors The Board of Directors of AB InBev
SA/NV certifies, on behalf and for the account of the company, that, to their knowledge, (a) the financial statements which have been prepared in accordance with International Financial Reporting Standards give a true and fair view of the assets,
liabilities, financial position and profit or loss of the company and the entities included in the consolidation as a whole and (b) the management report includes a fair review of the development and performance of the business and the position of
the company and the entities included in the consolidation as a whole, together with a description of the principal risks and uncertainties they face. AB InBev – Annual Report 2023 71
Independent auditors’ report STATUTORY AUDITOR'S REPORT TO THE
GENERAL SHAREHOLDERS’ MEETING OF ANHEUSER-BUSCH INBEV NV/SA ON THE CONSOLIDATED FINANCIAL STATEMENTS FOR THE YEAR ENDED 31 DECEMBER 2023 We present to you our statutory auditor’s report in the context of our statutory audit of the
consolidated financial statements of Anheuser- Busch InBev NV/SA (the “Company”) and its subsidiaries (jointly “the Group”). This report includes our report on the consolidated financial statements, as well as the other legal
and regulatory requirements. This forms part of an integrated whole and is indivisible. We have been appointed as statutory auditor by the general meeting d.d. 27 April 2022, following the proposal formulated by the board of directors and following
the recommendation by the audit committee and the proposal formulated by the works’ council. Our mandate will expire on the date of the general meeting which will deliberate on the annual accounts for the year ended 31 December 2024. We have
performed the statutory audit of the consolidated financial statements of Anheuser-Busch InBev NV/SA for five consecutive years. Report on the consolidated financial statements Unqualified opinion We have performed the statutory audit of the
Group’s consolidated financial statements, which comprise the consolidated statement of financial position as at 31 December 2023, the consolidated income statement, the consolidated statement of comprehensive income/(loss), the consolidated
statement of changes in equity and the consolidated statement of cash flows for the year then ended, and the notes to the consolidated financial statements, including a summary of significant accounting policies and other explanatory information,
and which is characterized by a consolidated statement of financial position total of USD 219 340 million and a profit for the year of USD 6 891 million. In our opinion, the consolidated financial statements give a true and fair view of the
Group’s net equity and consolidated financial position as at 31 December 2023, and of its consolidated financial performance and its consolidated cash flows for the year then ended, in accordance with International Financial Reporting
Standards as adopted by the European Union and with the legal and regulatory requirements applicable in Belgium. Basis for unqualified opinion We conducted our audit in accordance with International Standards on Auditing (ISAs) as applicable in
Belgium. Furthermore, we have applied the International Standards on Auditing as approved by the IAASB which are applicable to the year-end and which are not yet approved at the national level. Our responsibilities under those standards are further
described in the “Statutory auditor’s responsibilities for the audit of the consolidated financial statements” section of our report. We have fulfilled our ethical responsibilities in accordance with the ethical requirements that
are relevant to our audit of the consolidated financial statements in Belgium, including the requirements related to independence. We have obtained from the board of directors and Company officials the explanations and information necessary for
performing our audit. We believe that the audit evidence we have obtained is sufficient and appropriate to provide a basis for our opinion. Key audit matters Key audit matters are those matters that, in our professional judgment, were of most
significance in our audit of the consolidated financial statements of the current period. These matters were addressed in the context of our audit of the consolidated financial statements as a whole and in forming our opinion thereon, and we do not
provide a separate opinion on these matters. AB InBev – Annual Report 2023 72
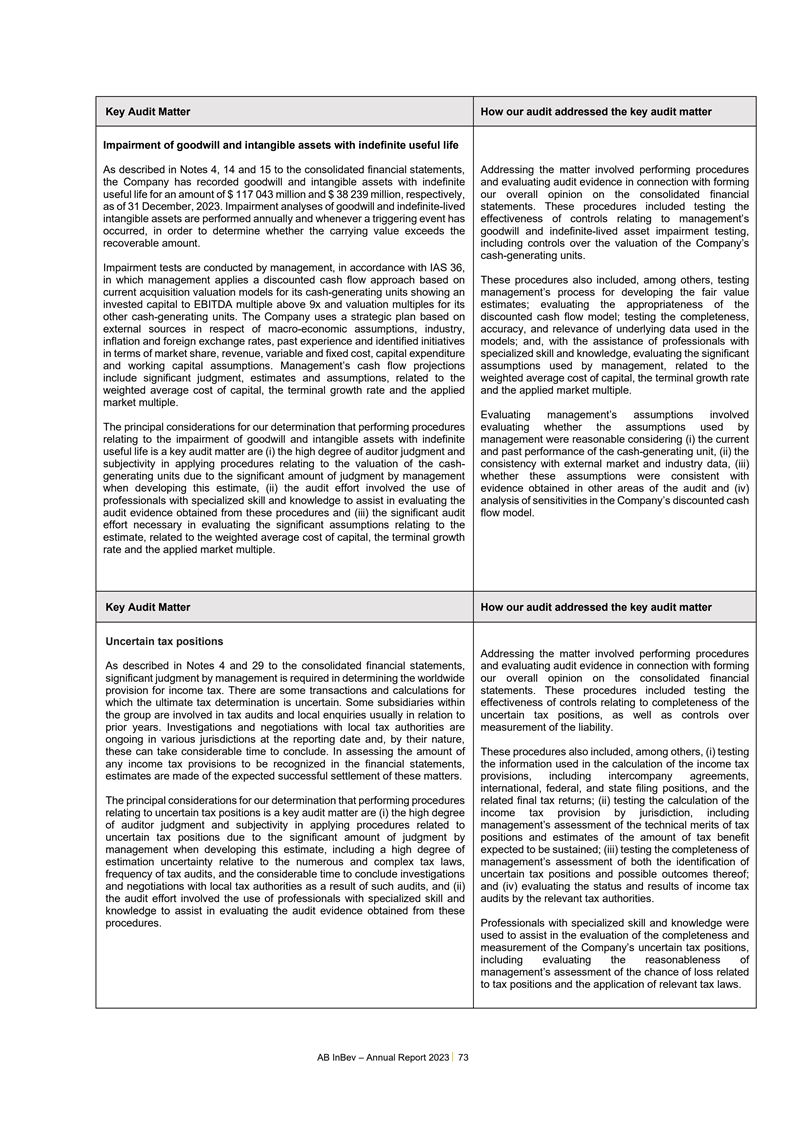
Key Audit Matter How our audit addressed the key audit matter
Impairment of goodwill and intangible assets with indefinite useful life As described in Notes 4, 14 and 15 to the consolidated financial statements, Addressing the matter involved performing procedures the Company has recorded goodwill and
intangible assets with indefinite and evaluating audit evidence in connection with forming useful life for an amount of $ 117 043 million and $ 38 239 million, respectively, our overall opinion on the consolidated financial as of 31 December, 2023.
Impairment analyses of goodwill and indefinite-lived statements. These procedures included testing the intangible assets are performed annually and whenever a triggering event has effectiveness of controls relating to management’s occurred, in
order to determine whether the carrying value exceeds the goodwill and indefinite-lived asset impairment testing, recoverable amount. including controls over the valuation of the Company’s cash-generating units. Impairment tests are conducted
by management, in accordance with IAS 36, in which management applies a discounted cash flow approach based on These procedures also included, among others, testing current acquisition valuation models for its cash-generating units showing an
management’s process for developing the fair value invested capital to EBITDA multiple above 9x and valuation multiples for its estimates; evaluating the appropriateness of the other cash-generating units. The Company uses a strategic plan
based on discounted cash flow model; testing the completeness, external sources in respect of macro-economic assumptions, industry, accuracy, and relevance of underlying data used in the inflation and foreign exchange rates, past experience and
identified initiatives models; and, with the assistance of professionals with in terms of market share, revenue, variable and fixed cost, capital expenditure specialized skill and knowledge, evaluating the significant and working capital
assumptions. Management’s cash flow projections assumptions used by management, related to the include significant judgment, estimates and assumptions, related to the weighted average cost of capital, the terminal growth rate weighted average
cost of capital, the terminal growth rate and the applied and the applied market multiple. market multiple. Evaluating management’s assumptions involved The principal considerations for our determination that performing procedures evaluating
whether the assumptions used by relating to the impairment of goodwill and intangible assets with indefinite management were reasonable considering (i) the current useful life is a key audit matter are (i) the high degree of auditor judgment and and
past performance of the cash-generating unit, (ii) the subjectivity in applying procedures relating to the valuation of the cash- consistency with external market and industry data, (iii) generating units due to the significant amount of judgment by
management whether these assumptions were consistent with when developing this estimate, (ii) the audit effort involved the use of evidence obtained in other areas of the audit and (iv) professionals with specialized skill and knowledge to assist in
evaluating the analysis of sensitivities in the Company’s discounted cash audit evidence obtained from these procedures and (iii) the significant audit flow model. effort necessary in evaluating the significant assumptions relating to the
estimate, related to the weighted average cost of capital, the terminal growth rate and the applied market multiple. Key Audit Matter How our audit addressed the key audit matter Uncertain tax positions Addressing the matter involved performing
procedures As described in Notes 4 and 29 to the consolidated financial statements, and evaluating audit evidence in connection with forming significant judgment by management is required in determining the worldwide our overall opinion on the
consolidated financial provision for income tax. There are some transactions and calculations for statements. These procedures included testing the which the ultimate tax determination is uncertain. Some subsidiaries within effectiveness of controls
relating to completeness of the the group are involved in tax audits and local enquiries usually in relation to uncertain tax positions, as well as controls over prior years. Investigations and negotiations with local tax authorities are measurement
of the liability. ongoing in various jurisdictions at the reporting date and, by their nature, these can take considerable time to conclude. In assessing the amount of These procedures also included, among others, (i) testing any income tax
provisions to be recognized in the financial statements, the information used in the calculation of the income tax estimates are made of the expected successful settlement of these matters. provisions, including intercompany agreements,
international, federal, and state filing positions, and the The principal considerations for our determination that performing procedures related final tax returns; (ii) testing the calculation of the relating to uncertain tax positions is a key
audit matter are (i) the high degree income tax provision by jurisdiction, including of auditor judgment and subjectivity in applying procedures related to management’s assessment of the technical merits of tax uncertain tax positions due to
the significant amount of judgment by positions and estimates of the amount of tax benefit management when developing this estimate, including a high degree of expected to be sustained; (iii) testing the completeness of estimation uncertainty
relative to the numerous and complex tax laws, management’s assessment of both the identification of frequency of tax audits, and the considerable time to conclude investigations uncertain tax positions and possible outcomes thereof; and
negotiations with local tax authorities as a result of such audits, and (ii) and (iv) evaluating the status and results of income tax the audit effort involved the use of professionals with specialized skill and audits by the relevant tax
authorities. knowledge to assist in evaluating the audit evidence obtained from these procedures. Professionals with specialized skill and knowledge were used to assist in the evaluation of the completeness and measurement of the Company’s
uncertain tax positions, including evaluating the reasonableness of management’s assessment of the chance of loss related to tax positions and the application of relevant tax laws. AB InBev – Annual Report 2023 73
Responsibilities of the board of directors for the preparation of the
consolidated financial statements The board of directors is responsible for the preparation of consolidated financial statements that give a true and fair view in accordance with International Financial Reporting Standards as adopted by the European
Union and with the legal and regulatory requirements applicable in Belgium, and for such internal control as the board of directors determines is necessary to enable the preparation of consolidated financial statements that are free from material
misstatement, whether due to fraud or error. In preparing the consolidated financial statements, the board of directors is responsible for assessing the Group’s ability to continue as a going concern, disclosing, as applicable, matters related
to going concern and using the going concern basis of accounting unless the board of directors either intends to liquidate the Group or to cease operations, or has no realistic alternative but to do so. Statutory auditor’s responsibilities for
the audit of the consolidated financial statements Our objectives are to obtain reasonable assurance about whether the consolidated financial statements as a whole are free from material misstatement, whether due to fraud or error, and to issue an
auditor’s report that includes our opinion. Reasonable assurance is a high level of assurance but is not a guarantee that an audit conducted in accordance with ISAs will always detect a material misstatement when it exists. Misstatements can
arise from fraud or error and are considered material if, individually or in the aggregate, they could reasonably be expected to influence the economic decisions of users taken on the basis of these consolidated financial statements. In performing
our audit, we comply with the legal, regulatory and normative framework applicable to the audit of the consolidated financial statements in Belgium. A statutory audit does not provide any assurance as to the Group’s future viability nor as to
the efficiency or effectiveness of the board of directors’ current or future business management at Group level. Our responsibilities in respect of the use of the going concern basis of accounting by the board of directors’ are described
below. As part of an audit in accordance with ISAs, we exercise professional judgment and maintain professional skepticism throughout the audit. We also: ● Identify and assess the risks of material misstatement of the consolidated financial
statements, whether due to fraud or error, design and perform audit procedures responsive to those risks, and obtain audit evidence that is sufficient and appropriate to provide a basis for our opinion. The risk of not detecting a material
misstatement resulting from fraud is higher than for one resulting from error, as fraud may involve collusion, forgery, intentional omissions, misrepresentations, or the override of internal control; ● Obtain an understanding of internal
control relevant to the audit in order to design audit procedures that are appropriate in the circumstances, but not for the purpose of expressing an opinion on the effectiveness of the Group’s internal control; ● Evaluate the
appropriateness of accounting policies used and the reasonableness of accounting estimates and related disclosures made by the board of directors; ● Conclude on the appropriateness of the board of directors’ use of the going concern
basis of accounting and, based on the audit evidence obtained, whether a material uncertainty exists related to events or conditions that may cast significant doubt on the Group’s ability to continue as a going concern. If we conclude that a
material uncertainty exists, we are required to draw attention in our statutory auditor’s report to the related disclosures in the consolidated financial statements or, if such disclosures are inadequate, to modify our opinion. Our conclusions
are based on the audit evidence obtained up to the date of our statutory auditor’s report. However, future events or conditions may cause the Group to cease to continue as a going concern; ● Evaluate the overall presentation, structure
and content of the consolidated financial statements, including the disclosures, and whether the consolidated financial statements represent the underlying transactions and events in a manner that achieves fair presentation; ● Obtain
sufficient and appropriate audit evidence regarding the financial information of the entities or business activities within the Group to express an opinion on the consolidated financial statements. We are responsible for the direction, supervision
and performance of the Group audit. We remain solely responsible for our audit opinion. We communicate with the audit committee regarding, among other matters, the planned scope and timing of the audit and significant audit findings, including any
significant deficiencies in internal control that we identify during our audit. We also provide the audit committee with a statement that we have complied with relevant ethical requirements regarding independence, and to communicate with them all
relationships and other matters that may reasonably be thought to bear on our independence, and where applicable, related safeguards. From the matters communicated with the audit committee, we determine those matters that were of most significance
in the audit of the consolidated financial statements of the current period and are therefore the key audit matters. We describe these matters in our auditor’s report unless law or regulation precludes public disclosure about the matter. Other
legal and regulatory requirements Responsibilities of the board of directors The board of directors is responsible for the preparation and the content of the directors’ report on the consolidated financial statements. Statutory auditor’s
responsibilities In the context of our engagement and in accordance with the Belgian standard which is complementary to the International Standards on Auditing (ISAs) as applicable in Belgium, our responsibility is to verify, in all material
respects, the directors’ report on the consolidated financial statements and to report on these matters. AB InBev – Annual Report 2023 74
Aspects related to the directors’ report on the consolidated
financial statements In our opinion, after having performed specific procedures in relation to the directors’ report on the consolidated financial statements, this directors’ report is consistent with the consolidated financial
statements for the year under audit, and it is prepared in accordance with article 3:32 of the Companies’ and Associations’ Code. In the context of our audit of the consolidated financial statements, we are also responsible for
considering, in particular based on the knowledge acquired resulting from the audit, whether the directors’ report on the consolidated financial statements is materially misstated or contains information which is inadequately disclosed or
otherwise misleading. In light of the procedures we have performed, there are no material misstatements we have to report to you. The non-financial information is included in a separate report of the directors’ report which is part of section
“Sustainability statements” of the annual report. The report of non-financial information contains the information required by virtue of article 3:32, §2 of the Companies’ and Associations’ Code, and agrees with the
consolidated financial statements for the same year. The Company has prepared the non- financial information, based on reference framework Global Reporting Initiative (GRI) Standards and relevant United Nations Sustainable Development Goals.
However, in accordance with article 3:80, §1, 5° of the Companies’ and Associations’ Code, we do not express an opinion as to whether the non-financial information has been prepared in accordance with the said framework as
disclosed in the separate report of the directors’ report on the consolidated financial statements. Statement related to independence ● Our registered audit firm and our network did not provide services which are incompatible with the
statutory audit of the consolidated financial statements, and our registered audit firm remained independent of the Group in the course of our mandate. ● The fees for additional services which are compatible with the statutory audit of the
consolidated financial statements referred to in article 3:65 of the Companies’ and Associations’ Code are correctly disclosed and itemized in the notes to the consolidated financial statements. European Uniform Electronic Format (ESEF)
We have also verified, in accordance with the draft standard on the verification of the compliance of the financial statements with the European Uniform Electronic Format (hereinafter “ESEF”), the compliance of the ESEF format with the
regulatory technical standards established by the European Delegate Regulation No. 2019/815 of 17 December 2018 (hereinafter: “Delegated Regulation”).The board of directors is responsible for the preparation, in accordance with ESEF
requirements, of the consolidated financial statements in the form of an electronic file in ESEF format (hereinafter “digital consolidated financial statements”) included in the annual financial report. Our responsibility is to obtain
sufficient appropriate evidence to conclude that the format and marking language of the digital consolidated financial statements comply in all material respects with the ESEF requirements under the Delegated Regulation. Based on our procedures
performed, we believe that the format of and marking of information in the digital consolidated financial statements included in the annual financial report of Anheuser-Busch InBev NV/SA per 31 December 2023 comply in all material respects with the
ESEF requirements under the Delegated Regulation. Other statements This report is consistent with the additional report to the audit committee referred to in article 11 of the Regulation (EU) N°537/2014. Diegem, 28 February 2024 The Statutory
Auditor PwC Bedrijfsrevisoren BV / Reviseurs d'Entreprises SRL Represented by Koen Hens Statutory Auditor AB InBev – Annual Report 2023 75
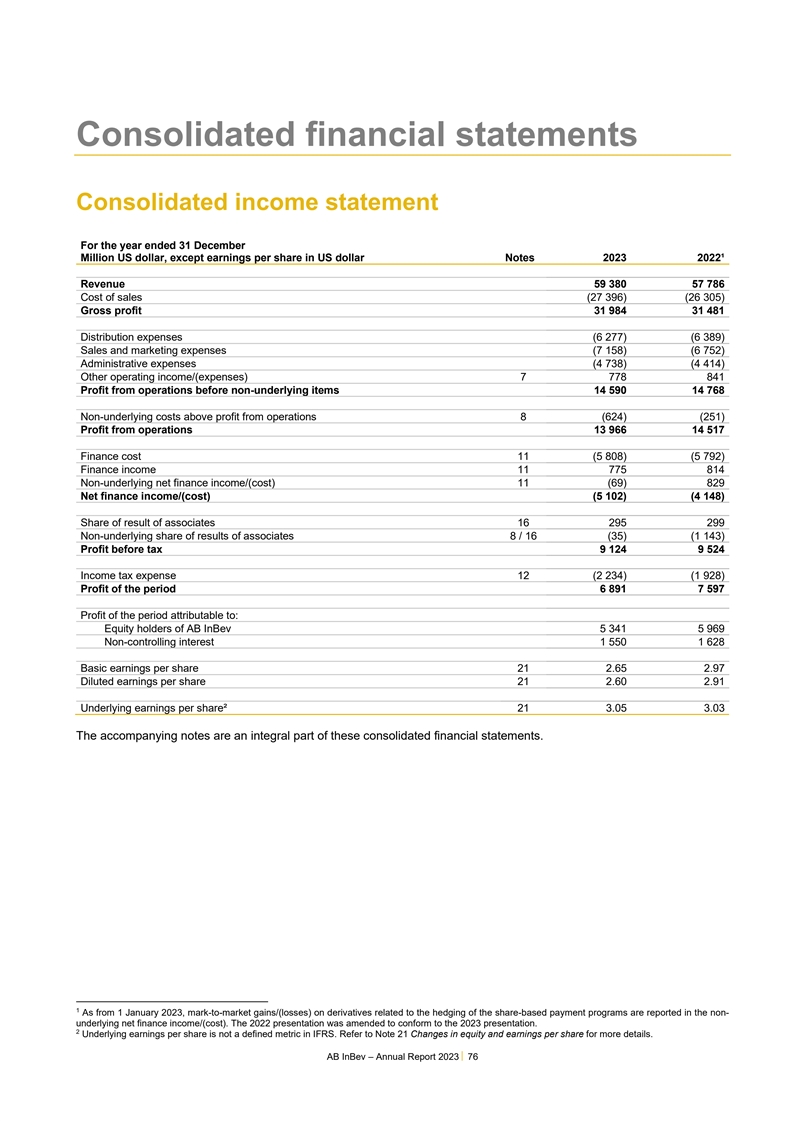
Consolidated financial statements Consolidated income statement For the
year ended 31 December Million US dollar, except earnings per share in US dollar Notes 2023 2022¹ . Revenue 59 380 57 786 Cost of sales (27 396) (26 305) Gross profit 31 984 31 481 . Distribution expenses (6 277) (6 389) Sales and marketing
expenses (7 158) (6 752) Administrative expenses (4 738) (4 414) Other operating income/(expenses) 7 778 841 Profit from operations before non-underlying items 14 590 14 768 . Non-underlying costs above profit from operations 8 (624) (251) Profit
from operations 13 966 14 517 . Finance cost 11 (5 808) (5 792) Finance income 11 775 814 Non-underlying net finance income/(cost) 11 (69) 829 Net finance income/(cost) (5 102) (4 148) . Share of result of associates 16 295 299 Non-underlying share
of results of associates 8 / 16 (35) (1 143) Profit before tax 9 124 9 524 . Income tax expense 12 (2 234) (1 928) Profit of the period 6 891 7 597 . Profit of the period attributable to: Equity holders of AB InBev 5 341 5 969 Non-controlling
interest 1 550 1 628 . Basic earnings per share 21 2.65 2.97 Diluted earnings per share 21 2.60 2.91 . Underlying earnings per share² 21 3.05 3.03 1 2 The accompanying notes are an integral part of these consolidated financial statements. 1 As
from 1 January 2023, mark-to-market gains/(losses) on derivatives related to the hedging of the share-based payment programs are reported in the non- underlying net finance income/(cost). The 2022 presentation was amended to conform to the 2023
presentation. 2 Underlying earnings per share is not a defined metric in IFRS. Refer to Note 21 Changes in equity and earnings per share for more details. AB InBev – Annual Report 2023 76
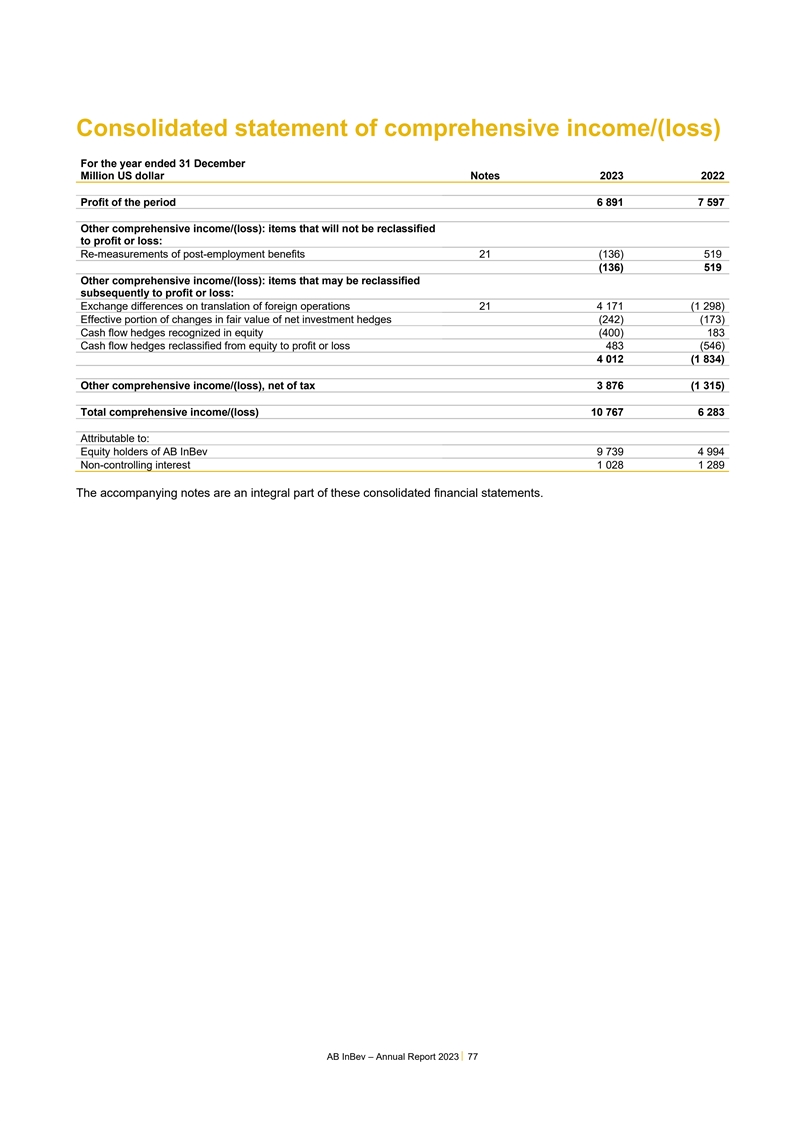
Consolidated statement of comprehensive income/(loss) For the year
ended 31 December Million US dollar Notes 2023 2022 . Profit of the period 6 891 7 597 XXX Other comprehensive income/(loss): items that will not be reclassified to profit or loss: Re-measurements of post-employment benefits 21 (136) 519 . (136) 519
Other comprehensive income/(loss): items that may be reclassified subsequently to profit or loss: Exchange differences on translation of foreign operations 21 4 171 (1 298) Effective portion of changes in fair value of net investment hedges (242)
(173) Cash flow hedges recognized in equity (400) 183 Cash flow hedges reclassified from equity to profit or loss 483 (546) XXX 4 012 (1 834) . Other comprehensive income/(loss), net of tax 3 876 (1 315) XXX Total comprehensive income/(loss) 10 767
6 283 XXX Attributable to: Equity holders of AB InBev 9 739 4 994 Non-controlling interest 1 028 1 289 The accompanying notes are an integral part of these consolidated financial statements. AB InBev – Annual Report 2023 77
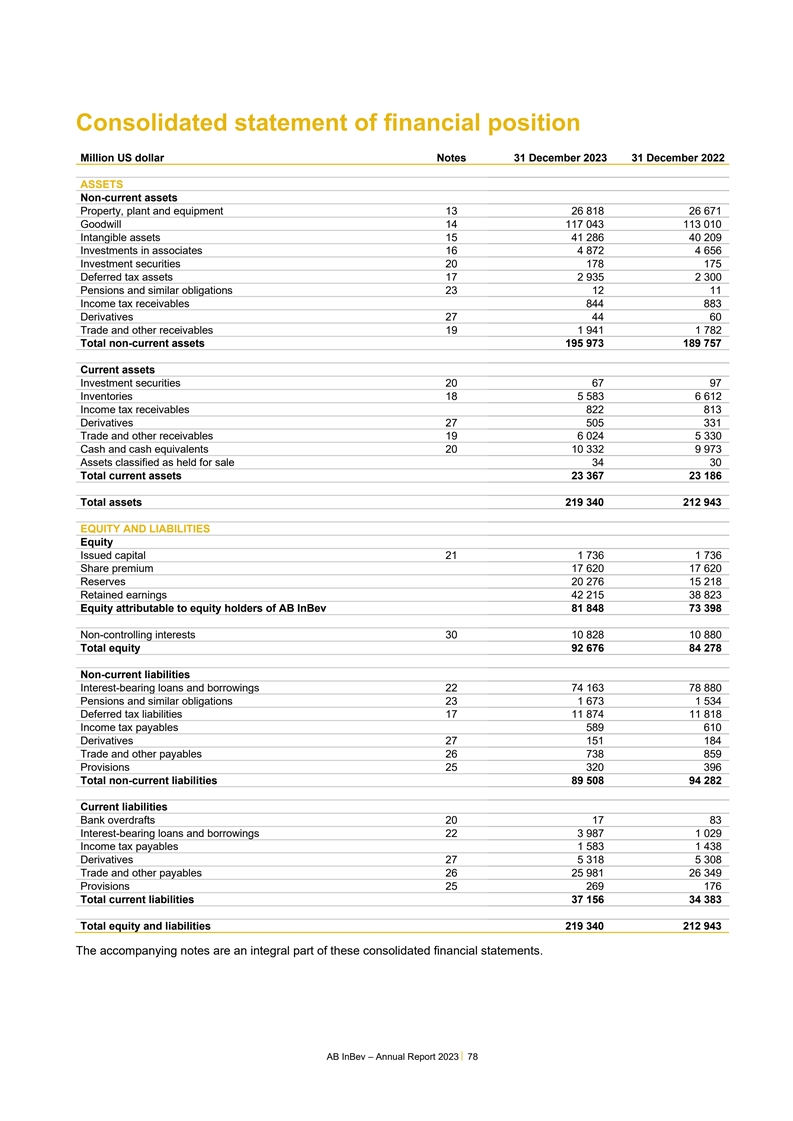
Consolidated statement of financial position Million US dollar Notes
31 December 2023 31 December 2022 . ASSETS Non-current assets Property, plant and equipment 13 26 818 26 671 Goodwill 14 117 043 113 010 Intangible assets 15 41 286 40 209 Investments in associates 16 4 872 4 656 Investment securities 20 178 175
Deferred tax assets 17 2 935 2 300 Pensions and similar obligations 23 12 11 Income tax receivables 844 883 Derivatives 27 44 60 Trade and other receivables 19 1 941 1 782 Total non-current assets 195 973 189 757 Current assets Investment securities
20 67 97 Inventories 18 5 583 6 612 Income tax receivables 822 813 Derivatives 27 505 331 Trade and other receivables 19 6 024 5 330 Cash and cash equivalents 20 10 332 9 973 Assets classified as held for sale 34 30 Total current assets 23 367 23
186 Total assets 219 340 212 943 EQUITY AND LIABILITIES Equity Issued capital 21 1 736 1 736 Share premium 17 620 17 620 Reserves 20 276 15 218 Retained earnings 42 215 38 823 Equity attributable to equity holders of AB InBev 81 848 73 398
Non-controlling interests 30 10 828 10 880 Total equity 92 676 84 278 Non-current liabilities Interest-bearing loans and borrowings 22 74 163 78 880 Pensions and similar obligations 23 1 673 1 534 Deferred tax liabilities 17 11 874 11 818 Income tax
payables 589 610 Derivatives 27 151 184 Trade and other payables 26 738 859 Provisions 25 320 396 Total non-current liabilities 89 508 94 282 Current liabilities Bank overdrafts 20 17 83 Interest-bearing loans and borrowings 22 3 987 1 029 Income
tax payables 1 583 1 438 Derivatives 27 5 318 5 308 Trade and other payables 26 25 981 26 349 Provisions 25 269 176 Total current liabilities 37 156 34 383 Total equity and liabilities 219 340 212 943 The accompanying notes are an integral part of
these consolidated financial statements. AB InBev – Annual Report 2023 78
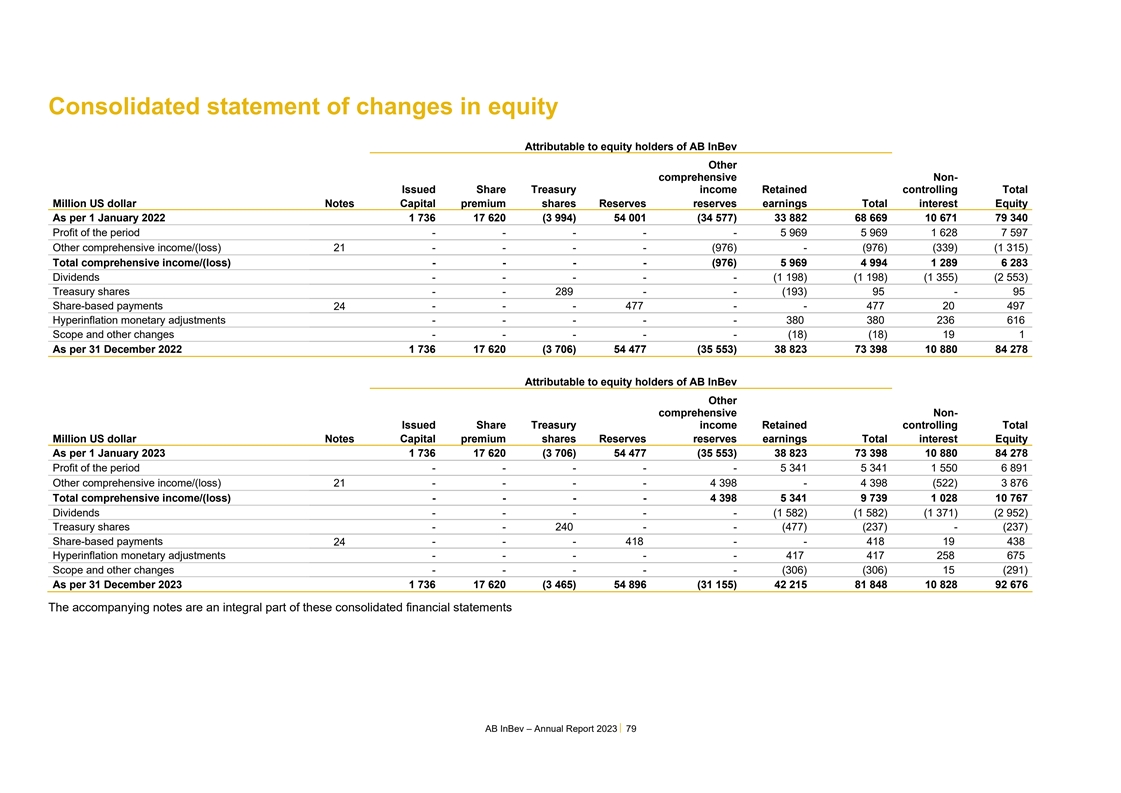
Consolidated statement of changes in equity Attributable to equity
holders of AB InBev Other comprehensive Non- Issued Share Treasury in come Retained c ont r ol li ng Total Million US dollar Notes Capital premium shares Reserves reserves earnings Total interest Equity As per 1 January 2022 1 736 17 620 (3 994) 54
001 (34 577) 33 882 68 669 10 671 79 340 Profit of the period - - - - - 5 969 5 969 1 628 7 597 Other comprehensive income/(loss) 21 - - - - (976) - (976) (339) (1 315) Total comprehensive income/(loss) - - - - (976) 5 969 4 994 1 289 6 283
Dividends - - - - - (1 198) (1 198) (1 355) (2 553) Treasury shares - - 289 - - (193) 95 - 95 Share-based payments - - - 477 - - 477 20 497 24 Hyperinflation monetary adjustments - - - - - 380 380 236 616 Scope and other changes - - - - - (18) (18)
19 1 As per 31 December 2022 1 736 17 620 (3 706) 54 477 (35 553) 38 823 73 398 10 880 84 278 XXX Attributable to equity holders of AB InBev Other comprehensive Non- Issued Share Treasury in come Retained c ont r ol li ng Total Million US dollar
Notes Capital premium shares Reserves reserves earnings Total interest Equity As per 1 January 2023 1 736 17 620 (3 706) 54 477 (35 553) 38 823 73 398 10 880 84 278 Profit of the period - - - - - 5 341 5 341 1 550 6 891 Other comprehensive
income/(loss) 21 - - - - 4 398 - 4 398 (522) 3 876 Total comprehensive income/(loss) - - - - 4 398 5 341 9 739 1 028 10 767 Dividends - - - - - (1 582) (1 582) (1 371) (2 952) Treasury shares - - 240 - - (477) (237) - (237) Share-based payments 24 -
- - 418 - - 418 19 438 Hyperinflation monetary adjustments - - - - - 417 417 258 675 Scope and other changes - - - - - (306) (306) 15 (291) As per 31 December 2023 1 736 17 620 (3 465) 54 896 (31 155) 42 215 81 848 10 828 92 676 The accompanying
notes are an integral part of these consolidated financial statements AB InBev – Annual Report 2023 79
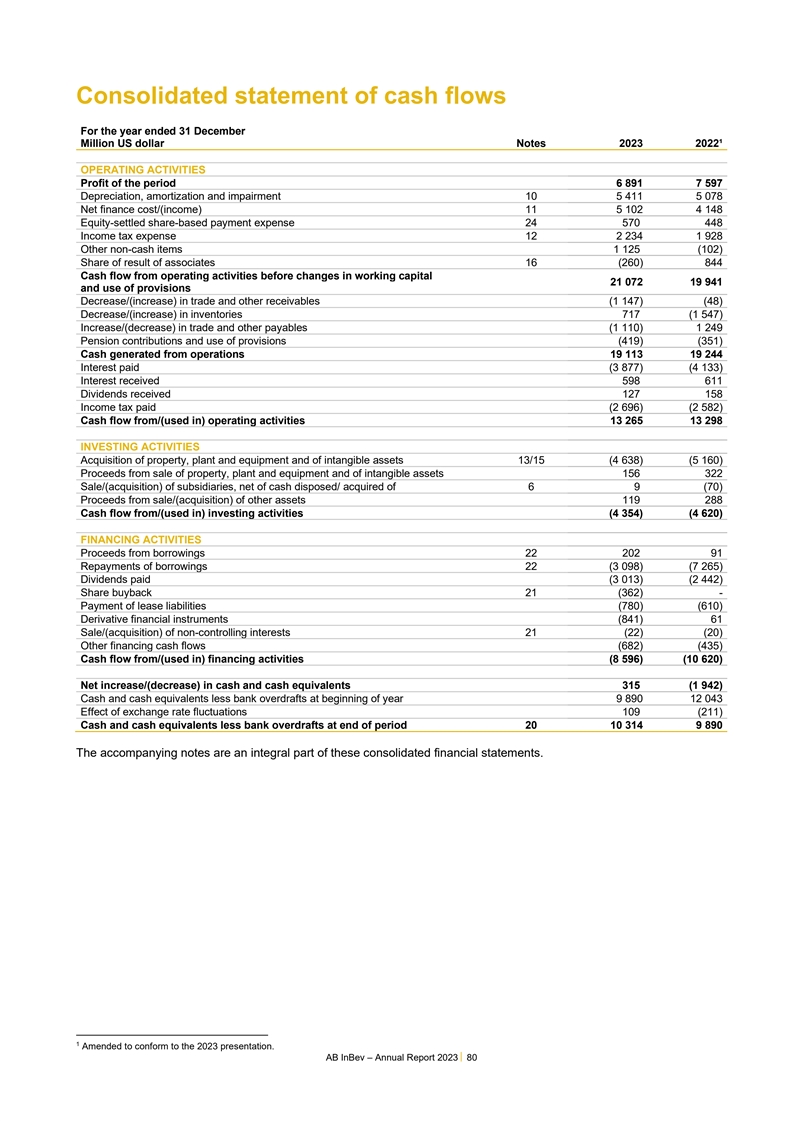
Consolidated statement of cash flows For the year ended 31 December
Million US dollar Notes 2023 2022¹ . OPERATING ACTIVITIES Profit of the period 6 891 7 597 Depreciation, amortization and impairment 10 5 411 5 078 Net finance cost/(income) 11 5 102 4 148 Equity-settled share-based payment expense 24 570 448
Income tax expense 12 2 234 1 928 Other non-cash items 1 125 (102) Share of result of associates 16 (260) 844 Cash flow from operating activities before changes in working capital 21 072 19 941 and use of provisions Decrease/(increase) in trade and
other receivables (1 147) (48) Decrease/(increase) in inventories 717 (1 547) Increase/(decrease) in trade and other payables (1 110) 1 249 Pension contributions and use of provisions (419) (351) Cash generated from operations 19 113 19 244 Interest
paid (3 877) (4 133) Interest received 598 611 Dividends received 127 158 Income tax paid (2 696) (2 582) Cash flow from/(used in) operating activities 13 265 13 298 . INVESTING ACTIVITIES Acquisition of property, plant and equipment and of
intangible assets 13/15 (4 638) (5 160) Proceeds from sale of property, plant and equipment and of intangible assets 156 322 Sale/(acquisition) of subsidiaries, net of cash disposed/ acquired of 6 9 (70) Proceeds from sale/(acquisition) of other
assets 119 288 Cash flow from/(used in) investing activities (4 354) (4 620) . FINANCING ACTIVITIES Proceeds from borrowings 22 202 91 Repayments of borrowings 22 (3 098) (7 265) Dividends paid (3 013) (2 442) Share buyback 21 (362) - Payment of
lease liabilities (780) (610) Derivative financial instruments (841) 61 Sale/(acquisition) of non-controlling interests 21 (22) (20) Other financing cash flows (682) (435) Cash flow from/(used in) financing activities (8 596) (10 620) Net
increase/(decrease) in cash and cash equivalents 315 (1 942) Cash and cash equivalents less bank overdrafts at beginning of year 9 890 12 043 Effect of exchange rate fluctuations 109 (211) Cash and cash equivalents less bank overdrafts at end of
period 20 10 314 9 890 1 The accompanying notes are an integral part of these consolidated financial statements. 1 Amended to conform to the 2023 presentation. AB InBev – Annual Report 2023 80
Notes to the consolidated financial statements Note Corporate
information 1 Statement of compliance 2 Summary of significant accounting policies 3 Use of estimates and judgments 4 Segment reporting 5 Acquisitions and disposals of subsidiaries 6 Other operating income/(expenses) 7 Non-underlying items 8 Payroll
and related benefits 9 Additional information on operating expenses by nature 10 Finance cost and income 11 Income taxes 12 Property, plant and equipment 13 Goodwill 14 Intangible assets 15 Investments in associates 16 Deferred tax assets and
liabilities 17 Inventories 18 Trade and other receivables 19 Cash and cash equivalents and investment securities 20 Changes in equity and earnings per share 21 Interest-bearing loans and borrowings 22 Pensions and similar obligations 23 Share-based
payments 24 Provisions 25 Trade and other payables 26 Risks arising from financial instruments 27 Collateral and contractual commitments for the acquisition of property, plant and equipment, 28 loans to customers and other Contingencies 29
Non-controlling interests 30 Related parties 31 Events after the reporting date 32 AB InBev companies 33 AB InBev – Annual Report 2023 81
1. Corporate information Anheuser-Busch InBev is a publicly traded
company (Euronext: ABI) based in Leuven, Belgium, with secondary listings on the Mexico (MEXBOL: ANB) and South Africa (JSE: ANH) stock exchanges and with American Depositary Receipts on the New York Stock Exchange (NYSE: BUD). As a company, we
dream big to create a future with more cheers. We are always looking to serve up new ways to meet life’s moments, move our industry forward and make a meaningful impact in the world. We are committed to building great brands that stand the
test of time and to brewing the best beers using the finest ingredients. Our diverse portfolio of well over 500 beer brands includes global brands Budweiser®, Corona®, Stella Artois® and Michelob Ultra®; multi-country brands
Beck’s®, Hoegaarden® and Leffe®; and local champions such as Aguila®, Antarctica®, Bud Light®, Brahma®, Cass®, Castle®, Castle Lite®, Cristal®, Harbin®, Jupiler®, Modelo
Especial®, Quilmes®, Victoria®, Sedrin® and Skol®. Our brewing heritage dates back more than 600 years, spanning continents and generations. From our European roots at the Den Hoorn brewery in Leuven, Belgium. To the
pioneering spirit of the Anheuser & Co brewery in St. Louis, US. To the creation of the Castle Brewery in South Africa during the Johannesburg gold rush. To Bohemia, the first brewery in Brazil. Geographically diversified with a balanced
exposure to developed and developing markets, we leverage the collective strengths of approximately 155 000 employees based in nearly 50 countries worldwide. For 2023, AB InBev’s reported revenue was 59.4 billion US dollar (excluding joint
ventures and associates). The consolidated financial statements of the company for the year ended 31 December 2023 comprise the company and its subsidiaries (together referred to as “AB InBev” or the “company”) and the
company’s interest in associates, joint ventures and operations. The consolidated financial statements were authorized for issue by the Board of Directors on 28 February 2024. 2. Statement of compliance The consolidated financial statements
have been prepared in accordance with International Financial Reporting Standards as issued by the International Accounting Standard Board (IASB) and in conformity with International Financial Reporting Standards as adopted by the European Union
(collectively “IFRS”). AB InBev did not early apply any new IFRS requirements that were not yet effective in 2023 and did not apply any European carve-outs from IFRS. 3. Summary of significant accounting policies The accounting policies
applied are consistent to all periods presented in these consolidated financial statements by the company and its subsidiary. (A) BASIS OF PREPARATION AND MEASUREMENT Depending on the applicable IFRS requirements, the measurement basis used in
preparing the financial statements is cost, net realizable value, fair value or recoverable amount. Whenever IFRS provides an option between cost and another measurement basis (e.g., systematic re-measurement), the cost approach is applied. (B)
FUNCTIONAL AND PRESENTATION CURRENCY Unless otherwise specified, all financial information included in these financial statements has been stated in US dollar, which is the company’s presentation currency, and has been rounded to the nearest
million. The functional currency of the parent company is the euro. (C) PRINCIPLES OF CONSOLIDATION Subsidiaries are those entities controlled by AB InBev. AB InBev controls an entity when it is exposed to, or has rights to, variable returns from
its involvement with the entity and has the ability to affect those returns through its power over the entity. In assessing control, potential voting rights are taken into account. Control is presumed to exist where AB InBev owns, directly or
indirectly, more than one half of the voting rights (which does not always equate to economic ownership), unless it can be demonstrated that such ownership does not constitute control. The financial statements of subsidiaries are included in the
consolidated financial statements from the date that control commences until the date that control ceases. Total comprehensive income of subsidiaries is attributed to the owners of the company and to the non-controlling interests even if this
results in the non-controlling interests having a deficit balance. Associates are undertakings in which AB InBev has significant influence over the financial and operating policies, but which it does not control. This is generally evidenced by
ownership of between 20% and 50% of the voting rights. A joint venture is an arrangement in which AB InBev has joint control, whereby AB InBev has rights to the net assets of the arrangement, rather than rights to its assets and obligations for its
liabilities. Associates and joint ventures are accounted for by the equity method of accounting, from the date that significant influence or joint control commences until the date that significant AB InBev – Annual Report 2023 82
influence or joint control ceases. When AB InBev’s share of
losses exceeds the carrying amount of the associate or joint venture, the carrying amount is reduced to nil and recognition of further losses is discontinued except to the extent that AB InBev has incurred legal or constructive obligations on behalf
of the associate or joint venture. Joint operations arise when AB InBev has rights to the assets and obligations to the liabilities of a joint arrangement. AB InBev accounts for its share of the assets, liabilities, revenues and expenses as from the
moment joint operation commences until the date that joint operation ceases. The financial statements of the company’s subsidiaries, joint ventures, joint operations and associates are prepared for the same reporting year as the parent
company, using consistent accounting policies. In exceptional cases when the financial statements of a subsidiary, joint venture, joint operation or associate are prepared as of a different date from that of AB InBev, adjustments are made for the
effects of significant transactions or events that occur between that date and the date of AB InBev's financial statements. In such cases, the difference between the end of the reporting period of these subsidiaries, joint ventures, joint operations
or associates from AB InBev's reporting period is no more than three months. Results from the company’s associates Anadolu Efes and Castel are reported on a three-month lag. Therefore, estimates are made to reflect AB InBev’s share in
the result of these associates for the last quarter. Such estimates are revisited when required. Transactions with non-controlling interests are treated as transactions with equity owners of the company. For purchases from non-controlling interests,
the difference between any consideration paid and the relevant share acquired of the carrying value of net assets of the subsidiary is recorded in equity. Gains or losses on disposals to non-controlling interests are also recorded in equity where
there is no loss of control. All intercompany transactions, balances and unrealized gains and losses on transactions between group companies have been eliminated. Unrealized gains arising from transactions with joint ventures, joint operations and
associates are eliminated to the extent of AB InBev’s interest in the entity. Unrealized losses are eliminated in the same way as unrealized gains, but only to the extent that there is no evidence of impairment. A listing of the
company’s most important subsidiaries, joint ventures, joint operations and associates is set out in Note 33 AB InBev companies. (D) SUMMARY OF CHANGES IN ACCOUNTING POLICIES A number of amendments to standards became mandatory for the first
time for the financial year beginning on 1 January 2023 and have not been listed in these consolidated financial statements as they either do not apply or are immaterial to AB InBev’s consolidated financial statements. The IASB made amendments
to IAS 12 Income taxes in May 2023 that (a) provide a temporary exception from accounting for deferred taxes arising from legislation enacted to implement the OECD’s Pillar Two model rules, and (b) introduce additional disclosure requirements.
The company and its subsidiaries are within the scope of the OECD Pillar Two model rules as Pillar Two legislation was enacted in Belgium, the jurisdiction in which the parent entity is incorporated, and will come into effect from 1 January 2024.
The company applied the exception from accounting for deferred taxes arising from legislation enacted and is in the process of assessing the full impact. Based on the preliminary analysis made, the company does not expect the impact to be material.
(E) FOREIGN CURRENCIES Foreign currency transactions Foreign currency transactions are accounted for at exchange rates prevailing at the date of the transactions. Monetary assets and liabilities denominated in foreign currencies are translated at
the exchange rates prevailing on the reporting. Gains and losses resulting from the settlement of foreign currency transactions and from the translation of monetary assets and liabilities denominated in foreign currencies are recognized in the
income statement. Non-monetary assets and liabilities denominated in foreign currencies are translated at the foreign exchange rate prevailing at the date of the transaction or, for those stated at fair value, at the dates the fair value was
determined. Translation of the results and financial position of foreign operations Assets and liabilities of foreign operations are translated to US dollar at foreign exchange rates prevailing at the reporting date. Income statements of foreign
operations, excluding foreign entities in hyperinflationary economies, are translated to US dollar at exchange rates for the year approximating the foreign exchange rates prevailing at the dates of the transactions. The components of
shareholders’ equity are translated at historical rates. Exchange differences arising from the translation of shareholders’ equity to US dollar at period-end exchange rates are taken to other comprehensive income (translation reserves).
AB InBev – Annual Report 2023 83
Financial Reporting in hyperinflationary economies In May 2018, the
Argentinean peso underwent a severe devaluation, causing Argentina´s three-year cumulative inflation to exceed 100% and thus, triggering the requirement to transition to hyperinflation accounting as of 2018, as prescribed by IAS 29 Financial
Reporting in Hyperinflationary Economies. Under IAS 29, non-monetary assets and liabilities stated at historical cost, equity and income statements of subsidiaries operating in hyperinflationary economies are restated for changes in the general
purchasing power of the local currency, applying a general price index. These re-measured accounts are used for conversion into US dollar at the period closing exchange rate. As a result, the statement of financial position and net results of
subsidiaries operating in hyperinflation economies are stated in terms of the measuring unit current at the end of the reporting period. The 2023 results, restated for purchasing power, were translated at the December 2023 closing rate of 808.737265
Argentinean pesos per US dollar (2022 results - at 177.131872 Argentinean pesos per US dollar). Exchange rates The most important exchange rates that have been used in preparing the financial statements are: Closing rate Average rate 1 US dollar
equals: 31 December 2023 31 December 2022 31 December 2023 31 December 2022 Argentinean peso 808.737265 177.131872 - - Brazilian real 4.841287 5.217705 5.008522 5.164428 Canadian dollar 1.325066 1.353834 1.351906 1.297354 Chinese yuan 7.104880
6.898736 7.063811 6.661729 Colombian peso 3 818.47 4 807.99 4 284.95 4 211.36 Euro 0.904977 0.937559 0.925550 0.951768 Mexican peso 16.893354 19.361452 17.728805 20.123646 Peruvian nuevo sol 3.713000 3.820004 3.745164 3.845294 Pound sterling
0.786470 0.831548 0.804601 0.811905 South African rand 18.414052 16.968472 18.409380 16.392270 South Korean won 1 296.53 1 260.16 1 309.12 1 286.17 (F) INTANGIBLE ASSETS Research and development Expenditure on research activities, undertaken with
the prospect of gaining new scientific or technical knowledge and understanding, is recognized in the income statement as an expense as incurred. Expenditure on development activities, whereby research findings are applied to a plan or design for
the production of new or substantially improved products and processes, is capitalized if the product or process is technically and commercially feasible, future economic benefits are probable, and the company has sufficient resources to complete
development. The expenditure capitalized includes the cost of materials, direct labor and an appropriate proportion of overheads. Other development expenditure is recognized in the income statement as an expense as incurred. Capitalized development
expenditure is stated at cost less accumulated amortization (see below) and impairment losses (refer to accounting policy N). Amortization related to research and development intangible assets is included within the cost of sales if production
related and in sales and marketing if related to commercial activities. Borrowing costs directly attributable to the acquisition, construction or production of qualifying assets are capitalized as part of the cost of such assets. Supply and
distribution rights A supply right is the right for AB InBev to supply a customer and the commitment by the customer to purchase from AB InBev. A distribution right is the right to sell specified products in a certain territory. Acquired
distribution rights are measured initially at cost or fair value when obtained through a business combination. Amortization related to supply and distribution rights is included within sales and marketing expenses. Brands If part of the
consideration paid in a business combination relates to trademarks, trade names, formulas, recipes or technological expertise these intangible assets are considered as a group of complementary assets that is referred to as a brand for which one fair
value is determined. Expenditure on internally generated brands is expensed as incurred. AB InBev – Annual Report 2023 84
Software Purchased software is measured at cost less accumulated
amortization. Expenditure on internally developed software is capitalized when the expenditure qualifies as development activities; otherwise, it is recognized in the income statement when incurred. Amortization related to software is included in
cost of sales, distribution expenses, sales and marketing expenses or administrative expenses based on the activity the software supports. Other intangible assets Other intangible assets, acquired by the company, are recognized at cost less
accumulated amortization and impairment losses. Other intangible assets also include multi-year sponsorship rights acquired by the company. These are initially recognized at the present value of the future payments and subsequently measured at cost
less accumulated amortization and impairment losses. Subsequent expenditure Subsequent expenditure on capitalized intangible assets is capitalized only when it increases the future economic benefits embodied in the specific asset to which it
relates. All other expenditures are expensed as incurred. Amortization Intangible assets with a finite life are amortized using the straight-line method over their estimated useful lives. Licenses, brewing, supply and distribution rights are
amortized over the period in which the rights exist. Brands are considered to have an indefinite life unless plans exist to discontinue the brand. Discontinuance of a brand can be either through sale or termination of marketing support. When AB
InBev purchases distribution rights for its own products the life of these rights is considered indefinite, unless the company has a plan to discontinue the related brand or distribution. Software and capitalized development costs related to
technology are amortized generally over 3 to 10 years. Brands are deemed intangible assets with indefinite useful lives and, therefore, are not amortized but tested for impairment on an annual basis (refer to accounting policy N). Gains and losses
on sale Net gains on sale of intangible assets are presented in the income statement as other operating income. Net losses on sale are included as other operating expenses. Net gains and losses are recognized in the income statement when the control
has been transferred to the buyer, recovery of the consideration is probable, the associated costs can be estimated reliably, and there is no continuing managerial involvement with the intangible assets. (G) BUSINESS COMBINATIONS The company applies
the acquisition method of accounting to account for acquisitions of businesses. The cost of an acquisition is measured as the aggregate of the fair values at the date of exchange of the assets given, liabilities incurred, and equity instruments
issued. Identifiable assets, liabilities and contingent liabilities acquired or assumed are measured separately at their fair value as of the acquisition date. The excess of the cost of the acquisition over the company’s interest in the fair
value of the identifiable net assets acquired is recorded as goodwill. The allocation of fair values to the identifiable assets acquired and liabilities assumed is based on various assumptions requiring management judgment. Acquisition-related costs
are expensed as incurred. If the business combination is achieved in stages, the acquisition date carrying value of AB InBev’s previously held interest in the acquiree is re-measured to fair value at the acquisition date; any gains or losses
arising from such re-measurement are recognized in profit or loss. (H) GOODWILL Goodwill is determined as the excess of the consideration paid over AB InBev’s interest in the net fair value of the identifiable assets, liabilities and
contingent liabilities of the acquired subsidiary, jointly controlled entity or associate recognized at the date of acquisition. All business combinations are accounted for by applying the purchase method. In conformity with IFRS 3 Business
Combinations, goodwill is stated at cost and not amortized but tested for impairment on an annual basis and whenever there is an indicator that the cash generating unit to which goodwill has been allocated, may be impaired (refer to accounting
policy N). Goodwill is expressed in the currency of the subsidiary to which it relates and is AB InBev – Annual Report 2023 85
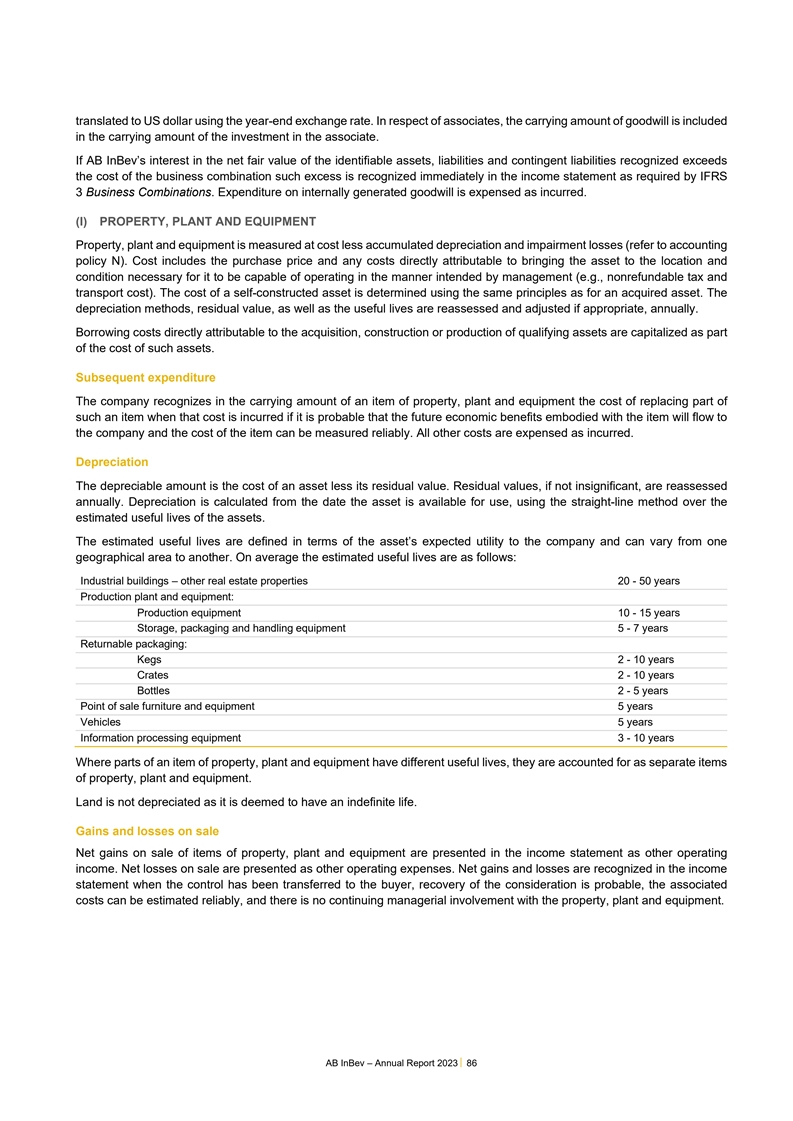
translated to US dollar using the year-end exchange rate. In respect of
associates, the carrying amount of goodwill is included in the carrying amount of the investment in the associate. If AB InBev’s interest in the net fair value of the identifiable assets, liabilities and contingent liabilities recognized
exceeds the cost of the business combination such excess is recognized immediately in the income statement as required by IFRS 3 Business Combinations. Expenditure on internally generated goodwill is expensed as incurred. (I) PROPERTY, PLANT AND
EQUIPMENT Property, plant and equipment is measured at cost less accumulated depreciation and impairment losses (refer to accounting policy N). Cost includes the purchase price and any costs directly attributable to bringing the asset to the
location and condition necessary for it to be capable of operating in the manner intended by management (e.g., nonrefundable tax and transport cost). The cost of a self-constructed asset is determined using the same principles as for an acquired
asset. The depreciation methods, residual value, as well as the useful lives are reassessed and adjusted if appropriate, annually. Borrowing costs directly attributable to the acquisition, construction or production of qualifying assets are
capitalized as part of the cost of such assets. Subsequent expenditure The company recognizes in the carrying amount of an item of property, plant and equipment the cost of replacing part of such an item when that cost is incurred if it is probable
that the future economic benefits embodied with the item will flow to the company and the cost of the item can be measured reliably. All other costs are expensed as incurred. Depreciation The depreciable amount is the cost of an asset less its
residual value. Residual values, if not insignificant, are reassessed annually. Depreciation is calculated from the date the asset is available for use, using the straight-line method over the estimated useful lives of the assets. The estimated
useful lives are defined in terms of the asset’s expected utility to the company and can vary from one geographical area to another. On average the estimated useful lives are as follows: Industrial buildings – other real estate
properties 20 - 50 years Production plant and equipment: Production equipment 10 - 15 years Storage, packaging and handling equipment 5 - 7 years Returnable packaging: Kegs 2 - 10 years Crates 2 - 10 years Bottles 2 - 5 years Point of sale furniture
and equipment 5 years Vehicles 5 years Information processing equipment 3 - 10 years Where parts of an item of property, plant and equipment have different useful lives, they are accounted for as separate items of property, plant and equipment. Land
is not depreciated as it is deemed to have an indefinite life. Gains and losses on sale Net gains on sale of items of property, plant and equipment are presented in the income statement as other operating income. Net losses on sale are presented as
other operating expenses. Net gains and losses are recognized in the income statement when the control has been transferred to the buyer, recovery of the consideration is probable, the associated costs can be estimated reliably, and there is no
continuing managerial involvement with the property, plant and equipment. AB InBev – Annual Report 2023 86
(J) LEASES The company as lessee The company assesses whether a
contract is or contains a lease at inception of a contract. The company recognizes a right- of-use asset and a corresponding lease liability with respect to all lease agreements in which it is the lessee, except for short- term leases (defined as
leases with a lease term of 12 months or less) and leases of low value assets. For these leases, the company recognizes the lease payments as an operating expense on a straight-line basis over the term of the lease, and payments for these leases are
presented in cash flow from operating activities. The lease liability is initially measured at the present value of the lease payments that are not paid at the commencement date, discounted by using the rate implicit in the lease. If this rate
cannot be readily determined, the company uses its incremental borrowing rate specific to the country, term and currency of the contract. In addition, the company considers its recent debt issuances as well as publicly available data for instruments
with similar characteristics when calculating the incremental borrowing rates. Lease payments include fixed payments, less any lease incentives, variable lease payments that depend on an index or a rate known at the commencement date, and purchase
options or extension option payments if the company is reasonably certain to exercise these options. Variable lease payments that do not depend on an index or rate are not included in the measurement of the lease liability and right-of-use asset and
are recognized as an expense in the income statement in the period in which the event or condition that triggers those payments occurs. A lease liability is remeasured upon a change in the lease term, changes in an index or rate used to determine
the lease payments or reassessment of exercise of a renewal and/or purchase option. The corresponding adjustment is made to the related right-of-use asset. The right-of-use assets comprise the initial measurement of the corresponding lease
liability, lease payments made at or before the commencement day and any initial direct costs. They are subsequently measured at cost less accumulated depreciation and impairment losses. The right-of-use assets are depreciated starting at the
commencement date over the shorter period of useful life of the underlying asset and lease term (refer to accounting policies I and N). The lease liability is presented in the ‘Interest-bearing loans and borrowings’ line and the
right-of-use assets are presented in the ‘Property, plant and equipment’ line in the consolidated statement of financial position. In addition, the principal portion of the lease payments is presented within financing activities and the
interest component is presented within operating activities in the consolidated cash flow statement. The company as lessor Leases where the company transfers substantially all the risks and rewards of ownership to the lessee are classified as
finance leases. Leases of assets under which all the risks and rewards of ownership are substantially retained by the company are classified as operating leases. Rental income is recognized in other operating income on a straight-line basis over the
term of the lease. (K) INVENTORIES Inventories are valued at the lower of cost and net realizable value. Cost includes expenditure incurred in acquiring the inventories and bringing them to their existing location and condition. The weighted average
method is used in assigning the cost of inventories. The cost of finished products and work in progress comprises raw materials, other production materials, direct labor, other direct cost and an allocation of fixed and variable overhead based on
normal operating capacity. Net realizable value is the estimated selling price in the ordinary course of business, less the estimated completion and selling costs. Inventories are written down on a case-by-case basis if the anticipated net
realizable value declines below the carrying amount of the inventories. The calculation of the net realizable value takes into consideration specific characteristics of each inventory category, such as expiration date, remaining shelf life,
slow-moving indicators, amongst others. AB InBev – Annual Report 2023 87
(L) TRADE AND OTHER RECEIVABLES Trade receivables are amounts due from
customers for goods sold or services performed in the ordinary course of business and generally due for settlement within 30 days. Trade receivables are recognized initially at the amount of the consideration that is unconditional unless they
contain significant financing components, when they are recognized at the amount adjusted for the time value of money. The company holds trade and other receivables with the objective to collect the contractual cash flows and therefore measures them
subsequently at amortized cost using the effective interest rate method. Trade and other receivables are carried at amortized cost less impairment losses. To determine the appropriate amount to be impaired factors such as significant financial
difficulties of the debtor, probability that the debtor will default, enter into bankruptcy or financial reorganization, or delinquency in payments are considered. Other receivables are initially recognized at fair value and subsequently measured at
amortized cost. Any impairment losses and foreign exchange results are directly recognized in profit or loss. (M) CASH AND CASH EQUIVALENTS Cash and cash equivalents include all cash balances and short-term highly liquid investments with a maturity
of three months or less from the date of acquisition that are readily convertible into cash. They are stated at face value, which approximates their fair value. In the cash flow statement, cash and cash equivalents are presented net of bank
overdrafts. (N) IMPAIRMENT The carrying amounts of property, plant and equipment, goodwill and intangible assets are reviewed at each reporting date to determine whether there is any indication of impairment. If there is an indicator of impairment,
the asset’s recoverable amount is estimated. In addition, goodwill, intangible assets that are not yet available for use and intangibles with an indefinite useful life are tested for impairment annually at the cash-generating unit level (that
is a country or group of countries managed as a group below a reporting region). An impairment loss is recognized whenever the carrying amount of an asset or the related cash-generating unit exceeds its recoverable amount. Impairment losses are
recognized in the income statement. Calculation of recoverable amount The recoverable amount of non-financial assets is determined as the higher of their fair value less costs to sell and value in use. For an asset that does not generate largely
independent cash inflows, the recoverable amount is determined for the cash-generating unit to which the asset belongs. The recoverable amount of the cash generating units to which the goodwill and the intangible assets with indefinite useful life
belong is based on discounted future cash flows using a discount rate that reflects current market assessments of the time value of money and the risks specific to the asset. These calculations are corroborated by valuation multiples, quoted share
prices for publicly traded subsidiaries or other available fair value indicators. Impairment losses recognized in respect of cash-generating units firstly reduce allocated goodwill and then the carrying amounts of the other assets in the unit on a
pro rata basis. Reversal of impairment losses Non-financial assets other than goodwill that suffered an impairment are reviewed for possible reversal of the impairment at each reporting date. An impairment loss is reversed only to the extent that
the asset’s carrying amount does not exceed the carrying amount that would have been determined, net of depreciation or amortization, if no impairment loss had been recognized. AB InBev – Annual Report 2023 88
(O) FAIR VALUE MEASUREMENT A number of AB InBev’s accounting
policies and notes require fair value measurement for both financial and non-financial items. Fair value is the price that would be received to sell an asset or paid to transfer a liability in an orderly transaction between market participants at
the measurement date. When measuring fair value, AB InBev uses observable market data as far as possible. Fair values are categorized into different levels in a fair value hierarchy based on the inputs used in the valuation techniques as follows:
• Level 1: inputs are unadjusted quoted prices in active markets for identical assets or liabilities. • Level 2: inputs are observable either directly (i.e., as prices) or indirectly (i.e., derived from prices). • Level 3: fair
value measurements incorporate significant inputs that are based on unobservable market data. If the inputs used to measure the fair value of an asset or liability fall into different levels of the fair value hierarchy, then the fair value
measurement is categorized in its entirety in the same level of the fair value hierarchy as the lowest level input that is significant to the entire measurement. The company applies fair value measurement to the instruments listed below. Derivatives
The fair value of exchange traded derivatives (e.g., exchange traded foreign currency futures) is determined by reference to the official prices published by the respective exchanges (e.g., the New York Board of Trade). The fair value of over-the-
counter derivatives is determined by commonly used valuation techniques. Debt securities This category includes both debt securities designated at FVOCI and FVPL. The fair value is measured using observable inputs such as interest rates and foreign
exchange rates. When it pertains to instruments that are publicly traded, the fair value is determined by reference to observable quotes. In circumstances where debt securities are not publicly traded, the main valuation technique is the discounted
cash flow. The company may apply other valuation techniques or combination of valuation techniques if the fair value results are more relevant. Equity securities designated as at FVOCI Investments in equity securities comprise quoted and unquoted
securities. When liquid quoted prices are available, these are used to fair value investments in quoted securities. The unquoted securities are fair valued using primarily the discounted cash flow method. Non-derivative financial liabilities The
fair value of non-derivative financial liabilities is generally determined using unobservable inputs and therefore fall into level 3. In these circumstances, the valuation technique used is discounted cash flow, whereby the projected cash flows are
discounted using a risk adjusted rate. (P) SHARE CAPITAL Repurchase of share capital When AB InBev buys back its own shares, the amount of the consideration paid, including directly attributable costs, is recognized as a deduction from equity under
treasury shares. The difference between the carrying value of the treasury shares issued to employees and their fair value is recognized in retained earnings. Dividends Dividends paid are recognized in the consolidated financial statements on the
date that the dividends are declared unless minimum statutory dividends are required by local legislation or the bylaws of the company’s subsidiaries. In such instances, statutory minimum dividends are recognized as a liability. AB InBev
– Annual Report 2023 89
Share issuance costs Incremental costs directly attributable to the
issue of new shares or options are shown in equity as a deduction, net of tax, from the proceeds. (Q) PROVISIONS Provisions are recognized when (i) the company has a present legal or constructive obligation as a result of past events, (ii) it is
probable that an outflow of resources embodying economic benefits will be required to settle the obligation, and (iii) a reliable estimate of the amount of the obligation can be made. Provisions are determined by discounting the expected future cash
flows at a pre-tax rate that reflects current market assessments of the time value of money and, where appropriate, the risks specific to the liability. Restructuring A provision for restructuring is recognized when the company has approved a
detailed and formal restructuring plan, and the restructuring has either commenced or has been announced publicly. Costs relating to the ongoing activities of the company are not provided for. The provision includes the benefit commitments in
connection with early retirement and redundancy schemes. Onerous contracts A provision for onerous contracts is recognized when the expected benefits to be derived by the company from a contract are lower than the unavoidable cost of meeting its
obligations under the contract. Such provision is measured at the present value of the lower of the expected cost of terminating the contract and the expected net cost of continuing with the contract. Disputes and Litigations A provision for
disputes and litigation is recognized when it is more likely than not that the company will be required to make future payments as a result of past events, such items may include but are not limited to, several claims, suits and actions relating to
antitrust laws, violations of distribution and license agreements, environmental matters, employment related disputes, claims from tax authorities related to indirect taxes, and alcohol industry litigation matters. (R) PENSION AND SIMILAR
OBLIGATIONS Post-employment benefits Post-employment benefits include pensions, post-employment life insurance and post-employment medical benefits. The company operates a number of defined benefit and defined contribution plans throughout the
world, the assets of which are generally held in separate trustee-managed funds. The pension plans are generally funded by payments from employees and the company, and, for defined benefit plans taking account of the recommendations of independent
actuaries. AB InBev maintains funded and unfunded pension plans. a) Defined contribution plans Contributions to defined contribution plans are recognized as an expense in the income statement when incurred. A defined contribution plan is a pension
plan under which AB InBev pays fixed contributions into a fund. AB InBev has no legal or constructive obligations to pay further contributions if the fund does not hold sufficient assets to pay all employees the benefits relating to employee service
in the current and prior periods. b) Defined benefit plans A defined benefit plan is a pension plan that is not a defined contribution plan. Typically, defined benefit plans define an amount of pension benefit that an employee will receive on
retirement, usually dependent on one or more factors such as age, years of service and compensation. For defined benefit plans, the pension expenses are assessed separately for each plan using the projected unit credit method. The projected unit
credit method considers each period of service as giving rise to an additional unit of benefit entitlement. Under this method, the cost of providing pensions is charged to the income statement so as to spread the regular cost over the service lives
of employees in accordance with the advice of qualified actuaries who carry out a full valuation of the plans at least every three years. The amounts charged to the income statement include current service cost, net interest cost (income), past
service costs and the effect of any curtailments or settlements. Past service costs are recognized at the earlier of when the amendment / curtailment occurs or when the company recognizes related restructuring or termination costs. The pension
obligations recognized in the statement of financial position are measured at the present value of the estimated future cash outflows using interest rates based on high quality corporate bond yields, which have terms to maturity approximating the
terms of the related liability, less the fair value of any AB InBev – Annual Report 2023 90
plan assets. Re-measurements, comprising of actuarial gains and losses,
the effect of the asset ceiling (excluding net interest) and the return on plan assets (excluding net interest) are recognized in full in the period in which they occur in the statement of comprehensive income. Re-measurements are not reclassified
to profit or loss in subsequent periods. Where the calculated amount of a defined benefit liability is negative (an asset), AB InBev recognizes such pension asset to the extent that economic benefits are available to AB InBev either from refunds or
reductions in future contributions. Other post-employment obligations Some of AB InBev’s companies provide post-employment medical benefits to their retirees. The entitlement to these benefits is usually based on the employee remaining in
service up to retirement age. The expected costs of these benefits are accrued over the period of employment, using an accounting methodology similar to that for defined benefit pension plans. Termination benefits Termination benefits are recognized
as an expense at the earlier when the company is demonstrably committed, without realistic possibility of withdrawal, to a formal detailed plan to terminate employment before the normal retirement date and when the company recognizes costs for a
restructuring. Bonuses Bonuses received by company employees and management are based on pre-defined company and individual target achievement. The estimated amount of the bonus is recognized as an expense in the period the bonus is earned. (S)
SHARE-BASED PAYMENTS Different share and share option programs allow company senior management and members of the board to acquire shares of the company and some of its affiliates. The fair value of the share options is estimated at grant date,
using a binomial Hull model, modified to reflect the IFRS 2 requirement that assumptions about forfeiture before the end of the vesting period cannot impact the fair value of the option. The fair value of the Restricted Stock Units
(“RSUs”) is the share price at grant date. The fair value of the Performance Stock Units (PSUs) with a market condition (relative Total Shareholder Return (“TSR”)) is determined using Monte Carlo simulations. The fair value
of the options, RSUs and PSUs granted is expensed over the vesting period based on the expected number of options that will vest. When the options are exercised, equity is increased by the amount of the proceeds received. When the share-based
payment programs are vested, they are settled net of tax withholdings. (T) INTEREST-BEARING LOANS AND BORROWINGS Interest-bearing loans and borrowings are recognized initially at fair value, less attributable transaction costs. Subsequent to initial
recognition, interest-bearing loans and borrowings are stated at amortized cost with any difference between the initial amount and the maturity amount being recognized in the income statement (in accretion expense) over the expected life of the
instrument on an effective interest rate basis. The company has long-term loan agreements with foreign subsidiaries, denominated in foreign currency, the settlement of which is neither planned nor likely to occur in the foreseeable future. In
accordance with IAS 21 The Effects of Changes in Foreign Exchange Rates, the exchange differences on retranslation of these loans are recognized in other comprehensive income in the consolidated financial statements. If the loan becomes planned or
likely to be settled in the foreseeable future, the related foreign currency differences are recognized in profit or loss. In the event of partial settlement, only the foreign currency differences corresponding to the settled portion are
reclassified to the profit or loss of the period in non-underlying finance income/(cost). (U) TRADE AND OTHER PAYABLES Trade and other payables are recognized initially at fair value and subsequently measured at amortized cost using the effective
interest method. AB InBev – Annual Report 2023 91
(V) INCOME TAX Income tax on the profit for the year comprises current
and deferred tax. Income tax is recognized in the income statement except to the extent that it relates to items recognized directly in equity, in which case the tax effect is also recognized directly in equity. Current tax is the expected tax
payable on the taxable income for the year, using tax rates enacted, or substantively enacted, at the reporting date, and any adjustment to tax payable in respect of previous years. In accordance with IAS 12 Income Taxes deferred taxes are provided
using the so-called balance sheet liability method. This means that, for all taxable and deductible differences between the tax bases of assets and liabilities and their carrying amounts in the statement of financial position a deferred tax
liability or asset is recognized. Under this method a provision for deferred taxes is also made for differences between the fair values of assets and liabilities acquired in a business combination and their tax base. IAS 12 prescribes that no
deferred taxes are recognized (i) on initial recognition of goodwill, (ii) at the initial recognition of assets or liabilities in a transaction that is not a business combination and affects neither accounting nor taxable profit and (iii) on
differences relating to investments in subsidiaries to the extent that they will probably not reverse in the foreseeable future and to the extent that the company is able to control the timing of the reversal. The amount of deferred tax provided is
based on the expected manner of realization or settlement of the carrying amount of assets and liabilities, using currently or substantively enacted tax rates. Deferred tax assets and liabilities are offset if there is a legally enforceable right to
offset current tax liabilities and assets, and they relate to income taxes levied by the same tax authority on the same taxable entity, or on different taxable entities which intend either to settle current tax liabilities and assets on a net basis,
or to realize the assets and settle the liabilities simultaneously. The company recognizes deferred tax assets, including assets arising from losses carried forward, to the extent that future probable taxable profit will be available against which
the deferred tax asset can be utilized. A deferred tax asset is reduced to the extent that it is no longer probable that the related tax benefit will be realized. The company has administrative and judicial discussions with tax authorities related
to certain tax treatments adopted when calculating the income tax and social contribution, in particular in Brazil. As required by IFRIC 23, the company assesses each material tax position. When the company assesses that it is probable that the tax
authorities will accept the tax treatments adopted, income taxes are calculated and reported consistently with the tax treatment used. The company discloses the potential effect of material uncertainties as a tax-related contingency in Note 29
Contingencies. When the company concludes that it is not probable that a particular tax treatment is accepted, the company generally uses the most likely amount of the tax treatment when determining the tax provision to be recorded. The company
presents income tax provisions in income tax liabilities. Assets and liabilities for uncertain tax treatments are presented as current tax assets/liabilities or deferred tax assets/liabilities. (W) INCOME RECOGNITION Goods sold Revenue is measured
based on the consideration to which the company expects to be entitled in a contract with a customer and excludes amounts collected on behalf of third parties. The company recognizes revenue when performance obligations are satisfied, meaning when
the company transfers control of a product to a customer. Specifically, revenue recognition follows the following five-step approach: • Identification of the contracts with a customer • Identification of the performance obligations in
the contracts • Determination of the transaction price • Allocation of the transaction price to the performance obligations in the contracts • Revenue recognition when performance obligations are satisfied Revenue from the sale of
goods is measured at the amount that reflects the best estimate of the consideration expected to be received in exchange for those goods. Contracts can include significant variable elements, such as discounts, rebates, refunds, credits, price
concessions, incentives, performance bonuses and penalties. Such trade incentives are treated as variable consideration. If the consideration includes a variable amount, the company estimates the amount of consideration to which it will be entitled
in exchange for transferring the promised goods or services to the customer. Variable consideration AB InBev – Annual Report 2023 92
is only included in the transaction price if it is highly probable that
the amount of revenue recognized would not be subject to significant future reversals when the uncertainty is resolved. Royalty income The company recognizes the sales-based or usage-based royalties in other operating income when the later of the
following events occurs: (a) the customer’s subsequent sales or usage; and (b) the performance obligation to which some or all of the sales-based or usage-based royalty has been allocated has been satisfied (or partially satisfied). Government
grants A government grant is recognized in the statement of financial position initially as deferred income when there is reasonable assurance that it will be received and that the company will comply with the conditions attached to it. Grants that
compensate the company for expenses incurred are recognized as other operating income on a systematic basis in the same periods in which the expenses are incurred. Grants that compensate the company for the acquisition of an asset are presented by
deducting them from the acquisition cost of the related asset. Finance income Finance income comprises interest received or receivable on funds invested, dividend income, foreign exchange gains, losses on currency hedging instruments offsetting
currency gains, gains on hedging instruments that are not part of a hedge accounting relationship, gains on financial assets measured at FVPL as well as any gains from hedge ineffectiveness (refer to accounting policy Y). Interest income is
recognized as it accrues (taking into account the effective yield on the asset) unless collectability is in doubt. Dividend income Dividend income is recognized in the income statement on the date that the dividend is declared. Tax credits From 2020
to 2023, Ambev, our subsidiary in Brazil, recognized tax credits in other operating income after a favorable judicial decision by the Brazilian Supreme Court, which recognized the right to exclude the Value-Added Tax (ICMS) from the taxable basis of
the social contribution on gross revenue (PIS and COFINS). The tax credits are reported in other operating income when the conditions in IAS 37 are met and the related interest in finance income. (X) EXPENSES Finance costs Finance costs comprise
interest payable on borrowings, calculated using the effective interest rate method, foreign exchange losses, gains on currency hedging instruments offsetting currency losses, results on interest rate hedging instruments, losses on hedging
instruments that are not part of a hedge accounting relationship, losses on financial assets classified as trading, impairment losses on financial assets as well as any losses from hedge ineffectiveness (refer to accounting policy Y). All interest
costs incurred in connection with borrowings or financial transactions are expensed as incurred as part of finance costs. Any difference between the initial amount and the maturity amount of interest-bearing loans and borrowings, such as transaction
costs and fair value adjustments, are recognized in the income statement (in accretion expense) over the expected life of the instrument on an effective interest rate basis (refer to accounting policy T). The interest expense component of lease
payments is also recognized in the income statement (in accretion expense) using the effective interest rate method. Research and development, advertising and promotional costs and systems development costs Research, advertising and promotional
costs are expensed in the year in which these costs are incurred. Development costs and systems development costs are expensed in the year in which these costs are incurred if they do not meet the criteria for capitalization (refer to accounting
policy F). AB InBev – Annual Report 2023 93
Purchasing, receiving and warehousing costs Purchasing and receiving
costs are included in the cost of sales, as well as the costs of storing and moving raw materials and packaging materials. The costs of storing finished products at the brewery as well as costs incurred for subsequent storage in distribution centers
are included within distribution expenses. Emission allowances The company is subject to greenhouse gas emission allowance trading schemes in force in a number of geographies. Acquired emission allowances are recognized at cost in cost of sales. To
the extent that it is expected that the number of allowances needed to settle the greenhouse gas emissions exceeds the number of emission allowances owned, a provision is recognized. Such provision is measured at the estimated amount of the
expenditure required to settle the obligation. (Y) FINANCIAL INSTRUMENTS AND HEDGE ACCOUNTING AB InBev uses derivative financial instruments to mitigate the transactional impact of foreign currencies, interest rates, equity prices and commodity
prices on the company’s performance. AB InBev’s financial risk management policy prohibits the use of derivative financial instruments for trading purposes and the company does therefore not hold or issue any such instruments for such
purposes. Classification and measurement Except for certain trade receivables, the company initially measures a financial asset at its fair value plus, in the case of a financial asset not at fair value through profit or loss, transaction costs
directly attributable to the acquisition or issue of the financial asset. Debt financial instruments are subsequently measured at amortized cost, FVOCI or FVPL. The classification is based on two criteria: the objective of the company’s
business model for managing the assets; and whether the instruments’ contractual cash flows represent ‘solely payments of principal and interest’ on the principal amount outstanding (the ‘SPPI criterion’). The
classification and measurement of the company’s financial assets is as follows: • Debt instruments at amortized cost: comprise investments in debt securities where the contractual cash flows are solely payments of principal and interest
and the company’s business model is to collect contractual cash flows. Interest income, foreign exchange gains and losses and any impairment charges for such instruments are recognized in profit or loss. • Debt instruments at FVOCI with
gains or losses recycled to profit or loss on derecognition: comprise investments in debt securities where the contractual cash flows are solely payments of principal and interest and the company’s business model is achieved by both collecting
contractual cash flows and selling financial assets. Interest income, foreign exchange gains and losses and any impairment charges on such instruments are recognized in profit or loss. All other fair value gains and losses are recognized in other
comprehensive income. On disposal of these debt securities, any related balance within FVOCI reserve is reclassified to profit or loss. • Equity instruments designated at FVOCI, with no recycling of gains or losses to profit or loss on
derecognition: the company designates these investments on an instrument-by-instrument basis as equity securities at FVOCI because they represent investments held for long term strategic purposes. When cost does not provide an appropriate estimate
of fair value, investments in unquoted companies are subsequently measured at fair value using discounted cash flow methods. These investments are not subject to impairment testing and upon disposal, the cumulative gain or loss accumulated in other
comprehensive income are not reclassified to profit or loss. • Financial assets and liabilities at FVPL: comprise derivative instruments and equity instruments which were not designated as FVOCI. This category also includes debt instruments
which do not meet the cash flow or the business model tests. Hedge accounting The company designates certain derivatives as hedging instruments to hedge the variability in cash flows associated with highly probable forecast transactions arising from
changes in foreign exchange rates, interest rates and commodity prices. To hedge changes in the fair value of recognized assets, liabilities and firm commitments, the company designates certain derivatives as part of fair value hedge. The company
also designates certain derivatives and non-derivative financial liabilities as hedges of foreign exchange risk on a net investment in a foreign operation. At the inception of the hedging relationships, the company documents the risk management
objective and strategy for undertaking the hedge. Hedge effectiveness is measured at the inception of the hedge relationship and through periodic AB InBev – Annual Report 2023 94
prospective effectiveness assessments to ensure that an economic
relationship exists between hedged item and hedging instrument. For the different type of hedges in place, the company generally enters into hedge relationships where the critical terms of the hedging instrument match exactly the terms of the hedged
item. Therefore, the hedge ratio is typically 1:1. The company performs a qualitative assessment of effectiveness. In circumstances where the terms of the hedged item no longer exactly match the critical terms of the hedging instrument, the company
uses a hypothetical derivative method to assess effectiveness. Possible sources of ineffectiveness are changes in the timing of the forecasted transaction, changes in the quantity of the hedged item or changes in the credit risk of either party to
the derivative contract. Cash flow hedge accounting Cash flow hedge accounting is applied when a derivative hedges the variability in cash flows of a highly probable forecasted transaction, foreign currency risk of a firm commitment or a recognized
asset or liability (such as variable interest rate instrument). When the hedged forecasted transaction or firm commitment subsequently results in the recognition of a non-financial item, the amount accumulated in the hedging reserves is included
directly in the initial carrying amount of the non-financial item when it is recognized. For all other hedged transactions, the amount accumulated in the hedging reserves is reclassified to profit or loss in the same period during which the hedged
item affects profit or loss (e.g., when the variable interest expense is recognized). When a hedging instrument or hedge relationship is terminated but the hedged transaction is still expected to occur, the cumulative gain or loss (at that point)
remains in equity and is reclassified to profit or loss when the hedged transaction occurs. If the hedged transaction is no longer expected to occur, the cumulative gain or loss recognized in other comprehensive income is reclassified to profit or
loss immediately. Any ineffectiveness is recognized immediately in profit or loss. Fair value hedge accounting When a derivative hedges the variability in fair value of a recognized asset or liability (such as a fixed rate instrument) or a firm
commitment, any resulting gain or loss on the hedging instrument is recognized in the profit or loss. The carrying amount of the hedged item is also adjusted for fair value changes in respect of the risk being hedged, with any gain or loss being
recognized in profit or loss. The fair value adjustment to the carrying amount of the hedged item is amortized to profit or loss from the date of discontinuation. Net investment hedge accounting When a non-derivative foreign currency liability
hedges a net investment in a foreign operation, exchange differences arising on the translation of the liability to the functional currency are recognized directly in other comprehensive income (translation reserves). When a derivative financial
instrument hedges a net investment in a foreign operation, the portion of the gain or the loss on the hedging instrument that is determined to be effective is recognized directly in other comprehensive income (translation reserves) and is
reclassified to profit or loss upon disposal of the foreign operation, while the ineffective portion is reported in profit or loss. Offsetting Financial assets and financial liabilities are offset, and the net amount presented in the statement of
financial position when, and only when, the company has a current legally enforceable right to set off the amounts and it intends either to settle them on a net basis or to realize the asset and settle the liability simultaneously. Derecognition A
financial asset is primarily derecognized (i.e., removed from the Group’s consolidated statement of financial position) when the rights to receive cash flows from the asset have expired or the Group has transferred its rights to receive cash
flows from the asset. A financial liability is derecognized when the obligation under the liability is discharged, cancelled or expires. (Z) SEGMENT REPORTING Operating segments are components of the company’s business activities about which
separate financial information is available that is evaluated regularly by senior management. The company has six operating segments. AB InBev – Annual Report 2023 95
AB InBev’s operating segment reporting format is geographical
because the company’s risks and rates of return are affected predominantly by the fact that AB InBev operates in different geographical areas. The company’s management structure and internal reporting system to the Board of Directors is
set up accordingly. The company’s five geographic regions are North America, Middle Americas, South America, EMEA and Asia Pacific. The aggregation criteria applied are based on similarities in the economic indicators (e.g., margins) that have
been assessed in determining that the aggregated operating segments share similar economic characteristics, as prescribed in IFRS 8. Furthermore, management assessed additional factors such as management’s views on the optimal number of
reporting segments, AB InBev historical geographies, peer comparison (e.g., Asia Pacific and EMEA being a commonly reported regions amongst the company’s peers), as well as management’s view on the optimal balance between practical and
more granular information. The results of Global Export and Holding Companies, which includes the company’s global headquarters and the export businesses in countries in which AB InBev has no operations are reported separately. The
company’s five geographic regions plus the Global Export and Holding Companies comprise the company’s six reportable segments for financial reporting purposes. Segment capital expenditure is the total cost incurred during the period to
acquire property, plant and equipment, and intangible assets other than goodwill. (AA) NON-UNDERLYING ITEMS Non-underlying items are those that in management’s judgment need to be disclosed separately by virtue of their size or incidence. Such
items are disclosed on the face of the consolidated income statement or separately disclosed in the notes to the financial statements. Transactions which may give rise to non-underlying items are principally restructuring activities, impairments,
gains or losses on disposal of investments or business activities and the effect of the accelerated repayment of certain debt facilities. Mark-to-market adjustments on derivative instruments related to the hedging of share-based payment programs and
on derivative instruments entered into to hedge the shares issued in relation to the combinations with Grupo Modelo and SAB are reported in non-underlying finance income/(cost). The impact of income tax on the non-underlying items is calculated
country-by-country and is included in non-underlying taxes (Refer to Note 8 Non-Underlying items). (BB) DISCONTINUED OPERATIONS AND NON-CURRENT ASSETS HELD FOR SALE A discontinued operation is a component of the company that either has been disposed
of or is classified as held for sale and represents a separate major line of business or geographical area of operations and is part of a single coordinated plan to dispose of or is a subsidiary acquired exclusively with a view to resale. AB InBev
classifies a non-current asset (or disposal group) as held for sale if its carrying amount will be recovered principally through a sale transaction rather than through continuing use if all of the conditions of IFRS 5 are met. A disposal group is
defined as a group of assets to be disposed of, by sale or otherwise, together as a group in a single transaction, and liabilities directly associated with those assets that will be transferred. Immediately before classification as held for sale,
the company measures the carrying amount of the asset (or all the assets and liabilities in the disposal group) in accordance with applicable IFRS. Then, on initial classification as held for sale, non-current assets and disposal groups are
recognized at the lower of carrying amount and fair value less costs to sell. Impairment losses on initial classification as held for sale are included in profit or loss. The same applies to gains and losses on subsequent re-measurement. Non-current
assets classified as held for sale are no longer depreciated or amortized. (CC) RECENTLY ISSUED IFRS To the extent that new IFRS requirements are expected to be applicable in the future, they have not been applied in preparing these consolidated
financial statements for the year ended 31 December 2023. A number of amendments to standards are effective for annual periods beginning after 1 January 2024 and have not been discussed either because of their non-applicability or immateriality to
AB InBev’s consolidated financial statements. AB InBev – Annual Report 2023 96
4. Use of estimates and judgments The preparation of financial
statements in conformity with IFRS requires management to make judgments, estimates and assumptions that affect the application of policies and reported amounts of assets and liabilities, income and expenses. The estimates and associated assumptions
are based on historical experience and various other factors that are believed to be reasonable under the circumstances, the results of which form the basis of making the judgments about carrying values of assets and liabilities that are not readily
apparent from other sources. Actual results may differ from these estimates. These estimates and underlying assumptions are reviewed on an ongoing basis. Revisions to accounting estimates are recognized in the period in which the estimate is revised
if the revision affects only that period or, if the revision affects both current and future periods, in the period of the revision and future periods. Although each of its significant accounting policies reflects judgments, assessments or
estimates, AB InBev believes that the following accounting policies reflect the most critical judgments, estimates and assumptions that are important to its business operations and understanding results: business combinations, intangible assets,
goodwill, impairment, provisions, share-based payments, employee benefits and accounting for current and deferred tax. The fair values of acquired identifiable intangibles are based on an assessment of future cash flows. Impairment analyses of
goodwill and indefinite-lived intangible assets are performed annually and whenever a triggering event has occurred, in order to determine whether the carrying value exceeds the recoverable amount. These calculations are based on estimates of future
cash flows. The company uses its judgment to select a variety of methods including the discounted cash flow method and option valuation models and makes assumptions about the fair value of financial instruments that are mainly based on market
conditions existing at each reporting date. Actuarial assumptions are established to anticipate future events and are used in calculating pension and other long-term employee benefit expenses and liabilities. These factors include assumptions with
respect to interest rates, rates of increase in health care costs, rates of future compensation increases, turnover rates, and life expectancy. The company is subject to income tax in numerous jurisdictions. Significant judgment is required to
determine the worldwide provision for income tax. There are some transactions and calculations for which the ultimate tax determination is uncertain. Some subsidiaries within the group are involved in tax audits and local enquiries usually in
relation to prior years. Investigations and negotiations with local tax authorities are ongoing in various jurisdictions at the reporting date and, by their nature, these can take considerable time to conclude. In assessing the amount of any income
tax provisions to be recognized in the financial statements, estimates are made of the expected successful settlement of these matters. Estimates of interest and penalties on tax liabilities are also recorded. Where the final outcome of these
matters is different from the amounts that were initially recorded, such differences will impact the current and deferred income tax assets and liabilities in the period that such determination is made. Judgments made by management in the
application of IFRS that have a significant effect on the financial statements and estimates with a significant risk of material adjustment in the following year are further discussed in the relevant notes hereafter. AB InBev – Annual Report
2023 97
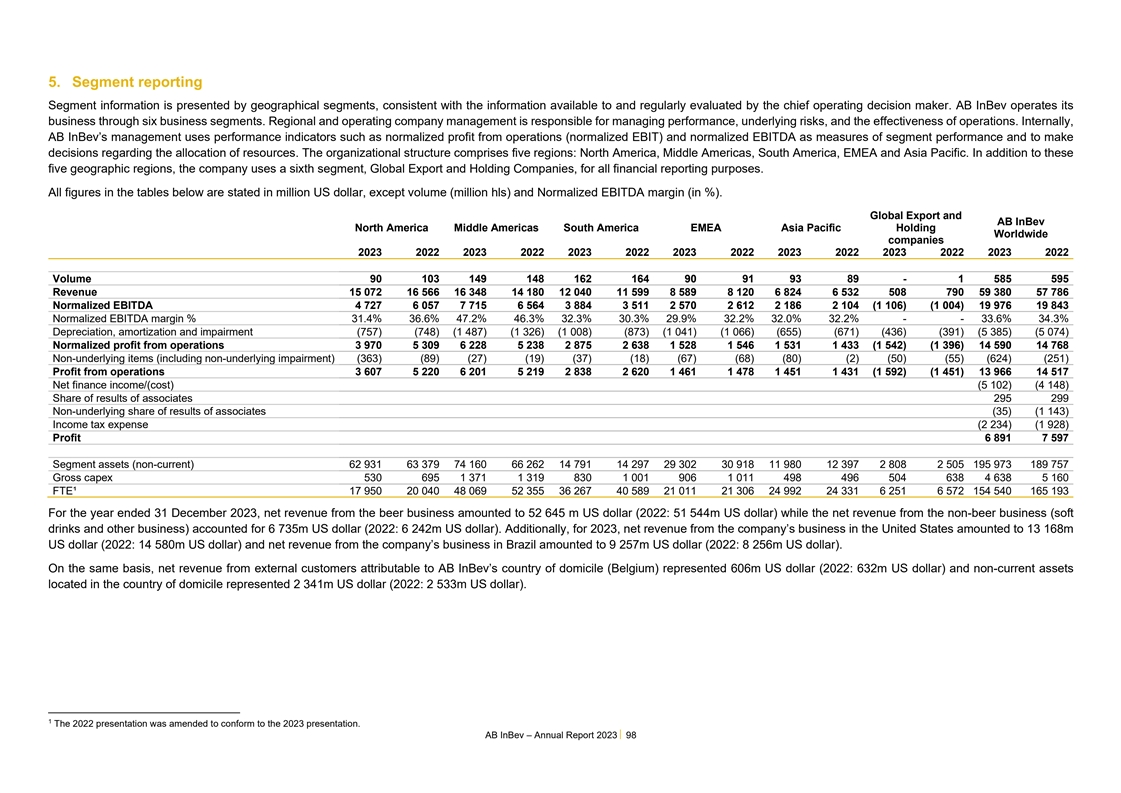
5. Segment reporting Segment information is presented by geographical
segments, consistent with the information available to and regularly evaluated by the chief operating decision maker. AB InBev operates its business through six business segments. Regional and operating company management is responsible for managing
performance, underlying risks, and the effectiveness of operations. Internally, AB InBev’s management uses performance indicators such as normalized profit from operations (normalized EBIT) and normalized EBITDA as measures of segment
performance and to make decisions regarding the allocation of resources. The organizational structure comprises five regions: North America, Middle Americas, South America, EMEA and Asia Pacific. In addition to these five geographic regions, the
company uses a sixth segment, Global Export and Holding Companies, for all financial reporting purposes. 1 All figures in the tables below are stated in million US dollar, except volume (million hls) and Normalized EBITDA margin (in %). Global
Export and AB InBev North America Middle Americas South America EMEA Asia Pacific Holding Worldwide companies 2023 2022 2023 2022 2023 2022 2023 2022 2023 2022 2023 2022 2023 2022 . Volume 90 103 149 148 162 164 90 91 93 89 - 1 585 595 Revenue 15
072 16 566 16 348 14 180 12 040 11 599 8 589 8 120 6 824 6 532 508 790 59 380 57 786 Normalized EBITDA 4 727 6 057 7 715 6 564 3 884 3 511 2 570 2 612 2 186 2 104 (1 106) (1 004) 19 976 19 843 Normalized EBITDA margin % 31.4% 36.6% 47.2% 46.3% 32.3%
30.3% 29.9% 32.2% 32.0% 32.2% - - 33.6% 34.3% Depreciation, amortization and impairment (757) (748) (1 487) (1 326) (1 008) (873) (1 041) (1 066) (655) (671) (436) (391) (5 385) (5 074) Normalized profit from operations 3 970 5 309 6 228 5 238 2 875
2 638 1 528 1 546 1 531 1 433 (1 542) (1 396) 14 590 14 768 Non-underlying items (including non-underlying impairment) (363) (89) (27) (19) (37) (18) (67) (68) (80) (2) (50) (55) (624) (251) Profit from operations 3 607 5 220 6 201 5 219 2 838 2 620
1 461 1 478 1 451 1 431 (1 592) (1 451) 13 966 14 517 Net finance income/(cost) (5 102) (4 148) Share of results of associates 295 299 Non-underlying share of results of associates (35) (1 143) Income tax expense (2 234) (1 928) Profit 6 891 7 597 .
Segment assets (non-current) 62 931 63 379 74 160 66 262 14 791 14 297 29 302 30 918 11 980 12 397 2 808 2 505 195 973 189 757 Gross capex 530 695 1 371 1 319 830 1 001 906 1 011 498 496 504 638 4 638 5 160 FTE¹ 17 950 20 040 48 069 52 355 36
267 40 589 21 011 21 306 24 992 24 331 6 251 6 572 154 540 165 193 For the year ended 31 December 2023, net revenue from the beer business amounted to 52 645 m US dollar (2022: 51 544m US dollar) while the net revenue from the non-beer business
(soft drinks and other business) accounted for 6 735m US dollar (2022: 6 242m US dollar). Additionally, for 2023, net revenue from the company’s business in the United States amounted to 13 168m US dollar (2022: 14 580m US dollar) and net
revenue from the company’s business in Brazil amounted to 9 257m US dollar (2022: 8 256m US dollar). On the same basis, net revenue from external customers attributable to AB InBev’s country of domicile (Belgium) represented 606m US
dollar (2022: 632m US dollar) and non-current assets located in the country of domicile represented 2 341m US dollar (2022: 2 533m US dollar). 1 The 2022 presentation was amended to conform to the 2023 presentation. AB InBev – Annual Report
2023 98
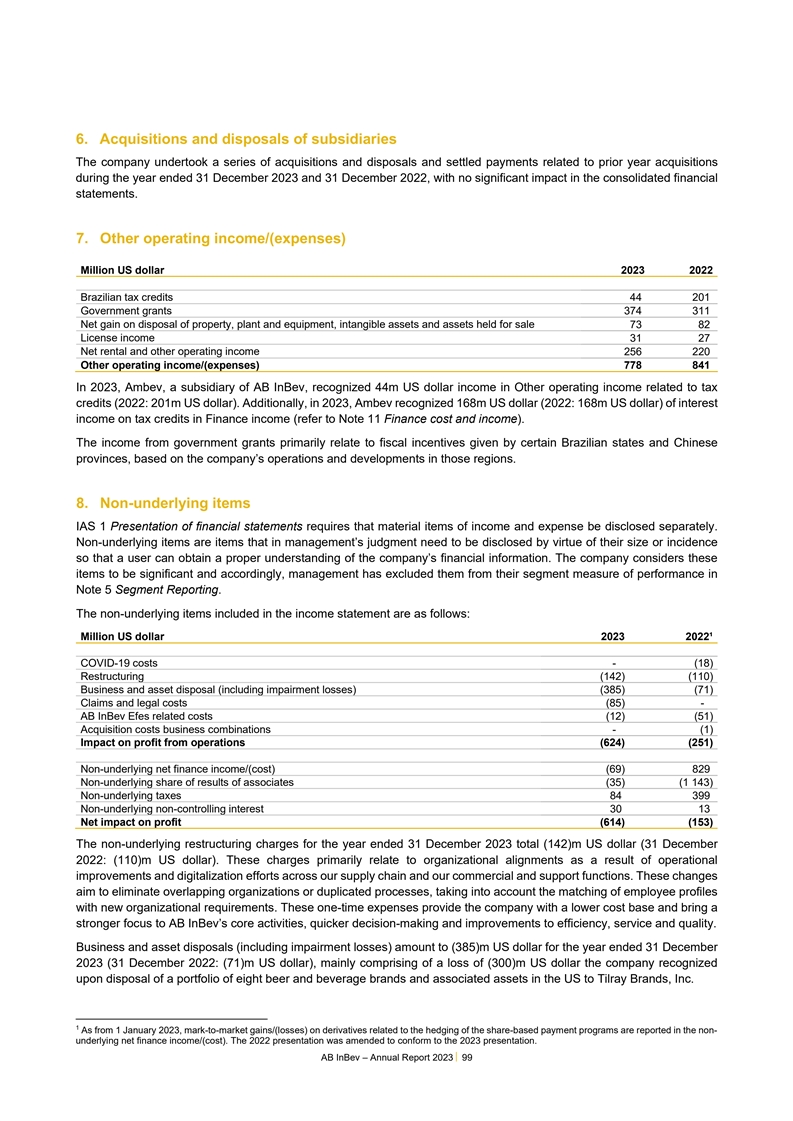
6. Acquisitions and disposals of subsidiaries The company undertook a
series of acquisitions and disposals and settled payments related to prior year acquisitions during the year ended 31 December 2023 and 31 December 2022, with no significant impact in the consolidated financial statements. 7. Other operating
income/(expenses) Million US dollar 2023 2022 Brazilian tax credits 44 201 Government grants 374 311 Net gain on disposal of property, plant and equipment, intangible assets and assets held for sale 73 82 License income 31 27 Net rental and other
operating income 256 220 Other operating income/(expenses) 778 841 In 2023, Ambev, a subsidiary of AB InBev, recognized 44m US dollar income in Other operating income related to tax credits (2022: 201m US dollar). Additionally, in 2023, Ambev
recognized 168m US dollar (2022: 168m US dollar) of interest income on tax credits in Finance income (refer to Note 11 Finance cost and income). The income from government grants primarily relate to fiscal incentives given by certain Brazilian
states and Chinese provinces, based on the company’s operations and developments in those regions. 8. Non-underlying items IAS 1 Presentation of financial statements requires that material items of income and expense be disclosed separately.
Non-underlying items are items that in management’s judgment need to be disclosed by virtue of their size or incidence so that a user can obtain a proper understanding of the company’s financial information. The company considers these
items to be significant and accordingly, management has excluded them from their segment measure of performance in Note 5 Segment Reporting. 1 The non-underlying items included in the income statement are as follows: Million US dollar 2023
2022¹ COVID-19 costs - (18) Restructuring (142) (110) Business and asset disposal (including impairment losses) (385) (71) Claims and legal costs (85) - AB InBev Efes related costs (12) (51) Acquisition costs business combinations - (1) Impact
on profit from operations (624) (251) Non-underlying net finance income/(cost) (69) 829 Non-underlying share of results of associates (35) (1 143) Non-underlying taxes 84 399 Non-underlying non-controlling interest 30 13 Net impact on profit (614)
(153) The non-underlying restructuring charges for the year ended 31 December 2023 total (142)m US dollar (31 December 2022: (110)m US dollar). These charges primarily relate to organizational alignments as a result of operational improvements and
digitalization efforts across our supply chain and our commercial and support functions. These changes aim to eliminate overlapping organizations or duplicated processes, taking into account the matching of employee profiles with new organizational
requirements. These one-time expenses provide the company with a lower cost base and bring a stronger focus to AB InBev’s core activities, quicker decision-making and improvements to efficiency, service and quality. Business and asset
disposals (including impairment losses) amount to (385)m US dollar for the year ended 31 December 2023 (31 December 2022: (71)m US dollar), mainly comprising of a loss of (300)m US dollar the company recognized upon disposal of a portfolio of eight
beer and beverage brands and associated assets in the US to Tilray Brands, Inc. 1 As from 1 January 2023, mark-to-market gains/(losses) on derivatives related to the hedging of the share-based payment programs are reported in the non- underlying net
finance income/(cost). The 2022 presentation was amended to conform to the 2023 presentation. AB InBev – Annual Report 2023 99
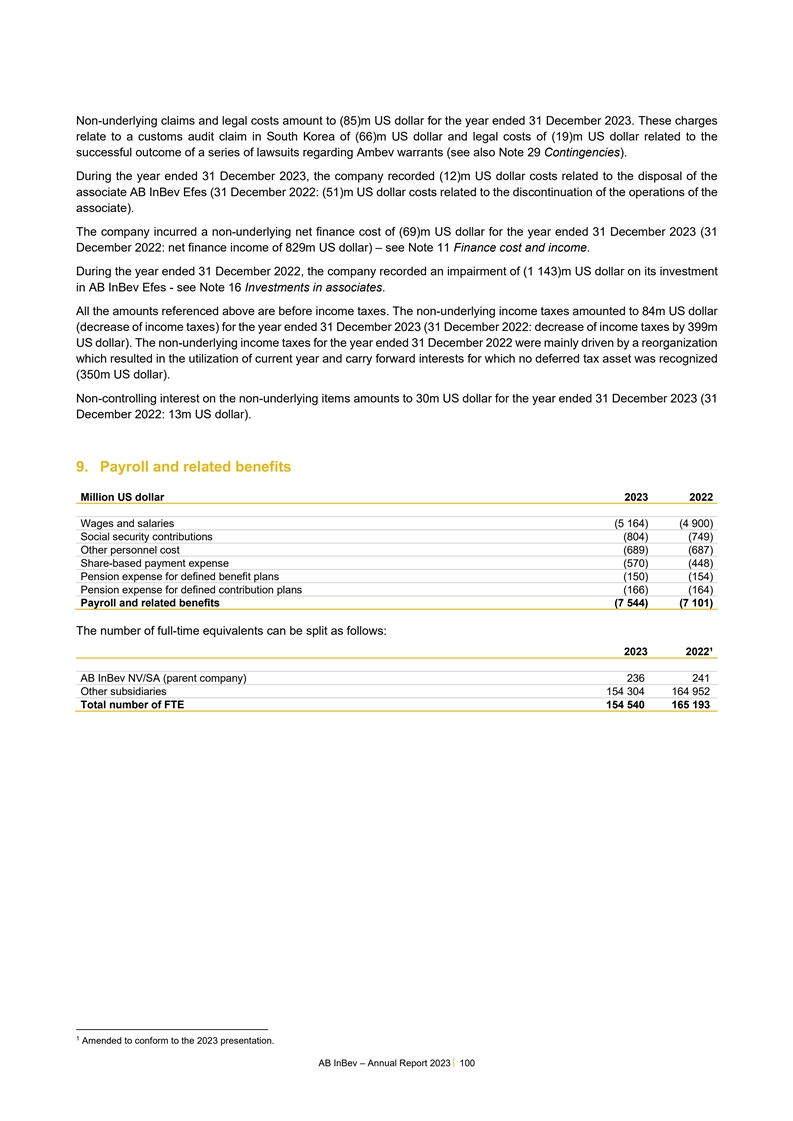
Non-underlying claims and legal costs amount to (85)m US dollar for
the year ended 31 December 2023. These charges relate to a customs audit claim in South Korea of (66)m US dollar and legal costs of (19)m US dollar related to the successful outcome of a series of lawsuits regarding Ambev warrants (see also Note 29
Contingencies). During the year ended 31 December 2023, the company recorded (12)m US dollar costs related to the disposal of the associate AB InBev Efes (31 December 2022: (51)m US dollar costs related to the discontinuation of the operations of
the associate). The company incurred a non-underlying net finance cost of (69)m US dollar for the year ended 31 December 2023 (31 December 2022: net finance income of 829m US dollar) – see Note 11 Finance cost and income. During the year ended
31 December 2022, the company recorded an impairment of (1 143)m US dollar on its investment in AB InBev Efes - see Note 16 Investments in associates. All the amounts referenced above are before income taxes. The non-underlying income taxes amounted
to 84m US dollar (decrease of income taxes) for the year ended 31 December 2023 (31 December 2022: decrease of income taxes by 399m US dollar). The non-underlying income taxes for the year ended 31 December 2022 were mainly driven by a
reorganization which resulted in the utilization of current year and carry forward interests for which no deferred tax asset was recognized (350m US dollar). Non-controlling interest on the non-underlying items amounts to 30m US dollar for the year
ended 31 December 2023 (31 December 2022: 13m US dollar). 9. Payroll and related benefits Million US dollar 2023 2022 Wages and salaries (5 164) (4 900) Social security contributions (804) (749) Other personnel cost (689) (687) Share-based payment
expense (570) (448) Pension expense for defined benefit plans (150) (154) Pension expense for defined contribution plans (166) (164) Payroll and related benefits (7 544) (7 101) 1 The number of full-time equivalents can be split as follows: 2023
2022¹ AB InBev NV/SA (parent company) 236 241 Other subsidiaries 154 304 164 952 Total number of FTE 154 540 165 193 1 Amended to conform to the 2023 presentation. AB InBev – Annual Report 2023 100
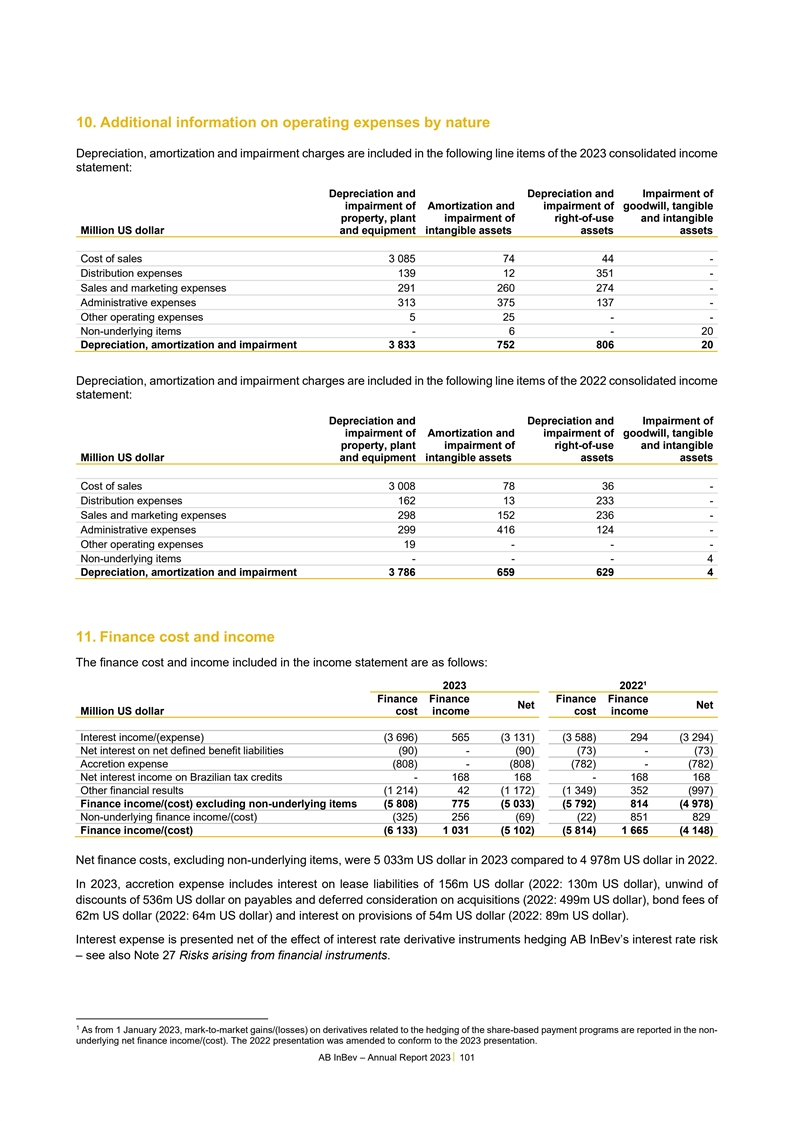
10. Additional information on operating expenses by nature
Depreciation, amortization and impairment charges are included in the following line items of the 2023 consolidated income statement: Depreciation and Depreciation and Impairment of impairment of Amortization and impairment of goodwill, tangible
property, plant impairment of right-of-use and intangible Million US dollar and equipment intangible assets assets assets Cost of sales 3 085 74 44 - Distribution expenses 139 12 351 - Sales and marketing expenses 291 260 274 - Administrative
expenses 313 375 137 - Other operating expenses 5 25 - - Non-underlying items - 6 - 20 Depreciation, amortization and impairment 3 833 752 806 20 Depreciation, amortization and impairment charges are included in the following line items of the 2022
consolidated income statement: Depreciation and Depreciation and Impairment of impairment of Amortization and impairment of goodwill, tangible property, plant impairment of right-of-use and intangible Million US dollar and equipment intangible
assets assets assets Cost of sales 3 008 78 36 - Distribution expenses 162 13 233 - Sales and marketing expenses 298 152 236 - Administrative expenses 299 416 124 - Other operating expenses 19 - - - Non-underlying items - - - 4 Depreciation,
amortization and impairment 3 786 659 629 4 11. Finance cost and income 1 The finance cost and income included in the income statement are as follows: 2023 2022¹ Finance Finance Finance Finance Net Net Million US dollar cost income cost income
Interest income/(expense) (3 696) 565 (3 131) (3 588) 294 (3 294) Net interest on net defined benefit liabilities (90) - (90) (73) - (73) Accretion expense (808) - (808) (782) - (782) Net interest income on Brazilian tax credits - 168 168 - 168 168
Other financial results (1 214) 42 (1 172) (1 349) 352 (997) Finance income/(cost) excluding non-underlying items (5 808) 775 (5 033) (5 792) 814 (4 978) Non-underlying finance income/(cost) (325) 256 (69) (22) 851 829 Finance income/(cost) (6 133)
1 031 (5 102) (5 814) 1 665 (4 148) Net finance costs, excluding non-underlying items, were 5 033m US dollar in 2023 compared to 4 978m US dollar in 2022. In 2023, accretion expense includes interest on lease liabilities of 156m US dollar (2022:
130m US dollar), unwind of discounts of 536m US dollar on payables and deferred consideration on acquisitions (2022: 499m US dollar), bond fees of 62m US dollar (2022: 64m US dollar) and interest on provisions of 54m US dollar (2022: 89m US dollar).
Interest expense is presented net of the effect of interest rate derivative instruments hedging AB InBev’s interest rate risk – see also Note 27 Risks arising from financial instruments. 1 As from 1 January 2023, mark-to-market
gains/(losses) on derivatives related to the hedging of the share-based payment programs are reported in the non- underlying net finance income/(cost). The 2022 presentation was amended to conform to the 2023 presentation. AB InBev – Annual
Report 2023 101
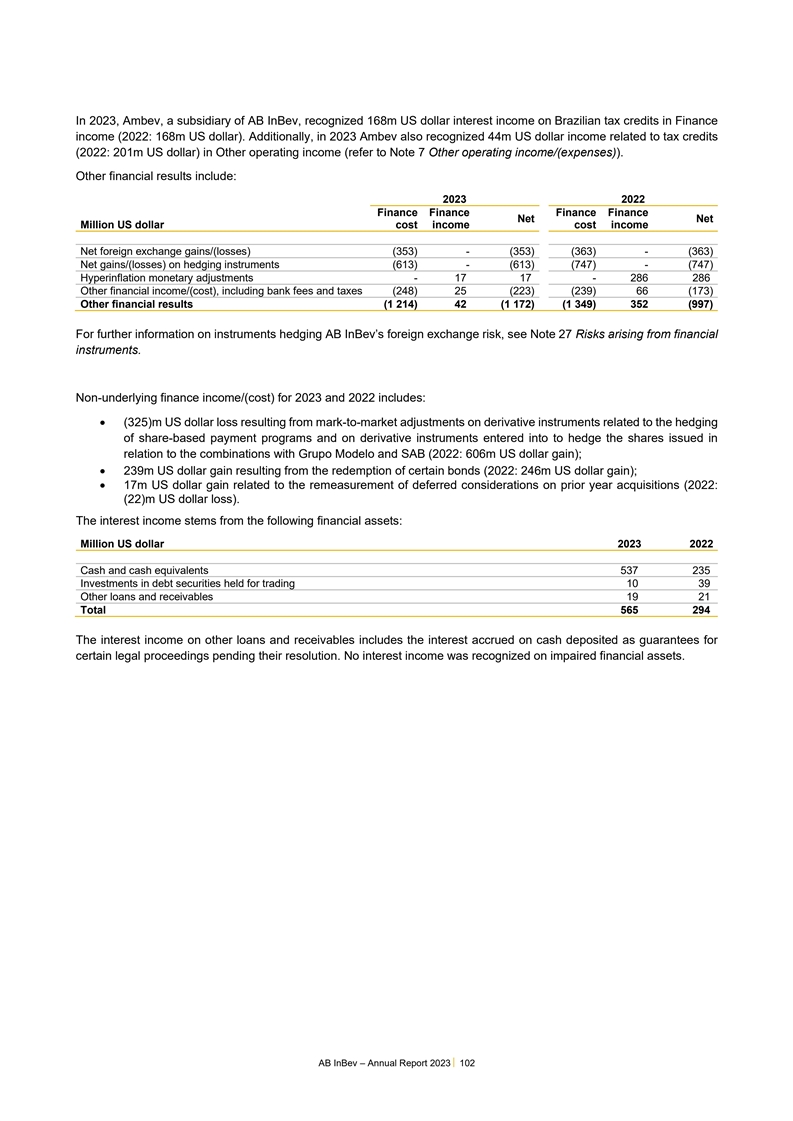
In 2023, Ambev, a subsidiary of AB InBev, recognized 168m US dollar
interest income on Brazilian tax credits in Finance income (2022: 168m US dollar). Additionally, in 2023 Ambev also recognized 44m US dollar income related to tax credits (2022: 201m US dollar) in Other operating income (refer to Note 7 Other
operating income/(expenses)). Other financial results include: 2023 2022 Finance Finance Finance Finance Net Net Million US dollar cost income cost income Net foreign exchange gains/(losses) (353) - (353) (363) - (363) Net gains/(losses) on hedging
instruments (613) - (613) (747) - (747) Hyperinflation monetary adjustments - 17 17 - 286 286 Other financial income/(cost), including bank fees and taxes (248) 25 (223) (239) 66 (173) Other financial results (1 214) 42 (1 172) (1 349) 352 (997) For
further information on instruments hedging AB InBev’s foreign exchange risk, see Note 27 Risks arising from financial instruments. Non-underlying finance income/(cost) for 2023 and 2022 includes: • (325)m US dollar loss resulting from
mark-to-market adjustments on derivative instruments related to the hedging of share-based payment programs and on derivative instruments entered into to hedge the shares issued in relation to the combinations with Grupo Modelo and SAB (2022: 606m
US dollar gain); • 239m US dollar gain resulting from the redemption of certain bonds (2022: 246m US dollar gain); • 17m US dollar gain related to the remeasurement of deferred considerations on prior year acquisitions (2022: (22)m US
dollar loss). The interest income stems from the following financial assets: Million US dollar 2023 2022 Cash and cash equivalents 537 235 Investments in debt securities held for trading 10 39 Other loans and receivables 19 21 Total 565 294 The
interest income on other loans and receivables includes the interest accrued on cash deposited as guarantees for certain legal proceedings pending their resolution. No interest income was recognized on impaired financial assets. AB InBev –
Annual Report 2023 102
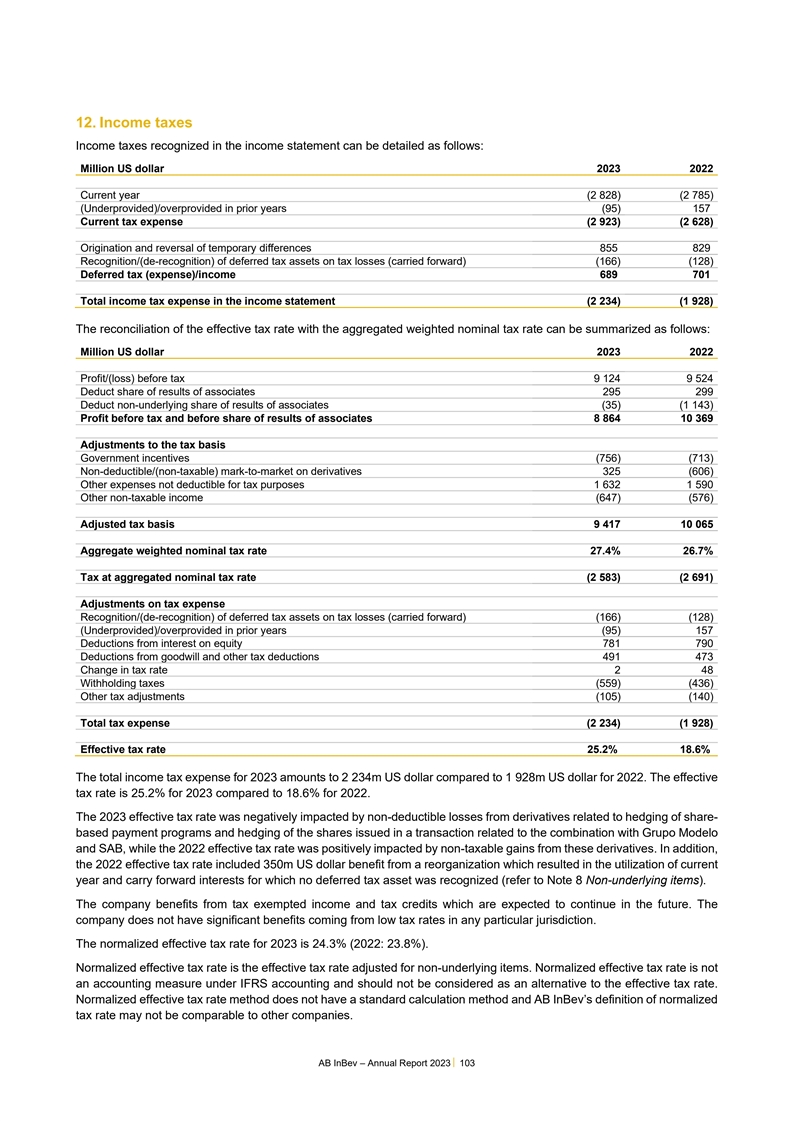
12. Income taxes Income taxes recognized in the income statement can
be detailed as follows: Million US dollar 2023 2022 Current year (2 828) (2 785) (Underprovided)/overprovided in prior years (95) 157 Current tax expense (2 923) (2 628) Origination and reversal of temporary differences 855 829
Recognition/(de-recognition) of deferred tax assets on tax losses (carried forward) (166) (128) Deferred tax (expense)/income 689 701 Total income tax expense in the income statement (2 234) (1 928) The reconciliation of the effective tax rate with
the aggregated weighted nominal tax rate can be summarized as follows: Million US dollar 2023 2022 . Profit/(loss) before tax 9 124 9 524 Deduct share of results of associates 295 299 Deduct non-underlying share of results of associates (35) (1 143)
Profit before tax and before share of results of associates 8 864 10 369 . Adjustments to the tax basis Government incentives (756) (713) Non-deductible/(non-taxable) mark-to-market on derivatives 325 (606) Other expenses not deductible for tax
purposes 1 632 1 590 Other non-taxable income (647) (576) . Adjusted tax basis 9 417 10 065 . Aggregate weighted nominal tax rate 27.4% 26.7% . Tax at aggregated nominal tax rate (2 583) (2 691) . Adjustments on tax expense
Recognition/(de-recognition) of deferred tax assets on tax losses (carried forward) (166) (128) (Underprovided)/overprovided in prior years (95) 157 Deductions from interest on equity 781 790 Deductions from goodwill and other tax deductions 491 473
Change in tax rate 2 48 Withholding taxes (559) (436) Other tax adjustments (105) (140) . Total tax expense (2 234) (1 928) . Effective tax rate 25.2% 18.6% The total income tax expense for 2023 amounts to 2 234m US dollar compared to 1 928m US
dollar for 2022. The effective tax rate is 25.2% for 2023 compared to 18.6% for 2022. The 2023 effective tax rate was negatively impacted by non-deductible losses from derivatives related to hedging of share- based payment programs and hedging of
the shares issued in a transaction related to the combination with Grupo Modelo and SAB, while the 2022 effective tax rate was positively impacted by non-taxable gains from these derivatives. In addition, the 2022 effective tax rate included 350m US
dollar benefit from a reorganization which resulted in the utilization of current year and carry forward interests for which no deferred tax asset was recognized (refer to Note 8 Non-underlying items). The company benefits from tax exempted income
and tax credits which are expected to continue in the future. The company does not have significant benefits coming from low tax rates in any particular jurisdiction. The normalized effective tax rate for 2023 is 24.3% (2022: 23.8%). Normalized
effective tax rate is the effective tax rate adjusted for non-underlying items. Normalized effective tax rate is not an accounting measure under IFRS accounting and should not be considered as an alternative to the effective tax rate. Normalized
effective tax rate method does not have a standard calculation method and AB InBev’s definition of normalized tax rate may not be comparable to other companies. AB InBev – Annual Report 2023 103
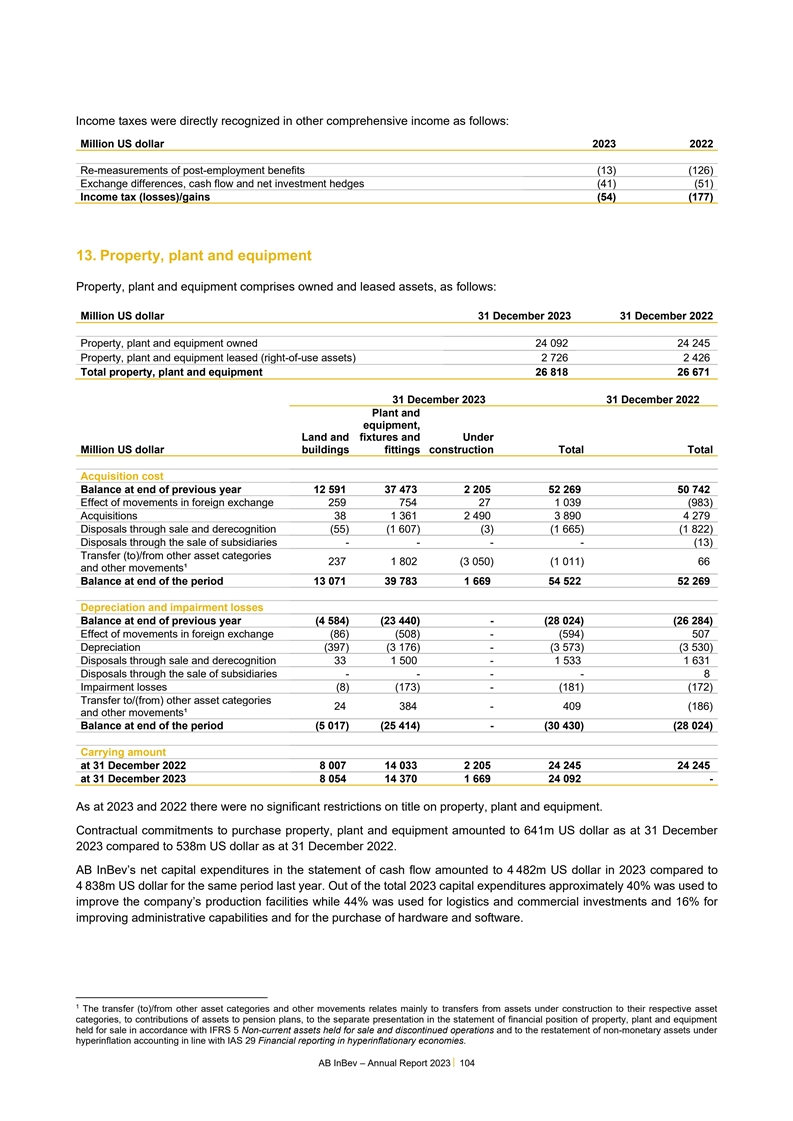
Income taxes were directly recognized in other comprehensive income as
follows: Million US dollar 2023 2022 Re-measurements of post-employment benefits (13) (126) Exchange differences, cash flow and net investment hedges (41) (51) Income tax (losses)/gains (54) (177) 13. Property, plant and equipment Property, plant
and equipment comprises owned and leased assets, as follows: Million US dollar 31 December 2023 31 December 2022 Property, plant and equipment owned 24 092 24 245 Property, plant and equipment leased (right-of-use assets) 2 726 2 426 Total property,
plant and equipment 26 818 26 671 31 December 2023 31 December 2022 Plant and equipment, Land and fixtures and Under Million US dollar buildings fittings construction Total Total Acquisition cost Balance at end of previous year 12 591 37 473 2 205
52 269 50 742 Effect of movements in foreign exchange 259 754 27 1 039 (983) Acquisitions 38 1 361 2 490 3 890 4 279 Disposals through sale and derecognition (55) (1 607) (3) (1 665) (1 822) Disposals through the sale of subsidiaries - - - - (13)
Transfer (to)/from other asset categories 237 1 802 (3 050) (1 011) 66 and other movements¹ Balance at end of the period 13 071 39 783 1 669 54 522 52 269 Depreciation and impairment losses Balance at end of previous year (4 584) (23 440) - (28
024) (26 284) Effect of movements in foreign exchange (86) (508) - (594) 507 Depreciation (397) (3 176) - (3 573) (3 530) Disposals through sale and derecognition 33 1 500 - 1 533 1 631 Disposals through the sale of subsidiaries - - - - 8 Impairment
losses (8) (173) - (181) (172) Transfer to/(from) other asset categories 24 384 - 409 (186) and other movements¹ Balance at end of the period (5 017) (25 414) - (30 430) (28 024) Carrying amount at 31 December 2022 8 007 14 033 2 205 24 245 24
245 at 31 December 2023 8 054 14 370 1 669 24 092 - 1 As at 2023 and 2022 there were no significant restrictions on title on property, plant and equipment. Contractual commitments to purchase property, plant and equipment amounted to 641m US dollar
as at 31 December 2023 compared to 538m US dollar as at 31 December 2022. AB InBev’s net capital expenditures in the statement of cash flow amounted to 4 482m US dollar in 2023 compared to 4 838m US dollar for the same period last year. Out of
the total 2023 capital expenditures approximately 40% was used to improve the company’s production facilities while 44% was used for logistics and commercial investments and 16% for improving administrative capabilities and for the purchase of
hardware and software. 1 The transfer (to)/from other asset categories and other movements relates mainly to transfers from assets under construction to their respective asset categories, to contributions of assets to pension plans, to the separate
presentation in the statement of financial position of property, plant and equipment held for sale in accordance with IFRS 5 Non-current assets held for sale and discontinued operations and to the restatement of non-monetary assets under
hyperinflation accounting in line with IAS 29 Financial reporting in hyperinflationary economies. AB InBev – Annual Report 2023 104
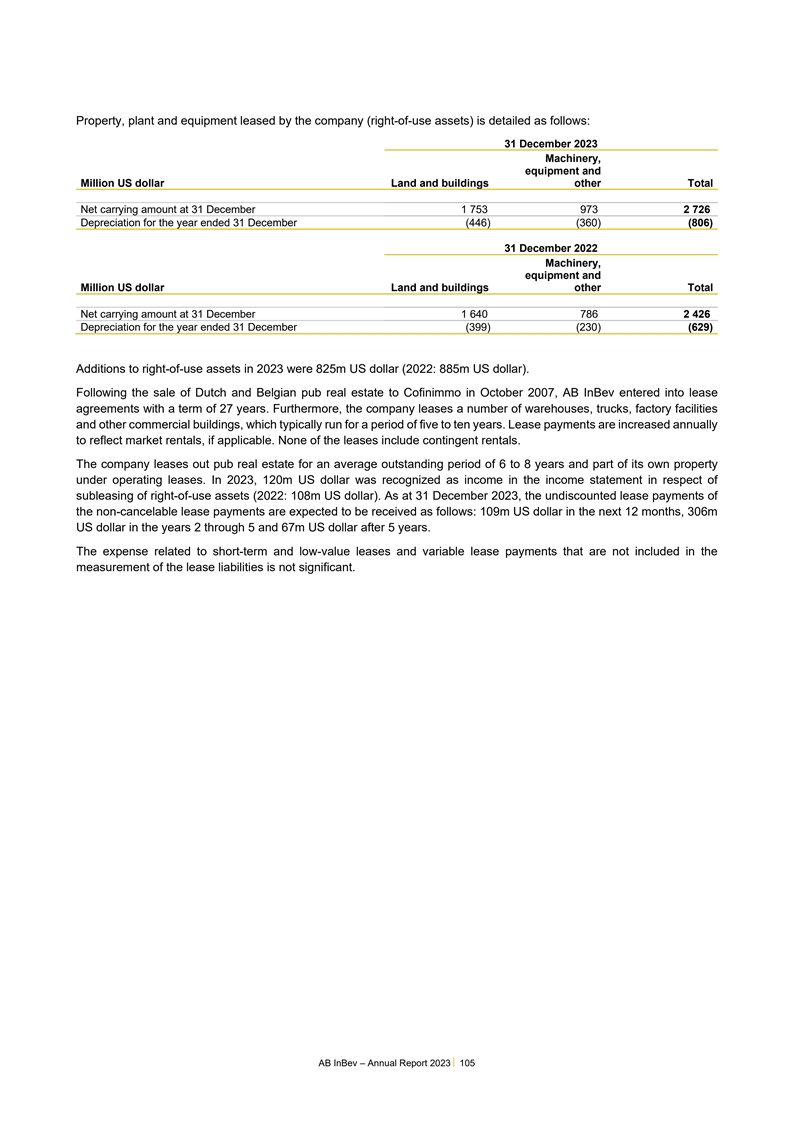
Property, plant and equipment leased by the company (right-of-use
assets) is detailed as follows: 31 December 2023 Machinery, equipment and Million US dollar Land and buildings other Total Net carrying amount at 31 December 1 753 973 2 726 Depreciation for the year ended 31 December (446) (360) (806) 31 December
2022 Machinery, equipment and Million US dollar Land and buildings other Total Net carrying amount at 31 December 1 640 786 2 426 Depreciation for the year ended 31 December (399) (230) (629) Additions to right-of-use assets in 2023 were 825m US
dollar (2022: 885m US dollar). Following the sale of Dutch and Belgian pub real estate to Cofinimmo in October 2007, AB InBev entered into lease agreements with a term of 27 years. Furthermore, the company leases a number of warehouses, trucks,
factory facilities and other commercial buildings, which typically run for a period of five to ten years. Lease payments are increased annually to reflect market rentals, if applicable. None of the leases include contingent rentals. The company
leases out pub real estate for an average outstanding period of 6 to 8 years and part of its own property under operating leases. In 2023, 120m US dollar was recognized as income in the income statement in respect of subleasing of right-of-use
assets (2022: 108m US dollar). As at 31 December 2023, the undiscounted lease payments of the non-cancelable lease payments are expected to be received as follows: 109m US dollar in the next 12 months, 306m US dollar in the years 2 through 5 and 67m
US dollar after 5 years. The expense related to short-term and low-value leases and variable lease payments that are not included in the measurement of the lease liabilities is not significant. AB InBev – Annual Report 2023 105
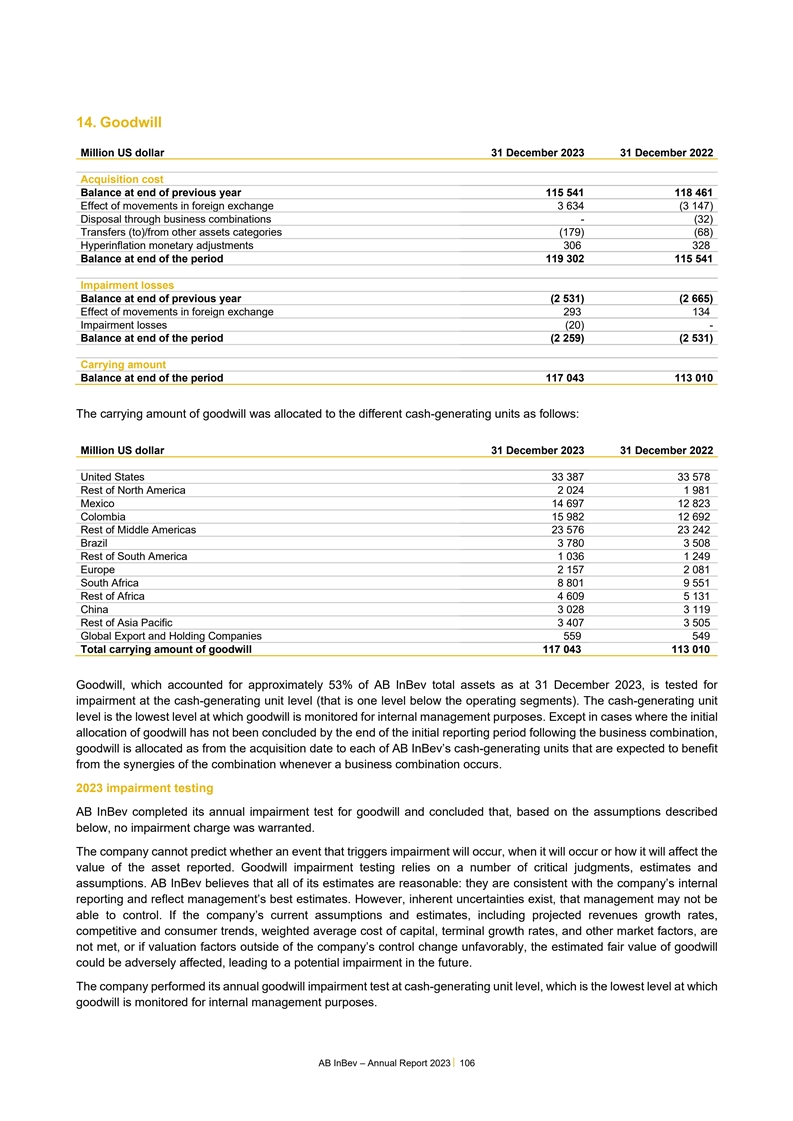
14. Goodwill Million US dollar 31 December 2023 31 December 2022
Acquisition cost Balance at end of previous year 115 541 118 461 Effect of movements in foreign exchange 3 634 (3 147) Disposal through business combinations - (32) Transfers (to)/from other assets categories (179) (68) Hyperinflation monetary
adjustments 306 328 Balance at end of the period 119 302 115 541 Impairment losses Balance at end of previous year (2 531) (2 665) Effect of movements in foreign exchange 293 134 Impairment losses (20) - Balance at end of the period (2 259) (2 531)
Carrying amount Balance at end of the period 117 043 113 010 The carrying amount of goodwill was allocated to the different cash-generating units as follows: Million US dollar 31 December 2023 31 December 2022 United States 33 387 33 578 Rest of
North America 2 024 1 981 Mexico 14 697 12 823 Colombia 15 982 12 692 Rest of Middle Americas 23 576 23 242 Brazil 3 780 3 508 Rest of South America 1 036 1 249 Europe 2 157 2 081 South Africa 8 801 9 551 Rest of Africa 4 609 5 131 China 3 028 3 119
Rest of Asia Pacific 3 407 3 505 Global Export and Holding Companies 559 549 Total carrying amount of goodwill 117 043 113 010 Goodwill, which accounted for approximately 53% of AB InBev total assets as at 31 December 2023, is tested for impairment
at the cash-generating unit level (that is one level below the operating segments). The cash-generating unit level is the lowest level at which goodwill is monitored for internal management purposes. Except in cases where the initial allocation of
goodwill has not been concluded by the end of the initial reporting period following the business combination, goodwill is allocated as from the acquisition date to each of AB InBev’s cash-generating units that are expected to benefit from the
synergies of the combination whenever a business combination occurs. 2023 impairment testing AB InBev completed its annual impairment test for goodwill and concluded that, based on the assumptions described below, no impairment charge was warranted.
The company cannot predict whether an event that triggers impairment will occur, when it will occur or how it will affect the value of the asset reported. Goodwill impairment testing relies on a number of critical judgments, estimates and
assumptions. AB InBev believes that all of its estimates are reasonable: they are consistent with the company’s internal reporting and reflect management’s best estimates. However, inherent uncertainties exist, that management may not be
able to control. If the company’s current assumptions and estimates, including projected revenues growth rates, competitive and consumer trends, weighted average cost of capital, terminal growth rates, and other market factors, are not met, or
if valuation factors outside of the company’s control change unfavorably, the estimated fair value of goodwill could be adversely affected, leading to a potential impairment in the future. The company performed its annual goodwill impairment
test at cash-generating unit level, which is the lowest level at which goodwill is monitored for internal management purposes. AB InBev – Annual Report 2023 106
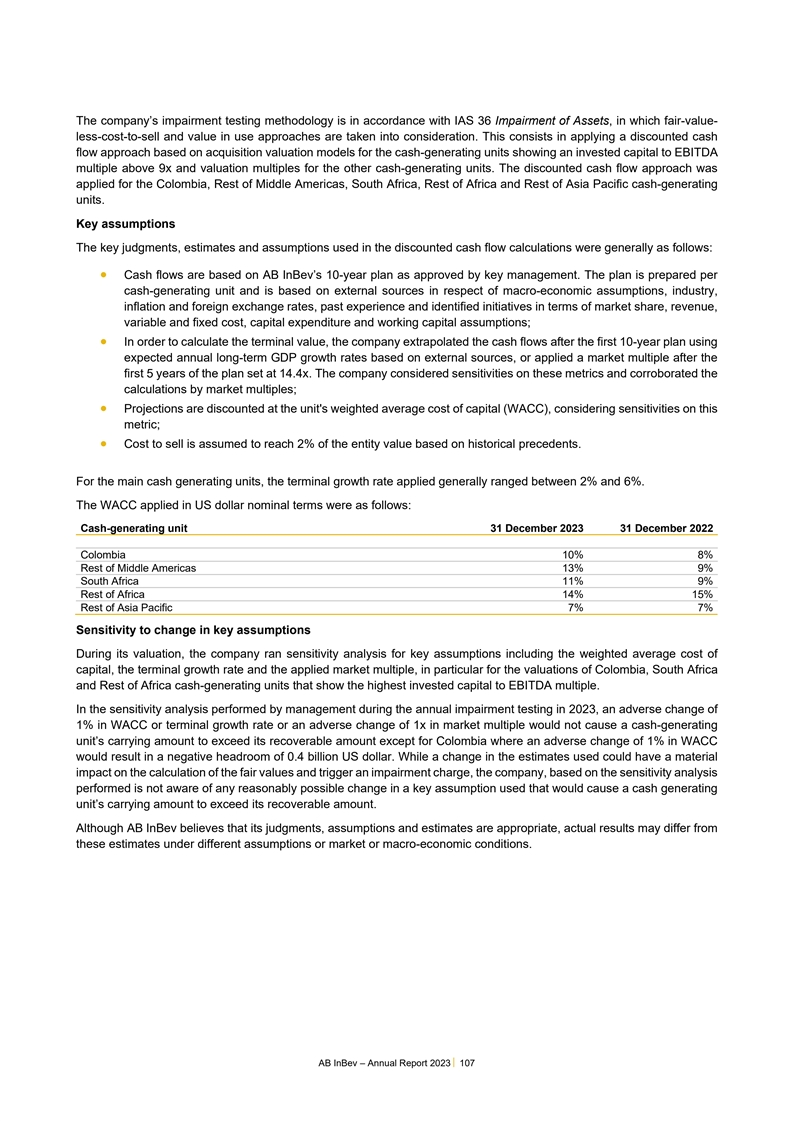
The company’s impairment testing methodology is in accordance
with IAS 36 Impairment of Assets, in which fair-value- less-cost-to-sell and value in use approaches are taken into consideration. This consists in applying a discounted cash flow approach based on acquisition valuation models for the
cash-generating units showing an invested capital to EBITDA multiple above 9x and valuation multiples for the other cash-generating units. The discounted cash flow approach was applied for the Colombia, Rest of Middle Americas, South Africa, Rest of
Africa and Rest of Asia Pacific cash-generating units. Key assumptions The key judgments, estimates and assumptions used in the discounted cash flow calculations were generally as follows: • Cash flows are based on AB InBev’s 10-year
plan as approved by key management. The plan is prepared per cash-generating unit and is based on external sources in respect of macro-economic assumptions, industry, inflation and foreign exchange rates, past experience and identified initiatives
in terms of market share, revenue, variable and fixed cost, capital expenditure and working capital assumptions; • In order to calculate the terminal value, the company extrapolated the cash flows after the first 10-year plan using expected
annual long-term GDP growth rates based on external sources, or applied a market multiple after the first 5 years of the plan set at 14.4x. The company considered sensitivities on these metrics and corroborated the calculations by market multiples;
• Projections are discounted at the unit's weighted average cost of capital (WACC), considering sensitivities on this metric; • Cost to sell is assumed to reach 2% of the entity value based on historical precedents. For the main cash
generating units, the terminal growth rate applied generally ranged between 2% and 6%. The WACC applied in US dollar nominal terms were as follows: Cash-generating unit 31 December 2023 31 December 2022 Colombia 10% 8% Rest of Middle Americas 13% 9%
South Africa 11% 9% Rest of Africa 14% 15% Rest of Asia Pacific 7% 7% Sensitivity to change in key assumptions During its valuation, the company ran sensitivity analysis for key assumptions including the weighted average cost of capital, the
terminal growth rate and the applied market multiple, in particular for the valuations of Colombia, South Africa and Rest of Africa cash-generating units that show the highest invested capital to EBITDA multiple. In the sensitivity analysis
performed by management during the annual impairment testing in 2023, an adverse change of 1% in WACC or terminal growth rate or an adverse change of 1x in market multiple would not cause a cash-generating unit’s carrying amount to exceed its
recoverable amount except for Colombia where an adverse change of 1% in WACC would result in a negative headroom of 0.4 billion US dollar. While a change in the estimates used could have a material impact on the calculation of the fair values and
trigger an impairment charge, the company, based on the sensitivity analysis performed is not aware of any reasonably possible change in a key assumption used that would cause a cash generating unit’s carrying amount to exceed its recoverable
amount. Although AB InBev believes that its judgments, assumptions and estimates are appropriate, actual results may differ from these estimates under different assumptions or market or macro-economic conditions. AB InBev – Annual Report 2023
107
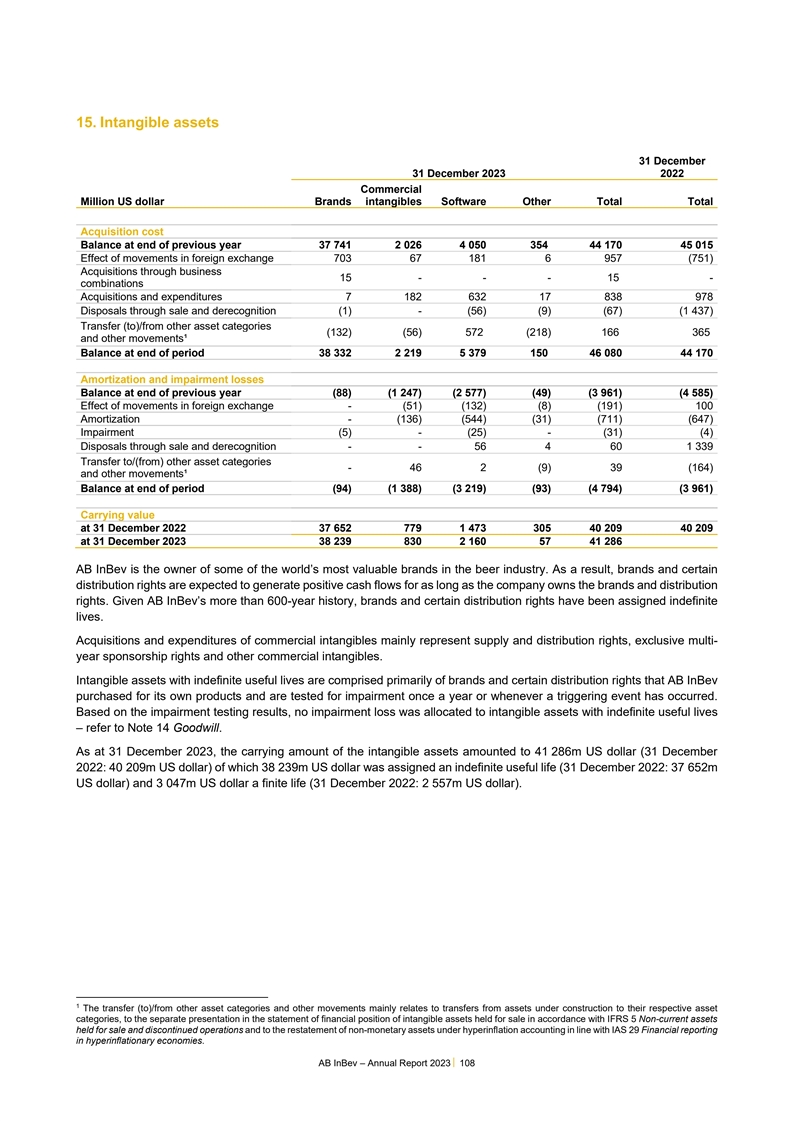
15. Intangible assets 31 December 31 December 2023 2022 Commercial
Million US dollar Brands intangibles Software Other Total Total Acquisition cost Balance at end of previous year 37 741 2 026 4 050 354 44 170 45 015 Effect of movements in foreign exchange 703 67 181 6 957 (751) Acquisitions through business 15 - -
- 15 - combinations Acquisitions and expenditures 7 182 632 17 838 978 Disposals through sale and derecognition (1) - (56) (9) (67) (1 437) Transfer (to)/from other asset categories (132) (56) 572 (218) 166 365 and other movements¹ Balance at
end of period 38 332 2 219 5 379 150 46 080 44 170 Amortization and impairment losses Balance at end of previous year (88) (1 247) (2 577) (49) (3 961) (4 585) Effect of movements in foreign exchange - (51) (132) (8) (191) 100 Amortization - (136)
(544) (31) (711) (647) Impairment (5) - (25) - (31) (4) Disposals through sale and derecognition - - 56 4 60 1 339 Transfer to/(from) other asset categories - 46 2 (9) 39 (164) and other movements¹ Balance at end of period (94) (1 388) (3 219)
(93) (4 794) (3 961) Carrying value at 31 December 2022 37 652 779 1 473 305 40 209 40 209 at 31 December 2023 38 239 830 2 160 57 41 286 AB InBev is the owner of some of the world’s most valuable brands in the beer industry. As a result,
brands and certain distribution rights are expected to generate positive cash flows for as long as the company owns the brands and distribution rights. Given AB InBev’s more than 600-year history, brands and certain distribution rights have
been assigned indefinite lives. Acquisitions and expenditures of commercial intangibles mainly represent supply and distribution rights, exclusive multi- 1 year sponsorship rights and other commercial intangibles. Intangible assets with indefinite
useful lives are comprised primarily of brands and certain distribution rights that AB InBev purchased for its own products and are tested for impairment once a year or whenever a triggering event has occurred. Based on the impairment testing
results, no impairment loss was allocated to intangible assets with indefinite useful lives – refer to Note 14 Goodwill. As at 31 December 2023, the carrying amount of the intangible assets amounted to 41 286m US dollar (31 December 2022: 40
209m US dollar) of which 38 239m US dollar was assigned an indefinite useful life (31 December 2022: 37 652m US dollar) and 3 047m US dollar a finite life (31 December 2022: 2 557m US dollar). 1 The transfer (to)/from other asset categories and
other movements mainly relates to transfers from assets under construction to their respective asset categories, to the separate presentation in the statement of financial position of intangible assets held for sale in accordance with IFRS 5
Non-current assets held for sale and discontinued operations and to the restatement of non-monetary assets under hyperinflation accounting in line with IAS 29 Financial reporting in hyperinflationary economies. AB InBev – Annual Report 2023
108
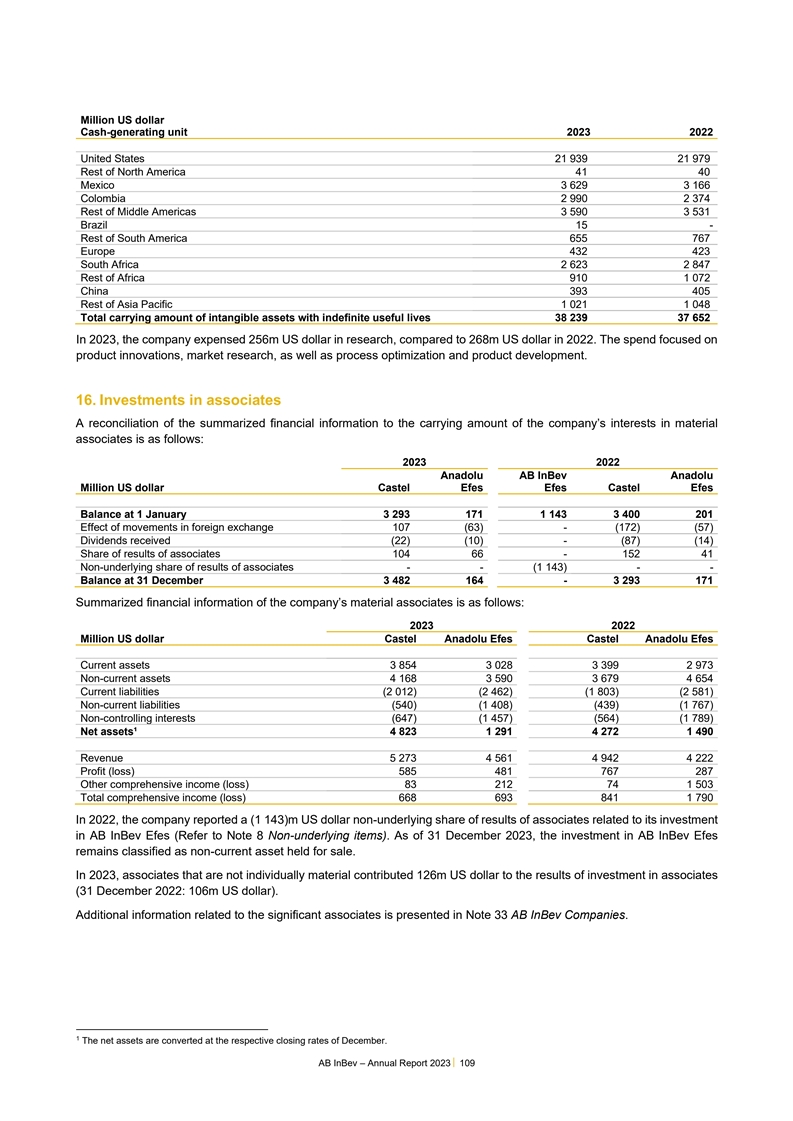
Million US dollar Cash-generating unit 2023 2022 United States 21 939
21 979 Rest of North America 41 40 Mexico 3 629 3 166 Colombia 2 990 2 374 Rest of Middle Americas 3 590 3 531 Brazil 15 - Rest of South America 655 767 Europe 432 423 South Africa 2 623 2 847 Rest of Africa 910 1 072 China 393 405 Rest of Asia
Pacific 1 021 1 048 Total carrying amount of intangible assets with indefinite useful lives 38 239 37 652 In 2023, the company expensed 256m US dollar in research, compared to 268m US dollar in 2022. The spend focused on product innovations, market
research, as well as process optimization and product development. 16. Investments in associates A reconciliation of the summarized financial information to the carrying amount of the company’s interests in material associates is as follows:
2023 2022 Anadolu AB InBev Anadolu Million US dollar Castel Efes Efes Castel Efes . Balance at 1 January 3 293 171 1 143 3 400 201 Effect of movements in foreign exchange 107 (63) - (172) (57) Dividends received (22) (10) - (87) (14) Share of
results of associates 104 66 - 152 41 Non-underlying share of results of associates - - (1 143) - - Balance at 31 December 3 482 164 - 3 293 171 Summarized financial information of the company’s material associates is as follows: 2023 2022
Million US dollar Castel Anadolu Efes Castel Anadolu Efes . Current assets 3 854 3 028 3 399 2 973 Non-current assets 4 168 3 590 3 679 4 654 Current liabilities (2 012) (2 462) (1 803) (2 581) Non-current liabilities (540) (1 408) (439) (1 767)
Non-controlling interests (647) (1 457) (564) (1 789) Net assets¹ 4 823 1 291 4 272 1 490 . Revenue 5 273 4 561 4 942 4 222 Profit (loss) 585 481 767 287 Other comprehensive income (loss) 83 212 74 1 503 Total comprehensive income (loss) 668
693 841 1 790 In 2022, the company reported a (1 143)m US dollar non-underlying share of results of associates related to its investment in AB InBev Efes (Refer to Note 8 Non-underlying items). As of 31 December 2023, the investment in AB InBev Efes
remains classified as non-current asset held for sale. In 2023, associates that are not individually material contributed 126m US dollar to the results of investment in associates 1 (31 December 2022: 106m US dollar). Additional information related
to the significant associates is presented in Note 33 AB InBev Companies. 1 The net assets are converted at the respective closing rates of December. AB InBev – Annual Report 2023 109
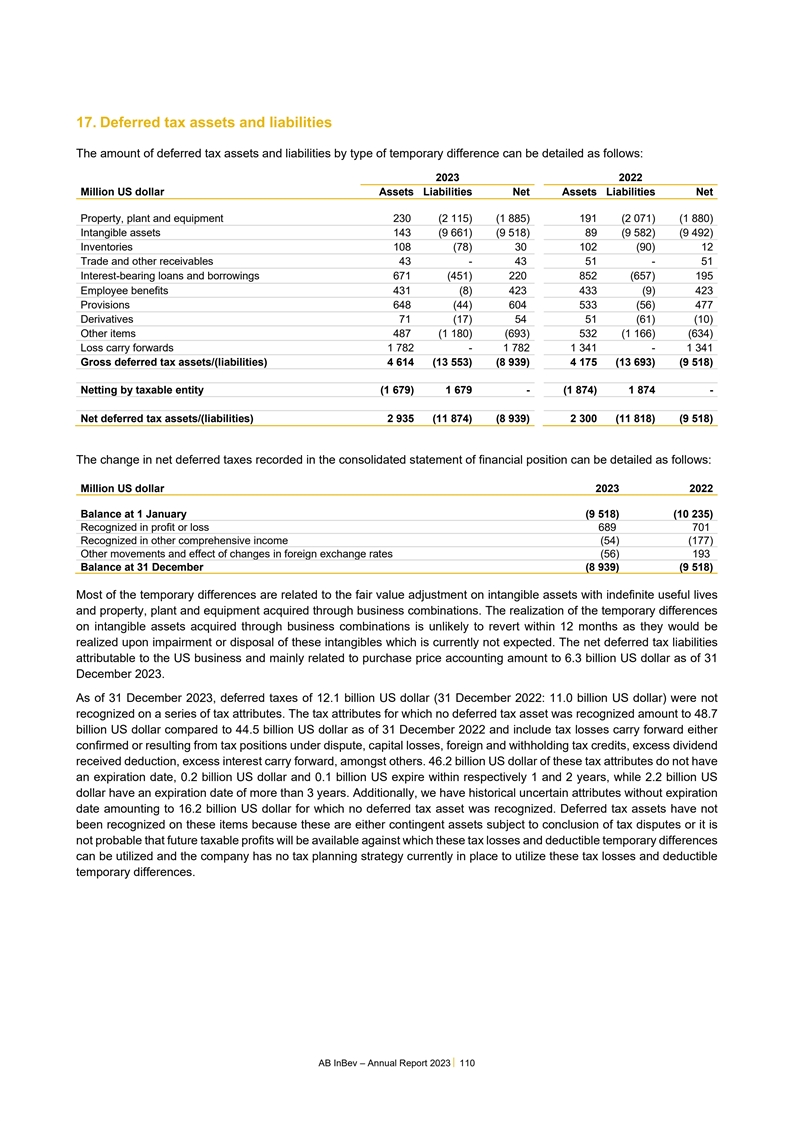
17. Deferred tax assets and liabilities The amount of deferred tax
assets and liabilities by type of temporary difference can be detailed as follows: 2023 2022 Million US dollar Assets Liabilities Net Assets Liabilities Net Property, plant and equipment 230 (2 115) (1 885) 191 (2 071) (1 880) Intangible assets 143
(9 661) (9 518) 89 (9 582) (9 492) Inventories 108 (78) 30 102 (90) 12 Trade and other receivables 43 - 43 51 - 51 Interest-bearing loans and borrowings 671 (451) 220 852 (657) 195 Employee benefits 431 (8) 423 433 (9) 423 Provisions 648 (44) 604
533 (56) 477 Derivatives 71 (17) 54 51 (61) (10) Other items 487 (1 180) (693) 532 (1 166) (634) Loss carry forwards 1 782 - 1 782 1 341 - 1 341 Gross deferred tax assets/(liabilities) 4 614 (13 553) (8 939) 4 175 (13 693) (9 518) Netting by taxable
entity (1 679) 1 679 - (1 874) 1 874 - Net deferred tax assets/(liabilities) 2 935 (11 874) (8 939) 2 300 (11 818) (9 518) The change in net deferred taxes recorded in the consolidated statement of financial position can be detailed as follows:
Million US dollar 2023 2022 Balance at 1 January (9 518) (10 235) Recognized in profit or loss 689 701 Recognized in other comprehensive income (54) (177) Other movements and effect of changes in foreign exchange rates (56) 193 Balance at 31
December (8 939) (9 518) Most of the temporary differences are related to the fair value adjustment on intangible assets with indefinite useful lives and property, plant and equipment acquired through business combinations. The realization of the
temporary differences on intangible assets acquired through business combinations is unlikely to revert within 12 months as they would be realized upon impairment or disposal of these intangibles which is currently not expected. The net deferred tax
liabilities attributable to the US business and mainly related to purchase price accounting amount to 6.3 billion US dollar as of 31 December 2023. As of 31 December 2023, deferred taxes of 12.1 billion US dollar (31 December 2022: 11.0 billion US
dollar) were not recognized on a series of tax attributes. The tax attributes for which no deferred tax asset was recognized amount to 48.7 billion US dollar compared to 44.5 billion US dollar as of 31 December 2022 and include tax losses carry
forward either confirmed or resulting from tax positions under dispute, capital losses, foreign and withholding tax credits, excess dividend received deduction, excess interest carry forward, amongst others. 46.2 billion US dollar of these tax
attributes do not have an expiration date, 0.2 billion US dollar and 0.1 billion US expire within respectively 1 and 2 years, while 2.2 billion US dollar have an expiration date of more than 3 years. Additionally, we have historical uncertain
attributes without expiration date amounting to 16.2 billion US dollar for which no deferred tax asset was recognized. Deferred tax assets have not been recognized on these items because these are either contingent assets subject to conclusion of
tax disputes or it is not probable that future taxable profits will be available against which these tax losses and deductible temporary differences can be utilized and the company has no tax planning strategy currently in place to utilize these tax
losses and deductible temporary differences. AB InBev – Annual Report 2023 110
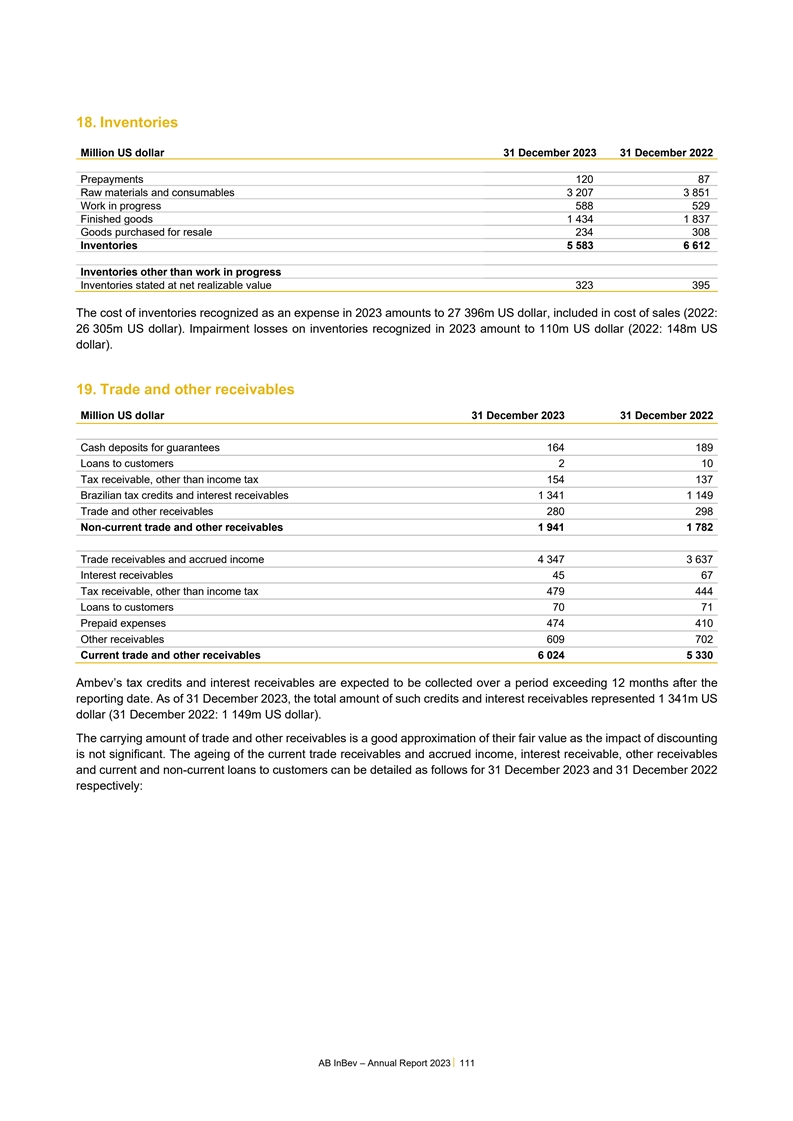
18. Inventories Million US dollar 31 December 2023 31 December 2022
Prepayments 120 87 Raw materials and consumables 3 207 3 851 Work in progress 588 529 Finished goods 1 434 1 837 Goods purchased for resale 234 308 Inventories 5 583 6 612 Inventories other than work in progress Inventories stated at net realizable
value 323 395 The cost of inventories recognized as an expense in 2023 amounts to 27 396m US dollar, included in cost of sales (2022: 26 305m US dollar). Impairment losses on inventories recognized in 2023 amount to 110m US dollar (2022: 148m US
dollar). 19. Trade and other receivables Million US dollar 31 December 2023 31 December 2022 Cash deposits for guarantees 164 189 Loans to customers 2 10 Tax receivable, other than income tax 154 137 Brazilian tax credits and interest receivables 1
341 1 149 Trade and other receivables 280 298 Non-current trade and other receivables 1 941 1 782 Trade receivables and accrued income 4 347 3 637 Interest receivables 45 67 Tax receivable, other than income tax 479 444 Loans to customers 70 71
Prepaid expenses 474 410 Other receivables 609 702 Current trade and other receivables 6 024 5 330 Ambev’s tax credits and interest receivables are expected to be collected over a period exceeding 12 months after the reporting date. As of 31
December 2023, the total amount of such credits and interest receivables represented 1 341m US dollar (31 December 2022: 1 149m US dollar). The carrying amount of trade and other receivables is a good approximation of their fair value as the impact
of discounting is not significant. The ageing of the current trade receivables and accrued income, interest receivable, other receivables and current and non-current loans to customers can be detailed as follows for 31 December 2023 and 31 December
2022 respectively: AB InBev – Annual Report 2023 111
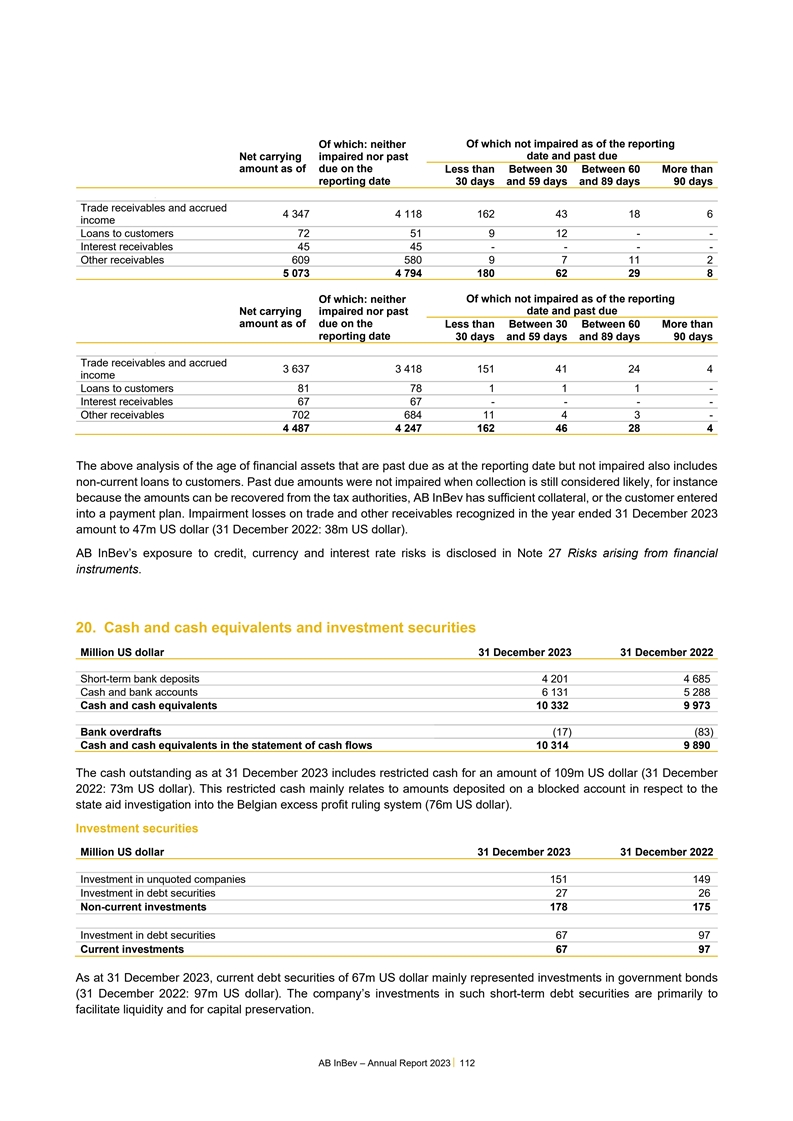
Of which: neither Of which not impaired as of the reporting date and
past due Net carrying impaired nor past amount as of due on the Less than Between 30 Between 60 More than reporting date 30 days and 59 days and 89 days 90 days . Trade receivables and accrued 4 347 4 118 162 43 18 6 income Loans to customers 72 51
9 12 - - Interest receivables 45 45 - - - - Other receivables 609 580 9 7 11 2 5 073 4 794 180 62 29 8 Of which not impaired as of the reporting Of which: neither date and past due Net carrying impaired nor past amount as of due on the Less than
Between 30 Between 60 More than reporting date 30 days and 59 days and 89 days 90 days . Trade receivables and accrued 3 637 3 418 151 41 24 4 income Loans to customers 81 78 1 1 1 - Interest receivables 67 67 - - - - Other receivables 702 684 11 4
3 - 4 487 4 247 162 46 28 4 The above analysis of the age of financial assets that are past due as at the reporting date but not impaired also includes non-current loans to customers. Past due amounts were not impaired when collection is still
considered likely, for instance because the amounts can be recovered from the tax authorities, AB InBev has sufficient collateral, or the customer entered into a payment plan. Impairment losses on trade and other receivables recognized in the year
ended 31 December 2023 amount to 47m US dollar (31 December 2022: 38m US dollar). AB InBev’s exposure to credit, currency and interest rate risks is disclosed in Note 27 Risks arising from financial instruments. 20. Cash and cash equivalents
and investment securities Million US dollar 31 December 2023 31 December 2022 Short-term bank deposits 4 201 4 685 Cash and bank accounts 6 131 5 288 Cash and cash equivalents 10 332 9 973 . Bank overdrafts (17) (83) Cash and cash equivalents in the
statement of cash flows 10 314 9 890 The cash outstanding as at 31 December 2023 includes restricted cash for an amount of 109m US dollar (31 December 2022: 73m US dollar). This restricted cash mainly relates to amounts deposited on a blocked
account in respect to the state aid investigation into the Belgian excess profit ruling system (76m US dollar). Investment securities Million US dollar 31 December 2023 31 December 2022 Investment in unquoted companies 151 149 Investment in debt
securities 27 26 Non-current investments 178 175 Investment in debt securities 67 97 Current investments 67 97 As at 31 December 2023, current debt securities of 67m US dollar mainly represented investments in government bonds (31 December 2022: 97m
US dollar). The company’s investments in such short-term debt securities are primarily to facilitate liquidity and for capital preservation. AB InBev – Annual Report 2023 112
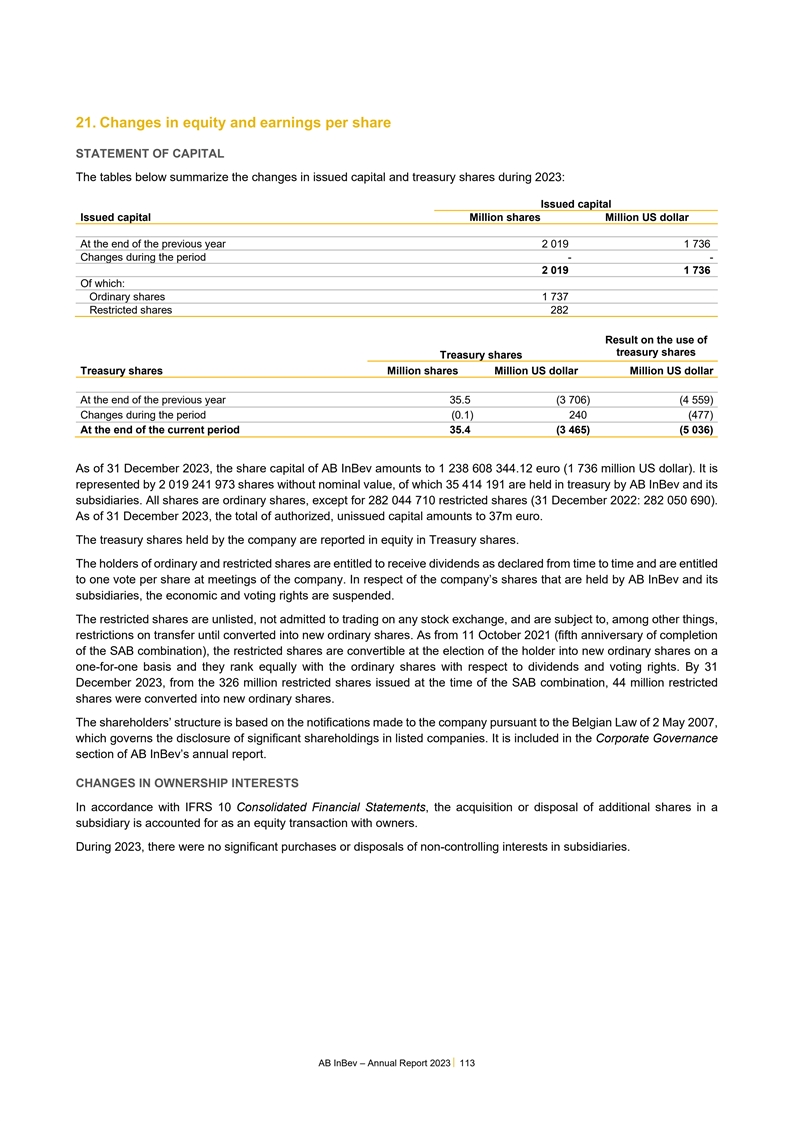
21. Changes in equity and earnings per share STATEMENT OF CAPITAL The
tables below summarize the changes in issued capital and treasury shares during 2023: Issued capital Issued capital Million shares Million US dollar At the end of the previous year 2 019 1 736 Changes during the period - - 2 019 1 736 Of which:
Ordinary shares 1 737 Restricted shares 282 Result on the use of treasury shares Treasury shares Treasury shares Million shares Million US dollar Million US dollar At the end of the previous year 35.5 (3 706) (4 559) Changes during the period (0.1)
240 (477) At the end of the current period 35.4 (3 465) (5 036) As of 31 December 2023, the share capital of AB InBev amounts to 1 238 608 344.12 euro (1 736 million US dollar). It is represented by 2 019 241 973 shares without nominal value, of
which 35 414 191 are held in treasury by AB InBev and its subsidiaries. All shares are ordinary shares, except for 282 044 710 restricted shares (31 December 2022: 282 050 690). As of 31 December 2023, the total of authorized, unissued capital
amounts to 37m euro. The treasury shares held by the company are reported in equity in Treasury shares. The holders of ordinary and restricted shares are entitled to receive dividends as declared from time to time and are entitled to one vote per
share at meetings of the company. In respect of the company’s shares that are held by AB InBev and its subsidiaries, the economic and voting rights are suspended. The restricted shares are unlisted, not admitted to trading on any stock
exchange, and are subject to, among other things, restrictions on transfer until converted into new ordinary shares. As from 11 October 2021 (fifth anniversary of completion of the SAB combination), the restricted shares are convertible at the
election of the holder into new ordinary shares on a one-for-one basis and they rank equally with the ordinary shares with respect to dividends and voting rights. By 31 December 2023, from the 326 million restricted shares issued at the time of the
SAB combination, 44 million restricted shares were converted into new ordinary shares. The shareholders’ structure is based on the notifications made to the company pursuant to the Belgian Law of 2 May 2007, which governs the disclosure of
significant shareholdings in listed companies. It is included in the Corporate Governance section of AB InBev’s annual report. CHANGES IN OWNERSHIP INTERESTS In accordance with IFRS 10 Consolidated Financial Statements, the acquisition or
disposal of additional shares in a subsidiary is accounted for as an equity transaction with owners. During 2023, there were no significant purchases or disposals of non-controlling interests in subsidiaries. AB InBev – Annual Report 2023
113
ACQUISITIONS AND DISPOSALS OF OWN SHARES (REPORT ACCORDING TO ARTICLE
7:220 OF THE BELGIAN COMPANIES CODE OF COMPANIES AND ASSOCIATIONS) AND BORROWINGS OF OWN SHARES– PURCHASE OF OWN SHARES During 2023, the company has acquired treasury shares in accordance with article 7:215 of the Belgian Code of Companies and
Associations (former article 620 of the Belgian Companies Code) and has proceeded with the following disposals of its own shares. Treasury shares Using the powers granted at the shareholders meeting of 28 April 2021, the Board of Directors approved
a share buyback program for an amount of 1 billion US dollar. As of 31 December 2023, AB InBev bought back 5.813.148 shares for a total amount of 362 million US dollar, corresponding to 0,29% of the total shares outstanding. The shares acquired were
mainly used to fulfill the company’s various share delivery commitments under the stock ownership plan. As of 31 December 2023, the group owned 35 414 191 own shares of which 34 775 830 were held directly by AB InBev. The par value of the
share is 0.61 euro. The treasury shares that the company still owned at the end of 2023 represented 26 508 604 US dollar (21 602 657 euro) of the subscribed capital. Borrowed shares In order to fulfill AB InBev’s commitments under various
outstanding share-based compensation plans, during the course of 2023, the company had stock lending arrangements in place for up to 30 million shares, which were fully used to fulfill share-based compensation plan commitments. The company shall pay
any dividend equivalent after tax in respect of such borrowed shares. This payment will be reported through equity as dividend. DIVIDENDS On 28 February 2024, a dividend of 0.82 euro per share or 1 645m euro was proposed by the Board of Directors
and will be subject to approval at the shareholders’ meeting on 24 April 2024. On 26 April 2023, a dividend of 0.75 euro per share or 1 510m euro was approved at the shareholders’ meeting. The dividend was paid out as of 5 May 2023. On
27 April 2022, a dividend of 0.50 euro per share or 1 004m euro was approved at the shareholders’ meeting. The dividend was paid out as of 5 May 2022. TRANSLATION RESERVES The translation reserves comprise all foreign currency exchange
differences arising from the translation of the financial statements of foreign operations. The translation reserves also comprise the portion of the gain or loss on the foreign currency liabilities and on the derivative financial instruments
determined to be effective net investment. HEDGING RESERVES The hedging reserves comprise the effective portion of the cumulative net change in the fair value of cash flow hedges to the extent that the hedged risk has not yet impacted profit or
loss. TRANSFERS FROM SUBSIDIARIES The amount of dividends payable to AB InBev by its operating subsidiaries is subject to, among other restrictions, general limitations imposed by the corporate laws, capital transfer restrictions and exchange
control restrictions of the respective jurisdictions where those subsidiaries are organized and operate. Capital transfer restrictions are also common in certain emerging market countries and may affect AB InBev’s flexibility in implementing a
capital structure it believes to be efficient. As of 31 December 2023, the restrictions above mentioned were not deemed significant on the company’s ability to access or use the assets or settle the liabilities of its operating subsidiaries.
Dividends paid to AB InBev by certain of its subsidiaries are also subject to withholding taxes. Withholding taxes, if applicable, generally do not exceed 15%. AB InBev – Annual Report 2023 114
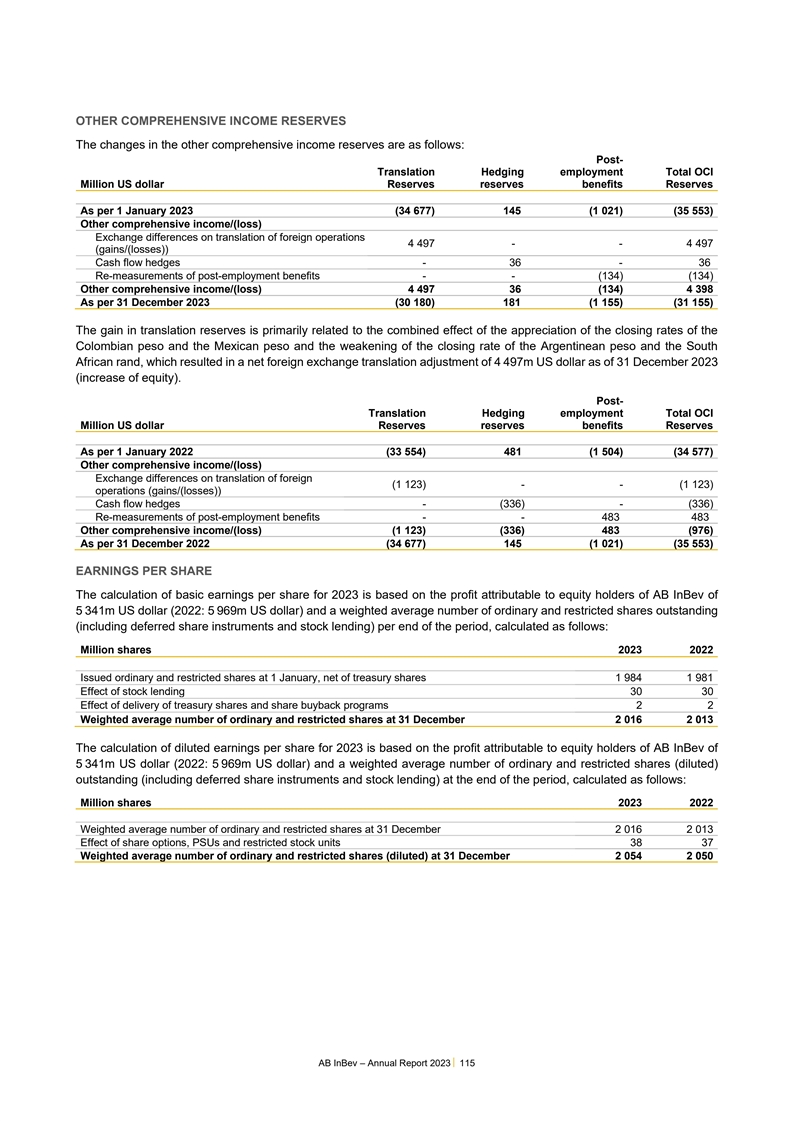
OTHER COMPREHENSIVE INCOME RESERVES The changes in the other
comprehensive income reserves are as follows: Post- Translation Hedging employment Total OCI Million US dollar Reserves reserves benefits Reserves . As per 1 January 2023 (34 677) 145 (1 021) (35 553) Other comprehensive income/(loss) Exchange
differences on translation of foreign operations 4 497 - - 4 497 (gains/(losses)) Cash flow hedges - 36 - 36 Re-measurements of post-employment benefits - - (134) (134) Other comprehensive income/(loss) 4 497 36 (134) 4 398 As per 31 December 2023
(30 180) 181 (1 155) (31 155) The gain in translation reserves is primarily related to the combined effect of the appreciation of the closing rates of the Colombian peso and the Mexican peso and the weakening of the closing rate of the Argentinean
peso and the South African rand, which resulted in a net foreign exchange translation adjustment of 4 497m US dollar as of 31 December 2023 (increase of equity). Post- Translation Hedging employment Total OCI Million US dollar Reserves reserves
benefits Reserves . As per 1 January 2022 (33 554) 481 (1 504) (34 577) Other comprehensive income/(loss) Exchange differences on translation of foreign (1 123) - - (1 123) operations (gains/(losses)) Cash flow hedges - (336) - (336) Re-measurements
of post-employment benefits - - 483 483 Other comprehensive income/(loss) (1 123) (336) 483 (976) As per 31 December 2022 (34 677) 145 (1 021) (35 553) EARNINGS PER SHARE The calculation of basic earnings per share for 2023 is based on the profit
attributable to equity holders of AB InBev of 5 341m US dollar (2022: 5 969m US dollar) and a weighted average number of ordinary and restricted shares outstanding (including deferred share instruments and stock lending) per end of the period,
calculated as follows: Million shares 2023 2022 . Issued ordinary and restricted shares at 1 January, net of treasury shares 1 984 1 981 Effect of stock lending 30 30 Effect of delivery of treasury shares and share buyback programs 2 2 Weighted
average number of ordinary and restricted shares at 31 December 2 016 2 013 The calculation of diluted earnings per share for 2023 is based on the profit attributable to equity holders of AB InBev of 5 341m US dollar (2022: 5 969m US dollar) and a
weighted average number of ordinary and restricted shares (diluted) outstanding (including deferred share instruments and stock lending) at the end of the period, calculated as follows: Million shares 2023 2022 . Weighted average number of ordinary
and restricted shares at 31 December 2 016 2 013 Effect of share options, PSUs and restricted stock units 38 37 Weighted average number of ordinary and restricted shares (diluted) at 31 December 2 054 2 050 AB InBev – Annual Report 2023
115
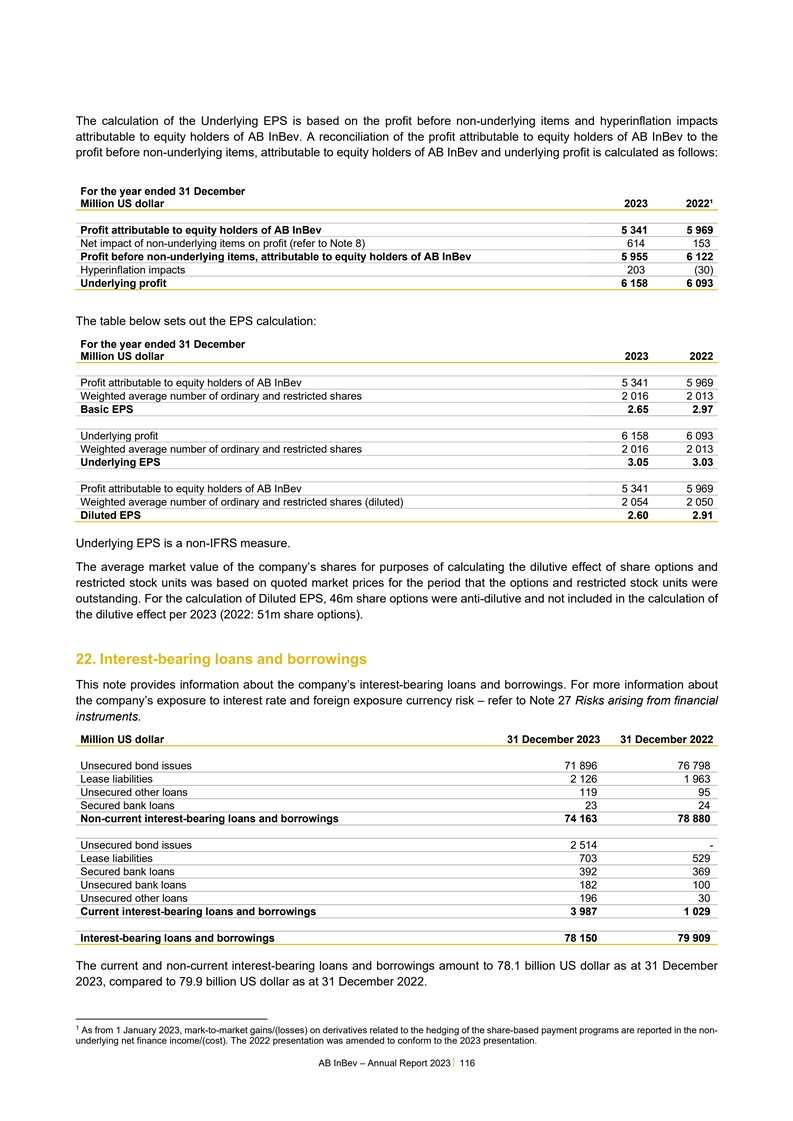
The calculation of the Underlying EPS is based on the profit before
non-underlying items and hyperinflation impacts attributable to equity holders of AB InBev. A reconciliation of the profit attributable to equity holders of AB InBev to the profit before non-underlying items, attributable to equity holders of AB
InBev and underlying profit is calculated as follows: 1 For the year ended 31 December Million US dollar 2023 2022¹ . Profit attributable to equity holders of AB InBev 5 341 5 969 Net impact of non-underlying items on profit (refer to Note 8)
614 153 Profit before non-underlying items, attributable to equity holders of AB InBev 5 955 6 122 Hyperinflation impacts 203 (30) Underlying profit 6 158 6 093 The table below sets out the EPS calculation: For the year ended 31 December Million US
dollar 2023 2022 . Profit attributable to equity holders of AB InBev 5 341 5 969 Weighted average number of ordinary and restricted shares 2 016 2 013 Basic EPS 2.65 2.97 . Underlying profit 6 158 6 093 Weighted average number of ordinary and
restricted shares 2 016 2 013 Underlying EPS 3.05 3.03 . Profit attributable to equity holders of AB InBev 5 341 5 969 Weighted average number of ordinary and restricted shares (diluted) 2 054 2 050 Diluted EPS 2.60 2.91 Underlying EPS is a non-IFRS
measure. The average market value of the company’s shares for purposes of calculating the dilutive effect of share options and restricted stock units was based on quoted market prices for the period that the options and restricted stock units
were outstanding. For the calculation of Diluted EPS, 46m share options were anti-dilutive and not included in the calculation of the dilutive effect per 2023 (2022: 51m share options). 22. Interest-bearing loans and borrowings This note provides
information about the company’s interest-bearing loans and borrowings. For more information about the company’s exposure to interest rate and foreign exposure currency risk – refer to Note 27 Risks arising from financial
instruments. Million US dollar 31 December 2023 31 December 2022 Unsecured bond issues 71 896 76 798 Lease liabilities 2 126 1 963 Unsecured other loans 119 95 Secured bank loans 23 24 Non-current interest-bearing loans and borrowings 74 163 78 880
Unsecured bond issues 2 514 - Lease liabilities 703 529 Secured bank loans 392 369 Unsecured bank loans 182 100 Unsecured other loans 196 30 Current interest-bearing loans and borrowings 3 987 1 029 Interest-bearing loans and borrowings 78 150 79
909 The current and non-current interest-bearing loans and borrowings amount to 78.1 billion US dollar as at 31 December 2023, compared to 79.9 billion US dollar as at 31 December 2022. 1 As from 1 January 2023, mark-to-market gains/(losses) on
derivatives related to the hedging of the share-based payment programs are reported in the non- underlying net finance income/(cost). The 2022 presentation was amended to conform to the 2023 presentation. AB InBev – Annual Report 2023
116
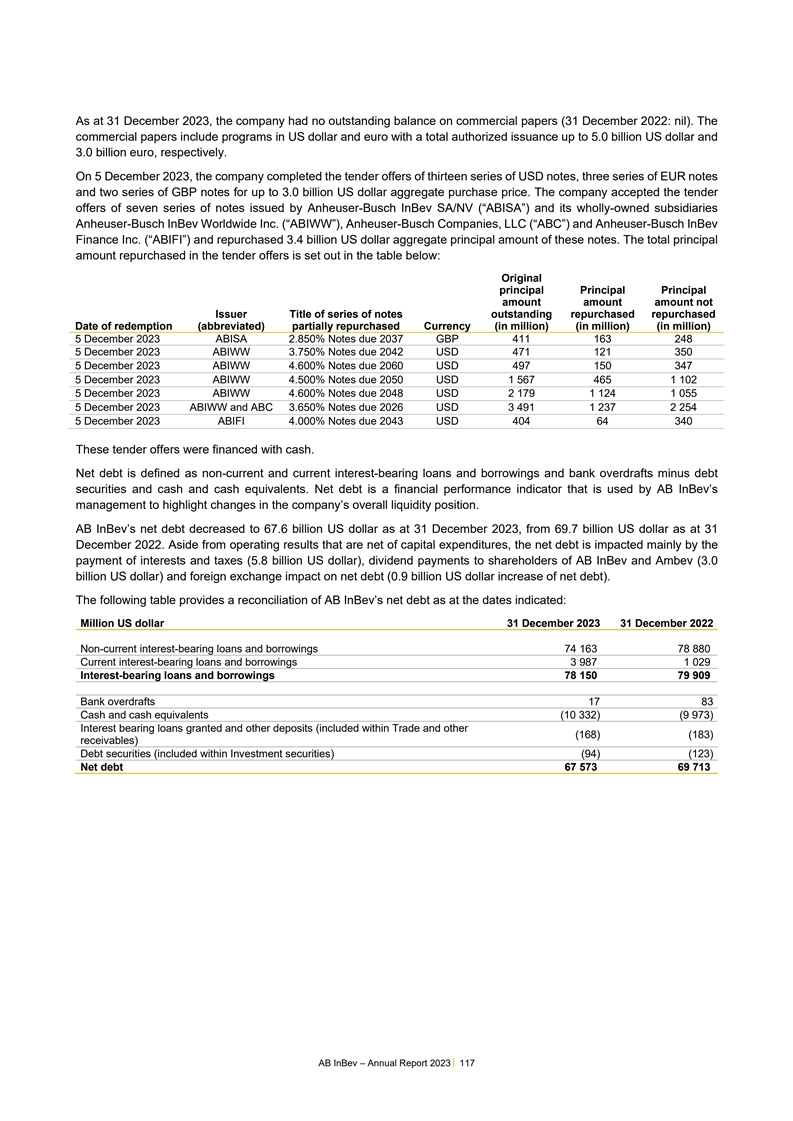
As at 31 December 2023, the company had no outstanding balance on
commercial papers (31 December 2022: nil). The commercial papers include programs in US dollar and euro with a total authorized issuance up to 5.0 billion US dollar and 3.0 billion euro, respectively. On 5 December 2023, the company completed the
tender offers of thirteen series of USD notes, three series of EUR notes and two series of GBP notes for up to 3.0 billion US dollar aggregate purchase price. The company accepted the tender offers of seven series of notes issued by Anheuser-Busch
InBev SA/NV (“ABISA”) and its wholly-owned subsidiaries Anheuser-Busch InBev Worldwide Inc. (“ABIWW”), Anheuser-Busch Companies, LLC (“ABC”) and Anheuser-Busch InBev Finance Inc. (“ABIFI”) and
repurchased 3.4 billion US dollar aggregate principal amount of these notes. The total principal amount repurchased in the tender offers is set out in the table below: Original principal Principal Principal amount amount amount not Issuer Title of
series of notes outstanding repurchased repurchased Date of redemption (abbreviated) partially repurchased Currency (in million) (in million) (in million) 5 December 2023 ABISA 2.850% Notes due 2037 GBP 411 163 248 5 December 2023 ABIWW 3.750% Notes
due 2042 USD 471 121 350 5 December 2023 ABIWW 4.600% Notes due 2060 USD 497 150 347 5 December 2023 ABIWW 4.500% Notes due 2050 USD 1 567 465 1 102 5 December 2023 ABIWW 4.600% Notes due 2048 USD 2 179 1 124 1 055 5 December 2023 ABIWW and ABC
3.650% Notes due 2026 USD 3 491 1 237 2 254 5 December 2023 ABIFI 4.000% Notes due 2043 USD 404 64 340 These tender offers were financed with cash. Net debt is defined as non-current and current interest-bearing loans and borrowings and bank
overdrafts minus debt securities and cash and cash equivalents. Net debt is a financial performance indicator that is used by AB InBev’s management to highlight changes in the company’s overall liquidity position. AB InBev’s net
debt decreased to 67.6 billion US dollar as at 31 December 2023, from 69.7 billion US dollar as at 31 December 2022. Aside from operating results that are net of capital expenditures, the net debt is impacted mainly by the payment of interests and
taxes (5.8 billion US dollar), dividend payments to shareholders of AB InBev and Ambev (3.0 billion US dollar) and foreign exchange impact on net debt (0.9 billion US dollar increase of net debt). The following table provides a reconciliation of AB
InBev’s net debt as at the dates indicated: Million US dollar 31 December 2023 31 December 2022 Non-current interest-bearing loans and borrowings 74 163 78 880 Current interest-bearing loans and borrowings 3 987 1 029 Interest-bearing loans
and borrowings 78 150 79 909 Bank overdrafts 17 83 Cash and cash equivalents (10 332) (9 973) Interest bearing loans granted and other deposits (included within Trade and other (168) (183) receivables) Debt securities (included within Investment
securities) (94) (123) Net debt 67 573 69 713 AB InBev – Annual Report 2023 117
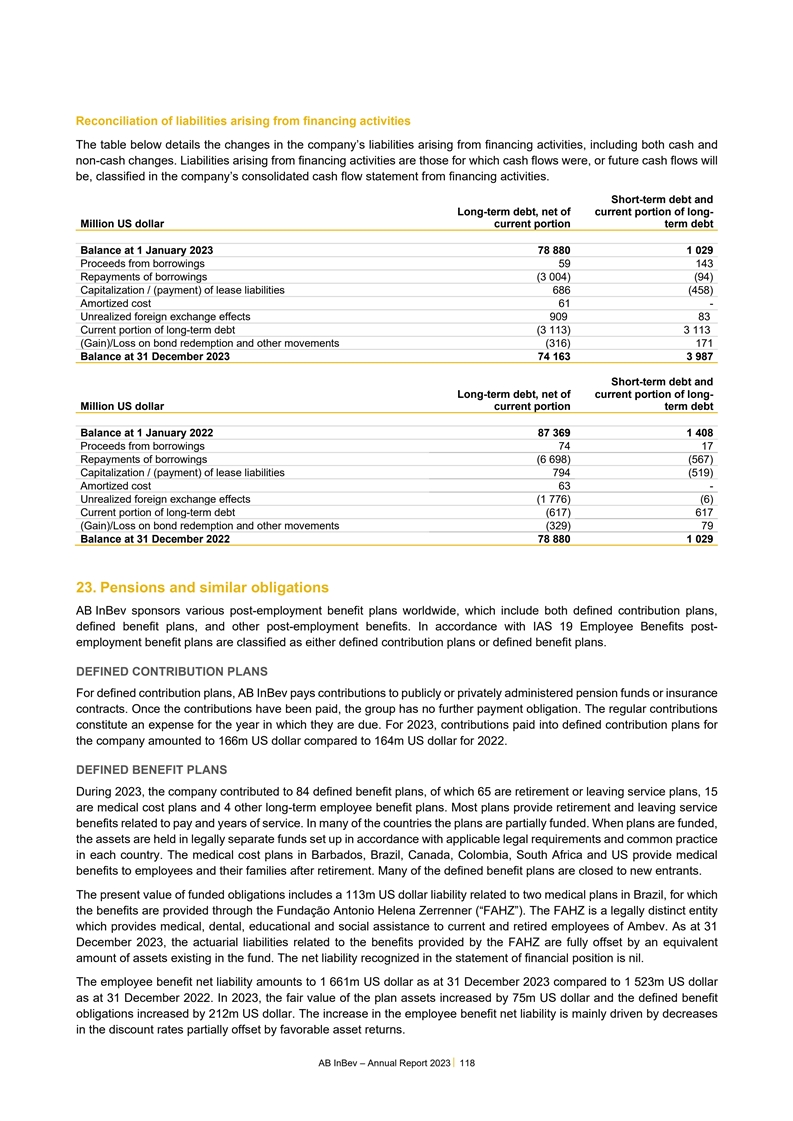
Reconciliation of liabilities arising from financing activities The
table below details the changes in the company’s liabilities arising from financing activities, including both cash and non-cash changes. Liabilities arising from financing activities are those for which cash flows were, or future cash flows
will be, classified in the company’s consolidated cash flow statement from financing activities. Short-term debt and Long-term debt, net of current portion of long- Million US dollar current portion term debt Balance at 1 January 2023 78 880 1
029 Proceeds from borrowings 59 143 Repayments of borrowings (3 004) (94) Capitalization / (payment) of lease liabilities 686 (458) Amortized cost 61 - Unrealized foreign exchange effects 909 83 Current portion of long-term debt (3 113) 3 113
(Gain)/Loss on bond redemption and other movements (316) 171 Balance at 31 December 2023 74 163 3 987 . Short-term debt and Long-term debt, net of current portion of long- Million US dollar current portion term debt Balance at 1 January 2022 87 369
1 408 Proceeds from borrowings 74 17 Repayments of borrowings (6 698) (567) Capitalization / (payment) of lease liabilities 794 (519) Amortized cost 63 - Unrealized foreign exchange effects (1 776) (6) Current portion of long-term debt (617) 617
(Gain)/Loss on bond redemption and other movements (329) 79 Balance at 31 December 2022 78 880 1 029 23. Pensions and similar obligations AB InBev sponsors various post-employment benefit plans worldwide, which include both defined contribution
plans, defined benefit plans, and other post-employment benefits. In accordance with IAS 19 Employee Benefits post- employment benefit plans are classified as either defined contribution plans or defined benefit plans. DEFINED CONTRIBUTION PLANS For
defined contribution plans, AB InBev pays contributions to publicly or privately administered pension funds or insurance contracts. Once the contributions have been paid, the group has no further payment obligation. The regular contributions
constitute an expense for the year in which they are due. For 2023, contributions paid into defined contribution plans for the company amounted to 166m US dollar compared to 164m US dollar for 2022. DEFINED BENEFIT PLANS During 2023, the company
contributed to 84 defined benefit plans, of which 65 are retirement or leaving service plans, 15 are medical cost plans and 4 other long-term employee benefit plans. Most plans provide retirement and leaving service benefits related to pay and years
of service. In many of the countries the plans are partially funded. When plans are funded, the assets are held in legally separate funds set up in accordance with applicable legal requirements and common practice in each country. The medical cost
plans in Barbados, Brazil, Canada, Colombia, South Africa and US provide medical benefits to employees and their families after retirement. Many of the defined benefit plans are closed to new entrants. The present value of funded obligations
includes a 113m US dollar liability related to two medical plans in Brazil, for which the benefits are provided through the Fundação Antonio Helena Zerrenner (“FAHZ”). The FAHZ is a legally distinct entity which provides
medical, dental, educational and social assistance to current and retired employees of Ambev. As at 31 December 2023, the actuarial liabilities related to the benefits provided by the FAHZ are fully offset by an equivalent amount of assets existing
in the fund. The net liability recognized in the statement of financial position is nil. The employee benefit net liability amounts to 1 661m US dollar as at 31 December 2023 compared to 1 523m US dollar as at 31 December 2022. In 2023, the fair
value of the plan assets increased by 75m US dollar and the defined benefit obligations increased by 212m US dollar. The increase in the employee benefit net liability is mainly driven by decreases in the discount rates partially offset by favorable
asset returns. AB InBev – Annual Report 2023 118
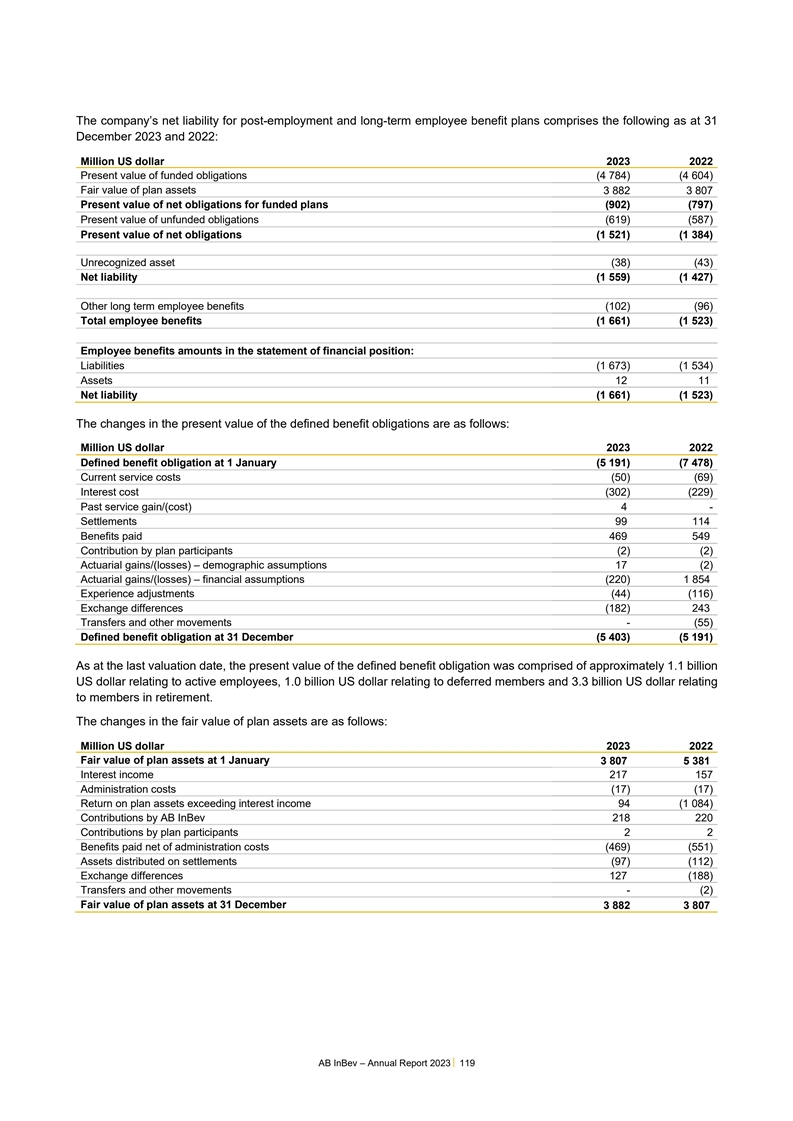
The company’s net liability for post-employment and long-term
employee benefit plans comprises the following as at 31 December 2023 and 2022: Million US dollar 2023 2022 Present value of funded obligations (4 784) (4 604) Fair value of plan assets 3 882 3 807 Present value of net obligations for funded plans
(902) (797) Present value of unfunded obligations (619) (587) Present value of net obligations (1 521) (1 384) Unrecognized asset (38) (43) Net liability (1 559) (1 427) Other long term employee benefits (102) (96) Total employee benefits (1 661) (1
523) Employee benefits amounts in the statement of financial position: Liabilities (1 673) (1 534) Assets 12 11 Net liability (1 661) (1 523) The changes in the present value of the defined benefit obligations are as follows: Million US dollar 2023
2022 Defined benefit obligation at 1 January (5 191) (7 478) Current service costs (50) (69) Interest cost (302) (229) Past service gain/(cost) 4 - Settlements 99 114 Benefits paid 469 549 Contribution by plan participants (2) (2) Actuarial
gains/(losses) – demographic assumptions 17 (2) Actuarial gains/(losses) – financial assumptions (220) 1 854 Experience adjustments (44) (116) Exchange differences (182) 243 Transfers and other movements - (55) Defined benefit obligation
at 31 December (5 403) (5 191) As at the last valuation date, the present value of the defined benefit obligation was comprised of approximately 1.1 billion US dollar relating to active employees, 1.0 billion US dollar relating to deferred members
and 3.3 billion US dollar relating to members in retirement. The changes in the fair value of plan assets are as follows: Million US dollar 2023 2022 Fair value of plan assets at 1 January 3 807 5 381 Interest income 217 157 Administration costs
(17) (17) Return on plan assets exceeding interest income 94 (1 084) Contributions by AB InBev 218 220 Contributions by plan participants 2 2 Benefits paid net of administration costs (469) (551) Assets distributed on settlements (97) (112) Exchange
differences 127 (188) Transfers and other movements - (2) Fair value of plan assets at 31 December 3 882 3 807 AB InBev – Annual Report 2023 119
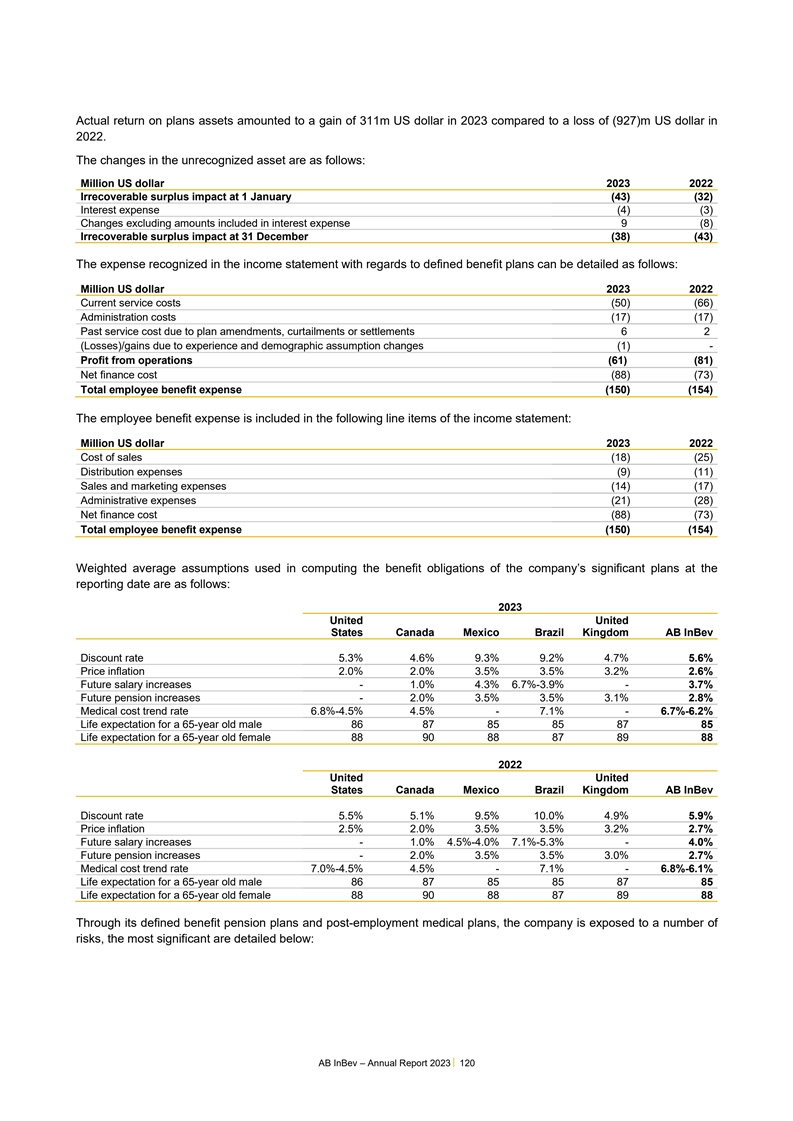
Actual return on plans assets amounted to a gain of 311m US dollar in
2023 compared to a loss of (927)m US dollar in 2022. The changes in the unrecognized asset are as follows: Million US dollar 2023 2022 Irrecoverable surplus impact at 1 January (43) (32) Interest expense (4) (3) Changes excluding amounts included in
interest expense 9 (8) Irrecoverable surplus impact at 31 December (38) (43) The expense recognized in the income statement with regards to defined benefit plans can be detailed as follows: Million US dollar 2023 2022 Current service costs (50) (66)
Administration costs (17) (17) Past service cost due to plan amendments, curtailments or settlements 6 2 (Losses)/gains due to experience and demographic assumption changes (1) - Profit from operations (61) (81) Net finance cost (88) (73) Total
employee benefit expense (150) (154) The employee benefit expense is included in the following line items of the income statement: Million US dollar 2023 2022 Cost of sales (18) (25) Distribution expenses (9) (11) Sales and marketing expenses (14)
(17) Administrative expenses (21) (28) Net finance cost (88) (73) Total employee benefit expense (150) (154) Weighted average assumptions used in computing the benefit obligations of the company’s significant plans at the reporting date are as
follows: 2023 United United States Canada Mexico Brazil Kingdom AB InBev Discount rate 5.3% 4.6% 9.3% 9.2% 4.7% 5.6% Price inflation 2.0% 2.0% 3.5% 3.5% 3.2% 2.6% Future salary increases - 1.0% 4.3% 6.7%-3.9% - 3.7% Future pension increases - 2.0%
3.5% 3.5% 3.1% 2.8% Medical cost trend rate 6.8%-4.5% 4.5% - 7.1% - 6.7%-6.2% Life expectation for a 65-year old male 86 87 85 85 87 85 Life expectation for a 65-year old female 88 90 88 87 89 88 2022 United United States Canada Mexico Brazil
Kingdom AB InBev Discount rate 5.5% 5.1% 9.5% 10.0% 4.9% 5.9% Price inflation 2.5% 2.0% 3.5% 3.5% 3.2% 2.7% Future salary increases - 1.0% 4.5%-4.0% 7.1%-5.3% - 4.0% Future pension increases - 2.0% 3.5% 3.5% 3.0% 2.7% Medical cost trend rate
7.0%-4.5% 4.5% - 7.1% - 6.8%-6.1% Life expectation for a 65-year old male 86 87 85 85 87 85 Life expectation for a 65-year old female 88 90 88 87 89 88 Through its defined benefit pension plans and post-employment medical plans, the company is
exposed to a number of risks, the most significant are detailed below: AB InBev – Annual Report 2023 120
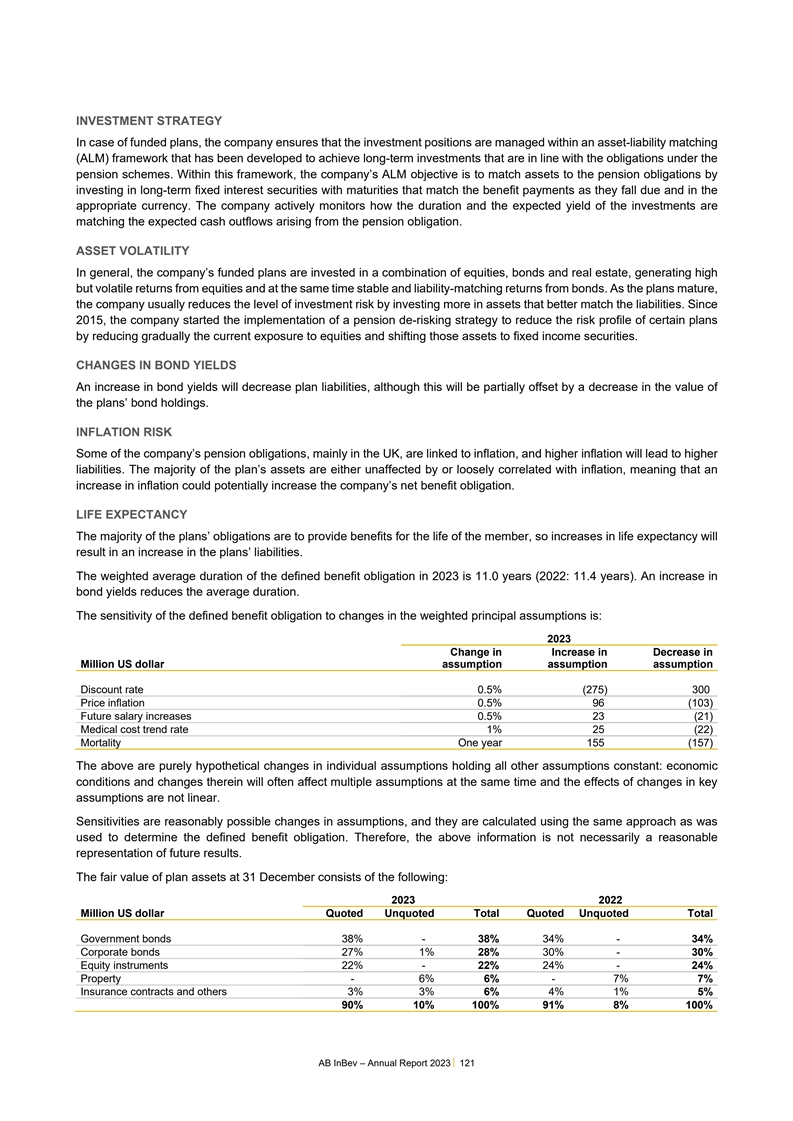
INVESTMENT STRATEGY In case of funded plans, the company ensures that
the investment positions are managed within an asset-liability matching (ALM) framework that has been developed to achieve long-term investments that are in line with the obligations under the pension schemes. Within this framework, the
company’s ALM objective is to match assets to the pension obligations by investing in long-term fixed interest securities with maturities that match the benefit payments as they fall due and in the appropriate currency. The company actively
monitors how the duration and the expected yield of the investments are matching the expected cash outflows arising from the pension obligation. ASSET VOLATILITY In general, the company’s funded plans are invested in a combination of equities,
bonds and real estate, generating high but volatile returns from equities and at the same time stable and liability-matching returns from bonds. As the plans mature, the company usually reduces the level of investment risk by investing more in
assets that better match the liabilities. Since 2015, the company started the implementation of a pension de-risking strategy to reduce the risk profile of certain plans by reducing gradually the current exposure to equities and shifting those
assets to fixed income securities. CHANGES IN BOND YIELDS An increase in bond yields will decrease plan liabilities, although this will be partially offset by a decrease in the value of the plans’ bond holdings. INFLATION RISK Some of the
company’s pension obligations, mainly in the UK, are linked to inflation, and higher inflation will lead to higher liabilities. The majority of the plan’s assets are either unaffected by or loosely correlated with inflation, meaning that
an increase in inflation could potentially increase the company’s net benefit obligation. LIFE EXPECTANCY The majority of the plans’ obligations are to provide benefits for the life of the member, so increases in life expectancy will
result in an increase in the plans’ liabilities. The weighted average duration of the defined benefit obligation in 2023 is 11.0 years (2022: 11.4 years). An increase in bond yields reduces the average duration. The sensitivity of the defined
benefit obligation to changes in the weighted principal assumptions is: 2023 Change in Increase in Decrease in Million US dollar assumption assumption assumption Discount rate 0.5% (275) 300 Price inflation 0.5% 96 (103) Future salary increases 0.5%
23 (21) Medical cost trend rate 1% 25 (22) Mortality One year 155 (157) The above are purely hypothetical changes in individual assumptions holding all other assumptions constant: economic conditions and changes therein will often affect multiple
assumptions at the same time and the effects of changes in key assumptions are not linear. Sensitivities are reasonably possible changes in assumptions, and they are calculated using the same approach as was used to determine the defined benefit
obligation. Therefore, the above information is not necessarily a reasonable representation of future results. The fair value of plan assets at 31 December consists of the following: 2023 2022 Million US dollar Quoted Unquoted Total Quoted Unquoted
Total Government bonds 38% - 38% 34% - 34% Corporate bonds 27% 1% 28% 30% - 30% Equity instruments 22% - 22% 24% - 24% Property - 6% 6% - 7% 7% Insurance contracts and others 3% 3% 6% 4% 1% 5% 90% 10% 100% 91% 8% 100% AB InBev – Annual Report
2023 121
AB InBev expects to contribute approximately 229m US dollar for its
funded defined benefit plans and 76m US dollar in benefit payments to its unfunded defined benefit plans and post-retirement medical plans in 2024. 24. Share-based payments Different share-based programs allow company senior management and members
of the board of directors to receive or acquire shares of AB InBev, Ambev or Budweiser APAC. AB InBev has three primary share-based compensation plans: the share-based compensation plan (“Share-Based Compensation Plan”), the long-term
restricted stock unit plan for directors (“RSU Plan for Directors”), and the various long-term incentive plan for executives (“LTI Plan Executives”). These share-based payment programs relate to either AB InBev shares or
American Depository Shares (“ADSs”) as underlying equity instruments. All the company share-based payment plans are equity-settled. Amounts have been converted to US dollar at the average rate of the period, unless otherwise indicated.
Share-based payment transactions resulted in a total expense of 570m US dollar for 2023, as compared to 448m US dollar for 2022. AB INBEV SHARE-BASED COMPENSATION PROGRAMS Share-Based Compensation Plan for Executives Under this plan, members of the
Executive Committee and other senior employees receive their bonus in cash but have the choice to invest some or all of the value of their bonus in AB InBev shares, referred to as voluntary shares. The voluntary shares are entitled to dividends from
the date of grant and are subject to a lock-up period of three years. They are granted at market price, to which a discount of up to 20% is applied. The discount is delivered in the form of RSUs (Discounted Shares). Executives who invest in
Voluntary Shares also receive one and a half matching shares for each voluntary share invested up to a limited total percentage of each executive’s variable compensation. These matching shares are also delivered in the form of RSUs (Matching
Shares). The RSUs relating to the Matching Shares and the Discounted Shares vest over a three or five-year period and are subject to specific restrictions or forfeiture provisions in the event of termination of service. During 2023, AB InBev issued
1.7m discounted and matching RSUs in relation to bonuses granted to company employees and management (2022: 4.8m discounted and matching RSUs). These discounted and matching RSUs represent a fair value of approximately 102m US dollar (2022: 293m US
dollar). Restricted Stock Units Plan for Directors The remuneration of the directors comprises a fixed cash fee component and a share-based component. The share-based portion of the remuneration of the directors of the company is granted in the form
of RSUs that vest after five years and, upon vesting, entitle their holders to one AB InBev share per RSU. During 2023, 0.1m RSUs with an estimated fair value of 4m US dollar were granted to directors (2022: 0.1m with an estimated fair value of 4m
US dollar). Annual LTI Plans for Executives Subject to management’s assessment of the executive’s performance and future potential, members of senior management may be eligible for an annual long-term incentive to be paid out in RSUs,
Performance Stock Units (“PSUs”) and/or stock options. • Long-term Incentive RSUs: They cliff vest over a three or five-year period. Upon vesting, each RSU entitles its holder to acquire one share. During 2023, AB InBev issued 2.9m
RSUs with an estimated fair value of 183m US dollar under this plan (2022: 3.9m RSUs with an estimated fair value of 228m US dollar under this plan). Out of these RSUs, 0.1m RSUs were granted to members of the Executive Committee (2022: 0.5m RSUs).
• Long-term PSUs: They cliff vest over a three-year period. Upon vesting of the PSUs, the number of shares to which the holders thereof shall be entitled shall depend on a performance test measuring (on a percentile basis) the company’s
three-year Total Shareholder Return (“TSR”) relative to the TSR realized for that period by a representative sample of listed companies belonging to the consumer goods sector. The number of shares to which such units entitle their
holders is subject to a hurdle and cap. During 2023, 0.5m PSUs were granted to Executives with an estimated fair value of 39m US dollar (2022: 0.5m PSUs with an estimated fair value of 39m US dollar under this plan). Out of these PSUs, 33 thousand
PSUs were granted to members of the Executive Committee (2022: 0.1m PSUs). AB InBev – Annual Report 2023 122
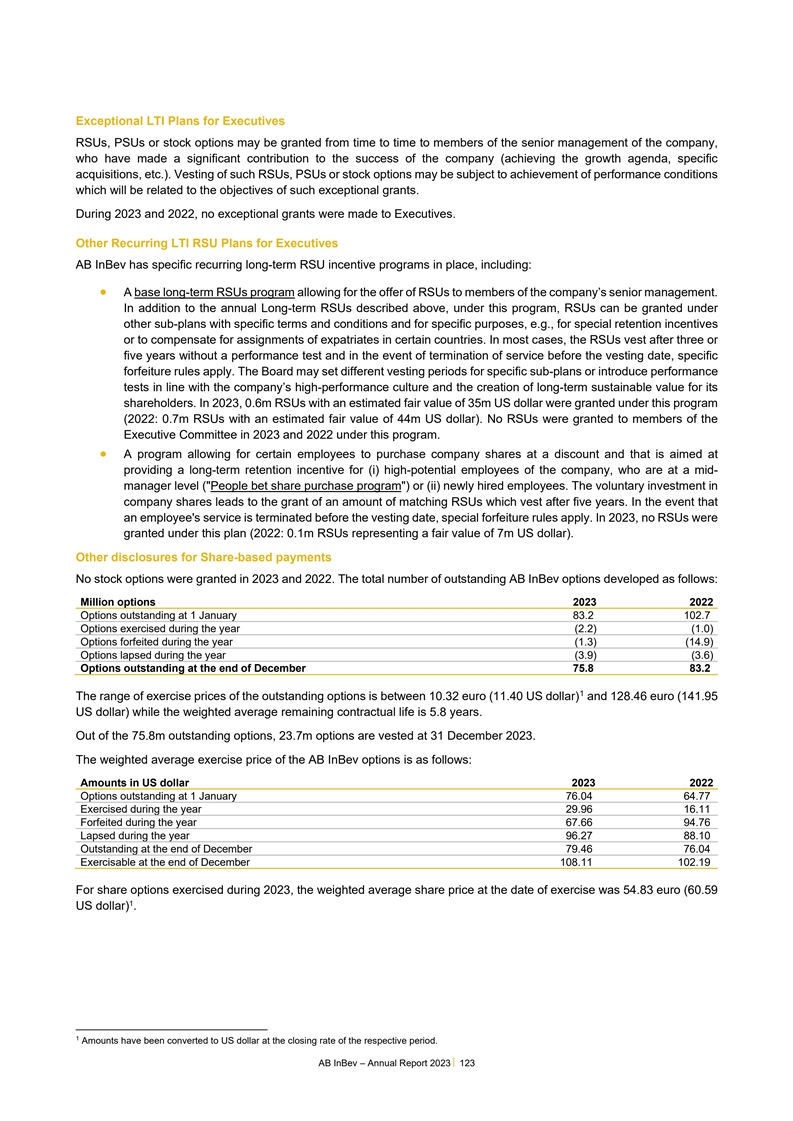
Exceptional LTI Plans for Executives RSUs, PSUs or stock options may
be granted from time to time to members of the senior management of the company, who have made a significant contribution to the success of the company (achieving the growth agenda, specific acquisitions, etc.). Vesting of such RSUs, PSUs or stock
options may be subject to achievement of performance conditions which will be related to the objectives of such exceptional grants. During 2023 and 2022, no exceptional grants were made to Executives. Other Recurring LTI RSU Plans for Executives AB
InBev has specific recurring long-term RSU incentive programs in place, including: • A base long-term RSUs program allowing for the offer of RSUs to members of the company’s senior management. In addition to the annual Long-term RSUs
described above, under this program, RSUs can be granted under other sub-plans with specific terms and conditions and for specific purposes, e.g., for special retention incentives or to compensate for assignments of expatriates in certain countries.
In most cases, the RSUs vest after three or five years without a performance test and in the event of termination of service before the vesting date, specific forfeiture rules apply. The Board may set different vesting periods for specific sub-plans
or introduce performance tests in line with the company’s high-performance culture and the creation of long-term sustainable value for its shareholders. In 2023, 0.6m RSUs with an estimated fair value of 35m US dollar were granted under this
program (2022: 0.7m RSUs with an estimated fair value of 44m US dollar). No RSUs were granted to members of the Executive Committee in 2023 and 2022 under this program. • A program allowing for certain employees to purchase company shares at a
discount and that is aimed at providing a long-term retention incentive for (i) high-potential employees of the company, who are at a mid- manager level ( People bet share purchase program ) or (ii) newly hired employees. The voluntary investment in
company shares leads to the grant of an amount of matching RSUs which vest after five years. In the event that an employee's service is terminated before the vesting date, special forfeiture rules apply. In 2023, no RSUs were granted under this plan
(2022: 0.1m RSUs representing a fair value of 7m US dollar). Other disclosures for Share-based payments No stock options were granted in 2023 and 2022. The total number of outstanding AB InBev options developed as follows: Million options 2023 2022
Options outstanding at 1 January 83.2 102.7 Options exercised during the year (2.2) (1.0) Options forfeited during the year (1.3) (14.9) Options lapsed during the year (3.9) (3.6) Options outstanding at the end of December 75.8 83.2 1 The range of
exercise prices of the outstanding options is between 10.32 euro (11.40 US dollar) and 128.46 euro (141.95 US dollar) while the weighted average remaining contractual life is 5.8 years. Out of the 75.8m outstanding options, 23.7m options are vested
at 31 December 2023. The weighted average exercise price of the AB InBev options is as follows: Amounts in US dollar 2023 2022 Options outstanding at 1 January 76.04 64.77 Exercised during the year 29.96 16.11 Forfeited during the year 67.66 94.76
Lapsed during the year 96.27 88.10 Outstanding at the end of December 79.46 76.04 Exercisable at the end of December 108.11 102.19 For share options exercised during 2023, the weighted average share price at the date of exercise was 54.83 euro
(60.59 1 US dollar) . 1 Amounts have been converted to US dollar at the closing rate of the respective period. AB InBev – Annual Report 2023 123
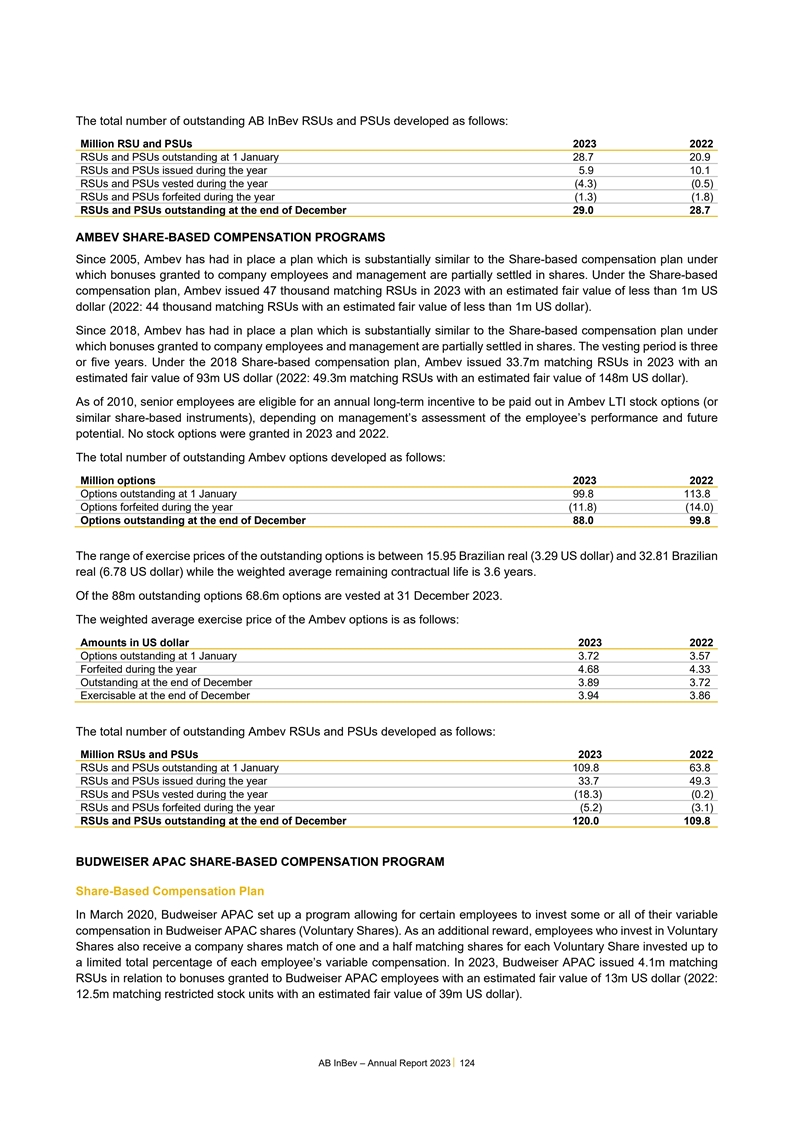
The total number of outstanding AB InBev RSUs and PSUs developed as
follows: Million RSU and PSUs 2023 2022 RSUs and PSUs outstanding at 1 January 28.7 20.9 RSUs and PSUs issued during the year 5.9 10.1 RSUs and PSUs vested during the year (4.3) (0.5) RSUs and PSUs forfeited during the year (1.3) (1.8) RSUs and PSUs
outstanding at the end of December 29.0 28.7 AMBEV SHARE-BASED COMPENSATION PROGRAMS Since 2005, Ambev has had in place a plan which is substantially similar to the Share-based compensation plan under which bonuses granted to company employees and
management are partially settled in shares. Under the Share-based compensation plan, Ambev issued 47 thousand matching RSUs in 2023 with an estimated fair value of less than 1m US dollar (2022: 44 thousand matching RSUs with an estimated fair value
of less than 1m US dollar). Since 2018, Ambev has had in place a plan which is substantially similar to the Share-based compensation plan under which bonuses granted to company employees and management are partially settled in shares. The vesting
period is three or five years. Under the 2018 Share-based compensation plan, Ambev issued 33.7m matching RSUs in 2023 with an estimated fair value of 93m US dollar (2022: 49.3m matching RSUs with an estimated fair value of 148m US dollar). As of
2010, senior employees are eligible for an annual long-term incentive to be paid out in Ambev LTI stock options (or similar share-based instruments), depending on management’s assessment of the employee’s performance and future
potential. No stock options were granted in 2023 and 2022. The total number of outstanding Ambev options developed as follows: Million options 2023 2022 Options outstanding at 1 January 99.8 113.8 Options forfeited during the year (11.8) (14.0)
Options outstanding at the end of December 88.0 99.8 The range of exercise prices of the outstanding options is between 15.95 Brazilian real (3.29 US dollar) and 32.81 Brazilian real (6.78 US dollar) while the weighted average remaining contractual
life is 3.6 years. Of the 88m outstanding options 68.6m options are vested at 31 December 2023. The weighted average exercise price of the Ambev options is as follows: Amounts in US dollar 2023 2022 Options outstanding at 1 January 3.72 3.57
Forfeited during the year 4.68 4.33 Outstanding at the end of December 3.89 3.72 Exercisable at the end of December 3.94 3.86 The total number of outstanding Ambev RSUs and PSUs developed as follows: Million RSUs and PSUs 2023 2022 RSUs and PSUs
outstanding at 1 January 109.8 63.8 RSUs and PSUs issued during the year 33.7 49.3 RSUs and PSUs vested during the year (18.3) (0.2) RSUs and PSUs forfeited during the year (5.2) (3.1) RSUs and PSUs outstanding at the end of December 120.0 109.8
BUDWEISER APAC SHARE-BASED COMPENSATION PROGRAM Share-Based Compensation Plan In March 2020, Budweiser APAC set up a program allowing for certain employees to invest some or all of their variable compensation in Budweiser APAC shares (Voluntary
Shares). As an additional reward, employees who invest in Voluntary Shares also receive a company shares match of one and a half matching shares for each Voluntary Share invested up to a limited total percentage of each employee’s variable
compensation. In 2023, Budweiser APAC issued 4.1m matching RSUs in relation to bonuses granted to Budweiser APAC employees with an estimated fair value of 13m US dollar (2022: 12.5m matching restricted stock units with an estimated fair value of 39m
US dollar). AB InBev – Annual Report 2023 124
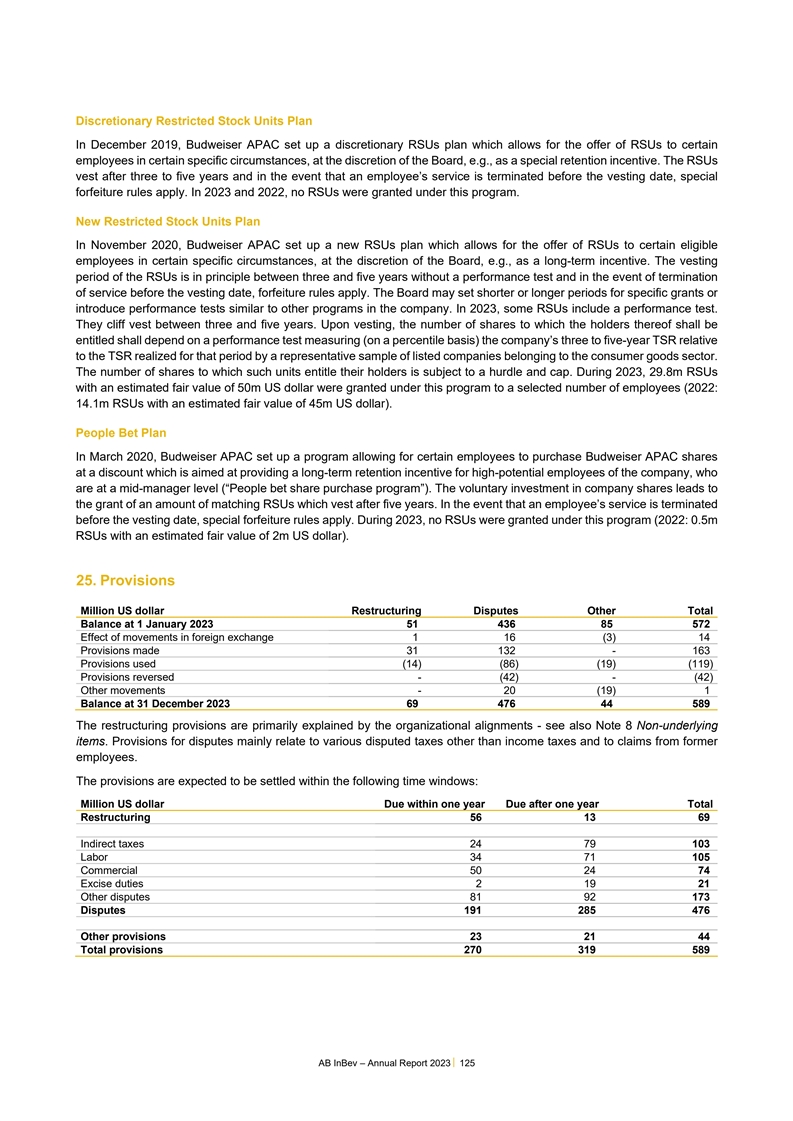
Discretionary Restricted Stock Units Plan In December 2019, Budweiser
APAC set up a discretionary RSUs plan which allows for the offer of RSUs to certain employees in certain specific circumstances, at the discretion of the Board, e.g., as a special retention incentive. The RSUs vest after three to five years and in
the event that an employee’s service is terminated before the vesting date, special forfeiture rules apply. In 2023 and 2022, no RSUs were granted under this program. New Restricted Stock Units Plan In November 2020, Budweiser APAC set up a
new RSUs plan which allows for the offer of RSUs to certain eligible employees in certain specific circumstances, at the discretion of the Board, e.g., as a long-term incentive. The vesting period of the RSUs is in principle between three and five
years without a performance test and in the event of termination of service before the vesting date, forfeiture rules apply. The Board may set shorter or longer periods for specific grants or introduce performance tests similar to other programs in
the company. In 2023, some RSUs include a performance test. They cliff vest between three and five years. Upon vesting, the number of shares to which the holders thereof shall be entitled shall depend on a performance test measuring (on a percentile
basis) the company’s three to five-year TSR relative to the TSR realized for that period by a representative sample of listed companies belonging to the consumer goods sector. The number of shares to which such units entitle their holders is
subject to a hurdle and cap. During 2023, 29.8m RSUs with an estimated fair value of 50m US dollar were granted under this program to a selected number of employees (2022: 14.1m RSUs with an estimated fair value of 45m US dollar). People Bet Plan In
March 2020, Budweiser APAC set up a program allowing for certain employees to purchase Budweiser APAC shares at a discount which is aimed at providing a long-term retention incentive for high-potential employees of the company, who are at a
mid-manager level (“People bet share purchase program”). The voluntary investment in company shares leads to the grant of an amount of matching RSUs which vest after five years. In the event that an employee’s service is terminated
before the vesting date, special forfeiture rules apply. During 2023, no RSUs were granted under this program (2022: 0.5m RSUs with an estimated fair value of 2m US dollar). 25. Provisions Million US dollar Restructuring Disputes Other Total Balance
at 1 January 2023 51 436 85 572 Effect of movements in foreign exchange 1 16 (3) 14 Provisions made 31 132 - 163 Provisions used (14) (86) (19) (119) Provisions reversed - (42) - (42) Other movements - 20 (19) 1 Balance at 31 December 2023 69 476 44
589 The restructuring provisions are primarily explained by the organizational alignments - see also Note 8 Non-underlying items. Provisions for disputes mainly relate to various disputed taxes other than income taxes and to claims from former
employees. The provisions are expected to be settled within the following time windows: Million US dollar Due within one year Due after one year Total Restructuring 56 13 69 Indirect taxes 24 79 103 Labor 34 71 105 Commercial 50 24 74 Excise duties
2 19 21 Other disputes 81 92 173 Disputes 191 285 476 Other provisions 23 21 44 Total provisions 270 319 589 AB InBev – Annual Report 2023 125
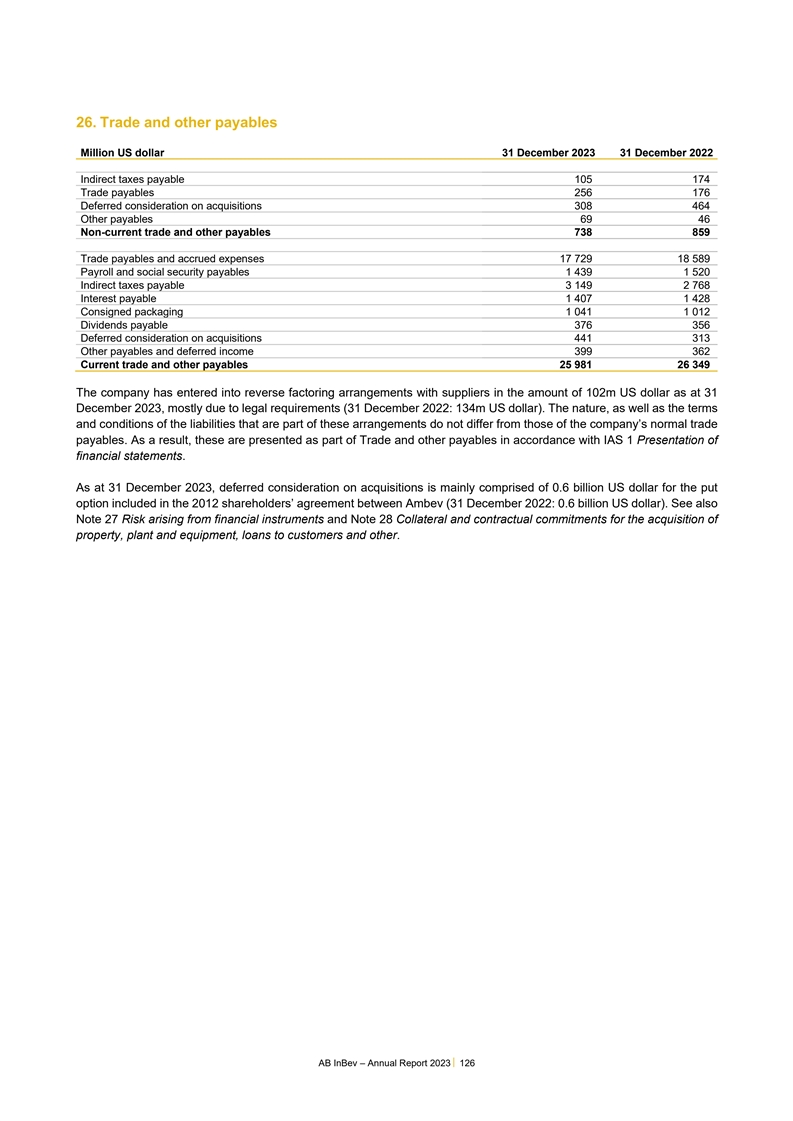
26. Trade and other payables Million US dollar 31 December 2023 31
December 2022 Indirect taxes payable 105 174 Trade payables 256 176 Deferred consideration on acquisitions 308 464 Other payables 69 46 Non-current trade and other payables 738 859 Trade payables and accrued expenses 17 729 18 589 Payroll and social
security payables 1 439 1 520 Indirect taxes payable 3 149 2 768 Interest payable 1 407 1 428 Consigned packaging 1 041 1 012 Dividends payable 376 356 Deferred consideration on acquisitions 441 313 Other payables and deferred income 399 362 Current
trade and other payables 25 981 26 349 The company has entered into reverse factoring arrangements with suppliers in the amount of 102m US dollar as at 31 December 2023, mostly due to legal requirements (31 December 2022: 134m US dollar). The
nature, as well as the terms and conditions of the liabilities that are part of these arrangements do not differ from those of the company’s normal trade payables. As a result, these are presented as part of Trade and other payables in
accordance with IAS 1 Presentation of financial statements. As at 31 December 2023, deferred consideration on acquisitions is mainly comprised of 0.6 billion US dollar for the put option included in the 2012 shareholders’ agreement between
Ambev (31 December 2022: 0.6 billion US dollar). See also Note 27 Risk arising from financial instruments and Note 28 Collateral and contractual commitments for the acquisition of property, plant and equipment, loans to customers and other. AB InBev
– Annual Report 2023 126
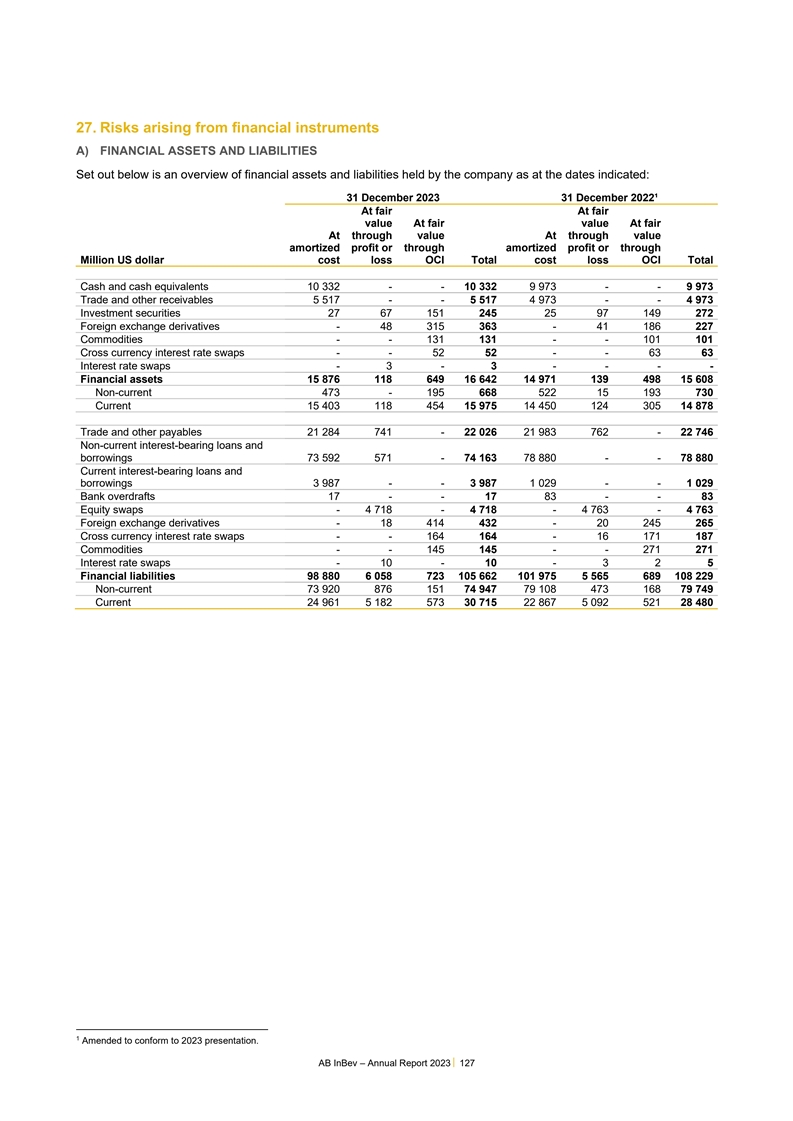
27. Risks arising from financial instruments A) FINANCIAL ASSETS AND
LIABILITIES 1 Set out below is an overview of financial assets and liabilities held by the company as at the dates indicated: 31 December 2023 31 December 2022¹ At fair At fair value At fair value At fair At through value At through value
amortized profit or through amortized profit or through Million US dollar cost loss OCI Total cost loss OCI Total Cash and cash equivalents 10 332 - - 10 332 9 973 - - 9 973 Trade and other receivables 5 517 - - 5 517 4 973 - - 4 973 Investment
securities 27 67 151 245 25 97 149 272 Foreign exchange derivatives - 48 315 363 - 41 186 227 Commodities - - 131 131 - - 101 101 Cross currency interest rate swaps - - 52 52 - - 63 63 Interest rate swaps - 3 - 3 - - - - Financial assets 15 876 118
649 16 642 14 971 139 498 15 608 Non-current 473 - 195 668 522 15 193 730 Current 15 403 118 454 15 975 14 450 124 305 14 878 . Trade and other payables 21 284 741 - 22 026 21 983 762 - 22 746 Non-current interest-bearing loans and borrowings 73 592
571 - 74 163 78 880 - - 78 880 Current interest-bearing loans and borrowings 3 987 - - 3 987 1 029 - - 1 029 Bank overdrafts 17 - - 17 83 - - 83 Equity swaps - 4 718 - 4 718 - 4 763 - 4 763 Foreign exchange derivatives - 18 414 432 - 20 245 265
Cross currency interest rate swaps - - 164 164 - 16 171 187 Commodities - - 145 145 - - 271 271 Interest rate swaps - 10 - 10 - 3 2 5 Financial liabilities 98 880 6 058 723 105 662 101 975 5 565 689 108 229 Non-current 73 920 876 151 74 947 79 108
473 168 79 749 Current 24 961 5 182 573 30 715 22 867 5 092 521 28 480 1 Amended to conform to 2023 presentation. AB InBev – Annual Report 2023 127
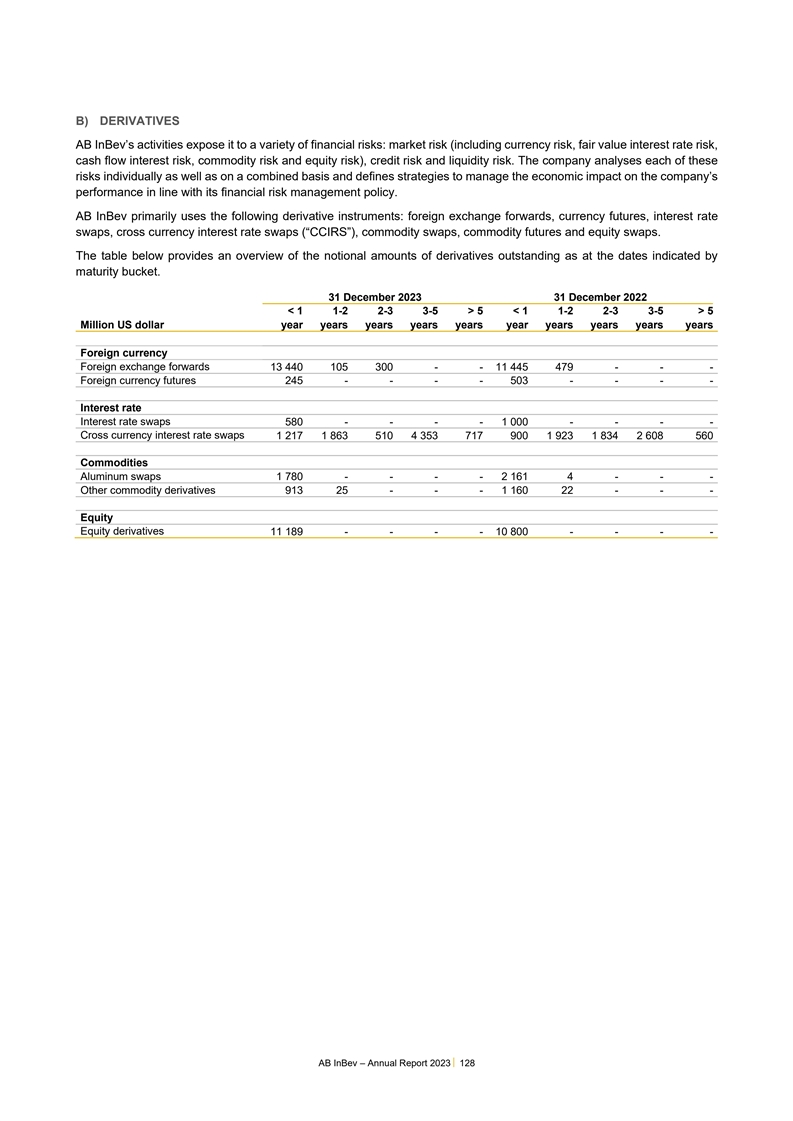
B) DERIVATIVES AB InBev’s activities expose it to a variety of
financial risks: market risk (including currency risk, fair value interest rate risk, cash flow interest risk, commodity risk and equity risk), credit risk and liquidity risk. The company analyses each of these risks individually as well as on a
combined basis and defines strategies to manage the economic impact on the company’s performance in line with its financial risk management policy. AB InBev primarily uses the following derivative instruments: foreign exchange forwards,
currency futures, interest rate swaps, cross currency interest rate swaps (“CCIRS”), commodity swaps, commodity futures and equity swaps. The table below provides an overview of the notional amounts of derivatives outstanding as at the
dates indicated by maturity bucket. 31 December 2023 31 December 2022 < 1 1-2 2-3 3-5 > 5 < 1 1-2 2-3 3-5 > 5 Million US dollar year years years years years year years years years years Foreign currency Foreign exchange forwards 13 440
105 300 - - 11 445 479 - - - Foreign currency futures 245 - - - - 503 - - - - Interest rate Interest rate swaps 580 - - - - 1 000 - - - - Cross currency interest rate swaps 1 217 1 863 510 4 353 717 900 1 923 1 834 2 608 560 Commodities Aluminum
swaps 1 780 - - - - 2 161 4 - - - Other commodity derivatives 913 25 - - - 1 160 22 - - - Equity Equity derivatives 11 189 - - - - 10 800 - - - - AB InBev – Annual Report 2023 128
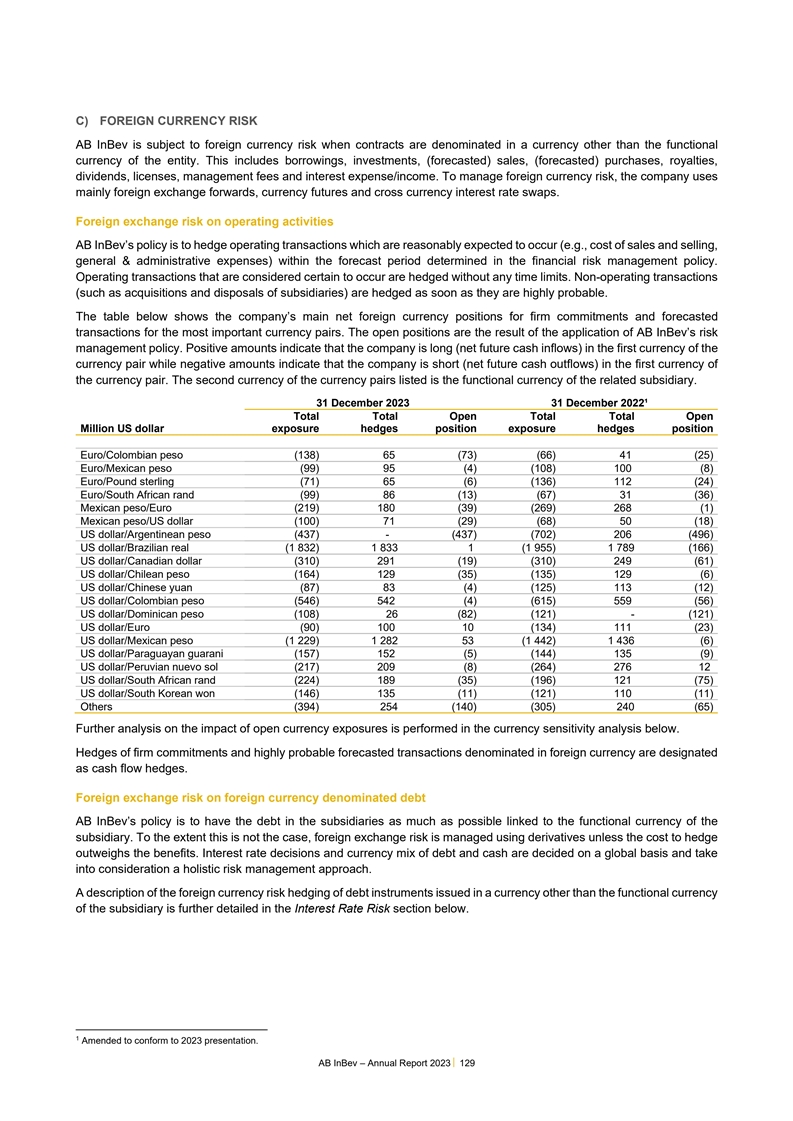
C) FOREIGN CURRENCY RISK AB InBev is subject to foreign currency risk
when contracts are denominated in a currency other than the functional currency of the entity. This includes borrowings, investments, (forecasted) sales, (forecasted) purchases, royalties, dividends, licenses, management fees and interest
expense/income. To manage foreign currency risk, the company uses mainly foreign exchange forwards, currency futures and cross currency interest rate swaps. Foreign exchange risk on operating activities AB InBev’s policy is to hedge operating
transactions which are reasonably expected to occur (e.g., cost of sales and selling, general & administrative expenses) within the forecast period determined in the financial risk management policy. Operating transactions that are considered
certain to occur are hedged without any time limits. Non-operating transactions (such as acquisitions and disposals of subsidiaries) are hedged as soon as they are highly probable. The table below shows the company’s main net foreign currency
positions for firm commitments and forecasted transactions for the most important currency pairs. The open positions are the result of the application of AB InBev’s risk management policy. Positive amounts indicate that the company is long
(net future cash inflows) in the first currency of the currency pair while negative amounts indicate that the company is short (net future cash outflows) in the first currency of the currency pair. The second currency of the currency pairs listed is
the functional currency of the related subsidiary. 31 December 2023 31 December 2022¹ Total Total Open Total Total Open Million US dollar exposure hedges position exposure hedges position Euro/Colombian peso (138) 65 (73) (66) 41 (25)
Euro/Mexican peso (99) 95 (4) (108) 100 (8) Euro/Pound sterling (71) 65 (6) (136) 112 (24) Euro/South African rand (99) 86 (13) (67) 31 (36) Mexican peso/Euro (219) 180 (39) (269) 268 (1) Mexican peso/US dollar (100) 71 (29) (68) 50 (18) US
dollar/Argentinean peso (437) - (437) (702) 206 (496) US dollar/Brazilian real (1 832) 1 833 1 (1 955) 1 789 (166) US dollar/Canadian dollar (310) 291 (19) (310) 249 (61) US dollar/Chilean peso (164) 129 (35) (135) 129 (6) US dollar/Chinese yuan
(87) 83 (4) (125) 113 (12) US dollar/Colombian peso (546) 542 (4) (615) 559 (56) US dollar/Dominican peso (108) 26 (82) (121) - (121) US dollar/Euro (90) 100 10 (134) 111 (23) US dollar/Mexican peso (1 229) 1 282 53 (1 442) 1 436 (6) US
dollar/Paraguayan guarani (157) 152 (5) (144) 135 (9) US dollar/Peruvian nuevo sol (217) 209 (8) (264) 276 12 US dollar/South African rand (224) 189 (35) (196) 121 (75) US dollar/South Korean won (146) 135 (11) (121) 110 (11) Others (394) 254 (140)
(305) 240 (65) 1 Further analysis on the impact of open currency exposures is performed in the currency sensitivity analysis below. Hedges of firm commitments and highly probable forecasted transactions denominated in foreign currency are designated
as cash flow hedges. Foreign exchange risk on foreign currency denominated debt AB InBev’s policy is to have the debt in the subsidiaries as much as possible linked to the functional currency of the subsidiary. To the extent this is not the
case, foreign exchange risk is managed using derivatives unless the cost to hedge outweighs the benefits. Interest rate decisions and currency mix of debt and cash are decided on a global basis and take into consideration a holistic risk management
approach. A description of the foreign currency risk hedging of debt instruments issued in a currency other than the functional currency of the subsidiary is further detailed in the Interest Rate Risk section below. 1 Amended to conform to 2023
presentation. AB InBev – Annual Report 2023 129
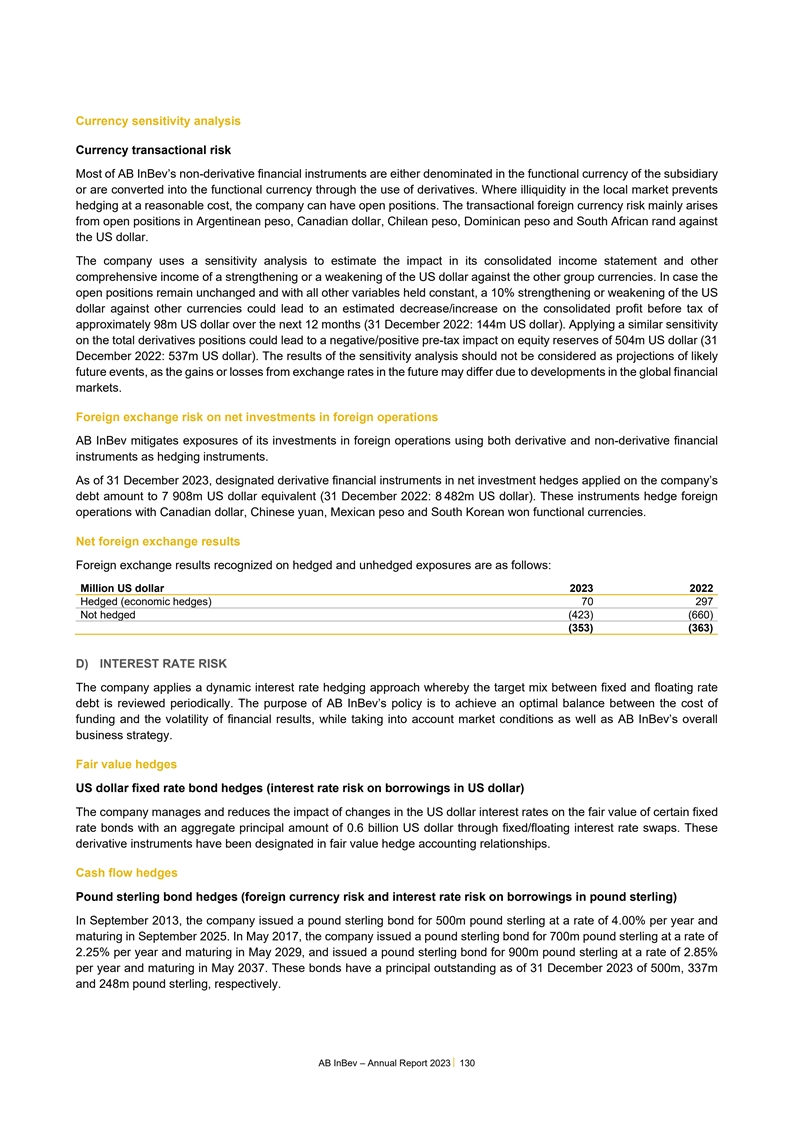
Currency sensitivity analysis Currency transactional risk Most of AB
InBev’s non-derivative financial instruments are either denominated in the functional currency of the subsidiary or are converted into the functional currency through the use of derivatives. Where illiquidity in the local market prevents
hedging at a reasonable cost, the company can have open positions. The transactional foreign currency risk mainly arises from open positions in Argentinean peso, Canadian dollar, Chilean peso, Dominican peso and South African rand against the US
dollar. The company uses a sensitivity analysis to estimate the impact in its consolidated income statement and other comprehensive income of a strengthening or a weakening of the US dollar against the other group currencies. In case the open
positions remain unchanged and with all other variables held constant, a 10% strengthening or weakening of the US dollar against other currencies could lead to an estimated decrease/increase on the consolidated profit before tax of approximately 98m
US dollar over the next 12 months (31 December 2022: 144m US dollar). Applying a similar sensitivity on the total derivatives positions could lead to a negative/positive pre-tax impact on equity reserves of 504m US dollar (31 December 2022: 537m US
dollar). The results of the sensitivity analysis should not be considered as projections of likely future events, as the gains or losses from exchange rates in the future may differ due to developments in the global financial markets. Foreign
exchange risk on net investments in foreign operations AB InBev mitigates exposures of its investments in foreign operations using both derivative and non-derivative financial instruments as hedging instruments. As of 31 December 2023, designated
derivative financial instruments in net investment hedges applied on the company’s debt amount to 7 908m US dollar equivalent (31 December 2022: 8 482m US dollar). These instruments hedge foreign operations with Canadian dollar, Chinese yuan,
Mexican peso and South Korean won functional currencies. Net foreign exchange results Foreign exchange results recognized on hedged and unhedged exposures are as follows: Million US dollar 2023 2022 Hedged (economic hedges) 70 297 Not hedged (423)
(660) (353) (363) D) INTEREST RATE RISK The company applies a dynamic interest rate hedging approach whereby the target mix between fixed and floating rate debt is reviewed periodically. The purpose of AB InBev’s policy is to achieve an
optimal balance between the cost of funding and the volatility of financial results, while taking into account market conditions as well as AB InBev’s overall business strategy. Fair value hedges US dollar fixed rate bond hedges (interest rate
risk on borrowings in US dollar) The company manages and reduces the impact of changes in the US dollar interest rates on the fair value of certain fixed rate bonds with an aggregate principal amount of 0.6 billion US dollar through fixed/floating
interest rate swaps. These derivative instruments have been designated in fair value hedge accounting relationships. Cash flow hedges Pound sterling bond hedges (foreign currency risk and interest rate risk on borrowings in pound sterling) In
September 2013, the company issued a pound sterling bond for 500m pound sterling at a rate of 4.00% per year and maturing in September 2025. In May 2017, the company issued a pound sterling bond for 700m pound sterling at a rate of 2.25% per year
and maturing in May 2029, and issued a pound sterling bond for 900m pound sterling at a rate of 2.85% per year and maturing in May 2037. These bonds have a principal outstanding as of 31 December 2023 of 500m, 337m and 248m pound sterling,
respectively. AB InBev – Annual Report 2023 130
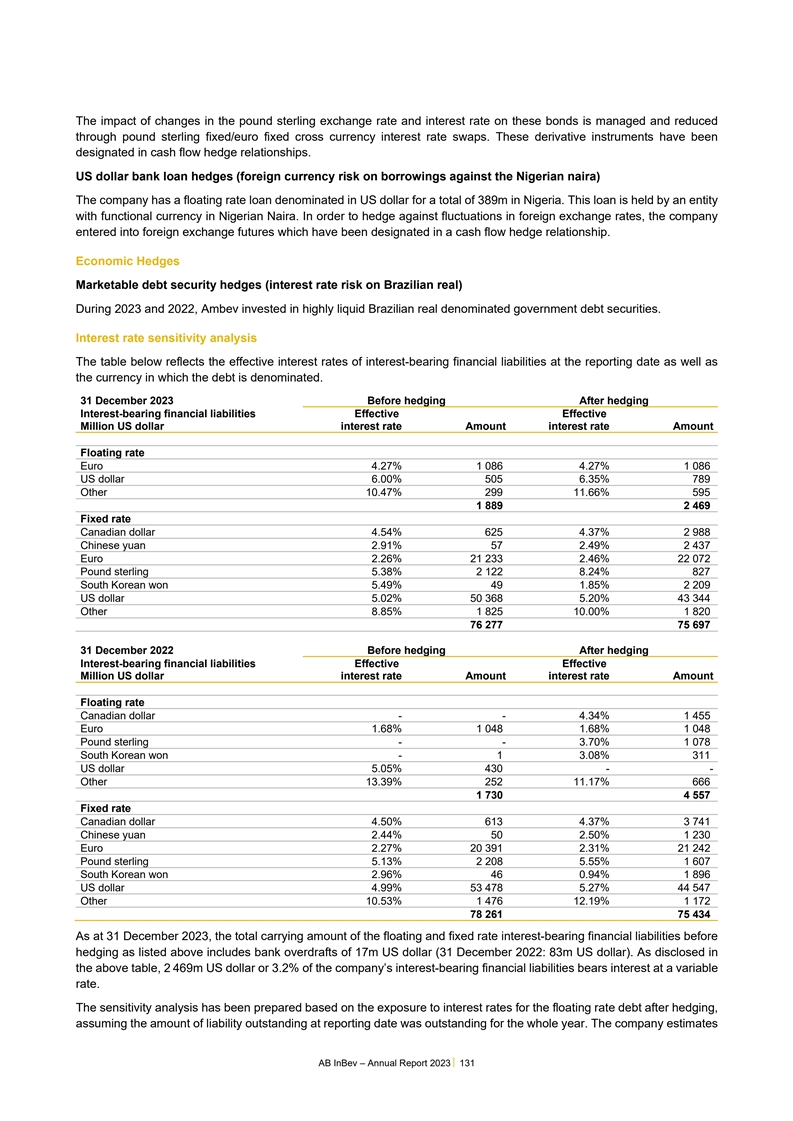
The impact of changes in the pound sterling exchange rate and interest
rate on these bonds is managed and reduced through pound sterling fixed/euro fixed cross currency interest rate swaps. These derivative instruments have been designated in cash flow hedge relationships. US dollar bank loan hedges (foreign currency
risk on borrowings against the Nigerian naira) The company has a floating rate loan denominated in US dollar for a total of 389m in Nigeria. This loan is held by an entity with functional currency in Nigerian Naira. In order to hedge against
fluctuations in foreign exchange rates, the company entered into foreign exchange futures which have been designated in a cash flow hedge relationship. Economic Hedges Marketable debt security hedges (interest rate risk on Brazilian real) During
2023 and 2022, Ambev invested in highly liquid Brazilian real denominated government debt securities. Interest rate sensitivity analysis The table below reflects the effective interest rates of interest-bearing financial liabilities at the reporting
date as well as the currency in which the debt is denominated. 31 December 2023 Before hedging After hedging Interest-bearing financial liabilities Effective Effective Million US dollar interest rate Amount interest rate Amount Floating rate Euro
4.27% 1 086 4.27% 1 086 US dollar 6.00% 505 6.35% 789 Other 10.47% 299 11.66% 595 1 889 2 469 Fixed rate Canadian dollar 4.54% 625 4.37% 2 988 Chinese yuan 2.91% 57 2.49% 2 437 Euro 2.26% 21 233 2.46% 22 072 Pound sterling 5.38% 2 122 8.24% 827
South Korean won 5.49% 49 1.85% 2 209 US dollar 5.02% 50 368 5.20% 43 344 Other 8.85% 1 825 10.00% 1 820 76 277 75 697 31 December 2022 Before hedging After hedging Interest-bearing financial liabilities Effective Effective Million US dollar
interest rate Amount interest rate Amount Floating rate Canadian dollar - - 4.34% 1 455 Euro 1.68% 1 048 1.68% 1 048 Pound sterling - - 3.70% 1 078 South Korean won - 1 3.08% 311 US dollar 5.05% 430 - - Other 13.39% 252 11.17% 666 1 730 4 557 Fixed
rate Canadian dollar 4.50% 613 4.37% 3 741 Chinese yuan 2.44% 50 2.50% 1 230 Euro 2.27% 20 391 2.31% 21 242 Pound sterling 5.13% 2 208 5.55% 1 607 South Korean won 2.96% 46 0.94% 1 896 US dollar 4.99% 53 478 5.27% 44 547 Other 10.53% 1 476 12.19% 1
172 78 261 75 434 As at 31 December 2023, the total carrying amount of the floating and fixed rate interest-bearing financial liabilities before hedging as listed above includes bank overdrafts of 17m US dollar (31 December 2022: 83m US dollar). As
disclosed in the above table, 2 469m US dollar or 3.2% of the company’s interest-bearing financial liabilities bears interest at a variable rate. The sensitivity analysis has been prepared based on the exposure to interest rates for the
floating rate debt after hedging, assuming the amount of liability outstanding at reporting date was outstanding for the whole year. The company estimates AB InBev – Annual Report 2023 131
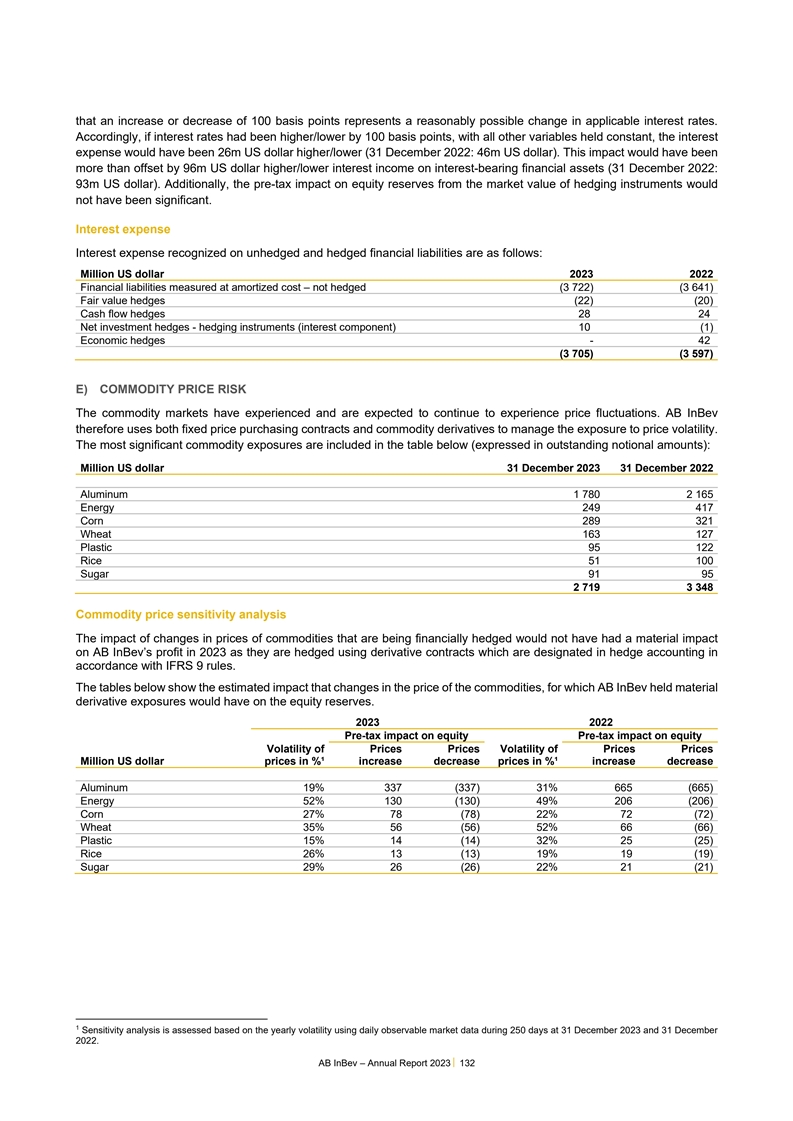
that an increase or decrease of 100 basis points represents a
reasonably possible change in applicable interest rates. Accordingly, if interest rates had been higher/lower by 100 basis points, with all other variables held constant, the interest expense would have been 26m US dollar higher/lower (31 December
2022: 46m US dollar). This impact would have been more than offset by 96m US dollar higher/lower interest income on interest-bearing financial assets (31 December 2022: 93m US dollar). Additionally, the pre-tax impact on equity reserves from the
market value of hedging instruments would not have been significant. Interest expense Interest expense recognized on unhedged and hedged financial liabilities are as follows: Million US dollar 2023 2022 Financial liabilities measured at amortized
cost – not hedged (3 722) (3 641) Fair value hedges (22) (20) Cash flow hedges 28 24 Net investment hedges - hedging instruments (interest component) 10 (1) Economic hedges - 42 (3 705) (3 597) E) COMMODITY PRICE RISK The commodity markets
have experienced and are expected to continue to experience price fluctuations. AB InBev therefore uses both fixed price purchasing contracts and commodity derivatives to manage the exposure to price volatility. The most significant commodity
exposures are included in the table below (expressed in outstanding notional amounts): Million US dollar 31 December 2023 31 December 2022 Aluminum 1 780 2 165 Energy 249 417 Corn 289 321 Wheat 163 127 Plastic 95 122 Rice 51 100 Sugar 91 95 2 719 3
348 Commodity price sensitivity analysis The impact of changes in prices of commodities that are being financially hedged would not have had a material impact on AB InBev’s profit in 2023 as they are hedged using derivative contracts which are
designated in hedge accounting in accordance with IFRS 9 rules. The tables below show the estimated impact that changes in the price of the commodities, for which AB InBev held material derivative exposures would have on the equity reserves.1 2023
2022 . Pre-tax impact on equity . Pre-tax impact on equity Volatility of Prices Prices Volatility of Prices Prices Million US dollar prices in %¹ increase decrease prices in %¹ increase decrease Aluminum 19% 337 (337) 31% 665 (665) Energy
52% 130 (130) 49% 206 (206) Corn 27% 78 (78) 22% 72 (72) Wheat 35% 56 (56) 52% 66 (66) Plastic 15% 14 (14) 32% 25 (25) Rice 26% 13 (13) 19% 19 (19) Sugar 29% 26 (26) 22% 21 (21) 1 Sensitivity analysis is assessed based on the yearly volatility using
daily observable market data during 250 days at 31 December 2023 and 31 December 2022. AB InBev – Annual Report 2023 132
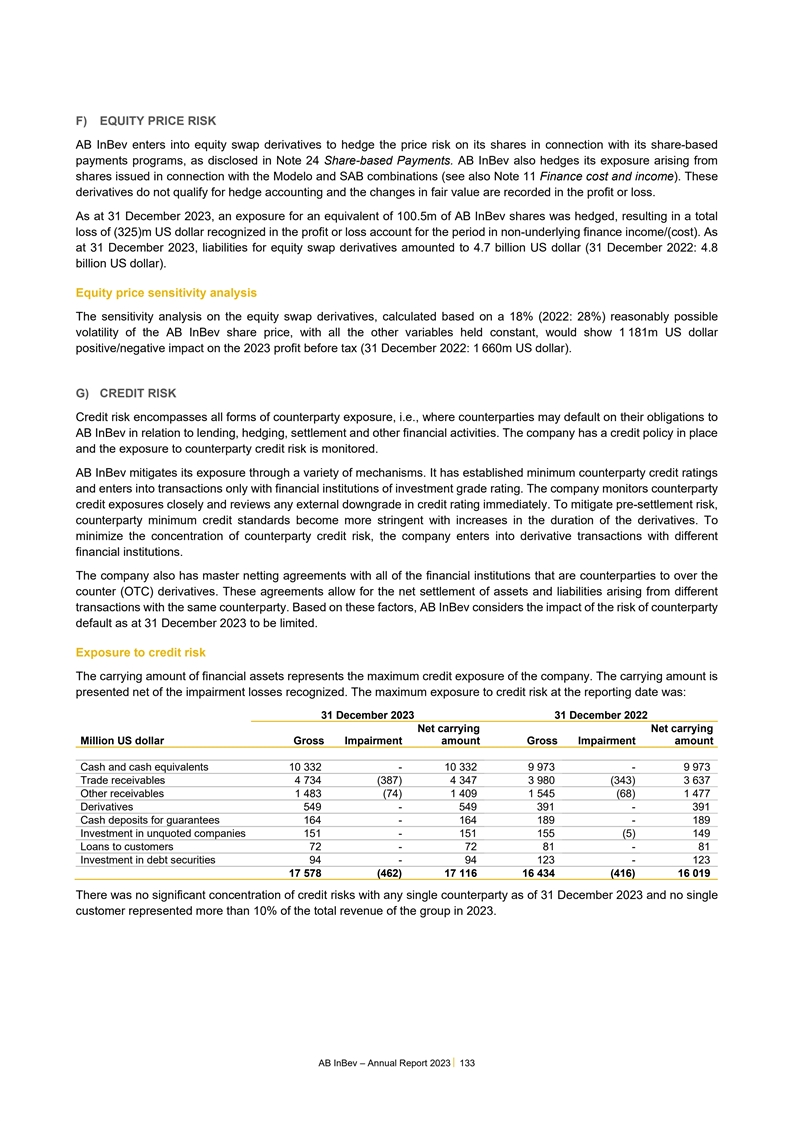
F) EQUITY PRICE RISK AB InBev enters into equity swap derivatives to
hedge the price risk on its shares in connection with its share-based payments programs, as disclosed in Note 24 Share-based Payments. AB InBev also hedges its exposure arising from shares issued in connection with the Modelo and SAB combinations
(see also Note 11 Finance cost and income). These derivatives do not qualify for hedge accounting and the changes in fair value are recorded in the profit or loss. As at 31 December 2023, an exposure for an equivalent of 100.5m of AB InBev shares
was hedged, resulting in a total loss of (325)m US dollar recognized in the profit or loss account for the period in non-underlying finance income/(cost). As at 31 December 2023, liabilities for equity swap derivatives amounted to 4.7 billion US
dollar (31 December 2022: 4.8 billion US dollar). Equity price sensitivity analysis The sensitivity analysis on the equity swap derivatives, calculated based on a 18% (2022: 28%) reasonably possible volatility of the AB InBev share price, with all
the other variables held constant, would show 1 181m US dollar positive/negative impact on the 2023 profit before tax (31 December 2022: 1 660m US dollar). G) CREDIT RISK Credit risk encompasses all forms of counterparty exposure, i.e., where
counterparties may default on their obligations to AB InBev in relation to lending, hedging, settlement and other financial activities. The company has a credit policy in place and the exposure to counterparty credit risk is monitored. AB InBev
mitigates its exposure through a variety of mechanisms. It has established minimum counterparty credit ratings and enters into transactions only with financial institutions of investment grade rating. The company monitors counterparty credit
exposures closely and reviews any external downgrade in credit rating immediately. To mitigate pre-settlement risk, counterparty minimum credit standards become more stringent with increases in the duration of the derivatives. To minimize the
concentration of counterparty credit risk, the company enters into derivative transactions with different financial institutions. The company also has master netting agreements with all of the financial institutions that are counterparties to over
the counter (OTC) derivatives. These agreements allow for the net settlement of assets and liabilities arising from different transactions with the same counterparty. Based on these factors, AB InBev considers the impact of the risk of counterparty
default as at 31 December 2023 to be limited. Exposure to credit risk The carrying amount of financial assets represents the maximum credit exposure of the company. The carrying amount is presented net of the impairment losses recognized. The
maximum exposure to credit risk at the reporting date was: 31 December 2023 31 December 2022 Net carrying Net carrying Million US dollar Gross Impairment amount Gross Impairment amount Cash and cash equivalents 10 332 - 10 332 9 973 - 9 973 Trade
receivables 4 734 (387) 4 347 3 980 (343) 3 637 Other receivables 1 483 (74) 1 409 1 545 (68) 1 477 Derivatives 549 - 549 391 - 391 Cash deposits for guarantees 164 - 164 189 - 189 Investment in unquoted companies 151 - 151 155 (5) 149 Loans to
customers 72 - 72 81 - 81 Investment in debt securities 94 - 94 123 - 123 17 578 (462) 17 116 16 434 (416) 16 019 There was no significant concentration of credit risks with any single counterparty as of 31 December 2023 and no single customer
represented more than 10% of the total revenue of the group in 2023. AB InBev – Annual Report 2023 133
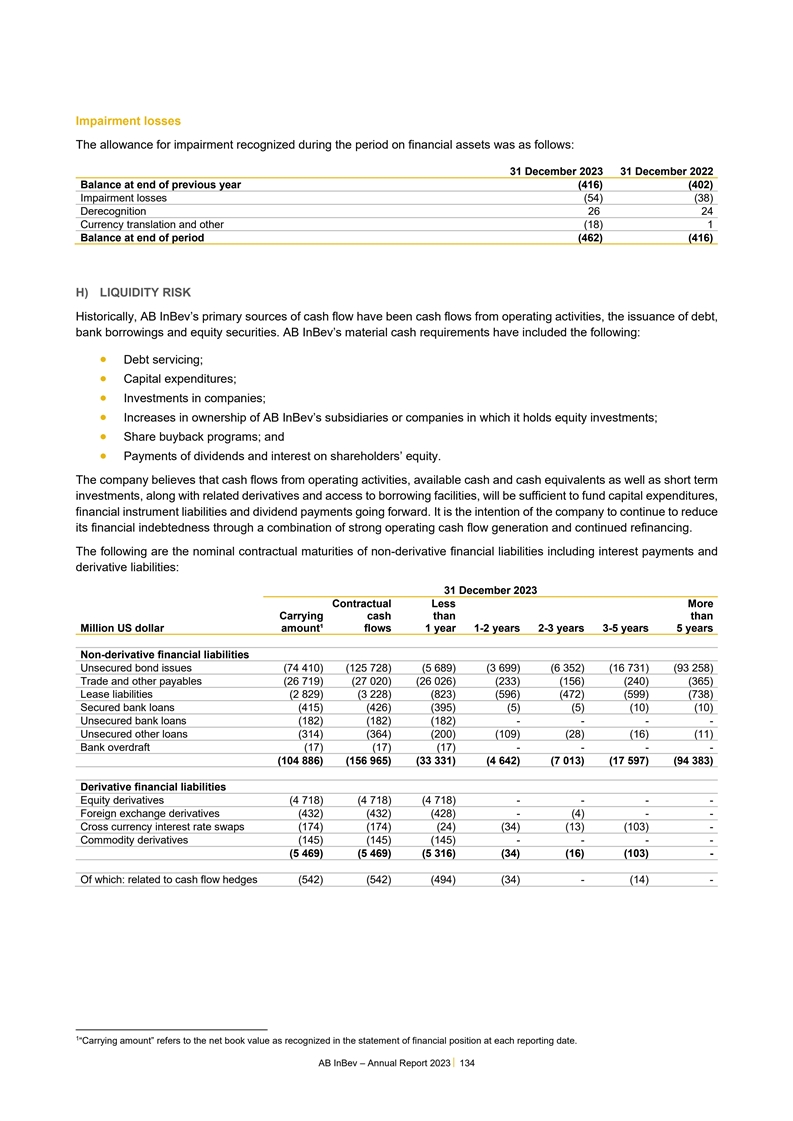
Impairment losses The allowance for impairment recognized during the
period on financial assets was as follows: 31 December 2023 31 December 2022 Balance at end of previous year (416) (402) Impairment losses (54) (38) Derecognition 26 24 Currency translation and other (18) 1 Balance at end of period (462) (416) H)
LIQUIDITY RISK Historically, AB InBev’s primary sources of cash flow have been cash flows from operating activities, the issuance of debt, bank borrowings and equity securities. AB InBev’s material cash requirements have included the
following: • Debt servicing; • Capital expenditures; • Investments in companies; • Increases in ownership of AB InBev’s subsidiaries or companies in which it holds equity investments; • Share buyback programs; and
• Payments of dividends and interest on shareholders’ equity. The company believes that cash flows from operating activities, available cash and cash equivalents as well as short term investments, along with related derivatives and
access to borrowing facilities, will be sufficient to fund capital expenditures, financial instrument liabilities and dividend payments going forward. It is the intention of the company to continue to reduce its financial indebtedness through a
combination of strong operating cash flow generation and continued refinancing. The following are the nominal contractual maturities of non-derivative financial liabilities including interest payments and 1 derivative liabilities: 31 December 2023
Contractual Less More Carrying cash than than Million US dollar amount¹ flows 1 year 1-2 years 2-3 years 3-5 years 5 years Non-derivative financial liabilities Unsecured bond issues (74 410) (125 728) (5 689) (3 699) (6 352) (16 731) (93 258)
Trade and other payables (26 719) (27 020) (26 026) (233) (156) (240) (365) Lease liabilities (2 829) (3 228) (823) (596) (472) (599) (738) Secured bank loans (415) (426) (395) (5) (5) (10) (10) Unsecured bank loans (182) (182) (182) - - - -
Unsecured other loans (314) (364) (200) (109) (28) (16) (11) Bank overdraft (17) (17) (17) - - - - (104 886) (156 965) (33 331) (4 642) (7 013) (17 597) (94 383) Derivative financial liabilities Equity derivatives (4 718) (4 718) (4 718) - - - -
Foreign exchange derivatives (432) (432) (428) - (4) - - Cross currency interest rate swaps (174) (174) (24) (34) (13) (103) - Commodity derivatives (145) (145) (145) - - - - (5 469) (5 469) (5 316) (34) (16) (103) - Of which: related to cash flow
hedges (542) (542) (494) (34) - (14) - 1 “Carrying amount” refers to the net book value as recognized in the statement of financial position at each reporting date. AB InBev – Annual Report 2023 134
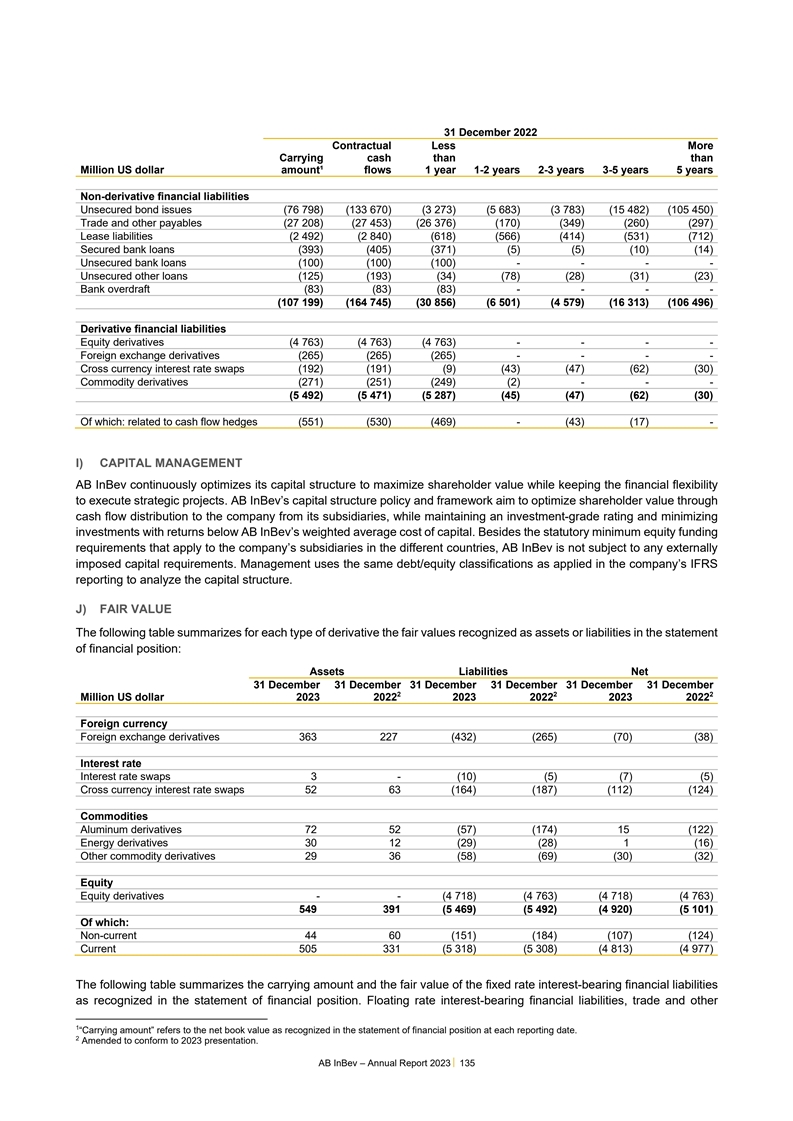
31 December 2022 Contractual Less More Carrying cash than than
Million US dollar amount¹ flows 1 year 1-2 years 2-3 years 3-5 years 5 years Non-derivative financial liabilities Unsecured bond issues (76 798) (133 670) (3 273) (5 683) (3 783) (15 482) (105 450) Trade and other payables (27 208) (27 453) (26
376) (170) (349) (260) (297) Lease liabilities (2 492) (2 840) (618) (566) (414) (531) (712) Secured bank loans (393) (405) (371) (5) (5) (10) (14) Unsecured bank loans (100) (100) (100) - - - - Unsecured other loans (125) (193) (34) (78) (28) (31)
(23) Bank overdraft (83) (83) (83) - - - - (107 199) (164 745) (30 856) (6 501) (4 579) (16 313) (106 496) Derivative financial liabilities Equity derivatives (4 763) (4 763) (4 763) - - - - Foreign exchange derivatives (265) (265) (265) - - - -
Cross currency interest rate swaps (192) (191) (9) (43) (47) (62) (30) Commodity derivatives (271) (251) (249) (2) - - - (5 492) (5 471) (5 287) (45) (47) (62) (30) Of which: related to cash flow hedges (551) (530) (469) - (43) (17) - I) CAPITAL
MANAGEMENT AB InBev continuously optimizes its capital structure to maximize shareholder value while keeping the financial flexibility to execute strategic projects. AB InBev’s capital structure policy and framework aim to optimize shareholder
value through cash flow distribution to the company from its subsidiaries, while maintaining an investment-grade rating and minimizing investments with returns below AB InBev’s weighted average cost of capital. Besides the statutory minimum
equity funding requirements that apply to the company’s subsidiaries in the different countries, AB InBev is not subject to any externally imposed capital requirements. Management uses the same debt/equity classifications as applied in the
company’s IFRS reporting to analyze the capital structure. J) FAIR VALUE The following table summarizes for each type of derivative the fair values recognized as assets or liabilities in the statement 1 of financial position: Assets
Liabilities Net 31 December 31 December 31 December 31 December 31 December 31 December 2 2 2 Million US dollar 2023 2022 2023 2022 2023 2022 Foreign currency Foreign exchange derivatives 363 227 (432) (265) (70) (38) Interest rate Interest rate
swaps 3 - (10) (5) (7) (5) Cross currency interest rate swaps 52 63 (164) (187) (112) (124) Commodities Aluminum derivatives 72 52 (57) (174) 15 (122) Energy derivatives 30 12 (29) (28) 1 (16) Other commodity derivatives 29 36 (58) (69) (30) (32)
Equity Equity derivatives - - (4 718) (4 763) (4 718) (4 763) 549 391 (5 469) (5 492) (4 920) (5 101) Of which: Non-current 44 60 (151) (184) (107) (124) Current 505 331 (5 318) (5 308) (4 813) (4 977) The following table summarizes the carrying
amount and the fair value of the fixed rate interest-bearing financial liabilities as recognized in the statement of financial position. Floating rate interest-bearing financial liabilities, trade and other 1 “Carrying amount” refers to
the net book value as recognized in the statement of financial position at each reporting date. 2 Amended to conform to 2023 presentation. AB InBev – Annual Report 2023 135
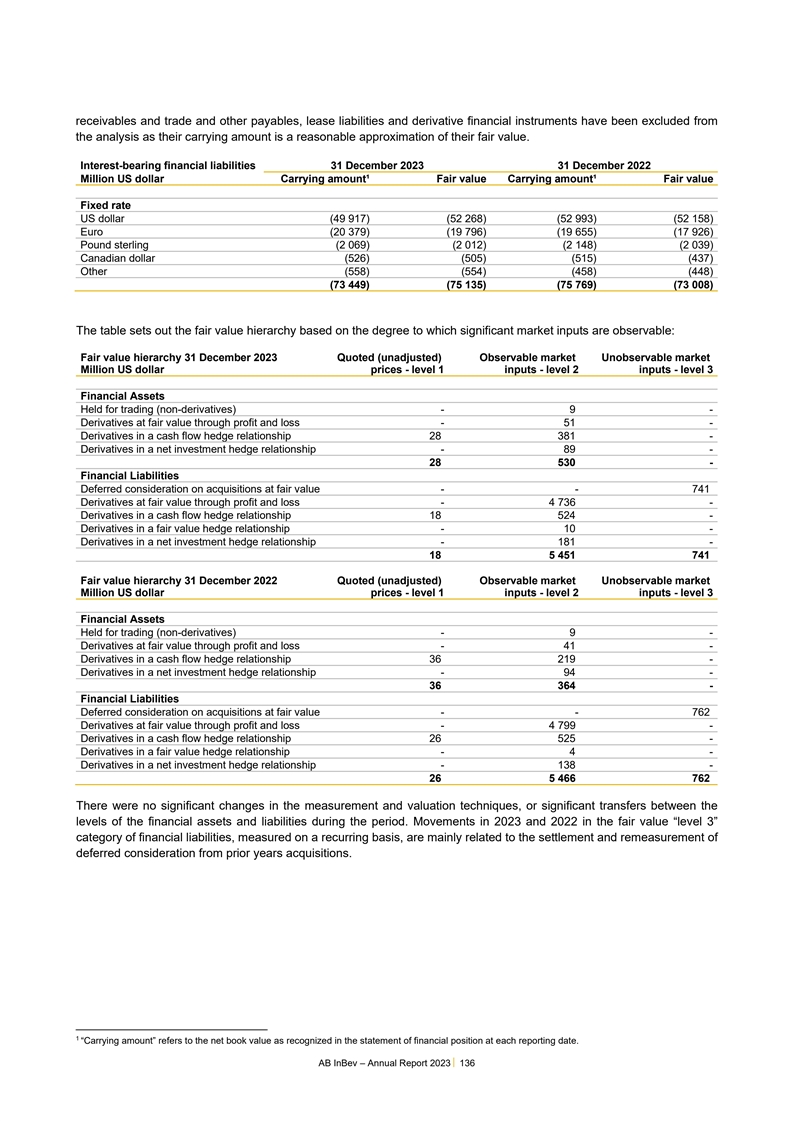
receivables and trade and other payables, lease liabilities and
derivative financial instruments have been excluded from the analysis as their carrying amount is a reasonable approximation of their fair value. Interest-bearing financial liabilities 31 December 2023 31 December 2022 Million US dollar Carrying
amount¹ Fair value Carrying amount¹ Fair value Fixed rate US dollar (49 917) (52 268) (52 993) (52 158) Euro (20 379) (19 796) (19 655) (17 926) Pound sterling (2 069) (2 012) (2 148) (2 039) Canadian dollar (526) (505) (515) (437) Other
(558) (554) (458) (448) (73 449) (75 135) (75 769) (73 008) 1 The table sets out the fair value hierarchy based on the degree to which significant market inputs are observable: Fair value hierarchy 31 December 2023 Quoted (unadjusted) Observable
market Unobservable market Million US dollar prices - level 1 inputs - level 2 inputs - level 3 Financial Assets Held for trading (non-derivatives) - 9 - Derivatives at fair value through profit and loss - 51 - Derivatives in a cash flow hedge
relationship 28 381 - Derivatives in a net investment hedge relationship - 89 - 28 530 - Financial Liabilities Deferred consideration on acquisitions at fair value - - 741 Derivatives at fair value through profit and loss - 4 736 - Derivatives in a
cash flow hedge relationship 18 524 - Derivatives in a fair value hedge relationship - 10 - Derivatives in a net investment hedge relationship - 181 - 18 5 451 741 Fair value hierarchy 31 December 2022 Quoted (unadjusted) Observable market
Unobservable market Million US dollar prices - level 1 inputs - level 2 inputs - level 3 Financial Assets Held for trading (non-derivatives) - 9 - Derivatives at fair value through profit and loss - 41 - Derivatives in a cash flow hedge relationship
36 219 - Derivatives in a net investment hedge relationship - 94 - 36 364 - Financial Liabilities Deferred consideration on acquisitions at fair value - - 762 Derivatives at fair value through profit and loss - 4 799 - Derivatives in a cash flow
hedge relationship 26 525 - Derivatives in a fair value hedge relationship - 4 - Derivatives in a net investment hedge relationship - 138 - 26 5 466 762 There were no significant changes in the measurement and valuation techniques, or significant
transfers between the levels of the financial assets and liabilities during the period. Movements in 2023 and 2022 in the fair value “level 3” category of financial liabilities, measured on a recurring basis, are mainly related to the
settlement and remeasurement of deferred consideration from prior years acquisitions. 1 “Carrying amount” refers to the net book value as recognized in the statement of financial position at each reporting date. AB InBev – Annual
Report 2023 136
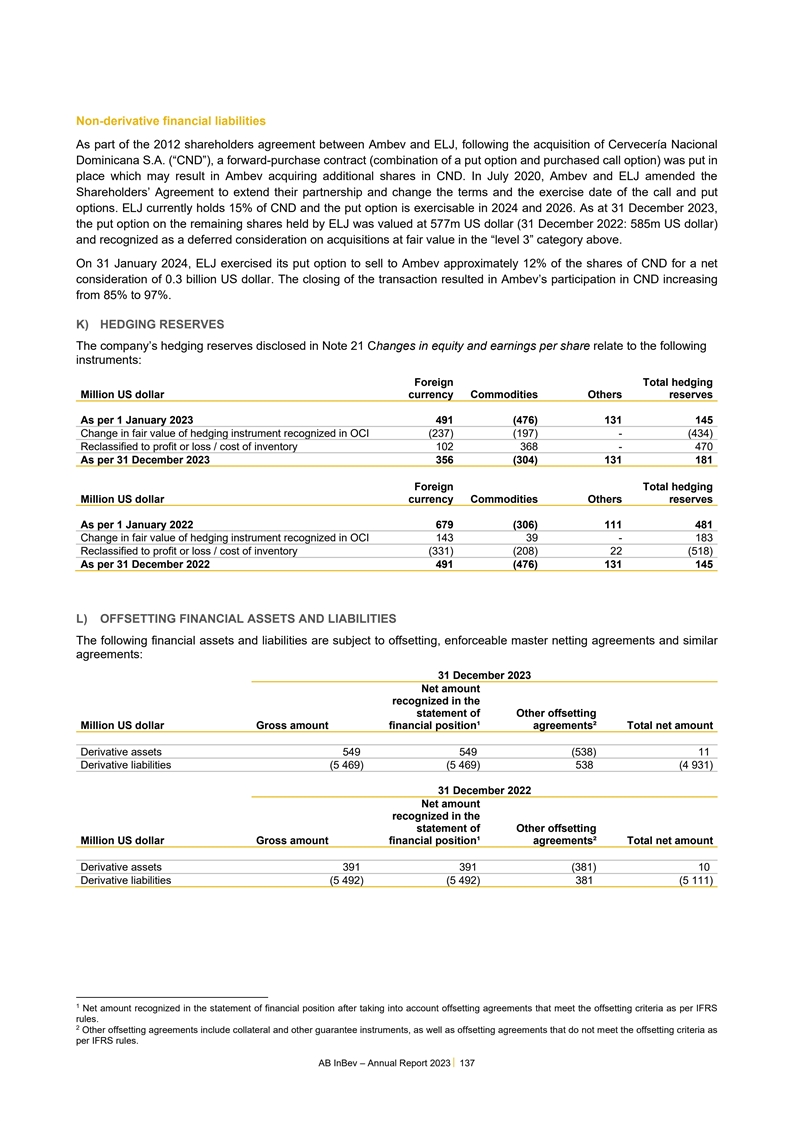
Non-derivative financial liabilities As part of the 2012 shareholders
agreement between Ambev and ELJ, following the acquisition of Cervecería Nacional Dominicana S.A. (“CND”), a forward-purchase contract (combination of a put option and purchased call option) was put in place which may result in
Ambev acquiring additional shares in CND. In July 2020, Ambev and ELJ amended the Shareholders’ Agreement to extend their partnership and change the terms and the exercise date of the call and put options. ELJ currently holds 15% of CND and
the put option is exercisable in 2024 and 2026. As at 31 December 2023, the put option on the remaining shares held by ELJ was valued at 577m US dollar (31 December 2022: 585m US dollar) and recognized as a deferred consideration on acquisitions at
fair value in the “level 3” category above. On 31 January 2024, ELJ exercised its put option to sell to Ambev approximately 12% of the shares of CND for a net consideration of 0.3 billion US dollar. The closing of the transaction
resulted in Ambev’s participation in CND increasing from 85% to 97%. K) HEDGING RESERVES The company’s hedging reserves disclosed in Note 21 Changes in equity and earnings per share relate to the following instruments: Foreign Total
hedging Million US dollar currency Commodities Others reserves As per 1 January 2023 491 (476) 131 145 Change in fair value of hedging instrument recognized in OCI (237) (197) - (434) Reclassified to profit or loss / cost of inventory 102 368 - 470
As per 31 December 2023 356 (304) 131 181 Foreign Total hedging Million US dollar currency Commodities Others reserves As per 1 January 2022 679 (306) 111 481 Change in fair value of hedging instrument recognized in OCI 143 39 - 183 Reclassified to
profit or loss / cost of inventory (331) (208) 22 (518) As per 31 December 2022 491 (476) 131 145 L) OFFSETTING FINANCIAL ASSETS AND LIABILITIES The following financial assets and liabilities are subject to offsetting, enforceable master netting
agreements and similar 12 agreements: 31 December 2023 Net amount recognized in the statement of Other offsetting Million US dollar Gross amount financial position¹ agreements² Total net amount Derivative assets 549 549 (538) 11 Derivative
liabilities (5 469) (5 469) 538 (4 931) 31 December 2022 Net amount recognized in the statement of Other offsetting Million US dollar Gross amount financial position¹ agreements² Total net amount Derivative assets 391 391 (381) 10
Derivative liabilities (5 492) (5 492) 381 (5 111) 1 Net amount recognized in the statement of financial position after taking into account offsetting agreements that meet the offsetting criteria as per IFRS rules. 2 Other offsetting agreements
include collateral and other guarantee instruments, as well as offsetting agreements that do not meet the offsetting criteria as per IFRS rules. AB InBev – Annual Report 2023 137
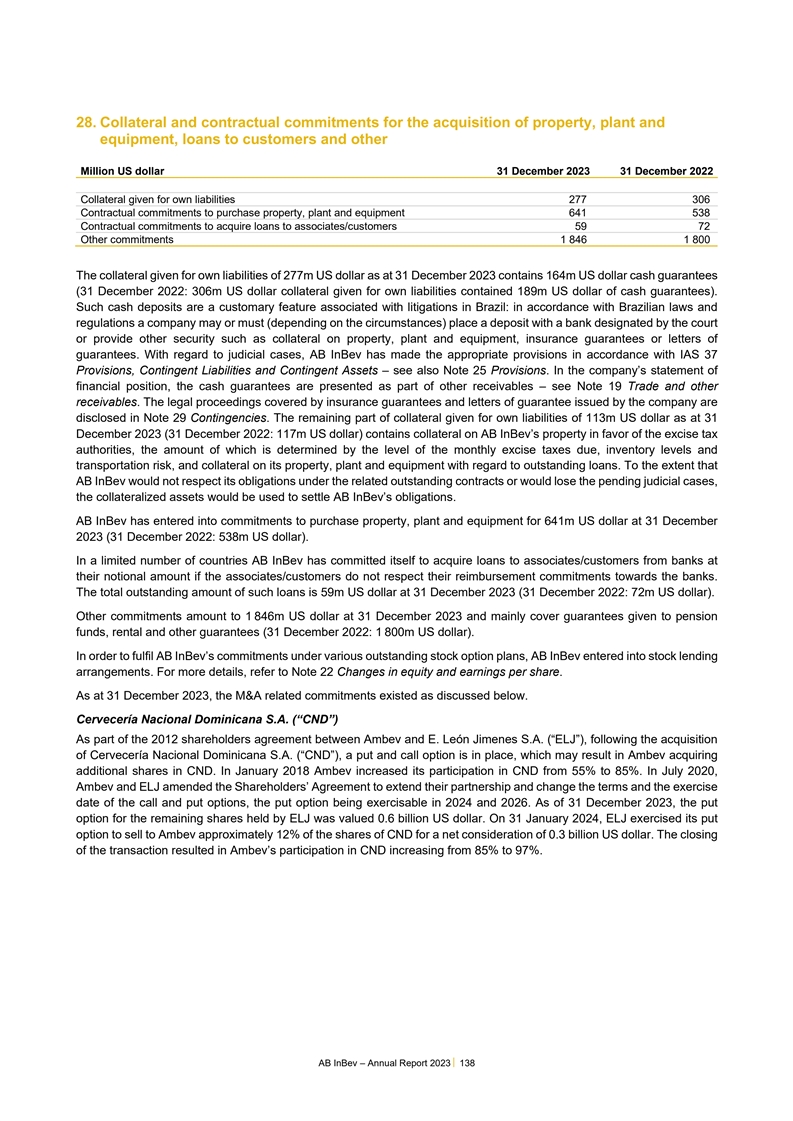
28. Collateral and contractual commitments for the acquisition of
property, plant and equipment, loans to customers and other Million US dollar 31 December 2023 31 December 2022 Collateral given for own liabilities 277 306 Contractual commitments to purchase property, plant and equipment 641 538 Contractual
commitments to acquire loans to associates/customers 59 72 Other commitments 1 846 1 800 The collateral given for own liabilities of 277m US dollar as at 31 December 2023 contains 164m US dollar cash guarantees (31 December 2022: 306m US dollar
collateral given for own liabilities contained 189m US dollar of cash guarantees). Such cash deposits are a customary feature associated with litigations in Brazil: in accordance with Brazilian laws and regulations a company may or must (depending
on the circumstances) place a deposit with a bank designated by the court or provide other security such as collateral on property, plant and equipment, insurance guarantees or letters of guarantees. With regard to judicial cases, AB InBev has made
the appropriate provisions in accordance with IAS 37 Provisions, Contingent Liabilities and Contingent Assets – see also Note 25 Provisions. In the company’s statement of financial position, the cash guarantees are presented as part of
other receivables – see Note 19 Trade and other receivables. The legal proceedings covered by insurance guarantees and letters of guarantee issued by the company are disclosed in Note 29 Contingencies. The remaining part of collateral given
for own liabilities of 113m US dollar as at 31 December 2023 (31 December 2022: 117m US dollar) contains collateral on AB InBev’s property in favor of the excise tax authorities, the amount of which is determined by the level of the monthly
excise taxes due, inventory levels and transportation risk, and collateral on its property, plant and equipment with regard to outstanding loans. To the extent that AB InBev would not respect its obligations under the related outstanding contracts
or would lose the pending judicial cases, the collateralized assets would be used to settle AB InBev’s obligations. AB InBev has entered into commitments to purchase property, plant and equipment for 641m US dollar at 31 December 2023 (31
December 2022: 538m US dollar). In a limited number of countries AB InBev has committed itself to acquire loans to associates/customers from banks at their notional amount if the associates/customers do not respect their reimbursement commitments
towards the banks. The total outstanding amount of such loans is 59m US dollar at 31 December 2023 (31 December 2022: 72m US dollar). Other commitments amount to 1 846m US dollar at 31 December 2023 and mainly cover guarantees given to pension
funds, rental and other guarantees (31 December 2022: 1 800m US dollar). In order to fulfil AB InBev’s commitments under various outstanding stock option plans, AB InBev entered into stock lending arrangements. For more details, refer to Note
22 Changes in equity and earnings per share. As at 31 December 2023, the M&A related commitments existed as discussed below. Cervecería Nacional Dominicana S.A. (“CND”) As part of the 2012 shareholders agreement between Ambev
and E. León Jimenes S.A. (“ELJ”), following the acquisition of Cervecería Nacional Dominicana S.A. (“CND”), a put and call option is in place, which may result in Ambev acquiring additional shares in CND. In January
2018 Ambev increased its participation in CND from 55% to 85%. In July 2020, Ambev and ELJ amended the Shareholders’ Agreement to extend their partnership and change the terms and the exercise date of the call and put options, the put option
being exercisable in 2024 and 2026. As of 31 December 2023, the put option for the remaining shares held by ELJ was valued 0.6 billion US dollar. On 31 January 2024, ELJ exercised its put option to sell to Ambev approximately 12% of the shares of
CND for a net consideration of 0.3 billion US dollar. The closing of the transaction resulted in Ambev’s participation in CND increasing from 85% to 97%. AB InBev – Annual Report 2023 138
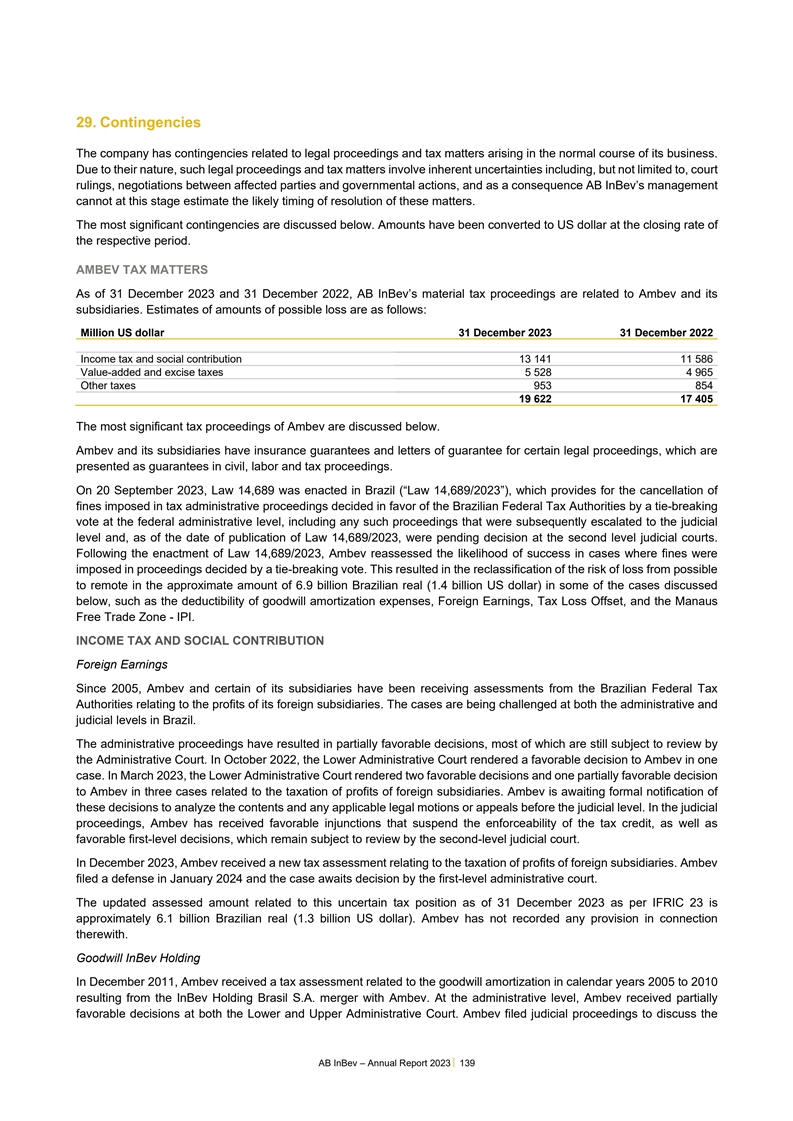
29. Contingencies The company has contingencies related to legal
proceedings and tax matters arising in the normal course of its business. Due to their nature, such legal proceedings and tax matters involve inherent uncertainties including, but not limited to, court rulings, negotiations between affected parties
and governmental actions, and as a consequence AB InBev’s management cannot at this stage estimate the likely timing of resolution of these matters. The most significant contingencies are discussed below. Amounts have been converted to US
dollar at the closing rate of the respective period. AMBEV TAX MATTERS As of 31 December 2023 and 31 December 2022, AB InBev’s material tax proceedings are related to Ambev and its subsidiaries. Estimates of amounts of possible loss are as
follows: Million US dollar 31 December 2023 31 December 2022 . Income tax and social contribution 13 141 11 586 Value-added and excise taxes 5 528 4 965 Other taxes 953 854 19 622 17 405 The most significant tax proceedings of Ambev are discussed
below. Ambev and its subsidiaries have insurance guarantees and letters of guarantee for certain legal proceedings, which are presented as guarantees in civil, labor and tax proceedings. On 20 September 2023, Law 14,689 was enacted in Brazil
(“Law 14,689/2023”), which provides for the cancellation of fines imposed in tax administrative proceedings decided in favor of the Brazilian Federal Tax Authorities by a tie-breaking vote at the federal administrative level, including
any such proceedings that were subsequently escalated to the judicial level and, as of the date of publication of Law 14,689/2023, were pending decision at the second level judicial courts. Following the enactment of Law 14,689/2023, Ambev
reassessed the likelihood of success in cases where fines were imposed in proceedings decided by a tie-breaking vote. This resulted in the reclassification of the risk of loss from possible to remote in the approximate amount of 6.9 billion
Brazilian real (1.4 billion US dollar) in some of the cases discussed below, such as the deductibility of goodwill amortization expenses, Foreign Earnings, Tax Loss Offset, and the Manaus Free Trade Zone - IPI. INCOME TAX AND SOCIAL CONTRIBUTION
Foreign Earnings Since 2005, Ambev and certain of its subsidiaries have been receiving assessments from the Brazilian Federal Tax Authorities relating to the profits of its foreign subsidiaries. The cases are being challenged at both the
administrative and judicial levels in Brazil. The administrative proceedings have resulted in partially favorable decisions, most of which are still subject to review by the Administrative Court. In October 2022, the Lower Administrative Court
rendered a favorable decision to Ambev in one case. In March 2023, the Lower Administrative Court rendered two favorable decisions and one partially favorable decision to Ambev in three cases related to the taxation of profits of foreign
subsidiaries. Ambev is awaiting formal notification of these decisions to analyze the contents and any applicable legal motions or appeals before the judicial level. In the judicial proceedings, Ambev has received favorable injunctions that suspend
the enforceability of the tax credit, as well as favorable first-level decisions, which remain subject to review by the second-level judicial court. In December 2023, Ambev received a new tax assessment relating to the taxation of profits of foreign
subsidiaries. Ambev filed a defense in January 2024 and the case awaits decision by the first-level administrative court. The updated assessed amount related to this uncertain tax position as of 31 December 2023 as per IFRIC 23 is approximately 6.1
billion Brazilian real (1.3 billion US dollar). Ambev has not recorded any provision in connection therewith. Goodwill InBev Holding In December 2011, Ambev received a tax assessment related to the goodwill amortization in calendar years 2005 to
2010 resulting from the InBev Holding Brasil S.A. merger with Ambev. At the administrative level, Ambev received partially favorable decisions at both the Lower and Upper Administrative Court. Ambev filed judicial proceedings to discuss the AB InBev
– Annual Report 2023 139
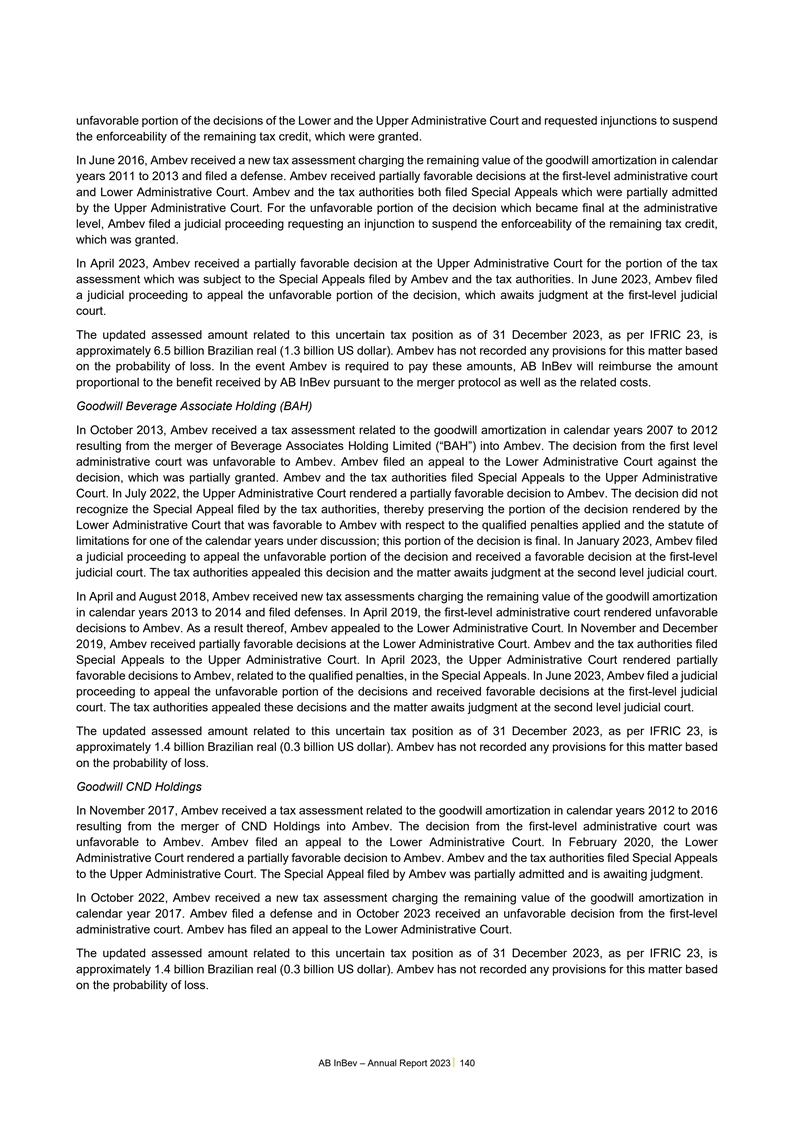
unfavorable portion of the decisions of the Lower and the Upper
Administrative Court and requested injunctions to suspend the enforceability of the remaining tax credit, which were granted. In June 2016, Ambev received a new tax assessment charging the remaining value of the goodwill amortization in calendar
years 2011 to 2013 and filed a defense. Ambev received partially favorable decisions at the first-level administrative court and Lower Administrative Court. Ambev and the tax authorities both filed Special Appeals which were partially admitted by
the Upper Administrative Court. For the unfavorable portion of the decision which became final at the administrative level, Ambev filed a judicial proceeding requesting an injunction to suspend the enforceability of the remaining tax credit, which
was granted. In April 2023, Ambev received a partially favorable decision at the Upper Administrative Court for the portion of the tax assessment which was subject to the Special Appeals filed by Ambev and the tax authorities. In June 2023, Ambev
filed a judicial proceeding to appeal the unfavorable portion of the decision, which awaits judgment at the first-level judicial court. The updated assessed amount related to this uncertain tax position as of 31 December 2023, as per IFRIC 23, is
approximately 6.5 billion Brazilian real (1.3 billion US dollar). Ambev has not recorded any provisions for this matter based on the probability of loss. In the event Ambev is required to pay these amounts, AB InBev will reimburse the amount
proportional to the benefit received by AB InBev pursuant to the merger protocol as well as the related costs. Goodwill Beverage Associate Holding (BAH) In October 2013, Ambev received a tax assessment related to the goodwill amortization in
calendar years 2007 to 2012 resulting from the merger of Beverage Associates Holding Limited (“BAH”) into Ambev. The decision from the first level administrative court was unfavorable to Ambev. Ambev filed an appeal to the Lower
Administrative Court against the decision, which was partially granted. Ambev and the tax authorities filed Special Appeals to the Upper Administrative Court. In July 2022, the Upper Administrative Court rendered a partially favorable decision to
Ambev. The decision did not recognize the Special Appeal filed by the tax authorities, thereby preserving the portion of the decision rendered by the Lower Administrative Court that was favorable to Ambev with respect to the qualified penalties
applied and the statute of limitations for one of the calendar years under discussion; this portion of the decision is final. In January 2023, Ambev filed a judicial proceeding to appeal the unfavorable portion of the decision and received a
favorable decision at the first-level judicial court. The tax authorities appealed this decision and the matter awaits judgment at the second level judicial court. In April and August 2018, Ambev received new tax assessments charging the remaining
value of the goodwill amortization in calendar years 2013 to 2014 and filed defenses. In April 2019, the first-level administrative court rendered unfavorable decisions to Ambev. As a result thereof, Ambev appealed to the Lower Administrative Court.
In November and December 2019, Ambev received partially favorable decisions at the Lower Administrative Court. Ambev and the tax authorities filed Special Appeals to the Upper Administrative Court. In April 2023, the Upper Administrative Court
rendered partially favorable decisions to Ambev, related to the qualified penalties, in the Special Appeals. In June 2023, Ambev filed a judicial proceeding to appeal the unfavorable portion of the decisions and received favorable decisions at the
first-level judicial court. The tax authorities appealed these decisions and the matter awaits judgment at the second level judicial court. The updated assessed amount related to this uncertain tax position as of 31 December 2023, as per IFRIC 23,
is approximately 1.4 billion Brazilian real (0.3 billion US dollar). Ambev has not recorded any provisions for this matter based on the probability of loss. Goodwill CND Holdings In November 2017, Ambev received a tax assessment related to the
goodwill amortization in calendar years 2012 to 2016 resulting from the merger of CND Holdings into Ambev. The decision from the first-level administrative court was unfavorable to Ambev. Ambev filed an appeal to the Lower Administrative Court. In
February 2020, the Lower Administrative Court rendered a partially favorable decision to Ambev. Ambev and the tax authorities filed Special Appeals to the Upper Administrative Court. The Special Appeal filed by Ambev was partially admitted and is
awaiting judgment. In October 2022, Ambev received a new tax assessment charging the remaining value of the goodwill amortization in calendar year 2017. Ambev filed a defense and in October 2023 received an unfavorable decision from the first-level
administrative court. Ambev has filed an appeal to the Lower Administrative Court. The updated assessed amount related to this uncertain tax position as of 31 December 2023, as per IFRIC 23, is approximately 1.4 billion Brazilian real (0.3 billion
US dollar). Ambev has not recorded any provisions for this matter based on the probability of loss. AB InBev – Annual Report 2023 140
Goodwill MAG In December 2022, CRBS S.A (a subsidiary of Ambev)
received a tax assessment related to the goodwill amortization in calendar years 2017 to 2020, resulting from the merger of RTD Barbados into CRBS. Ambev filed a defense in January 2023. In November 2023, Ambev received a partially favorable
decision from the first-level administrative court which reduced the qualified penalty applied to 100% (instead of 150% as initially charged). This decision is not final and is subject to review by the Lower Administrative Court. Ambev has filed an
appeal to the Lower Administrative Court against the unfavorable portion of the decision. The updated assessed amount related to this uncertain tax position as of 31 December 2023, as per IFRIC 23, is approximately 0.3 billion Brazilian real (0.1
billion US dollar). Ambev has not recorded any provisions for this matter based on the probability of loss. Ambev has continued to take the same deductions for the calendar years following the assessed periods (2021 to February 2022). Therefore, if
Ambev receives similar tax assessments for this period, Ambev management believes the outcome would be consistent with the already assessed periods. Disallowance of financial expenses In 2015, 2016 and 2020, Ambev received tax assessments related to
the disallowance of alleged non-deductible expenses and the deduction of certain losses mainly associated with financial investments and loans. Ambev presented defenses and, in November 2019, received a favorable decision at the first level
administrative court regarding the 2016 case, which was confirmed by the Upper Administrative Court in April 2023. In June 2021, Ambev received a partially favorable decision for the 2020 case at the first level administrative court and filed an
appeal to the Lower Administrative Court. In March 2023, Ambev received a favorable decision from the Lower Administrative Court, which fully canceled the tax assessment related to 2020, and this decision became final in May 2023. In June 2022,
Ambev received a partially favorable decision at the first level administrative court regarding the 2015 case and filed an appeal to the Lower Administrative Court. The favorable portion of the decision is also subject to mandatory review by the
Lower Administrative Court. The updated assessed amount related to this uncertain tax position as of 31 December 2023, as per IFRIC 23, is approximately 0.3 billion Brazilian real (0.1 billion US dollar). Ambev has not recorded any provisions for
this matter based on the probability of loss. Disallowance of tax paid abroad Since 2014, Ambev has been receiving tax assessments from the Brazilian Federal Tax Authorities, for calendar years as of 2007, related to the disallowance of deductions
associated with alleged unproven taxes paid abroad by its subsidiaries and has been filing defenses. The cases are being challenged at both the administrative and judicial levels. In November 2019, the Lower Administrative Court rendered a favorable
decision to Ambev in one of the cases (related to the 2010 tax period), which became definitive. In January 2020, the Lower Administrative Court rendered unfavorable decisions regarding four of these assessments related to the periods of 2015 and
2016, for which Ambev filed Special Appeals to the Upper Administrative Court. Ambev received unfavorable decisions at the Upper Administrative Court in respect of the Special Appeals in April 2023 and filed an appeal to the first-level judicial
court in November 2023. In connection with the tax assessments related to the periods of 2015 and 2016, additional tax assessments were filed to charge isolated fines due to the lack of monthly prepayments of income tax as a result of allegedly
undue deductions of taxes paid abroad. In 2021, Ambev received unfavorable decisions from the first-level administrative court in two of these assessments with respect to the 2015 and 2016 isolated fine cases, and filed appeals in connection
therewith, which are pending judgment by the Lower Administrative Court. In 2022, Ambev received an unfavorable decision from the first-level administrative court in the second assessment related to the 2016 isolated fine case and filed an appeal in
connection therewith which awaits judgment by the Lower Administrative Court. In October 2022, Ambev received a new tax assessment charging such isolated fine related to calendar year 2017. Ambev has filed a defense in this case, which awaits
judgment by the first-level administrative court. The other cases are still awaiting final decisions at both administrative and judicial courts. In November 2023, Ambev received a new tax assessment charging such isolated fine related to calendar
year 2018. Ambev has filed a defense in this case, which awaits judgment by the first-level administrative court. AB InBev – Annual Report 2023 141
The updated assessed amount related to this uncertain tax position as
of 31 December 2023, as per IFRIC 23, is approximately 14.3 billion Brazilian real (2.9 billion US dollar). Ambev has not recorded any provision in connection therewith. The company has continued to take the same deductions for the calendar years
following the assessed periods (2018 to 2023). Therefore, if Ambev receives similar tax assessments for this period, Ambev management believes the outcome would be the same as those tax years already assessed. Presumed Profit In April 2016, Arosuco
(a subsidiary of Ambev) received a tax assessment regarding the use of the “presumed profit” method for the calculation of income tax and the social contribution on net profits instead of the “real profit” method. In
September 2017, Arosuco received an unfavorable first-level administrative decision and filed an appeal. In January 2019, the Lower Administrative Court rendered a favorable decision to Arosuco, which became definitive. In March 2019, Arosuco
received a new tax assessment regarding the same subject and filed a defense. In October 2019, Arosuco received an unfavorable first-level administrative decision and filed an appeal with the Administrative Council for Tax Appeals
(“CARF”). The updated assessed amount related to this uncertain tax position as of 31 December 2023, as per IFRIC 23, is approximately 0.6 billion Brazilian real (0.1 billion US dollar). Arosuco has not recorded any provisions for this
matter based on the probability of loss. In February 2024, Arosuco received a unanimous favorable decision from CARF. Arosuco awaits formal notification of this decision to assess any potential impacts on the probability of loss and take any
additional necessary actions. Deductibility of IOC expenses In 2013, as approved in a Shareholders Meeting, Ambev implemented a corporate restructuring with the purpose of simplifying its corporate structure and converting into a single class of
shares company, among other reasons. One of the steps of such restructuring involved a contribution of shares followed by the merger of shares of its controlled entity, Companhia de Bebidas das Américas, into Ambev. As one of the results of
this restructuring, the counterpart register of the positive difference between the value of shares issued for the merger and the net equity value of its controlled entity’s share was accounted, as per IFRS 10/CPC 36 and ICPC09, in an equity
account of Ambev referred to as carrying value adjustment. In November 2019, Ambev received a tax assessment from the Brazilian Federal Tax Authorities related to the interest on capital (“IOC”) deduction in 2014. The assessment refers
primarily to the accounting and corporate effects of the restructuring carried out by Ambev in 2013 and its impact on the increase in the deductibility of IOC expenses. In August 2020, Ambev received a partially favorable decision at the first-level
administrative court and filed an appeal to the Lower Administrative Court, which awaits judgement. The favorable portion of the decision is subject to mandatory review by the Lower Administrative Court. In December 2020, Ambev received a new tax
assessment related to the deduction of the IOC in 2015 and 2016. Ambev filed a defense against this new tax assessment in January 2021. In June 2021, Ambev received a partially favorable decision and filed an appeal to the Lower Administrative
Court, which also awaits judgment. Similar to the first tax assessment, the favorable portion of the decision is also subject to mandatory review by the Lower Administrative Court. In December 2022, Ambev received a new tax assessment related to the
deduction of the IOC in 2017. Ambev filed a defense against this new tax assessment in January 2023. In September 2023, Ambev received a partially favorable decision at the first-level administrative court and filed an appeal to the Lower
Administrative Court against the unfavorable portion of the decision. The favorable portion of the decision is subject to mandatory review by the Lower Administrative Court. In November 2023, Ambev received a new tax assessment related to the
deduction of the IOC in the periods 2018 to 2021. Ambev has filed a defense against this new tax assessment, which is pending decision by the first-level administrative court. The updated assessed amount related to this uncertain tax position as of
31 December 2023, as per IFRIC 23, is approximately 27.4 billion Brazilian real (5.7 billion US dollar). Ambev has not recorded any provisions for this matter based on the probability of loss. The uncertain tax position, as per IFRIC 23, continued
to be adopted by Ambev as it also distributed or accrued IOC in the years following the assessed period (2022-2023) and deducted such amounts from its Corporate Income Taxes taxable basis. Therefore, in a scenario where the IOC deductibility would
also be questioned for the period after 2021, on the same AB InBev – Annual Report 2023 142
basis and arguments as the aforementioned tax assessments, Ambev
management estimates that the outcome of such potential further assessments would be consistent with the already assessed periods. In December 2023, Law No. 14,789/2023 (introduced in August 2023 as Provisional Measure No. 1,185), was enacted in
Brazil, which changed the calculation basis for interest on equity effective as of 1 January 2024. As a result, effective as of 1 January 2024, the uncertain tax treatment, as per IFRIC 23, is limited only to Corporate Income Taxes calculated in
accordance with rules and regulations in place prior to the enactment of Law No. 14,789/2023. Disallowance on Income Tax deduction In January 2020, Arosuco, a subsidiary of Ambev, received a tax assessment from the Brazilian Federal Tax Authorities
regarding the disallowance of the income tax reduction benefit provided for in Provisional Measure No. 2199-14/2001, for calendar years 2015 to 2018, and an administrative defense was filed. In October 2020, the first-level administrative court
rendered an unfavorable decision to Arosuco. Arosuco filed an appeal against the aforementioned decision. The updated assessed amount related to this uncertain tax position as of 31 December 2023, as per IFRIC 23, is approximately 2.6 billion
Brazilian real (0.5 billion US dollar). Ambev has not recorded any provisions for this matter based on the probability of loss. This uncertain tax position, as per IFRIC 23, continued to be applied by the Company impacting calendar years following
those assessed (2019-2023) in which it benefited from the income tax reduction provided for in Provisional Measure No. 2199-14/2001. In a scenario Arosuco is questioned on this matter for future periods, on the same basis and arguments as the
aforementioned tax assessment, Arosuco management estimates that the outcome of such potential further assessments would be consistent with the already assessed periods. In February 2024, Arosuco received a partially favorable, unanimous decision
from CARF, which partially granted the appeal filed by Arosuco. The decision recognizes Arosuco’s full enjoyment of the tax benefit reduction provided by Provisional Measure No. 2199-14/2001, and only requires payment of a portion of the
assessment related to the difference in calculation methodology between the tax authorities and Arosuco, as the taxpayer. The portion of the assessed amount as of 31 December 2023 related to the tax incentive is approximately 2.6 billion Brazilian
real (0.5 billion US dollar), and the portion related to the calculation difference is approximately 0.02 billion Brazilian real (5 million US dollar). Arosuco awaits formal notification of this decision to assess any potential impacts on the
probability of loss and take any additional necessary actions. Tax Loss Offset Ambev and certain of its subsidiaries received a number of assessments from the Brazilian Federal Tax Authorities relating to the offset of tax losses carried forward in
the context of business combinations. In February 2016, the Upper Administrative Court ruled unfavorably to Ambev in two of these cases, following which Ambev filed judicial proceedings. In September 2016, Ambev received a favorable first-level
decision in one of the judicial claims which was confirmed by the second-level judicial court in December 2022. This decision was appealed by the tax authorities. In March 2017, Ambev received an unfavorable first-level decision with respect to the
second judicial case and filed an appeal, which is pending judgment by the second-level judicial court. In a third case, Ambev received an unfavorable decision from the Lower Administrative Court in June 2019. Ambev filed an appeal to the Upper
Administrative Court, which was unfavorably decided against Ambev by a casting vote in February 2023. Due to the outcome of the judgment and considering the reductions provided for in Law No. 14,689/2023, Ambev opted to pay the assessment in
December 2023, with the corresponding reductions. The updated assessed amount related to this uncertain tax position as of 31 December 2023, as per IFRIC 23, is approximately 0.2 billion Brazilian real (0.1 billion US dollar). Ambev has not recorded
any provisions for this matter based on the probability of loss. ICMS VALUE ADDED TAX, EXCISE TAX (“IPI”) AND TAXES ON NET SALES Manaus Free Trade Zone – IPI / Social contributions In Brazil, goods manufactured within the Manaus
Free Trade Zone intended for remittance elsewhere in Brazil are exempt and/ or zero-rated from excise tax (“IPI”) and social contributions (“PIS/COFINS”). With respect to IPI, Ambev’s subsidiaries have been registering
IPI presumed tax credits upon the acquisition of exempted goods manufactured therein. Since 2009, Ambev has been receiving a number of tax assessments from the Brazilian Federal Tax Authorities relating to the disallowance of such credits. AB InBev
– Annual Report 2023 143
Ambev and its subsidiaries have also been receiving charges from the
Brazilian Federal Tax Authorities in relation to (i) federal taxes allegedly unduly offset with the disallowed presumed IPI excise tax credits that are under discussion in these proceedings and (ii) PIS/COFINS amounts allegedly due on
Arosuco’s remittance to Ambev subsidiaries. In April 2019, the Federal Supreme Court (“STF”) announced its judgment on Extraordinary Appeal No. 592.891/ /SP, with binding effect, deciding on the rights of taxpayers registering IPI
excise tax presumed credits on acquisitions of raw materials and exempted inputs originating from the Manaus Free Trade Zone. As a result of this decision, Ambev reclassified part of the amounts related to the IPI cases as remote losses maintaining
as possible losses only issues related to other additional discussions that were not included in the analysis of the STF. The cases are being challenged at both the administrative and judicial levels. Ambev management estimates the possible loss
related to these proceedings to be approximately 6.3 billion Brazilian real (1.3 billion US dollar) as of 31 December 2023. Ambev has not recorded any provision in connection therewith. IPI Suspension In 2014 and 2015, Ambev received tax assessments
from the Brazilian Federal Tax Authorities relating to IPI allegedly due over remittances of manufactured goods to other related factories. The cases are being challenged at both the administrative and judicial levels. In July 2022, Ambev received
the first judicial decision on this matter; the decision was unfavorable to Ambev and it filed an appeal. In July 2023, the Federal Court rendered its decision on the appeal, annulling the first level decision and ordering the production of
technical evidence as requested by Ambev in order to demonstrate the proper collection of IPI. The federal government has filed motions for clarification against this decision, which are pending judgment by the Federal Court. In October 2022, the
Upper Administrative Court rendered a partially favorable decision to Ambev in one of the cases related to this matter, which ordered a tax audit to determine the amount of the tax already effectively paid. The results of the tax audit, which were
notified in January 2024, were partially favorable to Ambev, reducing 98% of the amount alleged to be owed by Ambev in this case. Ambev will file an appeal at the judicial level against the unfavorable portion of the decision. Ambev management
estimates the possible loss related to these assessments to be approximately 1.8 billion Brazilian real (0.4 billion US dollar) as of 31 December 2023. Ambev has not recorded any provision in connection therewith. ICMS tax credits Ambev is currently
challenging tax assessments issued by the states of São Paulo, Rio de Janeiro, Minas Gerais, among others, questioning the legality of ICMS tax credits arising from transactions with companies that have tax incentives granted by other states.
The cases are being challenged at both the administrative and judicial level of the courts. In August 2020, the STF issued a binding decision (Extraordinary Appeal No. 628.075) ruling that tax credits granted by the states in the context of the ICMS
tax war shall be considered unlawful. The decision also recognized that the states should abide by the tax incentives validation process provided for in Complementary Law No. 160/17. This decision became final (and no longer subject to appeal) in
December 2021. With respect to the assessments issued by the State of São Paulo, Ambev received unfavorable decisions at the second administrative level in April, May and June 2022 and filed motions for reconsideration to the second
administrative level. In September 2023, Ambev received partially favorable decisions related to the motions for reconsideration. The favorable portion of those decisions became final and is not subject to appeal, while the unfavorable portion is
yet to be reviewed at the judicial level. In December 2023, the STF issued a binding decision (Claim of Non-compliance with a Fundamental Precept – ADPF No. 1004) holding that the unfavorable decisions regarding tax credits from the State of
Amazonas issued by the State of São Paulo in 2022 are unconstitutional. Therefore, even though Ambev is not part of this trial at the STF, the central discussion has generated a positive impact on the Company’s assessments. Ambev
management estimates the possible losses related to these assessments to be approximately 0.5 billion Brazilian real (0.1 billion US dollar) as of 31 December 2023. Ambev has not recorded any provision in connection therewith. In addition, in 2018
and 2021, Ambev received tax assessments from the States of Rio Grande do Sul and São Paulo charging alleged differences in ICMS due to the disallowance of credits arising from transactions with suppliers located in the Manaus Free Trade Zone.
With regard to the assessment issued by the State of Rio Grande do Sul, Ambev received a favorable judgment at the second administrative level, which was amended by the third administrative level in favor of the tax authorities. This decision is not
final and remains subject to appeal at the judicial level. With respect to the assessments issued by the State of São Paulo, Ambev received unfavorable decisions at the first administrative level. In these cases, Ambev has filed appeals at the
second administrative level. In one of these cases, Ambev received an unfavorable decision from the second-level administrative authority, which is not final and has been appealed at a third- AB InBev – Annual Report 2023 144
level authority. With regard to the other two cases, one is awaiting
judgment, and the first-instance decision issued in respect of the other was cancelled, requiring a new trial to be held. Ambev management estimates the possible losses related to these assessments to be approximately 0.8 billion Brazilian real (0.2
billion US dollar) as 31 December 2023. ICMS-ST Trigger Over the years, Ambev has received tax assessments to charge supposed ICMS differences considered due when the price of the products sold by Ambev is above the fixed price table basis
established by the relevant states, cases in which the state tax authorities contend that the calculation basis should be based on a value-added percentage over the actual prices and not the fixed table price. Ambev is currently challenging those
charges before the courts. The cases are being challenged at both the administrative and judicial levels. Ambev management estimates the total possible loss related to this issue to be approximately 10.7 billion Brazilian real (2.2 billion US
dollar) as of 31 December 2023. Ambev has not recorded any provision in connection therewith. SOCIAL CONTRIBUTIONS Since 2015, Ambev has received tax assessments issued by the Brazilian Federal Tax Authorities relating to PIS/COFINS amounts
allegedly due over bonus products granted to its customers. The cases are being challenged at both the administrative and judicial levels of the courts. In 2019, 2020 and 2023, Ambev received final favorable decisions at the administrative level in
some of these cases. In 2023, the Lower Administrative Court rendered favorable decisions to Ambev in two other cases and Ambev is awaiting formal notification of these decisions, which are not final and remain subject to appeal. At the judicial
level, one case is pending decision by the second level judicial court after the first-level judicial court rendered an unfavorable decision to Ambev. Ambev management estimates the possible loss related to these assessments to be approximately 1.8
billion Brazilian real (0.4 billion US dollar) as of 31 December 2023. Ambev has not recorded any provisions for this matter. AB INBEV’S TANZANIA TAX MATTERS Tanzania Breweries Limited (“TBL”), a subsidiary of AB InBev in Tanzania,
received a tax assessment for 850 billion Tanzanian shillings (0.3 billion US dollar) related to income tax on the alleged capital gain derived from the change in underlying ownership of TBL which the Tanzania Revenue Authority claims was more than
50% following the 2016 combination of SAB and AB InBev. TBL filed an appeal to the Tax Revenue Appeals Board. TBL believes that the assessment is without merit and will vigorously defend against the assessment. In accordance with IFRIC 23, no
related provision has been made. AB INBEV’S SOUTH AFRICA TAX MATTERS The South African Revenue Service (“SARS”) conducted an audit of AB InBev’s South African subsidiary, the South African Breweries (Pty) Ltd.
(“SAB”), in relation to the 2017 repurchase of SAB’s equity stake in Coca-Cola Beverages Africa (Pty) Ltd (“CCBA”), the Coca-Cola bottling business in Africa, by CCBA. The assessment from SARS claims that SAB owes 6.4
billion South African Rand (0.3 billion US dollar) in taxes plus penalties and interest, which as at the time of assessment totals 17.7 billion Rand (1 billion US dollar). The repurchase transaction also included an indemnity for certain tax
liabilities of CCBA. CCBA has notified SAB that CCBA has received an assessment from SARS for 8.9 billion Rand (0.5 billion US dollar). Both of these assessments are contested, but SAB may be required to secure or pre-pay some or all of the amounts
assessed, pending the outcome of the challenge and any appeal(s). In accordance with IFRIC 23, no related provision for these matters has been made based on the probability of loss. OTHER TAX MATTERS In February 2015, the European Commission opened
an in-depth state aid investigation into the Belgian excess profit ruling system. On 11 January 2016, the European Commission adopted a negative decision finding that the Belgian excess profit ruling system constitutes an aid scheme incompatible
with the internal market and ordering Belgium to recover the incompatible aid from a number of aid beneficiaries. The Belgian authorities contacted the companies that had benefitted from the system and advised each company of the amount of
incompatible aid that is potentially subject to recovery. The European Commission’s decision was appealed to the European Union’s General Court by Belgium on 22 March 2016 and by AB InBev on 12 July 2016. On 14 February 2019, the
European General Court concluded that the Belgian excess profit ruling system does not constitute illegal state aid. The European Commission appealed the judgment to the European Court of Justice. The public hearing in the framework of the appeal
proceedings took place on 24 September 2020 and AB InBev was heard as an intervening party. AB InBev – Annual Report 2023 145
On 3 December 2020, the Advocate General (AG) of the European Court of
Justice presented her non-binding opinion on the appeal procedure related to the 11 January 2016 opening decision, stating that, contrary to the 14 February 2019 judgment of the European General Court, the Belgian excess profit ruling system would
fulfil the legal requirements for an “aid scheme”. In the initial European General Court judgment, the court limited itself to finding the Belgian excess profit rulings were not an “aid scheme”, but did not consider whether
they constituted State aid. Consequently, the AG advised the European Court of Justice to refer the case back to the European General Court to review whether the Belgian excess profit rulings constitute State aid. On 16 September 2021, the European
Court of Justice agreed with the AG and concluded that the excess profit ruling system constitutes an aid scheme and set aside the judgment of the European General Court. The case was referred back to the European General Court to decide whether the
Belgian excess profit ruling system constitutes illegal State aid as well as the other remaining open issues in the appeal. On 20 September 2023, the European General Court upheld the European Commission’s decision. That judgment has been
appealed by AB InBev and other parties to the European Court of Justice. Following the initial annulment of the European Commission’s decision by the European General Court in 2019, the European Commission opened new state aid investigations
into the individual Belgian tax rulings, including the one issued to AB InBev in September 2019, to remedy the concerns that had led to the annulment. These investigations relate to the same rulings that were the subject of the European
Commission’s decision issued on 11 January 2016. AB InBev has filed its observations in respect of the opening decisions with the European Commission. On 28 October 2021, the European Commission stayed the new state aid investigations into the
individual Belgian tax rulings pending final resolution of the case. In addition, the Belgian tax authorities have also questioned the validity and the actual application of the excess profit ruling that was issued in favor of AB InBev and have
refused the actual tax exemption which it confers. AB InBev has filed a court claim against such decision before the Brussels court of first instance which ruled in favor of AB InBev on 21 June 2019, and again on 9 July 2021 for subsequent years.
The Belgian tax authorities appealed both judgments. In January 2019, AB InBev deposited 68 million euro (75 million US dollar) on a blocked account. Depending on the final outcome of the European Court procedures on the Belgian excess profit ruling
system, as well as the pending Belgian court cases, this amount will either be slightly modified, or released back to the company or paid over to the Belgian State. In connection with the European Court procedures, AB InBev recognized a provision of
68 million euro (75 million US dollar) in 2020. CERBUCO BREWING ARBITRATION Cerbuco Brewing Inc., (“Cerbuco”) a Canadian subsidiary of Ambev, owns a 50% equity ownership in Cerveceria Bucanero S.A. (“Bucanero”), a joint
venture in Cuba. In 2021, Cerbuco initiated an arbitration proceeding at the International Chamber of Commerce (“ICC”), relating to the potential breach of certain obligations relating to the joint venture, with the terms of reference
being formally executed in 2022. Depending on the outcome of the arbitration, there may be an impact on Cerbuco’s rights. As a result, Ambev’s ability to continue consolidating Bucanero into its financial statements may also be affected.
The financial impact has not yet been ascertained, as it depends on the outcome of the arbitration. WARRANTS Certain holders of warrants issued by Ambev in 1996 for exercise in 2003 proposed lawsuits to subscribe correspondent shares for an amount
lower than Ambev considers as established upon the warrant issuance. The holders of these warrants claimed that they should receive the dividends relative to these shares since 2003, approximately 1.2 billion Brazilian real (0.2 billion US dollar)
in addition to legal fees. Among the seven cases related to this topic, one was settled in previous years. Five cases have been finally resolved favorably to Ambev, with three of these decided in the second quarter of 2023. The last case was ruled
favorably to Ambev by the Superior Court of Justice and the decision became final in September 2023. With the closure of the last case, this litigation has ended completely in favor of the Company. No provisions have been made in connection with
this litigation. PROPOSED CLASS ACTION IN QUEBEC Labatt and other third-party defendants have been named in a proposed class action lawsuit in the Superior Court of Quebec seeking unquantified compensatory and punitive damages. The plaintiffs allege
that the defendants failed to warn of certain specific health risks of consuming defendants’ alcoholic beverages. A sub-class of plaintiffs further alleges that their diseases were caused by the consumption of defendants’ products. The
proposed class action has not yet been authorized by the Superior Court. AB InBev – Annual Report 2023 146
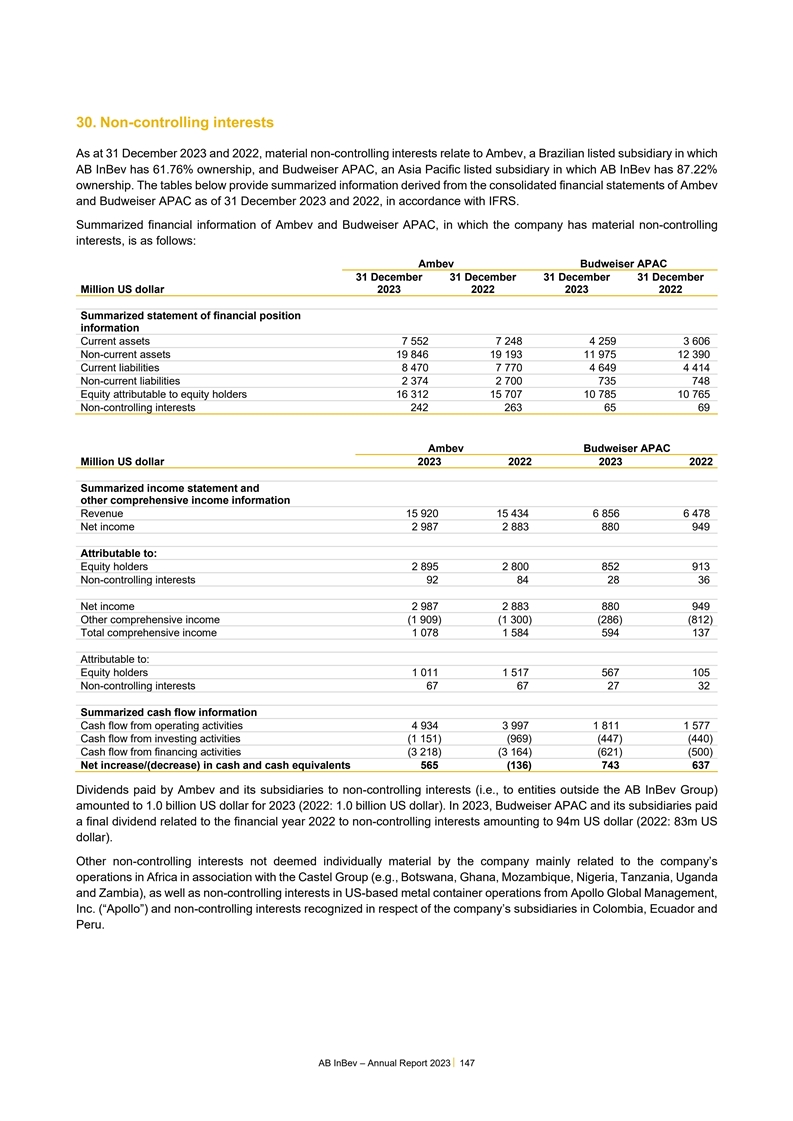
30. Non-controlling interests As at 31 December 2023 and 2022,
material non-controlling interests relate to Ambev, a Brazilian listed subsidiary in which AB InBev has 61.76% ownership, and Budweiser APAC, an Asia Pacific listed subsidiary in which AB InBev has 87.22% ownership. The tables below provide
summarized information derived from the consolidated financial statements of Ambev and Budweiser APAC as of 31 December 2023 and 2022, in accordance with IFRS. Summarized financial information of Ambev and Budweiser APAC, in which the company has
material non-controlling interests, is as follows: Ambev Budweiser APAC 31 December 31 December 31 December 31 December Million US dollar 2023 2022 2023 2022 Summarized statement of financial position information Current assets 7 552 7 248 4 259 3
606 Non-current assets 19 846 19 193 11 975 12 390 Current liabilities 8 470 7 770 4 649 4 414 Non-current liabilities 2 374 2 700 735 748 Equity attributable to equity holders 16 312 15 707 10 785 10 765 Non-controlling interests 242 263 65 69
Ambev Budweiser APAC Million US dollar 2023 2022 2023 2022 Summarized income statement and other comprehensive income information Revenue 15 920 15 434 6 856 6 478 Net income 2 987 2 883 880 949 Attributable to: Equity holders 2 895 2 800 852 913
Non-controlling interests 92 84 28 36 Net income 2 987 2 883 880 949 Other comprehensive income (1 909) (1 300) (286) (812) Total comprehensive income 1 078 1 584 594 137 Attributable to: Equity holders 1 011 1 517 567 105 Non-controlling interests
67 67 27 32 Summarized cash flow information Cash flow from operating activities 4 934 3 997 1 811 1 577 Cash flow from investing activities (1 151) (969) (447) (440) Cash flow from financing activities (3 218) (3 164) (621) (500) Net
increase/(decrease) in cash and cash equivalents 565 (136) 743 637 Dividends paid by Ambev and its subsidiaries to non-controlling interests (i.e., to entities outside the AB InBev Group) amounted to 1.0 billion US dollar for 2023 (2022: 1.0 billion
US dollar). In 2023, Budweiser APAC and its subsidiaries paid a final dividend related to the financial year 2022 to non-controlling interests amounting to 94m US dollar (2022: 83m US dollar). Other non-controlling interests not deemed individually
material by the company mainly related to the company’s operations in Africa in association with the Castel Group (e.g., Botswana, Ghana, Mozambique, Nigeria, Tanzania, Uganda and Zambia), as well as non-controlling interests in US-based metal
container operations from Apollo Global Management, Inc. (“Apollo”) and non-controlling interests recognized in respect of the company’s subsidiaries in Colombia, Ecuador and Peru. AB InBev – Annual Report 2023 147
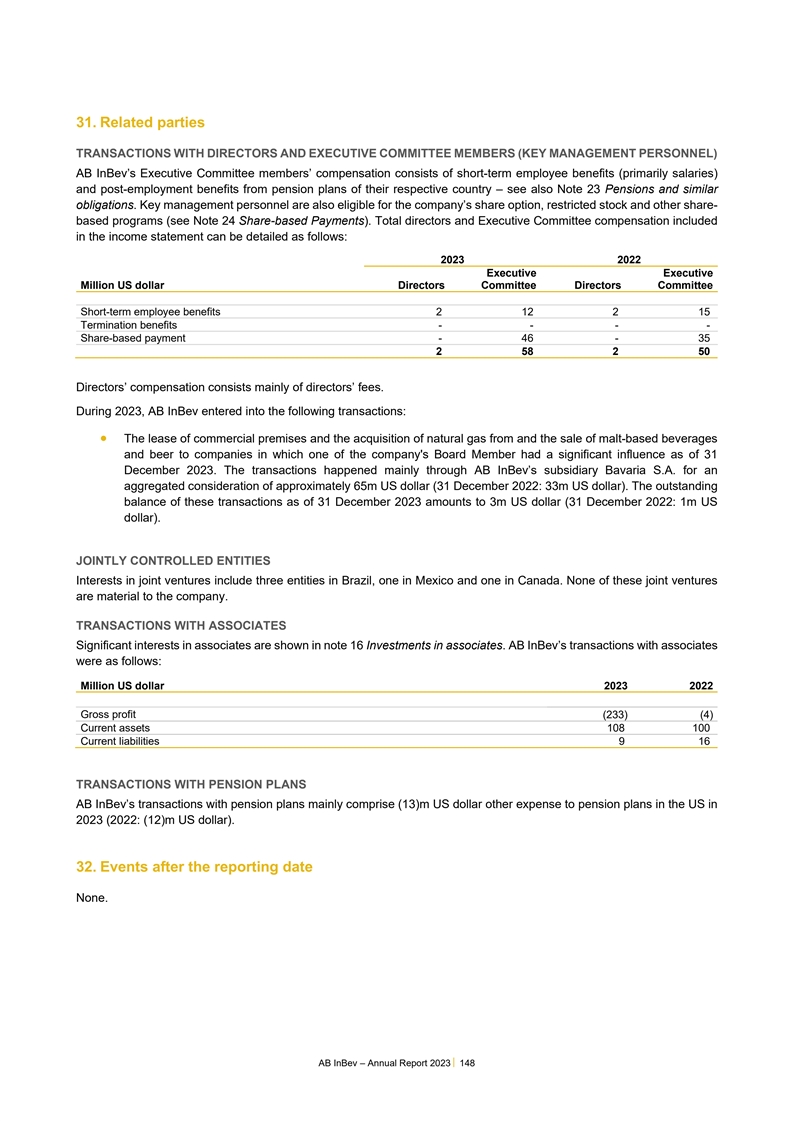
31. Related parties TRANSACTIONS WITH DIRECTORS AND EXECUTIVE
COMMITTEE MEMBERS (KEY MANAGEMENT PERSONNEL) AB InBev’s Executive Committee members’ compensation consists of short-term employee benefits (primarily salaries) and post-employment benefits from pension plans of their respective country
– see also Note 23 Pensions and similar obligations. Key management personnel are also eligible for the company’s share option, restricted stock and other share- based programs (see Note 24 Share-based Payments). Total directors and
Executive Committee compensation included in the income statement can be detailed as follows: 2023 2022 Executive Executive Million US dollar Directors Committee Directors Committee Short-term employee benefits 2 12 2 15 Termination benefits - - - -
Share-based payment - 46 - 35 2 58 2 50 Directors’ compensation consists mainly of directors’ fees. During 2023, AB InBev entered into the following transactions: • The lease of commercial premises and the acquisition of natural
gas from and the sale of malt-based beverages and beer to companies in which one of the company's Board Member had a significant influence as of 31 December 2023. The transactions happened mainly through AB InBev’s subsidiary Bavaria S.A. for
an aggregated consideration of approximately 65m US dollar (31 December 2022: 33m US dollar). The outstanding balance of these transactions as of 31 December 2023 amounts to 3m US dollar (31 December 2022: 1m US dollar). JOINTLY CONTROLLED ENTITIES
Interests in joint ventures include three entities in Brazil, one in Mexico and one in Canada. None of these joint ventures are material to the company. TRANSACTIONS WITH ASSOCIATES Significant interests in associates are shown in note 16
Investments in associates. AB InBev’s transactions with associates were as follows: Million US dollar 2023 2022 . Gross profit (233) (4) Current assets 108 100 Current liabilities 9 16 TRANSACTIONS WITH PENSION PLANS AB InBev’s
transactions with pension plans mainly comprise (13)m US dollar other expense to pension plans in the US in 2023 (2022: (12)m US dollar). 32. Events after the reporting date None. AB InBev – Annual Report 2023 148
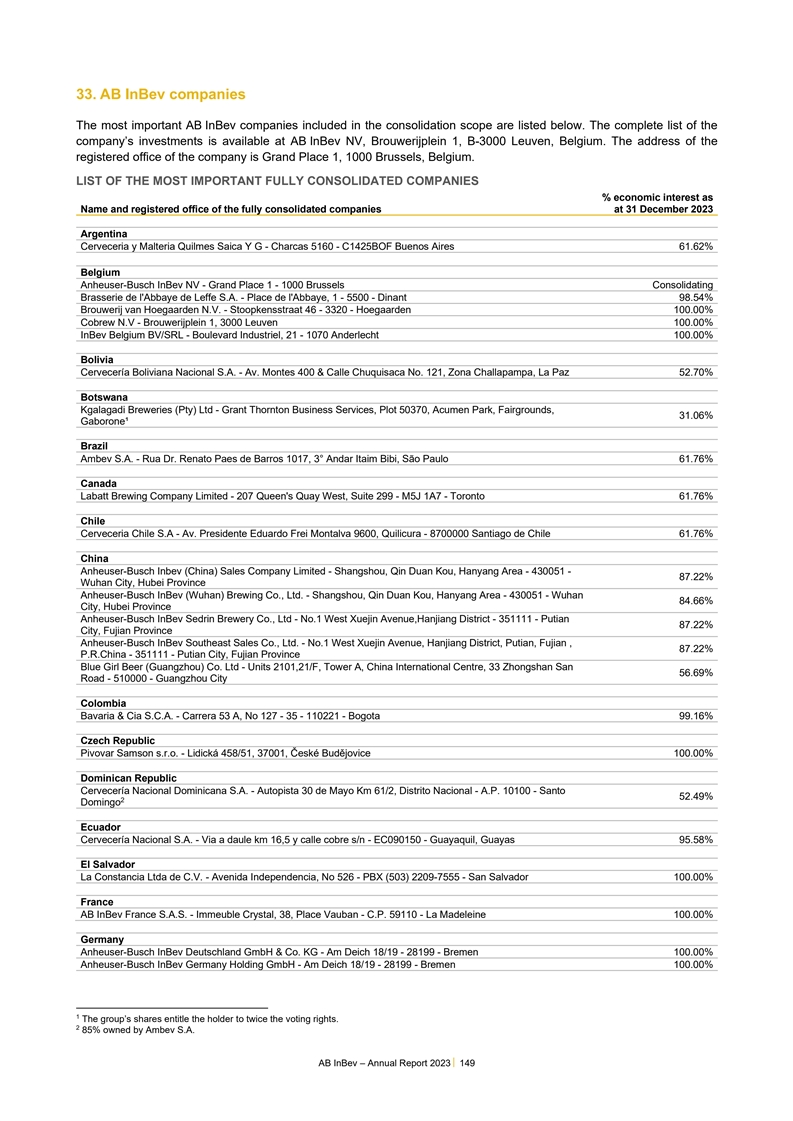
33. AB InBev companies The most important AB InBev companies included
in the consolidation scope are listed below. The complete list of the company’s investments is available at AB InBev NV, Brouwerijplein 1, B-3000 Leuven, Belgium. The address of the registered office of the company is Grand Place 1, 1000
Brussels, Belgium. 1 LIST OF THE MOST IMPORTANT FULLY CONSOLIDATED COMPANIES % economic interest as Name and registered office of the fully consolidated companies at 31 December 2023 . Argentina Cerveceria y Malteria Quilmes Saica Y G - Charcas 5160
- C1425BOF Buenos Aires 61.62% . Belgium Anheuser-Busch InBev NV - Grand Place 1 - 1000 Brussels Consolidating Brasserie de l'Abbaye de Leffe S.A. - Place de l'Abbaye, 1 - 5500 - Dinant 98.54% Brouwerij van Hoegaarden N.V. - Stoopkensstraat 46 -
3320 - Hoegaarden 100.00% Cobrew N.V - Brouwerijplein 1, 3000 Leuven 100.00% InBev Belgium BV/SRL - Boulevard Industriel, 21 - 1070 Anderlecht 100.00% . Bolivia Cervecería Boliviana Nacional S.A. - Av. Montes 400 & Calle Chuquisaca No. 121,
Zona Challapampa, La Paz 52.70% . Botswana Kgalagadi Breweries (Pty) Ltd - Grant Thornton Business Services, Plot 50370, Acumen Park, Fairgrounds, 31.06% Gaborone¹ . Brazil Ambev S.A. - Rua Dr. Renato Paes de Barros 1017, 3° Andar Itaim
Bibi, São Paulo 61.76% . Canada Labatt Brewing Company Limited - 207 Queen's Quay West, Suite 299 - M5J 1A7 - Toronto 61.76% . Chile Cerveceria Chile S.A - Av. Presidente Eduardo Frei Montalva 9600, Quilicura - 8700000 Santiago de Chile 61.76%
.. China Anheuser-Busch Inbev (China) Sales Company Limited - Shangshou, Qin Duan Kou, Hanyang Area - 430051 - 87.22% Wuhan City, Hubei Province Anheuser-Busch InBev (Wuhan) Brewing Co., Ltd. - Shangshou, Qin Duan Kou, Hanyang Area - 430051 - Wuhan
84.66% City, Hubei Province Anheuser-Busch InBev Sedrin Brewery Co., Ltd - No.1 West Xuejin Avenue,Hanjiang District - 351111 - Putian 87.22% City, Fujian Province Anheuser-Busch InBev Southeast Sales Co., Ltd. - No.1 West Xuejin Avenue, Hanjiang
District, Putian, Fujian , 87.22% P.R.China - 351111 - Putian City, Fujian Province Blue Girl Beer (Guangzhou) Co. Ltd - Units 2101,21/F, Tower A, China International Centre, 33 Zhongshan San 56.69% Road - 510000 - Guangzhou City . Colombia Bavaria
& Cia S.C.A. - Carrera 53 A, No 127 - 35 - 110221 - Bogota 99.16% . Czech Republic Pivovar Samson s.r.o. - Lidická 458/51, 37001, České Budějovice 100.00% . Dominican Republic Cervecería Nacional Dominicana S.A. -
Autopista 30 de Mayo Km 61/2, Distrito Nacional - A.P. 10100 - Santo 52.49% 2 Domingo . Ecuador Cervecería Nacional S.A. - Via a daule km 16,5 y calle cobre s/n - EC090150 - Guayaquil, Guayas 95.58% . El Salvador La Constancia Ltda de C.V. -
Avenida Independencia, No 526 - PBX (503) 2209-7555 - San Salvador 100.00% . France AB InBev France S.A.S. - Immeuble Crystal, 38, Place Vauban - C.P. 59110 - La Madeleine 100.00% 2 Germany Anheuser-Busch InBev Deutschland GmbH & Co. KG - Am
Deich 18/19 - 28199 - Bremen 100.00% Anheuser-Busch InBev Germany Holding GmbH - Am Deich 18/19 - 28199 - Bremen 100.00% . 1 The group’s shares entitle the holder to twice the voting rights. 2 85% owned by Ambev S.A. AB InBev – Annual
Report 2023 149
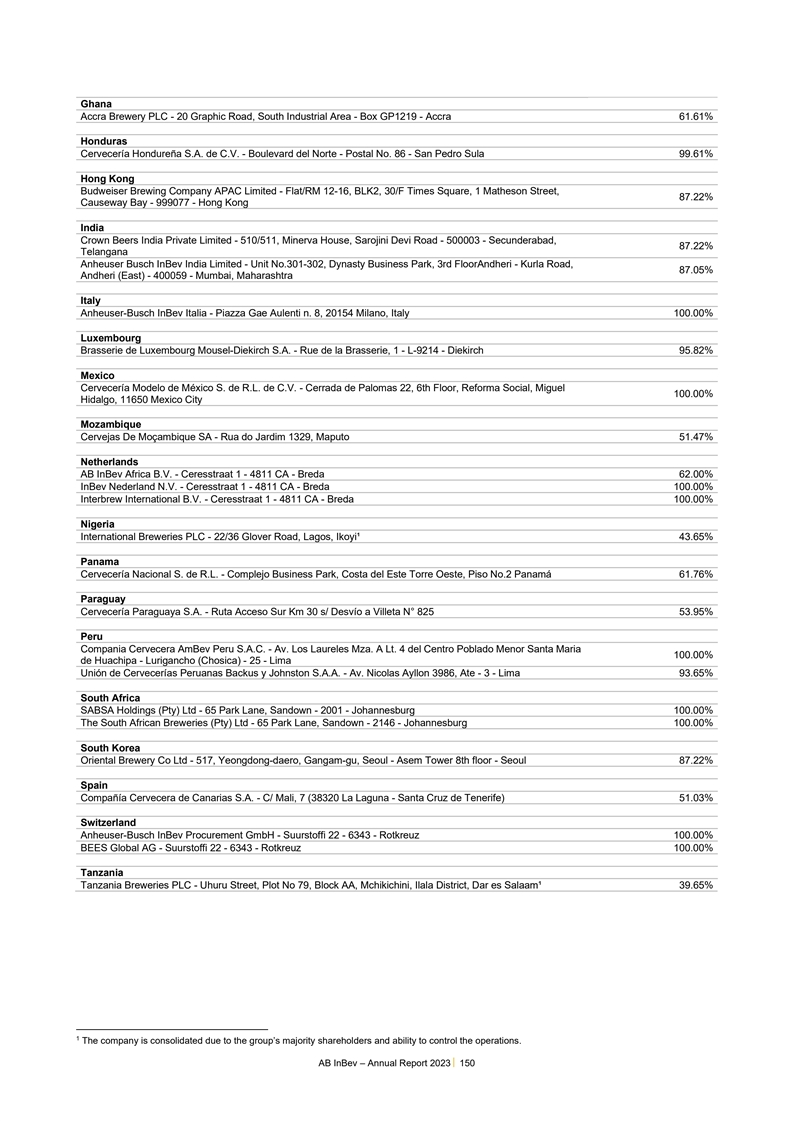
Ghana Accra Brewery PLC - 20 Graphic Road, South Industrial Area -
Box GP1219 - Accra 61.61% . Honduras Cervecería Hondureña S.A. de C.V. - Boulevard del Norte - Postal No. 86 - San Pedro Sula 99.61% . Hong Kong Budweiser Brewing Company APAC Limited - Flat/RM 12-16, BLK2, 30/F Times Square, 1 Matheson
Street, 87.22% Causeway Bay - 999077 - Hong Kong . India Crown Beers India Private Limited - 510/511, Minerva House, Sarojini Devi Road - 500003 - Secunderabad, 87.22% Telangana Anheuser Busch InBev India Limited - Unit No.301-302, Dynasty Business
Park, 3rd FloorAndheri - Kurla Road, 87.05% Andheri (East) - 400059 - Mumbai, Maharashtra . Italy Anheuser-Busch InBev Italia - Piazza Gae Aulenti n. 8, 20154 Milano, Italy 100.00% . Luxembourg Brasserie de Luxembourg Mousel-Diekirch S.A. - Rue de
la Brasserie, 1 - L-9214 - Diekirch 95.82% . Mexico Cervecería Modelo de México S. de R.L. de C.V. - Cerrada de Palomas 22, 6th Floor, Reforma Social, Miguel 100.00% Hidalgo, 11650 Mexico City . Mozambique Cervejas De Moçambique SA -
Rua do Jardim 1329, Maputo 51.47% . Netherlands AB InBev Africa B.V. - Ceresstraat 1 - 4811 CA - Breda 62.00% InBev Nederland N.V. - Ceresstraat 1 - 4811 CA - Breda 100.00% Interbrew International B.V. - Ceresstraat 1 - 4811 CA - Breda 100.00% .
Nigeria International Breweries PLC - 22/36 Glover Road, Lagos, Ikoyi¹ 43.65% . Panama Cervecería Nacional S. de R.L. - Complejo Business Park, Costa del Este Torre Oeste, Piso No.2 Panamá 61.76% . Paraguay Cervecería Paraguaya
S.A. - Ruta Acceso Sur Km 30 s/ Desvío a Villeta N° 825 53.95% . Peru Compania Cervecera AmBev Peru S.A.C. - Av. Los Laureles Mza. A Lt. 4 del Centro Poblado Menor Santa Maria 100.00% de Huachipa - Lurigancho (Chosica) - 25 - Lima
Unión de Cervecerías Peruanas Backus y Johnston S.A.A. - Av. Nicolas Ayllon 3986, Ate - 3 - Lima 93.65% . South Africa SABSA Holdings (Pty) Ltd - 65 Park Lane, Sandown - 2001 - Johannesburg 100.00% The South African Breweries (Pty) Ltd -
65 Park Lane, Sandown - 2146 - Johannesburg 100.00% . South Korea Oriental Brewery Co Ltd - 517, Yeongdong-daero, Gangam-gu, Seoul - Asem Tower 8th floor - Seoul 87.22% . Spain Compañía Cervecera de Canarias S.A. - C/ Mali, 7 (38320 La
Laguna - Santa Cruz de Tenerife) 51.03% . Switzerland Anheuser-Busch InBev Procurement GmbH - Suurstoffi 22 - 6343 - Rotkreuz 100.00% BEES Global AG - Suurstoffi 22 - 6343 - Rotkreuz 100.00% . Tanzania Tanzania Breweries PLC - Uhuru Street, Plot No
79, Block AA, Mchikichini, Ilala District, Dar es Salaam¹ 39.65% 1 1 The company is consolidated due to the group’s majority shareholders and ability to control the operations. AB InBev – Annual Report 2023 150
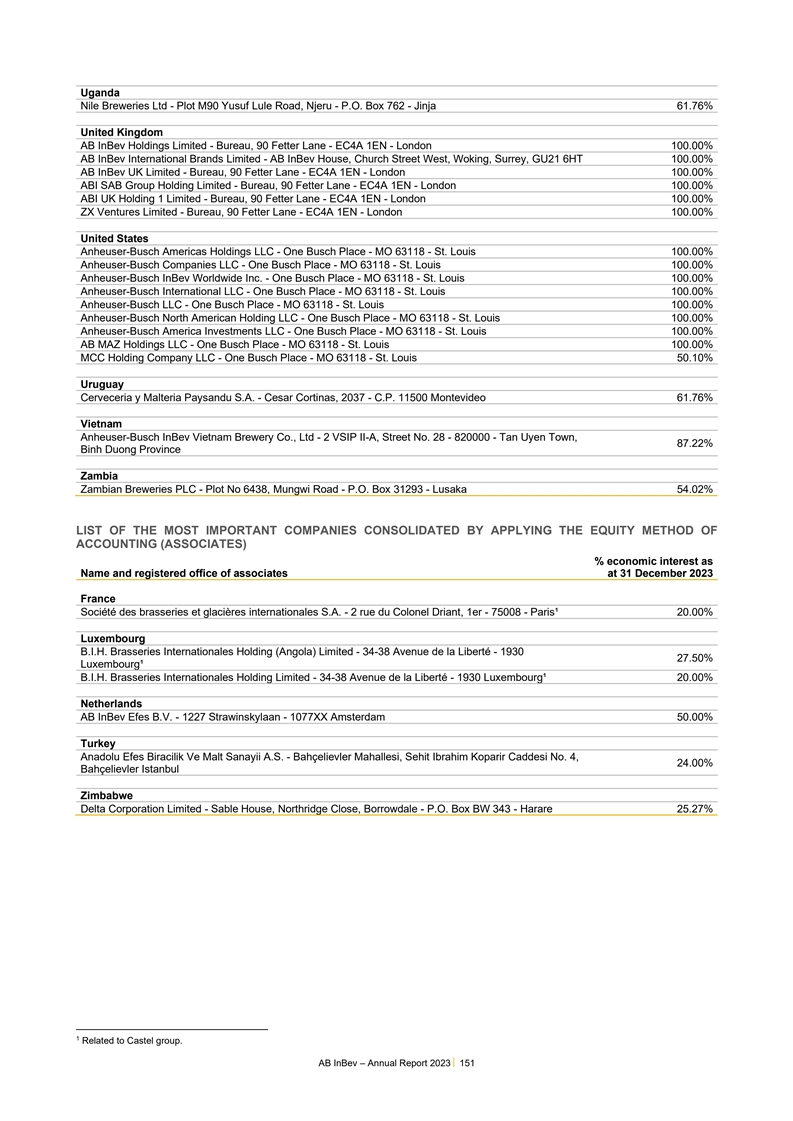
Uganda Nile Breweries Ltd - Plot M90 Yusuf Lule Road, Njeru - P.O.
Box 762 - Jinja 61.76% . United Kingdom AB InBev Holdings Limited - Bureau, 90 Fetter Lane - EC4A 1EN - London 100.00% AB InBev International Brands Limited - AB InBev House, Church Street West, Woking, Surrey, GU21 6HT 100.00% AB InBev UK Limited -
Bureau, 90 Fetter Lane - EC4A 1EN - London 100.00% ABI SAB Group Holding Limited - Bureau, 90 Fetter Lane - EC4A 1EN - London 100.00% ABI UK Holding 1 Limited - Bureau, 90 Fetter Lane - EC4A 1EN - London 100.00% ZX Ventures Limited - Bureau, 90
Fetter Lane - EC4A 1EN - London 100.00% . United States Anheuser-Busch Americas Holdings LLC - One Busch Place - MO 63118 - St. Louis 100.00% Anheuser-Busch Companies LLC - One Busch Place - MO 63118 - St. Louis 100.00% Anheuser-Busch InBev
Worldwide Inc. - One Busch Place - MO 63118 - St. Louis 100.00% Anheuser-Busch International LLC - One Busch Place - MO 63118 - St. Louis 100.00% Anheuser-Busch LLC - One Busch Place - MO 63118 - St. Louis 100.00% Anheuser-Busch North American
Holding LLC - One Busch Place - MO 63118 - St. Louis 100.00% Anheuser-Busch America Investments LLC - One Busch Place - MO 63118 - St. Louis 100.00% AB MAZ Holdings LLC - One Busch Place - MO 63118 - St. Louis 100.00% MCC Holding Company LLC - One
Busch Place - MO 63118 - St. Louis 50.10% . Uruguay Cerveceria y Malteria Paysandu S.A. - Cesar Cortinas, 2037 - C.P. 11500 Montevideo 61.76% . Vietnam Anheuser-Busch InBev Vietnam Brewery Co., Ltd - 2 VSIP II-A, Street No. 28 - 820000 - Tan Uyen
Town, 87.22% Binh Duong Province . Zambia Zambian Breweries PLC - Plot No 6438, Mungwi Road - P.O. Box 31293 - Lusaka 54.02% LIST OF THE MOST IMPORTANT COMPANIES CONSOLIDATED BY APPLYING THE EQUITY METHOD OF 1 ACCOUNTING (ASSOCIATES) % economic
interest as Name and registered office of associates at 31 December 2023 France Société des brasseries et glacières internationales S.A. - 2 rue du Colonel Driant, 1er - 75008 - Paris¹ 20.00% . Luxembourg B.I.H. Brasseries
Internationales Holding (Angola) Limited - 34-38 Avenue de la Liberté - 1930 27.50% Luxembourg¹ B.I.H. Brasseries Internationales Holding Limited - 34-38 Avenue de la Liberté - 1930 Luxembourg¹ 20.00% . Netherlands AB InBev Efes
B.V. - 1227 Strawinskylaan - 1077XX Amsterdam 50.00% . Turkey Anadolu Efes Biracilik Ve Malt Sanayii A.S. - Bahçelievler Mahallesi, Sehit Ibrahim Koparir Caddesi No. 4, 24.00% Bahçelievler Istanbul . Zimbabwe Delta Corporation Limited -
Sable House, Northridge Close, Borrowdale - P.O. Box BW 343 - Harare 25.27% 1 Related to Castel group. AB InBev – Annual Report 2023 151
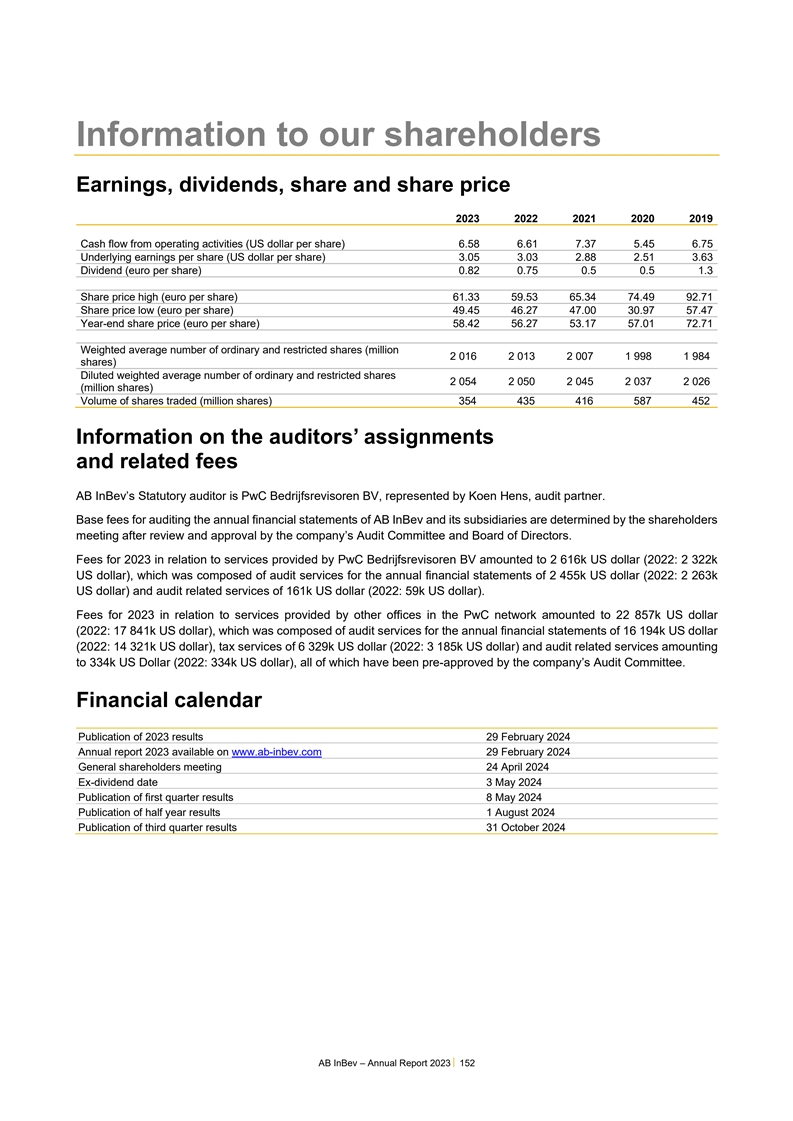
Information to our shareholders Earnings, dividends, share and share
price 2023 2022 2021 2020 2019 Cash flow from operating activities (US dollar per share) 6.58 6.61 7.37 5.45 6.75 Underlying earnings per share (US dollar per share) 3.05 3.03 2.88 2.51 3.63 Dividend (euro per share) 0.82 0.75 0.5 0.5 1.3 Share
price high (euro per share) 61.33 59.53 65.34 74.49 92.71 Share price low (euro per share) 49.45 46.27 47.00 30.97 57.47 Year-end share price (euro per share) 58.42 56.27 53.17 57.01 72.71 Weighted average number of ordinary and restricted shares
(million 2 016 2 013 2 007 1 998 1 984 shares) Diluted weighted average number of ordinary and restricted shares 2 054 2 050 2 045 2 037 2 026 (million shares) Volume of shares traded (million shares) 354 435 416 587 452 Information on the
auditors’ assignments and related fees AB InBev’s Statutory auditor is PwC Bedrijfsrevisoren BV, represented by Koen Hens, audit partner. Base fees for auditing the annual financial statements of AB InBev and its subsidiaries are
determined by the shareholders meeting after review and approval by the company’s Audit Committee and Board of Directors. Fees for 2023 in relation to services provided by PwC Bedrijfsrevisoren BV amounted to 2 616k US dollar (2022: 2 322k US
dollar), which was composed of audit services for the annual financial statements of 2 455k US dollar (2022: 2 263k US dollar) and audit related services of 161k US dollar (2022: 59k US dollar). Fees for 2023 in relation to services provided by
other offices in the PwC network amounted to 22 857k US dollar (2022: 17 841k US dollar), which was composed of audit services for the annual financial statements of 16 194k US dollar (2022: 14 321k US dollar), tax services of 6 329k US dollar
(2022: 3 185k US dollar) and audit related services amounting to 334k US Dollar (2022: 334k US dollar), all of which have been pre-approved by the company’s Audit Committee. Financial calendar Publication of 2023 results 29 February 2024
Annual report 2023 available on www.ab-inbev.com 29 February 2024 General shareholders meeting 24 April 2024 Ex-dividend date 3 May 2024 Publication of first quarter results 8 May 2024 Publication of half year results 1 August 2024 Publication of
third quarter results 31 October 2024 AB InBev – Annual Report 2023 152
Investor relations contact Investors Media Shaun Fullalove Media
Relations Tel: +1 212 573 9287 E-mail: media.relations@ab-inbev.com E-mail: shaun.fullalove@ab-inbev.com Ekaterina Baillie Tel: +32 16 276 888 E-mail: ekaterina.baillie@ab-inbev.com Cyrus Nentin Tel: +1 646 746 9673 E-mail: cyrus.nentin@ab-inbev.com
AB InBev – Annual Report 2023 153
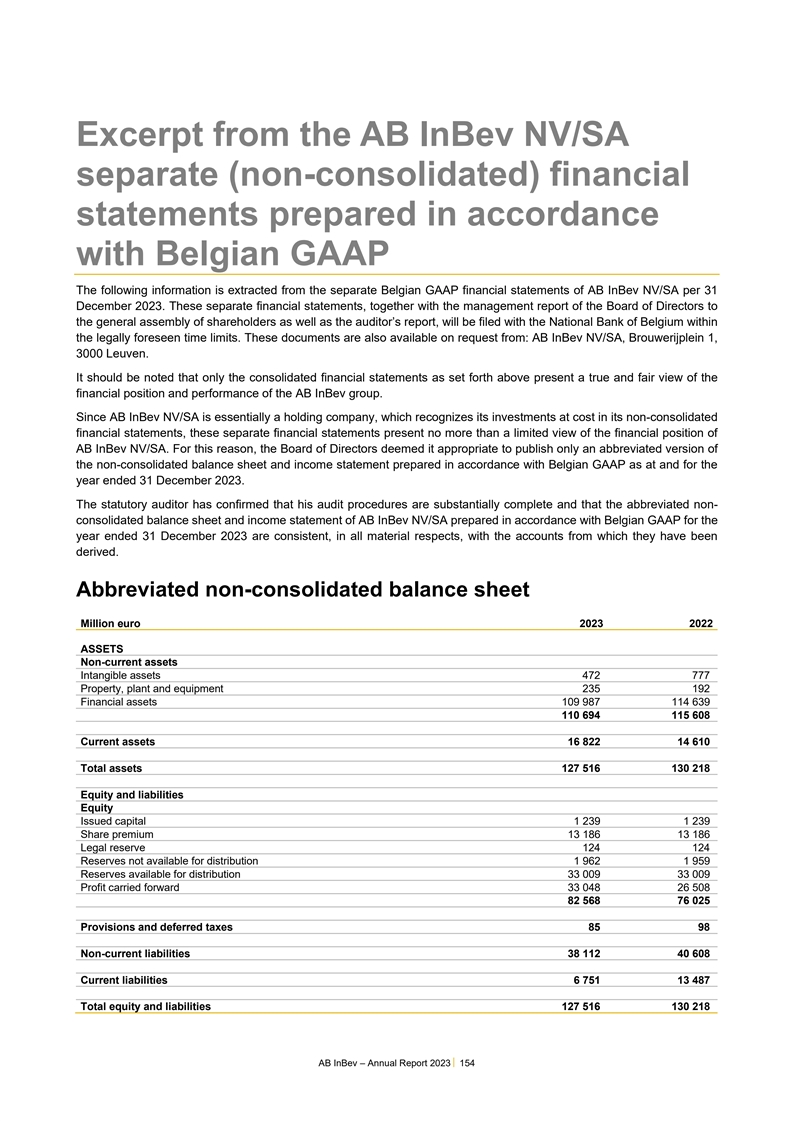
Excerpt from the AB InBev NV/SA separate (non-consolidated) financial
statements prepared in accordance with Belgian GAAP The following information is extracted from the separate Belgian GAAP financial statements of AB InBev NV/SA per 31 December 2023. These separate financial statements, together with the management
report of the Board of Directors to the general assembly of shareholders as well as the auditor’s report, will be filed with the National Bank of Belgium within the legally foreseen time limits. These documents are also available on request
from: AB InBev NV/SA, Brouwerijplein 1, 3000 Leuven. It should be noted that only the consolidated financial statements as set forth above present a true and fair view of the financial position and performance of the AB InBev group. Since AB InBev
NV/SA is essentially a holding company, which recognizes its investments at cost in its non-consolidated financial statements, these separate financial statements present no more than a limited view of the financial position of AB InBev NV/SA. For
this reason, the Board of Directors deemed it appropriate to publish only an abbreviated version of the non-consolidated balance sheet and income statement prepared in accordance with Belgian GAAP as at and for the year ended 31 December 2023. The
statutory auditor has confirmed that his audit procedures are substantially complete and that the abbreviated non- consolidated balance sheet and income statement of AB InBev NV/SA prepared in accordance with Belgian GAAP for the year ended 31
December 2023 are consistent, in all material respects, with the accounts from which they have been derived. Abbreviated non-consolidated balance sheet Million euro 2023 2022 ASSETS Non-current assets Intangible assets 472 777 Property, plant and
equipment 235 192 Financial assets 109 987 114 639 110 694 115 608 Current assets 16 822 14 610 Total assets 127 516 130 218 Equity and liabilities Equity Issued capital 1 239 1 239 Share premium 13 186 13 186 Legal reserve 124 124 Reserves not
available for distribution 1 962 1 959 Reserves available for distribution 33 009 33 009 Profit carried forward 33 048 26 508 82 568 76 025 Provisions and deferred taxes 85 98 Non-current liabilities 38 112 40 608 Current liabilities 6 751 13 487
Total equity and liabilities 127 516 130 218 AB InBev – Annual Report 2023 154
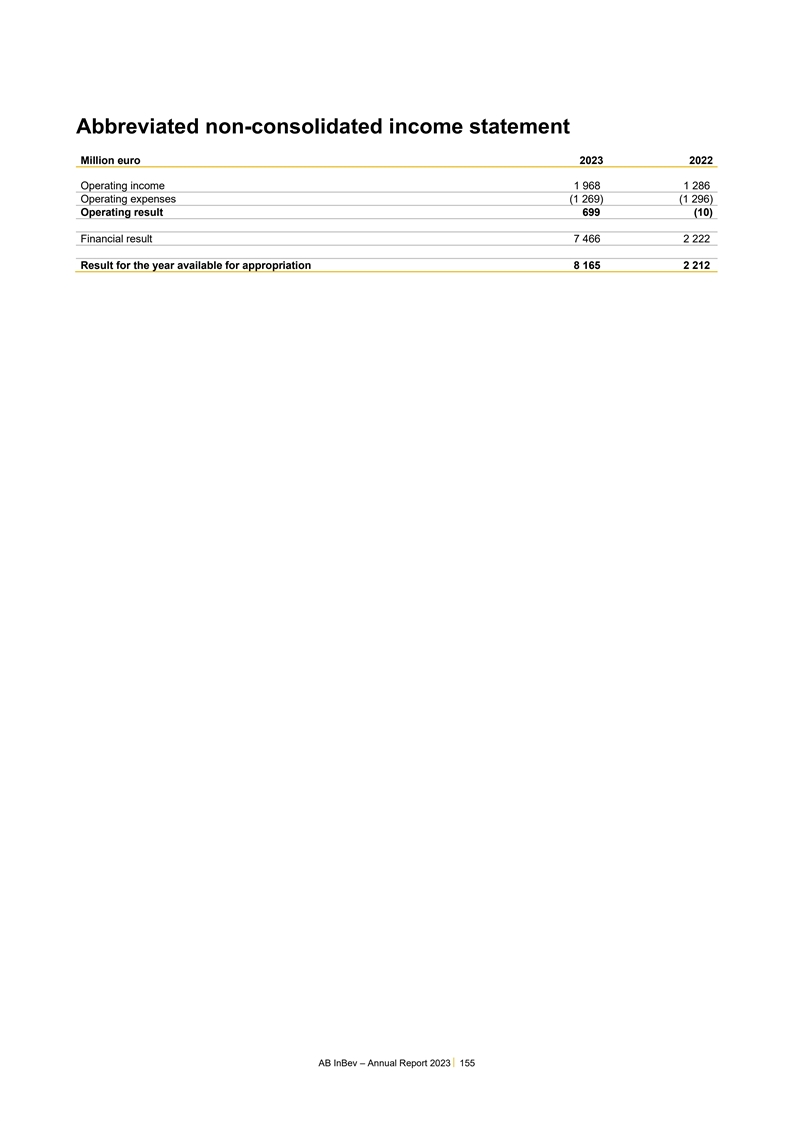
Abbreviated non-consolidated income statement Million euro 2023 2022
Operating income 1 968 1 286 Operating expenses (1 269) (1 296) Operating result 699 (10) Financial result 7 466 2 222 Result for the year available for appropriation 8 165 2 212 AB InBev – Annual Report 2023 155
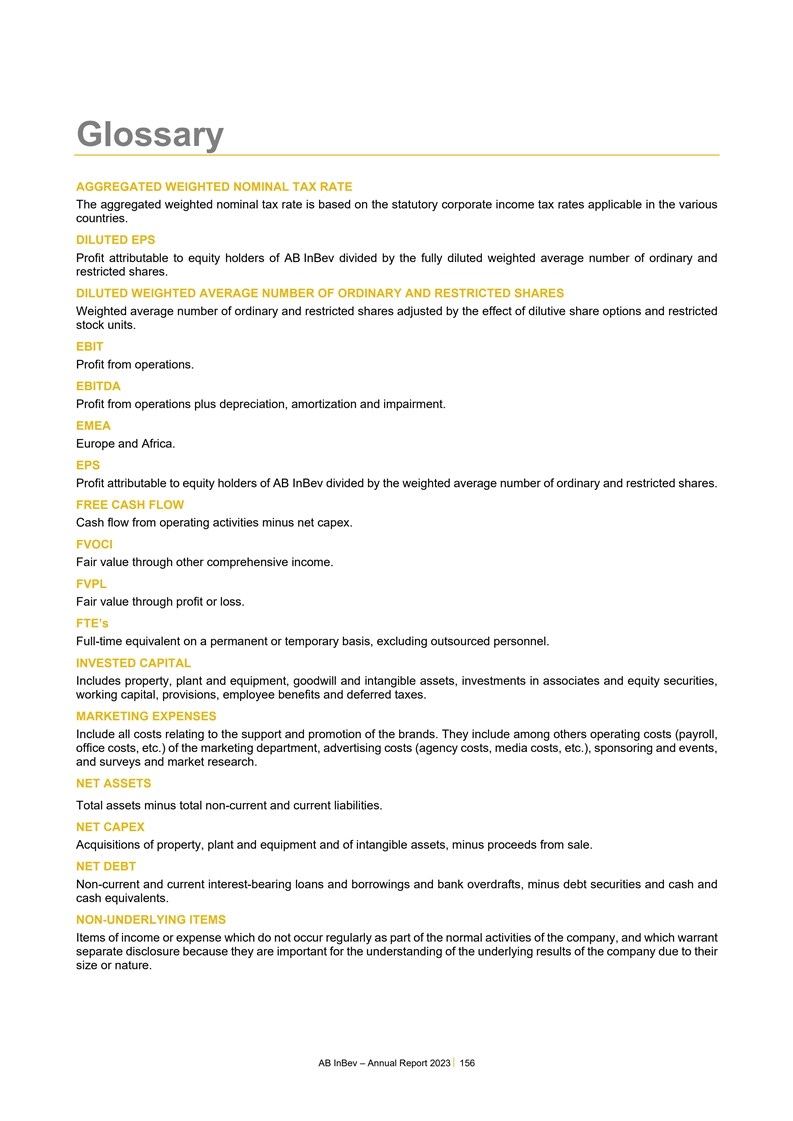
Glossary AGGREGATED WEIGHTED NOMINAL TAX RATE The aggregated weighted
nominal tax rate is based on the statutory corporate income tax rates applicable in the various countries. DILUTED EPS Profit attributable to equity holders of AB InBev divided by the fully diluted weighted average number of ordinary and restricted
shares. DILUTED WEIGHTED AVERAGE NUMBER OF ORDINARY AND RESTRICTED SHARES Weighted average number of ordinary and restricted shares adjusted by the effect of dilutive share options and restricted stock units. EBIT Profit from operations. EBITDA
Profit from operations plus depreciation, amortization and impairment. EMEA Europe and Africa. EPS Profit attributable to equity holders of AB InBev divided by the weighted average number of ordinary and restricted shares. FREE CASH FLOW Cash flow
from operating activities minus net capex. FVOCI Fair value through other comprehensive income. FVPL Fair value through profit or loss. FTE’s Full-time equivalent on a permanent or temporary basis, excluding outsourced personnel. INVESTED
CAPITAL Includes property, plant and equipment, goodwill and intangible assets, investments in associates and equity securities, working capital, provisions, employee benefits and deferred taxes. MARKETING EXPENSES Include all costs relating to the
support and promotion of the brands. They include among others operating costs (payroll, office costs, etc.) of the marketing department, advertising costs (agency costs, media costs, etc.), sponsoring and events, and surveys and market research.
NET ASSETS Total assets minus total non-current and current liabilities. NET CAPEX Acquisitions of property, plant and equipment and of intangible assets, minus proceeds from sale. NET DEBT Non-current and current interest-bearing loans and
borrowings and bank overdrafts, minus debt securities and cash and cash equivalents. NON-UNDERLYING ITEMS Items of income or expense which do not occur regularly as part of the normal activities of the company, and which warrant separate disclosure
because they are important for the understanding of the underlying results of the company due to their size or nature. AB InBev – Annual Report 2023 156
NORMALIZED The term “normalized” refers to performance
measures (EBITDA, EBIT, Profit or effective tax rate) before non-underlying items and profit from discontinued operations. AB InBev believes that the communication and explanation of normalized measures is essential for readers of its financial
statements to understand fully the sustainable performance of the company. Normalized measures are additional measures used by management and should not replace the measures determined in accordance with IFRS as an indicator of the company’s
performance. NORMALIZED EBIT Profit from operations adjusted for non-underlying items. NORMALIZED EBITDA Profit from operations adjusted for non-underlying items, plus depreciation, amortization and impairment. NORMALIZED EFFECTIVE TAX RATE
Effective tax rate adjusted for non-underlying items. NORMALIZED PROFIT Profit adjusted for non-underlying items and profit from discontinued operations. NORMALIZED PROFIT FROM OPERATIONS Profit from operations adjusted for non-underlying items. PAY
OUT RATIO Gross dividend per share multiplied by the estimated number of ordinary shares outstanding at the dividend record date, divided by normalized profit attributable to equity holders of AB InBev. PSUs Performance stock units. RE-MEASUREMENTS
OF POST-EMPLOYEE BENEFITS Comprised of actuarial gains and losses, the effect of the asset ceiling (excluding net interest) and the return on plan assets (excluding net interest). REVENUE Gross revenue less excise taxes and discounts. RSUs
Restricted stock units. SALES EXPENSES Include all costs relating to the selling of the products. They include among others the operating costs (payroll, office costs, etc.) of the sales department and the sales force. SG&A (SELLING, GENERAL
& ADMINISTRATIVE EXPENSES) Sales, marketing, distribution and administrative expenses SCOPE Financials are analyzed eliminating the impact of changes in currencies on translation of foreign operations, and scopes. A scope represents the impact
of acquisitions and divestitures, the start-up or termination of activities or the transfer of activities between segments, curtailment gains and losses and year-over-year changes in accounting estimates and other assumptions that management does
not consider as part of the underlying performance of the business. UNDERLYING EPS Underlying profit divided by the weighted average number of ordinary and restricted shares. UNDERLYING PROFIT Profit before non-underlying items, discontinued
operations, mark-to-market gains/losses on certain derivatives related to the hedging of share-based payment programs and hyperinflation impacts, attributable to equity holders of AB InBev. WEIGHTED AVERAGE NUMBER OF ORDINARY AND RESTRICTED SHARES
Number of shares outstanding at the beginning of the period, adjusted by the number of shares cancelled, repurchased or issued during the period multiplied by a time-weighing factor. WORKING CAPITAL Includes inventories, trade and other receivables
and trade and other payables, both current and non-current. AB InBev – Annual Report 2023 157
SUSTAIN- ABILITY STATEMENTS TABLE OF CONTENTS GENERAL STATEMENTS 159
ENVIRONMENTAL STATEMENTS 162 SOCIAL STATEMENTS 168 GOVERNANCE STATEMENTS 172 REPORT SCOPE 173 INDEPENDENT LIMITED ASSURANCE REPORT 175 DISCLOSURES PURSUANT TO ARTICLE 8 OF THE TAXONOMY REGULATION 177 AB InBev - Annual report 2023 - 158
1. General statements At AB InBev, we believe that sustainability
enables our commercial vision, unlocks long-term value and fulfills our company purpose. For more information on our business strategy, our diversified footprint and our value chain, see the Strategy section of this annual report. These
Sustainability statements serve as our non-financial reporting on corporate social responsibility matters in accordance with article 3:6, §4 and article 3:32, §2 of the Belgian Code of Companies and Associations, which implements Directive
2014/95/EU of 22 October 2014 amending Directive 2013/34/EU. The consolidated Sustainability statements for the year ended 31 December 2023 comprise the company and its fully owned subsidiaries (together referred to as “AB InBev” or the
“company” or “we”) and covers the fully consolidated companies included in the financial scope. Please see the list of fully consolidated companies in the Financial report. Any exception to this scope will be stated in the
text or footnotes. Unless explicitly stated otherwise, documents referenced or hyperlinks found herein are for informational purposes only and are not incorporated by reference into these Sustainability statements. Governance As the company’s
ultimate decision-making body, the Board’s sustainability oversight includes approval of strategies and review of sustainability performance. The Board received multiple updates on sustainability matters in 2023. • The Nomination
Committee reviews corporate governance matters as part of its role in the nomination and retention of Directors and executives. • The Remuneration Committee reviews remuneration policies and packages as part of its role in the remuneration and
retention of Directors and executives. • The Finance Committee reviews sustainability matters as part of its assessment of funding requirements, financial risk, supply security and sourcing strategies. • The Audit Committee reviews
environmental and social matters as part of its audit function. See the Corporate governance statement in this report for more details. The Chief Executive Officer, supported by the Executive Committee, executes and manages sustainability matters.
Within our Senior Leadership Team, Global Function Leads (Chiefs) oversee the global agenda for sustainability matters relevant to their respective business teams. Regional CEOs lead the zone agenda for sustainability matters relevant to their
zones. Embedded across the business, numerous employees are responsible for coordination and implementation of sustainability matters and initiatives relevant to their specific team and/or zone. Internal committees manage certain sustainability
topics that span teams and geographies. They provide visibility and foster collaboration and the sharing of best practices among zones and teams. Examples of these committees include the Sustainability Council and the Global Compliance Committee. A
description of AB InBev’s internal controls and risk management systems can be found in the Financial report in this report. The major risks and uncertainties faced by the company are described in the Risks and uncertainties section of the
Financial report. In addition, specific risk management tools are described in the topical disclosures in the Sustainability statements. Sustainability-related targets tied to annual variable performance-related compensation (bonuses) are cascaded
from the company’s highest level to our business and operating units. In 2023, more than 3000 colleagues across zones and teams carried annual performance targets linked to sustainable development topics. In addition to our Chief
Sustainability Officer, these included our Chief Finance Officer, Chief People Officer and Chief Legal and Corporate Affairs Officer, for whom the target typically would account for 10 to 20% of the annual short-term bonus. For more information on
our remuneration policy, see the Corporate governance statement. Stakeholder engagement We routinely engage with stakeholders across our value chain. AB InBev – Annual Report 2023 159
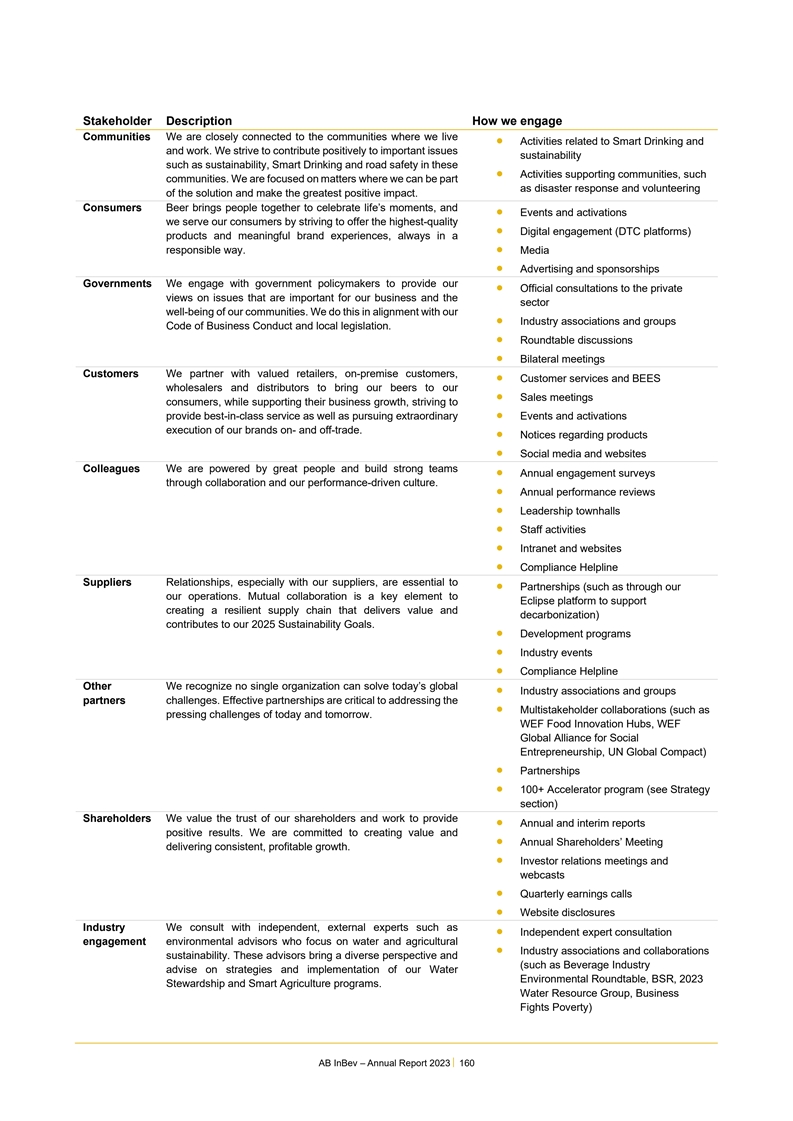
Stakeholder Description How we engage Communities We are closely
connected to the communities where we live • Activities related to Smart Drinking and and work. We strive to contribute positively to important issues sustainability such as sustainability, Smart Drinking and road safety in these •
Activities supporting communities, such communities. We are focused on matters where we can be part as disaster response and volunteering of the solution and make the greatest positive impact. Consumers Beer brings people together to celebrate
life’s moments, and • Events and activations we serve our consumers by striving to offer the highest-quality • Digital engagement (DTC platforms) products and meaningful brand experiences, always in a responsible way. • Media
• Advertising and sponsorships Governments We engage with government policymakers to provide our • Official consultations to the private views on issues that are important for our business and the sector well-being of our communities. We
do this in alignment with our • Industry associations and groups Code of Business Conduct and local legislation. • Roundtable discussions • Bilateral meetings Customers We partner with valued retailers, on-premise customers,
• Customer services and BEES wholesalers and distributors to bring our beers to our • Sales meetings consumers, while supporting their business growth, striving to provide best-in-class service as well as pursuing extraordinary •
Events and activations execution of our brands on- and off-trade. • Notices regarding products • Social media and websites Colleagues We are powered by great people and build strong teams • Annual engagement surveys through
collaboration and our performance-driven culture. • Annual performance reviews • Leadership townhalls • Staff activities • Intranet and websites • Compliance Helpline Suppliers Relationships, especially with our
suppliers, are essential to • Partnerships (such as through our our operations. Mutual collaboration is a key element to Eclipse platform to support creating a resilient supply chain that delivers value and decarbonization) contributes to our
2025 Sustainability Goals. • Development programs • Industry events • Compliance Helpline Other We recognize no single organization can solve today’s global • Industry associations and groups partners challenges.
Effective partnerships are critical to addressing the • Multistakeholder collaborations (such as pressing challenges of today and tomorrow. WEF Food Innovation Hubs, WEF Global Alliance for Social Entrepreneurship, UN Global Compact) •
Partnerships • 100+ Accelerator program (see Strategy section) Shareholders We value the trust of our shareholders and work to provide • Annual and interim reports positive results. We are committed to creating value and • Annual
Shareholders’ Meeting delivering consistent, profitable growth. • Investor relations meetings and webcasts • Quarterly earnings calls • Website disclosures Industry We consult with independent, external experts such as
• Independent expert consultation engagement environmental advisors who focus on water and agricultural • Industry associations and collaborations sustainability. These advisors bring a diverse perspective and (such as Beverage Industry
advise on strategies and implementation of our Water Environmental Roundtable, BSR, 2023 Stewardship and Smart Agriculture programs. Water Resource Group, Business Fights Poverty) AB InBev – Annual Report 2023 160
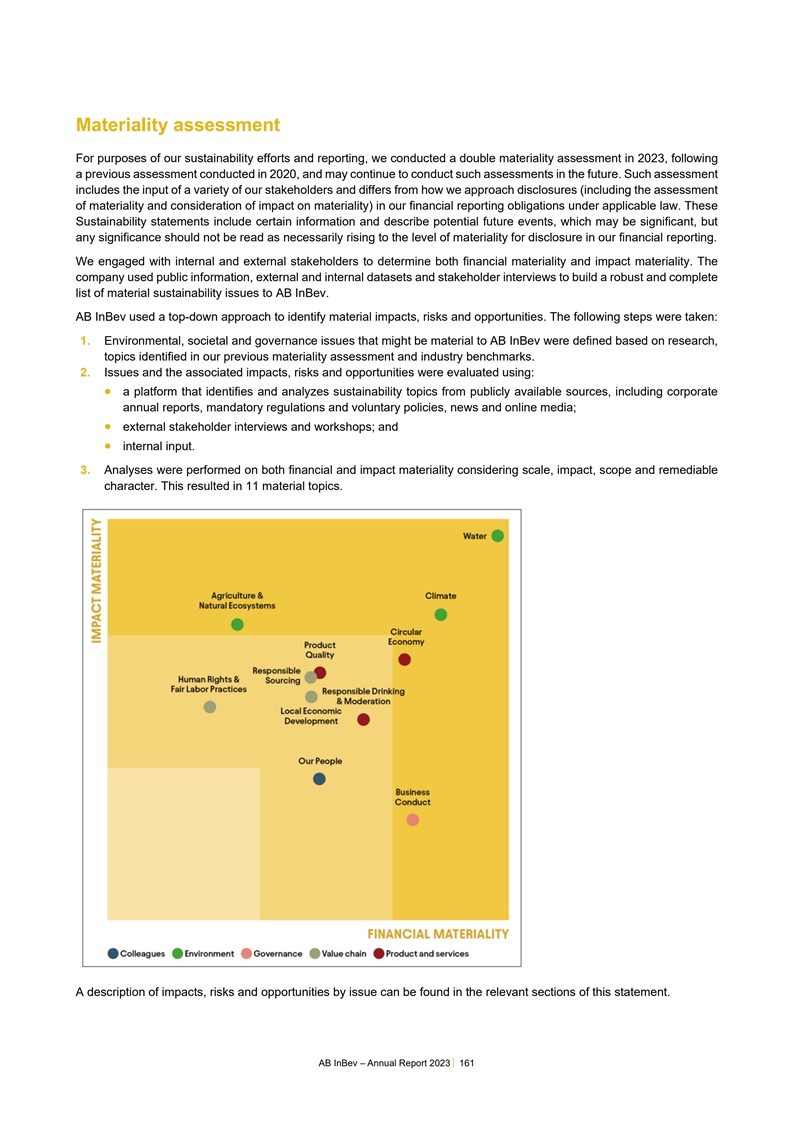
Materiality assessment For purposes of our sustainability efforts and
reporting, we conducted a double materiality assessment in 2023, following a previous assessment conducted in 2020, and may continue to conduct such assessments in the future. Such assessment includes the input of a variety of our stakeholders and
differs from how we approach disclosures (including the assessment of materiality and consideration of impact on materiality) in our financial reporting obligations under applicable law. These Sustainability statements include certain information
and describe potential future events, which may be significant, but any significance should not be read as necessarily rising to the level of materiality for disclosure in our financial reporting. We engaged with internal and external stakeholders
to determine both financial materiality and impact materiality. The company used public information, external and internal datasets and stakeholder interviews to build a robust and complete list of material sustainability issues to AB InBev. AB
InBev used a top-down approach to identify material impacts, risks and opportunities. The following steps were taken: 1. Environmental, societal and governance issues that might be material to AB InBev were defined based on research, topics
identified in our previous materiality assessment and industry benchmarks. 2. Issues and the associated impacts, risks and opportunities were evaluated using: • a platform that identifies and analyzes sustainability topics from publicly
available sources, including corporate annual reports, mandatory regulations and voluntary policies, news and online media; • external stakeholder interviews and workshops; and • internal input. 3. Analyses were performed on both
financial and impact materiality considering scale, impact, scope and remediable character. This resulted in 11 material topics. A description of impacts, risks and opportunities by issue can be found in the relevant sections of this statement. AB
InBev – Annual Report 2023 161
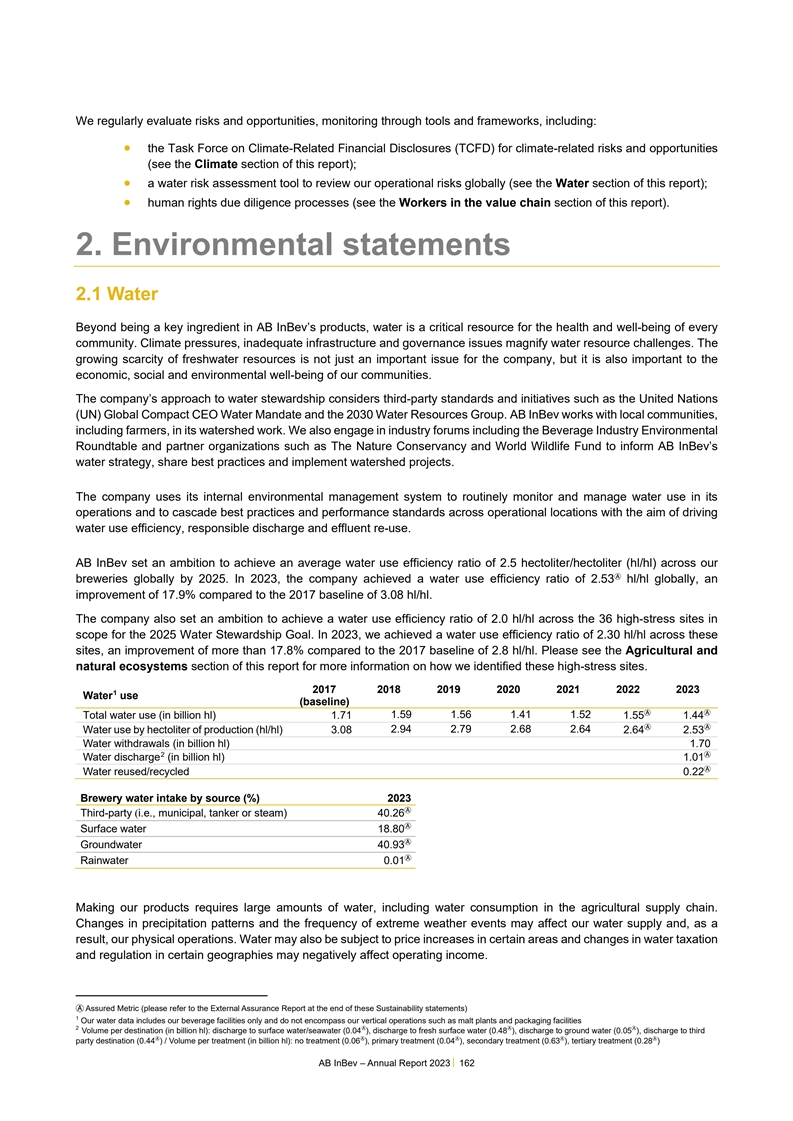
We regularly evaluate risks and opportunities, monitoring through
tools and frameworks, including: • the Task Force on Climate-Related Financial Disclosures (TCFD) for climate-related risks and opportunities (see the Climate section of this report); • a water risk assessment tool to review our
operational risks globally (see the Water section of this report); • human rights due diligence processes (see the Workers in the value chain section of this report). 2. Environmental statements 2.1 Water Beyond being a key ingredient in AB
InBev’s products, water is a critical resource for the health and well-being of every community. Climate pressures, inadequate infrastructure and governance issues magnify water resource challenges. The growing scarcity of freshwater resources
is not just an important issue for the company, but it is also important to the economic, social and environmental well-being of our communities. The company’s approach to water stewardship considers third-party standards and initiatives such
as the United Nations (UN) Global Compact CEO Water Mandate and the 2030 Water Resources Group. AB InBev works with local communities, including farmers, in its watershed work. We also engage in industry forums including the Beverage Industry
Environmental Roundtable and partner organizations such as The Nature Conservancy and World Wildlife Fund to inform AB InBev’s water strategy, share best practices and implement watershed projects. The company uses its internal environmental
management system to routinely monitor and manage water use in its operations and to cascade best practices and performance standards across operational locations with the aim of driving water use efficiency, responsible discharge and effluent
re-use. AB InBev set an ambition to achieve an average water use efficiency ratio of 2.5 hectoliter/hectoliter (hl/hl) across our Ⓐ breweries globally by 2025. In 2023, the company achieved a water use efficiency ratio of 2.53 hl/hl globally,
an improvement of 17.9% compared to the 2017 baseline of 3.08 hl/hl. The company also set an ambition to achieve a water use efficiency ratio of 2.0 hl/hl across the 36 high-stress sites in scope for the 2025 Water Stewardship Goal. In 2023, we
achieved a water use efficiency ratio of 2.30 hl/hl across these sites, an improvement of more than 17.8% compared to the 2017 baseline of 2.8 hl/hl. Please see the Agricultural and natural ecosystems section of this report for more information on
how we identified these high-stress sites. 2017 2018 2019 2020 2021 2022 2023 1 Water use (baseline) ⒶⒶ Total water use (in billion hl) 1.71 1.59 1.56 1.41 1.52 1.55 1.44 ⒶⒶ Water use by hectoliter of production (hl/hl) 3.08
2.94 2.79 2.68 2.64 2.64 2.53 Water withdrawals (in billion hl) 1.70 2Ⓐ Water discharge (in billion hl) 1.01 Ⓐ Water reused/recycled 0.22 Brewery water intake by source (%) 2023 Ⓐ Third-party (i.e., municipal, tanker or steam)
40.26 Ⓐ 18.80 Surface water Ⓐ Groundwater 40.93 Ⓐ Rainwater 0.01 Making our products requires large amounts of water, including water consumption in the agricultural supply chain. Changes in precipitation patterns and the frequency
of extreme weather events may affect our water supply and, as a result, our physical operations. Water may also be subject to price increases in certain areas and changes in water taxation and regulation in certain geographies may negatively affect
operating income. Ⓐ Assured Metric (please refer to the External Assurance Report at the end of these Sustainability statements) 1 Our water data includes our beverage facilities only and do not encompass our vertical operations such as malt
plants and packaging facilities 2ⒶⒶⒶ Volume per destination (in billion hl): discharge to surface water/seawater (0.04 ), discharge to fresh surface water (0.48 ), discharge to ground water (0.05 ), discharge to third
ⒶⒶⒶⒶⒶ party destination (0.44 ) / Volume per treatment (in billion hl): no treatment (0.06 ), primary treatment (0.04 ), secondary treatment (0.63 ), tertiary treatment (0.28 ) AB InBev – Annual Report 2023
162
As the world’s leading brewer, AB InBev is committed to being a
partner in managing water across its operations, communities and supply chain. We continue to scale our water stewardship efforts by driving water efficiency in our operations and engaging in watershed protection measures in partnership with local
stakeholders, especially in high-stress areas. For more information, please see the Agriculture and natural ecosystems section of this report. 2.2 Climate Our business is closely tied to the natural environment. Agricultural crops and water are our
key ingredients. We require raw materials for our packaging. We need energy and fuel to brew, transport and cool our beers. Our business is also closely connected with local communities and people across our global footprint. Climate change can
impact all of these. We are already experiencing both environmental and social climate-related impacts in our value chain and communities. AB InBev uses the International Financial Reporting Standards (IFRS) S2 Climate-related Disclosures (formerly
the Taskforce for Climate-Related Financial Disclosures (TCFD)), in line with GRI standards, to assess climate-related risks and opportunities over the short- (one to five years), medium- (six to ten years) and long-term (more than ten years) views.
Against this time horizon, we evaluate risks and opportunities associated with policy, technology, market changes, reputation and chronic and acute physical risks. We consider two scenarios each for physical and transition risks over the medium and
long term. We analyze short-term risks through our internal risk management processes. The outcome of these analyses informs our climate strategy. To analyze physical risks and opportunities, we considered two scenarios, using the Intergovernmental
Panel on Climate Change (IPCC) Representative Concentration Pathways (RCP): • Physical Risks Scenario 1: RCP 4.5, a high mitigation scenario in which emissions start declining by mid- century; and • Physical Risks Scenario 2: RCP 8.5, an
extreme global warming scenario in which global warming reaches 4 degrees Celsius, To analyze transition risks and opportunities, we selected two scenarios developed by the International Energy Agency (IEA): • Transition Risks Scenario 1:
Business-as-usual, as per Stated Policies Scenario (STEPS) considering current policy settings (already implemented or confirmed upcoming policies); and • Transition Risks Scenario 2: Net Zero Emissions by 2050 (NZE), with a narrow but
achievable pathway for the global energy sector to achieve net zero emissions by 2050, aligned with the 1.5 degrees Celsius scenario. The tables on the next page summarize the outcomes of our analyses. While these provided scenarios are different,
we believe that our strategy will enable us to address the potential risks and opportunities presented under each scenario. Although these Sustainability statements contain statements based on hypothetical or severely adverse scenarios and
assumptions, these statements should not necessarily be viewed as representing current or actual risk or forecasts of expected risk. In addition, our climate risk scenario analysis and net zero ambition strategy remain under development as we
continue to refine our analysis of and response to potential future climate risks and opportunities. Further, the data and methodology underlying our analysis and strategy remain subject to evolution. We believe the methodology of climate scenario
analysis and carbon accounting will continue to evolve and improve, especially related to Scope 3 emissions. As such, in future reports, certain disclosures may differ from those contained in these Sustainability statements due to improvements in
the quality and completeness of our data and updates to our methodology. Through the annual assessment described here, we develop a non-exhaustive list of our risk factors and uncertainties, which can be found in our Annual Report under the Risks
and uncertainties section. We evaluate transition and physical risks linked to climate change in line with IFRS S2 recommendations. Risks associated with our organization are related to both our direct operations and supply chain. These range from
the potential impact of carbon pricing in the geographies where we operate, to risks associated with climate pattern changes, to water scarcity and extreme weather events across our value chain. We also consider the risks related to market changes
and consumer expectations as well as the impact these could have on our reputation as a company. Furthermore, we have undertaken an analysis of our barley sourcing to assess the possible impacts of climate change as well as to identify areas of high
production potential. AB InBev – Annual Report 2023 163
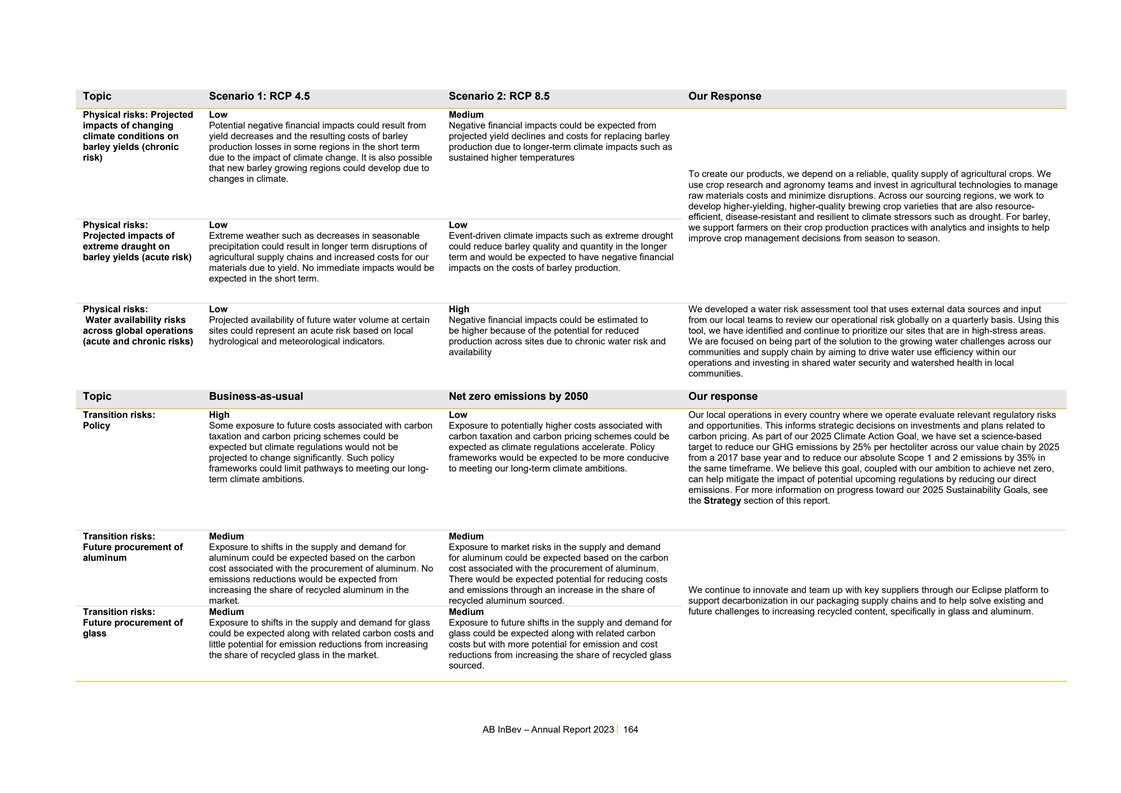
Topic Scenario 1: RCP 4.5 Scenario 2: RCP 8.5 Our Response Physical
risks: Projected Low Medium impacts of changing Potential negative financial impacts could result from Negative financial impacts could be expected from climate conditions on yield decreases and the resulting costs of barley projected yield declines
and costs for replacing barley barley yields (chronic production losses in some regions in the short term production due to longer-term climate impacts such as risk) due to the impact of climate change. It is also possible sustained higher
temperatures that new barley growing regions could develop due to To create our products, we depend on a reliable, quality supply of agricultural crops. We changes in climate. use crop research and agronomy teams and invest in agricultural
technologies to manage raw materials costs and minimize disruptions. Across our sourcing regions, we work to develop higher-yielding, higher-quality brewing crop varieties that are also resource- efficient, disease-resistant and resilient to climate
stressors such as drought. For barley, Physical risks: Low Low we support farmers on their crop production practices with analytics and insights to help Projected impacts of Extreme weather such as decreases in seasonable Event-driven climate
impacts such as extreme drought improve crop management decisions from season to season. extreme draught on precipitation could result in longer term disruptions of could reduce barley quality and quantity in the longer barley yields (acute risk)
agricultural supply chains and increased costs for our term and would be expected to have negative financial materials due to yield. No immediate impacts would be impacts on the costs of barley production. expected in the short term. Physical risks:
Low High We developed a water risk assessment tool that uses external data sources and input Water availability risks Projected availability of future water volume at certain Negative financial impacts could be estimated to from our local teams to
review our operational risk globally on a quarterly basis. Using this across global operations sites could represent an acute risk based on local be higher because of the potential for reduced tool, we have identified and continue to prioritize our
sites that are in high-stress areas. (acute and chronic risks) hydrological and meteorological indicators. production across sites due to chronic water risk and We are focused on being part of the solution to the growing water challenges across our
availability communities and supply chain by aiming to drive water use efficiency within our operations and investing in shared water security and watershed health in local communities. Topic Business-as-usual Net zero emissions by 2050 Our response
Transition risks: High Low Our local operations in every country where we operate evaluate relevant regulatory risks Policy Some exposure to future costs associated with carbon Exposure to potentially higher costs associated with and opportunities.
This informs strategic decisions on investments and plans related to taxation and carbon pricing schemes could be carbon taxation and carbon pricing schemes could be carbon pricing. As part of our 2025 Climate Action Goal, we have set a
science-based expected but climate regulations would not be expected as climate regulations accelerate. Policy target to reduce our GHG emissions by 25% per hectoliter across our value chain by 2025 projected to change significantly. Such policy
frameworks would be expected to be more conducive from a 2017 base year and to reduce our absolute Scope 1 and 2 emissions by 35% in frameworks could limit pathways to meeting our long- to meeting our long-term climate ambitions. the same timeframe.
We believe this goal, coupled with our ambition to achieve net zero, term climate ambitions. can help mitigate the impact of potential upcoming regulations by reducing our direct emissions. For more information on progress toward our 2025
Sustainability Goals, see the Strategy section of this report. Transition risks: Medium Medium Future procurement of Exposure to shifts in the supply and demand for Exposure to market risks in the supply and demand aluminum aluminum could be
expected based on the carbon for aluminum could be expected based on the carbon cost associated with the procurement of aluminum. No cost associated with the procurement of aluminum. emissions reductions would be expected from There would be
expected potential for reducing costs increasing the share of recycled aluminum in the and emissions through an increase in the share of We continue to innovate and team up with key suppliers through our Eclipse platform to market. recycled aluminum
sourced. support decarbonization in our packaging supply chains and to help solve existing and future challenges to increasing recycled content, specifically in glass and aluminum. Transition risks: Medium Medium Future procurement of Exposure to
shifts in the supply and demand for glass Exposure to future shifts in the supply and demand for glass could be expected along with related carbon costs and glass could be expected along with related carbon little potential for emission reductions
from increasing costs but with more potential for emission and cost the share of recycled glass in the market. reductions from increasing the share of recycled glass sourced. AB InBev – Annual Report 2023 164
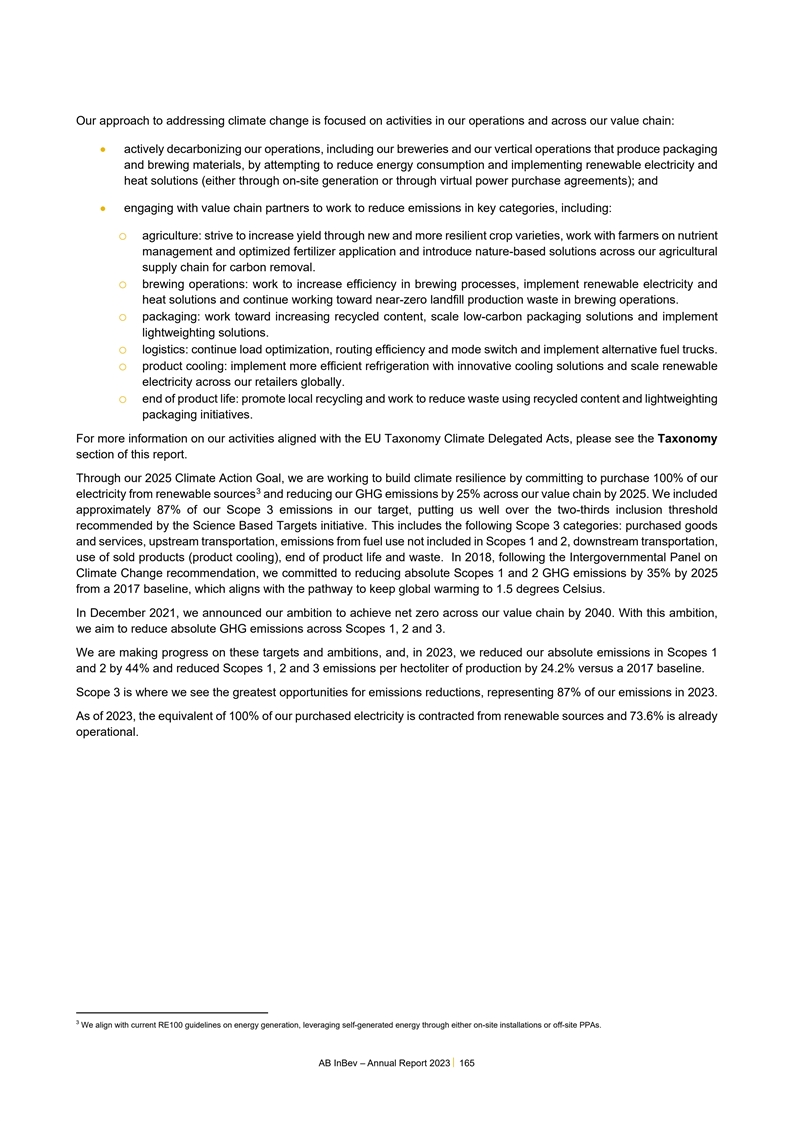
Our approach to addressing climate change is focused on activities in
our operations and across our value chain: • actively decarbonizing our operations, including our breweries and our vertical operations that produce packaging and brewing materials, by attempting to reduce energy consumption and implementing
renewable electricity and heat solutions (either through on-site generation or through virtual power purchase agreements); and • engaging with value chain partners to work to reduce emissions in key categories, including: o agriculture: strive
to increase yield through new and more resilient crop varieties, work with farmers on nutrient management and optimized fertilizer application and introduce nature-based solutions across our agricultural supply chain for carbon removal. o brewing
operations: work to increase efficiency in brewing processes, implement renewable electricity and heat solutions and continue working toward near-zero landfill production waste in brewing operations. o packaging: work toward increasing recycled
content, scale low-carbon packaging solutions and implement lightweighting solutions. o logistics: continue load optimization, routing efficiency and mode switch and implement alternative fuel trucks. o product cooling: implement more efficient
refrigeration with innovative cooling solutions and scale renewable electricity across our retailers globally. o end of product life: promote local recycling and work to reduce waste using recycled content and lightweighting packaging initiatives.
For more information on our activities aligned with the EU Taxonomy Climate Delegated Acts, please see the Taxonomy section of this report. Through our 2025 Climate Action Goal, we are working to build climate resilience by committing to purchase
100% of our 3 electricity from renewable sources and reducing our GHG emissions by 25% across our value chain by 2025. We included approximately 87% of our Scope 3 emissions in our target, putting us well over the two-thirds inclusion threshold
recommended by the Science Based Targets initiative. This includes the following Scope 3 categories: purchased goods and services, upstream transportation, emissions from fuel use not included in Scopes 1 and 2, downstream transportation, use of
sold products (product cooling), end of product life and waste. In 2018, following the Intergovernmental Panel on Climate Change recommendation, we committed to reducing absolute Scopes 1 and 2 GHG emissions by 35% by 2025 from a 2017 baseline,
which aligns with the pathway to keep global warming to 1.5 degrees Celsius. In December 2021, we announced our ambition to achieve net zero across our value chain by 2040. With this ambition, we aim to reduce absolute GHG emissions across Scopes 1,
2 and 3. We are making progress on these targets and ambitions, and, in 2023, we reduced our absolute emissions in Scopes 1 and 2 by 44% and reduced Scopes 1, 2 and 3 emissions per hectoliter of production by 24.2% versus a 2017 baseline. Scope 3 is
where we see the greatest opportunities for emissions reductions, representing 87% of our emissions in 2023. As of 2023, the equivalent of 100% of our purchased electricity is contracted from renewable sources and 73.6% is already operational. 3 We
align with current RE100 guidelines on energy generation, leveraging self-generated energy through either on-site installations or off-site PPAs. AB InBev – Annual Report 2023 165
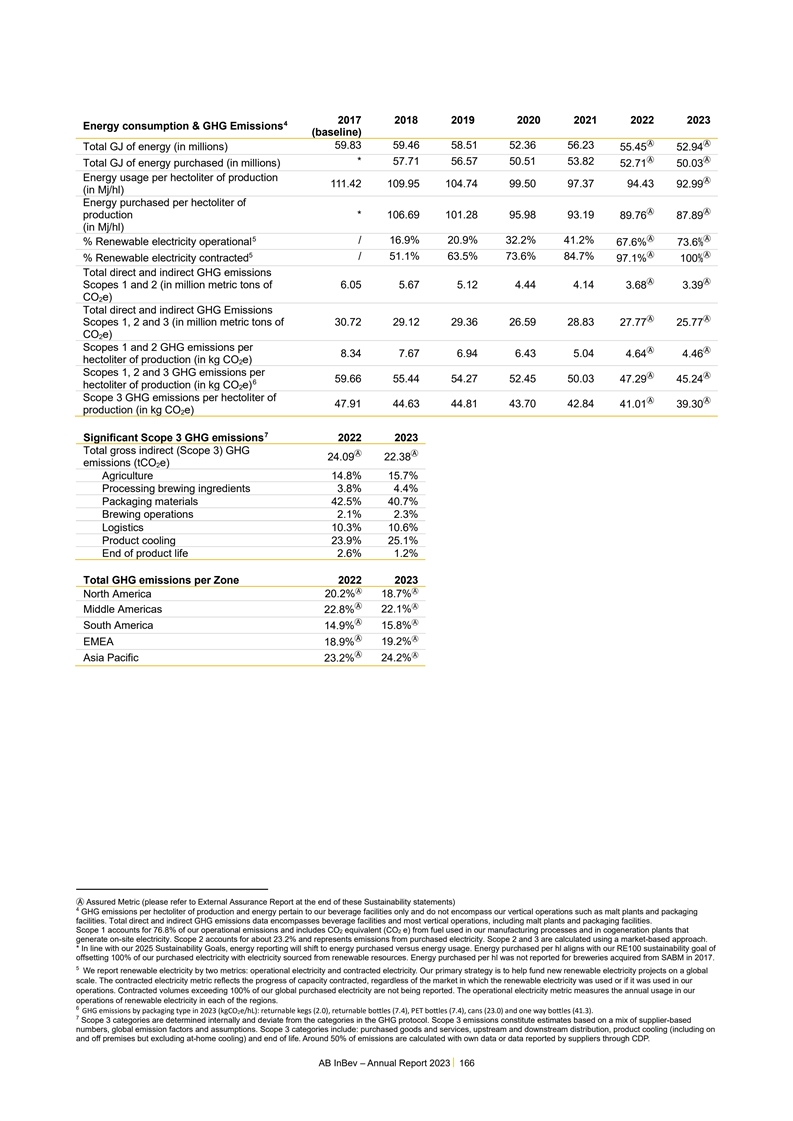
2017 2018 2019 2020 2021 2022 2023 4 Energy consumption & GHG
Emissions (baseline) ⒶⒶ 59.83 59.46 58.51 52.36 56.23 Total GJ of energy (in millions) 55.45 52.94 ⒶⒶ * 57.71 56.57 50.51 53.82 Total GJ of energy purchased (in millions) 52.71 50.03 Energy usage per hectoliter of production
Ⓐ 111.42 109.95 104.74 99.50 97.37 94.43 92.99 (in Mj/hl) Energy purchased per hectoliter of ⒶⒶ production * 106.69 101.28 95.98 93.19 89.76 87.89 (in Mj/hl) ⒶⒶ 5 / 16.9% 20.9% 32.2% 41.2% % Renewable electricity
operational 67.6% 73.6% ⒶⒶ 5 / 51.1% 63.5% 73.6% 84.7% % Renewable electricity contracted 97.1% 100% Total direct and indirect GHG emissions ⒶⒶ Scopes 1 and 2 (in million metric tons of 6.05 5.67 5.12 4.44 4.14 3.68 3.39 CO
e) 2 Total direct and indirect GHG Emissions ⒶⒶ Scopes 1, 2 and 3 (in million metric tons of 30.72 29.12 29.36 26.59 28.83 27.77 25.77 CO e) 2 Scopes 1 and 2 GHG emissions per ⒶⒶ 8.34 7.67 6.94 6.43 5.04 4.64 4.46 hectoliter
of production (in kg CO e) 2 Scopes 1, 2 and 3 GHG emissions per ⒶⒶ 59.66 55.44 54.27 52.45 50.03 47.29 45.24 6 hectoliter of production (in kg CO e) 2 Scope 3 GHG emissions per hectoliter of ⒶⒶ 47.91 44.63 44.81 43.70 42.84
41.01 39.30 production (in kg CO e) 2 7 Significant Scope 3 GHG emissions 2022 2023 Total gross indirect (Scope 3) GHG ⒶⒶ 24.09 22.38 emissions (tCO e) 2 Agriculture 14.8% 15.7% Processing brewing ingredients 3.8% 4.4% Packaging
materials 42.5% 40.7% Brewing operations 2.1% 2.3% Logistics 10.3% 10.6% Product cooling 23.9% 25.1% End of product life 2.6% 1.2% Total GHG emissions per Zone 2022 2023 ⒶⒶ North America 20.2% 18.7% ⒶⒶ 22.1% Middle Americas
22.8% Ⓐ Ⓐ South America 14.9% 15.8% ⒶⒶ EMEA 18.9% 19.2% ⒶⒶ Asia Pacific 23.2% 24.2% Ⓐ Assured Metric (please refer to External Assurance Report at the end of these Sustainability statements) 4 GHG emissions
per hectoliter of production and energy pertain to our beverage facilities only and do not encompass our vertical operations such as malt plants and packaging facilities. Total direct and indirect GHG emissions data encompasses beverage facilities
and most vertical operations, including malt plants and packaging facilities. Scope 1 accounts for 76.8% of our operational emissions and includes CO2 equivalent (CO2 e) from fuel used in our manufacturing processes and in cogeneration plants that
generate on-site electricity. Scope 2 accounts for about 23.2% and represents emissions from purchased electricity. Scope 2 and 3 are calculated using a market-based approach. * In line with our 2025 Sustainability Goals, energy reporting will shift
to energy purchased versus energy usage. Energy purchased per hl aligns with our RE100 sustainability goal of offsetting 100% of our purchased electricity with electricity sourced from renewable resources. Energy purchased per hl was not reported
for breweries acquired from SABM in 2017. 5 We report renewable electricity by two metrics: operational electricity and contracted electricity. Our primary strategy is to help fund new renewable electricity projects on a global scale. The contracted
electricity metric reflects the progress of capacity contracted, regardless of the market in which the renewable electricity was used or if it was used in our operations. Contracted volumes exceeding 100% of our global purchased electricity are not
being reported. The operational electricity metric measures the annual usage in our operations of renewable electricity in each of the regions. 6 GHG emissions by packaging type in 2023 (kgCO e/hL): returnable kegs (2.0), returnable botles (7.4),
PET botles (7.4), cans (23.0) and one way botles (41.3 ). 2 7 Scope 3 categories are determined internally and deviate from the categories in the GHG protocol. Scope 3 emissions constitute estimates based on a mix of supplier-based numbers, global
emission factors and assumptions. Scope 3 categories include: purchased goods and services, upstream and downstream distribution, product cooling (including on and off premises but excluding at-home cooling) and end of life. Around 50% of emissions
are calculated with own data or data reported by suppliers through CDP. AB InBev – Annual Report 2023 166
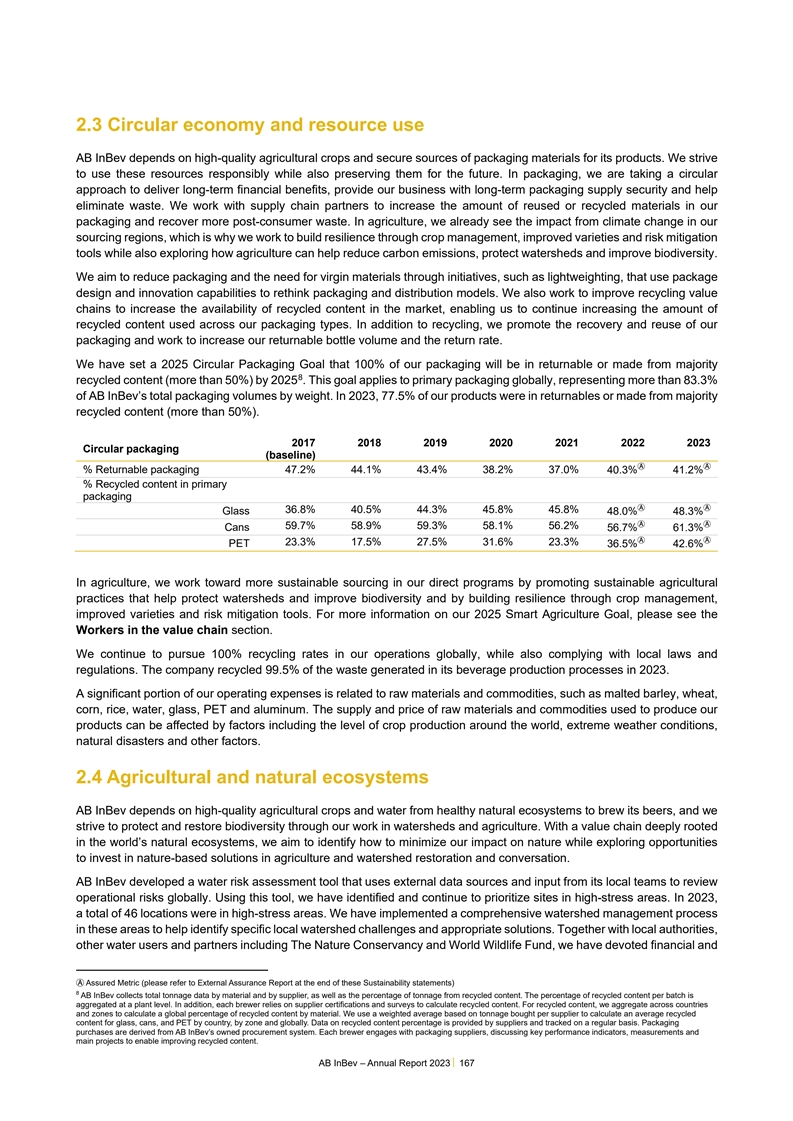
2.3 Circular economy and resource use AB InBev depends on high-quality
agricultural crops and secure sources of packaging materials for its products. We strive to use these resources responsibly while also preserving them for the future. In packaging, we are taking a circular approach to deliver long-term financial
benefits, provide our business with long-term packaging supply security and help eliminate waste. We work with supply chain partners to increase the amount of reused or recycled materials in our packaging and recover more post-consumer waste. In
agriculture, we already see the impact from climate change in our sourcing regions, which is why we work to build resilience through crop management, improved varieties and risk mitigation tools while also exploring how agriculture can help reduce
carbon emissions, protect watersheds and improve biodiversity. We aim to reduce packaging and the need for virgin materials through initiatives, such as lightweighting, that use package design and innovation capabilities to rethink packaging and
distribution models. We also work to improve recycling value chains to increase the availability of recycled content in the market, enabling us to continue increasing the amount of recycled content used across our packaging types. In addition to
recycling, we promote the recovery and reuse of our packaging and work to increase our returnable bottle volume and the return rate. We have set a 2025 Circular Packaging Goal that 100% of our packaging will be in returnable or made from majority 8
recycled content (more than 50%) by 2025 . This goal applies to primary packaging globally, representing more than 83.3% of AB InBev’s total packaging volumes by weight. In 2023, 77.5% of our products were in returnables or made from majority
recycled content (more than 50%). 2017 2018 2019 2020 2021 2022 2023 Circular packaging (baseline) ⒶⒶ % Returnable packaging 47.2% 44.1% 43.4% 38.2% 37.0% 40.3% 41.2% % Recycled content in primary packaging ⒶⒶ 36.8% 40.5%
44.3% 45.8% 45.8% Glass 48.0% 48.3% ⒶⒶ 59.7% 58.9% 59.3% 58.1% 56.2% Cans 56.7% 61.3% ⒶⒶ 23.3% 17.5% 27.5% 31.6% 23.3% PET 36.5% 42.6% In agriculture, we work toward more sustainable sourcing in our direct programs by
promoting sustainable agricultural practices that help protect watersheds and improve biodiversity and by building resilience through crop management, improved varieties and risk mitigation tools. For more information on our 2025 Smart Agriculture
Goal, please see the Workers in the value chain section. We continue to pursue 100% recycling rates in our operations globally, while also complying with local laws and regulations. The company recycled 99.5% of the waste generated in its beverage
production processes in 2023. A significant portion of our operating expenses is related to raw materials and commodities, such as malted barley, wheat, corn, rice, water, glass, PET and aluminum. The supply and price of raw materials and
commodities used to produce our products can be affected by factors including the level of crop production around the world, extreme weather conditions, natural disasters and other factors. 2.4 Agricultural and natural ecosystems AB InBev depends on
high-quality agricultural crops and water from healthy natural ecosystems to brew its beers, and we strive to protect and restore biodiversity through our work in watersheds and agriculture. With a value chain deeply rooted in the world’s
natural ecosystems, we aim to identify how to minimize our impact on nature while exploring opportunities to invest in nature-based solutions in agriculture and watershed restoration and conversation. AB InBev developed a water risk assessment tool
that uses external data sources and input from its local teams to review operational risks globally. Using this tool, we have identified and continue to prioritize sites in high-stress areas. In 2023, a total of 46 locations were in high-stress
areas. We have implemented a comprehensive watershed management process in these areas to help identify specific local watershed challenges and appropriate solutions. Together with local authorities, other water users and partners including The
Nature Conservancy and World Wildlife Fund, we have devoted financial and Ⓐ Assured Metric (please refer to External Assurance Report at the end of these Sustainability statements) 8 AB InBev collects total tonnage data by material and by
supplier, as well as the percentage of tonnage from recycled content. The percentage of recycled content per batch is aggregated at a plant level. In addition, each brewer relies on supplier certifications and surveys to calculate recycled content.
For recycled content, we aggregate across countries and zones to calculate a global percentage of recycled content by material. We use a weighted average based on tonnage bought per supplier to calculate an average recycled content for glass, cans,
and PET by country, by zone and globally. Data on recycled content percentage is provided by suppliers and tracked on a regular basis. Packaging purchases are derived from AB InBev’s owned procurement system. Each brewer engages with packaging
suppliers, discussing key performance indicators, measurements and main projects to enable improving recycled content. AB InBev – Annual Report 2023 167
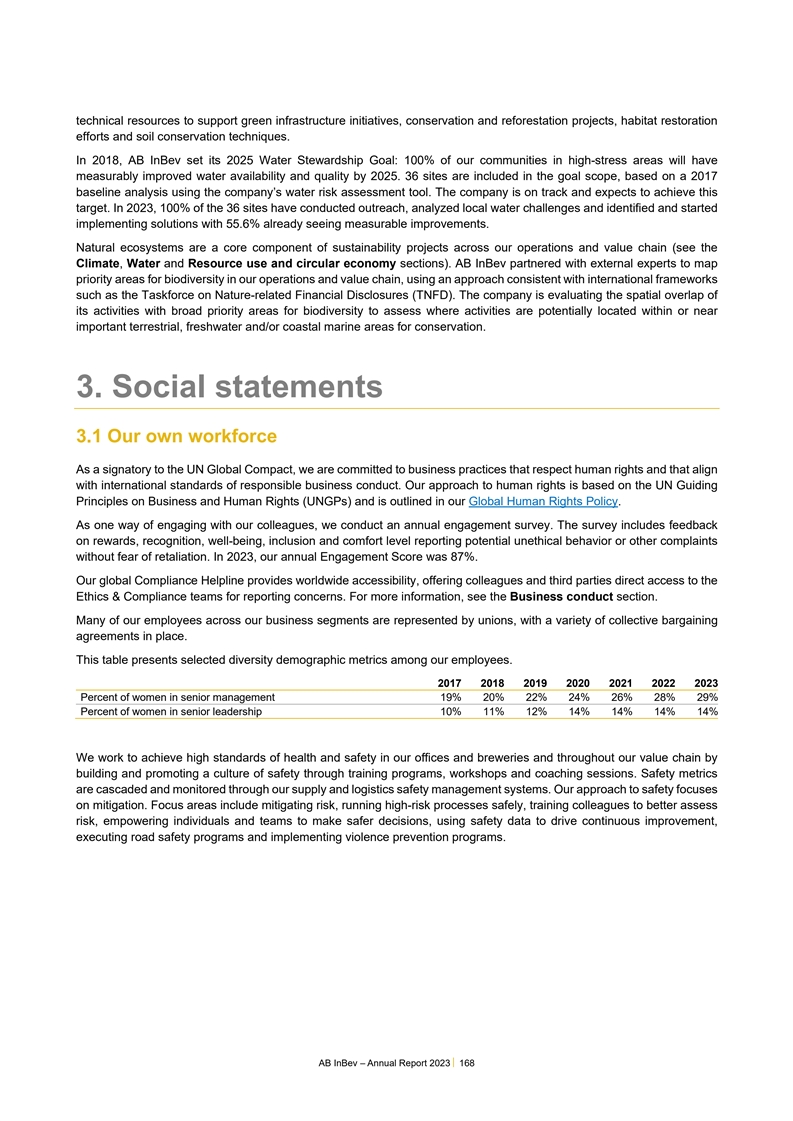
technical resources to support green infrastructure initiatives,
conservation and reforestation projects, habitat restoration efforts and soil conservation techniques. In 2018, AB InBev set its 2025 Water Stewardship Goal: 100% of our communities in high-stress areas will have measurably improved water
availability and quality by 2025. 36 sites are included in the goal scope, based on a 2017 baseline analysis using the company’s water risk assessment tool. The company is on track and expects to achieve this target. In 2023, 100% of the 36
sites have conducted outreach, analyzed local water challenges and identified and started implementing solutions with 55.6% already seeing measurable improvements. Natural ecosystems are a core component of sustainability projects across our
operations and value chain (see the Climate, Water and Resource use and circular economy sections). AB InBev partnered with external experts to map priority areas for biodiversity in our operations and value chain, using an approach consistent with
international frameworks such as the Taskforce on Nature-related Financial Disclosures (TNFD). The company is evaluating the spatial overlap of its activities with broad priority areas for biodiversity to assess where activities are potentially
located within or near important terrestrial, freshwater and/or coastal marine areas for conservation. 3. Social statements 3.1 Our own workforce As a signatory to the UN Global Compact, we are committed to business practices that respect human
rights and that align with international standards of responsible business conduct. Our approach to human rights is based on the UN Guiding Principles on Business and Human Rights (UNGPs) and is outlined in our Global Human Rights Policy. As one way
of engaging with our colleagues, we conduct an annual engagement survey. The survey includes feedback on rewards, recognition, well-being, inclusion and comfort level reporting potential unethical behavior or other complaints without fear of
retaliation. In 2023, our annual Engagement Score was 87%. Our global Compliance Helpline provides worldwide accessibility, offering colleagues and third parties direct access to the Ethics & Compliance teams for reporting concerns. For more
information, see the Business conduct section. Many of our employees across our business segments are represented by unions, with a variety of collective bargaining agreements in place. This table presents selected diversity demographic metrics
among our employees. 2017 2018 2019 2020 2021 2022 2023 Percent of women in senior management 19% 20% 22% 24% 26% 28% 29% Percent of women in senior leadership 10% 11% 12% 14% 14% 14% 14% We work to achieve high standards of health and safety in our
offices and breweries and throughout our value chain by building and promoting a culture of safety through training programs, workshops and coaching sessions. Safety metrics are cascaded and monitored through our supply and logistics safety
management systems. Our approach to safety focuses on mitigation. Focus areas include mitigating risk, running high-risk processes safely, training colleagues to better assess risk, empowering individuals and teams to make safer decisions, using
safety data to drive continuous improvement, executing road safety programs and implementing violence prevention programs. AB InBev – Annual Report 2023 168
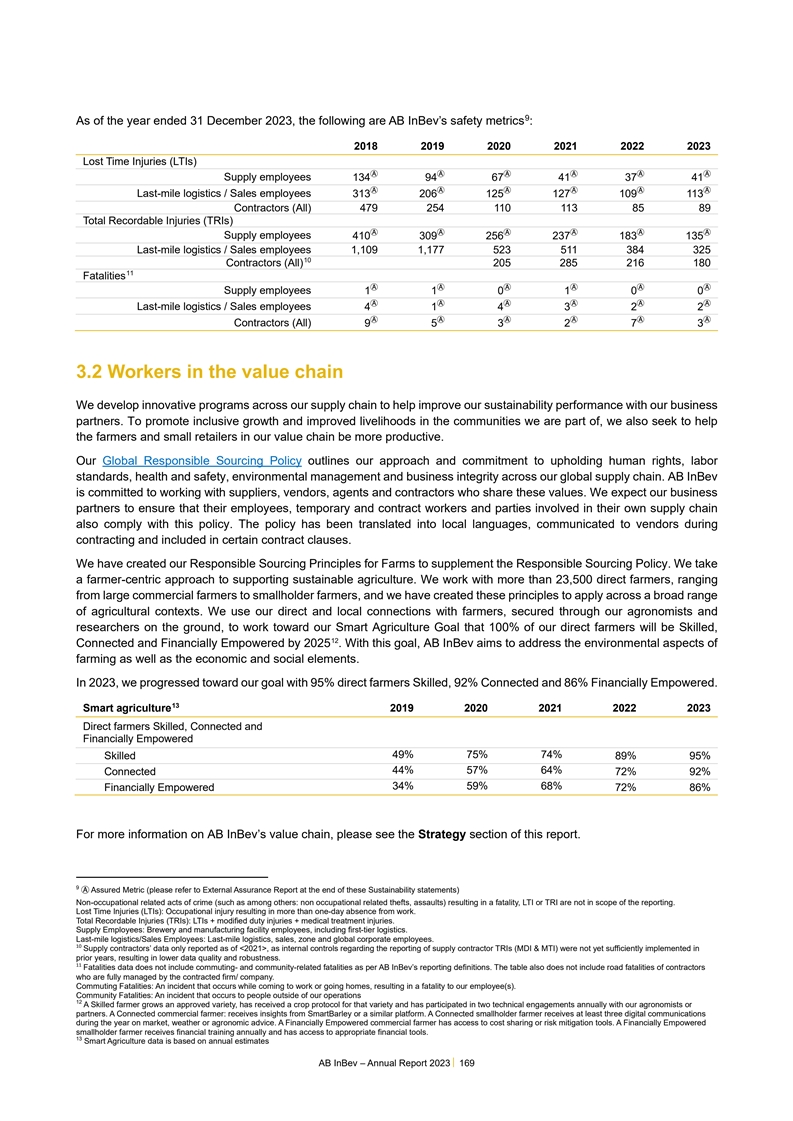
9 As of the year ended 31 December 2023, the following are AB
InBev’s safety metrics : 2018 2019 2020 2021 2022 2023 Lost Time Injuries (LTIs) ⒶⒶⒶⒶⒶⒶ Supply employees 134 94 67 41 37 41 ⒶⒶⒶⒶⒶⒶ Last-mile logistics / Sales employees
313 206 125 127 109 113 Contractors (All) 479 254 110 113 85 89 Total Recordable Injuries (TRIs) ⒶⒶⒶⒶⒶⒶ Supply employees 410 309 256 237 183 135 Last-mile logistics / Sales employees 1,109 1,177 523 511 384 325 10
Contractors (All) 205 285 216 180 11 Fatalities ⒶⒶⒶⒶⒶⒶ Supply employees 1 1 0 1 0 0 ⒶⒶⒶⒶⒶⒶ Last-mile logistics / Sales employees 4 1 4 3 2 2
ⒶⒶⒶⒶⒶⒶ Contractors (All) 9 5 3 2 7 3 3.2 Workers in the value chain We develop innovative programs across our supply chain to help improve our sustainability performance with our business partners. To promote
inclusive growth and improved livelihoods in the communities we are part of, we also seek to help the farmers and small retailers in our value chain be more productive. Our Global Responsible Sourcing Policy outlines our approach and commitment to
upholding human rights, labor standards, health and safety, environmental management and business integrity across our global supply chain. AB InBev is committed to working with suppliers, vendors, agents and contractors who share these values. We
expect our business partners to ensure that their employees, temporary and contract workers and parties involved in their own supply chain also comply with this policy. The policy has been translated into local languages, communicated to vendors
during contracting and included in certain contract clauses. We have created our Responsible Sourcing Principles for Farms to supplement the Responsible Sourcing Policy. We take a farmer-centric approach to supporting sustainable agriculture. We
work with more than 23,500 direct farmers, ranging from large commercial farmers to smallholder farmers, and we have created these principles to apply across a broad range of agricultural contexts. We use our direct and local connections with
farmers, secured through our agronomists and researchers on the ground, to work toward our Smart Agriculture Goal that 100% of our direct farmers will be Skilled, 12 Connected and Financially Empowered by 2025 . With this goal, AB InBev aims to
address the environmental aspects of farming as well as the economic and social elements. In 2023, we progressed toward our goal with 95% direct farmers Skilled, 92% Connected and 86% Financially Empowered. 13 Smart agriculture 2019 2020 2021 2022
2023 Direct farmers Skilled, Connected and Financially Empowered 49% 75% 74% Skilled 89% 95% 44% 57% 64% Connected 72% 92% 34% 59% 68% Financially Empowered 72% 86% For more information on AB InBev’s value chain, please see the Strategy
section of this report. 9 Ⓐ Assured Metric (please refer to External Assurance Report at the end of these Sustainability statements) Non-occupational related acts of crime (such as among others: non occupational related thefts, assaults)
resulting in a fatality, LTI or TRI are not in scope of the reporting. Lost Time Injuries (LTIs): Occupational injury resulting in more than one-day absence from work. Total Recordable Injuries (TRIs): LTIs + modified duty injuries + medical
treatment injuries. Supply Employees: Brewery and manufacturing facility employees, including first-tier logistics. Last-mile logistics/Sales Employees: Last-mile logistics, sales, zone and global corporate employees. 10 Supply contractors’
data only reported as of <2021>, as internal controls regarding the reporting of supply contractor TRIs (MDI & MTI) were not yet sufficiently implemented in prior years, resulting in lower data quality and robustness. 11 Fatalities data
does not include commuting- and community-related fatalities as per AB InBev’s reporting definitions. The table also does not include road fatalities of contractors who are fully managed by the contracted firm/ company. Commuting Fatalities:
An incident that occurs while coming to work or going homes, resulting in a fatality to our employee(s). Community Fatalities: An incident that occurs to people outside of our operations 12 A Skilled farmer grows an approved variety, has received a
crop protocol for that variety and has participated in two technical engagements annually with our agronomists or partners. A Connected commercial farmer: receives insights from SmartBarley or a similar platform. A Connected smallholder farmer
receives at least three digital communications during the year on market, weather or agronomic advice. A Financially Empowered commercial farmer has access to cost sharing or risk mitigation tools. A Financially Empowered smallholder farmer receives
financial training annually and has access to appropriate financial tools. 13 Smart Agriculture data is based on annual estimates AB InBev – Annual Report 2023 169
See Our own workers section for AB InBev’s Human Rights Policy.
Due diligence is a key enabler of our approach to human rights management: identifying actual and potential impacts and implementing measures to address, prevent and remedy issues that may arise. Responsibility for human rights is shared across
relevant functions as well as global and local teams. As an example of how local teams work to identify and address relevant human rights risks, local Legal Compliance teams convene and bring together representatives from teams including
Procurement, Sales, Supply, Logistics, People, Corporate Affairs and Marketing to map the value chain in the country and identify potential human rights impacts. During 2023, workshops were held in the Dominican Republic, Mexico and Colombia. Where
we work directly with farmers, we have mapped key risks relating to human rights and responsible sourcing. Additionally, our Procurement management system defines the risk management process, which includes human rights risk monitoring and
screening. In 2023, we assessed more than 3,500 suppliers. 3.3 Consumers and end users Responsible drinking and moderation We believe beer is part of celebrating life throughout the world and a major engine of economic activity. Data from the World
Health Organization (“WHO”) shows that the harmful consumption of alcohol has decreased globally over the last decade. As the world’s leading brewer, we are committed to helping our consumers make smart choices while enjoying our
products, and we aim to use the core strengths of our business and invest in evidence-based initiatives to promote “Smart Drinking”. Social Norms Marketing Research indicates that individual patterns of consumption can be improved by
reminding consumers that moderation and control are the group norms. Social norms marketing is a combination of evidence-based techniques proven to promote specific positive behaviors. Through social norms marketing, we aim to improve consumption
patterns by promoting social norms that produce positive outcomes. Our social norm efforts are built around the following programs: • Investing in social norms marketing campaigns and programs: In 2015, we committed to invest 1 billion USD
across our markets in dedicated social marketing campaigns and related programs by the end of 2025. We are 14 on track to meet our goal by 2025, with investment of approximately 900 million USD through 2023. • Adhering to a clear code of
Responsible Marketing and Communications (RMCC): The RMCC sets the standards for our marketing and commercial communication worldwide to ensure that our commercial communications are aimed only at individuals above the legal drinking age and are
carried out in a socially responsible manner. Our Sales, Marketing, Legal and Corporate Affairs colleagues, contractors, and agencies are trained periodically in matters related to the RMCC. • Establishing Digital Guiding Principles: In 2014,
we worked with the International Alliance for Responsible Drinking (IARD) and the World Federation of Advertisers (WFA) to develop the International Digital Guiding Principles (IDGP). These are a set of standards for responsible digital marketing,
age affirmation mechanisms, site transparency, user generated content regulation, forward advice notice and a responsible drinking message. Multi-Year Pilots We believe we need to work with communities to reduce harmful drinking and offer impactful
evidence-based interventions. Through our Smart Drinking City Pilots, we identified best practices that could be scaled up, we have identified three interventions that we believe can be most impactful in helping to reduce the harmful effects of
drinking and are working on making these tools accessible and scalable. • Responsible Beverage Service Trainings: This training program for community point-of-sale professionals, such as bar keepers and servers, aims to promote positive
consumer behaviors. • Screenings and Brief Interventions: This preventive program measures an individual’s drinking pattern during outpatient or wellness visits and motivates those identified as being at risk of harmful consumption of
alcohol to change their behavior. • Road Safety Initiatives: We support the United Nations goal to halve the number of road traffic fatalities by 2030 and invest in innovative programs to improve road safety and reduce injuries and fatalities
from traffic collisions. In 2023, we renewed and expanded our partnership with United Nations Institute for Training and Research to 14 472 million USD of the total amount has been validated through an independent external auditor. The remaining
investment figures are under review. Total investment could potentially change based on results of external assurance process results. AB InBev – Annual Report 2023 170
improve road safety. We continue to work with Together for Safer
Roads, a private-sector coalition focused on improving road safety. In partnership with local experts, governments and the AB InBev Foundation, we are supporting 53 programs across 21 countries using the evidence-based techniques we tested in our
City Pilots. Providing choice in our product portfolio In 2015, we led the industry by setting a goal of expanding our no- and low-alcohol beer volume to represent 20% of our global beer volume by the end of 2025, bringing global attention and
eventually momentum to this category. In 2023, 6.83% of our global beer volume was less than 3.5% alcohol by volume (ABV). Although we have been striving to meet our goal, we believe we will not reach the target of 20% by 2025. When measured against
the typical 5% ABV for beer, lower-alcohol alternatives are a larger part of our portfolio. Today, products at 4.5% ABV or below represent 54% of our portfolio. We are committed to expanding our portfolio of no-alcohol and lower-alcohol products to
give consumers more choice and promote moderation and responsible drinking worldwide. We are furthering this effort by featuring Corona Cero, our fast- growing zero alcohol beer brand, as the leading global Worldwide Olympic Partner brand. Labeling
Our labels and secondary packaging are a key touchpoint with consumers. Many countries do not require guidance labels. However, as part of our voluntary guidance labeling initiative, in 26 countries where there is currently no legal mandate for
legal warnings, we have updated our label designs on our primary product packaging to provide actionable advice to consumers. Product quality Our passion for beer transfers to our uncompromising commitment to quality to help ensure our consumers
enjoy the freshest, best-tasting beers. In our efforts to maintain product safety, we follow a comprehensive quality management system at our breweries and other sites, and we extend these standards to our suppliers. If consumers have questions,
comments or issues, they may speak to a company representative by calling our toll-free customer service number, printed on our packaging. In 2023, we experienced a 23% year-on-year reduction in consumer complaints. In 2023, 100% of our sites were
internally audited against the BRC Global Standard Food Safety Requirements and 44% of these sites were externally audited. AB InBev, as a consumer product company, may be subject to product recall or other associated liabilities, which could
adversely impact our business, reputation and performance. AB InBev – Annual Report 2023 171
4. Governance statements 4.1 Business conduct Business conduct
policies Our Code of Business Conduct contains ethical principles and includes policies that define colleagues’ responsibilities and expected behavior, addressing key risk areas such as anti-corruption, human rights, digital ethics and data
privacy, harassment and discrimination, and conflict of interest. For more information on this policy, see the Corporate governance statement in this report. Grievance mechanism and investigation process Through our Whistleblower Policy, we
encourage colleagues to speak up. We have a zero-tolerance policy toward any threatened or actual retaliation against anyone who, in good faith, raises concerns or participates in an investigation. Any concerns with respect to potential violations
of our Code of Business Conduct, policies and applicable laws or regulations can be reported through our Compliance Helpline. This secure means of reporting is available 24/7 for internal and external users. Reports can be filed in different
languages, and if desired and permitted by local law, anonymously. All reports are taken seriously and are promptly reviewed by the Ethics & Compliance team. Training and policy awareness AB InBev annually launches a series of mandatory training
modules to educate our workforce on our Code of Business Conduct and policies. In addition to trainings, policies are available to all employees online, including versions in multiple languages. To help ensure the correct application and
interpretation of the company’s policies, colleagues can seek guidance and request compliance approvals via our Compliance Channel. All submissions undergo comprehensive review by specialized teams. In 2023, our platform received over 2000
requests from colleagues, with dedicated teams diligently following up. Detecting risks Our compliance data analytics and management platform, BrewRIGHT, works to aggregate, standardize and visualize company systems to identify patterns in everyday
operations to predict and attempt to identify any potential corruption risk within the company. AB InBev – Annual Report 2023 172
5. Report scope Report Scope AB InBev prepared the 2023 Sustainability
statements using the Global Reporting Initiative’s (GRI) Standards and the Sustainability Accounting Standards Board (SASB) Standards as guides. To help determine the content developed, a materiality assessment was conducted, which helped
identify the key issues that are of most importance to our stakeholders and our company. The GRI Index and the SASB Index for this year’s statements can be found in Appendix 3 and 4, which is an integral part of these Sustainability
statements. The data presented in the 2023 Sustainability statements were gathered and verified with the assistance of content owners across all functions and geographic zones. AB InBev has established processes to support accurate and consistent
reporting of Smart Drinking, 2025 Sustainability Goals and safety performance data, as well as key performance indicators (KPIs). In the Limited Assurance Report of the Independent Auditor (section 7 in the 2023 Sustainability statements) and in key
places throughout the report, we have identified which metrics have been subject to this independent assurance. Those assured metrics are marked with the symbol Ⓐ. Unless otherwise noted, the scope of the Sustainability statements is aligned
with the group’s financial reporting. Environmental data from newly acquired operations are excluded from the running cycle. These facilities will be included in future reporting. Where data are not internally available, for instance due to
newly acquired operations, reporting estimates are used. For recycled content in primary packaging and Scope 3 GHG emissions, we estimate values based on a mix of our own and third-party data as these include upstream and/or downstream activities of
our organization. The total percentage of Scope 3 emissions follows the Science Based Targets initiative, where at least 66% of emissions are to be included in the target scope. Approximately half of Scope 3 data are our own data and data provided
by our suppliers via CDP (formerly the “Carbon Disclosure Project”). Safety data is immediately tracked and monitored for all sites and included unless otherwise stated in text or footnotes. End-of-year incident data in this report is
captured in mid-January of the following year and validated based on information from that point. Injuries may develop and change status based on further medical diagnosis, treatment and incident management. This is a consistent practice to enable
accurate year-over-year data comparison of a single point in time. Subsequent changes to the injury classification in the years following the reporting year are not considered for current year’s reporting purposes nor in the comparative data
of prior years. Global goals on water, energy purchased and GHG emissions presented in this report, as well as KPIs such as energy usage include both our beverage and vertical operations unless stated otherwise in text or footnotes. The use and
purchase of energy excludes the energy exported to third parties and certain projects under construction. The excluded use and purchase of energy does not reflect the amount of energy used in our beer brewing processes. For our beverage and vertical
operations, including malting and packaging facilities, we use our operations management system VPO. The key performance indicators energy usage, water usage and Scopes 1 and 2 emissions per hectoliter of production (in kilograms CO2/hectoliter)
exclude vertical operations. This data is reported annually to CDP. Specific data tables contain footnotes for additional data. Special Operations (SOPs) fulfill one or more criteria including reduced volume, low number of FTEs, complexity of brand
mix, unusual products or production processes. These are excluded from the reporting scope. The potential impact of the 67 SOPs facilities accounted for in 2023 is estimated to be 2.7% of the total Scope 1 and 2 emissions. This percentage deviation
on emissions equally is the maximum deviation expected for all other KPIs. The following assumptions are applied for the calculation of this percentage: 1) country average of Scopes 1 and 2 emissions per hectoliter is applied, 2) average production
volume per country is applied, 3) for experimental centers, the tons of CO2 applied are the same as those for small facilities and 4) for the SOPs verticalized operations, emissions averages from larger existing sites apply. We report renewable
electricity by two metrics: operational electricity and contracted electricity. Our primary strategy is to help fund new renewable electricity projects, and as these can take time to build, we believe it is important to report both metrics. The
contracted electricity metric tracks the progress of all renewable electricity contracted, regardless of the market in which the renewable electricity was used or if it was used in our operations. The operational electricity measures our actual
annual realization towards our goal of 100% renewable electricity in each of the regions where we operate by 2025. AB InBev – Annual Report 2023 173
For recycled content calculation, a weighted average of recycled
content is calculated based on purchases for each supplier and recycled content in the material. Our packaging goal applies to our primary packaging, which represents more than 82% of our total packaging volume by weight globally, though our work in
circularity extends to secondary packaging and post-consumer waste. For packaging that is not returnable (such as one-way glass bottles, aluminum cans and PET bottles), we are committed to reaching a minimum of 50% recycled content. Data on recycled
content percentage is provided by suppliers and tracked on a regular basis. Packaging purchases are derived from AB InBev’s owned procurement system. We engage with packaging suppliers, discussing their key performance indicators, measurements
and main projects to enable improving recycled content. For the Scopes 1 and 2 emissions calculation, the facilities in scope described above are included. Scope 3 emissions, which account for information that is beyond our operations and that
impacts our supply chain, are estimated values based on a mix of our own and third-party data. The total percentage of Scope 3 emissions follows the Science Based Targets Initiative, where at least 66% of emissions are to be included in target
scope. Approximately 50% of Scope 3 data is our own data and data provided by suppliers via CDP. CDP data is used to calculate supplier-based emissions of raw and packaging materials used in the manufacturing of beer. A hybrid approach that has been
validated by the Science Based Targets initiative and CDP is used, which entails a mix of own data, supplier data and market estimates. Scope 3 includes the following out of the 15 categories: purchased good and services, upstream and downstream
distribution, emissions related to fuel use not included in Scopes 1 and 2, use of product (product cooling, including on and off premise and excluding at-home cooling) and end of product life. Categories excluded include capital goods, waste
generated in operations (more than 99% of waste generated is recycled), business travel, commuting, upstream and downstream leased assets, processing of sold products, franchises and investments. These categories represent approximately less than
10% of total Scope 3 emissions. We expect that our ambition to achieve net zero and the supporting data may be revised as measurement standards, modelling methodology and the level of data granularity improve. AB InBev – Annual Report 2023
174
6. Independent Limited Assurance Report Report on selected
sustainability information regarding the reporting year 2023 included in the AB InBev Sustainability Statements 2023 To the Board of Directors of AB InBev We have performed a limited assurance engagement on whether Anheuser Bush InBev NV (“AB
InBev”)’s selected sustainability information as of and for the year ended December 31, 2023, listed below and marked with the symbol in the AB InBev Sustainability Statements 2023 (the “Selected Information”) has been
prepared in accordance with the applied reporting criteria as disclosed in the section Report scope (pp. 173) in the AB InBev Sustainability Statements 2023 (the “Reporting Criteria”). The Selected Information is described below: •
Water Use by Hectoliter of Production, Total Water Use in hl (pp. 162) • Total Water Use in Hectoliter, per source (pp. 162) • Water discharges – Total Volume (pp. 162) • Water discharges – Volume by destination (pp.
162) • Water discharges – Volume by treatment (pp. 162) • Water recycled and/or reused volume (pp. 162) • Total Energy purchased and Energy purchased per Hectoliter of Production (pp. 166) • Energy usage per Hectoliter
of Production (MJ/hl) (pp. 166) • Percentage of purchased (operational) electricity from renewable sources (pp. 166) • Percentage of contracted electricity from renewable sources (pp. 166) • Total Direct and Indirect GHG Emissions
(in metric tons of Co2e) and GHG Emissions per Hectoliter of Production (in kg Co2e/hl) (pp. 166) • Total Direct and Indirect GHG emissions (in metric tons of Co2e), per zone (pp. 166) • Total Scope 3 GHG Emissions (in metric tons of
Co2e) and per Hectoliter of Production (in kg Co2e/hl) (pp. 166) • Percentage of returnable primary packaging (pp. 167) • Percentage of recycled content in primary packaging (pp. 167) • Lost Time Injuries (LTI) – Supply
Employees, Last-mile logistics / Sales Employees (pp. 169) • Total Recordable Injuries (TRI) – Supply Employees (pp. 169) • Fatalities (pp. 169) Based on the procedures performed and evidence obtained, nothing has come to our
attention to cause us to believe that AB InBev’s Selected Information as of and for the year ended December 31, 2023 is not prepared, in all material respects, in accordance with the Reporting Criteria. Our conclusion on the Selected
Information does not extend to any other information that accompanies or contains the Selected Information and our assurance report. Basis for conclusion We conducted our engagement in accordance with International Standard on Assurance Engagements
(ISAE) 3000 (Revised), Assurance Engagements Other Than Audits or Reviews of Historical Financial Information issued by the International Auditing and Assurance Standards Board (IAASB). Our responsibilities under this standard are further described
in the “Our responsibilities” section of our report. We have complied with the independence and other ethical requirements of the International Code of Ethics for Professional Accountants (including International Independence Standards)
issued by the International Ethics Standards Board for Accountants (IESBA). Our firm applies International Standard on Quality Management (ISQM) 1, Quality Management for Firms that Perform Audits or Reviews of Financial Statements, or Other
Assurance or Related Services Engagements, issued by the IAASB. AB InBev – Annual Report 2023 175
This standard requires the firm to design, implement and operate a
system of quality management, including policies or procedures regarding compliance with ethical requirements, professional standards and applicable legal and regulatory requirements. We believe that the evidence we have obtained is sufficient and
appropriate to provide a basis for our conclusion. Responsibilities for the Selected Information The management of AB InBev is responsible for • designing, implementing and maintaining internal control relevant to the preparation of the
Selected Information that is free from material misstatement, whether due to fraud or error; • selecting or developing suitable criteria for preparing the Selected Information and appropriately referring to or describing the criteria used; and
• preparing the Selected Information in accordance with the Reporting Criteria. Our responsibilities We are responsible for: • planning and performing the engagement to obtain limited assurance about whether the Selected Information is
free from material misstatement, whether due to fraud or error; • forming an independent conclusion, based on the procedures we have performed and the evidence we have obtained; and • reporting our conclusion to the Board of Directors of
AB InBev. We exercised professional judgment and maintained professional skepticism throughout the engagement. We designed and performed our procedures to obtain evidence about the selected Information that is sufficient and appropriate to provide a
basis for our conclusion. Our procedures selected depended on our understanding of the Selected Information and other engagement circumstances, and our consideration of areas where material misstatements are likely to arise. In carrying out our
engagement, we: • Interviewed relevant staff responsible for providing the information, for carrying out internal control procedures on the Selected Information and consolidating the data in the AB InBev Sustainability Statements 2023; •
Performed site visits to seven production sites in South-Africa (two sites), Brazil, China, Belgium, the United States of America and Mexico aimed at, on a local level, validating source data and evaluating the design and implementation of internal
control and validation procedures; • Reviewed relevant internal and external documentation, on a limited test basis, in order to determine the reliability of the Selected Information; • Evaluated for a selection of estimates included in
the Selected Information the plausibility of the identified methods and selected assumptions, as well as the relevance and reliability of selected data sources used for their determination, and verifying the mathematical accuracy of the underlying
calculations; • Performed preliminary and final analytical review procedures to confirm our understanding of trends in the Selected Information at site and corporate level. The procedures performed in a limited assurance engagement vary in
nature and timing from, and are less in extent than for, a reasonable assurance engagement. Consequently, the level of assurance obtained in a limited assurance engagement is substantially lower than the assurance that would have been obtained had a
reasonable assurance engagement been performed. Brussels, 29 February 2024 KPMG Bedrijfsrevisoren Mike Boonen - Bedrijfsrevisor AB InBev – Annual Report 2023 176
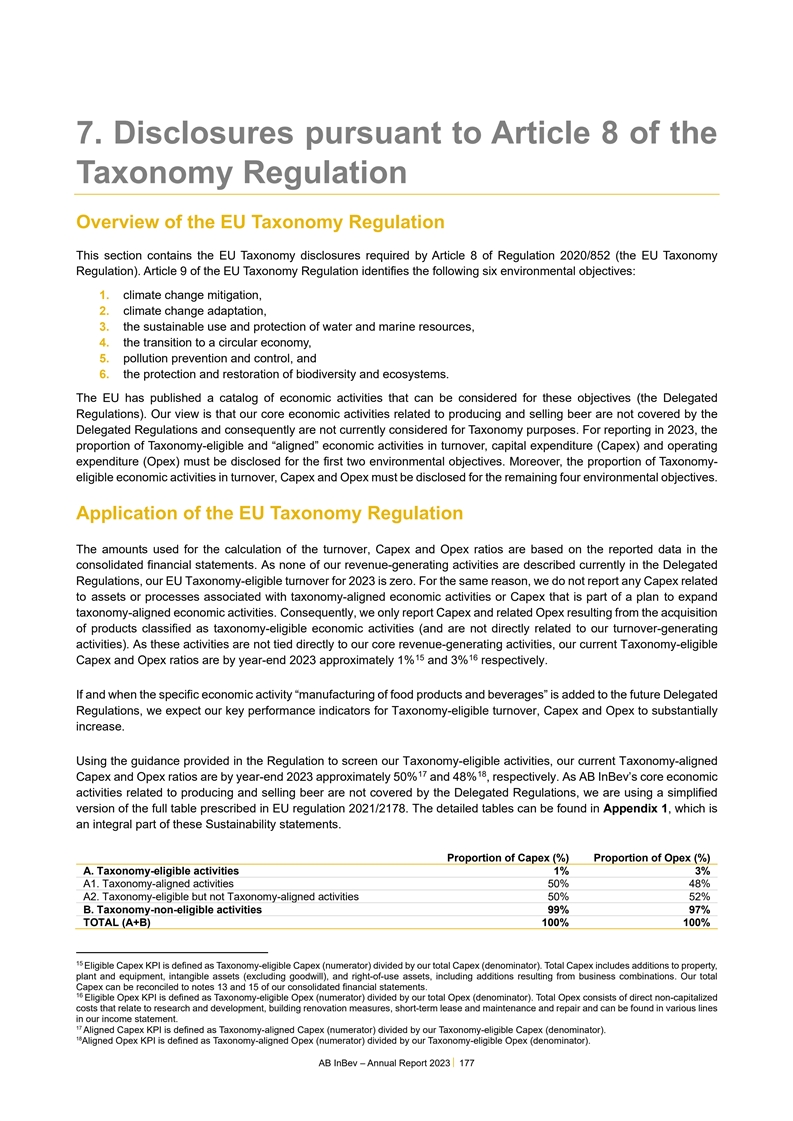
7. Disclosures pursuant to Article 8 of the Taxonomy Regulation
Overview of the EU Taxonomy Regulation This section contains the EU Taxonomy disclosures required by Article 8 of Regulation 2020/852 (the EU Taxonomy Regulation). Article 9 of the EU Taxonomy Regulation identifies the following six environmental
objectives: 1. climate change mitigation, 2. climate change adaptation, 3. the sustainable use and protection of water and marine resources, 4. the transition to a circular economy, 5. pollution prevention and control, and 6. the protection and
restoration of biodiversity and ecosystems. The EU has published a catalog of economic activities that can be considered for these objectives (the Delegated Regulations). Our view is that our core economic activities related to producing and selling
beer are not covered by the Delegated Regulations and consequently are not currently considered for Taxonomy purposes. For reporting in 2023, the proportion of Taxonomy-eligible and “aligned” economic activities in turnover, capital
expenditure (Capex) and operating expenditure (Opex) must be disclosed for the first two environmental objectives. Moreover, the proportion of Taxonomy- eligible economic activities in turnover, Capex and Opex must be disclosed for the remaining
four environmental objectives. Application of the EU Taxonomy Regulation The amounts used for the calculation of the turnover, Capex and Opex ratios are based on the reported data in the consolidated financial statements. As none of our
revenue-generating activities are described currently in the Delegated Regulations, our EU Taxonomy-eligible turnover for 2023 is zero. For the same reason, we do not report any Capex related to assets or processes associated with taxonomy-aligned
economic activities or Capex that is part of a plan to expand taxonomy-aligned economic activities. Consequently, we only report Capex and related Opex resulting from the acquisition of products classified as taxonomy-eligible economic activities
(and are not directly related to our turnover-generating activities). As these activities are not tied directly to our core revenue-generating activities, our current Taxonomy-eligible 15 16 Capex and Opex ratios are by year-end 2023 approximately
1% and 3% respectively. If and when the specific economic activity “manufacturing of food products and beverages” is added to the future Delegated Regulations, we expect our key performance indicators for Taxonomy-eligible turnover,
Capex and Opex to substantially increase. Using the guidance provided in the Regulation to screen our Taxonomy-eligible activities, our current Taxonomy-aligned 17 18 Capex and Opex ratios are by year-end 2023 approximately 50% and 48% ,
respectively. As AB InBev’s core economic activities related to producing and selling beer are not covered by the Delegated Regulations, we are using a simplified version of the full table prescribed in EU regulation 2021/2178. The detailed
tables can be found in Appendix 1, which is an integral part of these Sustainability statements. Proportion of Capex (%) Proportion of Opex (%) A. Taxonomy-eligible activities 1% 3% A1. Taxonomy-aligned activities 50% 48% A2. Taxonomy-eligible but
not Taxonomy-aligned activities 50% 52% B. Taxonomy-non-eligible activities 99% 97% TOTAL (A+B) 100% 100% 15 Eligible Capex KPI is defined as Taxonomy-eligible Capex (numerator) divided by our total Capex (denominator). Total Capex includes
additions to property, plant and equipment, intangible assets (excluding goodwill), and right-of-use assets, including additions resulting from business combinations. Our total Capex can be reconciled to notes 13 and 15 of our consolidated financial
statements. 16 Eligible Opex KPI is defined as Taxonomy-eligible Opex (numerator) divided by our total Opex (denominator). Total Opex consists of direct non-capitalized costs that relate to research and development, building renovation measures,
short-term lease and maintenance and repair and can be found in various lines in our income statement. 17 Aligned Capex KPI is defined as Taxonomy-aligned Capex (numerator) divided by our Taxonomy-eligible Capex (denominator). 18 Aligned Opex KPI is
defined as Taxonomy-aligned Opex (numerator) divided by our Taxonomy-eligible Opex (denominator). AB InBev – Annual Report 2023 177
It is relevant to clarify that “non-eligibility” under
the EU Taxonomy Regulation refers to the fact that the activities at present remain outside of the scope of the economic activities for which technical screening criteria have been developed under the Delegated Regulations. As such, non-eligible
actives under the EU Taxonomy should not be interpreted as an indication of our sustainability performance or ambition. Additionally, we would expect these key performance indicators to increase as the four remaining environmental objectives are
added to the Delegated Regulations and additional activities are included in the criteria for all environmental objectives. The EU Taxonomy will evolve, and the delegated acts will be integrated progressively, to include all the activities with the
potential to contribute to the six environmental objectives. We may revise the definitions used to derive alignment data, as we continue to develop our understanding of the EU Taxonomy. Although these ratios do not currently concern our core
activities, we have analyzed the eligibility and alignment ratios. Capex and Opex for activities performed outside the EU were deemed in many cases not Taxonomy-aligned for this report. AB InBev does not engage in activities related to fossil gas
and nuclear energy. Template 1 of Annex XII of Delegated Regulation (EU) 2021/2178 can be found in Appendix 2, which is an integral part of these Sustainability statements. Current other activities and outlook on our potential for Taxonomy-
eligibility and alignment going forward We continue to explore ways to reduce our emissions through our commercial strategy and invest in the decarbonization of our operations and value chain as part of our 2025 Climate Action Goal and our ambition
to achieve net zero by 2040. We will continue to assess our Taxonomy-eligible and -aligned activities considering the evolving legal framework of the EU Taxonomy Regulation and to further integrate the requirements of the EU Taxonomy framework in
our business model and reporting policies and procedures. AB InBev – Annual Report 2023 178
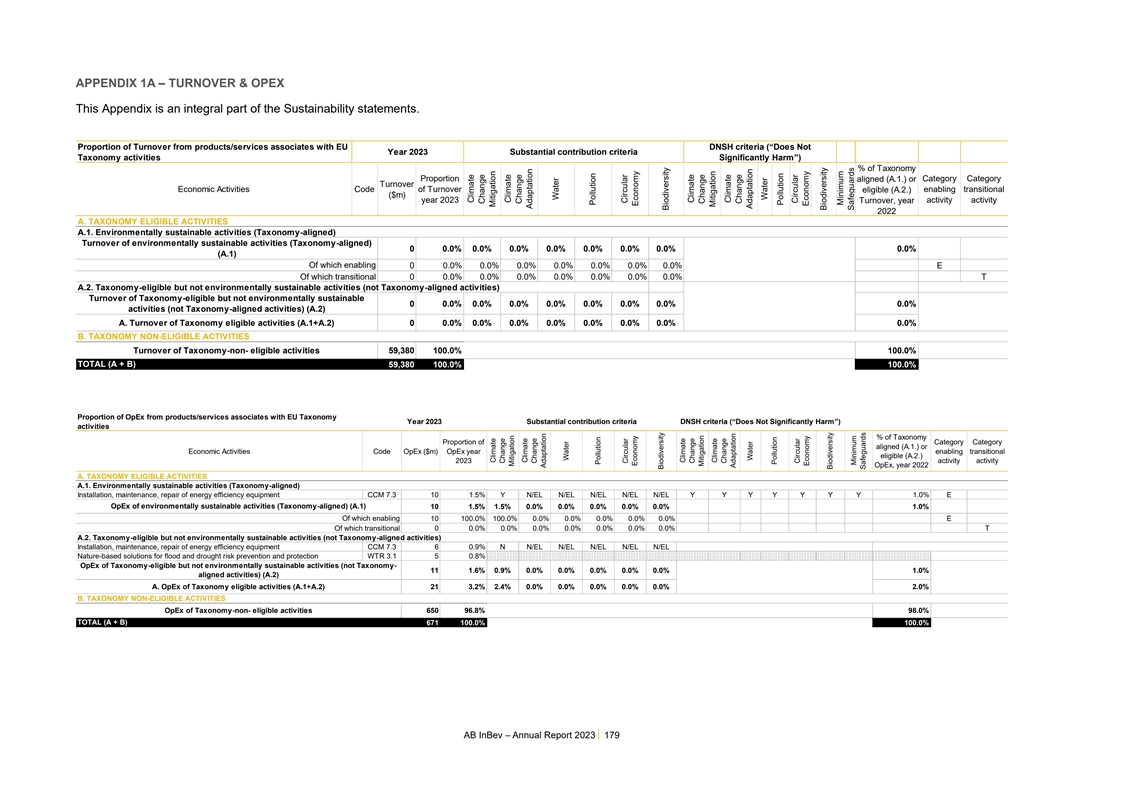
APPENDIX 1A – TURNOVER & OPEX This Appendix is an integral
part of the Sustainability statements. Proportion of Turnover from products/services associates with EU DNSH criteria (“Does Not Year 2023 Substantial contribution criteria Taxonomy activities Significantly Harm”) % of Taxonomy
Proportion aligned (A.1.) or Category Category Turnover Economic Activities Code of Turnover eligible (A.2.) enabling transitional ($m) year 2023 activity activity Turnover, year 2022 A. TAXONOMY ELIGIBLE ACTIVITIES A.1. Environmentally sustainable
activities (Taxonomy-aligned) Turnover of environmentally sustainable activities (Taxonomy-aligned) 0 0.0% 0.0% 0.0% 0.0% 0.0% 0.0% 0.0% 0.0% (A.1) Of which enabling 0 0.0% 0.0% 0.0% 0.0% 0.0% 0.0% 0.0% E Of which transitional 0 0.0% 0.0% 0.0% 0.0%
0.0% 0.0% 0.0% T A.2. Taxonomy-eligible but not environmentally sustainable activities (not Taxonomy-aligned activities) Turnover of Taxonomy-eligible but not environmentally sustainable 0 0.0% 0.0% 0.0% 0.0% 0.0% 0.0% 0.0% 0.0% activities (not
Taxonomy-aligned activities) (A.2) A. Turnover of Taxonomy eligible activities (A.1+A.2) 0 0.0% 0.0% 0.0% 0.0% 0.0% 0.0% 0.0% 0.0% B. TAXONOMY NON-ELIGIBLE ACTIVITIES Turnover of Taxonomy-non- eligible activities 59,380 100.0% 100.0% TOTAL (A + B)
59,380 100.0% 100.0% Proportion of OpEx from products/services associates with EU Taxonomy Year 2023 Substantial contribution criteria DNSH criteria (“Does Not Significantly Harm”) activities % of Taxonomy Proportion of Category Category
aligned (A.1.) or Economic Activities Code OpEx ($m) OpEx year enabling transitional eligible (A.2.) 2023 activity activity OpEx, year 2022 A. TAXONOMY ELIGIBLE ACTIVITIES A.1. Environmentally sustainable activities (Taxonomy-aligned) Installation,
maintenance, repair of energy efficiency equipment CCM 7.3 10 1.5% Y N/EL N/EL N/EL N/EL N/EL Y Y Y Y Y Y Y 1.0% E OpEx of environmentally sustainable activities (Taxonomy-aligned) (A.1) 10 1.5% 1.5% 0.0% 0.0% 0.0% 0.0% 0.0% 1.0% Of which enabling
10 100.0% 100.0% 0.0% 0.0% 0.0% 0.0% 0.0% E Of which transitional 0 0.0% 0.0% 0.0% 0.0% 0.0% 0.0% 0.0% T A.2. Taxonomy-eligible but not environmentally sustainable activities (not Taxonomy-aligned activities) Installation, maintenance, repair of
energy efficiency equipment CCM 7.3 6 0.9% N N/EL N/EL N/EL N/EL N/EL Nature-based solutions for flood and drought risk prevention and protection WTR 3.1 5 0.8% OpEx of Taxonomy-eligible but not environmentally sustainable activities (not Taxonomy-
11 1.6% 0.9% 0.0% 0.0% 0.0% 0.0% 0.0% 1.0% aligned activities) (A.2) A. OpEx of Taxonomy eligible activities (A.1+A.2) 21 3.2% 2.4% 0.0% 0.0% 0.0% 0.0% 0.0% 2.0% B. TAXONOMY NON-ELIGIBLE ACTIVITIES OpEx of Taxonomy-non- eligible activities 650 96.8%
98.0% TOTAL (A + B) 671 100.0% 100.0% AB InBev – Annual Report 2023 179 Climate Change Climate Mitigation Change Climate Mitigation Change Climate Adaptation Change Adaptation Water Water Pollution Pollution Circular Circular Economy
Economy Biodiversity Biodiversity Climate Climate Change Mitigation Change Mitigation Climate Change Climate Adaptation Change Water Adaptation Water Pollution Pollution Circular Circular Economy Economy Biodiversity Biodiversity Minimum Safeguards
Minimum Safeguards
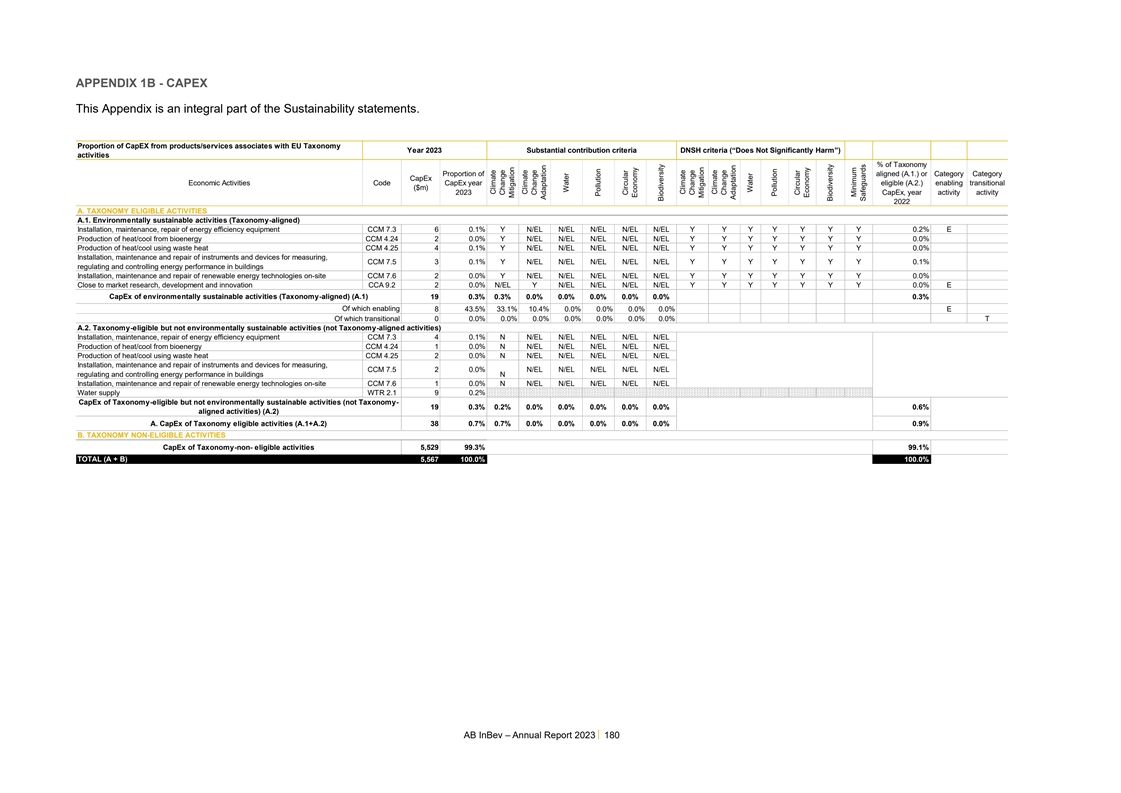
APPENDIX 1B - CAPEX This Appendix is an integral part of the
Sustainability statements. Proportion of CapEX from products/services associates with EU Taxonomy Year 2023 Substantial contribution criteria DNSH criteria (“Does Not Significantly Harm”) activities % of Taxonomy Proportion of aligned
(A.1.) or Category Category CapEx Economic Activities Code CapEx year eligible (A.2.) enabling transitional ($m) 2023 CapEx, year activity activity 2022 A. TAXONOMY ELIGIBLE ACTIVITIES A.1. Environmentally sustainable activities (Taxonomy-aligned)
Installation, maintenance, repair of energy efficiency equipment CCM 7.3 6 0.1% Y N/EL N/EL N/EL N/EL N/EL Y Y Y Y Y Y Y 0.2% E Production of heat/cool from bioenergy CCM 4.24 2 0.0% Y N/EL N/EL N/EL N/EL N/EL Y Y Y Y Y Y Y 0.0% Production of
heat/cool using waste heat CCM 4.25 4 0.1% Y N/EL N/EL N/EL N/EL N/EL Y Y Y Y Y Y Y 0.0% Installation, maintenance and repair of instruments and devices for measuring, CCM 7.5 3 0.1% Y N/EL N/EL N/EL N/EL N/EL Y Y Y Y Y Y Y 0.1% regulating and
controlling energy performance in buildings Installation, maintenance and repair of renewable energy technologies on-site CCM 7.6 2 0.0% Y N/EL N/EL N/EL N/EL N/EL Y Y Y Y Y Y Y 0.0% Close to market research, development and innovation CCA 9.2 2
0.0% N/EL Y N/EL N/EL N/EL N/EL Y Y Y Y Y Y Y 0.0% E CapEx of environmentally sustainable activities (Taxonomy-aligned) (A.1) 19 0.3% 0.3% 0.0% 0.0% 0.0% 0.0% 0.0% 0.3% Of which enabling 8 43.5% 33.1% 10.4% 0.0% 0.0% 0.0% 0.0% E Of which
transitional 0 0.0% 0.0% 0.0% 0.0% 0.0% 0.0% 0.0% T A.2. Taxonomy-eligible but not environmentally sustainable activities (not Taxonomy-aligned activities) Installation, maintenance, repair of energy efficiency equipment CCM 7.3 4 0.1% N N/EL N/EL
N/EL N/EL N/EL Production of heat/cool from bioenergy CCM 4.24 1 0.0% N N/EL N/EL N/EL N/EL N/EL Production of heat/cool using waste heat CCM 4.25 2 0.0% N N/EL N/EL N/EL N/EL N/EL Installation, maintenance and repair of instruments and devices for
measuring, CCM 7.5 2 0.0% N/EL N/EL N/EL N/EL N/EL regulating and controlling energy performance in buildings N Installation, maintenance and repair of renewable energy technologies on-site CCM 7.6 1 0.0% N N/EL N/EL N/EL N/EL N/EL Water supply WTR
2.1 9 0.2% CapEx of Taxonomy-eligible but not environmentally sustainable activities (not Taxonomy- 19 0.3% 0.2% 0.0% 0.0% 0.0% 0.0% 0.0% 0.6% aligned activities) (A.2) A. CapEx of Taxonomy eligible activities (A.1+A.2) 38 0.7% 0.7% 0.0% 0.0% 0.0%
0.0% 0.0% 0.9% B. TAXONOMY NON-ELIGIBLE ACTIVITIES CapEx of Taxonomy-non- eligible activities 5,529 99.3% 99.1% TOTAL (A + B) 5,567 100.0% 100.0% AB InBev – Annual Report 2023 180 Climate Change Mitigation Climate Change Adaptation
Water Pollution Circular Economy Biodiversity Climate Change Mitigation Climate Change Adaptation Water Pollution Circular Economy Biodiversity Minimum Safeguards
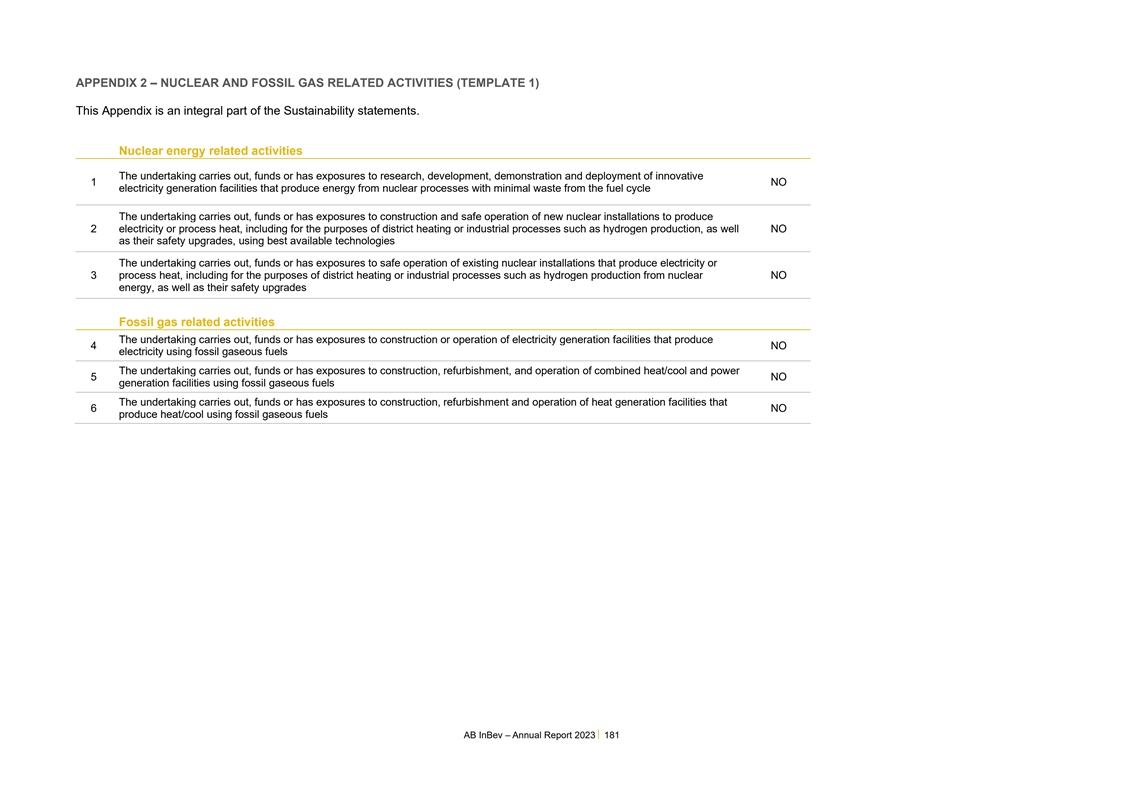
APPENDIX 2 – NUCLEAR AND FOSSIL GAS RELATED ACTIVITIES (TEMPLATE
1) This Appendix is an integral part of the Sustainability statements. Nuclear energy related activities The undertaking carries out, funds or has exposures to research, development, demonstration and deployment of innovative 1 NO electricity
generation facilities that produce energy from nuclear processes with minimal waste from the fuel cycle The undertaking carries out, funds or has exposures to construction and safe operation of new nuclear installations to produce 2 electricity or
process heat, including for the purposes of district heating or industrial processes such as hydrogen production, as well NO as their safety upgrades, using best available technologies The undertaking carries out, funds or has exposures to safe
operation of existing nuclear installations that produce electricity or 3 process heat, including for the purposes of district heating or industrial processes such as hydrogen production from nuclear NO energy, as well as their safety upgrades
Fossil gas related activities The undertaking carries out, funds or has exposures to construction or operation of electricity generation facilities that produce 4 NO electricity using fossil gaseous fuels The undertaking carries out, funds or has
exposures to construction, refurbishment, and operation of combined heat/cool and power 5 NO generation facilities using fossil gaseous fuels The undertaking carries out, funds or has exposures to construction, refurbishment and operation of heat
generation facilities that 6 NO produce heat/cool using fossil gaseous fuels AB InBev – Annual Report 2023 181
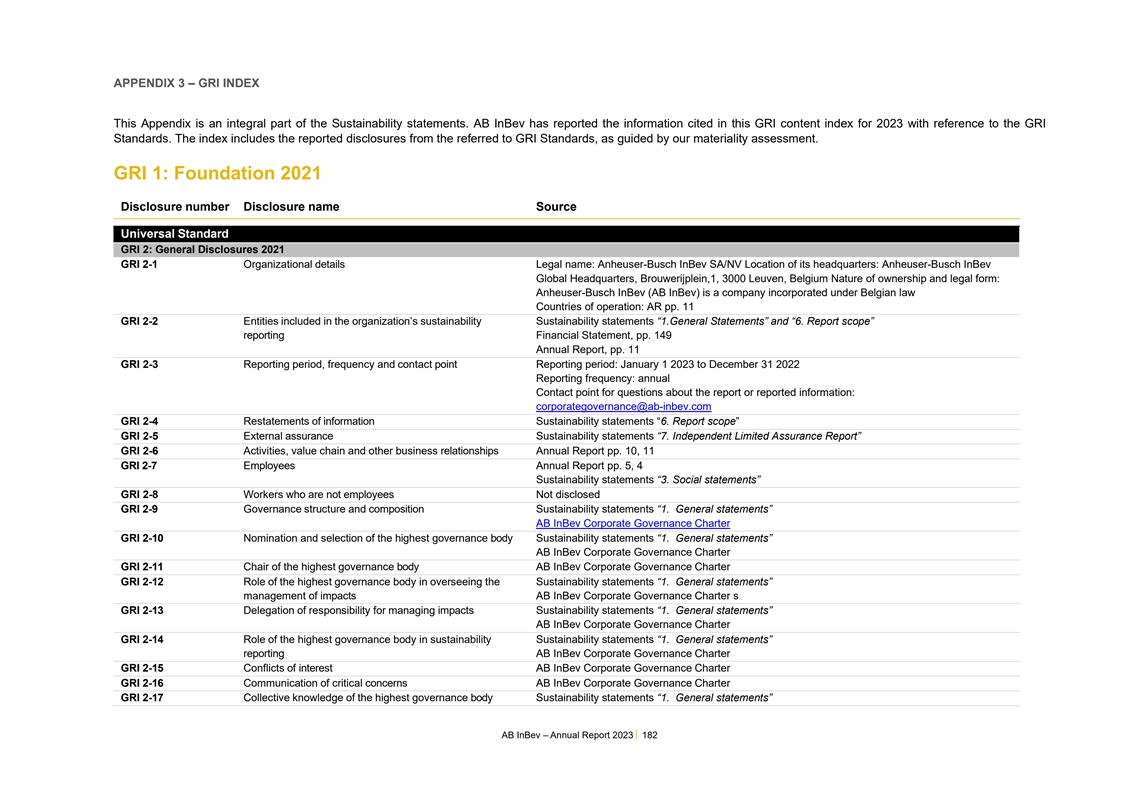
APPENDIX 3 – GRI INDEX This Appendix is an integral part of the
Sustainability statements. AB InBev has reported the information cited in this GRI content index for 2023 with reference to the GRI Standards. The index includes the reported disclosures from the referred to GRI Standards, as guided by our
materiality assessment. GRI 1: Foundation 2021 Disclosure number Disclosure name Source Universal Standard GRI 2: General Disclosures 2021 GRI 2-1 Organizational details Legal name: Anheuser-Busch InBev SA/NV Location of its headquarters:
Anheuser-Busch InBev Global Headquarters, Brouwerijplein,1, 3000 Leuven, Belgium Nature of ownership and legal form: Anheuser-Busch InBev (AB InBev) is a company incorporated under Belgian law Countries of operation: AR pp. 11 GRI 2-2 Entities
included in the organization’s sustainability Sustainability statements “1.General Statements” and “6. Report scope” reporting Financial Statement, pp. 149 Annual Report, pp. 11 GRI 2-3 Reporting period, frequency and
contact point Reporting period: January 1 2023 to December 31 2022 Reporting frequency: annual Contact point for questions about the report or reported information: corporategovernance@ab-inbev.com GRI 2-4 Restatements of information Sustainability
statements “6. Report scope” GRI 2-5 External assurance Sustainability statements “7. Independent Limited Assurance Report” GRI 2-6 Activities, value chain and other business relationships Annual Report pp. 10, 11 GRI 2-7
Employees Annual Report pp. 5, 4 Sustainability statements “3. Social statements” GRI 2-8 Workers who are not employees Not disclosed GRI 2-9 Governance structure and composition Sustainability statements “1. General
statements” AB InBev Corporate Governance Charter GRI 2-10 Nomination and selection of the highest governance body Sustainability statements “1. General statements” AB InBev Corporate Governance Charter GRI 2-11 Chair of the
highest governance body AB InBev Corporate Governance Charter GRI 2-12 Role of the highest governance body in overseeing the Sustainability statements “1. General statements” management of impacts AB InBev Corporate Governance Charter s
GRI 2-13 Delegation of responsibility for managing impacts Sustainability statements “1. General statements” AB InBev Corporate Governance Charter GRI 2-14 Role of the highest governance body in sustainability Sustainability statements
“1. General statements” reporting AB InBev Corporate Governance Charter GRI 2-15 Conflicts of interest AB InBev Corporate Governance Charter GRI 2-16 Communication of critical concerns AB InBev Corporate Governance Charter GRI 2-17
Collective knowledge of the highest governance body Sustainability statements “1. General statements” AB InBev – Annual Report 2023 182
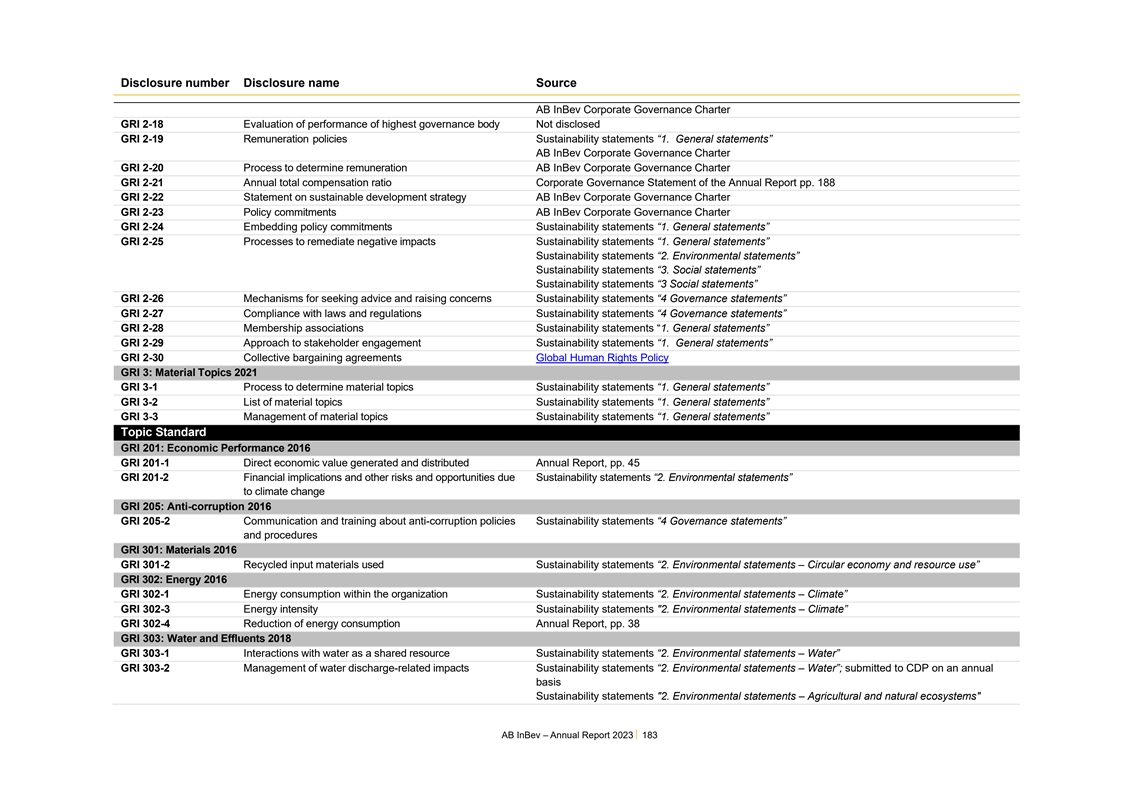
Disclosure number Disclosure name Source AB InBev Corporate Governance
Charter GRI 2-18 Evaluation of performance of highest governance body Not disclosed GRI 2-19 Remuneration policies Sustainability statements “1. General statements” AB InBev Corporate Governance Charter GRI 2-20 Process to determine
remuneration AB InBev Corporate Governance Charter GRI 2-21 Annual total compensation ratio Corporate Governance Statement of the Annual Report pp. 188 GRI 2-22 Statement on sustainable development strategy AB InBev Corporate Governance Charter GRI
2-23 Policy commitments AB InBev Corporate Governance Charter GRI 2-24 Embedding policy commitments Sustainability statements “1. General statements” GRI 2-25 Processes to remediate negative impacts Sustainability statements “1.
General statements” Sustainability statements “2. Environmental statements” Sustainability statements “3. Social statements” Sustainability statements “3 Social statements” GRI 2-26 Mechanisms for seeking
advice and raising concerns Sustainability statements “4 Governance statements” GRI 2-27 Compliance with laws and regulations Sustainability statements “4 Governance statements” GRI 2-28 Membership associations Sustainability
statements “1. General statements” GRI 2-29 Approach to stakeholder engagement Sustainability statements “1. General statements” GRI 2-30 Collective bargaining agreements Global Human Rights Policy GRI 3: Material Topics 2021
GRI 3-1 Process to determine material topics Sustainability statements “1. General statements” GRI 3-2 List of material topics Sustainability statements “1. General statements” GRI 3-3 Management of material topics
Sustainability statements “1. General statements” Topic Standard GRI 201: Economic Performance 2016 GRI 201-1 Direct economic value generated and distributed Annual Report, pp. 45 GRI 201-2 Financial implications and other risks and
opportunities due Sustainability statements “2. Environmental statements” to climate change GRI 205: Anti-corruption 2016 GRI 205-2 Communication and training about anti-corruption policies Sustainability statements “4 Governance
statements” and procedures GRI 301: Materials 2016 GRI 301-2 Recycled input materials used Sustainability statements “2. Environmental statements – Circular economy and resource use” GRI 302: Energy 2016 GRI 302-1 Energy
consumption within the organization Sustainability statements “2. Environmental statements – Climate” GRI 302-3 Energy intensity Sustainability statements 2. Environmental statements – Climate” GRI 302-4 Reduction of
energy consumption Annual Report, pp. 38 GRI 303: Water and Effluents 2018 GRI 303-1 Interactions with water as a shared resource Sustainability statements “2. Environmental statements – Water” GRI 303-2 Management of water
discharge-related impacts Sustainability statements “2. Environmental statements – Water”; submitted to CDP on an annual basis Sustainability statements 2. Environmental statements – Agricultural and natural ecosystems AB
InBev – Annual Report 2023 183
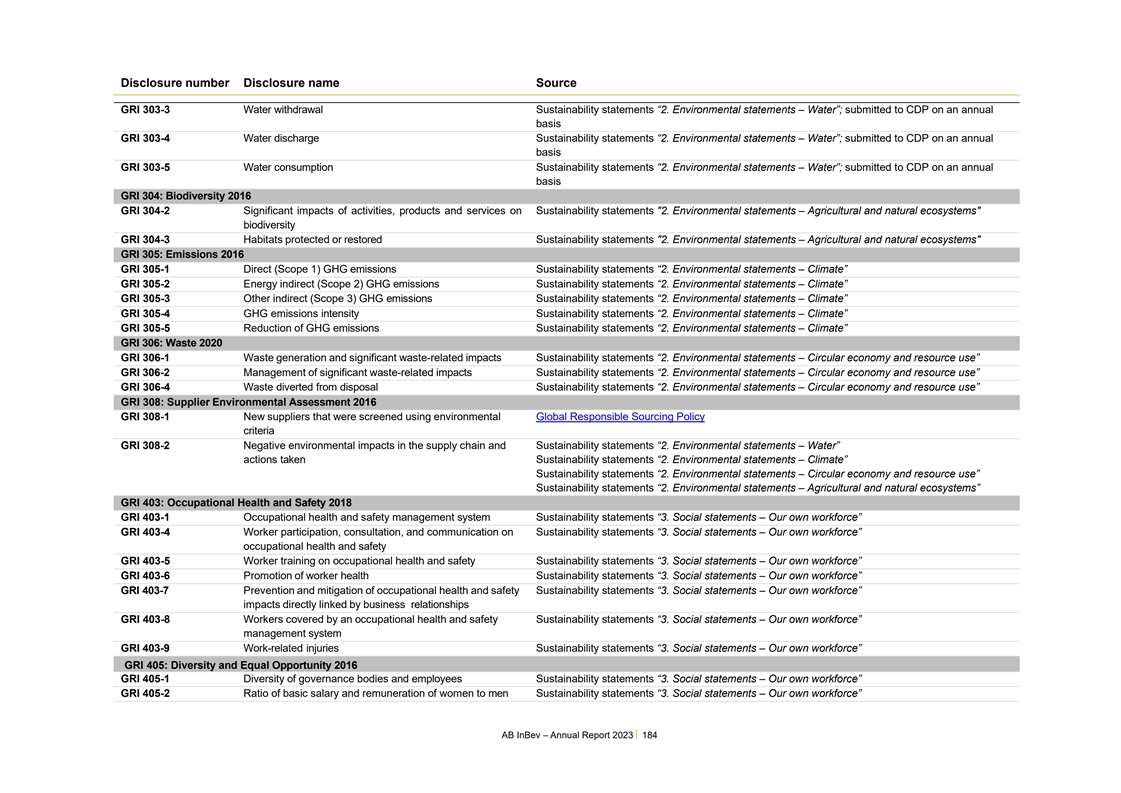
Disclosure number Disclosure name Source GRI 303-3 Water withdrawal
Sustainability statements “2. Environmental statements – Water”; submitted to CDP on an annual basis GRI 303-4 Water discharge Sustainability statements “2. Environmental statements – Water”; submitted to CDP on
an annual basis GRI 303-5 Water consumption Sustainability statements “2. Environmental statements – Water”; submitted to CDP on an annual basis GRI 304: Biodiversity 2016 GRI 304-2 Significant impacts of activities, products and
services on Sustainability statements 2. Environmental statements – Agricultural and natural ecosystems biodiversity GRI 304-3 Habitats protected or restored Sustainability statements 2. Environmental statements – Agricultural and
natural ecosystems GRI 305: Emissions 2016 GRI 305-1 Direct (Scope 1) GHG emissions Sustainability statements “2. Environmental statements – Climate” GRI 305-2 Energy indirect (Scope 2) GHG emissions Sustainability statements
“2. Environmental statements – Climate” GRI 305-3 Other indirect (Scope 3) GHG emissions Sustainability statements “2. Environmental statements – Climate” GRI 305-4 GHG emissions intensity Sustainability
statements “2. Environmental statements – Climate” GRI 305-5 Reduction of GHG emissions Sustainability statements “2. Environmental statements – Climate” GRI 306: Waste 2020 GRI 306-1 Waste generation and
significant waste-related impacts Sustainability statements “2. Environmental statements – Circular economy and resource use” GRI 306-2 Management of significant waste-related impacts Sustainability statements “2.
Environmental statements – Circular economy and resource use” GRI 306-4 Waste diverted from disposal Sustainability statements “2. Environmental statements – Circular economy and resource use” GRI 308: Supplier
Environmental Assessment 2016 GRI 308-1 New suppliers that were screened using environmental Global Responsible Sourcing Policy criteria GRI 308-2 Negative environmental impacts in the supply chain and Sustainability statements “2.
Environmental statements – Water” actions taken Sustainability statements “2. Environmental statements – Climate” Sustainability statements “2. Environmental statements – Circular economy and resource
use” Sustainability statements “2. Environmental statements – Agricultural and natural ecosystems” GRI 403: Occupational Health and Safety 2018 GRI 403-1 Occupational health and safety management system Sustainability
statements “3. Social statements – Our own workforce” GRI 403-4 Worker participation, consultation, and communication on Sustainability statements “3. Social statements – Our own workforce” occupational health and
safety GRI 403-5 Worker training on occupational health and safety Sustainability statements “3. Social statements – Our own workforce” GRI 403-6 Promotion of worker health Sustainability statements “3. Social statements
– Our own workforce” GRI 403-7 Prevention and mitigation of occupational health and safety Sustainability statements “3. Social statements – Our own workforce” impacts directly linked by business relationships GRI 403-8
Workers covered by an occupational health and safety Sustainability statements “3. Social statements – Our own workforce” management system GRI 403-9 Work-related injuries Sustainability statements “3. Social statements
– Our own workforce” GRI 405: Diversity and Equal Opportunity 2016 GRI 405-1 Diversity of governance bodies and employees Sustainability statements “3. Social statements – Our own workforce” GRI 405-2 Ratio of basic
salary and remuneration of women to men Sustainability statements “3. Social statements – Our own workforce” AB InBev – Annual Report 2023 184
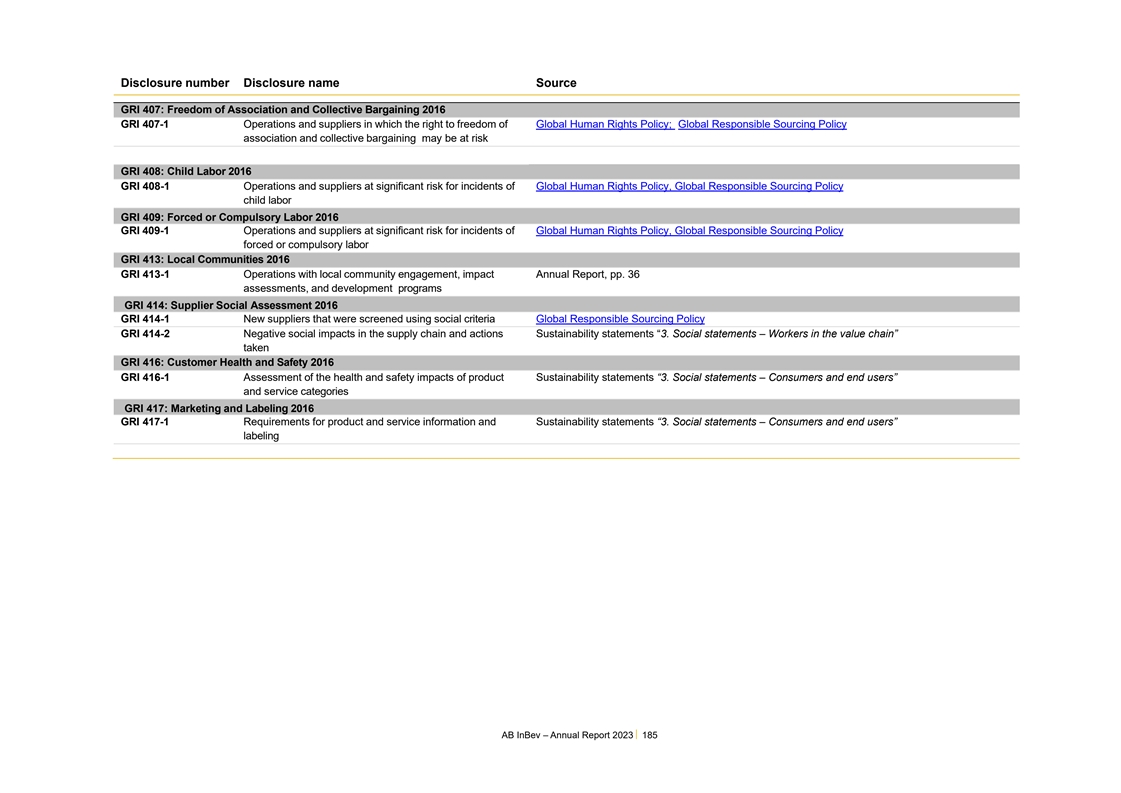
Disclosure number Disclosure name Source GRI 407: Freedom of
Association and Collective Bargaining 2016 GRI 407-1 Operations and suppliers in which the right to freedom of Global Human Rights Policy; Global Responsible Sourcing Policy association and collective bargaining may be at risk GRI 408: Child Labor
2016 GRI 408-1 Operations and suppliers at significant risk for incidents of Global Human Rights Policy, Global Responsible Sourcing Policy child labor GRI 409: Forced or Compulsory Labor 2016 GRI 409-1 Operations and suppliers at significant risk
for incidents of Global Human Rights Policy, Global Responsible Sourcing Policy forced or compulsory labor GRI 413: Local Communities 2016 GRI 413-1 Operations with local community engagement, impact Annual Report, pp. 36 assessments, and
development programs GRI 414: Supplier Social Assessment 2016 GRI 414-1 New suppliers that were screened using social criteria Global Responsible Sourcing Policy GRI 414-2 Negative social impacts in the supply chain and actions Sustainability
statements “3. Social statements – Workers in the value chain” taken GRI 416: Customer Health and Safety 2016 GRI 416-1 Assessment of the health and safety impacts of product Sustainability statements “3. Social statements
– Consumers and end users” and service categories GRI 417: Marketing and Labeling 2016 GRI 417-1 Requirements for product and service information and Sustainability statements “3. Social statements – Consumers and end
users” labeling AB InBev – Annual Report 2023 185
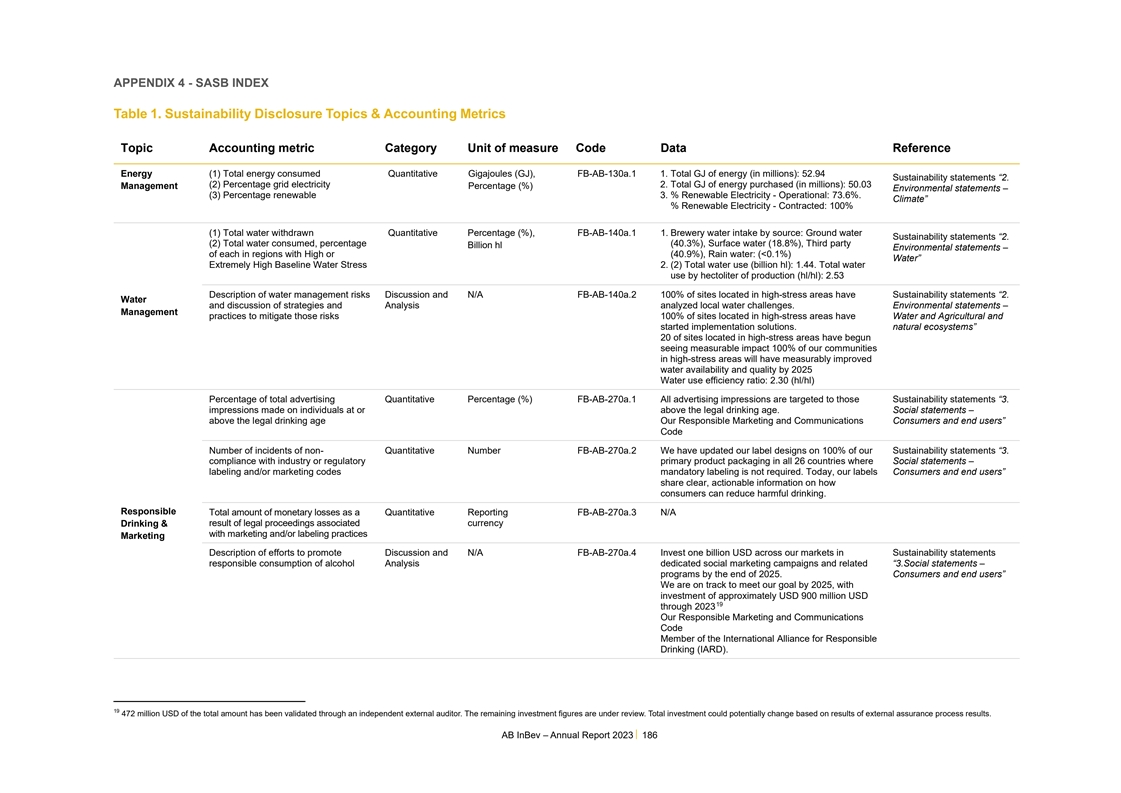
APPENDIX 4 - SASB INDEX Table 1. Sustainability Disclosure Topics
& Accounting Metrics Topic Accounting metric Category Unit of measure Code Data Reference Energy (1) Total energy consumed Quantitative Gigajoules (GJ), FB-AB-130a.1 1. Total GJ of energy (in millions): 52.94 Sustainability statements “2.
(2) Percentage grid electricity 2. Total GJ of energy purchased (in millions): 50.03 Management Percentage (%) Environmental statements – (3) Percentage renewable 3. % Renewable Electricity - Operational: 73.6%. Climate” % Renewable
Electricity - Contracted: 100% (1) Total water withdrawn Quantitative Percentage (%), FB-AB-140a.1 1. Brewery water intake by source: Ground water Sustainability statements “2. (2) Total water consumed, percentage (40.3%), Surface water
(18.8%), Third party Billion hl Environmental statements – of each in regions with High or (40.9%), Rain water: (<0.1%) Water” Extremely High Baseline Water Stress 2. (2) Total water use (billion hl): 1.44. Total water use by
hectoliter of production (hl/hl): 2.53 Description of water management risks Discussion and N/A FB-AB-140a.2 100% of sites located in high-stress areas have Sustainability statements “2. Water and discussion of strategies and Analysis analyzed
local water challenges. Environmental statements – Management practices to mitigate those risks 100% of sites located in high-stress areas have Water and Agricultural and started implementation solutions. natural ecosystems” 20 of sites
located in high-stress areas have begun seeing measurable impact 100% of our communities in high-stress areas will have measurably improved water availability and quality by 2025 Water use efficiency ratio: 2.30 (hl/hl) Percentage of total
advertising Quantitative Percentage (%) FB-AB-270a.1 All advertising impressions are targeted to those Sustainability statements “3. impressions made on individuals at or above the legal drinking age. Social statements – above the legal
drinking age Our Responsible Marketing and Communications Consumers and end users” Code Number of incidents of non- Quantitative Number FB-AB-270a.2 We have updated our label designs on 100% of our Sustainability statements “3.
compliance with industry or regulatory primary product packaging in all 26 countries where Social statements – labeling and/or marketing codes mandatory labeling is not required. Today, our labels Consumers and end users” share clear,
actionable information on how consumers can reduce harmful drinking. Responsible Total amount of monetary losses as a Quantitative Reporting FB-AB-270a.3 N/A Drinking & result of legal proceedings associated currency with marketing and/or
labeling practices Marketing Description of efforts to promote Discussion and N/A FB-AB-270a.4 Invest one billion USD across our markets in Sustainability statements responsible consumption of alcohol Analysis dedicated social marketing campaigns
and related “3.Social statements – programs by the end of 2025. Consumers and end users” We are on track to meet our goal by 2025, with investment of approximately USD 900 million USD 19 through 2023 Our Responsible Marketing and
Communications Code Member of the International Alliance for Responsible Drinking (IARD). 19 472 million USD of the total amount has been validated through an independent external auditor. The remaining investment figures are under review. Total
investment could potentially change based on results of external assurance process results. AB InBev – Annual Report 2023 186
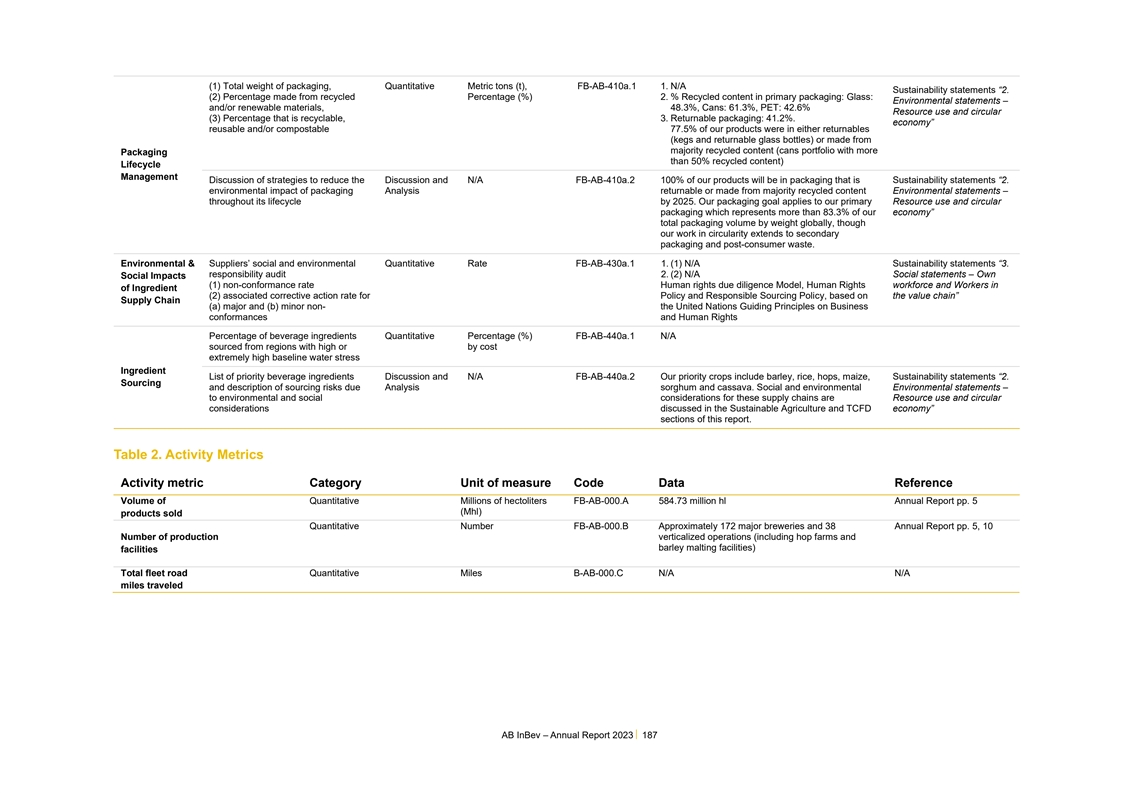
(1) Total weight of packaging, Quantitative Metric tons (t),
FB-AB-410a.1 1. N/A Sustainability statements “2. (2) Percentage made from recycled Percentage (%) 2. % Recycled content in primary packaging: Glass: Environmental statements – and/or renewable materials, 48.3%, Cans: 61.3%, PET: 42.6%
Resource use and circular (3) Percentage that is recyclable, 3. Returnable packaging: 41.2%. economy” reusable and/or compostable 77.5% of our products were in either returnables (kegs and returnable glass bottles) or made from majority
recycled content (cans portfolio with more Packaging than 50% recycled content) Lifecycle Management Discussion of strategies to reduce the Discussion and N/A FB-AB-410a.2 100% of our products will be in packaging that is Sustainability statements
“2. environmental impact of packaging Analysis returnable or made from majority recycled content Environmental statements – throughout its lifecycle by 2025. Our packaging goal applies to our primary Resource use and circular packaging
which represents more than 83.3% of our economy” total packaging volume by weight globally, though our work in circularity extends to secondary packaging and post-consumer waste. Environmental & Suppliers’ social and environmental
Quantitative Rate FB-AB-430a.1 1. (1) N/A Sustainability statements “3. responsibility audit 2. (2) N/A Social statements – Own Social Impacts (1) non-conformance rate Human rights due diligence Model, Human Rights workforce and Workers
in of Ingredient (2) associated corrective action rate for Policy and Responsible Sourcing Policy, based on the value chain” Supply Chain (a) major and (b) minor non- the United Nations Guiding Principles on Business conformances and Human
Rights Percentage of beverage ingredients Quantitative Percentage (%) FB-AB-440a.1 N/A sourced from regions with high or by cost extremely high baseline water stress Ingredient List of priority beverage ingredients Discussion and N/A FB-AB-440a.2
Our priority crops include barley, rice, hops, maize, Sustainability statements “2. Sourcing and description of sourcing risks due Analysis sorghum and cassava. Social and environmental Environmental statements – to environmental and
social considerations for these supply chains are Resource use and circular considerations discussed in the Sustainable Agriculture and TCFD economy” sections of this report. Table 2. Activity Metrics Activity metric Category Unit of measure
Code Data Reference Volume of Quantitative Millions of hectoliters FB-AB-000.A 584.73 million hl Annual Report pp. 5 (Mhl) products sold Quantitative Number FB-AB-000.B Approximately 172 major breweries and 38 Annual Report pp. 5, 10 Number of
production verticalized operations (including hop farms and barley malting facilities) facilities Total fleet road Quantitative Miles B-AB-000.C N/A N/A miles traveled AB InBev – Annual Report 2023 187
CORPORATE GOVERNANCE STATEMENT TABLE OF CONTENTS INTRODUCTION 189 THE
BOARD OF DIRECTORS 192 CHIEF EXECUTIVE OFFICER AND EXECUTIVE MANAGEMENT 199 SENIOR LEADERSHIP TEAM 200 INTERNAL CONTROL AND RISK MANAGEMENT SYSTEMS 203 SHAREHOLDERS’ STRUCTURE 205 ITEMS TO BE DISCLOSED PURSUANT TO ARTICLE 34 OF THE BELGIAN
ROYAL DECREE OF 14 NOVEMBER 2007 208 REMUNERATION 214 AB InBev - Annual report 2023 - 188
1. Introduction 1.1. The Belgian Code on Corporate Governance The
corporate governance practices of Anheuser-Busch InBev are reflected in its Corporate Governance Charter, which is available on https://www.ab-inbev.com/investors/corporate-governance/corporate-governance-documents.html. The Charter is regularly
updated. Anheuser-Busch InBev is a company incorporated under Belgian law with a primary listing on Euronext Brussels (Euronext: ABI) and with secondary listings on the Mexico Stock Exchange (MEXBOL: ANB) and the Johannesburg Stock Exchange (JSE:
ANH) (ISIN: BE0974293251) and with American Depositary Shares (“ADSs”) listed on the New York Stock Exchange. As a Belgian company with a primary listing on Euronext Brussels, Anheuser-Busch InBev adheres to the principles and provisions
of the 2020 Belgian Corporate Governance Code (www.corporategovernancecommittee.be) (“the Corporate Governance Code”), taking into account its specific status as a multinational group with secondary listings in Mexico and Johannesburg
and with ADSs listed in New York. In line with AB InBev’s specific shareholding structure and the global nature of its operations, the company has departed in 2023 from the following soft-law principles of the Corporate Governance Code:
Principle 4.19 of the Corporate Governance Code: “the Board should set up a nomination committee with the majority of its members comprising independent non-executive board members” - The Board of Directors appoints the chairman and
members of the Nomination Committee from among the directors. As the committee is composed exclusively of non-executive directors, including one independent director, who all are independent of management and free from any business relationship that
could materially interfere with the exercise of their independent judgment, the Board considers that the composition of this committee achieves the aim of Principle 4.19 of the Corporate Governance Code. Principle 7.6 of the Corporate Governance
Code: “A non-executive board member should receive part of their remuneration in the form of shares in the company. These shares should be held until at least one year after the non-executive board member leaves the board and at least three
years after the moment of award. However, no stock options should be granted to non-executive board members” - The share-based component of the directors’ remuneration is paid in the form of Restricted Stock Units. Such Restricted Stock
Units vest after five years and, upon vesting, entitle their holders to one AB InBev share per Restricted Stock Unit (subject to any applicable withholdings). The shares delivered to directors upon vesting of the Restricted Stock Units are not
subject to a lock-up of three years after the date of delivery and one year after the date of departure of the relevant director. However, the Board considers that the five- year vesting period of the Restricted Stock Units fosters a sustainable and
long-term commitment of the directors to shareholder value creation that addresses the goal of Principle 7.6 of the Corporate Governance Code. 1.2. New York Stock Exchange Listing Further to the New York Stock Exchange listing of ADSs representing
ordinary shares of AB InBev, the New York Stock Exchange Corporate Governance rules for Foreign Private Issuers are applicable to the company. AB InBev has also registered under the US Securities and Exchange Act of 1934, as amended. As a result, it
is also subject to the US Sarbanes- Oxley Act of 2002 and to certain US Securities laws and regulations relating to corporate governance. AB InBev – Annual Report 2023 189
1.3. Specific Corporate Governance initiatives 1.3.1. FOSTERING
ETHICAL CONDUCT The Board of Directors and management of AB InBev are committed to promoting and maintaining the highest standards of ethical behavior and transparency. This guides everything that AB InBev does as an organization, and serves as its
foundation for creating a future with more cheers. AB InBev has established ethical rules and internal codes and policies to reinforce this commitment. The Code of Business Conduct sets out the ethical standards which all colleagues around the world
are expected to adhere to and provides guidance for interactions with third parties. During 2023, the Code of Business Conduct was updated to reinforce key principles and policies. It requires colleagues to comply with all applicable laws, disclose
any relevant conflicts of interests, to act in the best interests of the company, and conduct all dealings in an honest and ethical manner. It covers confidentiality of information, limits on offering or accepting gifts or entertainment, and the
appropriate use of the company’s property. The Code of Business Conduct includes policies which define colleagues’ responsibilities and expected behavior, and includes the Global Anti-Corruption, Human Rights, Data Privacy,
Anti-Harassment and Anti-Discrimination, and Conflict of Interest Policies. As an example, the Global Anti-Corruption Policy states that AB InBev’s employees are strictly prohibited from, either directly or indirectly, giving, offering,
promising, or authorizing anything of value, to anyone with the intent to exert improper influence or inducement, secure an improper commercial advantage for the company, or serve as a reward for past improper conduct. In line with this commitment
to integrity, AB InBev encourages its colleagues and third parties to speak up through a global whistle-blowing system. This system provides a simple, secure, confidential and, if desired, anonymous manner to raise concerns or report actual or
suspected violations of law or policies. The company also uses technology and its BrewRIGHT digital risk analytics systems to proactively monitor risk and potential violations of policy. 1.3.2. DEMONSTRATING COMMITMENT TO SHAREHOLDER COMMUNICATION
AB InBev is committed to creating value for its shareholders. The company encourages its shareholders to take an active interest in the company. In support of this objective, it provides quality information, in a timely fashion, through a variety of
communication tools. These include annual reports, half-yearly reports, sustainability reporting, quarterly statements, financial results announcements, briefings, and a section that is dedicated to investors on the AB InBev website
(www.ab-inbev.com/investors.html). AB InBev recognizes that a commitment to disclosure builds trust and confidence with shareholders and the public in general. The company adopted a Disclosure Manual to demonstrate its commitment to best practices
in transparency. This manual is designed to promote full, consistent and timely disclosure of company activities. 1.3.3. UPHOLDING SHAREHOLDER RIGHTS Prior to the annual shareholders’ meeting, shareholders are invited to submit any questions
they have for the Chairman or the CEO for discussion during the meeting. The agenda for the shareholders’ meeting and all related documents are also posted on the AB InBev website at least 30 days in advance of any shareholders’ meeting.
Shareholders have the right to vote on various resolutions related to company matters. If they are unable to attend a meeting, they can submit their votes by mail or appoint a proxy. Minutes of the meetings and results of the votes are posted on the
AB InBev website shortly after the meeting (www.ab- inbev.com/investors/corporate-governance/shareholder-meetings.html). The convening notice for the upcoming annual shareholders’ meeting to be held on 24 April 2024 will be published on 22
March 2024 and will contain further information on the format of the meeting and modalities for participation. AB InBev – Annual Report 2023 190
1.3.4. PREVENTING THE ABUSE OF INSIDE INFORMATION The company’s
Code of Dealing is applicable to all members of the Board of Directors, all members of senior management, all employees and certain associated persons. The Code of Dealing aims to prevent the abuse of inside information, especially in periods
leading up to price-sensitive events or decisions or announcement of financial results. The Code of Dealing prohibits dealing in the company’s securities by certain persons during any closed period, e.g. a period of 30 days preceding any
results announcement of the company. In addition, before dealing in any securities of the company, members of the Board of Directors, certain members of senior leadership, including all members of the Senior Leadership Team, and certain associated
persons must obtain clearance in accordance with the procedure set forth in the Code of Dealing. Compliance with the Code of Dealing is reinforced and monitored through the company’s Compliance Program. In accordance with EU Regulation
596/2014 on market abuse (MAR), the company establishes lists of insiders when required. In addition, pursuant to the same regulation, (i) members of the Executive Committee (ExCom) and (ii) members of the Board of Directors notify their trades
(above a 5,000 Euro yearly threshold) to the company and to the Belgian Financial Services and Markets Authority (FSMA), which publishes these notifications on its website. 1.3.5. CORPORATE SOCIAL RESPONSIBILITY AB InBev’s Purpose is to dream
big to create a future with more cheers. Corporate social responsibility and sustainability are central to the company’s culture and embedded in the way it does business. In accordance with article 3:6, §4 and article 3:32, §2 of the
Belgian Code of Companies and Associations (the “Belgian Companies Code”), which implement Directive 2014/95/EU of 22 October 2014 amending Directive 2013/34/EU as regards disclosure of non-financial and diversity information by certain
large undertakings and groups, AB InBev has included in this Annual Report a non-financial statement reporting on corporate social responsibility and sustainability matters. 1.3.6. DIVERSITY AND INCLUSIVE WORKPLACE The process for nominating and
selecting candidates for the Board of Directors is described in the Corporate Governance Charter of Anheuser-Busch InBev. The company aims to have a balanced and diverse Board primarily considering, among other things, the relevant skills,
education, experience and background of directors. Currently, five out of 15 Board members are women (same ratio as last reporting year). Reference is made to section 2.1 of this Corporate Governance Statement for a short biography of each of the
members of the Board of Directors, including their qualifications and background, as well as for further information on the applicable Belgian legal gender diversity requirements. AB InBev is proud to have an employee base of 135 nationalities
across the business. Effective 1 March 2024, 24 nationalities are represented on the SLT and the senior leadership level directly below the SLT and two out of 18 members on the SLT are women (same ratio as last reporting year). Reference is made to
section 4 of this Corporate Governance Statement for a short biography of each of the members of the SLT, including their qualifications and background. The overall representation of women in senior management in our company was 29% in 2023 versus
28% in 2022. AB InBev continues working to build diverse teams while considering the relevant skills, education, experience and background of employees. AB InBev has a Diversity Policy and Principles as part of the company’s Global Code of
Business Conduct, which includes policies on anti-harassment, anti-discrimination and human rights. This policy aims at cultivating and maintaining a diverse and inclusive workplace. We also engage with our colleagues through our annual engagement
survey. The survey includes feedback on rewards, recognition, well-being, inclusion and comfort level reporting potential unethical behavior or other complaints without fear of retaliation. AB InBev – Annual Report 2023 191
2. The Board of Directors 2.1. Structure and composition The Board of
Directors currently consists of 15 members, all of whom are non-executives. The roles and responsibilities of the Board, its composition, structure and organization are described in detail in Anheuser- Busch InBev’s Corporate Governance
Charter. This Corporate Governance Charter includes the criteria that directors must satisfy to qualify as independent directors. Unless the shareholders’ meeting decides on a shorter term, directors (other than the Restricted Share Directors)
are appointed for a maximum term of four years, which is renewable. In accordance with article 19.4 (b) of our Articles of Association, Restricted Share Directors are appointed for renewable terms ending at the next ordinary shareholders’
meeting following their appointment. The appointment and renewal of mandates of directors (i) is based on a recommendation of the Nomination Committee, taking into account the rules regarding the composition of the Board that are set out in the
Articles of Association (e.g., rules regarding number of independent directors and directors appointed upon proposal of the AB InBev Reference Shareholder and the Restricted Shareholders), and (ii) is subject to approval by the shareholders’
meeting. The annual general meeting of the Company held on 26 April 2023 approved a proposal to revise the Board composition rules through an amendment of the Articles of Association, increasing the number of independent directors on the Board from
three to four and decreasing the number of directors appointed upon proposal of our Reference Shareholder from nine to eight. Consequently, pursuant to the amended Articles of Association, the Board is composed as follows, reflecting the
Company’s particular shareholder structure: • four directors shall be independent directors appointed by the shareholders’ meeting upon proposal by the Board; and • so long as the Stichting Anheuser-Busch InBev (the Reference
Shareholder) and/or any of its Affiliates, any of their respective Successors or Successors' Affiliates own, in aggregate, more than 30% of shares with voting rights in the share capital of the company, eight directors shall be appointed by the
shareholders’ meeting upon proposal by the Reference Shareholder and/or any of its Affiliates, any of their respective Successors or Successors' Affiliates; and • so long as the holders of Restricted Shares (the Restricted Shareholders)
(together with their Affiliates, any of their respective Successors and/or Successors' Affiliates) own in aggregate: − more than 13.5% of the Shares with voting rights in the share capital of the company, three directors will be appointed by
the shareholders’ meeting upon proposal by the Restricted Shareholders (each such director a Restricted Share Director); − more than 9% but not more than 13.5% of the Shares with voting rights in the share capital of the company, two
Restricted Share Directors will be appointed; − more than 4.5% but not more than 9% of the Shares with voting rights in the share capital of the company, one Restricted Share Director will be appointed; and − 4.5% or less than 4.5% of
the Shares with voting rights in the share capital of the company, they will no longer have the right to propose any candidate for appointment as a member of the Board and no Restricted Share Directors will be appointed. The Articles of Association
set out detailed rules regarding the calculation of the company’s share capital owned by the Reference Shareholder and the Restricted Shareholders for the purpose of determining director nomination rights. Affiliates and Successors have the
meaning set out in the Articles of Association. The composition of the Board will be balanced primarily considering the respective skills, education, experience and background of each of the Board members. AB InBev fully complies with the Belgian
Code of Corporate Governance, which recommends that companies have at least three independent directors. AB InBev – Annual Report 2023 192
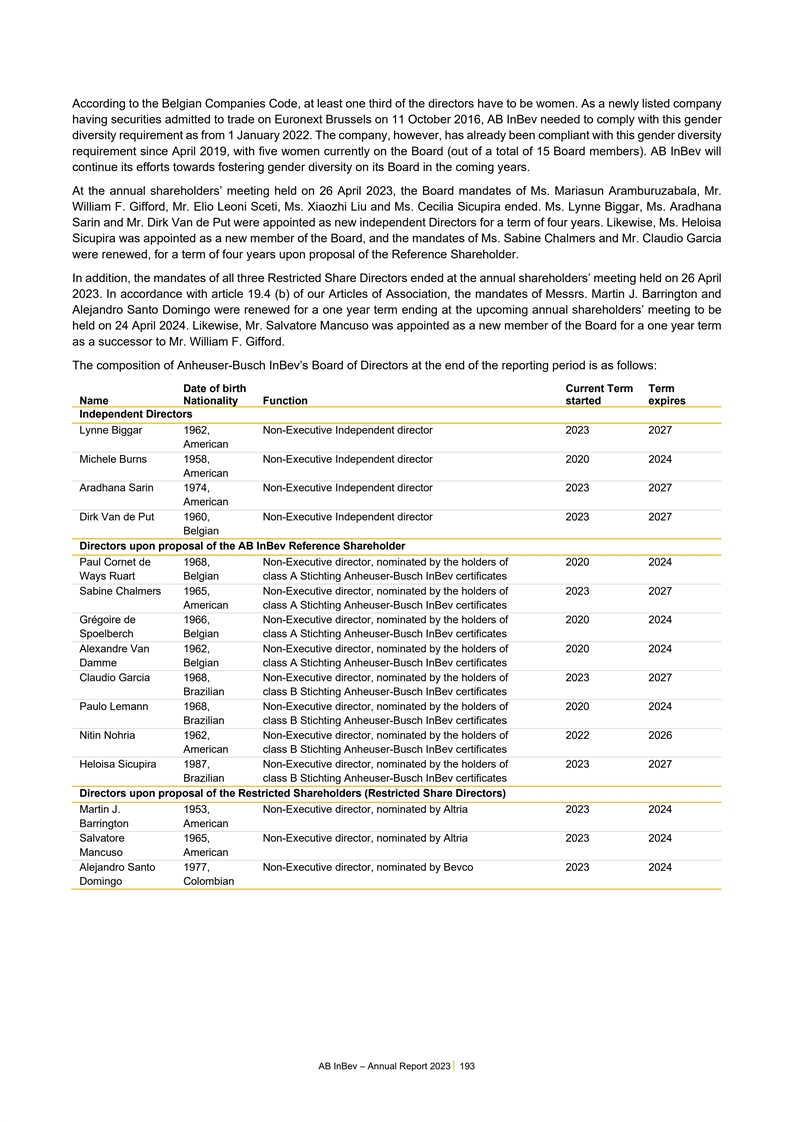
According to the Belgian Companies Code, at least one third of the
directors have to be women. As a newly listed company having securities admitted to trade on Euronext Brussels on 11 October 2016, AB InBev needed to comply with this gender diversity requirement as from 1 January 2022. The company, however, has
already been compliant with this gender diversity requirement since April 2019, with five women currently on the Board (out of a total of 15 Board members). AB InBev will continue its efforts towards fostering gender diversity on its Board in the
coming years. At the annual shareholders’ meeting held on 26 April 2023, the Board mandates of Ms. Mariasun Aramburuzabala, Mr. William F. Gifford, Mr. Elio Leoni Sceti, Ms. Xiaozhi Liu and Ms. Cecilia Sicupira ended. Ms. Lynne Biggar, Ms.
Aradhana Sarin and Mr. Dirk Van de Put were appointed as new independent Directors for a term of four years. Likewise, Ms. Heloisa Sicupira was appointed as a new member of the Board, and the mandates of Ms. Sabine Chalmers and Mr. Claudio Garcia
were renewed, for a term of four years upon proposal of the Reference Shareholder. In addition, the mandates of all three Restricted Share Directors ended at the annual shareholders’ meeting held on 26 April 2023. In accordance with article
19.4 (b) of our Articles of Association, the mandates of Messrs. Martin J. Barrington and Alejandro Santo Domingo were renewed for a one year term ending at the upcoming annual shareholders’ meeting to be held on 24 April 2024. Likewise, Mr.
Salvatore Mancuso was appointed as a new member of the Board for a one year term as a successor to Mr. William F. Gifford. The composition of Anheuser-Busch InBev’s Board of Directors at the end of the reporting period is as follows: Date of
birth Current Term Term Name Nationality Function started expires Independent Directors Lynne Biggar 1962, Non-Executive Independent director 2023 2027 American Michele Burns 1958, Non-Executive Independent director 2020 2024 American Aradhana Sarin
1974, Non-Executive Independent director 2023 2027 American Dirk Van de Put 1960, Non-Executive Independent director 2023 2027 Belgian Directors upon proposal of the AB InBev Reference Shareholder Paul Cornet de 1968, Non-Executive director,
nominated by the holders of 2020 2024 Ways Ruart Belgian class A Stichting Anheuser-Busch InBev certificates Sabine Chalmers 1965, Non-Executive director, nominated by the holders of 2023 2027 American class A Stichting Anheuser-Busch InBev
certificates Grégoire de 1966, Non-Executive director, nominated by the holders of 2020 2024 Spoelberch Belgian class A Stichting Anheuser-Busch InBev certificates Alexandre Van 1962, Non-Executive director, nominated by the holders of 2020
2024 Damme Belgian class A Stichting Anheuser-Busch InBev certificates Claudio Garcia 1968, Non-Executive director, nominated by the holders of 2023 2027 Brazilian class B Stichting Anheuser-Busch InBev certificates Paulo Lemann 1968, Non-Executive
director, nominated by the holders of 2020 2024 Brazilian class B Stichting Anheuser-Busch InBev certificates Nitin Nohria 1962, Non-Executive director, nominated by the holders of 2022 2026 American class B Stichting Anheuser-Busch InBev
certificates Heloisa Sicupira 1987, Non-Executive director, nominated by the holders of 2023 2027 Brazilian class B Stichting Anheuser-Busch InBev certificates Directors upon proposal of the Restricted Shareholders (Restricted Share Directors)
Martin J. 1953, Non-Executive director, nominated by Altria 2023 2024 Barrington American Salvatore 1965, Non-Executive director, nominated by Altria 2023 2024 Mancuso American Alejandro Santo 1977, Non-Executive director, nominated by Bevco 2023
2024 Domingo Colombian AB InBev – Annual Report 2023 193
Mr. Barrington is a representative of the Restricted Shareholders.
Born in 1953, he is an American citizen and graduated from Albany Law School of Union University with a Juris Doctorate Degree. He is the retired Chairman, Chief Executive Officer and President of Altria Group. During his 25 years at Altria Group,
he served in numerous legal and business roles for Altria and its companies. These include Vice Chairman of Altria Group; Executive Vice President and Chief Administrative Officer of Altria Group; Senior Vice President and General Counsel of Philip
Morris International (a separate public company spun-off from Altria Group in 2008); and Senior Vice President and General Counsel of Philip Morris USA. Before joining Altria, Mr. Barrington practiced law in both the government and private sectors.
Ms. Biggar is an independent member of the Board. Born in 1962, she is a US citizen and graduated from Stanford University with a Bachelor’s Degree in International Relations and holds an MBA from Columbia Business School. She is a Senior
Advisor at the Boston Consulting Group and is an independent Board director of Voya Financial, Inc., a leading health, wealth and investment company based in the US, and of Finastra, a financial software company headquartered in the UK. She is also
an independent Executive Committee member of Leading Hotels of the World. Ms. Biggar was Executive Vice President and Global Chief Marketing Officer at Visa from 2016 to 2022. Prior to joining Visa, she served as executive vice president of consumer
marketing and revenue for Time, Inc., and before that, she spent more than 20 years at American Express in a variety of leadership positions. Ms. Biggar is also a Board member of The New 42nd Street and the global media trade group MMA Global. Ms.
Burns is an independent member of the Board. Born in 1958, she is an American citizen and graduated Summa Cum Laude from the University of Georgia with a Bachelor’s Degree in Business Administration and a Master’s Degree in Accountancy.
Ms. Burns was the Chairman and Chief Executive Officer of Mercer LLC from 2006 until 2012. She currently serves on the Boards of Directors of The Goldman Sachs Group, Goldman Sachs International, Etsy and Circle Online Financial, a private company.
From 2003 until 2013, she served as a director of Wal-Mart Stores. From 2013 to 2023, she served on the Board of Cisco Systems. From 2014 until 2018, she served on the Board of Alexion Pharmaceuticals. She currently serves on the Advisory Council of
the Stanford Center on Longevity at Stanford University. Ms. Burns began her career in 1981 at Arthur Andersen, where she became a partner in 1991. In 1999, she joined Delta Air Lines, assuming the role of Chief Financial Officer from 2000 to 2004.
From 2004 to 2006, Ms. Burns served as Chief Financial Officer and Chief Restructuring Officer of Mirant Corporation, an independent power producer. From March 2006 until September 2006, Ms. Burns served as the Chief Financial Officer of Marsh and
McLennan Companies. Ms. Chalmers is a representative of the main shareholders (nominated by Eugénie Patri Sébastien S.A., the holder of the Class A Stichting certificates). Born in 1965, Ms. Chalmers is a dual American-British citizen and
holds a Bachelor’s Degree in Law from the London School of Economics. She is qualified to practice law in England and New York State. Ms. Chalmers is the General Counsel, Company Secretary and Director of Regulatory Affairs of BT Group plc and
is also a member of the Court of Directors of the Bank of England. Prior to joining BT, she was the Chief Legal and Corporate Affairs Officer and Secretary to the Board of Directors of AB InBev, a role she held from 2005 to 2017. Ms. Chalmers joined
AB InBev after 12 years with Diageo plc where she held a number of senior legal positions including as General Counsel of the Latin American and North American businesses. Prior to Diageo plc, she was an associate at the law firm of Lovell White
Durrant in London, specializing in mergers and acquisitions. Mr. Cornet de Ways Ruart is a representative of the main shareholders (nominated by Eugénie Patri Sébastien S.A., the holder of the Class A Stichting certificates). Born in 1968,
he is a Belgian citizen and holds a Master’s Degree as a Commercial Engineer from the Catholic University of Louvain and an MBA from the University of Chicago. He has attended the Master Brewer program at the Catholic University of Louvain.
From 2006 to 2011, he worked at Yahoo! and was in charge of Corporate Development for Europe before taking on additional responsibilities as Senior Financial Director for Audience and Chief of Staff. Prior to joining Yahoo!, Mr. Cornet was Director
of Strategy for Orange U.K. and spent seven years with McKinsey & Company in London and Palo Alto, California. He is also a non-executive director of EPS, Adrien Invest, Floridienne S.A. and several privately held companies. Mr. Garcia is a
representative of the main shareholders (nominated by BRC S.à.R.L., the holder of the class B Stichting certificates). Born in Brazil in 1968, he is a Brazilian citizen and is a graduate from Universidade Estadual do Rio de Janeiro, Brazil with
a B.A. in Economics. Mr. Garcia interned at Companhia Cervejaria Brahma in 1991 and was employed as a Management Trainee in February 1993. From 1993 until 2001, Mr. Garcia worked in several positions in finance, mainly in the area of corporate
budgeting. In 2001, he started the first Shared Service Center for Ambev and in 2003 he became the head of both the Technology and Shared Services operations. Mr. Garcia participated in all M&A integration projects from 1999 until 2018. In 2005,
he was appointed Chief Information and Shared Service Officer for InBev (following the combination of Ambev and Interbrew) in Leuven, Belgium. From 2006 to 2014, Mr. Garcia combined the functions of Chief People and Technology Officer. From 2014 to
January 2018, Mr. Garcia was the Chief People Officer of Anheuser-Busch InBev. Mr. Garcia is a board member of Americanas SA, the Garcia Family Foundation, Chairman of the Telles Foundation and a Trustee at the Chapin School in New York City. AB
InBev – Annual Report 2023 194
Mr. Lemann is a representative of the main shareholders (nominated by
BRC S.à.R.L., the holder of the class B Stichting certificates). Born in Brazil in 1968, he is a Brazilian citizen and graduated from Faculdade Candido Mendes in Rio de Janeiro, Brazil with a B.A. in Economics. Mr. Lemann interned at
PriceWaterhouse in 1989 and was employed as an Analyst at Andersen Consulting from 1990 to 1991. Mr. Lemann also performed equity analysis while at Banco Marka and Dynamo Asset Management (both in Rio de Janeiro). From 1997 to 2004, he developed the
hedge fund investment group at Tinicum Inc., a New York-based investment office that advised the Synergy Fund of Funds, where he served as Portfolio Manager. Mr. Lemann is a Founding Partner at Vectis Partners and is a board member of Americanas SA,
Lemann Foundation and Lone Pine Capital. Mr. Mancuso is a representative of the Restricted Shareholders. Born in 1965, he is a US citizen and holds a Bachelor’s Degree in Accounting from Iona College, USA. He serves as Executive Vice President
and Chief Financial Officer for Altria Group. Over the course of his more than 32 years with Altria, he has held a variety of leadership roles across the Finance, Compliance and Strategy & Business Development organizations. Previous senior
roles for Altria Group include Senior Vice President, Finance & Procurement, and Treasurer & Vice President, Investor Relations and Accounting. Prior to joining the Altria Group, Mr. Mancuso worked for Pittston Company. He also serves on the
Board of the Greater Richmond Partnership. Mr. Nohria is a representative of the main shareholders (nominated by BRC S.à.R.L., the holder of the class B Stichting certificates). Born in 1962, he is an American citizen and graduated from
Massachusetts Institute of Technology with a Ph.D. in Management and from the Indian Institute of Technology, Bombay, with a Bachelor of Technology in Chemical Engineering. Mr. Nohria started his career as a Harvard Business School faculty member in
1988 and served as its Dean from 2010 to 2020. He is currently a Professor at Harvard Business School and Chairman of Thrive Capital, a venture capital firm. Mr. Nohria also serves on the Boards of Directors of Alsym, The Bridgespan Group, Exor,
Mass General Brigham, and Rakuten Medical. Mr. Santo Domingo is a representative of the Restricted Shareholders. Born in 1977, he is a US, Colombian and Spanish citizen and obtained a B.A. in History from Harvard College. He is the Senior Managing
Director at Quadrant Capital Advisors, Inc. in New York City. He was a member of the Board of SABMiller Plc until 2016, where he was also Vice- Chairman of SABMiller Plc for Latin America. Mr. Santo Domingo is Chairman of the Board of Bavaria S.A.
in Colombia. He is Chairman of the Board of Valorem, a company which owns a diverse portfolio of industrial and media assets in Latin America. Mr. Santo Domingo is also a director of Life Time Group Holdings, Inc., an owner and operator of fitness
centers in the United States and Canada, Florida Crystals, the world’s largest sugar refiner, Caracol TV, Colombia’s leading broadcaster, El Espectador, a leading Colombian newspaper, and Cine Colombia, Colombia’s leading film
distribution and movie theatre company. In the non-profit sector, he is Chair of the Wildlife Conservation Society and Fundación Santo Domingo. He is also a Member of the Boards of The Metropolitan Museum of Art, The British Museum, DKMS, a
foundation dedicated to combatting leukemia and blood disorders, WNET, Mount Sinai Health System and Fundación Pies Descalzos, a foundation focused on assisting impoverished children in Colombia. He is a member of Harvard University’s
Global Advisory Council (GAC). Dr. Sarin is an independent member of the Board. Born in 1974, she is a US citizen and holds a medical degree from the University of Delhi, India, and an MBA degree from Stanford Business School, USA. Dr. Sarin is
Executive Director and Chief Financial Officer of AstraZeneca PLC since August 2021. Previously, she was Chief Financial Officer of Alexion, a rare disease biopharmaceutical company. Prior to Alexion, she was Managing Director, Corporate and
Investment Banking at Citi Global Healthcare Banking, Managing Director of Healthcare Investment Banking at UBS, and worked at JP Morgan in the Mergers & Acquisitions advisory group. Dr. Sarin started her career practicing medicine in India and
Africa. She is a member of the Board of Governors of the American Red Cross. Ms. Sicupira is a representative of the main shareholders (nominated by BRC S.à.R.L., the holder of the class B Stichting certificates). Born in 1987, she is a
Brazilian citizen and is a graduate from Columbia University (USA) with an MBA degree and from Pontifícia Universidade Católica (Brazil) with a Bachelor’s Degree in Law, and is qualified to practice law in Brazil. She previously
served on the Board of São Carlos Empreendimentos S.A. from 2018-2021. Ms. Sicupira began her career in 2011 as a lawyer specializing in capital markets. Since 2017 she has been an investment analyst and portfolio manager at LTS Investments and
prior to that she was an investment analyst at MSD Capital. Mr. de Spoelberch is a representative of the main shareholders (nominated by Eugénie Patri Sébastien S.A., the holder of the Class A Stichting certificates). Born in 1966, he is a
Belgian citizen and holds an MBA from INSEAD. Mr. de Spoelberch is an active private equity shareholder and his recent activities include shared Chief Executive Officer responsibilities for Lunch Garden, the leading Belgian self-service restaurant
chain. He is a member of the board of several family-owned companies, such as Eugénie Patri Sébastien S.A., Verlinvest and Cobehold (Cobepa). He is also an administrator of the Baillet-Latour Fund, a foundation that encourages social,
cultural, artistic, technical, sporting, educational and philanthropic achievements. AB InBev – Annual Report 2023 195
Mr. Van Damme is a representative of the main shareholders (nominated
by Eugénie Patri Sébastien S.A., the holder of the Class A Stichting certificates). Born in 1962, he is a Belgian citizen and graduated from Solvay Business School, Brussels. Mr. Van Damme joined the beer industry early in his career and
held various operational positions within Interbrew until 1991, including Head of Corporate Planning and Strategy. He has managed several private venture holding companies and is currently a director of several family-owned companies such as Patri
S.A. (Luxembourg). Mr. Van de Put is an independent member of the Board. Born in 1960, he is a dual citizen of Belgium and the US and holds a doctorate in veterinary medicine from the University of Ghent, Belgium. Mr. Van de Put is Chairman and CEO
of Mondelēz International, the global leader in biscuits and chocolate, since 2017. He joined Mondelēz from McCain Foods Limited, the largest marketer and manufacturer of frozen French fries, potato specialties and appetizers, where he was
President and CEO since 2010. Before joining McCain, he was President of the Global OTC Division of Novartis Inc., a Swiss pharmaceutical company, and spent more than a decade with Groupe Danone, a maker of dairy, water, baby food and clinical
nutrition products, where he served as President of the Americas Division and joint President of the Fresh Dairy Division. In the first 15 years of his career, he held many sales and marketing roles in Europe and Latin America for Mars Inc., as well
as The Coca Cola Company, where he served as President, Coca Cola Caribbean. He is the co-Chair of the Board of Directors at The Consumer Goods Forum, and has previously been a non-executive director of Mattel, a global toy company and Keurig Dr
Pepper, a coffee and drinks company. 2.2. Functioning In 2023, the Board of Anheuser-Busch InBev held nine meetings, most of which were in person meetings. Certain of the meetings were held in the geographical zones in which the company has
operations. On these occasions, the Board was provided with a comprehensive briefing of the relevant geographical zone and market, which included an overview of performance, key challenges facing the market and the steps being taken to address the
challenges. These visits also provided the Board members with the opportunity to meet with employees, trainees, consumers, customers and other stakeholders. Other major Board agenda items in 2023 included the impact of and response to the ongoing
conflict between Russia and Ukraine; geopolitical and macro-economic developments; the long-range plan (10YP); achievement of targets; sales figures and brand health, including Bud Light performance; reporting and budget (1YP); consolidated results;
strategic direction; culture and people, including diversity & inclusion (D&I) and management succession planning; executive compensation; new and ongoing investment; capital market transactions; financial profile and deleveraging; capital
allocation initiatives; transformation initiatives; external growth and acquisitions; marketing strategy; consumer insights; corporate social responsibility and sustainability; risk management and compliance; cybersecurity and data privacy; as well
as discussions on governance and Board succession planning. The average attendance rate at Board meetings in 2023 was 96%. In 2023, the Board has been assisted by four Committees: the Audit Committee, the Finance Committee, the Remuneration
Committee and the Nomination Committee. As per the date of this report, the composition of the Committees is as follows: Audit Nomination Finance Remuneration Committee Committee Committee Committee Martin J. Barrington Member Member Lynne Biggar
Member Michele Burns Chair Member Member Member Sabine Chalmers Member Paul Cornet de Ways Ruart Member Grégoire de Spoelberch Chair Claudio Garcia Chair Chair Paulo Lemann Member Salvatore Mancuso Member Nitin Nohria Member Aradhana Sarin
Member Alejandro Santo Domingo Member Heloisa Sicupira Member Alexandre Van Damme Member Dirk Van de Put Member AB InBev – Annual Report 2023 196
AUDIT COMMITTEE In accordance with the requirements of the Belgian
Companies Code, the Audit Committee is composed exclusively of non- executive Board members and at least one of its members qualifies as an independent director under Belgian law. In addition, Ms. Burns and Ms. Sarin have extensive experience in
accounting and audit matters. Reference is made to section 2.1 for short biographies and overviews of their qualifications and experience. A majority of the voting members of the Audit Committee are independent directors as defined in the
company’s Corporate Governance Charter and all of them are independent as defined in Rule 10A-3(b)(1)(ii) under the US Securities Exchange Act of 1934, as amended. In 2023, the Audit Committee met eight times. During its meetings, the
Committee reviewed the financial statements of the company, the annual report, half-yearly and quarterly statements, as well as related results announcements. The Committee also considered issues arising from internal audits conducted by the
Internal Audit department and the implementation of the company’s Compliance Program. Obligations under the Sarbanes Oxley Act, the review of the independence of the external auditor, the company’s data privacy and cybersecurity
programs, developments in sustainability reporting regulations and a quarterly status update of significant litigation were some of the other important topics on the agenda of the Committee in 2023. The members of the Committee attended all meetings
(100% average attendance rate). FINANCE COMMITTEE The Finance Committee met six times in 2023. Committee discussions included treasury updates and overall risk management strategy including, but not limited to risks related to commodities, interest
rates, currencies and liquidity, hedging policies, the debt profile and capital structure of the group, pensions, dividends and share buy-backs. The members of the Committee attended all meetings, except for Mr. Gifford and Mr. Mancuso each of whom
was excused at one meeting (95% average attendance rate). NOMINATION COMMITTEE The Nomination Committee’s principal role is to guide the Board succession process. The Committee identifies persons qualified to become Board members and
recommends director candidates for nomination by the Board and appointment by the shareholders’ meeting. The Nomination Committee met three times in 2023. Discussions included the nomination of directors for appointment or renewal, Board and
Board Committee composition, management targets, the global management trainee program, D&I initiatives and progress, and succession planning for key executive functions. In 2023, the Nomination Committee also oversaw the on-boarding program for
the new Directors who joined our Board on 26 April 2023. The members of the Committee attended all meetings (100% average attendance rate). REMUNERATION COMMITTEE In accordance with the requirements of the Belgian Companies Code, the Remuneration
Committee is composed exclusively of non-executive Board members and a majority of its members, i.e. Ms. Michele Burns and Mr. Dirk Van de Put, qualify as independent directors under Belgian law. The Remuneration Committee’s principal role is
to guide the Board on decisions relating to the remuneration policies for the Board, the CEO, the Executive Committee (ExCom) and the Senior Leadership Team (SLT) and on individual remuneration packages of directors, the CEO and other members of the
ExCom and members of the SLT. The Remuneration Committee met five times in 2023. Discussions included achievement of targets, Executive and Board compensation, executive shares and restricted stock units schemes, Long Term Incentive grants,
compensation models and special incentives. The members of the Committee attended all meetings (100% average attendance rate). AB InBev – Annual Report 2023 197
2.3. Evaluation of the Board and its committees For each financial
year, the Board performs an evaluation of its performance at the initiative of the Chairman. The Board discusses the results of this evaluation in executive session in the absence of management. A third party may act as facilitator. As part of this
evaluation process, each director is requested to comment on and evaluate the following topics: • effectiveness of Board and committee operations (e.g. checking that important issues are suitably prepared and discussed, time available for
discussion of important policy matters, checking availability and adequacy of pre- read); • the qualifications and responsibilities of individual directors (e.g. actual contribution of each director, the director’s presence at the
meetings and his/her involvement in discussions, impact of changes to the director’s other relevant commitments outside the company); • effectiveness of oversight of management and interaction with management; • composition and
size of the Board and committees. Examples of relevant criteria that are considered include: − director independence: an affirmative determination as to independence in accordance with the independence criteria published in the Corporate
Governance Charter. − other commitments of directors: the outside Board commitments of each director enhance experience and perspective of directors, but will be reviewed on a case-by-case basis to ensure that each director can devote proper
attention to the fulfilment of his oversight responsibilities. − disqualifying circumstances: certain circumstances may constitute a disqualification for membership on the Board (e.g. Board membership of a major supplier, customer or
competitor of the company, membership of a federal or regional government). Circumstances will be evaluated on a case-by-case basis to ensure that directors are not conflicted. − skills and previous contributions: the company expects that all
directors prepare for, attend and participate actively and constructively in all meetings; exercise their business judgment in good faith; focus their efforts on ensuring that the company’s business is conducted so as to further the interests
of the shareholders; and become and remain well informed about the company, relevant business and economic trends and about the principles and practices of sound Corporate Governance. Following review and discussion of the responses, the Chairman of
the Board may table proposals to enhance the performance or effectiveness of the functioning of the Board. Advice can be requested from a third-party expert. The evaluation of the Audit Committee is a recurring agenda item for the Committee and is
performed about once a year. This evaluation is discussed at a Committee meeting and includes assessment of its planning going forward, the appropriateness of the time allocated to its various areas of responsibility, its composition and any areas
for improvement. Any major action points resulting therefrom are reported to the Board. 2.4. Certain transactions and other contractual relationships There are no transactions or other contractual relationships to be reported between the company and
its Board members that gave rise to conflicting interests as defined in the Belgian Companies Code. The company is prohibited from making loans to directors, whether for the purpose of exercising options or for any other purpose. AB InBev –
Annual Report 2023 198
3. Chief Executive Officer and Executive Management The Chief
Executive Officer (CEO) is entrusted by the Board with the responsibility for the day-to-day management of the company. The CEO has direct operational responsibility for the entire company. The CEO leads an Executive Committee (ExCom) which
comprises the CEO, the Chief Financial Officer, the Chief Strategy and Technology Officer and the Chief Legal & Corporate Affairs Officer. The ExCom was established with effect as from 1 January 2019 and is the successor to the former Executive
Board of Management. It reports to the CEO and works with the Board on matters such as corporate governance, general management of our company and the implementation of corporate strategy as defined by our Board. The ExCom performs such other duties
as may be assigned to it from time to time by the CEO or the Board. As per 1 January 2024, our Executive Committee consisted of the following members: Michel Doukeris CEO David Almeida Chief Strategy and Technology Officer Fernando Tennenbaum Chief
Financial Officer John Blood Chief Legal and Corporate Affairs Officer and Corporate Secretary AB InBev – Annual Report 2023 199
4. Senior Leadership Team The Senior Leadership Team (SLT) was
established with effect as from 1 January 2019. The SLT reports to the Chief Executive Officer and consists of the members of the ExCom, all other functional Chiefs and Zone CEOs, including the Chief Executive Officer of Ambev and the Chief
Executive Officer of Bud APAC, who report to the Board of Directors of Ambev and Bud APAC respectively. The SLT has an advisory role to the Board and the ExCom and drives the commercial and operational agenda, reflecting the strategy set out by the
Board. In addition, the SLT performs such duties as may be assigned to it from time to time by the CEO, ExCom or the Board. As per 1 January 2024, our Senior Leadership Team consisted of the following members: Michel Doukeris – CEO Members of
the ExCom (other than the CEO) Zone CEOs David Almeida Chief Strategy and Technology Officer Jan Craps Asia Pacific (APAC) John Blood Chief Legal & Corporate Affairs Officer Jean Jereissati South America and Corporate Secretary Fernando
Tennenbaum Chief Financial Officer Carlos Lisboa Middle America Other Functional Chiefs Cassiano de Stefano Africa Ezgi Barcenas* Chief Sustainability Officer Jason Warner Europe Nick Caton Chief B2B Officer Brendan Whitworth North America Katherine
M. Barrett General Counsel Lucas Herscovici Chief Direct-to-Consumer Officer Nelson Jamel Chief People Officer Donna Lorenson Chief Communications Officer Marcel Marcondes Chief Marketing Officer Ricardo Moreira Chief Supply Officer Ricardo Tadeu
Chief Growth Officer * Ezgi Barcenas has decided to leave AB InBev, effective 1 March 2024, to take on a different professional opportunity. Michel Doukeris is AB InBev’s Chief Executive Officer since 1 July 2021. Born in 1973, he is a
Brazilian citizen and holds a Degree in Chemical Engineering from Federal University of Santa Catarina in Brazil and a Master’s Degree in Marketing from Fundação Getulio Vargas, also in Brazil. He has also completed post-graduate
programs in Marketing and Marketing Strategy from the Kellogg School of Management and Wharton Business School in the United States. Mr. Doukeris joined AB InBev in 1996 and held a number of commercial operations roles in Latin America before moving
to Asia where he led AB InBev’s China and Asia Pacific operations for seven years. In 2016 he moved to the U.S. to assume the position of global Chief Sales Officer. Prior to his appointment as CEO, Mr. Doukeris led Anheuser-Busch and the
North American business since January 2018. David Almeida is AB InBev’s Chief Strategy and Technology Officer since 29 April 2020. Born in 1976, he is a dual citizen of the U.S. and Brazil and holds a Bachelor’s Degree in Economics from
the University of Pennsylvania. Most recently, he served as Chief Strategy and Transformation Officer and before that as Chief Integration Officer and Chief Sales Officer ad interim having previously held the positions of Vice President, U.S. Sales
and of Vice President, Finance for the North American organization. Prior to that, he served as InBev’s head of mergers and acquisitions, where he led the combination with Anheuser-Busch in 2008 and subsequent integration activities in the
U.S. Before joining the group in 1998, he worked at Salomon Brothers in New York as a financial analyst in the Investment Banking division. Katherine Barrett is AB InBev’s General Counsel. Born in 1970, she is a U.S. citizen and holds a
bachelor’s degree in Business Administration from Saint Louis University and a Juris Doctorate degree from the University of Arizona. Ms. Barrett joined Anheuser-Busch in 2000 as a litigation attorney in the Legal Department. She most recently
served as Vice President, U.S. General Counsel & Labor Relations, where she was responsible for overseeing all legal issues in the U.S. including commercial, litigation and regulatory matters and labor relations. Prior to joining the company,
Ms. Barrett worked in private practice at law firms in Nevada and Missouri. AB InBev – Annual Report 2023 200
John Blood is AB InBev’s Chief Legal & Corporate Affairs
Officer and Company Secretary. Born in 1967, Mr. Blood is a U.S. citizen and holds a bachelor’s degree from Amherst College and a JD degree from the University of Michigan Law School. Mr. Blood joined AB InBev in 2009 as Vice President Legal,
Commercial and M&A. Most recently Mr. Blood was AB InBev’s General Counsel. Prior to the latter role, he was Zone Vice President Legal & Corporate Affairs in North America where he has led the legal and corporate affairs agenda for the
United States and Canada. Prior to joining the company, Mr. Blood worked on the legal team in Diageo’s North American business and also was in private practice at a New York City law firm. Nick Caton, is AB InBev’s Chief B2B Officer
since April 2022. Born in 1982, he is a U.S. citizen and received a bachelor’s degree in mathematics from Stanford University and a law degree from Yale Law School. Mr. Caton has been with AB InBev for over 10 years, most recently as Chief
Financial Officer for Anheuser-Busch. During his time at the company, Mr. Caton has held roles in finance, technology and sales in the North America Zone, Asia-Pacific Zone, BEES, and GHQ. Prior to AB InBev, Mr. Caton was with McKinsey and with
Skadden Arps LLP. Jan Craps is AB InBev’s CEO Asia Pacific Zone since 1 January 2019 and CEO and Co-Chair of Budweiser Brewing Company APAC since 8 May 2019. Born in 1977, he is a Belgian citizen and obtained a Degree in Business Engineering
from KU Brussels and a Master’s Degree in Business Engineering from KU Leuven, Belgium. Mr. Craps was an associate consultant with McKinsey & Company before joining Interbrew in 2002. He acquired a range of international experiences in a
number of senior marketing, sales and logistics executive positions in France and Belgium. In 2011, he relocated to Canada where he was appointed Head of Sales for Canada followed by his appointment as President and CEO of Labatt Breweries of Canada
in 2014. Until 31 December 2018, he held the position of Zone President Asia Pacific South. Lucas Herscovici is AB InBev’s Chief Direct-To-Consumer Officer since April 2022. Born in 1977, he is an Argentinean citizen and received a Degree in
Industrial Engineering from Instituto Tecnológico de Buenos Aires. Mr. Herscovici joined the group in 2002 as a Global Management Trainee in Latin America South Zone and has built his career in Marketing and Sales. After years of leading Sales
Strategy in Argentina, he moved to the Global Headquarters and in 2011 was responsible for opening the “Beer Garage”, AB InBev’s Global digital innovation office, based out of Palo Alto, California. After leading Digital Marketing
and Consumer connections for USA, he later became Global Marketing VP of Insights, Innovation and Consumer Connections and held such role until 31 December 2018, when he became Chief Non-Alcohol Officer, a position he held until August 2020. He most
recently served as Chief Sales Officer until April 2022. Nelson Jamel is AB InBev’s Chief People Officer since 29 April 2020. Born in 1972, he is a Brazilian citizen and holds a bachelor’s and master’s degree in industrial
engineering from the Universidade Federal do Rio de Janeiro. His more than 20-year journey with AB InBev has taken him from leading finance roles in Brazil to the Dominican Republic, through Western Europe and North America. Prior to his current
role, he served as the Vice President of Finance and Technology for the North America Zone. Donna Lorenson is AB InBev’s Chief Communications Officer since November 2023. Born in 1973, she is an American citizen and holds a bachelor’s
degree from the University of Idaho. Ms. Lorenson has more than 23 years of deep expertise leading global teams in consumer packaged goods and highly regulated industries. Most recently, she served as Chief Corporate Affairs Officer at Kenvue, the
world’s largest pure-play consumer health company. Previously, she led Global Communications & Public Affairs for the Consumer Health business at Johnson & Johnson. Prior to joining Johnson & Johnson, Ms. Lorenson held leadership
positions at Alcon as Head of US Communications, and at Edelman in their Washington, D.C., and New York offices. Before entering the field of public relations, Donna served in the U.S. Army as a Military Police Officer and was stationed in Ansbach,
Germany. Jean Jereissati Neto is AB InBev’s CEO South America Zone and CEO of Ambev. Born in 1974, he is a Brazilian citizen and received a Degree in Business Administration from Fundação Getúlio Vargas (FGV) and an Executive
Education at Insead and Wharton. Mr. Jereissati joined Ambev in 1998 and held various positions in Sales and Trade Marketing prior to becoming CEO of Cerveceria Nacional Dominicana, in 2013, making a successful integration with CND. In 2015, he
joined Asia and Pacific North Zone to become Business Unit President for China and in 2017 he was appointed Zone President of the Zone, leading one of the most complex and fast-growing business. Most recently, Mr Jereissati held the role of Business
Unit President for Brazil. Carlos Lisboa is AB InBev’s CEO Middle America Zone since 1 January 2019. Born in 1969, he is a Brazilian citizen and received a Degree in Business Administration from the Catholic University of Pernambuco and a
Marketing specialization from FESP, both in Brazil. Mr. Lisboa joined Ambev in 1993 and has built his career in Marketing and Sales. He was responsible for building the Skol brand in Brazil in 2001 and after that became Marketing Vice President for
AB InBev’s Latin American North Zone. Mr. Lisboa then led the International Business Unit in AB InBev’s Latin America South Zone for two years prior to becoming Business Unit President for Canada. In 2015, he was appointed Marketing Vice
President for AB InBev’s Global Brands. Most recently, Mr. Lisboa held the role of Zone President Latin America South until 31 December 2018. AB InBev – Annual Report 2023 201
Marcel Marcondes is AB InBev’s Chief Marketing Officer since
April 2022. Born in 1975, he is a Brazilian citizen and holds a Master’s Degree in business administration from the Business School São Paulo. Mr. Marcondes has been with the company since 2005, most recently as Global President, Beyond
Beer Co. From 2017 to 2021, Mr. Marcondes was the Chief Marketing Officer at Anheuser-Busch, where he led the marketing strategy for a broad portfolio of some of the world’s largest beer brands. Mr. Marcondes sits on the Board of the
Association of National Advertisers (ANA) and is a member of the Cannes Lions CMO Growth Council. He also sits on Adweek’s Diversity & Inclusion Council and leads Anheuser-Busch’s partnerships with AIMM’s #SeeHer and #SeeAll to
promote multicultural marketing. Before joining AB InBev, Mr. Marcondes spent seven years in brand management at Unilever. Ricardo Moreira is AB InBev’s Chief Supply Officer since 1 January 2024. Born in 1971, he is a Portuguese citizen and
received a Degree in Mechanical Engineering from Rio de Janeiro Federal University in Brazil and a specialization in Management from University of Chicago in the U.S. Mr. Moreira joined Ambev in 1995 and held various positions in the Sales and
Finance organizations prior to becoming Regional Sales Director in 2001. He subsequently held positions as Vice President Logistics & Procurement for Latin America North, Business Unit President for Hispanic Latin America (HILA) and Vice
President Soft Drinks Latin America North. In 2013, Mr. Moreira moved to Mexico to head AB InBev’s Sales, Marketing and Distribution organizations and lead the commercial integration of Grupo Modelo. Most recently, Mr. Moreira held the role of
CEO Africa Zone until 31 December 2023 and, prior to that, of Zone President Latin America COPEC until 31 December 2018. Cassiano de Stefano is AB InBev’s CEO Africa Zone since 1 January 2024. Born in 1974, he is a Brazilian citizen and holds
a degree in civil engineering from Unicamp and a Master’s in Business Administration from the University of Sao Paulo. He also has postgraduate certifications in business, sales, marketing, logistics, and administration from The Wharton
School, INSEAD, the Kellogg School of Management, and Stanford University. Mr. de Stefano has been with AB InBev for over 24 years, most recently serving as President of Grupo Modelo in México. During his time at the company, Cassiano has held
various management roles in Sales and Logistics, in Brazil and Russia. Prior to his movement to Mexico, he was Logistics Vice President and Vice President of High End Co for AmBev. Ricardo Tadeu is AB InBev’s Chief Growth Officer since April
2022. Born in 1976, he is a Brazilian citizen, and received a law degree from the Universidade Cândido Mendes in Brazil and a Master of Laws from Harvard Law School in Cambridge, Massachusetts. He is also Six Sigma Black Belt certified. He
joined Ambev in 1995 and has held various roles across the Commercial area. He was appointed Business Unit President for the operations in Hispanic Latin America in 2005, and served as Business Unit President, Brazil from 2008 to 2012. He served as
Zone President, Mexico from 2013 until his appointment as Zone President Africa upon completion of the combination with SAB in 2016. Mr. Tadeu most recently served as Chief B2B Officer, spearheading the creation of BEES, and before that he served as
Chief Sales Officer until July 2020, and Zone President Africa until 31 December 2018. Fernando Tennenbaum is AB InBev’s Chief Financial Officer since 29 April 2020. Born in 1977, he is a dual citizen of Brazil and Germany and holds a degree
in industrial engineering from Escola Politécnica da Universidade de São Paulo and a corporate MBA from Ambev. He joined the company in 2004, and has held various roles in the finance function (including Treasury, Investor Relations and
M&A). He most recently served as the Vice President of Finance (South America Zone) and Chief Financial and Investor Relations Officer of Ambev S.A. Jason Warner is AB InBev’s CEO Europe Zone since 1 January 2019. Born in 1973, he is a
dual British and U.S. citizen and received a BSc Eng Hons Industrial Business Studies degree from DeMontfort University in the United Kingdom. Prior to his current role, he was Business Unit President for North Europe between 2015 and 2018. He
joined AB InBev in July 2009 as Global VP Budweiser, based in New York, before moving into a dual role of Global VP Budweiser and Marketing VP. He has also held Global VP roles for Corona as well as Innovation and Renovation. Prior to joining AB
InBev, he held various positions at The Coca-Cola Company and Nestlé. Brendan Whitworth is AB InBev’s CEO North America Zone and CEO of Anheuser-Busch since 1 July 2021. Born in 1976, he is a US citizen and holds an MBA degree from
Harvard Business School. Prior to his current role, he was Chief Sales Officer of Anheuser-Busch. Mr. Whitworth joined AB InBev in 2013 as a Global Sales Director and went on to hold various commercial leadership positions in the U.S., including
Vice President U.S. Trade Marketing, and Vice President Sales U.S. Northeast Region. Prior to joining AB InBev, Mr. Whitworth held a series of U.S. commercial leadership roles at PepsiCo Frito-Lay. He also served in the US Marine Corps and Central
Intelligence Agency. AB InBev – Annual Report 2023 202
5. Internal Control and Risk Management Systems The Board of Directors
and the ExCom, assisted by the SLT, were responsible for establishing and maintaining adequate internal controls and risk management systems during the reporting period. Internal control is the process designed to provide reasonable assurance
regarding achievement of objectives related to effectiveness and efficiency of operations, reliability of financial reporting and compliance with applicable laws and regulations. Risk management is the process designed to identify potential events
that may affect the company and to manage risks to be within its risk appetite. Without prejudice to the responsibilities of the Board as a whole, the Audit Committee oversees financial and business risk management and discusses the process by which
management assesses and manages the company’s exposure to those risks and the steps taken to monitor and control such exposure. The major risks and uncertainties faced by the company are described in the Risks and Uncertainties section of the
Management report in AB InBev’s annual report. The company has established and operates its internal control and risk management systems based on guidelines issued by the Committee of Sponsoring Organizations of the Treadway Commission (COSO).
The internal control system is based upon COSO’s Internal Control – Integrated Framework of 2013 and the risk management system is based on COSO’s Enterprise Risk Management Framework of 2017. 5.1 Financial reporting The ExCom,
assisted by the SLT, was responsible for establishing and maintaining adequate internal controls over financial reporting during the reporting period. The company’s internal control over financial reporting is a process designed to provide
reasonable assurance regarding the reliability of financial reporting and the preparation of financial statements for external purposes in accordance with International Financial Reporting Standards (IFRS). Internal controls over financial reporting
include those written policies and procedures that: • pertain to the maintenance of records that, in reasonable detail, accurately and fairly reflect the transactions and dispositions of company assets; • provide reasonable assurance
that transactions are recorded as necessary to permit preparation of financial statements in accordance with IFRS; • provide reasonable assurance that receipts and expenditures are being made only in accordance with authorization of management
and directors of the company; and • provide reasonable assurance regarding prevention or timely detection of unauthorized acquisition, use or disposition of assets that could have a material effect on the consolidated financial statements.
Internal control over financial reporting includes the assessment of the relevant risks and the identification and monitoring of key controls and actions taken to correct deficiencies as identified. Because of its inherent limitations, internal
control over financial reporting may not prevent or detect misstatements. Also, projections of any evaluation of effectiveness to future periods are subject to the risk that controls may become inadequate because of changes in conditions, or that
the degree of compliance with the policies or procedures may deteriorate. Senior management assessed the effectiveness of the company’s internal control over financial reporting as of 31 December 2023. As indicated above, management based this
assessment on criteria for effective internal control over financial reporting described in “Internal Control — Integrated Framework” issued by COSO in May 2013. The assessment included an evaluation of the design of the
company’s internal control over financial reporting and testing of its operational effectiveness. Based on this assessment, it was determined that, as of 31 December 2023, the company maintained effective internal control over financial
reporting. The Board of Directors and the Audit Committee reviewed management’s assessment. The review related among other things to ensuring that there are no significant deficiencies or material weaknesses in the design or operation of
internal controls over financial reporting which are reasonably likely to adversely affect the company’s ability to record, process, summarize and report financial information, and to the existence of any fraud, whether or not material, that
involves management or other employees who have a significant role in the company’s internal control over financial reporting. AB InBev – Annual Report 2023 203
In addition, as a result of the listing of Anheuser-Busch InBev on the
New York Stock Exchange, the company must adhere to Section 404 of the US Sarbanes-Oxley Act of 2002. As a consequence, the company is required to provide on a yearly basis a management report on the effectiveness of the company’s internal
control over financial reporting, as described in Section 404 of the US Sarbanes-Oxley Act of 2002 and the rules implementing the act. Management’s report and the Statutory Auditor’s related opinion regarding the relevant financial year,
will be included in the company’s Annual Report on Form 20-F for such year, which is required to be filed with the US Securities and Exchange Commission. 5.2 Internal Audit The company has a professional and independent internal audit (risk
management) department. The appointment of the Head of internal audit is reviewed by the Audit Committee. The Audit Committee reviews internal audit’s risk assessment and annual audit plan and regularly receives internal audit reports for
review and discussion. Internal control deficiencies identified by internal audit are communicated in a timely manner to management and periodic follow-up is performed to verify corrective action has been taken. 5.3 Compliance AB InBev has an Ethics
& Compliance Program which fosters a culture of ethics, integrity and lawful behavior. This program includes a Code of Business Conduct and the Anti-Corruption Policy. During 2023, the Code of Business Conduct was updated to reinforce key
principles and policies. In addition, training on company policies was expanded in 2023 to reach more colleagues and more topics. The Ethics & Compliance Program further promotes compliance with applicable laws and regulations and the completion
of a periodic certification by management of compliance with the Code of Business Conduct. A set of internal controls and a data analytics tool have been implemented and are periodically assessed by the Global and Local Ethics & Compliance
Committees and the Audit Committee. The Global Ethics & Compliance Committee, chaired by the company’s Global Head of Ethics & Compliance, assesses regulatory, ethical and compliance risks for the company from a global perspective and
provides strategic direction for the activities of the Ethics and Compliance function. On a quarterly basis, the Global Ethics & Compliance Committee reviews the operation of the Compliance Program and follows-up on reports submitted through the
company’s Compliance Helpline (a confidential whistle-blowing platform). In addition to the Global Ethics & Compliance Committee, each Zone has its own Local Ethics & Compliance Committee, which addresses local ethics and compliance
matters. The Audit Committee reviews the operation of the Ethics & Compliance Program and the results of any compliance reviews or reports submitted through the company’s global Compliance Helpline. On a regular basis, the Audit Committee
also reviews the significant legal, compliance and regulatory matters that may have a material effect on the financial statements or the company’s operations, including material notices to or inquiries received from governmental agencies. In
addition, the Board of Directors dedicated time in 2023 to a review of the company’s compliance function and programs, including in the areas of data privacy and cybersecurity. AB InBev – Annual Report 2023 204
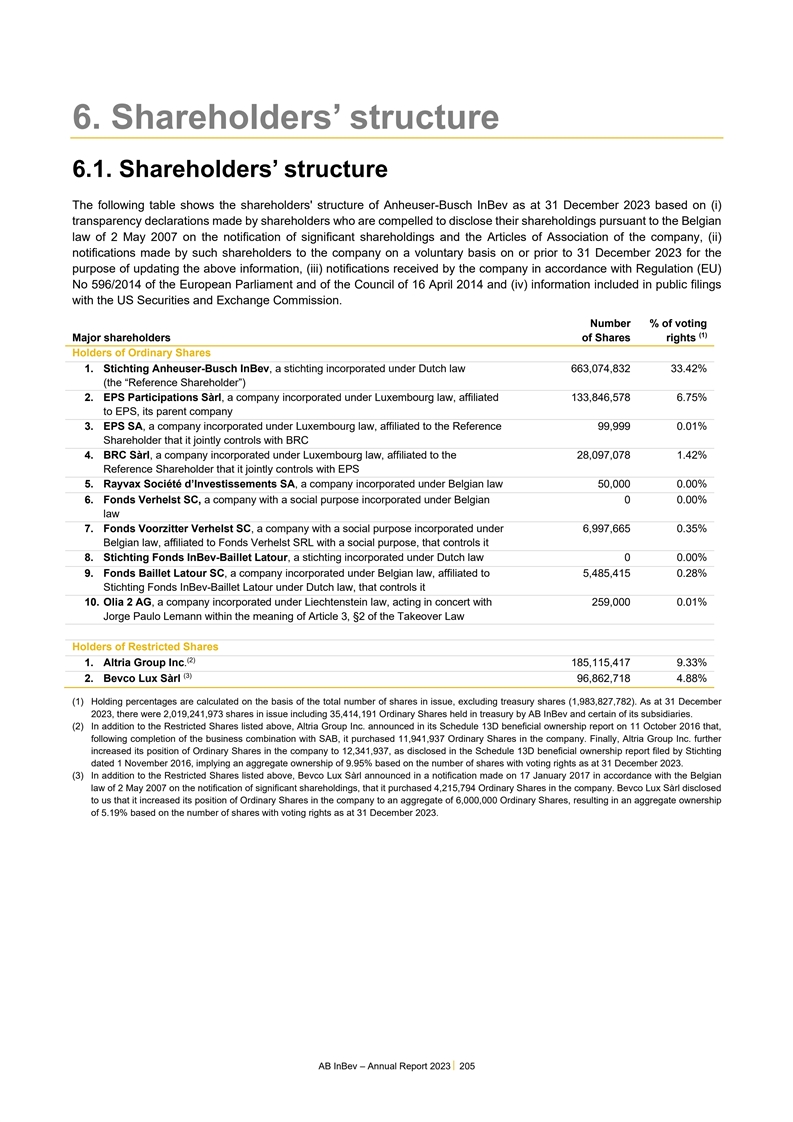
6. Shareholders’ structure 6.1. Shareholders’ structure
The following table shows the shareholders' structure of Anheuser-Busch InBev as at 31 December 2023 based on (i) transparency declarations made by shareholders who are compelled to disclose their shareholdings pursuant to the Belgian law of 2 May
2007 on the notification of significant shareholdings and the Articles of Association of the company, (ii) notifications made by such shareholders to the company on a voluntary basis on or prior to 31 December 2023 for the purpose of updating the
above information, (iii) notifications received by the company in accordance with Regulation (EU) No 596/2014 of the European Parliament and of the Council of 16 April 2014 and (iv) information included in public filings with the US Securities and
Exchange Commission. Number % of voting (1) Major shareholders of Shares rights Holders of Ordinary Shares 1. Stichting Anheuser-Busch InBev, a stichting incorporated under Dutch law 663,074,832 33.42% (the “Reference Shareholder”) 2.
EPS Participations Sàrl, a company incorporated under Luxembourg law, affiliated 133,846,578 6.75% to EPS, its parent company 3. EPS SA, a company incorporated under Luxembourg law, affiliated to the Reference 99,999 0.01% Shareholder that it
jointly controls with BRC 4. BRC Sàrl, a company incorporated under Luxembourg law, affiliated to the 28,097,078 1.42% Reference Shareholder that it jointly controls with EPS 5. Rayvax Société d’Investissements SA, a company
incorporated under Belgian law 50,000 0.00% 6. Fonds Verhelst SC, a company with a social purpose incorporated under Belgian 0 0.00% law 7. Fonds Voorzitter Verhelst SC, a company with a social purpose incorporated under 6,997,665 0.35% Belgian law,
affiliated to Fonds Verhelst SRL with a social purpose, that controls it 8. Stichting Fonds InBev-Baillet Latour, a stichting incorporated under Dutch law 0 0.00% 9. Fonds Baillet Latour SC, a company incorporated under Belgian law, affiliated to
5,485,415 0.28% Stichting Fonds InBev-Baillet Latour under Dutch law, that controls it 10. Olia 2 AG, a company incorporated under Liechtenstein law, acting in concert with 259,000 0.01% Jorge Paulo Lemann within the meaning of Article 3, §2 of
the Takeover Law Holders of Restricted Shares (2) 1. Altria Group Inc. 185,115,417 9.33% (3) 2. Bevco Lux Sàrl 96,862,718 4.88% (1) Holding percentages are calculated on the basis of the total number of shares in issue, excluding treasury
shares (1,983,827,782). As at 31 December 2023, there were 2,019,241,973 shares in issue including 35,414,191 Ordinary Shares held in treasury by AB InBev and certain of its subsidiaries. (2) In addition to the Restricted Shares listed above, Altria
Group Inc. announced in its Schedule 13D beneficial ownership report on 11 October 2016 that, following completion of the business combination with SAB, it purchased 11,941,937 Ordinary Shares in the company. Finally, Altria Group Inc. further
increased its position of Ordinary Shares in the company to 12,341,937, as disclosed in the Schedule 13D beneficial ownership report filed by Stichting dated 1 November 2016, implying an aggregate ownership of 9.95% based on the number of shares
with voting rights as at 31 December 2023. (3) In addition to the Restricted Shares listed above, Bevco Lux Sàrl announced in a notification made on 17 January 2017 in accordance with the Belgian law of 2 May 2007 on the notification of
significant shareholdings, that it purchased 4,215,794 Ordinary Shares in the company. Bevco Lux Sàrl disclosed to us that it increased its position of Ordinary Shares in the company to an aggregate of 6,000,000 Ordinary Shares, resulting in an
aggregate ownership of 5.19% based on the number of shares with voting rights as at 31 December 2023. AB InBev – Annual Report 2023 205
The first ten entities mentioned in the table act in concert (it being
understood that (i) the first nine entities act in concert within the meaning of article 3, §1, 13º of the Belgian law of 2 May 2007 on the disclosure of significant shareholdings in issuers whose securities are admitted to trading on a
regulated market and containing various provisions, implementing into Belgian law Directive 2004/109/CE, and (ii) the tenth entity acts in concert with the first nine entities within the meaning of article 3, §2 of the Belgian law of 1 April
2007 on public takeover bids) and hold, as per (i) the most recent notifications received by AB InBev and the FSMA in accordance with (a) article 6 of the Belgian law of 2 May 2007 on the notification of significant shareholdings or (b) Regulation
(EU) No 596/2014 of the European Parliament and of the Council of 16 April 2014, and (ii) notifications to the company made on a voluntary basis prior to 31 December 2023, in aggregate, 837,910,567 Ordinary Shares, representing 42.24% of the voting
rights attached to the shares outstanding as of 31 December 2023 excluding treasury shares. 6.2. Shareholders’ arrangements Stichting Anheuser-Busch InBev (the Reference Shareholder) has entered into shareholders’ agreements with (a)
BRC, EPS, EPS Participations, Rayvax Société d’Investissements SA (Rayvax), (b) Fonds Baillet Latour SC and Fonds Voorzitter Verhelst SC with a social purpose, and (c) the largest holders of Restricted Shares in the company (the
Restricted Shareholders). A. REFERENCE SHAREHOLDER’S AGREEMENT In connection with the combination of Interbrew with Ambev in 2004, BRC, EPS, Rayvax and the Reference Shareholder entered into a shareholders’ agreement on 2 March 2004
which provided for BRC and EPS to hold their interests in the old Anheuser-Busch InBev through the Reference Shareholder (except for approximately 134 million shares held directly or indirectly by EPS and approximately 28 million shares held
directly by BRC based on the most recent shareholding disclosure received by the company as at 31 December 2023). The shareholders’ agreement was amended and restated on 9 September 2009. On 18 December 2013, EPS contributed to EPS
Participations its certificates in the Reference Shareholder and the shares it held in the old Anheuser-Busch InBev except for 100,000 shares. Immediately thereafter, EPS Participations joined the concert constituted by BRC, EPS, Rayvax and the
Reference Shareholder and adhered to the shareholders’ agreement. On 18 December 2014, the Reference Shareholder, EPS, EPS Participations, BRC and Rayvax entered into a new shareholders’ agreement that replaced the previous
shareholders’ agreement of 2009. On 11 April 2016, the parties thereto entered into an amended and restated new shareholders’ agreement (the 2016 Shareholders’ Agreement). On April 27, 2023, the parties thereto entered into an
amended and restated shareholders’ agreement (the 2023 Shareholders’ Agreement), which replaced in its entirety the 2016 Shareholders’ Agreement. The 2023 Shareholders’ Agreement has primarily modified certain provisions for
nominating members of the Board included in the 2016 Shareholders’ Agreement. The 2023 Shareholders’ Agreement addresses, among other things, certain matters relating to the governance and management of both AB InBev and the Reference
Shareholder, as well as (i) the transfer of the Reference Shareholder certificates, and (ii) the de-certification and re-certification process for the company’s shares (the Shares) and the circumstances in which the Shares held by the
Reference Shareholder may be de-certified and/or pledged at the request of BRC, EPS and EPS Participations. The 2023 Shareholders’ Agreement provides for restrictions on the ability of BRC and EPS/EPS Participations to transfer their Reference
Shareholder certificates. Pursuant to the terms of the 2023 Shareholders’ Agreement, BRC and EPS/EPS Participations jointly and equally exercise control over the Reference Shareholder and the Shares held by the Reference Shareholder. The
Reference Shareholder is managed by an eight-member board of directors and each of BRC and EPS/EPS Participations have the right to appoint four directors to the Reference Shareholder board of directors. Subject to certain exceptions, at least seven
of the eight Reference Shareholder directors must be present or represented in order to constitute a quorum of the Reference Shareholder board, and any action to be taken by the Reference Shareholder board of directors will, subject to certain
qualified majority conditions, require the approval of a majority of the directors present or represented, including at least two directors appointed by BRC and two directors appointed by EPS/EPS Participations. Subject to certain exceptions, all
decisions of the Reference Shareholder with respect to the Shares it holds, including how such Shares will be voted at shareholders’ meetings of AB InBev (Shareholders’ Meetings), will be made by the Reference Shareholder board of
directors. AB InBev – Annual Report 2023 206
The 2023 Shareholders’ Agreement requires the Reference
Shareholder board of directors to meet prior to each shareholders’ meeting of AB InBev to determine how the Shares held by the Reference Shareholder are to be voted. The 2023 Shareholders’ Agreement requires EPS, EPS Participations, BRC
and Rayvax, as well as any other holder of certificates issued by the Reference Shareholder, to vote their Shares in the same manner as the Shares held by the Reference Shareholder. The parties agree to effect any free transfers of their Shares in
an orderly manner of disposal that does not disrupt the market for the Shares and in accordance with any conditions established by the company to ensure such orderly disposal. In addition, under the 2023 Shareholders’ Agreement, EPS, EPS
Participations and BRC agree not to acquire any shares of Ambev’s capital stock, subject to limited exceptions. Pursuant to the 2023 Shareholders’ Agreement, the Reference Shareholder board of directors will propose to the
shareholders’ meeting of AB InBev eight candidates for appointment to the Board, among which each of BRC and EPS/EPS Participations will have the right to nominate four candidates. The 2023 Shareholders’ Agreement will remain in effect
for an initial term until 27 August 2034. It will be automatically renewed for successive terms of ten years each unless, not later than two years prior to the expiration of the initial or any successive ten-year term, either party to the 2023
Shareholders' Agreement notifies the other of its intention to terminate the 2023 Shareholders’ Agreement. B. VOTING AGREEMENT BETWEEN THE REFERENCE SHAREHOLDER AND THE FOUNDATIONS In addition, the Reference Shareholder has entered into a
voting agreement with Fonds Baillet Latour SRL with a social purpose (now Fonds Baillet Latour SC) and Fonds Voorzitter Verhelst SRL with a social purpose (now Fonds Voorzitter Verhelst SC). This agreement provides for consultations between the
three bodies before any shareholders’ meetings of AB InBev to decide how they will exercise the voting rights attached to their Shares. Consensus is required for all items that are submitted to the approval of any shareholders’ meetings.
If the parties fail to reach a consensus, Fonds Baillet Latour SC and Fonds Voorzitter Verhelst SC will vote their Shares in the same manner as the Reference Shareholder. The voting agreement is valid until 1 November 2034. C. VOTING AGREEMENT
BETWEEN THE REFERENCE SHAREHOLDER AND SOME RESTRICTED SHAREHOLDERS On 8 October 2016, the Reference Shareholder and each holder of Restricted Shares (such holders being the Restricted Shareholders) holding more than 1% of the company’s total
share capital, being Altria Group Inc. and Bevco LTD, have entered into a voting agreement, to which the company is also a party, under which notably: • the Reference Shareholder is required to exercise the voting rights attached to its
Ordinary Shares to give effect to the directors’ appointment principles set out in articles 19 and 20 of the Articles of Association of the company; • each Restricted Shareholder is required to exercise the voting rights attached to its
Ordinary Shares and Restricted Shares, as applicable, to give effect to the directors’ appointment principles set out in articles 19 and 20 of the Articles of Association; and • each Restricted Shareholder is required not to exercise the
voting rights attached to its Ordinary Shares and Restricted Shares, as applicable, in favour of any resolutions which would be proposed to modify the rights attached to Restricted Shares, unless such resolution has been approved by a qualified
majority of the holders of at least 75% of the Restricted Shareholder Voting Shares (as defined in the Articles of Association). AB InBev – Annual Report 2023 207
7. Items to be disclosed pursuant to Article 34 of the Belgian Royal
Decree of 14 November 2007 According to article 34 of the Belgian Royal Decree of 14 November 2007, Anheuser-Busch InBev hereby discloses the following items: 7.1. Capital structure and authorizations granted to the Board The company’s share
capital is divided in two categories of shares: all shares are ordinary shares (the Ordinary Shares), except for the restricted shares which were issued as part of the combination with SAB and remain outstanding from time to time (the Restricted
Shares). Since 11 October 2021, the Restricted Shares are convertible at the election of their holders into new Ordinary Shares on a one-for-one basis. Following conversion requests made until 31 December 2023, as of 1 January 2024, 282,044,710
Restricted Shares remain outstanding compared to 1,737,197,263 outstanding Ordinary Shares. As of that date, Ordinary Shares represented 86.03% of the capital while Restricted Shares represented 13.97% of the capital. Ordinary Shares and Restricted
Shares have the same rights except as set out in the Articles of Association. Restricted Shares shall always be in registered form and shall not be listed or admitted to trading on any stock market. Anheuser-Busch InBev may increase or decrease its
share capital with the specific approval of a shareholders’ meeting. The shareholders may also authorize the Board of Directors to increase the share capital. Such authorization must be limited in time and amount. In either case, the
shareholders’ approval or authorization must satisfy the quorum and majority requirements applicable to amendments to the Articles of Association. At the annual shareholders’ meeting of 27 April 2022, the shareholders authorized the
Board of Directors to increase the share capital of AB InBev to an amount not to exceed 3% of the total number of shares issued and outstanding on 27 April 2022 (i.e. 2,019,241,973). This authorization has been granted for five years from the date
of publication of the amendment of the Articles of Association resolved upon by the shareholders’ meeting held on 27 April 2022 (i.e., until 3 June 2027). It can be used for several purposes, including when the sound management of the
company’s business or the need to react to appropriate business opportunities calls for a restructuring, an acquisition (whether private or public) of securities or assets in one or more companies or, generally, any other appropriate increase
of the company’s capital. AB InBev’s Board of Directors has been authorized by the shareholders’ meeting to acquire, on or outside the stock exchange, AB InBev shares up to maximum 20% of the issued shares for a unitary price which
will not be lower than 1 Euro and not higher than 20% above the highest closing price in the last 20 trading days preceding the transaction. This authorization is valid for five years as from the date of publication of the amendment of the Articles
of Association resolved upon by the shareholders’ meeting held on 28 April 2021 (i.e., until 1 June 2026). 7.2. Voting rights and transferability of shares and shareholders’ arrangements VOTING RIGHTS, QUORUM AND MAJORITY REQUIREMENTS
Each share entitles the holder to one vote. In accordance with article 7:217, §1 and article 7:224 of the Belgian Companies Code, the voting rights attached to shares held by Anheuser-Busch InBev and its subsidiaries are suspended. Generally,
there is no quorum requirement for a shareholders’ meeting and decisions will be taken by a simple majority vote of shares present or represented. However, certain matters will require a larger majority and/or a quorum. These include the
following: i. any amendment to the Articles of Association (except the amendments to the corporate purpose or the transformation of the legal form of the company), including inter alia, reductions or increases of the share capital of the company
(except for capital increases decided by the Board pursuant to the authorized capital) or any resolution relating to a merger or demerger of the company require the presence in person or by proxy of shareholders holding an aggregate AB InBev –
Annual Report 2023 208
of at least 50% of the issued share capital, and the approval of a
qualified majority of at least 75% of the votes cast at the meeting (without taking abstentions into account); ii. any authorization to repurchase of Shares requires a quorum of shareholders holding an aggregate of at least 50% of the share capital
and approval by a qualified majority of at least 75% of the votes cast at the meeting (without taking abstentions into account); iii. any modification of the purpose of the company requires a quorum of shareholders holding an aggregate of at least
50% of the share capital and approval by a qualified majority of at least 80% of the votes cast at the meeting (without taking abstentions into account); iv. resolutions relating to the modification of the rights attached to a particular class of
shares will require the presence in person or by proxy of shareholders holding an aggregate of at least 50% of the issued share capital in each class of shares and the approval of a qualified majority of at least 75% of the votes cast at the meeting
(without taking abstentions into account) in each class of shares, (in each of the cases (i), (ii), (iii) and (iv), if a quorum is not present, a second meeting must be convened. At the second meeting, the quorum requirement does not apply. However,
the qualified majority requirement of 75% or 80%, as the case may be, continues to apply); and v. any acquisition or disposal of tangible assets by the company for an amount higher than the value of one third of the company’s consolidated
total assets as reported in its most recent audited consolidated financial statements requires the approval of a qualified majority of at least 75% of the votes cast at the meeting (without taking abstentions into account), but there is no minimum
quorum requirement. As an additional rule, in the event of (i) a contribution in kind to the company with assets owned by any person or entity which is required to file a transparency declaration pursuant to applicable Belgian law or a subsidiary
(within the meaning of article 1:15 of the Belgian Companies Code) of such person or entity, or (ii) a merger of the company with such a person or entity or a subsidiary of such person or entity, then such person or entity and its subsidiaries shall
not be entitled to vote on the resolution submitted to the shareholders’ meeting to approve such contribution in kind or merger. TRANSFERABILITY OF SHARES Ordinary Shares are freely transferable. As far as Restricted Shares are concerned,
until 10 October 2021, no Restricted Shareholder was able, in each case directly or indirectly, to transfer, sell, contribute, offer, grant any option on, otherwise dispose of, pledge, charge, assign, mortgage, grant any lien or any security
interest on, enter into any certification or depository arrangement or enter into any form of hedging arrangement with respect to, any of its Restricted Shares or any interests therein or any rights relating thereto, or enter into any contract or
other agreement to do any of the foregoing, except in the specific instances set out in the Articles of Association in connection with transactions with Affiliates and Successors or in relation with Pledges. Each of the terms Affiliates, Successors
and Pledge is defined in the Articles of Association. Since 11 October 2021, these transfer restrictions are no longer applicable, but Restricted Shares shall automatically convert into Ordinary Shares (on a one-for-one basis) upon any transfer,
sale, contribution or other disposal of Restricted Shares as set out below. CONVERSION Voluntary conversion Since 11 October 2021, each Restricted Shareholder has the right to convert all or part of its holding of Restricted Shares into Ordinary
Shares at its election at any time. Automatic conversion The Restricted Shares shall automatically convert into Ordinary Shares in the situations set out in article 7.6. of the Articles of Association, i.e.: • upon any transfer, sale,
contribution or other disposal, except as set out in article 7.6 (a) of the Articles of Association in connection with transactions with Affiliates and Successors or in relation with Pledges; • immediately prior to the closing of a successful
public takeover bid for all shares of the company or the completion of a merger of Anheuser-Busch InBev as acquiring or disappearing company, in circumstances where the shareholders directly or indirectly, controlling or exercising directly or
indirectly joint control over AB InBev immediately prior to such takeover bid or merger will not directly or indirectly control, or exercise joint control over, AB InBev or the surviving entity following such takeover bid or merger; or • upon
the announcement of a squeeze-out bid for the outstanding shares of the company, in accordance with article 7:82 of the Belgian Companies Code. SHAREHOLDERS ARRANGEMENTS Please refer to section 6.2 above. AB InBev – Annual Report 2023
209
7.3. Significant agreements or securities of Anheuser- Busch InBev
that may be impacted by a change of control on the company 1. REVOLVING CREDIT AND SWINGLINE FACILITIES AGREEMENT The company entered, on 16 February 2021, into an Amendment and Restatement Agreement in respect of its existing Revolving Credit and
Swingline Facilities Agreement originally dated 26 February 2010, as amended from time to time and for the last time pursuant to an Amendment Letter dated 27 October 2015 (the Original Facilities Agreement and, as amended and restated by the
Amendment and Restatement Agreement, the Restated Facilities Agreement ). The Original Facilities Agreement was originally entered into by the old Anheuser-Busch InBev SA/NV, and was transferred to the company as a result of the merger between
Anheuser-Busch InBev (formerly “Newbelco”) and the old Anheuser- Busch InBev SA/NV, that took place on 10 October 2016 in the framework of the combination with SAB. The total commitments of the Original Facilities Agreement were,
immediately prior to the effective date of the Amendment and Restatement Agreement, USD 9,000,000,000 and, following the effective date of the Amendment and Restatement Agreement, USD 10,100,000,000. Pursuant to the Amendment and Restatement
Agreement, the maturity of the Original Facilities Agreement was extended from August 2022 under the Original Facilities Agreement to February 2026 under the Restated Facilities Agreement. The company has, with effect from 17 March 2022, exercised
the first of its two options under the Restated Facilities Agreement to further extend the maturity of the USD 10,100,000,000 facility until February 2027. Likewise, the company has, with effect from 8 September 2023, exercised the second of its two
options under the Restated Facilities Agreement to further extend the maturity of the facility until February 2028 with total commitments of USD 9,750,000,000 for the period from February 2027 to February 2028. The Restated Facilities Agreement
contains a clause 17 (Mandatory Prepayment) that grants, in essence, to any lender under the Restated Facilities Agreement, upon a Change of Control over the Company, the right (i) not to fund any loan or letter of credit (other than a rollover loan
meeting certain conditions) and (ii) (by not less than 30 days written notice) to cancel its undrawn commitments and require repayment of its participations in the loans or letters of credit, together with accrued interest thereon, and all other
amounts owed to such lender under the Restated Facilities Agreement (and certain related documents). Pursuant to the Restated Facilities Agreement (a) “Change of Control” means “any person or group of persons acting in concert (in
each case other than Stichting InBev or any existing direct or indirect certificate holder or certificate holders of Stichting InBev or any person or group of persons acting in concert with any such persons) gaining Control of the Company, (b)
“acting in concert” means “a group of persons who, pursuant to an agreement or understanding (whether formal or informal), actively co-operate, through the acquisition directly or indirectly of shares in the Company by any of them,
either directly or indirectly, to obtain Control of the Company” and (c) “Control” means, in respect of the Company, (a) “the direct or indirect ownership of more than 50 per cent of the share capital or similar rights of
ownership of the Company or the power to direct the management and the policies of the Company whether through the ownership of share capital, contract or otherwise or (b) the power (whether by way of ownership of shares, proxy, contract, agency or
otherwise) to: (i) cast, or control the casting of, more than 50 per cent. of the maximum number of votes that might be cast at a general meeting; or (ii) appoint or remove all, or the majority, of the directors or other equivalent officers; or
(iii) give directions to management with respect to the operating and financial policies of the entity with which the directors or other equivalent officers of the Company are obliged to comply”. In accordance with article 7:151 of the Belgian
Companies Code, clause 17 (Mandatory Prepayment) of the Restated Facilities Agreement was approved by the annual shareholders’ meeting of the Company held on 28 April 2021. Similar clauses were, in respect of the Original Facilities Agreement,
approved by the shareholders meeting of old Anheuser-Busch InBev SA/NV on 27 April 2010 and 27 April 2016 in accordance with the then Article 556 of the 2009 Belgian Companies Code. As of 31 December 2023, no drawdowns were outstanding under the
Original Facilities Agreement. 2. EMTN PROGRAM In accordance with article 556 of the 2009 Belgian Companies Code, the shareholders’ meeting of the old Anheuser-Busch InBev approved on 24 April 2013 (i) Condition 7.5. of the Terms &
Conditions (Redemption at the Option of the Noteholders (Change of Control Put)) of the 15,000,000,000 Euro updated Euro Medium Term Note Program dated 16 May 2012 of Anheuser-Busch InBev SA/NV and Brandbrew SA (the “Issuers”) and
Deutsche Bank AG, London Branch, acting as Arranger, which may be applicable in the case of Notes issued under the Program (the “EMTN Program”), (ii) any other provision in the EMTN Program granting rights to third parties which could
affect the company’s assets or could impose an AB InBev – Annual Report 2023 210
obligation on the company where in each case the exercise of those
rights is dependent on the occurrence of a “Change of Control” (as defined in the Terms & Conditions of the EMTN Program). Pursuant to the EMTN Program, (a) “Change of Control” means “any person or group of persons
acting in concert (in each case other than Stichting Anheuser-Busch InBev or any existing direct or indirect certificate holder or certificate holders of Stichting Anheuser-Busch InBev) gaining Control of the company provided that a change of
control shall not be deemed to have occurred if all or substantially all of the shareholders of the relevant person or group of persons are, or immediately prior to the event which would otherwise have constituted a change of control were, the
shareholders of the company with the same (or substantially the same) pro rata interests in the share capital of the relevant person or group of persons as such shareholders have, or as the case may be, had, in the share capital of the
company”, (b) “acting in concert” means “a group of persons who, pursuant to an agreement or understanding (whether formal or informal), actively cooperate, through the acquisition directly or indirectly of shares in the
company by any of them, either directly or indirectly, to obtain Control of the company”, and (c) “Control” means the “direct or indirect ownership of more than 50 per cent of the share capital or similar rights of ownership
of the company or the power to direct the management and the policies of the company whether through the ownership of share capital, contract or otherwise”. If a Change of Control Put is specified in the applicable Final Terms of the concerned
notes, Condition 7.5. of the Terms & Conditions of the EMTN Programme grants, to any holder of such notes, in essence, the right to request the redemption of his notes at the redemption amount specified in the Final Terms of the notes, together,
if appropriate, with interest accrued, upon the occurrence of a Change of Control and a related downgrade of the notes to sub-investment grade. The change of control provision above is included in the Final Terms of: • the 750,000,000 Euro
7.375% Notes due 2013 (Redeemed on 30 January 2013), the 600,000,000 Euro 8.625% Notes due 2017 (Redeemed on 9 December 2016) and the 550,000,000 GBP 9.75% Notes due 2024, each issued by the company in January 2009; • the 750,000,000 Euro
6.57% Notes due 2014, issued by the company in February 2009 (Redeemed on 27 February 2014); • the 50,000,000 Euro FRN Notes that bear an interest at a floating rate of 3 month EURIBOR plus 3.90 %, issued by the company in April 2009 (Redeemed
on 9 April 2014); • the 600,000,000 CHF 4.50% Notes due 2014 (Redeemed on 11 June 2014), issued by Brandbrew SA in June 2009 (with a guarantee by the company); • the 250,000,000 Euro 5.75% Notes due 2015 (Redeemed on 22 June 2015) and
the 750,000,000 GBP 6.50% Notes due 2017 (Redeemed in June 2017), each issued by the company in June 2009; and • the 750,000,000 Euro 4% Notes due 2018 (Redeemed in April 2018), issued by the company in April 2010. The series of Notes referred
to in the above paragraph were issued pursuant to the 10,000,000,000 Euro initial Euro Medium Term Note Programme dated 16 January 2009 or the 15,000,000,000 Euro updated Euro Medium Term Note Programme dated 24 February 2010 (as applicable). The
relevant change of control provisions contained in the Final Terms of such series of Notes were submitted to, and approved by, the shareholders meetings of the old Anheuser-Busch InBev held on 28 April 2009 and 27 April 2010, respectively. There is
no change of control clause included in the Final Terms of any series of Notes issued pursuant to the EMTN Programme by the company and/or Brandbrew SA after April 2010. As a result of the update of the EMTN Programme on 22 August 2013 the Terms
& Conditions of the updated EMTN Programme no longer provide for a Redemption at the option of the Noteholders (Change of Control Put). In May 2016, the old Anheuser-Busch InBev invited Noteholders of certain outstanding series of Notes issued
under the EMTN Programme prior to 2016 (the Notes ) to consider certain amendments to the terms and conditions applicable to those Notes (the Participation Solicitation ). The Participation Solicitation was undertaken to avoid any suggestion that
the combination with SAB could be interpreted as a cessation of business (or a threat to do so), winding up or dissolution of the old Anheuser-Busch InBev. Meetings of the Noteholders of each series of the Notes were held on 1 June 2016 at which
Noteholders voted in favour of the Participation Solicitation for each of the relevant series of Notes. Amended and restated final terms for each series of the Notes reflecting the amended terms and conditions, were signed by the old Anheuser-Busch
InBev and the subsidiary guarantors named therein on 1 June 2016. The EMTN Program has been transferred to the company as a result of the merger between Anheuser-Busch InBev (formerly “Newbelco”) and the old AB InBev, that took place on
10 October 2016 in the framework of the combination with SAB. AB InBev – Annual Report 2023 211
3. US DOLLAR NOTES In accordance with article 556 of the 2009 Belgian
Companies Code, the shareholders meeting of the old Anheuser-Busch InBev approved on 26 April 2011 (i) the Change of Control Clause of the USD 3,250,000,000 Notes issued on 29 and 26 March 2010, consisting of USD 1,000,000,000 2.50 % Notes due 2013
(Exchanged for Registered Notes in an exchange offer that closed on 2 September 2010 and redeemed on 26 March 2013), USD 750,000,000 3.625 % Notes due 2015 (Exchanged for Registered Notes in an exchange offer that closed on 2 September 2010 and
redeemed on 15 April 2015), USD 1,000,000,000 5.00 % Notes due 2020 (Exchanged for Registered Notes in an exchange offer that closed on 2 September 2010 and redeemed on 6 June 2018) and USD 500,000,000 Floating Rate Notes due 2013 (Exchanged for
Registered Notes in an exchange offer that closed on 2 September 2010 and redeemed on 26 March 2013) (the “Unregistered Notes issued in March 2010”), (ii) the Change of Control Clause of the USD 3,250,000,000 Registered Notes issued in
September 2010, consisting of USD 1,000,000,000 2.50 % Notes due 2013 (Redeemed on 26 March 2013), USD 750,000,000 3.625 % Notes due 2015 (Redeemed on 15 April 2015), USD 1,000,000,000 5.00 % Notes due 2020 (Redeemed on 6 June 2018) and USD
500,000,000 Floating Rate Notes due 2013 (Redeemed on 26 March 2013) and offered in exchange for corresponding amounts of the corresponding Unregistered Notes issued in March 2010, in accordance with a US Form F-4 Registration Statement pursuant to
an exchange offer launched by Anheuser-Busch InBev Worldwide Inc. in the U.S. on 5 August 2010 and expired on 2 September 2010 (the “Registered Notes issued in September 2010”), (iii) the Change of Control Clause of the USD 8,000,000,000
Registered Notes issued in March 2011, consisting of USD 1,250,000,000 7.20% Notes due 2014 (Redeemed on 20 June 2011), USD 2,500,000,000 7.75% Notes due 2019 (Redeemed on 19 March 2018) and USD 1,250,000,000 8.20% Notes due 2039, USD 1,550,000,000
5.375 % Notes due 2014 (Redeemed on 15 November 2014), USD 1,000,000,000 6.875 % Notes due 2019 (Redeemed on 15 November 2019) and USD 450,000,000 8.00 % Notes due 2039 and offered in exchange for corresponding amounts of the corresponding
Unregistered Notes issued in January 2009 and of the corresponding Unregistered Notes issued in May 2009, in accordance with a US Form F-4 Registration Statement pursuant to an exchange offer launched by Anheuser-Busch InBev Worldwide Inc. in the
U.S. on 11 February 2011 and expired on 14 March 2011 (the “Registered Notes issued in March 2011”), whereby each of the Unregistered Notes issued in March 2010, the Registered Notes issued in September 2010 and the Registered Notes
issued in March 2011 were issued by Anheuser-Busch InBev Worldwide Inc. with an unconditional and irrevocable guarantee as to payment of principal and interest from the old Anheuser-Busch InBev, and (iv) any other provision applicable to the
Unregistered Notes issued in March 2010, the Registered Notes issued in September 2010 and the Registered Notes issued in March 2011 granting rights to third parties which could affect the company’s assets or could impose an obligation on the
company where in each case the exercise of those rights is dependent on the launch of a public take-over bid over the shares of the company or on a “Change of Control” (as defined in the Offering Memorandum with respect to the
Unregistered Notes, as the case may be, and in the Registration Statement with respect to the Registered Notes). Pursuant to the Offering Memorandum and Registration Statement (a) “Change of Control” means “any person or group of
persons acting in concert (in each case other than Stichting Anheuser-Busch InBev or any existing direct or indirect certificate holder or certificate holders of Stichting Anheuser-Busch InBev) gaining Control of the company provided that a change
of control shall not be deemed to have occurred if all or substantially all of the shareholders of the relevant person or group of persons are, or immediately prior to the event which would otherwise have constituted a change of control were, the
shareholders of the company with the same (or substantially the same) pro rata interests in the share capital of the relevant person or group of persons as such shareholders have, or as the case may be, had, in the share capital of the
company”, (b) “Acting in concert” means “a group of persons who, pursuant to an agreement or understanding (whether formal or informal), actively cooperate, through the acquisition directly or indirectly of shares in the
company by any of them, either directly or indirectly, to obtain Control of the company”, and (c) “Control” means the “direct or indirect ownership of more than 50 per cent of the share capital or similar rights of ownership
of the company or the power to direct the management and the policies of the company whether through the ownership of share capital, contract or otherwise”. The Change of Control clause grants to any Noteholder, in essence, the right to
request the redemption of his Notes at a repurchase price in cash of 101% of their principal amount (plus interest accrued) upon the occurrence of a Change of Control and a related downgrade in the Notes to sub-investment grade. AB InBev –
Annual Report 2023 212
A similar change of control provision was approved by the
shareholders’ meeting of the old Anheuser-Busch InBev on 28 April 2009 with respect to: • the USD 5,000,000,000 Notes, consisting of USD 1,250,000,000 7.20% Notes due 2014 (Exchanged for Registered Notes in an exchange offer that closed
on 14 March 2011 and redeemed on 20 June 2011), USD 2,500,000,000 7.75% Notes due 2019 (Exchanged for Registered Notes in an exchange offer that closed on 14 March 2011 and redeemed on 19 March 2018) and USD 1,250,000,000 8.20% Notes due 2039
(Exchanged for Registered Notes in an exchange offer that closed on 14 March 2011), each issued in January 2009 by Anheuser- Busch InBev Worldwide Inc. with an unconditional and irrevocable guarantee as to payment of principal and interest from
Anheuser-Busch InBev SA/NV (the “Unregistered Notes issued in January 2009”). A similar change of control provision was approved by the shareholders’ meeting of the old Anheuser-Busch InBev on 27 April 2010 with respect to: •
the USD 3,000,000,000 Notes issued in May 2009, consisting of USD 1,550,000,000 5.375 % Notes due 2014 (Exchanged for Registered Notes in an exchange offer that closed on 14 March 2011 and redeemed on 15 November 2014), USD 1,000,000,000 6.875 %
Notes due 2019 (Redeemed on 15 November 2019) and USD 450,000,000 8.00 % Notes due 2039 (the “Unregistered Notes issued in May 2009”) each issued by Anheuser- Busch InBev Worldwide Inc. with an unconditional and irrevocable guarantee as
to payment of principal and interest from the old Anheuser-Busch InBev. • the USD 5,500,000,000 Notes issued in October 2009, consisting of USD 1,500,000,000 3.00 % Notes due 2012 (Exchanged for Registered Notes in an exchange offer that
closed on 05 February 2010 and redeemed on 15 October 2012), USD 1,250,000,000 4.125 % Notes due 2015 (Exchanged for Registered Notes in an exchange offer that closed on 5 February 2010 and redeemed on 15 January 2015), USD 2,250,000,000 5.375 %
Notes due 2020 (exchanged for Registered Notes in an exchange offer that closed on 5 February 2010 and redeemed on 23 April 2018) and USD 500,000,000 6.375 % Notes due 2040 (exchanged for Registered Notes in an exchange offer that closed on 5
February 2010 and partially exchanged for a combination of Unregistered Notes and cash in an exchange offer that closed on 6 April 2017) (the “Unregistered Notes issued in October 2009”) each issued by Anheuser-Busch InBev Worldwide Inc.
with an unconditional and irrevocable guarantee as to payment of principal and interest from the old Anheuser-Busch InBev. • the USD 5,500,000,000 Registered Notes issued in February 2010, consisting of USD 1,500,000,000 3 % Notes due 2012
(Redeemed on 15 October 2012), USD 1,250,000,000 4.125 % Notes due 2015 (Redeemed on 15 January 2015), USD 2,250,000,000 5.375 % Notes due 2020 (redeemed on 23 April 2018) and USD 500,000,000 6.375 % Notes due 2040 (partially exchanged for a
combination of Unregistered Notes and cash in an exchange offer that closed on 6 April 2017) and offered in exchange for corresponding amounts of the corresponding Unregistered Notes issued in October 2009, in accordance with a US Form F-4
Registration Statement pursuant to an exchange offer launched by Anheuser-Busch InBev Worldwide Inc. in the US on 8 January 2010 and expired on 5 February 2010 (the “Registered Notes issued in February 2010”) each issued by
Anheuser-Busch InBev Worldwide Inc. with an unconditional and irrevocable guarantee as to payment of principal and interest from the old Anheuser-Busch InBev. The US Dollar Notes have been transferred to the company as a result of the merger between
Anheuser-Busch InBev (formerly “Newbelco”) and the old AB InBev, which took place on 10 October 2016 in the framework of the combination with SAB. 4. NOTES ISSUED UNDER ANHEUSER-BUSCH INBEV’S SHELF REGISTRATION STATEMENT FILED ON
FORM F-3. For the sake of completeness, there is no Change of Control Clause applicable to outstanding Notes issued under Anheuser- Busch InBev’s Shelf Registration Statement filed on Form F-3 (with an unconditional and irrevocable guarantee
as to payment of principal and interest from Anheuser-Busch InBev SA/NV). AB InBev – Annual Report 2023 213
8. Remuneration 8.1. Remuneration policy The remuneration policy
applies to the directors, the CEO and the other members of the ExCom. References to the remuneration of other executives of the company, including the other members of the Senior Leadership Team (SLT), are purely for information purposes. The
remuneration policy was approved at the annual shareholders’ meeting of 27 April 2022. 8.1.1. REMUNERATION COMMITTEE The Remuneration Committee consists of three members appointed by the Board, all of whom are non-executive directors.
Currently, the chairperson of the Remuneration Committee is a representative of the Reference Shareholder and the two other members meet the requirements of independence as established by the Belgian Companies and Associations Code and the 2020
Belgian Corporate Governance Code. The CEO and the Chief People Officer are invited to the meetings of the Remuneration Committee. The Remuneration Committee meets four times a year, and more often if required, and is convened by its chairperson or
at the request of at least two of its members. The detailed composition, functioning and specific responsibilities of the Remuneration Committee are set forth in its terms of reference, which are part of the company’s Corporate Governance
Charter. The principal role of the Remuneration Committee is to guide the Board with respect to all its decisions relating to the remuneration policies for the Board, the CEO, the ExCom and the SLT, and on their individual remuneration packages. Its
objective is that the CEO and members of the ExCom and SLT are incentivized to achieve, and are compensated for, exceptional performance. It also promotes the maintenance and continuous improvement of the company’s compensation framework,
which applies to all employees. AB InBev’s compensation framework is based on meritocracy and a sense of ownership with a view to aligning the interests of employees with the interests of shareholders. The Remuneration Committee takes into
account the compensation of the employees when preparing the remuneration policy applicable to the directors, the members of the ExCom and the other members of the SLT. Particularly, the Committee discusses and assesses key areas of remuneration
policy for the wider workforce throughout the year, the annual bonus pool and resulting pay outcomes for employees across the workforce and any material changes to the structure of workforce compensation. The Remuneration Committee prepares (and
revises as the case may be) the remuneration policy and the remuneration report. In exceptional circumstances, the company may temporarily derogate from the remuneration policy. These exceptional circumstances cover situations in which the
derogation is necessary to serve the long-term interests and sustainability of the company as a whole or to assure its viability. Such derogation requires the approval of both the Remuneration Committee and the Board of Directors. The remuneration
report relating to the relevant financial year will include information on any derogation, including its justification. As noted above, the Remuneration Committee is composed exclusively of non-executive directors and a majority of its members
qualify as independent directors. This helps to prevent conflicts of interest regarding the establishment, amendments and implementation of the remuneration policy in relation to the CEO and ExCom members. The CEO and the Chief People Officer do not
take part in any discussions or deliberations of the Remuneration Committee related to their remuneration. The Remuneration Committee can hold in camera sessions without management being present whenever it deems appropriate to do so. In addition,
the power to approve the remuneration policy, prior to its submission to the shareholders’ meeting, and the determination of the remuneration of the CEO and the ExCom and SLT members is vested with the Board upon recommendation of the
Remuneration Committee. No member of the ExCom is at the same time a member of the Board. As regards the remuneration of the directors, all decisions are adopted by the shareholders’ meeting. AB InBev – Annual Report 2023 214
8.1.2. REMUNERATION POLICY OF THE DIRECTORS A. Remuneration governance
The Remuneration Committee recommends the remuneration for directors, including the chairperson and the directors sitting on one or more of the Board committees. In so doing, it benchmarks from time to time directors’ remuneration against peer
companies, as the case may be, with the assistance of an independent consulting firm. These recommendations are subject to approval by the Board and, subsequently, by the shareholders at the annual general meeting. In addition, the Board sets and
revises, from time to time, the rules and level of compensation for directors carrying out a special mandate and the rules for reimbursement of directors’ business-related out-of-pocket expenses. The shareholders’ meeting may from time
to time revise the directors’ remuneration upon recommendation of the Remuneration Committee. B. Structure of the remuneration The remuneration of the directors comprises a fixed cash fee component and a share-based component consisting of an
award of Restricted Stock Units, which makes Board remuneration simple, transparent and easy for shareholders to understand. Remuneration is commensurate to the time committed by the directors to the Board and its various committees and is set by
the shareholders’ meeting upon recommendation of the Remuneration Committee. In addition, the remuneration is designed to attract and retain talented directors. The award of Restricted Stock Units further aligns the interests of the directors
with the sustainable value-creation objectives of the company. Restricted Stock Units corresponding to a fixed value in Euro are granted to the members of its Board as part of the fixed remuneration for the exercise of their duties. The Restricted
Stock Units vest after five years and, upon vesting, entitle their holders to one AB InBev share per Restricted Stock Unit (subject to any applicable withholdings). The granting and vesting of the Restricted Stock Units are not subject to
performance criteria. Such Restricted Stock Units therefore qualify as fixed remuneration, as recommended by the 2020 Belgian Corporate Governance Code. Contrary to the soft law recommendation of the 2020 Belgian Corporate Governance Code, the
shares delivered to directors upon vesting of the Restricted Stock Units are not subject to a lock-up of three years after the date of the delivery and one year after the date of departure of the relevant director. However, the five-year vesting
period of the Restricted Stock Units fosters a sustainable and long-term commitment of the directors to shareholder value creation that addresses the goal of the 2020 Belgian Corporate Governance Code. C. Other The company is prohibited from making
loans to directors, whether for the purpose of exercising options or for any other purpose (except for routine advances for business-related expenses in accordance with the company’s rules for reimbursement of expenses). The company does not
provide pensions, medical benefits or other benefit programs to directors. 8.1.3. REMUNERATION POLICY OF THE EXCOM The company’s remuneration policy is designed to support its high-performance culture and the creation of long-term sustainable
value for its shareholders. The goal of the policy is to reward executives with market-leading compensation, which is conditional upon both the overall success of the company and individual performance. It promotes alignment with shareholders’
interests by strongly encouraging executive ownership of shares in the company and enables the company to attract and retain the best talent at a global level. Base salaries are aligned with mid-market levels. Additional short- and long-term
incentives are linked to challenging short- and long-term performance targets, and the investment of part or all of any variable compensation earned in company shares is encouraged (see section 8.1.3.A.b). The Board determines the maximum amount for
the funding of the variable remuneration pool prior to the start of a performance year and the allocation is made in accordance with criteria determined by the Board upon recommendation of the Remuneration Committee. All criteria and the duration of
the vesting periods are aligned with the relevant time horizon of the company and set with the goal of fostering the company’s sustainable and long-term commitment to shareholder value creation and its talent retention strategy. Criteria and
objectives are reviewed by the Remuneration Committee and the Board to promote alignment with the company’s business objective and strategic ambition. AB InBev – Annual Report 2023 215
The targets for each of the performance KPIs and business and
individual objectives of the CEO and the other members of the ExCom and SLT are set and assessed by the Board based on a pre-determined performance matrix, upon recommendation of the Remuneration Committee. The target achievement and corresponding
annual and long-term incentives of the CEO and the other members of the ExCom and SLT are assessed by the Remuneration Committee. The Board may revise the level of remuneration and approve a revised remuneration policy upon recommendation of the
Remuneration Committee, subject to the approval of the shareholders’ meeting where required. A. Components of executive remuneration Executive remuneration generally consists of (a) fixed base salary, (b) variable performance-related
compensation (bonus), (c) long-term incentives in the form of long-term Restricted Stock Units, long-term Performance Stock Units and/or long- term stock options, (d) pension schemes and (e) other components. The ratio between fixed remuneration
(consisting of items (a), (d) and (e) listed above) and on-target variable remuneration (consisting of items (b) and (c) listed above) depends on seniority levels of the executives. Our remuneration structure places a significant emphasis on
share-based components, resulting in items (b) and (c) being of a relatively higher weight assuming all performance and other requirements are fully met. To promote alignment with market practice, executives’ total compensation is reviewed
overall against benchmarks. These benchmarks are collected by independent compensation consultants, in relevant industries and geographies. For benchmarking, a custom sample of over 20 global leading peer companies (the Compensation Peer Group) is
used when available. The Compensation Peer Group is comprised of companies with a similar size to AB InBev, with the majority of them belonging to the consumer goods sector, and each shares a complex and diverse business model and operates in talent
and labor markets similar to AB InBev. The Compensation Peer Group is set by the Remuneration Committee upon the advice of an independent compensation consultant. It may be revised from time to time as the company evolves. The Compensation Peer
Group that is used as the benchmark for a given financial year will be detailed in the Remuneration Report for such financial year. If Compensation Peer Group data is not available for a given role, Fortune 100 companies’ data is used.
Executives’ total compensation at target is intended to be 10% above the third quartile. a. Base salary Executives’ base salaries are intended to be aligned with mid-market levels for the appropriate market. Mid-market means that, for a
similar job in the market, 50% of companies in that market pay more and 50% of companies pay less. b. Variable performance-related compensation (bonus) – Share-based compensation plan Variable performance-related compensation (bonus) is key to
the company’s compensation system and is aimed at rewarding executives’ short- and long-term performance. The target variable performance-related compensation (bonus) is expressed as a percentage of the market reference salary applicable
to the executive. The on-target bonus percentage currently theoretically amounts to maximum 200% of the market reference salary for members of the ExCom and 340% for the CEO. Company performance below or above target will result in a bonus payout
that is lower or higher than the theoretical on-target amount, subject to a cap. An additional incentive of 20% on a bonus amount may be awarded by the Remuneration Committee in the case of exceptional circumstances. The effective payout of variable
performance-related compensation (bonus) is directly correlated with performance, i.e. linked to the achievement of total company, business unit and individual targets, all of which are based on performance metrics. If executives do not achieve
their individual target hurdle, no bonus is earned irrespective of whether the total company and/or relevant business units achieve their targets. If, on the other hand, the total company and/or relevant business unit targets are not achieved, a
limited portion of the bonus is payable to executives if they achieve their individual target hurdle. AB InBev – Annual Report 2023 216
Company and business unit targets are based on performance metrics
which focus on top-line growth, profitability and long-term value creation. Examples of key performance metrics are: • EBITDA (organic) • Cash Flow Generation • Net Revenue Growth • Market Share • Sustainability targets
These performance metrics may evolve over time. The metrics and the relative weight attributed to each of them are set by the Board annually taking into account the company’s strategic priorities. Further details on the metrics for a given
financial year are included in the remuneration report for such year. Individual performance targets of the CEO and the other members of the ExCom may consist of financial and non-financial targets. Individual financial targets can, for example, be
related to EBITDA, net revenue, capex, resource allocation and net debt ratios. Examples of individual non-financial targets include brand development, operations and innovation, sustainability and other elements of corporate social responsibility,
corporate reputation and compliance/ethics. Typical individual performance measures in the non-financial areas relate to employee engagement, talent pipeline, sustainability goals and compliance, and are linked to the achievement of the
company’s strategic objectives. The target achievement for each of the performance metrics and business and personal objectives is assessed by the Remuneration Committee on the basis of accounting and financial data and other objective
criteria. A weighted performance score is translated into a payout curve with a cap, subject to a hurdle of achievement for individual targets. The hurdle is set at the minimum acceptable level of individual performance to trigger eligibility for a
bonus pay-out. The variable performance-related compensation (bonus) is usually paid annually in arrears after the publication of the company’s full year results, in or around March of the relevant year. Exceptionally, it may be paid out
semi-annually at the discretion of the Board. In such case, the first half of the variable compensation is paid shortly after publication of the half year results and the second half is paid after publication of the full year results. Executives
receive their variable performance-related compensation (bonus) in cash but are encouraged to invest some (up to 60%) or all of its value in company shares (Voluntary Shares). Voluntary Shares are: • existing ordinary shares; • entitled
to dividends paid as from the date of grant; • subject to a lock-up period of three years; and • granted at market price, to which a discount of up to 20% is applied. The discount is delivered in the form of Restricted Stock Units,
subject to specific restrictions or forfeiture provisions in the event of termination of service (Discounted Shares). Executives who invest in Voluntary Shares also receive one and a half matching shares from the company for each voluntary share
invested up to a limited total percentage (60%) of each executive’s variable compensation. These matching shares are also delivered in the form of Restricted Stock Units (Matching Shares). The Restricted Stock Units relating to the Matching
Shares and the Discounted Shares vest over a three-year period. No performance conditions apply to the vesting of the Restricted Stock Units. However, Restricted Stock Units will only be granted under the double condition that the executive: •
has earned a variable compensation, which is subject to the successful achievement of total company, business unit and individual performance targets (performance condition); and • has agreed to reinvest all or part of his/her variable
compensation in company shares, which are subject to a lock- up as indicated above (ownership condition). Specific forfeiture rules apply in the event the executive leaves the company before the vesting date of the Restricted Stock Units. AB InBev
– Annual Report 2023 217
In accordance with the authorization granted in the company’s
bylaws, this variable compensation system partly deviates from article 7:91 of the Belgian Companies and Associations Code, as it allows: • for the variable remuneration to be paid out based on the achievement of annual targets without
staggering its grant or payment over a three-year period. However, as indicated above, executives are encouraged to invest some or all of their variable compensation in company Voluntary Shares. Such voluntary investment also leads to a grant of
Matching Shares in the form of Restricted Stock Units, which vest over a three-year period, promoting sustainable long-term performance; and • for the Voluntary Shares granted under the share-based compensation plan to vest at their grant,
instead of applying a vesting period of minimum three years. Nonetheless, the Voluntary Shares are subject to a lock-up period of three years. c. Long-term incentives Annual long-term incentives Subject to management’s assessment of the
executive’s performance and future potential, members of our senior management may be eligible for an annual long-term incentive paid out in Restricted Stock Units, Performance Stock Units and/or stock options. Any grant of annual long-term
incentives to members of the ExCom and SLT is subject to Board approval, upon recommendation of the Remuneration Committee. Grants to executives of a certain seniority, including members of the ExCom and SLT, will primarily take the form of a
combination of Restricted Stock Units and Performance Stock Units. Long-term Restricted Stock Units have the following features: • a grant value determined on the basis of the market price or an average market price of the share at the time of
grant; • upon vesting, each Restricted Stock Unit entitles its holder to acquire one share; • the Restricted Stock Units cliff vest over a three-year period; and • in the event the executive leaves the company before the vesting
date, specific forfeiture rules will apply. Long-term Performance Stock Units have the following features: • a grant value determined on the basis of the market price or an average market price of the share at the time of grant; • the
Performance Stock Units cliff vest over a three-year period; • upon vesting of the Performance Stock Units, the number of shares to which the holders thereof shall be entitled shall depend on a performance test measuring (on a percentile
basis) the company’s three-year Total Shareholder Return (TSR) relative to the TSR realized for that period by a representative sample of listed companies belonging to the consumer goods sector. The number of shares to which such Units entitle
their holders is subject to a hurdle and cap; and • in the event the executive leaves the company before the vesting date, specific forfeiture rules will apply. Long-term incentive stock options have the following features: • an exercise
price equal to the market price or an average market price of the share at the time of grant; • a maximum lifetime of 10 years and an exercise period that starts after five years; • upon exercise, each option entitles the option holder
to purchase one share; • the options cliff vest after five years; and • in the event of termination of service before the vesting date, specific forfeiture rules will apply. AB InBev – Annual Report 2023 218
Exceptional long-term incentives Restricted Stock Units, Performance
Stock Units or stock options may be granted from time to time to members of the senior management of the company: • who have made a significant contribution to the success of the company; or • who have made a significant contribution in
relation to acquisitions and/or the achievement of integration benefits; or • to incentivize and retain senior leaders who are considered to be instrumental in achieving the company’s ambitious short or long-term growth agenda. Vesting
of such Restricted Stock Units, Performance Stock Units or stock options may be subject to achievement of performance conditions which will be related to the objectives of such exceptional grants. Such performance conditions may consist of financial
metrics related to market conditions (e.g. relative TSR) or non-market conditions (e.g. an EBITDA compounded annual growth rate). Grants will primarily take the form of Restricted Stock Units. Any grant of exceptional long-term incentives to members
of the ExCom and SLT is subject to Board approval, upon recommendation of the Remuneration Committee. The following historic exceptional long-term incentive plans are listed by way of example: 1. 2020 Incentive Plan: options could be granted to
selected members of the senior management of the company, who were considered to be instrumental in helping the company to achieve its ambitious growth target. Each option gave the grantee the right to purchase one existing share. An exercise price
was set at an amount equal to the market price of the share at the time of grant. The options had a duration of 10 years as from granting and would vest after five years. The options would only become exercisable provided a performance test was met
by the company. This performance test was based on a net revenue amount which had to be achieved by 31 December 2022 at the latest. 2. Integration Incentive Plan: options could be granted to selected members of the senior management of the company
considering the significant contribution that these employees could make to the success of the company and the achievement of integration benefits. Each option gave the grantee the right to purchase one existing AB InBev share. The exercise price of
the options was set at an amount equal to the market price of the share at the time of grant. The options had a duration of 10 years from grant and would vest on 1 January 2022 and would only become exercisable provided a performance test was met by
the company by 31 December 2021 at the latest. This performance test was based on an EBITDA compounded annual growth rate target and could be complemented by additional country or zone specific or function specific targets. Specific forfeiture rules
applied if the employee left the company before the performance test achievement or vesting date. 3. Incentive Plan for SAB employees: options could be granted to employees of former SAB. The grant resulted from the commitment that the company made
under the terms of the combination with SAB that it would, for at least one year, preserve the terms and conditions for employment of all employees that remain with the group. Each option gives the grantee the right to purchase one existing AB InBev
share. The exercise price of the options is set at an amount equal to the market price of the share at the time of grant. The options have a duration of 10 years as from granting and vest after three years. Specific forfeiture rules apply if the
employee leaves the company before the vesting date. 4. Long Run Stock Options Incentive Plan: options can be granted to selected members of the company’s senior management to incentivize and retain senior leaders who are considered to be
instrumental in achieving the company’s ambitious long-term growth agenda over the next 10 years. Each option gives the grantee the right to purchase one existing share. The exercise price of the options is set at the closing share price on
the day preceding the grant date. The options have a duration of 15 years as from granting and, in principle, vest after 5 or 10 years. The options only become exercisable provided a performance test is met by the company. This performance test is
based on an organic EBITDA compounded annual growth rate target. Specific forfeiture rules apply if the employee leaves the company before the performance test achievement or vesting date. Upon recommendation of the Remuneration Committee, the Board
can implement similar exceptional long-term incentive plans. AB InBev – Annual Report 2023 219
Other recurring long-term Restricted Stock Unit programs Several
recurring specific long-term Restricted Stock Unit programs are in place: 1. A base long-term Restricted Stock Units program allowing for the offer of Restricted Stock Units to members of the company’s senior management. In addition to the
annual Long-term Restricted Stock Units described above (see section 8.1.3.A.c Annual long-term incentives), under this program, Restricted Stock Units can be granted under other sub-plans with specific terms and conditions and for specific
purposes, e.g. for special retention incentives or to compensate for assignments of expatriates in certain countries. In most cases, the Restricted Stock Units vest after three or five years without a performance test and in the event of termination
of service before the vesting date, specific forfeiture rules apply. The Board may set different vesting periods for specific sub-plans or introduce performance tests in line with the company’s high-performance culture and the creation of
long-term sustainable value for its shareholders. Any grant under long-term Restricted Stock Unit programs to members of the ExCom and SLT is subject to Board approval, upon recommendation of the Remuneration Committee. 2. A program allowing certain
employees to purchase company shares at a discount aimed as a long-term retention incentive for (i) high-potential employees of the company, who are at a mid-manager level (People bet share purchase program) or (ii) newly hired employees. The
voluntary investment in company shares leads to the grant of up to three Matching Shares for each share invested or, as the case may be, a number of Matching Shares corresponding to a fixed monetary value that depends on seniority level. The
Matching Shares are granted in the form of Restricted Stock Units which vest after five years. In the event of termination before the vesting date, specific forfeiture rules apply. Since 2016, instead of Restricted Stock Units, stock options may
also be granted under this program with similar vesting and forfeiture rules. Exchange of share ownership program From time to time, certain members of Ambev’s senior management are transferred to AB InBev and vice versa. In order to encourage
management mobility and promote alignment between AB InBev’s interests and the interests of these managers, the Board has approved a program that aims at facilitating the exchange by these managers of their Ambev shares into AB InBev shares.
Under the program, the Ambev shares can be exchanged for AB InBev shares based on the average share price of both the Ambev and the AB InBev shares on the date the exchange is requested. A discount of 16.66% is granted in exchange for a five-year
lock-up period for the shares, provided the manager remains in service during this period. The discounted shares are forfeited in the event of termination of service before the end of the five-year lock-up period. Programs for maintaining
consistency of benefits granted and for encouraging global mobility of executives Two programs which are aimed at maintaining consistency of benefits granted to executives and encouraging the international mobility of executives while complying with
all legal and tax obligations are in place: 1. The Exchange program: under this program, the vesting and transferability restrictions of the Series A options granted under the November 2008 Exceptional Option Grant and of the options granted under
the April 2009 Exceptional Option Grant could be released, e.g. for executives who moved to the United States. These executives were then offered the possibility to exchange their options for ordinary AB InBev shares that remained locked up until 31
December 2018 (five years longer than the original lock-up period). Since the Series A options granted under the November 2008 Exceptional Option Grant and the options granted under the April 2009 Exceptional Option Grant vested on 1 January 2014,
the Exchange program is no longer relevant for these options. Instead, the Exchange program became applicable to the Series B options granted under the November 2008 Exceptional Option Grant. Under the extended program, executives who were
relocated, e.g. to the United States, could be offered the possibility to exchange their Series B options for ordinary Anheuser-Busch shares that, in principle, remained locked up until 31 December 2023 (five years longer than the original lock-up
period). As a variant to this program, the Board also approved the recommendation of the Remuneration Committee to allow the early release of the vesting conditions of the Series B options granted under the November 2008 Exceptional Option Grant for
executives who were relocated, e.g. to the United States. The shares that resulted from the exercise of the options, in principle, remained blocked until 31 December 2023. AB InBev – Annual Report 2023 220
2. The Dividend waiver program: where applicable, the dividend
protection feature of the outstanding options owned by executives who move to the United States is being cancelled. In order to compensate for the economic loss which results from this cancellation, a number of new options is granted to these
executives with a value equal to this economic loss. The new options have a strike price equal to the share price on the day preceding the grant date of the options. All other terms and conditions, in particular with respect to vesting, exercise
limitations and forfeiture rules of the new options are identical to the outstanding options for which the dividend protection feature is cancelled. As a consequence, the grant of these new options does not result in the grant of any additional
economic benefit to the executives concerned. There is also a possible early release of vesting conditions of unvested stock options or Restricted Stock Units which are vesting within six months of the executives’ relocation. The shares that
result from the early exercise of the options or the early vesting of the Restricted Stock Units must remain blocked until the end of the initial vesting period. d. Pension schemes Our executives participate in Anheuser-Busch InBev’s pension
schemes in either the United States, Belgium or their home country. These schemes are in line with predominant market practices in the respective countries. They may be defined benefit plans or defined contribution plans. e. Other benefits The
company is prohibited from making loans to members of the ExCom or SLT, whether for the purpose of exercising options or for any other purpose (except for routine advances for business-related expenses in accordance with the company’s rules
for reimbursement of expenses). Executives and their family are eligible to participate in the Employer’s Executive benefit plans (including medical and hospitalization, death and disability plans) in effect from time to time, in line with the
predominant market practices. B. Minimum threshold of shares to be held by members of the ExCom The Board has set a minimum threshold of shares of the company to be held at any time by the CEO to two years of base salary (gross) and by the other
members of the ExCom to one year of base salary (gross). Newly appointed ExCom members have three years to reach such threshold following the date of their appointment. C. Main contractual terms and conditions of employment of members of the ExCom
The terms and conditions of employment of the members of the ExCom are included in individual employment agreements which are concluded for an indefinite period of time. Executives are also required to comply with the company’s policies and
codes such as the Code of Business Conduct and Code of Dealing and are subject to exclusivity, confidentiality and non- compete obligations under their employment agreements. The agreement typically provides that the executive’s eligibility
for payment of variable compensation is determined exclusively on the basis of the achievement of company and individual targets set by the company. The specific conditions and modalities of the variable compensation are fixed separately by the
company and approved by the Remuneration Committee. The termination arrangements for the ExCom members provide for a termination indemnity of 12 months of remuneration, including variable compensation, in the event of termination without cause. The
variable compensation for purposes of the termination indemnity shall be calculated as the average of the variable compensation paid to the executive for the last two years of employment prior to the year of termination. In addition, if the company
decides to impose upon the executive a non-compete restriction of 12 months, the executive shall be entitled to receive an additional indemnity of six months, subject to applicable laws and regulations. AB InBev – Annual Report 2023
221
D. Reclaim of variable remuneration The company’s share-based
compensation and long-term incentive plans contain a malus provision for all grants made since March 2019. Such provision provides that the Restricted Stock Units and/or stock options granted to an executive will automatically expire and become null
and void in the scenario where the executive is found by the Global Ethics and Compliance Committee to be (i) responsible for a material breach of the company’s Code of Business Conduct; or (ii) subject to a material adverse court or
administrative decision, in each case in the period before the vesting of the Restricted Stock Units or exercise of the stock options. In addition, on 11 October 2023, the company adopted a clawback policy that applies to incentive-based
compensation received by certain executives (which currently comprise the members of the ExCom). Under this policy, “incentive-based compensation” is defined broadly to include any compensation that is granted, earned, or vested based
wholly or in part upon the attainment of a financial reporting measure (e.g. variable performance-related compensation (bonus) and annual long-term incentive performance stock units (PSUs)). The policy provides that in the event the company is
required to prepare an accounting restatement of its financial statements due to the company’s material noncompliance with any financial reporting requirements under the applicable securities laws, the company will recover (on a pre-tax basis)
from the relevant executives any incentive-based compensation received by such executives on or after 2 October 2023 and during the three fiscal years preceding the date the restatement was required that exceeds the amount of incentive-based
compensation that otherwise would have been received had such incentive-based compensation been determined according to the applicable accounting restatement, subject to limited exceptions. The recovery of such compensation applies regardless of
whether any misconduct occurred and without regard to whether an executive engaged in misconduct or otherwise caused or contributed to the requirement for a restatement. 8.2. Remuneration report This remuneration report must be read together with
the remuneration policy which, to the extent necessary, should be regarded as forming part of this remuneration report. The remuneration granted to directors and members of the ExCom with respect to financial year 2023 is in line with the
remuneration policy. It is designed to support the company’s high- performance culture and the creation of long-term sustainable value for its shareholders and promotes alignment with shareholders’ interests by strongly encouraging
executive ownership of shares in the company. The remuneration report will be submitted to the approval of the annual shareholders’ meeting of 24 April 2024. 8.2.1. REMUNERATION REPORT RELATING TO DIRECTORS A. General overview a. Cash
remuneration The fixed annual fee of the directors amounts to EUR 75,000, except for the chairperson of the Board and the chairperson of the Audit Committee whose annual fixed fees amount respectively to EUR 255,000 and EUR 127,500. In addition, a
fixed annual retainer applies as follows: (a) EUR 28,000 for the chairperson of the Audit Committee, (b) EUR 14,000 for the other members of the Audit Committee, (c) EUR 14,000 for each of the chairpersons of the Finance Committee, the Remuneration
Committee and the Nomination Committee, and (d) EUR 7,000 for each of the other members of the Finance Committee, the Remuneration Committee and the Nomination Committee, it being understood that the amounts of the retainers set out above are
cumulative in the case of participation of a director in several committees. b. Share-based remuneration The share-based portion of the remuneration of the directors of the company is granted in the form of Restricted Stock Units corresponding to a
fixed gross value per year of (i) EUR 550,000 for the chairperson of the Board, (ii) EUR 350,000 for the chairperson of the Audit Committee and (iii) EUR 200,000 for the other directors. Such Restricted Stock Units vest after five years. Each
director is entitled to receive a number of Restricted Stock Units corresponding to the above amount to which such director is entitled divided by the closing price of the shares of the company on Euronext Brussels on the day preceding the annual
shareholders’ meeting approving the accounts of the financial year to which the remuneration in Restricted Stock Units relates. Upon vesting, each vested Restricted Stock Unit entitles its holder to one AB InBev share (subject to any
applicable withholdings). AB InBev – Annual Report 2023 222
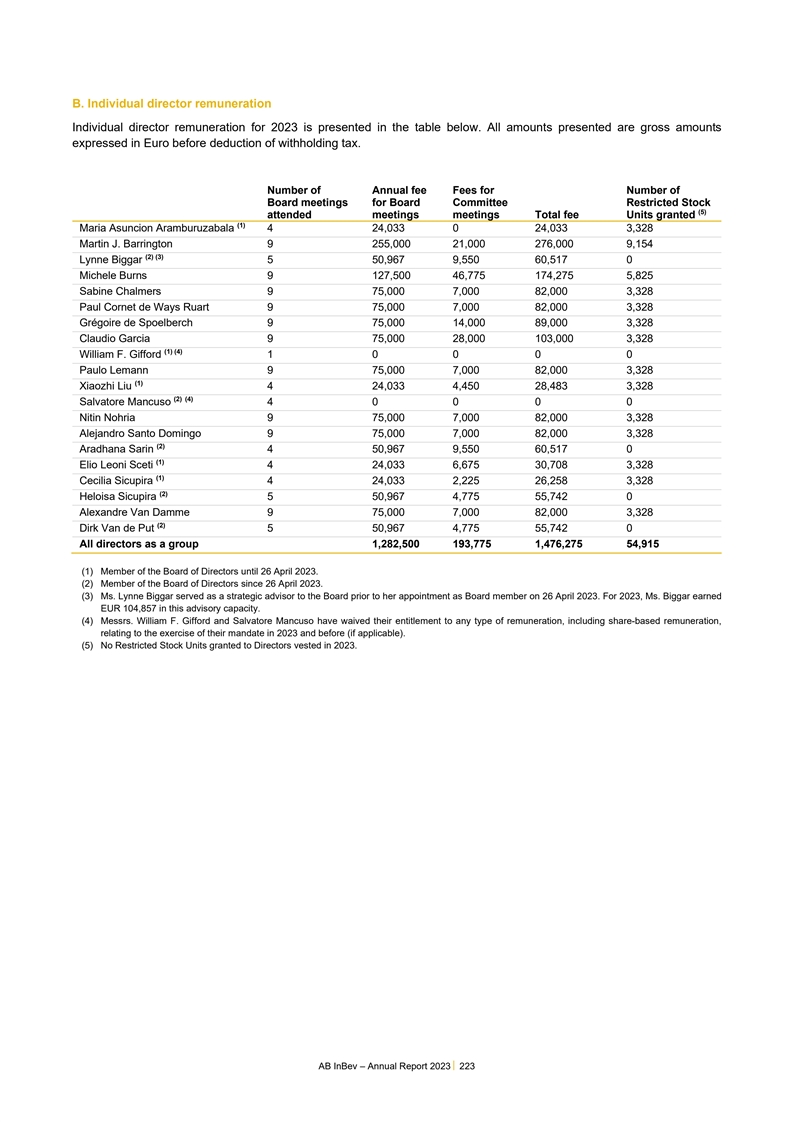
B. Individual director remuneration Individual director remuneration
for 2023 is presented in the table below. All amounts presented are gross amounts expressed in Euro before deduction of withholding tax. Number of Annual fee Fees for Number of Board meetings for Board Committee Restricted Stock (5) attended
meetings meetings Total fee Units granted (1) Maria Asuncion Aramburuzabala 4 24,033 0 24,033 3,328 Martin J. Barrington 9 255,000 21,000 276,000 9,154 (2) (3) Lynne Biggar 5 50,967 9,550 60,517 0 Michele Burns 9 127,500 46,775 174,275 5,825 Sabine
Chalmers 9 75,000 7,000 82,000 3,328 Paul Cornet de Ways Ruart 9 75,000 7,000 82,000 3,328 Grégoire de Spoelberch 9 75,000 14,000 89,000 3,328 Claudio Garcia 9 75,000 28,000 103,000 3,328 (1) (4) William F. Gifford 1 0 0 0 0 Paulo Lemann 9
75,000 7,000 82,000 3,328 (1) Xiaozhi Liu 4 24,033 4,450 28,483 3,328 (2) (4) Salvatore Mancuso 4 0 0 0 0 Nitin Nohria 9 75,000 7,000 82,000 3,328 Alejandro Santo Domingo 9 75,000 7,000 82,000 3,328 (2) Aradhana Sarin 4 50,967 9,550 60,517 0 (1)
Elio Leoni Sceti 4 24,033 6,675 30,708 3,328 (1) Cecilia Sicupira 4 24,033 2,225 26,258 3,328 (2) Heloisa Sicupira 5 50,967 4,775 55,742 0 Alexandre Van Damme 9 75,000 7,000 82,000 3,328 (2) Dirk Van de Put 5 50,967 4,775 55,742 0 All directors as a
group 1,282,500 193,775 1,476,275 54,915 (1) Member of the Board of Directors until 26 April 2023. (2) Member of the Board of Directors since 26 April 2023. (3) Ms. Lynne Biggar served as a strategic advisor to the Board prior to her appointment as
Board member on 26 April 2023. For 2023, Ms. Biggar earned EUR 104,857 in this advisory capacity. (4) Messrs. William F. Gifford and Salvatore Mancuso have waived their entitlement to any type of remuneration, including share-based remuneration,
relating to the exercise of their mandate in 2023 and before (if applicable). (5) No Restricted Stock Units granted to Directors vested in 2023. AB InBev – Annual Report 2023 223
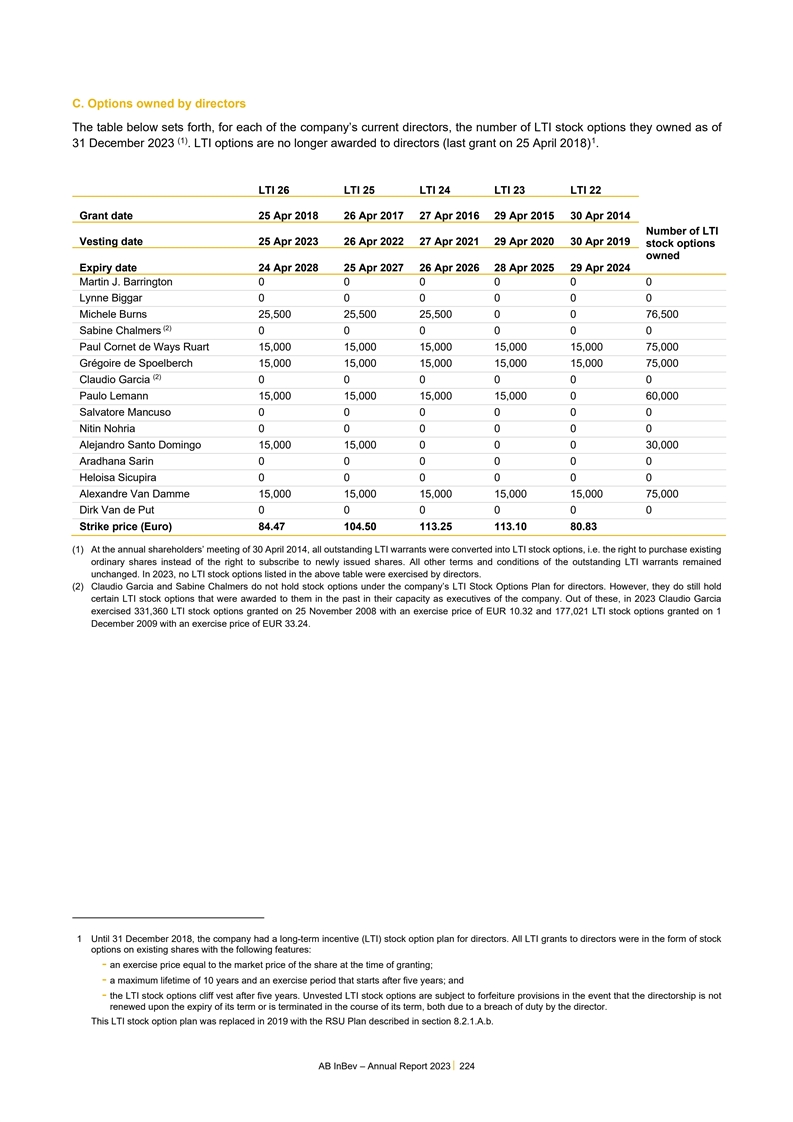
C. Options owned by directors The table below sets forth, for each of
the company’s current directors, the number of LTI stock options they owned as of (1) 1 31 December 2023 . LTI options are no longer awarded to directors (last grant on 25 April 2018) . LTI 26 LTI 25 LTI 24 LTI 23 LTI 22 Grant date 25 Apr 2018
26 Apr 2017 27 Apr 2016 29 Apr 2015 30 Apr 2014 Number of LTI Vesting date 25 Apr 2023 26 Apr 2022 27 Apr 2021 29 Apr 2020 30 Apr 2019 stock options owned Expiry date 24 Apr 2028 25 Apr 2027 26 Apr 2026 28 Apr 2025 29 Apr 2024 Martin J. Barrington 0
0 0 0 0 0 Lynne Biggar 0 0 0 0 0 0 Michele Burns 25,500 25,500 25,500 0 0 76,500 (2) Sabine Chalmers 0 0 0 0 0 0 Paul Cornet de Ways Ruart 15,000 15,000 15,000 15,000 15,000 75,000 Grégoire de Spoelberch 15,000 15,000 15,000 15,000 15,000
75,000 (2) Claudio Garcia 0 0 0 0 0 0 Paulo Lemann 15,000 15,000 15,000 15,000 0 60,000 Salvatore Mancuso 0 0 0 0 0 0 Nitin Nohria 0 0 0 0 0 0 Alejandro Santo Domingo 15,000 15,000 0 0 0 30,000 Aradhana Sarin 0 0 0 0 0 0 Heloisa Sicupira 0 0 0 0 0 0
Alexandre Van Damme 15,000 15,000 15,000 15,000 15,000 75,000 Dirk Van de Put 0 0 0 0 0 0 Strike price (Euro) 84.47 104.50 113.25 113.10 80.83 (1) At the annual shareholders’ meeting of 30 April 2014, all outstanding LTI warrants were
converted into LTI stock options, i.e. the right to purchase existing ordinary shares instead of the right to subscribe to newly issued shares. All other terms and conditions of the outstanding LTI warrants remained unchanged. In 2023, no LTI stock
options listed in the above table were exercised by directors. (2) Claudio Garcia and Sabine Chalmers do not hold stock options under the company’s LTI Stock Options Plan for directors. However, they do still hold certain LTI stock options
that were awarded to them in the past in their capacity as executives of the company. Out of these, in 2023 Claudio Garcia exercised 331,360 LTI stock options granted on 25 November 2008 with an exercise price of EUR 10.32 and 177,021 LTI stock
options granted on 1 December 2009 with an exercise price of EUR 33.24. 1 Until 31 December 2018, the company had a long-term incentive (LTI) stock option plan for directors. All LTI grants to directors were in the form of stock options on existing
shares with the following features: - an exercise price equal to the market price of the share at the time of granting; - a maximum lifetime of 10 years and an exercise period that starts after five years; and - the LTI stock options cliff vest
after five years. Unvested LTI stock options are subject to forfeiture provisions in the event that the directorship is not renewed upon the expiry of its term or is terminated in the course of its term, both due to a breach of duty by the director.
This LTI stock option plan was replaced in 2019 with the RSU Plan described in section 8.2.1.A.b. AB InBev – Annual Report 2023 224
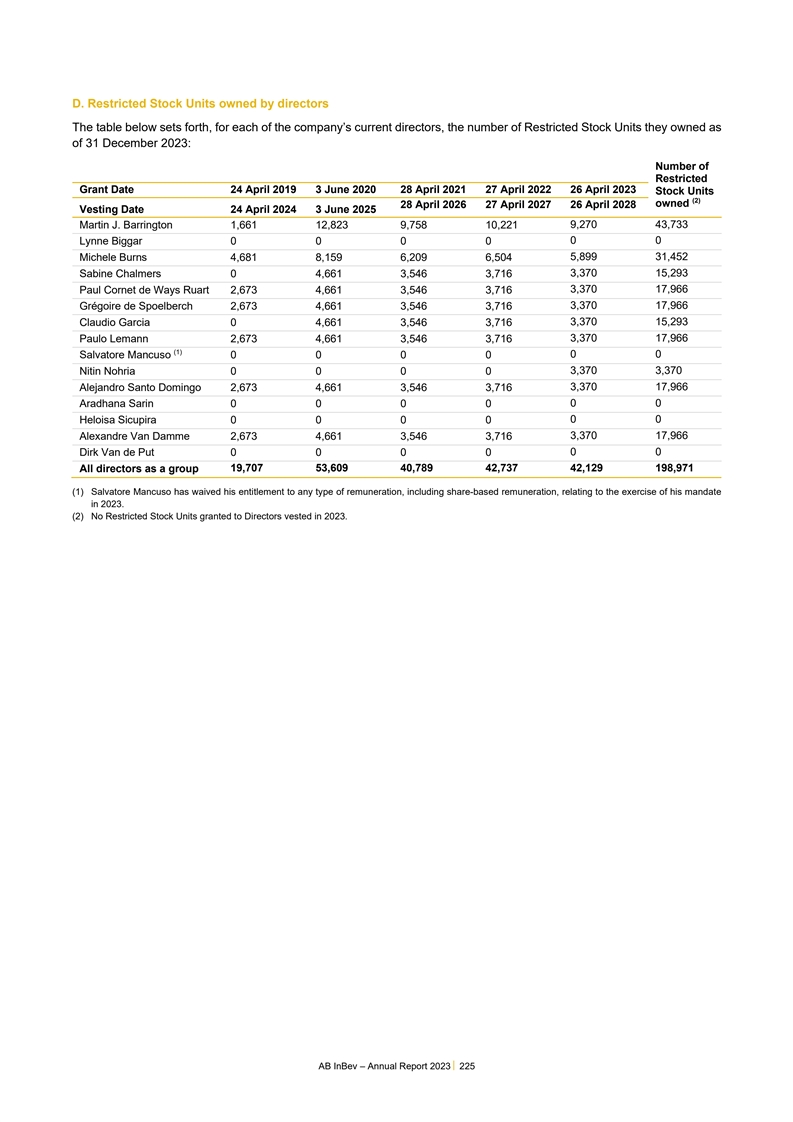
D. Restricted Stock Units owned by directors The table below sets
forth, for each of the company’s current directors, the number of Restricted Stock Units they owned as of 31 December 2023: Number of Restricted Grant Date 24 April 2019 3 June 2020 28 April 2021 27 April 2022 26 April 2023 Stock Units (2)
owned 28 April 2026 27 April 2027 26 April 2028 Vesting Date 24 April 2024 3 June 2025 9,270 43,733 Martin J. Barrington 1,661 12,823 9,758 10,221 0 0 Lynne Biggar 0 0 0 0 5,899 31,452 Michele Burns 4,681 8,159 6,209 6,504 Sabine Chalmers 0 4,661
3,546 3,716 3,370 15,293 Paul Cornet de Ways Ruart 2,673 4,661 3,546 3,716 3,370 17,966 3,370 17,966 Grégoire de Spoelberch 2,673 4,661 3,546 3,716 3,370 15,293 Claudio Garcia 0 4,661 3,546 3,716 3,370 17,966 Paulo Lemann 2,673 4,661 3,546
3,716 (1) Salvatore Mancuso 0 0 0 0 0 0 Nitin Nohria 0 0 0 0 3,370 3,370 3,370 17,966 Alejandro Santo Domingo 2,673 4,661 3,546 3,716 0 0 Aradhana Sarin 0 0 0 0 0 0 Heloisa Sicupira 0 0 0 0 Alexandre Van Damme 2,673 4,661 3,546 3,716 3,370 17,966
Dirk Van de Put 0 0 0 0 0 0 19,707 53,609 40,789 42,737 42,129 198,971 All directors as a group (1) Salvatore Mancuso has waived his entitlement to any type of remuneration, including share-based remuneration, relating to the exercise of his mandate
in 2023. (2) No Restricted Stock Units granted to Directors vested in 2023. AB InBev – Annual Report 2023 225
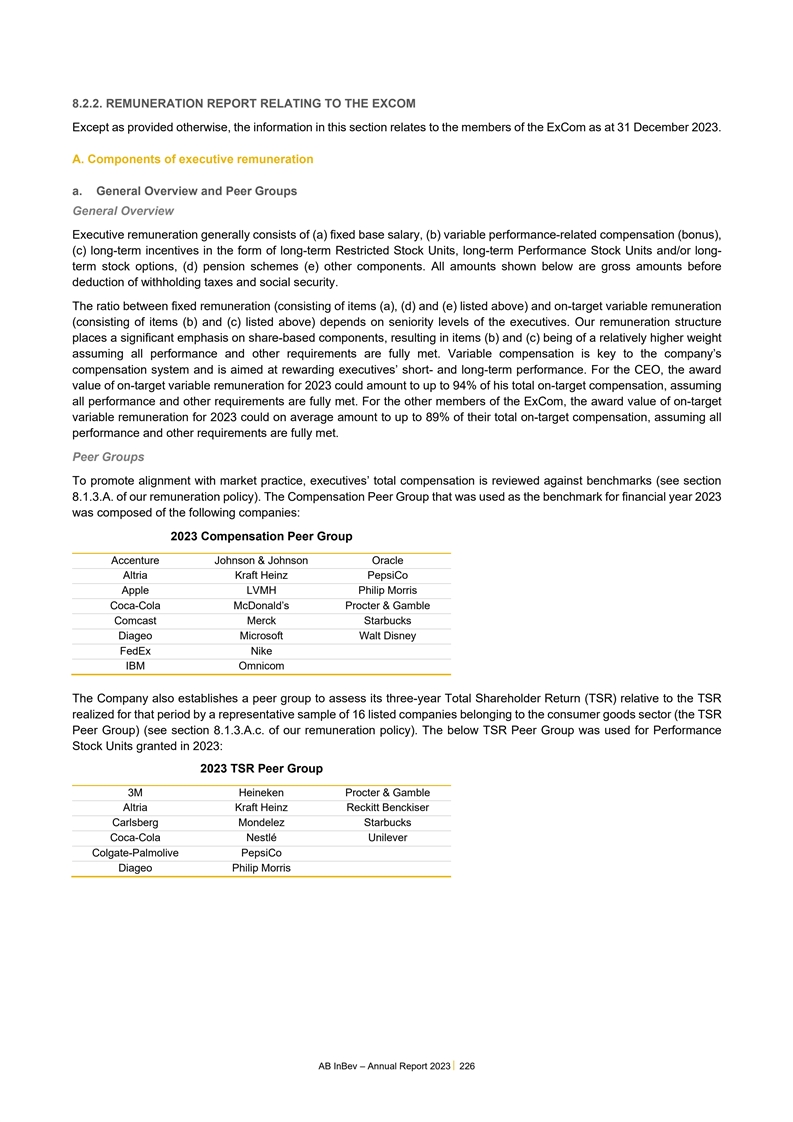
8.2.2. REMUNERATION REPORT RELATING TO THE EXCOM Except as provided
otherwise, the information in this section relates to the members of the ExCom as at 31 December 2023. A. Components of executive remuneration a. General Overview and Peer Groups General Overview Executive remuneration generally consists of (a)
fixed base salary, (b) variable performance-related compensation (bonus), (c) long-term incentives in the form of long-term Restricted Stock Units, long-term Performance Stock Units and/or long- term stock options, (d) pension schemes (e) other
components. All amounts shown below are gross amounts before deduction of withholding taxes and social security. The ratio between fixed remuneration (consisting of items (a), (d) and (e) listed above) and on-target variable remuneration (consisting
of items (b) and (c) listed above) depends on seniority levels of the executives. Our remuneration structure places a significant emphasis on share-based components, resulting in items (b) and (c) being of a relatively higher weight assuming all
performance and other requirements are fully met. Variable compensation is key to the company’s compensation system and is aimed at rewarding executives’ short- and long-term performance. For the CEO, the award value of on-target
variable remuneration for 2023 could amount to up to 94% of his total on-target compensation, assuming all performance and other requirements are fully met. For the other members of the ExCom, the award value of on-target variable remuneration for
2023 could on average amount to up to 89% of their total on-target compensation, assuming all performance and other requirements are fully met. Peer Groups To promote alignment with market practice, executives’ total compensation is reviewed
against benchmarks (see section 8.1.3.A. of our remuneration policy). The Compensation Peer Group that was used as the benchmark for financial year 2023 was composed of the following companies: 2023 Compensation Peer Group Accenture Johnson &
Johnson Oracle Altria Kraft Heinz PepsiCo Apple LVMH Philip Morris Coca-Cola McDonald’s Procter & Gamble Comcast Merck Starbucks Diageo Microsoft Walt Disney FedEx Nike IBM Omnicom The Company also establishes a peer group to assess its
three-year Total Shareholder Return (TSR) relative to the TSR realized for that period by a representative sample of 16 listed companies belonging to the consumer goods sector (the TSR Peer Group) (see section 8.1.3.A.c. of our remuneration policy).
The below TSR Peer Group was used for Performance Stock Units granted in 2023: 2023 TSR Peer Group 3M Heineken Procter & Gamble Altria Kraft Heinz Reckitt Benckiser Carlsberg Mondelez Starbucks Coca-Cola Nestlé Unilever Colgate-Palmolive
PepsiCo Diageo Philip Morris AB InBev – Annual Report 2023 226
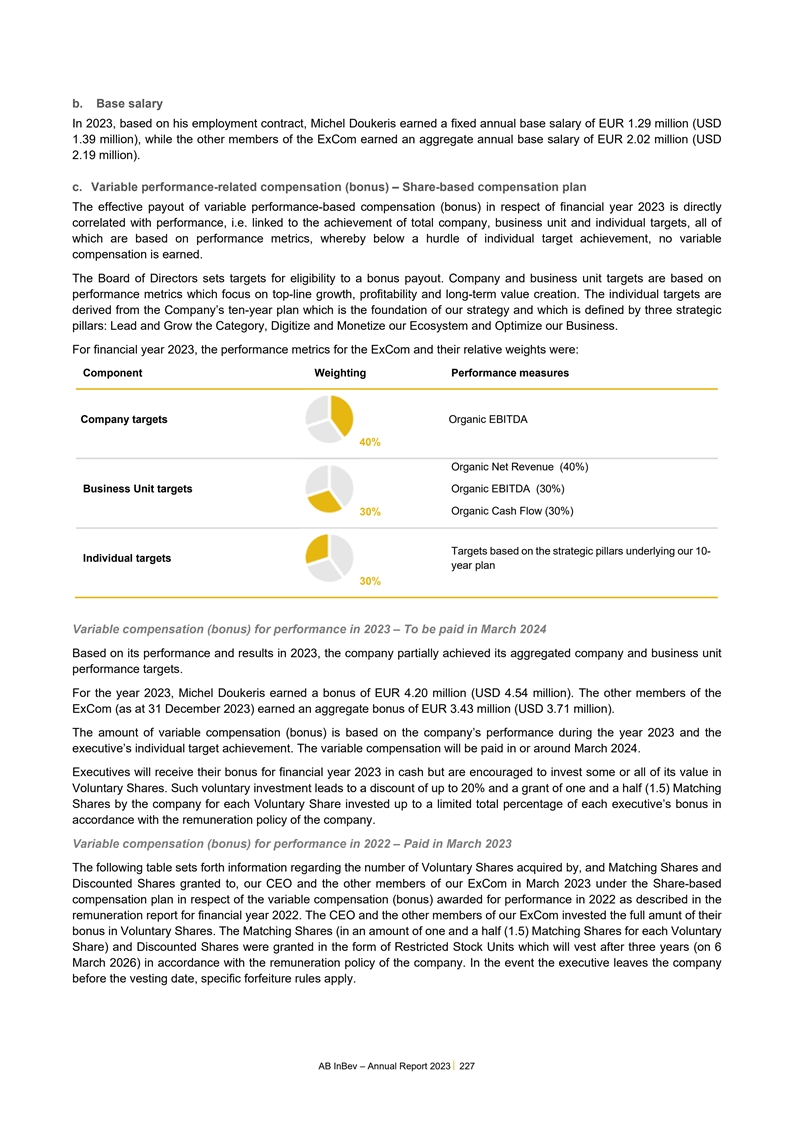
b. Base salary In 2023, based on his employment contract, Michel
Doukeris earned a fixed annual base salary of EUR 1.29 million (USD 1.39 million), while the other members of the ExCom earned an aggregate annual base salary of EUR 2.02 million (USD 2.19 million). c. Variable performance-related compensation
(bonus) – Share-based compensation plan The effective payout of variable performance-based compensation (bonus) in respect of financial year 2023 is directly correlated with performance, i.e. linked to the achievement of total company,
business unit and individual targets, all of which are based on performance metrics, whereby below a hurdle of individual target achievement, no variable compensation is earned. The Board of Directors sets targets for eligibility to a bonus payout.
Company and business unit targets are based on performance metrics which focus on top-line growth, profitability and long-term value creation. The individual targets are derived from the Company’s ten-year plan which is the foundation of our
strategy and which is defined by three strategic pillars: Lead and Grow the Category, Digitize and Monetize our Ecosystem and Optimize our Business. For financial year 2023, the performance metrics for the ExCom and their relative weights were:
Component Weighting Performance measures Company targets Organic EBITDA 40% Organic Net Revenue (40%) Business Unit targets Organic EBITDA (30%) Organic Cash Flow (30%) 30% Targets based on the strategic pillars underlying our 10- Individual targets
year plan 30% Variable compensation (bonus) for performance in 2023 – To be paid in March 2024 Based on its performance and results in 2023, the company partially achieved its aggregated company and business unit performance targets. For the
year 2023, Michel Doukeris earned a bonus of EUR 4.20 million (USD 4.54 million). The other members of the ExCom (as at 31 December 2023) earned an aggregate bonus of EUR 3.43 million (USD 3.71 million). The amount of variable compensation (bonus)
is based on the company’s performance during the year 2023 and the executive’s individual target achievement. The variable compensation will be paid in or around March 2024. Executives will receive their bonus for financial year 2023 in
cash but are encouraged to invest some or all of its value in Voluntary Shares. Such voluntary investment leads to a discount of up to 20% and a grant of one and a half (1.5) Matching Shares by the company for each Voluntary Share invested up to a
limited total percentage of each executive’s bonus in accordance with the remuneration policy of the company. Variable compensation (bonus) for performance in 2022 – Paid in March 2023 The following table sets forth information regarding
the number of Voluntary Shares acquired by, and Matching Shares and Discounted Shares granted to, our CEO and the other members of our ExCom in March 2023 under the Share-based compensation plan in respect of the variable compensation (bonus)
awarded for performance in 2022 as described in the remuneration report for financial year 2022. The CEO and the other members of our ExCom invested the full amunt of their bonus in Voluntary Shares. The Matching Shares (in an amount of one and a
half (1.5) Matching Shares for each Voluntary Share) and Discounted Shares were granted in the form of Restricted Stock Units which will vest after three years (on 6 March 2026) in accordance with the remuneration policy of the company. In the event
the executive leaves the company before the vesting date, specific forfeiture rules apply. AB InBev – Annual Report 2023 227
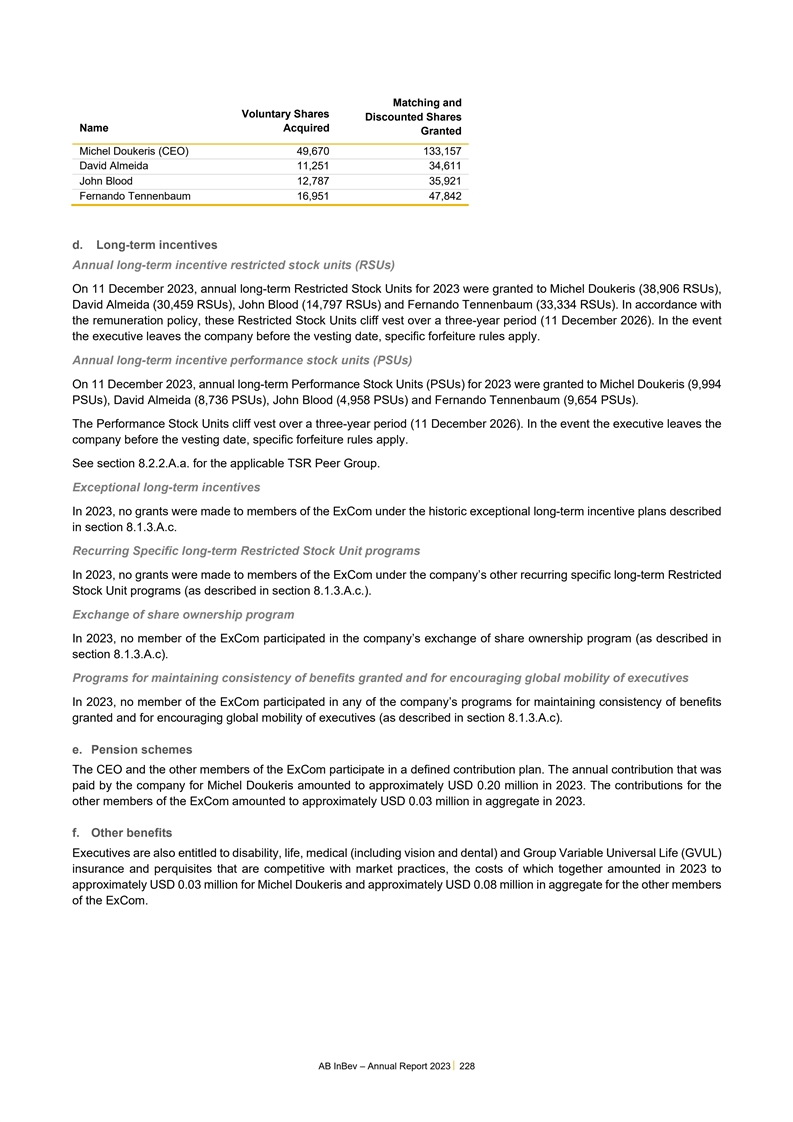
Matching and Voluntary Shares Discounted Shares Name Acquired Granted
Michel Doukeris (CEO) 49,670 133,157 David Almeida 11,251 34,611 John Blood 12,787 35,921 Fernando Tennenbaum 16,951 47,842 d. Long-term incentives Annual long-term incentive restricted stock units (RSUs) On 11 December 2023, annual long-term
Restricted Stock Units for 2023 were granted to Michel Doukeris (38,906 RSUs), David Almeida (30,459 RSUs), John Blood (14,797 RSUs) and Fernando Tennenbaum (33,334 RSUs). In accordance with the remuneration policy, these Restricted Stock Units
cliff vest over a three-year period (11 December 2026). In the event the executive leaves the company before the vesting date, specific forfeiture rules apply. Annual long-term incentive performance stock units (PSUs) On 11 December 2023, annual
long-term Performance Stock Units (PSUs) for 2023 were granted to Michel Doukeris (9,994 PSUs), David Almeida (8,736 PSUs), John Blood (4,958 PSUs) and Fernando Tennenbaum (9,654 PSUs). The Performance Stock Units cliff vest over a three-year period
(11 December 2026). In the event the executive leaves the company before the vesting date, specific forfeiture rules apply. See section 8.2.2.A.a. for the applicable TSR Peer Group. Exceptional long-term incentives In 2023, no grants were made to
members of the ExCom under the historic exceptional long-term incentive plans described in section 8.1.3.A.c. Recurring Specific long-term Restricted Stock Unit programs In 2023, no grants were made to members of the ExCom under the company’s
other recurring specific long-term Restricted Stock Unit programs (as described in section 8.1.3.A.c.). Exchange of share ownership program In 2023, no member of the ExCom participated in the company’s exchange of share ownership program (as
described in section 8.1.3.A.c). Programs for maintaining consistency of benefits granted and for encouraging global mobility of executives In 2023, no member of the ExCom participated in any of the company’s programs for maintaining
consistency of benefits granted and for encouraging global mobility of executives (as described in section 8.1.3.A.c). e. Pension schemes The CEO and the other members of the ExCom participate in a defined contribution plan. The annual contribution
that was paid by the company for Michel Doukeris amounted to approximately USD 0.20 million in 2023. The contributions for the other members of the ExCom amounted to approximately USD 0.03 million in aggregate in 2023. f. Other benefits Executives
are also entitled to disability, life, medical (including vision and dental) and Group Variable Universal Life (GVUL) insurance and perquisites that are competitive with market practices, the costs of which together amounted in 2023 to approximately
USD 0.03 million for Michel Doukeris and approximately USD 0.08 million in aggregate for the other members of the ExCom. AB InBev – Annual Report 2023 228
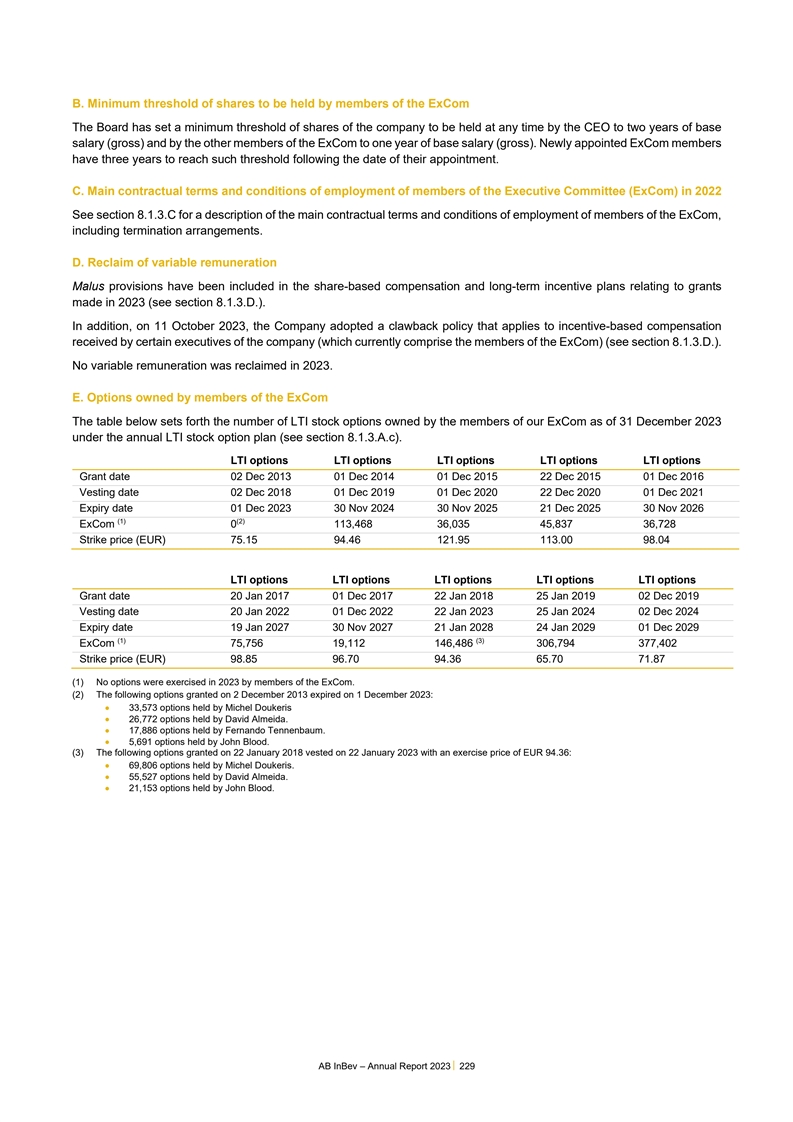
B. Minimum threshold of shares to be held by members of the ExCom The
Board has set a minimum threshold of shares of the company to be held at any time by the CEO to two years of base salary (gross) and by the other members of the ExCom to one year of base salary (gross). Newly appointed ExCom members have three years
to reach such threshold following the date of their appointment. C. Main contractual terms and conditions of employment of members of the Executive Committee (ExCom) in 2022 See section 8.1.3.C for a description of the main contractual terms and
conditions of employment of members of the ExCom, including termination arrangements. D. Reclaim of variable remuneration Malus provisions have been included in the share-based compensation and long-term incentive plans relating to grants made in
2023 (see section 8.1.3.D.). In addition, on 11 October 2023, the Company adopted a clawback policy that applies to incentive-based compensation received by certain executives of the company (which currently comprise the members of the ExCom) (see
section 8.1.3.D.). No variable remuneration was reclaimed in 2023. E. Options owned by members of the ExCom The table below sets forth the number of LTI stock options owned by the members of our ExCom as of 31 December 2023 under the annual LTI
stock option plan (see section 8.1.3.A.c). LTI options LTI options LTI options LTI options LTI options Grant date 02 Dec 2013 01 Dec 2014 01 Dec 2015 22 Dec 2015 01 Dec 2016 Vesting date 02 Dec 2018 01 Dec 2019 01 Dec 2020 22 Dec 2020 01 Dec 2021
Expiry date 01 Dec 2023 30 Nov 2024 30 Nov 2025 21 Dec 2025 30 Nov 2026 (1) (2) ExCom 0 113,468 36,035 45,837 36,728 Strike price (EUR) 75.15 94.46 121.95 113.00 98.04 LTI options LTI options LTI options LTI options LTI options Grant date 20 Jan
2017 01 Dec 2017 22 Jan 2018 25 Jan 2019 02 Dec 2019 Vesting date 20 Jan 2022 01 Dec 2022 22 Jan 2023 25 Jan 2024 02 Dec 2024 Expiry date 19 Jan 2027 30 Nov 2027 21 Jan 2028 24 Jan 2029 01 Dec 2029 (1) (3) ExCom 75,756 19,112 146,486 306,794 377,402
Strike price (EUR) 98.85 96.70 94.36 65.70 71.87 (1) No options were exercised in 2023 by members of the ExCom. (2) The following options granted on 2 December 2013 expired on 1 December 2023: • 33,573 options held by Michel Doukeris •
26,772 options held by David Almeida. • 17,886 options held by Fernando Tennenbaum. • 5,691 options held by John Blood. (3) The following options granted on 22 January 2018 vested on 22 January 2023 with an exercise price of EUR 94.36:
• 69,806 options held by Michel Doukeris. • 55,527 options held by David Almeida. • 21,153 options held by John Blood. AB InBev – Annual Report 2023 229
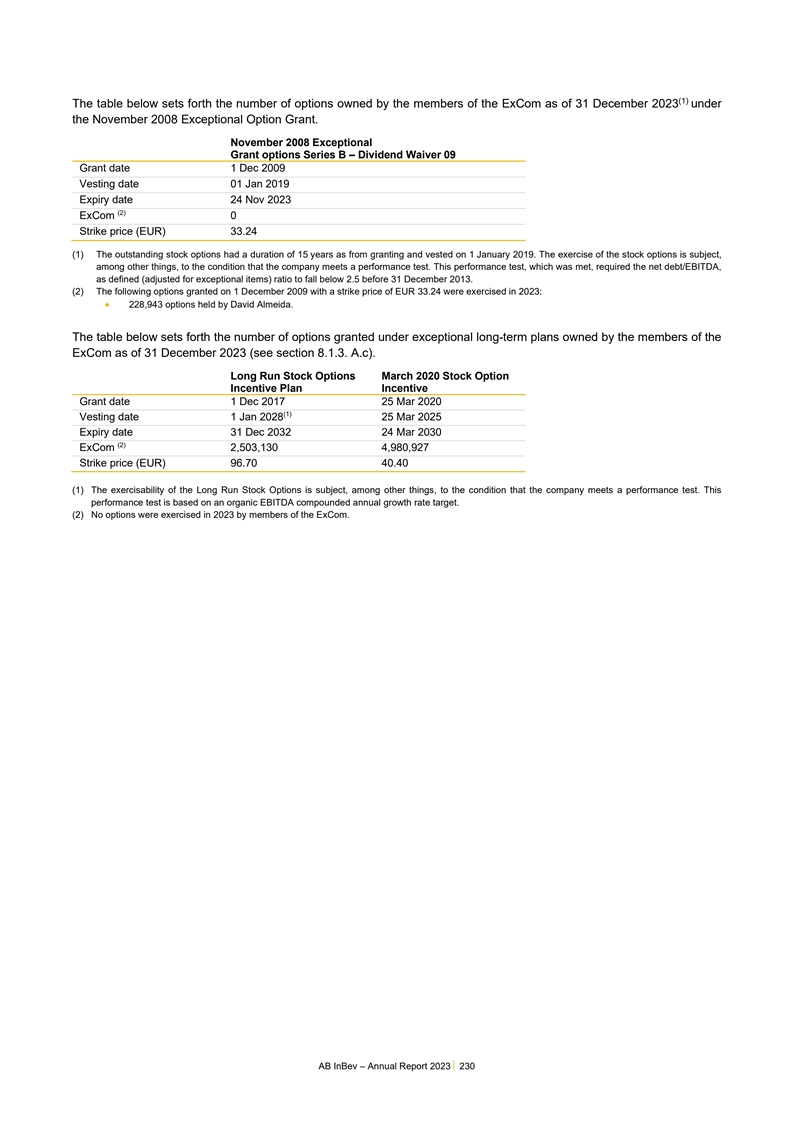
(1) The table below sets forth the number of options owned by the
members of the ExCom as of 31 December 2023 under the November 2008 Exceptional Option Grant. November 2008 Exceptional Grant options Series B – Dividend Waiver 09 Grant date 1 Dec 2009 Vesting date 01 Jan 2019 Expiry date 24 Nov 2023 (2)
ExCom 0 Strike price (EUR) 33.24 (1) The outstanding stock options had a duration of 15 years as from granting and vested on 1 January 2019. The exercise of the stock options is subject, among other things, to the condition that the company meets a
performance test. This performance test, which was met, required the net debt/EBITDA, as defined (adjusted for exceptional items) ratio to fall below 2.5 before 31 December 2013. (2) The following options granted on 1 December 2009 with a strike
price of EUR 33.24 were exercised in 2023: • 228,943 options held by David Almeida. The table below sets forth the number of options granted under exceptional long-term plans owned by the members of the ExCom as of 31 December 2023 (see
section 8.1.3. A.c). Long Run Stock Options March 2020 Stock Option Incentive Plan Incentive Grant date 1 Dec 2017 25 Mar 2020 (1) Vesting date 1 Jan 2028 25 Mar 2025 Expiry date 31 Dec 2032 24 Mar 2030 (2) ExCom 2,503,130 4,980,927 Strike price
(EUR) 96.70 40.40 (1) The exercisability of the Long Run Stock Options is subject, among other things, to the condition that the company meets a performance test. This performance test is based on an organic EBITDA compounded annual growth rate
target. (2) No options were exercised in 2023 by members of the ExCom. AB InBev – Annual Report 2023 230
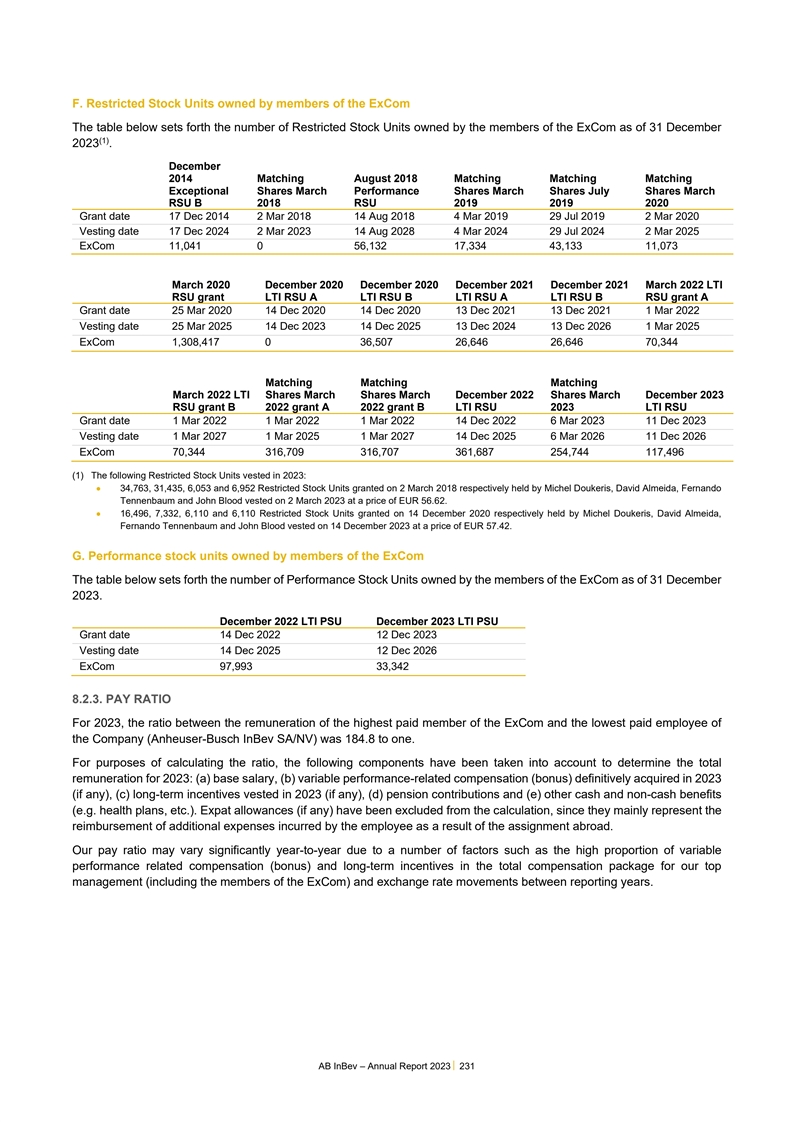
F. Restricted Stock Units owned by members of the ExCom The table
below sets forth the number of Restricted Stock Units owned by the members of the ExCom as of 31 December (1) 2023 . December 2014 Matching August 2018 Matching Matching Matching Exceptional Shares March Performance Shares March Shares July Shares
March RSU B 2018 RSU 2019 2019 2020 Grant date 17 Dec 2014 2 Mar 2018 14 Aug 2018 4 Mar 2019 29 Jul 2019 2 Mar 2020 Vesting date 17 Dec 2024 2 Mar 2023 14 Aug 2028 4 Mar 2024 29 Jul 2024 2 Mar 2025 ExCom 11,041 0 56,132 17,334 43,133 11,073 March
2020 December 2020 December 2020 December 2021 December 2021 March 2022 LTI RSU grant LTI RSU A LTI RSU B LTI RSU A LTI RSU B RSU grant A Grant date 25 Mar 2020 14 Dec 2020 14 Dec 2020 13 Dec 2021 13 Dec 2021 1 Mar 2022 Vesting date 25 Mar 2025 14
Dec 2023 14 Dec 2025 13 Dec 2024 13 Dec 2026 1 Mar 2025 ExCom 1,308,417 0 36,507 26,646 26,646 70,344 Matching Matching Matching March 2022 LTI Shares March Shares March December 2022 Shares March December 2023 RSU grant B 2022 grant A 2022 grant B
LTI RSU 2023 LTI RSU Grant date 1 Mar 2022 1 Mar 2022 1 Mar 2022 14 Dec 2022 6 Mar 2023 11 Dec 2023 Vesting date 1 Mar 2027 1 Mar 2025 1 Mar 2027 14 Dec 2025 6 Mar 2026 11 Dec 2026 ExCom 70,344 316,709 316,707 361,687 254,744 117,496 (1) The
following Restricted Stock Units vested in 2023: • 34,763, 31,435, 6,053 and 6,952 Restricted Stock Units granted on 2 March 2018 respectively held by Michel Doukeris, David Almeida, Fernando Tennenbaum and John Blood vested on 2 March 2023 at
a price of EUR 56.62. • 16,496, 7,332, 6,110 and 6,110 Restricted Stock Units granted on 14 December 2020 respectively held by Michel Doukeris, David Almeida, Fernando Tennenbaum and John Blood vested on 14 December 2023 at a price of EUR
57.42. G. Performance stock units owned by members of the ExCom The table below sets forth the number of Performance Stock Units owned by the members of the ExCom as of 31 December 2023. December 2022 LTI PSU December 2023 LTI PSU Grant date 14 Dec
2022 12 Dec 2023 Vesting date 14 Dec 2025 12 Dec 2026 ExCom 97,993 33,342 8.2.3. PAY RATIO For 2023, the ratio between the remuneration of the highest paid member of the ExCom and the lowest paid employee of the Company (Anheuser-Busch InBev SA/NV)
was 184.8 to one. For purposes of calculating the ratio, the following components have been taken into account to determine the total remuneration for 2023: (a) base salary, (b) variable performance-related compensation (bonus) definitively acquired
in 2023 (if any), (c) long-term incentives vested in 2023 (if any), (d) pension contributions and (e) other cash and non-cash benefits (e.g. health plans, etc.). Expat allowances (if any) have been excluded from the calculation, since they mainly
represent the reimbursement of additional expenses incurred by the employee as a result of the assignment abroad. Our pay ratio may vary significantly year-to-year due to a number of factors such as the high proportion of variable performance
related compensation (bonus) and long-term incentives in the total compensation package for our top management (including the members of the ExCom) and exchange rate movements between reporting years. AB InBev – Annual Report 2023 231
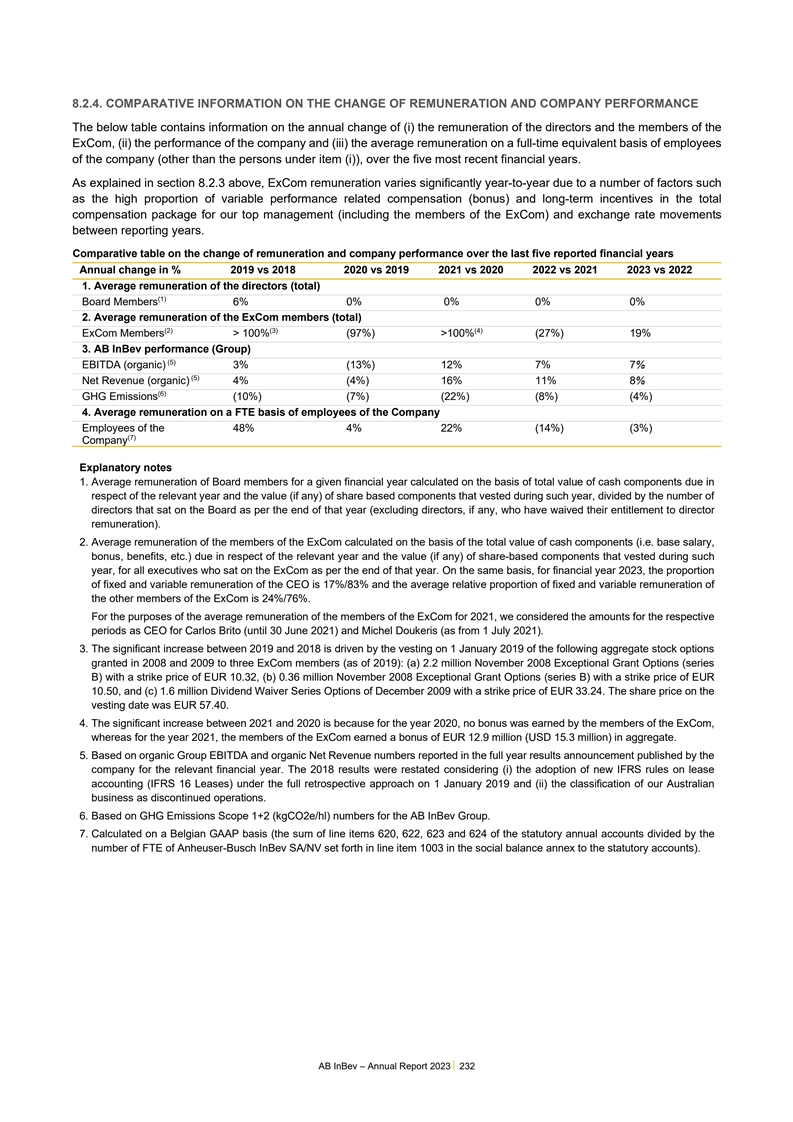
8.2.4. COMPARATIVE INFORMATION ON THE CHANGE OF REMUNERATION AND
COMPANY PERFORMANCE The below table contains information on the annual change of (i) the remuneration of the directors and the members of the ExCom, (ii) the performance of the company and (iii) the average remuneration on a full-time equivalent
basis of employees of the company (other than the persons under item (i)), over the five most recent financial years. As explained in section 8.2.3 above, ExCom remuneration varies significantly year-to-year due to a number of factors such as the
high proportion of variable performance related compensation (bonus) and long-term incentives in the total compensation package for our top management (including the members of the ExCom) and exchange rate movements between reporting years.
Comparative table on the change of remuneration and company performance over the last five reported financial years Annual change in % 2019 vs 2018 2020 vs 2019 2021 vs 2020 2022 vs 2021 2023 vs 2022 1. Average remuneration of the directors (total)
(1) Board Members 6% 0% 0% 0% 0% 2. Average remuneration of the ExCom members (total) (2) (3) (4) ExCom Members > 100% (97%) >100% (27%) 19% 3. AB InBev performance (Group) (5) EBITDA (organic) 3% (13%) 12% 7% 7% (5) Net Revenue (organic) 4%
(4%) 16% 11% 8% (6) GHG Emissions (10%) (7%) (22%) (8%) (4%) 4. Average remuneration on a FTE basis of employees of the Company Employees of the 48% 4% 22% (14%) (3%) (7) Company Explanatory notes 1. Average remuneration of Board members for a given
financial year calculated on the basis of total value of cash components due in respect of the relevant year and the value (if any) of share based components that vested during such year, divided by the number of directors that sat on the Board as
per the end of that year (excluding directors, if any, who have waived their entitlement to director remuneration). 2. Average remuneration of the members of the ExCom calculated on the basis of the total value of cash components (i.e. base salary,
bonus, benefits, etc.) due in respect of the relevant year and the value (if any) of share-based components that vested during such year, for all executives who sat on the ExCom as per the end of that year. On the same basis, for financial year
2023, the proportion of fixed and variable remuneration of the CEO is 17%/83% and the average relative proportion of fixed and variable remuneration of the other members of the ExCom is 24%/76%. For the purposes of the average remuneration of the
members of the ExCom for 2021, we considered the amounts for the respective periods as CEO for Carlos Brito (until 30 June 2021) and Michel Doukeris (as from 1 July 2021). 3. The significant increase between 2019 and 2018 is driven by the vesting on
1 January 2019 of the following aggregate stock options granted in 2008 and 2009 to three ExCom members (as of 2019): (a) 2.2 million November 2008 Exceptional Grant Options (series B) with a strike price of EUR 10.32, (b) 0.36 million November 2008
Exceptional Grant Options (series B) with a strike price of EUR 10.50, and (c) 1.6 million Dividend Waiver Series Options of December 2009 with a strike price of EUR 33.24. The share price on the vesting date was EUR 57.40. 4. The significant
increase between 2021 and 2020 is because for the year 2020, no bonus was earned by the members of the ExCom, whereas for the year 2021, the members of the ExCom earned a bonus of EUR 12.9 million (USD 15.3 million) in aggregate. 5. Based on organic
Group EBITDA and organic Net Revenue numbers reported in the full year results announcement published by the company for the relevant financial year. The 2018 results were restated considering (i) the adoption of new IFRS rules on lease accounting
(IFRS 16 Leases) under the full retrospective approach on 1 January 2019 and (ii) the classification of our Australian business as discontinued operations. 6. Based on GHG Emissions Scope 1+2 (kgCO2e/hl) numbers for the AB InBev Group. 7. Calculated
on a Belgian GAAP basis (the sum of line items 620, 622, 623 and 624 of the statutory annual accounts divided by the number of FTE of Anheuser-Busch InBev SA/NV set forth in line item 1003 in the social balance annex to the statutory accounts). AB
InBev – Annual Report 2023 232
CONTACTS Registered Office Asia Pacific Latin America South AB InBev
26F Raffles City Shanghai Office Tower Cervecería y Maltería Quilmes Grand-Place 1 268 Middle Xizang Road Av. 12 de Octubre y Gran Canaraia s/n 1000 Brussels Shanghai, 200001 (B1878AAB) Quilmes Belgium China Provincia de Buenos Aires
Argentina Global Headquarters - Europe InBev Belgium Middle Americas Belgium Brouwerijplein 1 3000 Leuven Grupo Modelo S.A. de C.V. AB InBev Belgium Cerrada de Palomas 22, piso 5 Brouwerijplein 1 Colonia Reforma Social 3000 Leuven CP 11650 Latin
America COPEC Belgium Mexico Bavaria Carrera 53A 127-35 Functional Management North America Bogotá Office Colombia Anheuser-Busch Co. Inc. AB InBev One Busch Place 250 Park Avenue St. Louis, MO 63118 Latin America North Floor 2 United States
Cervejaria Ambev New York, NY 10177 Corporate Park United States th Rua Dr. Renato Paes de Barros 1017 4 Floor 04530-001, Sao Paulo Africa Brazil South African Breweries 65 Park Lane Sandown Johannesburg South Africa AB InBev - Annual report 2023 -
233
REGISTERED TRADEMARKS The following brands are among the registered
trademarks of Anheuser- The following brands are registered Busch InBev SA/NV or one of its affiliated companies: trademarks co-owned with third parties: • PerfectDraft: co-owned with Koninklijke Philips N.V. Global brands • Clean Waves:
co-owned with Parley LLC Budweiser, Corona, Stella Artois and Michelob ULTRA Responsible Editor International brands Donna Lorenson Beck’s, Castle, Hoegaarden and Leffe Project Lead Local brands Michaël Cloots 10 Barrel, 2M, Aguila,
Alexander Keith’s, Alta Palla, Ama, Andes, Antarctica, Antarctica Sub-Zero, Archibald, Atlas, Babe, Balboa, Bathtub Gin, Barrilito, Special thanks to all our colleagues from AB InBev who made this Annual Bass, BBC, Beck’s Ice, Becker,
Belle-Vue, Birra del Borgo, Black Crown Gin, Report a reality. Blasfemia, Blue Point, Boddingtons, Bohemia, Boxing Cat, Brahma, Brahma Double Malt, Breckenridge, Brutal Fruit, Bud Zero, Bud 66, Bud Light, Bud Design and Production Light Seltzer,
Busch, Busch Light, Cafri, Camden Town, Camden Hells, ChrisCom Carling Black Label, Cass, Castle Lager, Castle Lite, Club, Club Colombia, Colorado, Corona Agua Rifada, Corona Sunbrew, Corona Tropical, Cristal, Cubanisto, Cucapá, Cusqueña,
Cutwater, Devils Backbone, Diebels, Diekirch, Eagle Lager, Elysian, Estrella Jalisco, Flying Fish, Four Peaks, Franziskaner, Ginette, Golden Road, Goose Island, Guaraná Antarctica, Haake-Beck, HANMAC, Harbin, Harbin Cristal, Harbin Ice, Harbin
1900, Hasseröder, Hayward 5000, Hero, Hertog Jan, HiBall, Impala, Jinling, Julius, Jupiler, Kaiba, Karbach, Kilimanjaro, King of Beers, Kokanee, Kombrewcha, Kona, Kwak, Labatt, Lakeport, La Virgen, Leffe 0.0, Leon, Löwenbräu,
Mackeson, Magnífica, Mexicali, Mike’s, Mike’s Hard Seltzer, Mill Street, U kan dit rapport in het Nederlands raadplegen op onze website: Modelo, Modelo Especial, Modelo Pura Malta, Montejo, Mosi, Nativa, Natty www.ab-inbev. com
Daddy, Natural Light, Natural Light Seltzer, Negra Modelo, Norte, Nossa, Vous pouvez consulter ce rapport en français sur notre site web: Nuestra Siembra, NÜTRL, O’Doul’s, OB, Oland, Paceña, Pacifico, Patagonia,
www.ab-inbev.com Patricia, Pilsen, Pilsen Callao, Pilsener, Poker, Pony Malta, Presidente, Pure Anheuser-Busch InBev NV/SA Draught, Quilmes, Quilmes Zero, Redd’s, Safari, Salva Vida, Sedrin, Shiliang, Brouwerijplein 1B-3000 Leuven Shock Top,
Skol, Spaten, Stanley Park, Tijuana, Tripel Karmeliet, Trophy, Belgium Tropical, Vieux Temps, Victoria, Wäls, Whitbread, Wicked Weed. Tel: +32 16 276 111 For some of our most recent innovations, trademark applications are still pending and
haven’t matured to registration yet. Register of Companies 0417.497.106 AB InBev - Annual report 2023 - 234
Anheuser Busch Inbev SA NV (NYSE:BUD)
Historical Stock Chart
From Mar 2024 to Apr 2024

Anheuser Busch Inbev SA NV (NYSE:BUD)
Historical Stock Chart
From Apr 2023 to Apr 2024
