false
0001109242
0001109242
2024-02-26
2024-02-26
iso4217:USD
xbrli:shares
iso4217:USD
xbrli:shares
UNITED STATES
SECURITIES AND EXCHANGE COMMISSION
Washington, D.C. 20549
FORM 8-K
CURRENT REPORT
Pursuant to Section 13 or 15(d) of
The Securities Exchange Act of
1934
Date of Report (Date of earliest event reported) February 26, 2024
HANMI FINANCIAL CORPORATION
(Exact name of registrant as specified in its charter)
| Delaware |
000-30421 |
95-4788120 |
(State or other jurisdiction
of incorporation) |
(Commission File Number) |
(IRS Employer Identification No.) |
900 Wilshire Boulevard, Suite 1250
Los Angeles, California |
90017 |
| (Address of principal executive offices) |
(Zip Code) |
Registrant's telephone number, including area code: (213) 382-2200
Not Applicable
(Former name or former address, if changed since last
report)
Check the appropriate box below if the Form 8-K filing is intended to simultaneously satisfy
the filing obligation of the registrant under any of the following provisions:
| ☐ |
Written communications pursuant to Rule 425 under the Securities Act (17 CFR 230.425) |
| ☐ |
Soliciting material pursuant to Rule 14a-12 under the Exchange Act (17 CFR 240.14a-12) |
| ☐ |
Pre-commencement communications pursuant to Rule 14d-2(b) under the Exchange Act (17 CFR 240.14d-2(b)) |
| ☐ |
Pre-commencement communications pursuant to Rule 13e-4(c) under the Exchange Act (17 CFR 240.13e-4(c)) |
Securities registered pursuant to Section 12(b) of the Act:
| Title of each class |
|
Trading
Symbol(s) |
|
Name of each exchange on which registered |
| Common Stock, $0.001 par value |
|
HAFC |
|
Nasdaq Global Select Market |
Indicate by check mark whether the registrant is an emerging growth company
as defined in Rule 405 of the Securities Act of 1933 (§230.405 of this chapter) or Rule 12b-2 of the Securities Exchange Act of 1934
(§240.12b-2 of this chapter).
Emerging growth company ☐
If an emerging growth company, indicate by check mark if the registrant has
elected not to use the extended transition period for complying with any new or revised financial accounting standards provided pursuant
to Section 13(a) of the Exchange Act. ☐
|
Item 7.01 |
Regulation FD Disclosure. |
On February 26, 2024, Hanmi Financial Corporation (the
“Company”), parent company of Hanmi Bank, made available and distributed to analysts and prospective investors a slide presentation.
The presentation materials include information regarding the Company’s operating and growth strategies and financial performance.
The slide presentation is furnished in this Current Report on Form 8-K, pursuant to this Item 7.01, as Exhibit 99.1, and is incorporated
herein by reference.
This Current Report and the information included below and furnished as
exhibits hereto shall not be deemed to be “filed” for purposes of Section 18 of the Securities Exchange Act of 1934, as amended
(“Exchange Act”), nor shall it be incorporated by reference into a filing under the Securities Act of 1933, as amended, or
the Exchange Act, except as expressly set forth by specific reference in such a filing. The furnishing of the information in this Current
Report is not intended to, and does not, constitute a determination or admission by the Company that the information in this report is
material or complete, or that investors should consider this information before making an investment decision with respect to any security
of the Company or any of its affiliates.
|
Item 9.01 |
Financial Statements and Exhibits. |
Forward-Looking Statements
This press release contains forward-looking statements, which are included
in accordance with the “safe harbor” provisions of the Private Securities Litigation Reform Act of 1995. All statements other
than statements of historical fact are “forward–looking statements” for purposes of federal and state securities laws,
including, but not limited to, statements about our anticipated future operating and financial performance, financial position and liquidity,
business strategies, regulatory and competitive outlook, investment and expenditure plans, capital and financing needs and availability,
plans and objectives of management for future operations, developments regarding our capital and strategic plans, and other similar forecasts
and statements of expectation and statements of assumption underlying any of the foregoing. In some cases, you can identify forward-looking
statements by terminology such as “may,” “will,” “should,” “could,” “expects,”
“plans,” “intends,” “anticipates,” “believes,” “estimates,” “predicts,”
“potential,” or “continue,” or the negative of such terms and other comparable terminology. Although we believe
that our forward-looking statements to be reasonable, we cannot guarantee future results, levels of activity, performance or achievements.
Forward-looking statements involve known and unknown risks, uncertainties
and other factors that may cause our actual results, levels of activity, performance or achievements to differ from those expressed or
implied by the forward-looking statements. These factors include the following:
|
· |
a failure to maintain adequate levels of capital and liquidity to support our operations; |
|
· |
the effect of potential future supervisory action against us or Hanmi Bank; |
|
· |
the effect of our rating under the Community Reinvestment Act and our ability to address any issues raised in our regulatory exams; |
|
· |
general economic and business conditions internationally, nationally and in those areas in which we operate, including any potential recessionary
conditions; |
|
· |
volatility and deterioration in the credit and equity markets; |
|
· |
changes in consumer spending, borrowing and savings habits; |
|
· |
availability of capital from private and government sources; |
|
· |
competition for loans and deposits and failure to attract or retain loans and deposits; |
|
· |
inflation and fluctuations in interest rates that reduce our margins and yields, the fair value of financial instruments, the level of
loan originations or prepayments on loans we have made and make, and the cost we pay to retain and attract deposits and secure other types
of funding; |
our ability to enter new markets successfully and capitalize on
growth opportunities;
|
· |
the current or anticipated impact of military conflict, terrorism or other geopolitical events; |
|
· |
a potential government shutdown; |
|
· |
risks of natural disasters; |
|
· |
legal proceedings and litigation brought against us; |
|
· |
a failure in or breach of our operational or security systems or infrastructure, including cyberattacks; |
|
· |
the failure to maintain current technologies; |
|
· |
risks associated with Small Business Administration loans; |
|
· |
failure to attract or retain key employees; |
|
· |
our ability to access cost-effective funding; |
|
· |
fluctuations in real estate values; |
|
· |
changes in accounting policies and practices; |
|
· |
changes in governmental regulation, including, but not limited to, any increase in FDIC insurance premiums and changes in the monetary
policies of the U.S. Treasury and the Board of Governors of the Federal Reserve System; |
|
· |
the continuing impact of the COVID-19 pandemic on our business and results of operation; |
|
· |
the ability of Hanmi Bank to make distributions to Hanmi Financial Corporation, which is restricted by certain factors, including Hanmi
Bank’s retained earnings, net income, prior distributions made, and certain other financial tests; |
|
· |
strategic transactions we may enter into; |
|
· |
the adequacy of our allowance for credit losses; |
|
· |
our credit quality and the effect of credit quality on our credit losses expense and allowance for credit losses; |
|
· |
changes in the financial performance and/or condition of our borrowers and the ability of our borrowers to perform terms of their loans
and other terms of credit agreements; |
|
· |
our ability to control expenses; and |
|
· |
cyber security and fraud risks against our information technology and those of our third-party providers and vendors. |
In addition, we set forth certain risks in our reports filed with the U.S.
Securities and Exchange Commission, including, Item 1A of our Annual Report on Form 10-K for the year ended December 31, 2023, our Quarterly
Reports on Form 10-Q, and Current Reports on Form 8-K that we will file hereafter, which could cause actual results to differ from those
projected. We undertake no obligation to update such forward-looking statements except as required by law.
SIGNATURES
Pursuant to the requirements of the Securities Exchange Act of 1934, the
Registrant has duly caused this report to be signed on its behalf by the undersigned hereunto duly authorized.
| |
HANMI FINANCIAL CORPORATION |
| |
|
| |
|
| |
|
| Date: February 26, 2024 |
By: |
/s/ Bonita I. Lee |
| |
|
Bonita I. Lee |
| |
|
Chief Executive Officer |
Exhibit 99.1

Wedbush 2024 Virtual Bank Conference February 2024 Los Angeles New York/ New Jersey Virginia Chicago Dallas Houston San Francisco San Diego

Hanmi Financial Corporation (the “Company”) cautions investors that any statements contained herein that are not historical facts are forward - looking statements within the meaning of the “safe harbor” provisions of the Private Securities Litigation Reform Act of 1995 , including, but not limited to, those statements regarding operating and financial performance, financial position and liquidity, business strategies, regulatory, economic and competitive outlook, investment and expenditure plans, capital and financing needs and availability, litigation, plans and objectives, merger or sale activity, financial condition and results of operations, and all other forecasts and statements of expectation or assumption underlying any of the foregoing . These statements involve known and unknown risks and uncertainties that are difficult to predict . Investors should not rely on any forward - looking statement and should consider risks, such as changes in governmental policy, legislation and regulations, economic uncertainty and changes in economic conditions, inflation, the continuing impact of the COVID - 19 pandemic on our business and results of operations, fluctuations in interest rate and credit risk, competitive pressures, the ability to succeed in new markets, balance sheet management, liquidity and sources of funding, the size and composition of our deposit portfolio, including the percentage of uninsured deposits in the portfolio, increased assessments by the Federal Deposit Insurance Corporation, risk of natural disasters, a failure in or breach of our operational or security systems or infrastructure, including cyberattacks, the adequacy of our allowance for credit losses, and other operational factors . Forward - looking statements are based upon the good faith beliefs and expectations of management as of this date only and are further subject to additional risks and uncertainties, including, but not limited to, the risk factors set forth in our earnings release dated January 23 , 2024 , including the section titled “Forward Looking Statements and the Company’s most recent Form 10 - K, 10 - Q and other filings with the Securities and Exchange Commission (“SEC”) . Investors are urged to review our earnings release dated January 23 , 2024 , including the section titled “Forward Looking Statements and the Company’s SEC filings . The Company disclaims any obligation to update or revise the forward - looking statements herein . 2 Forward - Looking Statements
This presentation contains financial information determined by methods other than in accordance with accounting principles generally accepted in the United States of America (“GAAP”) . These non - GAAP measures include tangible common equity to tangible assets, and tangible common equity per share . Management uses these “non - GAAP” measures in its analysis of the Company’s performance . Management believes these non - GAAP financial measures allow for better comparability of period to period operating performance . Additionally, the Company believes this information is utilized by regulators and market analysts to evaluate a company’s financial condition and therefore, such information is useful to investors . These disclosures should not be viewed as a substitute for operating results determined in accordance with GAAP, nor are they necessarily comparable to non - GAAP performance measures that may be presented by other companies . A reconciliation of the non - GAAP measures used in this presentation to the most directly comparable GAAP measures is provided in the Appendix to this presentation . 3 Non - GAAP Financial Information

5 – 9 Overview & highlights 10 – 23 Loan portfolio 24 – 25 Deposit portfolio 26 – 30 Margin, fee income, expenses 31 – 35 Asset quality 36 – 37 Securities & liquidity 38 – 39 Capital management 40 – 43 Environmental Social Governance (ESG) 44 – 48 Appendix 4 Table of Contents

Hanmi Franchise at a Glance Loans $6.2B Deposits $6.3B TCE/TA (2) Ratio 9.14% Second Largest Korean - American Bank in the U.S. • Founded in 1982 in Los Angeles, as the first Korean - American bank • 35 full - service branches and 8 loan production offices across 9 states • Focused on MSAs with high Asian - American and multi - ethnic populations • Strong track record of growth • Well capitalized, significantly above regulatory requirements (1) CAGR based on the average loan growth between 2013, when new executive management was appointed, and 2023 (2) Non - GAAP financial measure; refer to the non - GAAP reconciliation slide Loan Growth (1) 10.7% TBVPS (2) $22.75 As of 4Q23 Total Assets $7.6B Experienced Bankers with Deep Community Ties 3 2 1 1 1 1 7 1 1 Branch Loan Production Office (LPO) 1 22 2 5

Previous Experience Hanmi Experience (Years) Banking Experience (Years) Position Name BBCN Bancorp, Shinhan Bank America, Nara Bank 11 38 President & CEO Bonnie Lee Opus Bank, First California Financial Group 9 33 SEVP, Chief Financial Officer Romolo Santarosa BBCN Bancorp 11 30 SEVP, Chief Banking Officer Anthony Kim Pacific Western Bank, FDIC 9 28 EVP, Chief Credit Officer Matthew Fuhr East West Bank 10 36 EVP, Chief Credit Risk Officer Mike Park East West Bank, Nara Bank, Wilshire Bank, First American Bank 10 41 EVP, Chief SBA Lending Officer Anna Chung Columbia Bank, American Marine Bank, First Capital Bank of Texas 6 22 EVP, Chief Technology Officer Navneeth Naidu Pacific Western Bank, Unify Financial Federal Credit Union 5 25 SVP, Chief Risk Officer Michael Du Bank of the West, Arthur Anderson 2 26 SVP, Chief Accounting Officer Joseph Pangrazio 6 Management Team

The Hanmi Timeline 1982 - First Korean American Bank in the U.S. 1988 - Began offering SBA loans - Acquired First Global Bank 2001 - Listed HAFC common stock 2004 - Acquired Pacific Union Bank ($1.2 billion in assets) 2007 - Completed $70 million secondary common stock offering 2013 - C.G. Kum appointed as the new CEO - Bonnie Lee appointed as the new COO 2014 - Acquired Central Bancorp, Inc. ($1.3 billion in assets) 2016 - Acquired Commercial Equipment Leasing Division ($228 million in assets) 2017 - Assets surpassed $5 billion - Opened a Manhattan, NY branch 2019 - Bonnie Lee appointed as the new CEO 2022 - Assets surpassed $7 billion - Celebrated 40 th Anniversary - Nasdaq Closing Bell Ceremony For over 40 years, we have been dedicated to helping our stakeholders bank on their dreams . 7 2020 - Launch of USKC (1) - Revitalization of Mortgage Lending (1) U.S. subsidiaries of Korean Corporations 2018 - Opened Chinatown branch in Houston, Texas
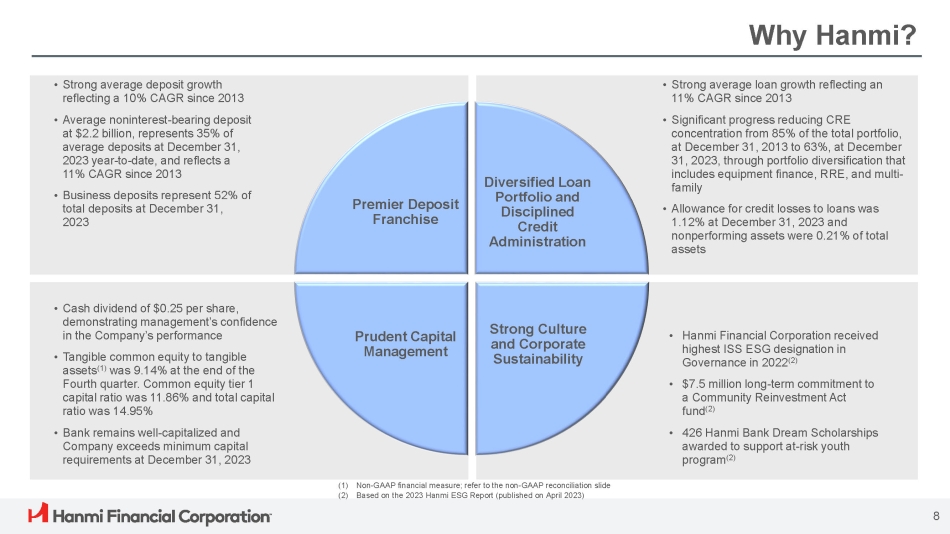
Why Hanmi? • Strong average loan growth reflecting an 11% CAGR since 2013 • Significant progress reducing CRE concentration from 85% of the total portfolio, at December 31, 2013 to 63%, at December 31, 2023, through portfolio diversification that includes equipment finance, RRE, and multi - family • Allowance for credit losses to loans was 1.12% at December 31, 2023 and nonperforming assets were 0.21% of total assets • Strong average deposit growth reflecting a 10% CAGR since 2013 • Average noninterest - bearing deposit at $2.2 billion, represents 35% of average deposits at December 31, 2023 year - to - date, and reflects a 11% CAGR since 2013 • Business deposits represent 52% of total deposits at December 31, 2023 Premier Deposit Franchise Diversified Loan Portfolio and Disciplined Credit Administration 8 Strong Culture and Corporate Sustainability Prudent Capital Management • Cash dividend of $0.25 per share, demonstrating management’s confidence in the Company’s performance • Tangible common equity to tangible assets (1) was 9.14% at the end of the Fourth quarter. Common equity tier 1 capital ratio was 11.86% and total capital ratio was 14.95% • Bank remains well - capitalized and Company exceeds minimum capital requirements at December 31, 2023 • Hanmi Financial Corporation received highest ISS ESG designation in Governance in 2022 (2) • $7.5 million long - term commitment to a Community Reinvestment Act fund (2) • 426 Hanmi Bank Dream Scholarships awarded to support at - risk youth program (2) (1) Non - GAAP financial measure; refer to the non - GAAP reconciliation slide (2) Based on the 2023 Hanmi ESG Report (published on April 2023)

4Q23 Highlights Diluted EPS $0.61 ROAA 0.99% NIM 2.92% Efficiency Ratio 58.86% TBVPS (1) $22.75 Net Income $18.6M • Net income was $18.6 million, or $0.61 per diluted share, down 0.9% from $18.8 million, or $0.62 per diluted share, for the prior quarter » Net interest income was $53.1 million, down 3.1% from the prior quarter » Noninterest income was $6.7 million, down 40.5% from the prior quarter primarily due to the third quarter benefitting from a $4.0 million gain on a branch sale - and - leaseback » Noninterest expense was $35.2 million, up 2.8% from the prior quarter » Efficiency ratio was 58.86%, compared with 51.82% for the prior quarter • Loans receivable were $6.18 billion, up 2.7% from the prior quarter » Loan production was $389.5 million with a weighted average interest rate of 8.10% • Deposits were $6.28 billion, up 0.3% from the prior quarter, with noninterest - bearing demand deposits representing 31.9% of total deposits » Cost of interest - bearing deposits was 3.83%, up 30 basis points from the prior quarter • Credit loss recovery was $2.9 million; allowance for credit losses to loans was 1.12% at December 31, 2023 • Tangible common equity to tangible assets (1) was 9.14%, Common equity tier 1 capital ratio was 11.86% and total capital ratio was 14.95% ROAE 9.70% (1) Non - GAAP financial measure; refer to the non - GAAP reconciliation slide 9

6.85% 7.19% 7.39% 7.80% 8.10% Loan Production 18% 32% 46% 29% 19% 23% 9% 25% 23% 11% $303.6 11% 32% $259.3 12% 39% 20% 13% 16% $336.3 11% 16% 21% 20% $389.5 12% 14% 15% 13% $473.8 4Q22 1Q23 2Q23 3Q23 CRE C&I Equipment Finance RRE (1) 4Q23 (2) SBA • Weighted average interest rate on new production was up 30 basis points sequentially. • Commercial real estate loan production was $178.2 million and equipment finance production was $57.3 million for the fourth quarter. • Residential mortgage (1) loan production was $53.5 million and commercial and industrial loan production was $52.1 million. • SBA (2) loan production was $48.4 million for the fourth quarter. Fourth quarter observed the highest quarterly loan production in 2023. Loan production increased by 16% quarter - over - quarter. Weighted average interest rate on new production (1) Residential mortgage includes $0.1 million, $2.0 million, $0.0, $0.0, and $0.0 of consumer loans for 4Q22, 1Q23, 2Q23, 3Q23, and 4Q23 respectively (2) $53.2 million, $34.5 million, $30.9 million, $36.1 million, and $48.4 million of SBA loan production includes $36.7 million, $22.6 million, $19.4 million, $17.6 million, and $20.2 million of loans secured by CRE and the remainder representing C&I as of 4Q22, 1Q23, 2Q23, 3Q23, and 4Q23 respectively ($ in millions) 10

Average Loan Trend $4,039 $3,423 $2,902 $2,441 $2,157 $4,456 $4,508 $4,685 $4,795 $5,968 $5,597 2013 2014 2015 2016 2020 2021 2022 2023 2017 2018 2019 Average Loans Receivable Strong average loan growth reflecting an 11% CAGR since 2013. ($ in millions) 11

Successful Portfolio Diversification Strategy 12 Loan Composition (as of December 31, 2023) Loan Composition (as of December 31, 2013) $2.23 Billion $6.18 Billion (1) RRE includes Consumer loans (2) $144.5 million or 7.6% and $115.5 million or 3.0% of the CRE portfolio is unguaranteed SBA loans at December 31, 2013 and December 31, 2023, respectively (3) $7.0 million or 3.1% and $61.1 million or 8.2% of the C&I portfolio is unguaranteed SBA loans at December 31, 2013 and December 31, 2023, respectively RRE – 16% Equipment Finance – 9% (1) RRE – 5% Significant progress reducing CRE concentration from 85% of total portfolio to 63%. (1) (2) CRE – 63% C& I ( 3 – ) 12% (2) CRE – 85% (3) C&I – 10%

Loan Portfolio Commercial Real Estate (CRE) (1,2) Portfolio $3,890 Outstanding ($ in millions) 5.52% 4Q23 Average Yield $6.2 Billion Loan Portfolio (as of December 31, 2023) CRE 13 Owner - 12% C&I - 12% Equipment Finance - 9% (2) CRE Construction - 2% (2) CRE Multifamily - 7% Note: Numbers may not add due to rounding (1) Includes syndicated loans of $297.8 million in total commitments ($239.3 million disbursed) across C&I ($238.4 million committed and $179.9 million disbursed) and CRE ($59.4 million committed and disbursed) (2) Commercial Real Estate (CRE) is a combination of Investor (non - owner), Owner Occupied, Multifamily, and Construction. Investor (or non - owner occupied) property is where the investor does not occupy the property. The primary source of repayment stems from the rental income associated with the respective properties. Owner occupied property is where the borrower owns the property and also occupies it. The primary source of repayment is the cash flow from the ongoing operations and activities conducted by the borrower/owner. Multifamily real estate is a residential property that has 5 or more housing units. (3) Residential real estate is a loan (mortgage) secured by a single family residence, including one to four units (duplexes, triplexes, and fourplexes). RRE also includes $1.9 million of HELOCs and $4.5 million in consumer loans (4) Weighted average DCR and weighted average LTV calculated when the loan was first underwritten or renewed subsequently CRE (2) Multifamily 155 # of Loans 55.1% Weighted Average Loan - to - Value Ratio (4) 1.57x Weighted Average Debt Coverage Ratio (4) CRE (2) Investor (non - owner) 893 # of Loans 50.3% Weighted Average Loan - to - Value Ratio (4) 2.06x Weighted Average Debt Coverage Ratio (4) CRE (2) Owner Occupied 753 # of Loans 47.8% Weighted Average Loan - to - Value Ratio (4) 2.69x Weighted Average Debt Coverage Ratio (4) Residential Real Estate (RRE) (3) Portfolio $963 Outstanding ($ in millions) 4.98% 4Q23 Average Yield Commercial & Industrial (C&I) (1) Portfolio $748 Outstanding ($ in millions) 8.96% 4Q23 Average Yield Equipment Finance Portfolio $582 Outstanding ($ in millions) 5.85% 4Q23 Average Yield (2) CRE Investor (non - owner) (2) - 42% RRE - (3) 16%

Loan Portfolio Diversification Loan portfolio is well diversified across collateral types and industry types; CRE represents 63% of the total portfolio and C&I, excluding Equipment Finance Agreements, represents 12%. CRE Portfolio (1) $3.89B C&I Portfolio (2) $748M Retail – 28% Hospitality – 19% Office – 15% Industrial – 10% Multifamily – 10% Mixed Use – 3% Gas Station – 6% Construction 3% Other – 6% Manufacturing - 24% 14 Finance & Insurance - 17% Wholesale Trade - 7% Retail Trade - 8% Real Estate Rental & Leasing - 5% Healthcare - 7% Other - 32% (1) $115.5 million, or 3.0%, of the CRE portfolio are unguaranteed SBA loans (2) $61.1 million, or 8.2%, of the C&I portfolio are unguaranteed SBA loans

CRE Portfolio Geographical Exposure CRE Composition by State $3,890 Multifamily by State $419 Construction by State $100 Owner Occupied by State $764 Investor (Non - owner Occupied) by State $2,607 California – $2,602 67% Texas – $398 10% New York – $216 6% Illinois – $85 2% Other – $589 15% New York – $80 19% Illinois – $14 3% Other – $17 4% New York – $18 18% California – California – $63 $211 Texas - 63% 51% $97 23% Other – $19 19% California - $469 62% New York – $9 1% Texas – $47 6% Illinois – $14 2% Other – $225 29% California - $1,859 71% 15 Texas – $254 10% New York – $109 4% Illinois – $56 2% Other – $329 13% ($ in millions) ($ in millions)

Loan Portfolio Distribution CRE C&I ($ in millions) ($ in millions) Construction (1) Multifamily Non - owner Occupied Owner Occupied $100 $419 $2,607 $763 Total Balance $11.15 $2.70 $2.95 $1.01 Average $7.99 $1.11 $1.12 $0.32 Median $58 $302 $1,866 $573 (3) Top Quintile Balance $22.3 or more $2.5 or more $3.5 or more $1.2 or more Top Quintile Loan Size $29.23 $9.74 $10.67 $3.82 Top Quintile Average $29.23 $4.71 $6.79 $2.09 Top Quintile Median Lines of Credit (2) Term (2) $374 $374 Total Balance $0.64 $0.36 Average $0.06 $0.05 Median $314 $331 Top Quintile Balance (3) $0.7 or more $0.1 or more Top Quintile Loan Size $3.78 $1.63 Top Quintile Average $1.43 $0.24 Top Quintile Median Residential Real Estate & Equipment Finance 16 Equipment Finance Residential Real Estate $582 $963 Total Balance $0.05 $0.54 Average $0.03 $0.46 Median $298 $397 Top Quintile Balance (3) $0.1 or more $0.7 or more Top Quintile Loan Size $0.12 $1.12 Top Quintile Average $0.10 $0.92 Top Quintile Median ($ in millions) (1) Represents the total outstanding amount. Advances require authorization and disbursement requests, depending on the progress of the project and inspections. Advances are non - revolving and are made throughout the term, up to the original commitment amount (2) Term loans are commitment for a specified term. Majority of the Lines of Credit are revolving, including commercial revolvers, with some non - revolvers (sub - notes and working capital tranches) (3) Top quintile represents top 20% of the loans

<1 Year 1 - 3 Years >3 Years Total Real estate loans $ 1,107.4 $ 661.6 $ 302.5 $ 143.3 Retail 740.5 372.6 144.7 223.2 Hospitality 575.0 225.6 304.7 44.7 Office 1,366.5 755.6 449.6 161.3 Other 3,789.4 2,015.4 1,201.5 572.5 Commercial Property 100.3 2.0 8.0 90.3 Construction 962.7 958.2 0.1 4.4 RRE / Consumer 4,852.4 2,975.6 1,209.6 667.2 Total Real Estate Loans 747.8 235.6 211.6 300.6 C&I (1) 582.2 350.6 199.1 32.5 Equipment Finance $ 6,182.4 $ 3,561.8 $ 1,620.3 $ 1,000.3 Loans receivable 17 Loan Portfolio Maturities ($ in millions) Note: numbers may not add due to rounding (1) $274.1 million of C&I are lines of credit expected to be renewed and maintain a maturity of less than one year

USKC (1) Loans & Deposits 33% 21% 20% 6% 4% 3% 3% 3% 2% 2% 3% Real Estate Investment Hotel Auto Part Manufacturer Food Education Golf Course Electronics/Home Appliances Computer Equipment Steel Transportation Other USKC portfolio represented $764.1 million in loans, or 12% of the loan portfolio and $818.7 million in deposits, or 13% of the deposit portfolio. USKC CRE portfolio had a weighted average debt coverage ratio (2) of 1.94x and weighted average loan - to - value (2) of 58.2%. USKC Loans – Top 10 Industries (as of 4Q23) 75% 75% 77% 80% 80% $781 25% $764 25% $732 23% $720 20% $764 20% U.S. subsidiaries of Korean Corporations Weighted average DCR and weighted average LTV calculated when the loan was first underwritten or renewed subsequently (1) (2) 4Q23 3Q23 2Q23 1Q23 4Q22 Time deposits, not illustrated, were 5% of total USKC deposits at December 31, 2023. Hence, the percentages do not add to 100% (3) CRE C&I USKC Loans by Product ($ in millions) USKC Deposits – Top 10 Industries (as of 4Q23) 27% Auto Part Manufacurer 11% Steel 10% Electronics/Home Appliances 6% All Other Financial Investment Activities 5% RE Investment/Leasing 5% Food 4% Research and Development 3% IT 3% Tire 3% Hospitality 23% Other 49% 46% 41% $575 38% 58% $565 32% 60% $688 46% $795 $819 49% 54% 4Q22 1Q23 2Q23 3Q23 4Q23 Demand Noninterest - bearing Money Market & Savings USKC Deposits by Product 18 ($ in millions) (3)

Office Loan Portfolio The CRE office portfolio (1) was $575.0 million at December 31, 2023, representing 9% of the total loan portfolio. 81% 12% 3% Remaining = 3% 1% Portfolio by State • Average balance and median balance of the portfolio were $4.6 million and $1.0 million, respectively • Weighted average debt coverage ratio (2) of the segment was 2.03x • Weighted average loan to value (2) of the segment was 56.50% • 21.29% of the portfolio is expected to reprice in 1 to 3 months • No delinquent or nonaccrual loans • Criticized loans represented 1.76% of the office portfolio Rate Distribution (1) Segment represents exposure in CRE and excludes $18.4 million in construction. 7.3% of the portfolio is owner occupied (2) Weighted average DCR and weighted average LTV calculated when the loan was first underwritten or renewed subsequently 67% 33% Fixed Variable 19
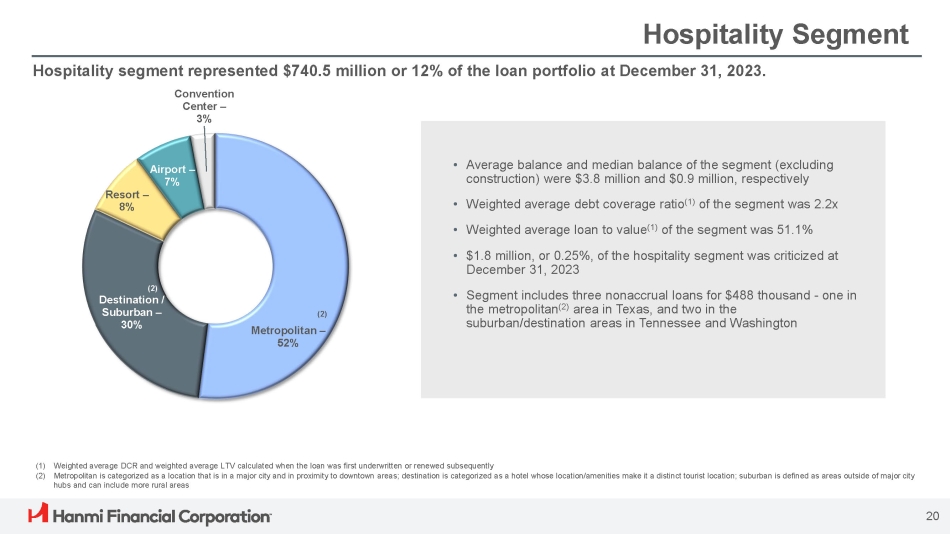
Resort – 8% 20 Airport – 7% (2) Metropolitan – 52% (2) Destination / Suburban – 30% Hospitality Segment Hospitality segment represented $740.5 million or 12% of the loan portfolio at December 31, 2023. Convention Center – 3% (1) Weighted average DCR and weighted average LTV calculated when the loan was first underwritten or renewed subsequently (2) Metropolitan is categorized as a location that is in a major city and in proximity to downtown areas; destination is categorized as a hotel whose location/amenities make it a distinct tourist location; suburban is defined as areas outside of major city hubs and can include more rural areas • Average balance and median balance of the segment (excluding construction) were $3.8 million and $0.9 million, respectively • Weighted average debt coverage ratio (1) of the segment was 2.2x • Weighted average loan to value (1) of the segment was 51.1% • $1.8 million, or 0.25%, of the hospitality segment was criticized at December 31, 2023 • Segment includes three nonaccrual loans for $488 thousand - one in the metropolitan (2) area in Texas, and two in the suburban/destination areas in Tennessee and Washington

Retail Segment Retail segment represented $1.1 billion or 18% of the loan portfolio at December 31, 2023. (1) Weighted average DCR and weighted average LTV calculated when the loan was first underwritten or renewed subsequently • Average balance and median balance of the segment were $1.5 million and $0.7 million, respectively • Weighted average debt coverage ratio (1) of the segment was 2.02x • Weighted average loan to value (1) of the segment was 47.50% • $11.4 million, or 1.03%, of the retail segment was criticized at December 31, 2023 • $2.0 million, or 0.18%, of the retail segment were on nonaccrual status at December 31, 2023 California 72% 21 Texas 13% Illinois 2% Georgia 3% Other 10%

Residential Real Estate Portfolio (2) QM - 2% (3) Non - QM - 91% (4) Jumbo Non - QM - 7% Non - QM Jumbo Non - QM QM 22 The RRE (1) portfolio was $962.7 million at December 31, 2023, representing 16% of the total loan portfolio. Our conservative underwriting policy focuses on high - quality mortgage originations with maximum Loan - to - Value (LTV) between 60% and 70%, maximum Debt - to - Income (DTI) of 43% and minimum FICO scores of 680. (1) RRE includes $1.9 million of Home Equity Line of Credit (HELOC) and $4.5 million in consumer loans (2) QM loans conform to the Ability - to - Repay (ATR) rules/requirements of CFPB (3) Non - QM loans do not conform to the CFPB Dodd - Frank Act (4) Jumbo Non - QM loan amounts exceed FHFA limits, but generally conform to the ATR/QM rules • 27.6% of the Residential Real Estate portfolio is fixed and 72.4% is variable. Of the variable mortgage portfolio, 84.8% is expected to reset after 12 months and 15.2% within the next 12 months • Total delinquencies are 0.09% of the residential portfolio, consisting of 0.05% within 30 - 59 and 0.03% in 60 - 89 days delinquency categories

Equipment Finance Portfolio Equipment finance portfolio represented $582.3 million or 9% of the loan portfolio at December 31, 2023. Transportation, 28% 12% Manufacturing, Wholesale Trade, 4% 37% 7% 8% Trucks Machine Tools Earth Moving Portfolio by Industry Portfolio by Equipment Portfolio by State 6% 4% 4% 3% Remaining = 45% 14% 5% 6% Trailers Software Healthcare, 4% 3% 4% 4% General Construction Construction, 15% 8% 9% 3% Printing 3% Medical/Dental Professional Services, 5% 3% 24% Waste Management, Material Handling 11% Other Other, (1) 21% 23 (1) Other includes retail trade, agriculture, and other services of 3%, 3%, and 3%, respectively

31% 31% 30% 33% 30% 29% 27% 34% 41% 45% 35% 69% 69% 70% 67% 70% 71% 73% 66% 59% 55% 65% $2,391 $2,872 $3,503 $3,608 $4,160 $4,461 $4,691 $5,560 $4,946 $5,950 $6,191 2013 2014 2015 2021 2022 2023 2016 2017 2018 Noninterest - bearing deposits 2019 2020 Interest - bearing deposits ($ in millions) Strong deposit growth reflecting a 10% CAGR since 2013. Average noninterest - bearing deposits have grown by 11% CAGR since 2013, and now represents 35% of total deposits. 24 Average Deposit Trend

1.70% 2.73% 3.25% 3.53% 3.83% 1Q23 2Q23 3Q23 Average Balance of Interest - bearing Deposits Interest - bearing Deposit Costs $3,487 $3,787 $3,966 $4,135 $4,174 4Q22 4Q23 Deposit Base Noninterest - bearing demand deposits represented 32% of total deposits at December 31, 2023. Estimated uninsured deposit liabilities were 40% of the total deposit liabilities. Brokered deposits remained low at 1% of the deposit base. Note: Numbers may not add due to rounding Deposits ($ in millions) Deposits (as of 4Q23) Average Interest - bearing Deposits ($ in millions) Business $3,245 52% Personal $3,036 48% ($ in millions) 41% 38% 35% 35% 32% 2% 2% 2% 1% 1% 25% 22% 25% 25% 28% 11% 17% 17% 16% 16% $6,28 $6,260 $6,316 $6,201 $6,168 23% 23% 21% 21% 21% 1 4Q22 1Q23 2Q23 3Q23 4Q23 Time <= $250K Money Market & Savings Demand Noninterest - bearing Time > $250K Demand Interest - bearing 25

Net Interest Income | Net Interest Margin Net interest income for the fourth quarter was $53.1 million and net interest margin (taxable equivalent) was 2.92%, both down from the previous quarter stemming from higher cost of interest - bearing deposits. $64.6 $57.9 $55.4 $54.9 $53.1 3.67% 3.28% 3.11% 3.03% 2.92% 4Q22 1Q23 2Q23 3Q23 4Q23 Net Interest Income NIM ($ in millions) 3.03% 2.92% 0.23% - 0.08% - 0.17% - 0.09% 3Q23 Loans Other earning assets IB - deposits FHLB Borrowings & other IB 4Q23 NIM Increase liabilities Decrease 26

Net Interest Income Sensitivity 24% of the loan portfolio reprices within 1 - 3 months. $320.2 $407.4 $560.0 $1,392.3 $343.1 $1,406.9 $338.1 $298.6 $414.8 $498.3 $1,509.6 $658.3 $517.5 $110.1 $858.6 $1,807.1 $841.4 $102.7 1 - 3 Months 4 - 12 Months 1 - 2 Years 2 - 3 Years 3 - 5 Years >5 Years Fixed Variable Loans – Months to Reset / Maturity (1) ($ . in millions) Fed Funds Rate & Cost of CDs $75.0 $75.1 $15.0 $13.2 $710.7 $405.1 $490.1 $655.0 $785.7 $480.2 $505.1 $668.2 4.27% 4.45% 4.75% 4.72% 1Q24 4Q24 2Q24 Wholesale 3Q24 Retail ($ in millions) 1Q23 2Q23 3Q23 Deposits – CD Maturities 4.50% 5.00% 5.25% 5.50% 5.50% 2.17% 3.31% 3.70% 3.95% 4.24% 4Q22 4Q23 Fed Funds Rate (3) Cost of CDs (2) Cost of CDs (4) Numbers may not add due to rounding (1) Includes loans held for sale; numbers may not add due to rounding (2) Cost of CDs and interest bearing - deposits for the month of December 2023 was 4.40% and 3.97%, respectively (3) Fed funds rate represent the rate at the end of the quarter (4) Represent weighted average contractual rates 27

$2.4 45% $1.2 23% $0.8 15% $0.9 17% Service charges on deposit accounts Trade finance and other service charges and fees Servicing income All other operating income Noninterest Income SBA 7(a) Loan Production and Sales ($ in millions) $53.2 $34.5 $30.9 $36.1 $48.4 $40.9 $29.7 $19.9 $21.0 $29.9 5.99% 7.85% 7.75% 6.84% 6.17% 4Q22 1Q23 2Q23 SBA Loan Sales SBA Production 3Q23 4Q23 SBA Trade Premium Noninterest income for the fourth quarter was $6.7 million, down 40% from the previous quarter primarily due to the third quarter benefitting from a $4.0 million gain on a branch sale - and - leaseback. Noninterest Income 4Q23 Service Charges and Fees ($ in millions) ($ in millions) $5.5 $6.5 $6.7 $10.0 $5.3 $1.9 $1.9 $1.2 $1.4 $7.5 $8.3 $11.2 $1.2 $6.7 4Q22 1Q23 2Q23 3Q23 4Q23 Service charges, fees & other Securities transactions Gain on sale of SBA loans Legal settlements ($1.9) 28 $7.9 $1.9 (1) Numbers may not add due to rounding (1) Includes $4.0 million gain on the sale - and - leaseback of bank premises
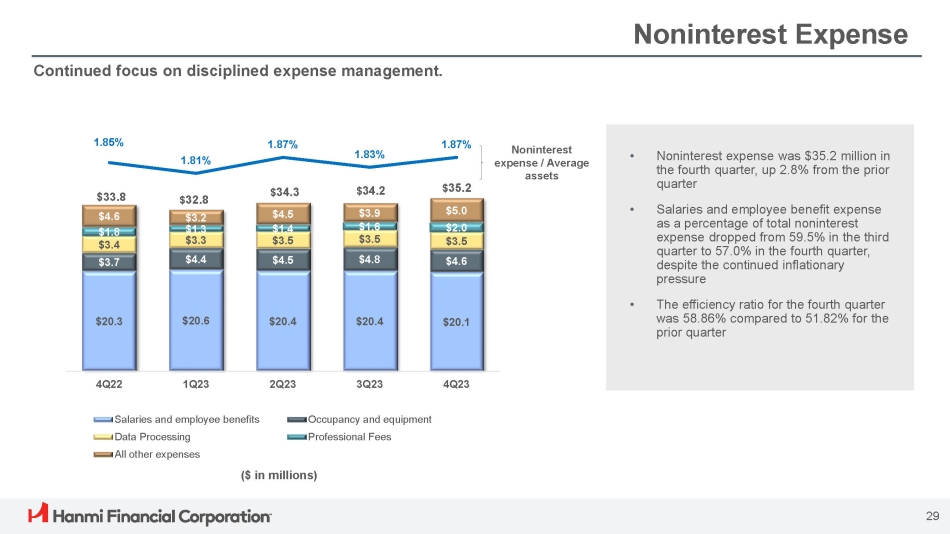
Noninterest Expense • Noninterest expense was $ 35 . 2 million in the fourth quarter, up 2 . 8 % from the prior quarter • Salaries and employee benefit expense as a percentage of total noninterest expense dropped from 59.5% in the third quarter to 57.0% in the fourth quarter, despite the continued inflationary pressure • The efficiency ratio for the fourth quarter was 58 . 86 % compared to 51 . 82 % for the prior quarter Continued focus on disciplined expense management. ($ in millions) Noninterest expense / Average assets $20.3 $2.0 $1.6 $1.4 $1.3 $3.5 $3.5 $3.5 $3.3 $4.6 $4.8 $4.5 $4.4 $20.1 $20.4 $20.4 $20.6 $ 32.8 $3.2 $33.8 $4.6 $1.8 $3.4 $3.7 $ 34.3 $4.5 $ 34.2 $3.9 $ 35.2 $5.0 1.85% 1.81% 1.87% 1.83% 1.87% 2Q23 3Q23 4Q23 Occupancy and equipment Professional Fees 4Q22 1Q23 Salaries and employee benefits Data Processing All other expenses Noninterest expense/Average assets 29

Pretax, Pre - Provision Income (PTPP) (1) • Pretax, pre - provision income was $ 24 . 6 million for the fourth quarter, down 22 . 7 % from the prior quarter and down 35 . 5 % from the same quarter last year • PTPP over average assets for 4Q23 was 1.31% compared with 1.70% for the prior quarter $38.2 $33.4 $29.1 $27.8 $24.6 $4.0 $38.2 $33.4 $29.1 $31.8 $24.6 2.09% 1.84% 1.58% 1.70% 1.31% 1.49% 2Q23 4Q22 1Q23 Gain on sale of Bank premise 3Q23 4Q23 Pretax, pre - provision income PTPP / Average assets (1) 30 ($ in millions) (1) Refer to PTPP schedule in appendix (1)

Asset Quality – Delinquent & Criticized Loans Delinquent loans / Total loans $46.2 $47.3 $38.8 $33.1 $31.4 $79.0 $64.3 $44.6 $76.5 $65.3 $125.2 $111.6 $83.5 $109.6 $96.7 2.10% 1.87% 1.40% 1.82% 1.56% 4Q22 1Q23 2Q23 3Q23 4Q23 Classified Special Mention Delinquent Loans (1) Criticized Loans Criticized loans / Total loans Asset quality remains strong. $7.1 $7.0 $6.9 $8.0 $8.3 $6.7 $7.5 $1.3 $6.2 $15.4 $13.7 $9.5 $2.6 $10.3 $2.3 0.13% 0.26% 0.23% 0.16% 0.17% 4Q22 1Q23 2Q23 Equipment Finance Delinquent Loans 3Q23 4Q23 All Other Delinquent Loans ($ in millions) 31 ($ in millions) (1) Represents loans 30 to 89 days past due and still accruing

$9.8 $20.1 $22.2 $15.8 $15.5 $0.1 $0.1 $0.1 $0.1 $0.1 $10.0 $20.2 $22.3 $15.9 $15.6 3Q23 4Q23 4Q22 1Q23 2Q23 Nonperforming loans Note: Numbers may not add due to rounding OREO Asset Quality – Nonperforming Assets & Nonaccrual Loans 0.14% 0.27% 0.30% 0.22% 0.21% Nonperforming assets / Total assets Nonperforming Assets (1) Nonaccrual Loans Nonperforming assets were $15.6 million at the end of the fourth quarter, down from $15.9 million at the end of the third quarter. ($ in millions) ($ in millions) (1) Nonperforming assets exclude repossessed personal property of $0.5 million, $0.6 million, $0.8 million, $1.3 million, and $1.3 million for December 31, 2022, March 31, 2023, June 30, 2023, September 30, 2023, and December 31, 2023 respectively (2) Specific allowance for credit losses at December 31, 2022, March 31, 2023, June 30, 2023, September 30, 2023, and December 31, 2023 was $3.3 million, $6.2 million, $7.4 million, $2.9 million, and $3.4 million respectively (3) RRE includes consumer loans $5.7 $6.7 $6.9 $7.9 $7.3 $3.6 $0.5 $2.9 $0.5 $5.3 $3.0 $3.3 $10.0 $4.9 $4.9 (2) $9.8 (2) $22.2 2Q23 3Q23 (3) (2) $20.1 (2) $15.5 (2) $15.8 4Q23 RRE 4Q22 1Q23 Equipment Finance All other CRE and C&I < $3M All other CRE and C&I >= $3M 32 $10.0

Asset Quality – Gross & Net Loan Charge - offs Gross Charge - offs Net Charge - offs Net Charge - offs / Average loans Net charge - offs for the fourth quarter reflected $6.2 million in recoveries, primarily stemming from $6.1 million in recovery from a 2019 troubled loan relationship. ($ in millions) ($ in millions) $1.6 $2.6 $2.8 $1.8 $0.6 $6.6 $1.2 $0.4 $0.8 $2.2 $2.7 $0.1 $9.4 $1.8 4Q22 1Q23 2Q23 Equipment Finance Charge - offs 3Q23 4Q23 All Other Loan Charge - offs Note: Numbers may not add due to rounding $2.5 $1.2 ($0.3) $2.3 ($0.6) $6.4 ($6.2) $0.3 $0.6 $1.5 $0.4 $1.1 $1.7 $8.9 ($5.0) 4Q23 0.02% 0.10% 0.12% 0.60% - 0.33% 3Q23 4Q22 1Q23 2Q23 Equipment Finance Net Charge - offs All Other Net Charge - offs 33

ACL Trends Allowance for credit losses was $69.5 million as of December 31, 2023, generating an allowance for credit losses to loans of 1.12% consistent with the prior quarter. $71.5 $72.2 $71.0 $67.3 $69.5 1.20% 1.21% 1.19% 1.12% 1.12% 4Q22 1Q23 2Q23 3Q23 4Q23 Allowance for credit losses ACL to Loans ($0.1) $0.1 $2.1 ($2.9) 4Q23 $5.2 4Q22 1Q23 2Q23 3Q23 Credit loss recovery Credit loss expense Allowance for Credit Losses Credit Loss Expense (Recovery) 34 ($ in millions) ($ in millions)

ACL Analysis by Loan Type December 31, 2022 March 31, 2023 June 30, 2023 September 30, 2023 December 31, 2023 ($ in millions) Loans Allowance Loans Allowance Loans Allowance Loans Allowance Loans Allowance $ 3,833.4 $ 40.6 $ 3,784.2 $ 39.2 $ 3,738.3 $ 38.4 $ 3,773.0 $ 38.9 $ 3,889.7 $ 40.2 CRE 804.5 15.3 778.1 15.3 753.5 16.0 728.8 11.2 747.8 10.3 C&I 594.8 12.2 600.2 13.4 586.4 11.9 592.7 12.3 582.2 13.7 Equipment Finance 734.5 3.4 817.9 4.3 887.0 4.7 926.3 4.9 962.7 5.3 RRE & Consumer $ 5,967.1 $ 71.5 $ 5,980.5 $ 72.2 $ 5,965.2 $ 71.0 $ 6,020.8 $ 67.3 $ 6,182.4 $ 69.5 Total Note: Numbers may not add due to rounding 35
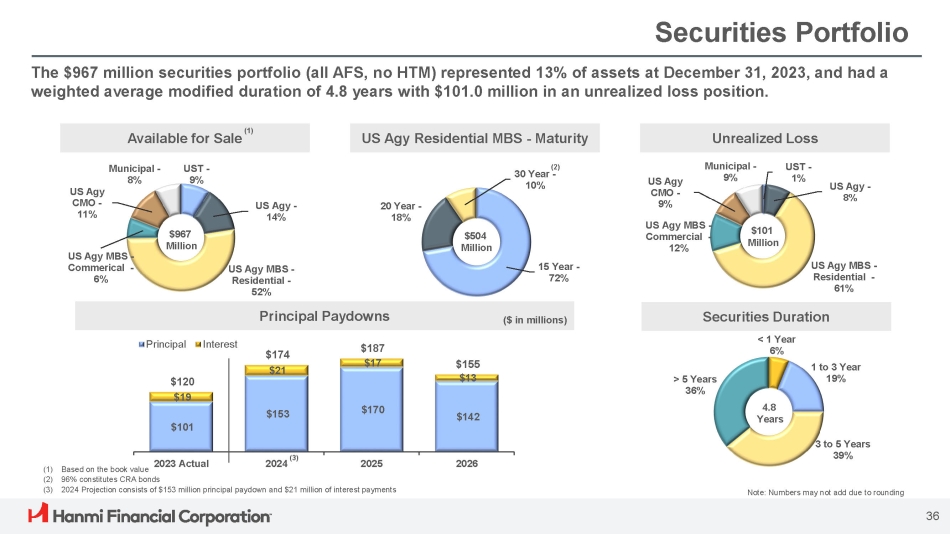
US Agy Residential MBS - Maturity 15 Year - 72% 20 Year - 18% 30 Year - 10% Securities Portfolio The $967 million securities portfolio (all AFS, no HTM) represented 13% of assets at December 31, 2023, and had a weighted average modified duration of 4.8 years with $101.0 million in an unrealized loss position. Principal Paydowns ($ in millions) $101 $153 $170 $142 $120 $19 $174 $21 $187 $17 $155 $13 2025 2026 Principal Interest Unrealized Loss UST - 1% US Agy - 8% US Agy MBS - Residential - 61% US Agy MBS - Commercial - 12% US Agy CMO - 9% Municipal - 9% Available for Sale UST - 9% US Agy - 14% US Agy MBS - Residential - 52% US Agy MBS - Commerical - 6% US Agy CMO - 11 % Municipal - 8% $967 Million Securities Duration < 1 Year 6% 1 to 3 Year 19% 3 to 5 Years 39% > 5 Years 36% 4.8 Years $504 Million $101 Million (1) Based on the book value 2023 Actual (3) 2024 Projection consists of $153 million principal paydown and $21 million of interest payments Note: Numbers may not add due to rounding 36 (2) 96% constitutes CRA bonds 2024 (3) (2) (1)
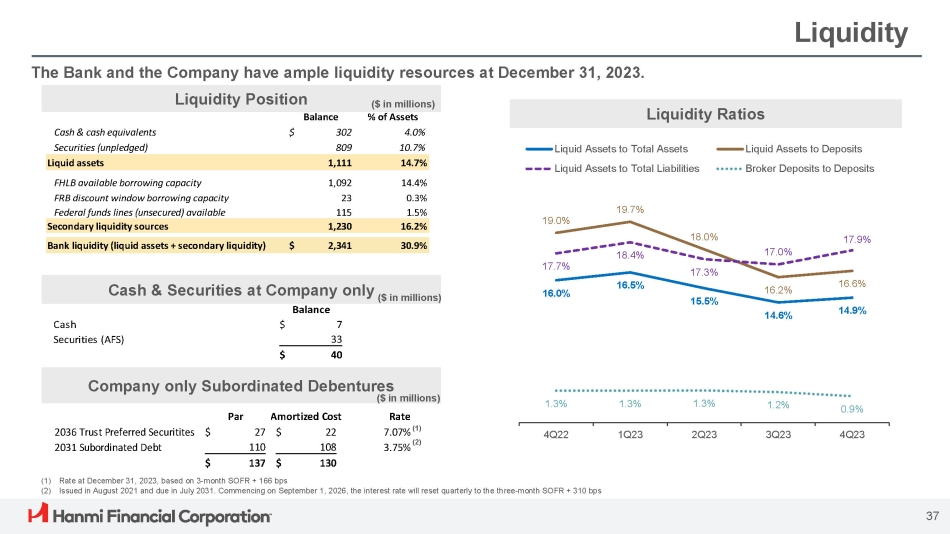
4.0% $ 302 Cash & cash equivalents Liquid Assets to Deposits Liquid Assets to Total Assets 10.7% 809 Securities (unpledged) Broker Deposits to Deposits Liquid Assets to Total Liabilities 14.7% 1,111 Liquid assets 14.4% 1,092 FHLB available borrowing capacity 0.3% 23 FRB discount window borrowing capacity 1.5% 115 Federal funds lines (unsecured) available 16.2% 1,230 Secondary liquidity sources 30.9% $ 2,341 Bank liquidity (liquid assets + secondary liquidity) Balance % of Assets Liquidity The Bank and the Company have ample liquidity resources at December 31, 2023. (1) Rate at December 31, 2023, based on 3 - month SOFR + 166 bps (2) Issued in August 2021 and due in July 2031. Commencing on September 1, 2026, the interest rate will reset quarterly to the three - month SOFR + 310 bps Liquidity Position ($ in millions) 16.0% 16.5% 15.5% 14.6% 14.9% 19.7% 19.0% 18.0% 16.2% 16.6% 17.7% 18.4% 17.3% 17.0% 17.9% 1.3% 1.3% 1.3% 1.2% 0.9% 4Q22 1Q23 2Q23 3Q23 4Q23 Liquidity Ratios 37 Par Amortized Cost 2036 Trust Preferred Securitites $ 27 $ 22 Rate 7.07% (1) (2) 3.75% 108 110 2031 Subordinated Debt $ 130 $ 137 Company only Subordinated Debentures ($ in millions) Cash & Securities at Company only ($ in millions) Balance Cash $ 7 Securities (AFS) 33 $ 40

(1) Non - GAAP financial measure, refer to the non - GAAP reconciliation slides (2) Rate at the end of the quarter Capital Management Tangible book value per share (TBVPS) ( 1 ) increased to $ 22 . 75 from $ 21 . 45 at the end of the prior quarter . The increase reflects a $ 27 . 3 million decrease in the unrealized after - tax loss on AFS, and $ 11 . 0 million increase in net income, net of cash dividends paid . 4.00% 3.57% 4.16% 4.61% 5 - YR 3.85% ($88.7) ($79.1) ($84.6) ($99.4) ($71.9) 4Q22 1Q23 2Q23 3Q23 4Q23 AOCI $20.54 $21.30 $21.56 $21.45 $22.75 8.50% 8.77% 8.96% 8.89% 9.14% 4Q22 1Q23 2Q23 3Q23 4Q23 (1) TBVPS TBVPS (1) & TCE/TA (1) AOCI & 5 - YR TSY TSY (2) TCE / TA ($ in millions) (1) 38

Regulatory Capital The Company exceeds regulatory minimums and the Bank remains well capitalized at December 31, 2023. 8.00% 6.00% 4.50% 2.50% 2.50% 2.50% 14.95% 12.20% 11.86% 13.85% 11.10% 10.75% 10.50% 8.50% 7.00% Minimum Requirement Company Capital Conservation Buffer (1) Pro Forma 10.00% 8.00% 6.50% 14.27% 13.26% 13.26% 13.17% 12.16% 12.16% Well Capitalized Bank Pro Forma 39 CET1 Capital Tier 1 Capital Total Capital Company Bank CET1 Capital Tier 1 Capital Total Capital (1) Pro forma illustrates capital ratios with unrealized loses at December 31, 2023. Non - GAAP financial measure; refer to the non - GAAP reconciliation slide (1)
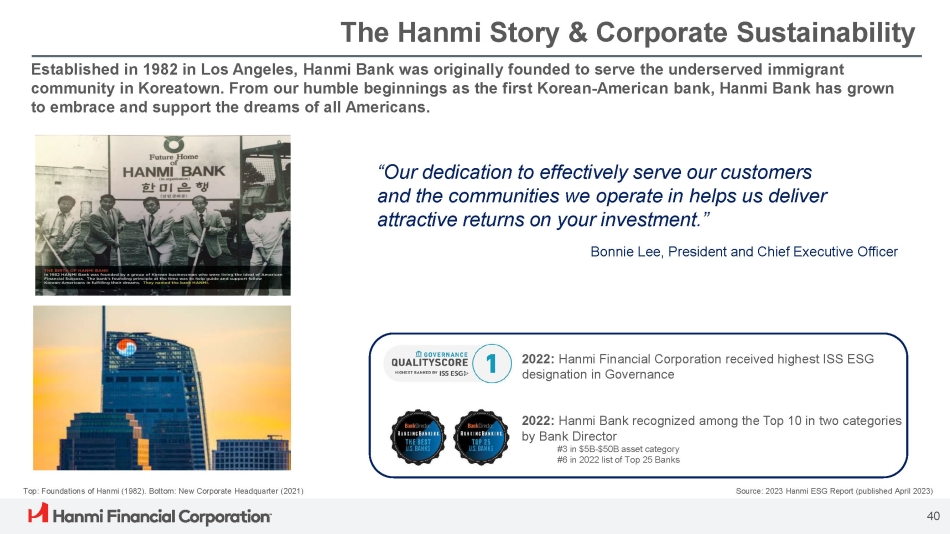
The Hanmi Story & Corporate Sustainability Established in 1982 in Los Angeles, Hanmi Bank was originally founded to serve the underserved immigrant community in Koreatown. From our humble beginnings as the first Korean - American bank, Hanmi Bank has grown to embrace and support the dreams of all Americans. “Our dedication to effectively serve our customers and the communities we operate in helps us deliver attractive returns on your investment.” Bonnie Lee, President and Chief Executive Officer 2022: Hanmi Financial Corporation received highest ISS ESG designation in Governance Top: Foundations of Hanmi (1982). Bottom: New Corporate Headquarter (2021) Source: 2023 Hanmi ESG Report (published April 2023) 40 2022: Hanmi Bank recognized among the Top 10 in two categories by Bank Director #3 in $5B - $50B asset category #6 in 2022 list of Top 25 Banks

The board recognizes that sustainability broadly encompasses corporate activities that enhance the long - term value of the Company. Corporate Sustainability (1 of 3) Donated 40 solar panels to the Koreatown Senior and Community Center in Los Angeles. Source: 2023 Hanmi ESG Report (published April 2023) 41 Sustainability Enterprise Risk Management Committee (ERMC) In 2021, Hanmi Financial Corporation moved its headquarters to the Wilshire Grand Center, a LEED certified space furthering environmentally sustainable practices in Downtown Los Angeles. • The Bank’s Enterprise Risk Management Committee (ERMC) is a forum for management to engage in a collaborative discussion on the evolving risk positions of the bank, emerging risks, control gaps and mitigation strategies • The ERMC reviews ten risk pillars, including credit risk, in which management has begun discussions regarding climate risk to our loan portfolio

As a community bank, we are an equal opportunity employer and we are proud to work with our communities to build a stronger future for all of our stakeholders. Corporate Sustainability (2 of 3) Source: 2023 Hanmi ESG Report (published April 2023) Fostering Human Capital 68% Female Workforce 91% Ethnically Diverse Workforce 60% Female Managers 43% Current staff have been with us at least 5 years 13% Workforce promotions via Annual Review Hanmi Bank Dream Scholarship Provided Almost $1M in Scholarships Assisting 426 at - risk Students Across 12 States Serving Our Communities $7.5M Long - term commitment to a Community Reinvestment Act fund 289 Small business and community development loans Financial Wellness $380M Originated for small businesses and community development $300K+ Donated to non - profit partners Partnered with HoneyBee to provide financial wellness programs and Choice Checking account to meet the needs of the unbanked and underbanked. 42 (1) (1) Launched in 2016, the Hanmi Bank Dream Scholarship for At - Risk Youth Program provides educational support to at - risk students

Governance and management of environmental and social impact create long - term value for our stakeholders. Corporate Sustainability (3 of 3) Source: 2023 Proxy Statement, 2023 Hanmi ESG Report (published April 2023) Oversight Diverse Board Members Our Board Shareholder Engagement • Annual shareholder engagement program to discuss executive compensation and governance practices • Ethics Hotline that allows for confidential reporting of any suspected concerns or improper conduct The NCG Committee believes the Board should encompass a broad range of talent, skill, knowledge, experience, diversity, and expertise. Hanmi is committed to sound corporate governance principles and maintains formal Corporate Governance Guidelines and a Code of Business Conduct and Ethics for employees, executive officers, and directors. 70% Board Members Ethnically Diverse 43 30% Board Members Female 90% Board Members Independent Nominating and Corporate Governance (NCG) Committee NCG Committee identifies individuals qualified to become directors, and has oversight over corporate governance principles applicable to Hanmi. ESG sub - committee, within NCG Committee, has the primary oversight of corporate citizenship and ESG - related matters. The NCG Committee held 4 meetings in 2022. Risk, Compliance and Planning (RCP) Committee The RCP Committee provides oversight of the enterprise risk management framework, and also oversees the strategic planning and the budgetary function. The RCP Committee held 8 meetings in 2022. Audit Committee The Audit Committee is responsible for overseeing and monitoring financial accounting and reporting, the system of internal controls established by management, and our audit process and policies. The Audit Committee held 12 meetings in 2022. Compensation and Human Resources (CHR) Committee The CHR Committee oversees the compensation of Hanmi’s executive officers and administers Hanmi’s compensation plans . The CHR Committee held 9 meetings in 2022 .

Appendix 44

4Q23 Financial Summary Note: numbers may not add due to rounding (1) Percentage change calculated from dollars in thousands; change in basis points for profitability metrics (2) Non - GAAP financial measure, refer to the non - GAAP reconciliation slide $ 0.93 $ 0.62 $ 0.61 EPS - Diluted ($ in millions, except EPS) Change (1) December 31, 2023 September 30, 2023 December 31, 2022 Q/Q Y/Y Income Statement Summary - 17.7% - 3.1% $ 64.6 $ 54.9 $ 53.1 Net interest income - 10.4% - 40.5% 7.5 11.2 6.7 Noninterest income - 16.9% - 9.5% 72.0 66.1 59.8 Operating revenue 4.0% 2.8% 33.8 34.2 35.2 Noninterest expense - 5619.2% - 155.7% 0.1 5.2 (2.9) Credit loss (recovery) expense - 27.9% 3.0% 38.1 26.7 27.5 Pretax income - 8.3% 12.1% 9.6 7.9 8.8 Income tax expense - 34.6% - 0.9% $ 28.5 $ 18.8 $ 18.6 Net income Selected balance sheet items 3.6% 2.7% $ 5,967 $ 6,021 $ 6,182 Loans receivable 1.8% 0.3% 6,168 6,260 6,281 Deposits 2.6% 3.0% 7,378 7,350 7,570 Total assets 10.1% 5.8% $ 638 $ 663 $ 702 Stockholders' equity Profitability Metrics (57) (1) 1.56% 1.00% 0.99% Return on average assets (620) (18) 15.90% 9.88% 9.70% Return on average equity 64 25 8.50% 8.89% 9.14% TCE/TA (2) (75) (11) 3.67% 3.03% 2.92% Net interest margin 1,187 704 46.99% 51.82% 58.86% Efficiency ratio 45

Pretax, Pre - Provision Income (PTPP) Schedule Note: numbers may not add due to rounding March 31, 2023 December 31, 2023 $ 7,475.2 7,367.2 June 30, 2023 $ 7,382.0 $ December 31, 2022 $ 7,252.2 $ 57.9 $ September 30, 2023 $ 7,434.7 53.1 $ 54.9 $ 6.7 11.2 55.4 $ 7.9 8.3 64.6 7.5 35.2 $ 24.6 34.2 $ 31.8 34.3 $ 29.1 32.8 $ 33.4 33.8 $ 38.2 $ 6.7 $ 11.2 - (4.0 ) $ 6.7 $ 7.2 $ 7.9 $ 8.3 $ 7.5 - - - $ 7.9 $ 8.3 $ 7.5 $ 24.6 - $ 24.6 $ 31.8 (4.0 ) $ 27.8 $ 29.1 - $ 29.1 $ 33.4 - $ 33.4 $ 38.2 - $ 38.2 1.70% 1.84% ($ in millions) Average assets Net interest revenue Noninterest income Noninterest expense PTPP Noninterest income less gain on a branch sale - and - leaseback Adjusted noninterest income PTPP less gain on a branch sale - and - leaseback Adjusted PTPP PTPP/Average assets Adjusted PTPP/Average assets 1.31% 1.31% 1.49% 1.58% 1.58% 1.84% 2.09% 2.09% 46

Non - GAAP Reconciliation: Tangible Common Equity to Tangible Asset Ratio 47 (1) There were no preferred shares outstanding at the periods indicated December 31, March 31, June 30, September 30, December 31, 2022 2023 2023 2023 2023 Hanmi Financial Corporation $ 7,378,262 $ 7,434,130 $ 7,344,924 $ 7,350,140 $ 7,570,341 Assets (11,225) (11,193) (11,162) (11,131) (11,099) Less goodwill and other intangible assets $ 7,367,037 $ 7,422,937 $ 7,333,762 $ 7,339,009 $ 7,559,242 Tangible assets $ 637,515 $ 662,165 $ 668,560 $ 663,359 $ 701,891 Stockholders' equity (1) (11,225) (11,193) (11,162) (11,131) (11,099) Less goodwill and other intangible assets $ 626,290 $ 650,972 $ 657,398 $ 652,228 $ 690,792 Tangible stockholders' equity (1) 8.64% 8.91% 9.10% 9.03% 9.27% Stockholders' equity to assets 8.50% 8.77% 8.96% 8.89% 9.14% Tangible common equity to tangible assets (1) 30,485,621 30,555,287 30,485,788 30,410,582 30,368,655 Common shares outstanding $ 20.54 $ 21.30 $ 21.56 $ 21.45 $ 22.75 Tangible common equity per common share ($ in thousands, except per share data)

Non - GAAP Reconciliation: Pro Forma Regulatory Capital 48 Note: numbers may not add due to rounding Bank Company ($ in thousands) Total Risk - based Tier 1 Common Equity Tier 1 Total Risk - based Tier 1 Common Equity Tier 1 $ 904,153 $ 840,046 $ 840,046 $ 947,285 $ 773,178 $ 751,515 Regulatory capital (71,924) (71,924) (71,924) (71,928) (71,928) (71,928) Unrealized losses on AFS securities $ 832,229 $ 768,122 $ 768,122 $ 875,357 $ 701,250 $ 679,587 Adjusted regulatory capital $ 6,334,263 $ 6,334,263 $ 6,334,263 $ 6,336,136 $ 6,336,136 $ 6,336,136 Risk weighted assets (17,254) (17,254) (17,254) (16,677) (16,677) (16,677) Risk weighted assets impact of unrealized losses on AFS securities $ 6,317,009 $ 6,317,009 $ 6,317,009 $ 6,319,459 $ 6,319,459 $ 6,319,459 Adjusted Risk weighted assets 14.27% 13.26% 13.26% 14.95% 12.20% 11.86% Regulatory capital ratio as reported - 1.10% - 1.10% - 1.10% - 1.10% - 1.11% - 1.11% Impact of unrealized losses on AFS securities 13.17% 12.16% 12.16% 13.85% 11.10% 10.75% Pro forma regulatory capital ratio
v3.24.0.1
| X |
- DefinitionBoolean flag that is true when the XBRL content amends previously-filed or accepted submission.
| Name: |
dei_AmendmentFlag |
| Namespace Prefix: |
dei_ |
| Data Type: |
xbrli:booleanItemType |
| Balance Type: |
na |
| Period Type: |
duration |
|
| X |
- DefinitionFor the EDGAR submission types of Form 8-K: the date of the report, the date of the earliest event reported; for the EDGAR submission types of Form N-1A: the filing date; for all other submission types: the end of the reporting or transition period. The format of the date is YYYY-MM-DD.
| Name: |
dei_DocumentPeriodEndDate |
| Namespace Prefix: |
dei_ |
| Data Type: |
xbrli:dateItemType |
| Balance Type: |
na |
| Period Type: |
duration |
|
| X |
- DefinitionThe type of document being provided (such as 10-K, 10-Q, 485BPOS, etc). The document type is limited to the same value as the supporting SEC submission type, or the word 'Other'.
| Name: |
dei_DocumentType |
| Namespace Prefix: |
dei_ |
| Data Type: |
dei:submissionTypeItemType |
| Balance Type: |
na |
| Period Type: |
duration |
|
| X |
- DefinitionAddress Line 1 such as Attn, Building Name, Street Name
| Name: |
dei_EntityAddressAddressLine1 |
| Namespace Prefix: |
dei_ |
| Data Type: |
xbrli:normalizedStringItemType |
| Balance Type: |
na |
| Period Type: |
duration |
|
| X |
- DefinitionAddress Line 2 such as Street or Suite number
| Name: |
dei_EntityAddressAddressLine2 |
| Namespace Prefix: |
dei_ |
| Data Type: |
xbrli:normalizedStringItemType |
| Balance Type: |
na |
| Period Type: |
duration |
|
| X |
- Definition
+ References
+ Details
| Name: |
dei_EntityAddressCityOrTown |
| Namespace Prefix: |
dei_ |
| Data Type: |
xbrli:normalizedStringItemType |
| Balance Type: |
na |
| Period Type: |
duration |
|
| X |
- DefinitionCode for the postal or zip code
| Name: |
dei_EntityAddressPostalZipCode |
| Namespace Prefix: |
dei_ |
| Data Type: |
xbrli:normalizedStringItemType |
| Balance Type: |
na |
| Period Type: |
duration |
|
| X |
- DefinitionName of the state or province.
| Name: |
dei_EntityAddressStateOrProvince |
| Namespace Prefix: |
dei_ |
| Data Type: |
dei:stateOrProvinceItemType |
| Balance Type: |
na |
| Period Type: |
duration |
|
| X |
- DefinitionA unique 10-digit SEC-issued value to identify entities that have filed disclosures with the SEC. It is commonly abbreviated as CIK. Reference 1: http://www.xbrl.org/2003/role/presentationRef
-Publisher SEC
-Name Exchange Act
-Number 240
-Section 12
-Subsection b-2
| Name: |
dei_EntityCentralIndexKey |
| Namespace Prefix: |
dei_ |
| Data Type: |
dei:centralIndexKeyItemType |
| Balance Type: |
na |
| Period Type: |
duration |
|
| X |
- DefinitionIndicate if registrant meets the emerging growth company criteria. Reference 1: http://www.xbrl.org/2003/role/presentationRef
-Publisher SEC
-Name Exchange Act
-Number 240
-Section 12
-Subsection b-2
| Name: |
dei_EntityEmergingGrowthCompany |
| Namespace Prefix: |
dei_ |
| Data Type: |
xbrli:booleanItemType |
| Balance Type: |
na |
| Period Type: |
duration |
|
| X |
- DefinitionCommission file number. The field allows up to 17 characters. The prefix may contain 1-3 digits, the sequence number may contain 1-8 digits, the optional suffix may contain 1-4 characters, and the fields are separated with a hyphen.
| Name: |
dei_EntityFileNumber |
| Namespace Prefix: |
dei_ |
| Data Type: |
dei:fileNumberItemType |
| Balance Type: |
na |
| Period Type: |
duration |
|
| X |
- DefinitionTwo-character EDGAR code representing the state or country of incorporation.
| Name: |
dei_EntityIncorporationStateCountryCode |
| Namespace Prefix: |
dei_ |
| Data Type: |
dei:edgarStateCountryItemType |
| Balance Type: |
na |
| Period Type: |
duration |
|
| X |
- DefinitionThe exact name of the entity filing the report as specified in its charter, which is required by forms filed with the SEC. Reference 1: http://www.xbrl.org/2003/role/presentationRef
-Publisher SEC
-Name Exchange Act
-Number 240
-Section 12
-Subsection b-2
| Name: |
dei_EntityRegistrantName |
| Namespace Prefix: |
dei_ |
| Data Type: |
xbrli:normalizedStringItemType |
| Balance Type: |
na |
| Period Type: |
duration |
|
| X |
- DefinitionThe Tax Identification Number (TIN), also known as an Employer Identification Number (EIN), is a unique 9-digit value assigned by the IRS. Reference 1: http://www.xbrl.org/2003/role/presentationRef
-Publisher SEC
-Name Exchange Act
-Number 240
-Section 12
-Subsection b-2
| Name: |
dei_EntityTaxIdentificationNumber |
| Namespace Prefix: |
dei_ |
| Data Type: |
dei:employerIdItemType |
| Balance Type: |
na |
| Period Type: |
duration |
|
| X |
- DefinitionLocal phone number for entity.
| Name: |
dei_LocalPhoneNumber |
| Namespace Prefix: |
dei_ |
| Data Type: |
xbrli:normalizedStringItemType |
| Balance Type: |
na |
| Period Type: |
duration |
|
| X |
- DefinitionBoolean flag that is true when the Form 8-K filing is intended to satisfy the filing obligation of the registrant as pre-commencement communications pursuant to Rule 13e-4(c) under the Exchange Act. Reference 1: http://www.xbrl.org/2003/role/presentationRef
-Publisher SEC
-Name Exchange Act
-Number 240
-Section 13e
-Subsection 4c
| Name: |
dei_PreCommencementIssuerTenderOffer |
| Namespace Prefix: |
dei_ |
| Data Type: |
xbrli:booleanItemType |
| Balance Type: |
na |
| Period Type: |
duration |
|
| X |
- DefinitionBoolean flag that is true when the Form 8-K filing is intended to satisfy the filing obligation of the registrant as pre-commencement communications pursuant to Rule 14d-2(b) under the Exchange Act. Reference 1: http://www.xbrl.org/2003/role/presentationRef
-Publisher SEC
-Name Exchange Act
-Number 240
-Section 14d
-Subsection 2b
| Name: |
dei_PreCommencementTenderOffer |
| Namespace Prefix: |
dei_ |
| Data Type: |
xbrli:booleanItemType |
| Balance Type: |
na |
| Period Type: |
duration |
|
| X |
- DefinitionTitle of a 12(b) registered security. Reference 1: http://www.xbrl.org/2003/role/presentationRef
-Publisher SEC
-Name Exchange Act
-Number 240
-Section 12
-Subsection b
| Name: |
dei_Security12bTitle |
| Namespace Prefix: |
dei_ |
| Data Type: |
dei:securityTitleItemType |
| Balance Type: |
na |
| Period Type: |
duration |
|
| X |
- DefinitionName of the Exchange on which a security is registered. Reference 1: http://www.xbrl.org/2003/role/presentationRef
-Publisher SEC
-Name Exchange Act
-Number 240
-Section 12
-Subsection d1-1
| Name: |
dei_SecurityExchangeName |
| Namespace Prefix: |
dei_ |
| Data Type: |
dei:edgarExchangeCodeItemType |
| Balance Type: |
na |
| Period Type: |
duration |
|
| X |
- DefinitionBoolean flag that is true when the Form 8-K filing is intended to satisfy the filing obligation of the registrant as soliciting material pursuant to Rule 14a-12 under the Exchange Act. Reference 1: http://www.xbrl.org/2003/role/presentationRef
-Publisher SEC
-Name Exchange Act
-Section 14a
-Number 240
-Subsection 12
| Name: |
dei_SolicitingMaterial |
| Namespace Prefix: |
dei_ |
| Data Type: |
xbrli:booleanItemType |
| Balance Type: |
na |
| Period Type: |
duration |
|
| X |
- DefinitionTrading symbol of an instrument as listed on an exchange.
| Name: |
dei_TradingSymbol |
| Namespace Prefix: |
dei_ |
| Data Type: |
dei:tradingSymbolItemType |
| Balance Type: |
na |
| Period Type: |
duration |
|
| X |
- DefinitionBoolean flag that is true when the Form 8-K filing is intended to satisfy the filing obligation of the registrant as written communications pursuant to Rule 425 under the Securities Act. Reference 1: http://www.xbrl.org/2003/role/presentationRef
-Publisher SEC
-Name Securities Act
-Number 230
-Section 425
| Name: |
dei_WrittenCommunications |
| Namespace Prefix: |
dei_ |
| Data Type: |
xbrli:booleanItemType |
| Balance Type: |
na |
| Period Type: |
duration |
|
Hanmi Financial (NASDAQ:HAFC)
Historical Stock Chart
From Mar 2024 to Apr 2024

Hanmi Financial (NASDAQ:HAFC)
Historical Stock Chart
From Apr 2023 to Apr 2024
