UNITED STATES
SECURITIES AND EXCHANGE COMMISSION
Washington,
D.C. 20549
Form 6-K
Report of Foreign Private Issuer Pursuant to Rule 13a-16 or 15d-16 under the Securities Exchange
Act of 1934
For the month of February 2024
Commission File Number: 001-11444
MAGNA INTERNATIONAL INC.
(Exact Name of Registrant as specified in its Charter)
337 Magna Drive, Aurora, Ontario, CANADA
L4G 7K1
(Address of principal executive office)
Indicate by check mark whether the registrant files or will file annual reports under cover of Form 20-F or Form 40-F.
Form 20-F ☐ Form 40-F ☒
SIGNATURES
Pursuant to the requirements of the Securities Exchange Act of 1934, the registrant has duly caused this report to be signed on its
behalf by the undersigned, thereunto duly authorized.
| |
MAGNA INTERNATIONAL INC. |
| |
(Registrant) |
| |
|
|
| |
|
| Date: February 9, 2024 |
By: |
/s/ "Bassem Shakeel" |
| |
|
Bassem A. Shakeel, |
| |
|
Vice-President, Associate General Counsel and Corporate Secretary |
| |
|
|
EXHIBITS
EXHIBIT 99.1
 |
PRESS RELEASE |
Magna Announces Fourth Quarter 2023 Results and 2024 Outlook
Fourth Quarter 2023 Highlights
- Sales increased 9% to $10.5 billion, compared to 7% increase in global light vehicle production
- Sales increased 4% excluding foreign currency translation and acquisitions net of divestitures
- Diluted earnings per share and Adjusted diluted earnings per share increased to $0.94 and $1.33, respectively,
compared to $0.33 and $0.94 last year
- Paid $133 million in dividends
- Raised quarterly cash dividend to $0.475 per share
2024 Outlook Highlights
- Sales expected to continue to outgrow global light vehicle production through outlook period
- Expect Adjusted EBIT Margin to expand by 180 basis points or more by 2026 to 7.0-7.7% range
AURORA, Ontario, Feb. 09, 2024 (GLOBE NEWSWIRE) -- Magna International Inc. (TSX: MG; NYSE: MGA) today reported financial
results for the fourth quarter and year ended December 31, 2023.
| |
|
|
THREE MONTHS ENDED
DECEMBER 31, |
|
YEAR ENDED
DECEMBER 31, |
| |
|
|
|
2023 |
|
|
|
2022 |
|
|
|
2023 |
|
|
|
2022 |
|
| |
Reported |
|
|
|
|
|
|
|
|
| |
|
|
|
|
|
|
|
|
|
| |
Sales |
|
$ |
10,454 |
|
|
$ |
9,568 |
|
|
$ |
42,797 |
|
|
$ |
37,840 |
|
| |
|
|
|
|
|
|
|
|
|
| |
Income from operations before income taxes |
|
$ |
310 |
|
|
$ |
146 |
|
|
$ |
1,606 |
|
|
$ |
878 |
|
| |
|
|
|
|
|
|
|
|
|
| |
Net income attributable to Magna International Inc. |
|
$ |
271 |
|
|
$ |
95 |
|
|
$ |
1,213 |
|
|
$ |
592 |
|
| |
|
|
|
|
|
|
|
|
|
| |
Diluted earnings per share |
|
$ |
0.94 |
|
|
$ |
0.33 |
|
|
$ |
4.23 |
|
|
$ |
2.03 |
|
| |
|
|
|
|
|
|
|
|
|
| Non-GAAP Financial Measures(1) |
|
|
|
|
|
|
|
|
| |
|
|
|
|
|
|
|
|
|
| |
Adjusted EBIT |
|
$ |
558 |
|
|
$ |
367 |
|
|
$ |
2,238 |
|
|
$ |
1,708 |
|
| |
|
|
|
|
|
|
|
|
|
| |
Adjusted diluted earnings per share |
|
$ |
1.33 |
|
|
$ |
0.94 |
|
|
$ |
5.49 |
|
|
$ |
4.24 |
|
| |
|
|
|
|
|
|
|
|
|
| All results are reported in millions of U.S. dollars, except per share figures,
which are in U.S. dollars. |
| |
| (1) |
Adjusted EBIT and Adjusted diluted earnings
per share are Non-GAAP financial measures that have no standardized meaning under U.S. GAAP, and as a result may not be comparable to
the calculation of similar measures by other companies. Effective July 1, 2023, we revised our calculations of Adjusted EBIT and Adjusted
diluted earnings per share to exclude the amortization of acquired intangible assets. The Non-GAAP measures within this press release
reflect the revised calculations. Further information and a reconciliation of these Non-GAAP financial measures is included in the back
of this press release. |
| |
 |
|
“I am pleased with our 2023 operating performance, highlighted by strong execution on higher sales, success in offsetting inflationary pressures, and the benefits from operational excellence activities across the company. We completed the acquisition of Veoneer Active Safety, and are on track to deliver meaningful synergies to our combined Active Safety business.
As we begin 2024, we remain focused on delivering on our short- and long- term growth, while emphasizing margin expansion, increasing free cash flow and driving returns on investment.”
- Swamy Kotagiri, Magna's Chief Executive Officer
|
THREE MONTHS ENDED DECEMBER 31, 2023
We posted sales of $10.5 billion for the fourth quarter of 2023, an increase of 9% over the fourth quarter of 2022,
which compares to global light vehicle production that increased 7%, including 5%, 7% and 12% higher production in North America, Europe,
and China respectively. In addition to higher global vehicle production, our sales benefitted from the launch of new programs and acquisitions
net of divestitures, partially offset by the negative impact of lost vehicle production as a result of the UAW labour strikes at certain
customers during the fourth quarter of 2023, which negatively impacted sales by approximately $275 million. Excluding the impact of foreign
currency translation and acquisitions net of divestitures, sales increased 4%.
Adjusted EBIT increased to $558 million in the fourth quarter of 2023 compared to $367 million in the fourth quarter
of 2022. Our ongoing focus on operational excellence and cost initiatives helped drive strong earnings on higher sales. In addition, the
Adjusted EBIT increase mainly reflected productivity and efficiency improvements, including lower costs at certain previously underperforming
facilities, higher tooling contribution, higher customer recoveries net of higher production input costs, lower net warranty costs, and
lower provisions against certain accounts receivable and other balances, partially offset by the negative impact of the UAW labour strikes
during the fourth quarter of 2023, higher launch, engineering and other costs associated with new assembly business, and higher restructuring
costs.
Income from operations before income taxes increased to $310 million for the fourth quarter of 2023 compared to $146
million in the fourth quarter of 2022. Included in income from operations before income taxes were other expense, net, and amortization
of acquired intangibles totaling $195 million and $204 million in the fourth quarters of 2023 and 2022, respectively. Excluding other
expense, net and amortization of acquired intangibles from both periods, income from operations before income taxes increased $155 million
in the fourth quarter of 2023 compared to the fourth quarter of 2022.
Net income attributable to Magna International Inc. was $271 million for the fourth quarter of 2023 compared to $95
million in the fourth quarter of 2022. Included in net income attributable to Magna International Inc. were other expense, net, amortization
of acquired intangibles and Adjustments to Deferred Tax Valuation Allowances totaling $112 million after tax in the fourth quarter of
2023, compared to $175 million after tax in the fourth quarter of 2022. Excluding these amounts from both periods, net income attributable
to Magna International Inc. increased $113 million in the fourth quarter of 2023 compared to the fourth quarter of 2022.
Diluted earnings per share was $0.94 in the fourth quarter of 2023, compared to $0.33 in the comparable period. Adjusted
diluted earnings per share was $1.33 compared to $0.94 for the fourth quarter of 2022.
In the fourth quarter of 2023, we generated cash from operations before changes in operating assets and liabilities
of $660 million and used $918 million in operating assets and liabilities. Investment activities for the fourth quarter of 2023 included
$944 million in fixed asset additions, $189 million in investments, other assets and intangible assets and $1 million in private equity
investments.
YEAR ENDED DECEMBER 31, 2023
We posted sales of $42.8 billion for the year ended December 31, 2023, an increase of 13% over the year ended December
31, 2022, which compares to global light vehicle production that increased 8%, including 9%, 11% and 8% higher production in North America,
Europe, and China respectively. In addition to higher global vehicle production, our sales benefitted from the launch of new programs
and acquisitions net of divestitures, partially offset by the negative impact of lost vehicle production as a result of the UAW labour
strikes at certain customers during the third and fourth quarters of 2023, which negatively impacted sales by approximately $325 million.
Excluding the impact of foreign currency translation and acquisitions net of divestitures, sales increased 11%.
Adjusted EBIT increased to $2.2 billion for the year ended December 31, 2023 compared to $1.7 billion for year ended
December 31, 2022, primarily due to earnings on higher sales, including higher margins due to the impact of operational excellence and
cost initiatives, and productivity and efficiency improvements, including lower costs at previously underperforming facilities, partially
offset by higher launch, engineering and other costs associated with new assembly business, the negative impact of the UAW labour strikes
during the third and fourth quarters of 2023, the net unfavourable impact of commercial items, lower amortization related to the initial
value of public company securities, higher launch costs associated with new manufacturing business, and the impact of acquisitions, net
of divestitures.
During the year ended December 31, 2023, income from operations before income taxes was $1.6 billion, net income attributable
to Magna International Inc. was $1.2 billion and diluted earnings per share was $4.23, increases of $728 million, $621 million, and $2.20,
respectively, each compared to the year ended December 31, 2022.
During the year ended December 31, 2023, Adjusted diluted earnings per share increased 29% to $5.49, compared to the
year ended December 31, 2022.
During the year ended December 31, 2023, we generated cash from operations before changes in operating assets and liabilities
of $2.9 billion and invested $221 million in operating assets and liabilities. Investment activities for the year ended December 31, 2023
included $1.5 billion to purchase Veoneer Active Safety, $2.5 billion in fixed asset additions, a $562 million increase in investments,
other assets and intangible assets and $11 million in public and private equity investments.
RETURN OF CAPITAL TO SHAREHOLDERS
We paid dividends of $133 million and $522 million for the three months and year ended December 31, 2023, respectively.
Our Board of Directors declared a fourth quarter dividend of $0.475 per Common Share. This represents a 3% increase
in our dividend, representing our 14th consecutive year of fourth quarter dividend increases. The dividend is payable on March
8, 2024 to shareholders of record as of the close of business on February 23, 2024.
Subject to approval by the Toronto Stock Exchange and New York Stock Exchange, our Board of Directors approved a new
Normal Course Issuer Bid (“NCIB”) to purchase up to 0.3 million of our Common Shares, representing approximately 0.11% of
our public float of Common Shares. This NCIB is expected to commence on February 15, 2024 and will terminate one year later.
2024 AND 2026 OUTLOOK
Our current year Outlook is provided annually, with quarterly updates; our 2026 Outlook is provided below, but not
updated quarterly. Our outlook does not incorporate material unannounced acquisitions or divestitures.
2024 and 2026 Outlook Assumptions
| |
|
2024 |
|
2026 |
Light Vehicle Production (millions of units)
North
America
Europe
China |
15.7
17.4
28.3 |
|
16.1
17.3
30.6 |
| |
|
|
|
|
Average Foreign exchange rates:
1 Canadian dollar equals
1 euro equals |
|
U.S. $0.74
U.S. $1.08 |
|
U.S. $0.74
U.S. $1.08 |
| |
|
|
|
|
2024 and 2026 Outlook
| |
|
2024 |
|
2026 |
Segment Sales
Body Exteriors & Structures
Power
& Vision
Seating Systems
Complete Vehicles |
|
$17.4 - $18.0 billion
$15.8 - $16.2 billion
$5.5
- $5.8 billion
$5.6 - $5.9 billion |
|
$19.6 - $20.6 billion
$16.8 - $17.4 billion
$6.5
- $6.9 billion
$6.1 - $6.5 billion |
| Total Sales |
|
$43.8 - $45.4 billion |
|
$48.8 - $51.2 billion |
| |
|
|
|
|
| Adjusted EBIT Margin(2) |
|
5.4% - 6.0% |
|
7.0% - 7.7% |
| |
|
|
|
|
| Equity Income (included in EBIT) |
|
$120 - $150 million |
|
$165 - $210 million |
| |
|
|
|
|
| Interest Expense, net |
|
Approximately $230 million |
|
|
| |
|
|
|
|
| Income Tax Rate(3) |
|
Approximately 21% |
|
|
| |
|
|
|
|
| Adjusted Net Income attributable to Magna(4) |
|
$1.6 - $1.8 billion |
|
|
| |
|
|
|
|
| Capital Spending |
|
Approximately $2.5 billion |
|
|
| |
|
|
|
|
| Notes: |
|
| (2) |
Adjusted EBIT Margin is the ratio of Adjusted EBIT to Total Sales. Refer to the reconciliation of Non-GAAP financial
measures in the back of this press release for further information |
| (3) |
The Income Tax Rate has been calculated using Adjusted EBIT and is based on current tax legislation |
| (4) |
Adjusted Net Income attributable to Magna represents Net Income excluding Other expense, net and amortization of acquired
intangible assets, net of tax |
Our Outlook is intended to provide information about management's current expectations and plans and may not be appropriate
for other purposes. Although considered reasonable by Magna as of the date of this document, the 2024 and 2026 Outlook above and the underlying
assumptions may prove to be inaccurate. Accordingly, our actual results could differ materially from our expectations as set forth herein.
The risks identified in the “Forward-Looking Statements” section below represent the primary factors which we believe could
cause actual results to differ materially from our expectations.
Key Drivers of Our Business
Our operating results are primarily dependent on the levels of North American, European, and Chinese car and light
truck production by our customers. While we supply systems and components to every major original equipment manufacturer (“OEM”),
we do not supply systems and components for every vehicle, nor is the value of our content consistent from one vehicle to the next. As
a result, customer and program mix relative to market trends, as well as the value of our content on specific vehicle production programs,
are also important drivers of our results.
OEM production volumes are generally aligned with vehicle sales levels and thus affected by changes in such levels.
Aside from vehicle sales levels, production volumes are typically impacted by a range of factors, including: general economic and political
conditions; labour disruptions; free trade arrangements; tariffs; relative currency values; commodities prices; supply chains and infrastructure;
availability and relative cost of skilled labour; regulatory considerations, including those related to environmental emissions and safety
standards; and other factors.
Overall vehicle sales levels are significantly affected by changes in consumer confidence levels, which may in turn
be impacted by consumer perceptions and general trends related to the job, housing, and stock markets, as well as other macroeconomic
and political factors. Other factors which typically impact vehicle sales levels and thus production volumes include: interest rates and/or
availability of credit; fuel and energy prices; relative currency values; regulatory restrictions on use of vehicles in certain megacities;
government subsidies to consumers for the purchase of low- and zero-emission vehicles; and other factors.
Segment Analysis
[All amounts in U.S. dollars and all tabular amounts in millions
unless otherwise noted]
Body Exteriors & Structures
| |
For the three months |
|
|
|
|
| |
ended
December 31, |
|
|
|
|
| |
|
2023 |
|
|
2022 |
|
Change |
| |
|
|
|
|
|
|
|
|
| Sales |
$ |
4,178 |
|
$ |
4,004 |
|
$ |
174 |
+ |
4% |
|
| |
|
|
|
|
|
|
|
|
| Adjusted EBIT |
$ |
280 |
|
$ |
200 |
|
$ |
80 |
+ |
40% |
|
| |
|
|
|
|
|
|
|
|
| Adjusted
EBIT as a percentage of sales (i) |
6.7% |
|
|
5.0% |
|
|
|
+ |
1.7% |
|
(i) Adjusted EBIT as a percentage of sales is calculated as Adjusted EBIT divided
by Sales.
Sales for Body Exteriors & Structures increased 4% or $174 million to $4.18 billion in the
fourth quarter of 2023 compared to $4.00 billion in 2022. The increase in sales was primarily due to higher global light vehicle
production, the launch of new programs during or subsequent to the fourth quarter of 2022, including the Ford F-Series SuperDuty, Fisker
Ocean, Mercedes-Benz EQE, and Chevrolet Equinox EV, and the net strengthening of foreign currencies against the U.S. dollar, which increased
reported U.S. dollar sales by $49 million. These factors were partially offset by the negative impact of lost vehicle production as a
result of the UAW labour strikes at certain customers during the fourth quarter of 2023, which negatively impacted sales by approximately
$170 million, and net customer price concessions.
Adjusted EBIT increased $80 million to $280 million for the fourth quarter of 2023 compared to $200
million in the fourth quarter of 2022 and Adjusted EBIT as a percentage of sales increased to 6.7% from 5.0%. These increases were
primarily due to earnings on higher sales including higher margins due to the impact of operational excellence and cost initiatives, productivity
and efficiency improvements, including lower costs at certain previously underperforming facilities, lower provisions against certain
accounts receivable and other balances, higher tooling contribution, and higher customer recoveries net of higher production input costs.
These were partially offset by the negative impact of the UAW labour strikes during the fourth quarter of 2023, higher restructuring costs,
higher employee profit sharing and incentive compensation.
Power & Vision
| |
For the three months |
|
|
|
|
| |
ended
December 31, |
|
|
|
|
| |
|
2023 |
|
|
2022 |
|
Change |
| |
|
|
|
|
|
|
|
|
| Sales |
$ |
3,775 |
|
$ |
3,016 |
|
$ |
759 |
+ |
25% |
|
| |
|
|
|
|
|
|
|
|
| Adjusted EBIT |
$ |
231 |
|
$ |
116 |
|
$ |
115 |
+ |
99% |
|
| |
|
|
|
|
|
|
|
|
| Adjusted
EBIT as a percentage of sales |
6.1% |
|
|
3.8% |
|
|
|
+ |
2.3% |
|
Sales for Power & Vision increased 25% or $759 million to $3.78 billion in the fourth
quarter of 2023 compared to $3.02 billion in the fourth quarter of 2022. The increase in sales was primarily due to the launch
of new programs during or subsequent to the fourth quarter of 2022, including the Chery Jetour Traveller, Fisker Ocean, Subaru Impreza,
and Mercedes-Benz EQE, higher global light vehicle production, acquisitions, net of divestitures, subsequent to the fourth quarter of
2022, which increased sales by $355 million, the net strengthening of foreign currencies against the U.S. dollar, which increased U.S.
dollar sales by $59 million, and customer input cost recoveries. These factors were partially offset by the negative impact of lost vehicle
production as a result of the UAW labour strikes at certain customers during the fourth quarter of 2023, which negatively impacted sales
by approximately $65 million, and net customer price concessions.
Adjusted EBIT increased $115 million to $231 million for the fourth quarter of 2023 compared to $116
million for the fourth quarter of 2022 and Adjusted EBIT as a percentage of sales increased to 6.1% from 3.8%. These increases were primarily
due to earnings on higher sales including higher margins due to the impact of operational excellence and cost initiatives, lower net warranty
costs, higher customer recoveries net of higher production input costs, cost savings and efficiencies realized, including as a result
of restructuring actions taken, and lower net engineering costs including spending related to our electrification and active safety businesses.
These were partially offset by the negative impact of the UAW labour strikes during the fourth quarter of 2023, and
net inefficiencies and other costs, including at certain underperforming facilities.
Seating Systems
| |
For the three months |
|
|
|
|
| |
ended
December 31, |
|
|
|
|
| |
|
2023 |
|
|
2022 |
|
Change |
| |
|
|
|
|
|
|
|
|
| Sales |
$ |
1,429 |
|
$ |
1,345 |
|
$ |
84 |
+ |
6% |
|
| |
|
|
|
|
|
|
|
|
| Adjusted EBIT |
$ |
44 |
|
$ |
14 |
|
$ |
30 |
+ |
214% |
|
| |
|
|
|
|
|
|
|
|
| Adjusted
EBIT as a percentage of sales |
3.1% |
|
|
1.0% |
|
|
|
+ |
2.1% |
|
Sales for Seating Systems increased 6% or $84 million to $1.43 billion in the fourth quarter
of 2023 compared to $1.35 billion in 2022. The increase in sales was primarily due to the launch of new programs during or subsequent
to the fourth quarter of 2022, including the Geely Boyue L, Changan Qiyuan A07, Changan Qiyuan A05, and Fisker Ocean, higher global light
vehicle production and the net strengthening of foreign currencies against the U.S. dollar, which increased U.S. dollar sales by $12 million.
These factors were partially offset by the negative impact of lost vehicle production as a result of the UAW labour strikes at certain
customers during the fourth quarter of 2023, which negatively impacted sales by approximately $40 million, and net customer price concessions.
Adjusted EBIT increased $30 million to $44 million for the fourth quarter of 2023 compared to $14 million
for the fourth quarter of 2022 and Adjusted EBIT as a percentage of sales increased to 3.1% from 1.0%. These increases were primarily
due to earnings on higher sales including higher margins due to the impact of operational excellence and cost initiatives, productivity
and efficiency improvements, including lower costs at previously underperforming facilities, lower launch costs and provisions against
certain accounts receivable and other balances in 2022, and commercial items in the fourth quarter of 2023 and 2022, which had a net favourable
impact on a year over year basis. These were partially offset by higher production input costs net of customer recoveries, the negative
impact of the UAW labour strikes during the fourth quarter of 2023, and foreign exchange losses on the weakening of the Argentine peso
against the U.S. dollar.
Complete Vehicles
| |
For the three months |
|
|
|
|
| |
ended
December 31, |
|
|
|
|
| |
|
2023 |
|
|
2022 |
|
Change |
| |
|
|
|
|
|
|
|
|
| Complete Vehicle
Assembly Volumes (thousands of units) |
|
21.4 |
|
|
28.6 |
|
|
|
- |
25% |
|
| |
|
|
|
|
|
|
|
|
| Sales |
$ |
1,201 |
|
$ |
1,330 |
|
$ |
(129 |
) |
- |
10% |
|
| |
|
|
|
|
|
|
|
|
| Adjusted EBIT |
$ |
43 |
|
$ |
57 |
|
$ |
(14 |
) |
- |
25% |
|
| |
|
|
|
|
|
|
|
|
| Adjusted EBIT as
a percentage of sales |
|
3.6% |
|
|
4.3% |
|
|
|
- |
0.7% |
|
Sales for Complete Vehicles decreased 10% or $129 million to $1.20 billion in the fourth
quarter of 2023 compared to $1.33 billion in the fourth quarter of 2022 and assembly volumes decreased 25% or 7,200 units. This
sales decline was primarily due to lower assembly volumes, including the end of production of the BMW 5-Series, partially offset by favourable
program mix and a $65 million increase in reported U.S. dollar sales as a result of the strengthening of the euro against the U.S. dollar.
Adjusted EBIT decreased $14 million to $43 million for the fourth quarter of 2023 compared to $57 million
for the fourth quarter of 2022 and Adjusted EBIT as a percentage of sales decreased to 3.6% from 4.3% primarily due to higher launch,
engineering and other costs associated with new assembly business, and lower earnings on lower assembly volumes, net of contractual fixed
cost recoveries on certain programs, partially offset by commercial items in the fourth quarters of 2023 and 2022, which had a net favourable
impact on a year over year basis, and higher customer recoveries net of higher production input costs.
Corporate and Other
Adjusted EBIT was a loss of $40 million for the fourth quarter of 2023 compared to a loss of $20 million for the fourth
quarter of 2022. The $20 million decrease was primarily due to lower amortization related to the initial value of public company securities,
higher incentive and stock-based compensation, higher investments in research, development and new mobility, and higher labour costs partially
offset by an increase in fees received from our divisions.
MAGNA INTERNATIONAL INC.
CONSOLIDATED STATEMENTS OF INCOME
[Unaudited]
[U.S.
dollars in millions, except per share figures]
| |
Three months ended |
|
Year ended |
| |
December
31, |
|
December
31, |
| |
|
2023 |
|
|
2022 |
|
|
|
2023 |
|
|
2022 |
|
| |
|
|
|
|
|
|
|
|
|
| Sales |
$ |
10,454 |
|
$ |
9,568 |
|
|
$ |
42,797 |
|
$ |
37,840 |
|
| |
|
|
|
|
|
|
|
|
|
| Costs and expenses |
|
|
|
|
|
|
|
|
|
| Cost of goods sold |
|
8,961 |
|
|
8,403 |
|
|
|
37,185 |
|
|
33,188 |
|
| Depreciation |
|
372 |
|
|
338 |
|
|
|
1,436 |
|
|
1,373 |
|
| Amortization of acquired intangible
assets |
|
31 |
|
|
11 |
|
|
|
88 |
|
|
46 |
|
| Selling, general and administrative |
|
566 |
|
|
477 |
|
|
|
2,050 |
|
|
1,660 |
|
| Interest expense, net |
|
53 |
|
|
17 |
|
|
|
156 |
|
|
81 |
|
| Equity income |
|
(3 |
) |
|
(17 |
) |
|
|
(112 |
) |
|
(89 |
) |
| Other
expense, net [i] |
|
164 |
|
|
193 |
|
|
|
388 |
|
|
703 |
|
| Income from operations before income taxes |
|
310 |
|
|
146 |
|
|
|
1,606 |
|
|
878 |
|
| Income taxes |
|
12 |
|
|
35 |
|
|
|
320 |
|
|
237 |
|
| Net income |
|
298 |
|
|
111 |
|
|
|
1,286 |
|
|
641 |
|
| Income attributable to
non-controlling interests |
|
(27 |
) |
|
(16 |
) |
|
|
(73 |
) |
|
(49 |
) |
| Net income attributable
to Magna International Inc. |
$ |
271 |
|
$ |
95 |
|
|
$ |
1,213 |
|
$ |
592 |
|
| |
|
|
|
|
|
|
|
|
|
| Earnings per Common Share: |
|
|
|
|
|
|
|
|
|
| Basic |
$ |
0.95 |
|
$ |
0.33 |
|
|
$ |
4.24 |
|
$ |
2.04 |
|
| Diluted |
$ |
0.94 |
|
$ |
0.33 |
|
|
$ |
4.23 |
|
$ |
2.03 |
|
| |
|
|
|
|
|
|
|
|
|
| Cash dividends paid per
Common Share |
$ |
0.46 |
|
$ |
0.45 |
|
|
$ |
1.84 |
|
$ |
1.80 |
|
| |
|
|
|
|
|
|
|
|
|
| Weighted average number of Common Shares outstanding during |
|
|
|
|
|
|
|
|
|
| the period [in millions]: |
|
|
|
|
|
|
|
|
|
| Basic |
|
286.4 |
|
|
285.9 |
|
|
|
286.2 |
|
|
290.4 |
|
| Diluted |
|
286.6 |
|
|
286.3 |
|
|
|
286.6 |
|
|
291.2 |
|
| |
|
|
|
|
|
|
|
|
|
[i] See "Other expense, net" information included in this Press Release.
MAGNA INTERNATIONAL INC.
CONSOLIDATED BALANCE SHEETS
[Unaudited]
[U.S.
dollars in millions]
| |
As at
|
|
|
As at
|
|
| |
December 31,
|
|
|
December 31,
|
|
| |
|
2023 |
|
|
|
2022 |
|
| |
|
|
|
|
|
| ASSETS |
|
|
|
|
|
| Current assets |
|
|
|
|
|
| Cash and cash equivalents |
$ |
1,198 |
|
|
$ |
1,234 |
|
| Accounts receivable |
|
7,881 |
|
|
|
6,791 |
|
| Inventories |
|
4,606 |
|
|
|
4,180 |
|
| Prepaid expenses and other |
|
352 |
|
|
|
320 |
|
| |
|
14,037 |
|
|
|
12,525 |
|
| |
|
|
|
|
|
| Investments |
|
1,273 |
|
|
|
1,429 |
|
| Fixed assets, net |
|
9,618 |
|
|
|
8,173 |
|
| Operating lease right-of-use assets |
|
1,744 |
|
|
|
1,595 |
|
| Intangible assets, net |
|
876 |
|
|
|
452 |
|
| Goodwill |
|
2,767 |
|
|
|
2,031 |
|
| Deferred tax assets |
|
621 |
|
|
|
491 |
|
| Other assets |
|
1,319 |
|
|
|
1,093 |
|
| |
$ |
32,255 |
|
|
$ |
27,789 |
|
| |
|
|
|
|
|
| LIABILITIES AND SHAREHOLDERS' EQUITY |
|
|
|
|
|
| Current liabilities |
|
|
|
|
|
| Short-term borrowing |
$ |
511 |
|
|
$ |
8 |
|
| Accounts payable |
|
7,842 |
|
|
|
6,999 |
|
| Other accrued liabilities |
|
2,626 |
|
|
|
2,118 |
|
| Accrued salaries and wages |
|
912 |
|
|
|
850 |
|
| Income taxes payable |
|
125 |
|
|
|
93 |
|
| Long‑term debt due within one year |
|
819 |
|
|
|
654 |
|
| Current portion of operating
lease liabilities |
|
399 |
|
|
|
276 |
|
| |
|
13,234 |
|
|
|
10,998 |
|
| |
|
|
|
|
|
| Long‑term debt |
|
4,175 |
|
|
|
2,847 |
|
| Operating lease liabilities |
|
1,319 |
|
|
|
1,288 |
|
| Long-term employee benefit liabilities |
|
591 |
|
|
|
548 |
|
| Other long‑term liabilities |
|
475 |
|
|
|
461 |
|
| Deferred tax liabilities |
|
184 |
|
|
|
312 |
|
| |
|
19,978 |
|
|
|
16,454 |
|
| |
|
|
|
|
|
| Shareholders' equity |
|
|
|
|
|
| Capital stock |
|
|
|
|
|
| Common Shares |
|
|
|
|
|
| [issued: 286,552,908; December 31, 2022
– 285,931,816] |
|
3,354 |
|
|
|
3,299 |
|
| Contributed surplus |
|
125 |
|
|
|
111 |
|
| Retained earnings |
|
9,303 |
|
|
|
8,639 |
|
| Accumulated other comprehensive
loss |
|
(898 |
) |
|
|
(1,114 |
) |
| |
|
11,884 |
|
|
|
10,935 |
|
| |
|
|
|
|
|
| Non-controlling interests |
|
393 |
|
|
|
400 |
|
| |
|
12,277 |
|
|
|
11,335 |
|
| |
$ |
32,255 |
|
|
$ |
27,789 |
|
| |
|
|
|
|
|
MAGNA INTERNATIONAL INC.
CONSOLIDATED STATEMENTS OF CASH FLOWS
[Unaudited]
[U.S.
dollars in millions]
| |
Three months ended |
|
Year ended |
| |
December
31, |
|
December
31, |
| |
|
2023 |
|
|
2022 |
|
|
|
2023 |
|
|
2022 |
|
| |
|
|
|
|
|
|
|
|
|
| Cash provided from (used for): |
|
|
|
|
|
|
|
|
|
| |
|
|
|
|
|
|
|
|
|
| OPERATING ACTIVITIES |
|
|
|
|
|
|
|
|
|
| Net income |
$ |
298 |
|
$ |
111 |
|
|
$ |
1,286 |
|
$ |
641 |
|
| Items not involving current
cash flows |
|
362 |
|
|
406 |
|
|
|
1,642 |
|
|
1,776 |
|
| |
|
660 |
|
|
517 |
|
|
|
2,928 |
|
|
2,417 |
|
| Changes in operating assets
and liabilities |
|
918 |
|
|
739 |
|
|
|
221 |
|
|
(322 |
) |
| Cash provided from
operating activities |
|
1,578 |
|
|
1,256 |
|
|
|
3,149 |
|
|
2,095 |
|
| |
|
|
|
|
|
|
|
|
|
| INVESTING ACTIVITIES |
|
|
|
|
|
|
|
|
|
| Acquisitions |
|
(29 |
) |
|
(3 |
) |
|
|
(1,504 |
) |
|
(3 |
) |
| Fixed asset additions |
|
(944 |
) |
|
(750 |
) |
|
|
(2,500 |
) |
|
(1,681 |
) |
| Increase in investments, other assets and intangible assets |
|
(189 |
) |
|
(186 |
) |
|
|
(562 |
) |
|
(455 |
) |
| Increase in public and private equity investments |
|
(1 |
) |
|
— |
|
|
|
(11 |
) |
|
(29 |
) |
| Proceeds from dispositions |
|
27 |
|
|
20 |
|
|
|
122 |
|
|
124 |
|
| Net cash (outflow) inflow from disposal of facilities |
|
— |
|
|
— |
|
|
|
(48 |
) |
|
6 |
|
| Cash
used for investing activities |
|
(1,136 |
) |
|
(919 |
) |
|
|
(4,503 |
) |
|
(2,038 |
) |
| |
|
|
|
|
|
|
|
|
|
| FINANCING ACTIVITIES |
|
|
|
|
|
|
|
|
|
| Issues of debt |
|
16 |
|
|
9
|
|
|
|
2,083 |
|
|
54 |
|
| Increase in short-term borrowings |
|
492 |
|
|
8 |
|
|
|
487 |
|
|
11 |
|
| Repayments of debt |
|
(627 |
) |
|
(39 |
) |
|
|
(644 |
) |
|
(456 |
) |
| Issue of Common Shares on exercise of stock options |
|
6 |
|
|
3 |
|
|
|
20 |
|
|
8 |
|
| Tax withholding on vesting of equity awards |
|
(1 |
) |
|
— |
|
|
|
(11 |
) |
|
(15 |
) |
| Repurchase of Common Shares |
|
(2 |
) |
|
(5 |
) |
|
|
(13 |
) |
|
(780 |
) |
| Contributions to subsidiaries by non-controlling interests |
|
11 |
|
|
— |
|
|
|
11 |
|
|
5 |
|
| Dividends paid to non-controlling interests |
|
(25 |
) |
|
(24 |
) |
|
|
(74 |
) |
|
(46 |
) |
| Dividends |
|
(133 |
) |
|
(126 |
) |
|
|
(522 |
) |
|
(514 |
) |
| Cash
(used for) provided from financing activities |
|
(263 |
) |
|
(174 |
) |
|
|
1,337 |
|
|
(1,733 |
) |
| |
|
|
|
|
|
|
|
|
|
| Effect of exchange rate
changes on cash and cash equivalents |
|
(3 |
) |
|
(31 |
) |
|
|
(19 |
) |
|
(38 |
) |
| |
|
|
|
|
|
|
|
|
|
| Net increase (decrease) in cash, cash equivalents during
the period |
|
176 |
|
|
132 |
|
|
|
(36 |
) |
|
(1,714 |
) |
| Cash and cash equivalents,
beginning of period |
|
1,022 |
|
|
1,102 |
|
|
|
1,234 |
|
|
2,948 |
|
| Cash and cash equivalents,
end of period |
$ |
1,198 |
|
$ |
1,234 |
|
|
$ |
1,198 |
|
$ |
1,234 |
|
| |
|
|
|
|
|
|
|
|
|
MAGNA INTERNATIONAL INC.
SUPPLEMENTAL DATA
[Unaudited]
[All amounts in
U.S. dollars and all tabular amounts in millions unless otherwise noted]
OTHER EXPENSE, NET
| |
|
Three months ended |
|
Year ended |
| |
|
December
31, |
|
December
31, |
| |
|
|
2023 |
|
|
2022 |
|
|
|
2023 |
|
|
2022 |
|
| |
|
|
|
|
|
|
|
|
|
|
| Investments |
[a] |
$ |
98 |
|
$ |
101 |
|
|
$ |
201 |
|
$ |
221 |
|
| Restructuring |
[b] |
|
66 |
|
|
22 |
|
|
|
148 |
|
|
22 |
|
| Veoneer Active Safety Business transaction costs |
[c] |
|
— |
|
|
— |
|
|
|
23 |
|
|
— |
|
| Impairments and loss on sale of operations in Russia |
[d] |
|
— |
|
|
— |
|
|
|
16 |
|
|
376 |
|
| Loss on sale of business |
[e] |
|
— |
|
|
58 |
|
|
|
— |
|
|
58 |
|
| Impairments |
[f] |
|
— |
|
|
12 |
|
|
|
— |
|
|
26 |
|
| |
|
$ |
164 |
|
$ |
193 |
|
|
$ |
388 |
|
$ |
703 |
|
| |
|
|
|
|
|
|
|
|
|
|
[a] Investments
| |
|
Three months ended |
|
Year ended |
| |
|
December
31, |
|
December
31, |
| |
|
|
2023 |
|
|
2022 |
|
|
|
2023 |
|
|
2022 |
|
| |
|
|
|
|
|
|
|
|
|
|
| |
Revaluation of public company warrants |
$ |
93 |
|
$ |
77 |
|
|
$ |
110 |
|
$ |
173 |
|
| |
Non-cash impairment charge [i] |
|
5 |
|
|
— |
|
|
|
90 |
|
|
— |
|
| |
Revaluation of public and private equity investments |
|
— |
|
|
24 |
|
|
|
1 |
|
|
49 |
|
| |
Net gain on sale of public equity investments |
|
— |
|
|
— |
|
|
|
— |
|
|
(1 |
) |
| |
Other expense, net |
|
98 |
|
|
101 |
|
|
|
201 |
|
|
221 |
|
| |
Tax effect |
|
(24 |
) |
|
(26 |
) |
|
|
(28 |
) |
|
(53 |
) |
| |
Net
loss attributable to Magna |
$ |
74 |
|
$ |
75 |
|
|
$ |
173 |
|
$ |
168 |
|
| |
|
|
|
|
|
|
|
|
|
|
[i] The non-cash impairment charges relate to impairments of a private equity investments and related long-term receivables
within Other assets.
[b] Restructuring
For the three months ended December 31, 2023, the Company recorded restructuring charges of $57 million [$51 million
after tax] in its Power & Vision segment, and $9 million [$9 million after tax] in its Body Exteriors & Structures segment, respectively.
For the twelve months ended December 31, 2023, the Company recorded restructuring charges of $117 million [$97 million
after tax] in its Power & Vision segment, and $31 million [$27 million after tax] in its Body Exteriors & Structures segment,
respectively.
[c] Veoneer Active Safety Business transaction costs
During 2023, the Company incurred $23 million [$22 million after tax] of transaction costs related to the acquisition
of the Veoneer Active Safety Business [“Veoneer AS”].
[d] Impairments and loss on sale of operations in Russia
During the second quarter of 2022, the Company recorded a $376 million [$361 million after tax] impairment charge related
to its investment in Russia as a result of the expected lack of future cashflows and the uncertainties connected with the Russian economy.
This included net asset impairments of $173 million and a $203 million reserve against the related foreign currency translation losses
that were included in accumulated other comprehensive loss. The net asset impairments consisted of $163 million and $10 million in its
Body Exteriors & Structures and Seating Systems segments, respectively.
During the third quarter of 2023, the Company completed the sale of all of its investments in Russia resulting in a
loss of $16 million [$16 million after tax] including a net cash outflow of $23 million.
[e] Loss on sale of business
During the fourth quarter of 2022, the Company entered into an agreement to sell a European Power & Vision operation.
Under the terms of the arrangement, the Company was contractually obligated to provide the buyer with up to $42 million of funding, resulting
in a loss of $58 million [$57 million after tax]. During the first quarter of 2023, the Company completed the sale of this operation which
resulted in a net cash outflow of $25 million.
[f] Impairments
For the twelve months ended December 31, 2022, the Company recorded a provision against its assets related to the closure
of a customer in China of $10 million [$9 million after tax] in its Body Exteriors & Structures segment and $4 million [$3 million
after tax] in its Power & Vision segment, respectively. The company also recorded a fixed asset impairment for $12 million [$12 million
after tax] in its Body Exteriors & Structures segment.
SEGMENTED INFORMATION
Magna is a global automotive supplier which has complete vehicle engineering and contract manufacturing expertise,
as well as product capabilities which include body, chassis, exterior, seating, powertrain, active driver assistance, electronics, mirrors
& lighting, mechatronics, and roof systems. Magna also has electronic and software capabilities across many of these areas.
The Company is organized under four operating segments: Body Exteriors & Structures, Power & Vision, Seating
Systems, and Complete Vehicles. These segments have been determined on the basis of technological opportunities, product similarities,
and market and operating factors, and are also the Company's reportable segments.
The Company's chief operating decision maker uses Adjusted Earnings before Interest and Income Taxes ["Adjusted EBIT"]
as the measure of segment profit or loss, since management believes Adjusted EBIT is the most appropriate measure of operational profitability
or loss for its reporting segments. Adjusted EBIT is calculated by taking Net income and adding back Amortization of acquired intangible
assets, Income taxes, Interest expense, net and Other (income) expense, net.
Effective July 1, 2023, the Company revised its calculation of Adjusted EBIT to exclude the amortization of acquired
intangible assets. The Company believes that excluding the amortization of acquired intangible assets from Adjusted EBIT helps management
and investors in understanding its underlying performance and improves comparability between its segmented results of operations and its
peers. The Adjusted EBIT presented in the tables below, including for the prior period, have been updated to reflect the revised calculation.
MAGNA
INTERNATIONAL INC.
SUPPLEMENTAL DATA
[Unaudited]
[All amounts in U.S. dollars and
all tabular amounts in millions unless otherwise noted]
SEGMENTED INFORMATION (CONTINUED)
The following tables show segment information for the Company's reporting segments: See Non-GAAP Financial Measures
section for a reconciliation of Adjusted EBIT to the Company’s consolidated net income.
| |
|
|
|
|
|
|
|
|
|
|
|
|
|
|
| |
|
Three
months ended December 31, 2023 |
| |
Total
sales |
|
External
sales |
|
Adjusted
EBIT
[ii] |
|
Depreciation |
|
Equity
loss
(income) |
|
Fixed
asset
additions |
| |
|
|
|
|
|
|
|
|
|
|
|
|
|
|
| Body Exteriors
& Structures |
$ |
4,178 |
|
$ |
4,116 |
|
$ |
280 |
|
$ |
178 |
|
$ |
1 |
|
$ |
633 |
| Power & Vision |
|
3,775 |
|
|
3,716 |
|
|
231 |
|
|
132 |
|
|
1 |
|
|
242 |
| Seating Systems |
|
1,429 |
|
|
1,425 |
|
|
44 |
|
|
27 |
|
|
— |
|
|
44 |
| Complete Vehicles |
|
1,201 |
|
|
1,192 |
|
|
43 |
|
|
25 |
|
|
(5 |
) |
|
20 |
| Corporate & Other
[i] |
|
(129 |
) |
|
5 |
|
|
(40 |
) |
|
10 |
|
|
— |
|
|
5 |
| Total Reportable
Segments |
$ |
10,454 |
|
$ |
10,454 |
|
$ |
558 |
|
$ |
372 |
|
$ |
(3 |
) |
$ |
944 |
| |
|
|
|
|
|
|
|
|
|
|
|
|
|
|
| |
|
Three months
ended December 31, 2022 |
| |
Total
sales |
|
External
sales |
|
Adjusted
EBIT
[ii] |
|
Depreciation |
|
Equity
(income)
loss |
|
Fixed
asset
additions |
| |
|
|
|
|
|
|
|
|
|
|
|
|
|
|
| Body Exteriors & Structures |
$ |
4,004 |
|
$ |
3,945 |
|
$ |
200 |
|
$ |
169 |
|
$ |
— |
|
$ |
442 |
| Power & Vision |
|
3,016 |
|
|
2,961 |
|
|
116 |
|
|
117 |
|
|
(5 |
) |
|
203 |
| Seating Systems |
|
1,345 |
|
|
1,344 |
|
|
14 |
|
|
19 |
|
|
(6 |
) |
|
43 |
| Complete Vehicles |
|
1,330 |
|
|
1,318 |
|
|
57 |
|
|
28 |
|
|
(7 |
) |
|
52 |
| Corporate & Other
[i] |
|
(127 |
) |
|
— |
|
|
(20 |
) |
|
5 |
|
|
1 |
|
|
10 |
| Total Reportable Segments |
$ |
9,568 |
|
$ |
9,568 |
|
$ |
367 |
|
$ |
338 |
|
$ |
(17 |
) |
$ |
750 |
| |
|
|
|
|
|
|
|
|
|
|
|
|
|
|
| |
|
Year
ended December 31, 2023 |
| |
|
Total
sales |
|
|
External
sales |
|
|
Adjusted
EBIT
[ii] |
|
|
Depreciation |
|
|
Equity
loss
(income) |
|
|
Fixed
asset
additions |
| |
|
|
|
|
|
|
|
|
|
|
|
|
|
|
| Body Exteriors & Structures |
$ |
17,511 |
|
$ |
17,199 |
|
$ |
1,304 |
|
$ |
716 |
|
$ |
4 |
|
$ |
1,638 |
| Power & Vision |
|
14,305 |
|
|
14,052 |
|
|
668 |
|
|
510 |
|
|
(107 |
) |
|
664 |
| Seating Systems |
|
6,047 |
|
|
6,027 |
|
|
218 |
|
|
89 |
|
|
(3 |
) |
|
108 |
| Complete Vehicles |
|
5,538 |
|
|
5,502 |
|
|
124 |
|
|
100 |
|
|
(8 |
) |
|
65 |
| Corporate & Other
[i] |
|
(604 |
) |
|
17 |
|
|
(76 |
) |
|
21 |
|
|
2 |
|
|
25 |
| Total Reportable
Segments |
$ |
42,797 |
|
$ |
42,797 |
|
$ |
2,238 |
|
$ |
1,436 |
|
$ |
(112 |
) |
$ |
2,500 |
| |
|
|
|
|
|
|
|
|
|
|
|
|
|
|
| |
|
Year ended
December 31, 2022 |
| |
|
Total
sales |
|
|
External
sales |
|
|
Adjusted
EBIT [ii] |
|
|
Depreciation |
|
|
Equity
loss
(income) |
|
|
Fixed
asset
additions |
| |
|
|
|
|
|
|
|
|
|
|
|
|
|
|
| Body Exteriors & Structures |
$ |
16,004 |
|
$ |
15,763 |
|
$ |
852 |
|
$ |
697 |
|
$ |
10 |
|
$ |
928 |
| Power & Vision |
|
11,861 |
|
|
11,636 |
|
|
502 |
|
|
473 |
|
|
(77 |
) |
|
544 |
| Seating Systems |
|
5,269 |
|
|
5,252 |
|
|
104 |
|
|
79 |
|
|
(15 |
) |
|
101 |
| Complete Vehicles |
|
5,221 |
|
|
5,180 |
|
|
235 |
|
|
107 |
|
|
(10 |
) |
|
94 |
| Corporate & Other
[i] |
|
(515 |
) |
|
9 |
|
|
15 |
|
|
17 |
|
|
3 |
|
|
14 |
| Total Reportable Segments |
$ |
37,840 |
|
$ |
37,840 |
|
$ |
1,708 |
|
$ |
1,373 |
|
$ |
(89 |
) |
$ |
1,681 |
| |
[i] Included in Corporate and Other Adjusted EBIT are intercompany fees charged to the automotive segments.
[ii]
For a definition and reconciliation of Adjusted EBIT, refer to our Non-GAAP financial measures reconciliation included in the “Supplemental
Data” section of this Press Release.
MAGNA INTERNATIONAL INC.
SUPPLEMENTAL DATA
[Unaudited]
[All
amounts in U.S. dollars and all tabular amounts in millions unless otherwise noted]
NON-GAAP FINANCIAL MEASURES
In addition to the financial results reported in accordance with U.S. GAAP, this press release contains references
to the Non-GAAP financial measures reconciled below. We believe the Non-GAAP financial measures used in this press release are useful
to both management and investors in their analysis of the Company’s financial position and results of operations, and to improve
comparability between fiscal periods. In particular, management believes that Adjusted EBIT and Adjusted diluted earnings per share, are
useful measures in assessing the Company’s financial performance by excluding certain items that are not indicative of the Company's
core operating performance. The presentation of Non-GAAP financial measures should not be considered in isolation, or as a substitute
for the Company’s related financial results prepared in accordance with U.S. GAAP.
The following table reconciles Net income to Adjusted EBIT:
| |
Three months ended |
|
Year ended |
| |
December
31, |
|
December
31, |
| |
|
2023 |
|
|
2022 |
|
|
|
2023 |
|
|
2022 |
|
| |
|
|
|
|
|
|
|
|
|
| Net income |
$ |
298 |
|
$ |
111 |
|
|
$ |
1,286 |
|
$ |
641 |
|
| Add: |
|
|
|
|
|
|
|
|
|
| Amortization of acquired intangible
assets |
|
31 |
|
|
11 |
|
|
|
88 |
|
|
46 |
|
| Interest expense, net |
|
53 |
|
|
17 |
|
|
|
156 |
|
|
81 |
|
| Other expense, net |
|
164 |
|
|
193 |
|
|
|
388 |
|
|
703 |
|
| Income taxes |
|
12 |
|
|
35 |
|
|
|
320 |
|
|
237 |
|
| Adjusted
EBIT |
$ |
558 |
|
$ |
367 |
|
|
$ |
2,238 |
|
$ |
1,708 |
|
| |
|
|
|
|
|
|
|
|
|
The following table reconciles Net income attributable to Magna International Inc. to Adjusted diluted earnings per
share:
| |
Three months ended |
|
Year ended |
| |
December
31, |
|
December
31, |
| |
|
2023 |
|
|
2022 |
|
|
|
2023 |
|
|
2022 |
|
| |
|
|
|
|
|
|
|
|
|
| Net income attributable to Magna International Inc. |
$ |
271 |
|
$ |
95 |
|
|
$ |
1,213 |
|
$ |
592 |
|
| Add: |
|
|
|
|
|
|
|
|
|
| Amortization of acquired intangible
assets |
|
31 |
|
|
11 |
|
|
|
88 |
|
|
46 |
|
| Tax effect on Amortization of acquired
intangible assets |
|
(6 |
) |
|
(2 |
) |
|
|
(17 |
) |
|
(8 |
) |
| Other expense, net |
|
164 |
|
|
193 |
|
|
|
388 |
|
|
703 |
|
| Tax effect on Other expense, net |
|
(30 |
) |
|
(27 |
) |
|
|
(53 |
) |
|
(71 |
) |
| Adjustments to Deferred Tax Valuation
Allowances [i] |
|
(47 |
) |
|
— |
|
|
|
(47 |
) |
|
(29 |
) |
| Adjusted net income
attributable to Magna International Inc. |
$
|
383 |
|
$
|
270 |
|
|
$
|
1,572 |
|
$
|
1,233 |
|
| Diluted weighted average number of Common Shares |
|
|
|
|
|
|
|
|
|
| outstanding during the period (millions): |
|
286.6 |
|
|
286.3 |
|
|
|
286.6 |
|
|
291.2 |
|
| Adjusted
diluted earnings per share |
$ |
1.33 |
|
$ |
0.94 |
|
|
$ |
5.49 |
|
$ |
4.24 |
|
| |
|
|
|
|
|
|
|
|
|
[i] The Company records quarterly adjustments to the valuation allowance against its deferred tax assets in continents
like North America, Europe, Asia, and South America. The net effect of these adjustments is a reduction to income expense. [‘‘Adjustments
to Deferred Tax Valuation Allowances’’].
Certain of the forward-looking financial measures above are provided on a Non-GAAP basis. We do not provide a reconciliation
of such forward-looking measures to the most directly comparable financial measures calculated and presented in accordance with U.S. GAAP.
To do so would be potentially misleading and not practical given the difficulty of projecting items that are not reflective of on-going
operations in any future period. The magnitude of these items, however, may be significant.
This press release together with our Management’s Discussion and Analysis of Results of Operations and Financial
Position and our Interim Financial Statements are available in the Investor Relations section of our website at www.magna.com/company/investors
and filed electronically through the System for Electronic Data Analysis and Retrieval + (SEDAR+) which can be accessed at www.sedarplus.ca as
well as on the United States Securities and Exchange Commission’s Electronic Data Gathering, Analysis and Retrieval System (EDGAR),
which can be accessed at www.sec.gov.
We will hold a conference call for interested analysts and shareholders to discuss our year ended December 31, 2023
results and 2024 and 2026 Outlook on Friday, February 9, 2024 at 8:00 a.m. ET. The conference call will be chaired by Swamy Kotagiri,
Chief Executive Officer. The number to use for this call from North America is 1-800-621-4410. International callers should use 1-416-981-9010.
Please call in at least 10 minutes prior to the call start time. We will also webcast the conference call at www.magna.com. The slide
presentation accompanying the conference call as well as our financial review summary will be available on our website Friday prior to
the call.
TAGS
Quarterly earnings, full year results, outlook, financial results, vehicle production
INVESTOR CONTACT
Louis Tonelli, Vice-President, Investor Relations
louis.tonelli@magna.com
│ 905.726.7035
MEDIA CONTACT
Tracy Fuerst, Vice-President, Corporate Communications & PR
tracy.fuerst@magna.com
│ 248.761.7004
TELECONFERENCE CONTACT
Nancy Hansford, Executive Assistant, Investor Relations
nancy.hansford@magna.com
│ 905.726.7108
OUR BUSINESS (5)
Magna is more than one of the world’s largest suppliers
in the automotive space. We are a mobility technology company built to innovate, with a global, entrepreneurial-minded team of over 179,000(6)
employees across 342 manufacturing operations and 104 product development, engineering and sales centres spanning 28 countries. With 65+
years of expertise, our ecosystem of interconnected products combined with our complete vehicle expertise uniquely positions us to advance
mobility in an expanded transportation landscape.
For further information about Magna (NYSE:MGA; TSX:MG), please visit www.magna.com or follow us on social.
(5) Manufacturing operations, product development, engineering and sales centres include certain operations accounted
for under the equity method.
(6) Number of employees includes over 166,000 employees at our wholly owned or
controlled entities and over 13,000 employees at certain operations accounted for under the equity method.
FORWARD-LOOKING STATEMENTS
Certain statements in this press release constitute "forward-looking
information" or "forward-looking statements" (collectively, "forward-looking statements"). Any such forward-looking statements are intended
to provide information about management's current expectations and plans and may not be appropriate for other purposes. Forward-looking
statements may include financial and other projections, as well as statements regarding our future plans, strategic objectives or economic
performance, or the assumptions underlying any of the foregoing, and other statements that are not recitations of historical fact. We
use words such as "may", "would", "could", "should", "will", "likely", "expect", "anticipate", "believe", "intend", "plan", "aim", "forecast",
"outlook", "project", "estimate", "target" and similar expressions suggesting future outcomes or events to identify forward-looking statements.
The following table identifies the material forward-looking statements contained in this document, together with the material potential
risks that we currently believe could cause actual results to differ materially from such forward-looking statements. Readers should also
consider all of the risk factors which follow below the table:
| Material
Forward-Looking Statement |
Material
Potential Risks Related to Applicable Forward-Looking Statement |
Light
Vehicle Production
|
- Light vehicle sales levels
- Production disruptions, including as a result of labour strikes
- Supply disruptions
- Production allocation decisions by OEMs
|
Total
Sales
Segment Sales |
- Same risks as for Light Vehicle Production above
- The impact of elevated interest rates and availability of credit on consumer confidence and in turn vehicle
sales and production
- The impact of deteriorating vehicle affordability on consumer demand, and in turn vehicle sales and production
- Concentration of sales with six customers
- Shifts in market shares among vehicles or vehicle segments
- Shifts in consumer “take rates” for products we sell
- Relative foreign exchange rates
|
Adjusted
EBIT Margin
Net Income Attributable to Magna |
- Same risks as for Total Sales and Segment Sales above
- Successful execution of critical program launches
- Operational underperformance
- Product warranty/recall risks
- Production inefficiencies in our operations due to volatile vehicle production allocation decisions by
OEMs
- Higher costs incurred to mitigate the risk of supply disruptions
- Inflationary pressures
- Our ability to secure cost recoveries from customers and/or otherwise offset higher input costs
- Price concessions
- Risks of conducting business with Fisker and other newer EV-focused OEMs
- Commodity cost volatility
- Scrap steel price volatility
- Higher labour costs
- Tax risks
|
| Equity
Income |
- Same risks as Adjusted EBIT Margin and Net Income Attributable to Magna
- Risks related to conducting business through joint ventures
|
Forward-looking statements are based on information currently available to us and are based on assumptions and
analyses made by us in light of our experience and our perception of historical trends, current conditions and expected future developments,
as well as other factors we believe are appropriate in the circumstances. While we believe we have a reasonable basis for making any such
forward-looking statements, they are not a guarantee of future performance or outcomes. In addition to the factors in the table above,
whether actual results and developments conform to our expectations and predictions is subject to a number of risks, assumptions, and
uncertainties, many of which are beyond our control, and the effects of which can be difficult to predict, including, without limitation:
Macroeconomic,
Geopolitical and Other Risks
- inflationary pressures;
- interest rate levels;
- geopolitical risks;
Risks Related to the Automotive Industry
- economic cyclicality;
- regional production volume declines;
- deteriorating vehicle affordability;
- misalignment between Electric Vehicle (“EV”) production and sales;
- intense competition;
Strategic Risks
- alignment of our product mix with the “Car of the Future”;
- our evolving business risk profile as a result of increased investment in battery enclosures, powertrain electrification, autonomous/assisted
driving systems and new mobility business models;
- our ability to consistently develop and commercialize innovative products or processes;
- our investments in mobility and technology companies;
- strategic and other risks related to the transition to electromobility;
- inability to achieve future investment returns that equal or exceed past returns;
Customer-Related Risks
- concentration of sales with six customers;
- inability to significantly grow our business with Asian customers;
- growth of EV-focused OEMs, including risks related to limited financial, liquidity/capital or other resources, less mature product
development and validation processes, uncertain market acceptance of their products/services and untested business models;
- dependence on outsourcing;
- OEM consolidation and cooperation;
- shifts in market shares among vehicles or vehicle segments;
- shifts in consumer "take rates" for products we sell;
- potential loss of any material purchase orders;
- production disruptions affecting our customers;
- quarterly sales fluctuations;
Supply Chain Risks
- semiconductor supply chain disruptions and price increases;
- other supply chain disruptions;
- regional energy disruptions and pricing;
- a deterioration of the financial condition of our supply base;
Manufacturing/Operational Risks
- product and new facility launch risks;
- operational underperformance;
- restructuring costs;
- impairment charges;
- skilled labour attraction/retention;
- leadership expertise and succession;
|
|
Pricing Risks
- pricing risks between time of quote and start of production;
- price concessions;
- commodity price volatility;
- declines in scrap steel/aluminum prices;
Warranty/Recall Risks
- costs related to repair or replacement of defective products, including due to a recall;
- warranty or recall costs that exceed warranty provision or insurance coverage limits;
- product liability claims;
Climate Change Risks
- transition, physical, strategic and other risks related to climate change, as described in our Sustainability Report;
IT
Security/Cybersecurity Risks
- IT/Cybersecurity breach;
- product Cybersecurity breach;
Acquisition Risks
- inherent merger and acquisition risks;
- acquisition integration risk;
Other Business Risks
- risks related to conducting business through joint ventures;
- intellectual property risks;
- risks of conducting business in foreign markets;
- fluctuations in relative currency values;
- ability to achieve expected returns on capital investments;
- reduced financial flexibility as a result of an economic shock;
- changes in credit ratings assigned to us;
- the unpredictability of, and fluctuation in, the trading price of our Common Shares;
Legal, Regulatory and Other
Risks
- legal claims and/or regulatory actions against us;
- changes in laws and regulations, including tax laws and laws related to vehicle emissions;
- potential restrictions on free trade; and
- trade disputes/tariffs.
|
| |
|
|
In evaluating forward-looking statements or forward-looking information, we caution readers not to place undue reliance
on any forward-looking statement. Additionally, readers should specifically consider the various factors which could cause actual events
or results to differ materially from those indicated by such forward-looking statements, including the risks, assumptions and uncertainties
above which are:
- discussed under the “Industry Trends and Risks” heading of our Management’s Discussion
and Analysis; and
- set out in our revised Annual Information Form filed with securities commissions in Canada, our annual
report on Form 40-F / 40-F/A filed with the United States Securities and Exchange commission, and subsequent filings.
Readers should also consider discussion of our risk mitigation activities with respect to certain risk factors, which
can be also found in our Annual Information Form. Additional information about Magna, including our Annual Information Form, is available
through the System for Electronic Data Analysis and Retrieval + (SEDAR+) at www.sedarplus.ca
EXHIBIT 99.2
| FINANCIAL REVIEW OF MAGNA INTERNATIONAL INC. |
| (United States dollars in millions, except per share figures) (Unaudited) |
| Prepared in accordance with U.S. GAAP |
| |
|
|
|
|
|
|
2021 |
|
2022 |
|
2023 |
| |
|
|
|
|
Note |
|
1st Q |
2nd Q |
3rd Q |
4th Q |
TOTAL |
|
1st Q |
2nd Q |
3rd Q |
4th Q |
TOTAL |
|
1st Q |
2nd Q |
3rd Q |
4th Q |
TOTAL |
| VEHICLE VOLUME STATISTICS (in millions) |
|
|
|
|
|
|
|
|
|
|
|
| North America |
|
|
3.752 |
3.213 |
2.921 |
3.219 |
13.105 |
|
3.615 |
3.551 |
3.600 |
3.514 |
14.280 |
|
3.883 |
4.081 |
3.932 |
3.693 |
15.589 |
| |
|
|
|
|
|
|
|
|
|
|
|
|
|
|
|
|
|
|
|
|
|
|
|
| |
Western Europe |
|
|
3.045 |
2.443 |
1.783 |
2.392 |
9.663 |
|
2.491 |
2.596 |
2.292 |
2.704 |
10.083 |
|
3.020 |
2.972 |
2.415 |
2.807 |
11.214 |
| |
Eastern Europe |
|
|
1.870 |
1.671 |
1.212 |
1.650 |
6.403 |
|
1.506 |
1.424 |
1.305 |
1.484 |
5.719 |
|
1.561 |
1.626 |
1.415 |
1.665 |
6.267 |
| Total Europe |
|
|
|
4.915 |
4.114 |
2.995 |
4.042 |
16.066 |
|
3.997 |
4.020 |
3.597 |
4.188 |
15.802 |
|
4.581 |
4.598 |
3.830 |
4.472 |
17.481 |
| |
|
|
|
|
|
|
|
|
|
|
|
|
|
|
|
|
|
|
|
|
|
|
|
| China |
|
|
|
|
|
6.032 |
5.699 |
5.437 |
7.366 |
24.534 |
|
6.365 |
5.491 |
7.239 |
7.268 |
26.363 |
|
5.938 |
6.799 |
7.678 |
8.166 |
28.581 |
| |
|
|
|
|
|
|
|
|
|
|
|
|
|
|
|
|
|
|
|
|
|
|
|
| Other |
|
|
|
|
|
6.868 |
5.786 |
5.246 |
6.037 |
23.937 |
|
6.382 |
6.147 |
6.712 |
6.866 |
26.107 |
|
6.953 |
6.642 |
6.929 |
7.053 |
27.577 |
| |
|
|
|
|
|
|
|
|
|
|
|
|
|
|
|
|
|
|
|
|
|
|
|
| Global |
|
|
|
|
|
21.567 |
18.812 |
16.599 |
20.664 |
77.642 |
|
20.359 |
19.209 |
21.148 |
21.836 |
82.552 |
|
21.355 |
22.120 |
22.369 |
23.384 |
89.228 |
| |
|
|
|
|
|
|
|
|
|
|
|
|
|
|
|
|
|
|
|
|
|
|
|
| Magna Steyr vehicle assembly volumes |
|
|
0.041 |
0.030 |
0.025 |
0.034 |
0.130 |
|
0.026 |
0.032 |
0.026 |
0.028 |
0.112 |
|
0.034 |
0.027 |
0.023 |
0.021 |
0.105 |
| |
|
|
|
|
|
|
|
|
|
|
|
|
|
|
|
|
|
|
|
|
|
|
|
| AVERAGE FOREIGN EXCHANGE RATES |
|
|
|
|
|
|
|
|
|
|
|
|
|
|
|
|
|
|
|
| 1 Canadian dollar equals U.S. dollars |
|
|
0.790 |
0.814 |
0.794 |
0.794 |
0.798 |
|
0.790 |
0.783 |
0.765 |
0.737 |
0.769 |
|
0.740 |
0.745 |
0.746 |
0.735 |
0.742 |
| 1 Euro equals U.S. dollars |
|
|
1.205 |
1.206 |
1.178 |
1.144 |
1.183 |
|
1.123 |
1.064 |
1.006 |
1.019 |
1.053 |
|
1.073 |
1.089 |
1.088 |
1.076 |
1.082 |
| 1 Chinese renminbi equals U.S. dollars |
|
|
0.154 |
0.155 |
0.155 |
0.156 |
0.155 |
|
0.158 |
0.151 |
0.146 |
0.140 |
0.149 |
|
0.146 |
0.143 |
0.138 |
0.138 |
0.141 |
| |
|
|
|
|
|
|
|
|
|
|
|
|
|
|
|
|
|
|
|
|
|
|
|
| CONSOLIDATED STATEMENTS OF INCOME (LOSS) |
|
|
|
|
|
|
|
|
|
|
|
|
|
|
|
|
|
|
|
| Sales: |
|
|
|
|
|
|
|
|
|
|
|
|
|
|
|
|
|
|
|
|
|
|
| |
|
Body Exteriors & Structures |
|
|
4,025 |
3,647 |
3,185 |
3,620 |
14,477 |
|
4,077 |
3,947 |
3,976 |
4,004 |
16,004 |
|
4,439 |
4,540 |
4,354 |
4,178 |
17,511 |
| |
|
Power & Vision |
|
|
3,156 |
2,881 |
2,501 |
2,804 |
11,342 |
|
3,046 |
2,888 |
2,911 |
3,016 |
11,861 |
|
3,323 |
3,462 |
3,745 |
3,775 |
14,305 |
| |
|
Seating Systems |
|
|
1,303 |
1,166 |
1,123 |
1,299 |
4,891 |
|
1,376 |
1,253 |
1,295 |
1,345 |
5,269 |
|
1,486 |
1,603 |
1,529 |
1,429 |
6,047 |
| |
|
Complete Vehicles |
|
|
1,850 |
1,490 |
1,255 |
1,511 |
6,106 |
|
1,275 |
1,403 |
1,213 |
1,330 |
5,221 |
|
1,626 |
1,526 |
1,185 |
1,201 |
5,538 |
| |
|
Corporate & Other |
|
|
(155) |
(150) |
(145) |
(124) |
(574) |
|
(132) |
(129) |
(127) |
(127) |
(515) |
|
(201) |
(149) |
(125) |
(129) |
(604) |
| Sales |
|
|
|
|
|
10,179 |
9,034 |
7,919 |
9,110 |
36,242 |
|
9,642 |
9,362 |
9,268 |
9,568 |
37,840 |
|
10,673 |
10,982 |
10,688 |
10,454 |
42,797 |
| |
|
|
|
|
|
|
|
|
|
|
|
|
|
|
|
|
|
|
|
|
|
|
|
| Costs and expenses: |
|
|
|
|
|
|
|
|
|
|
|
|
|
|
|
|
|
|
|
| |
Cost of goods sold |
|
|
8,662 |
7,728 |
6,885 |
7,822 |
31,097 |
|
8,400 |
8,259 |
8,126 |
8,403 |
33,188 |
|
9,416 |
9,544 |
9,264 |
8,961 |
37,185 |
| |
Selling, general and administrative |
|
|
430 |
419 |
454 |
414 |
1,717 |
|
386 |
410 |
387 |
477 |
1,660 |
|
488 |
505 |
491 |
566 |
2,050 |
| |
Equity income |
|
|
(47) |
(44) |
(34) |
(23) |
(148) |
|
(20) |
(25) |
(27) |
(17) |
(89) |
|
(33) |
(36) |
(40) |
(3) |
(112) |
| |
|
|
|
|
|
|
|
|
|
|
|
|
|
|
|
|
|
|
|
|
|
|
|
| Adjusted EBITDA |
|
|
1,134 |
931 |
614 |
897 |
3,576 |
|
876 |
718 |
782 |
705 |
3,081 |
|
802 |
969 |
973 |
930 |
3,674 |
| |
Depreciation |
|
|
352 |
362 |
373 |
377 |
1,464 |
|
357 |
348 |
330 |
338 |
1,373 |
|
353 |
353 |
358 |
372 |
1,436 |
| |
|
|
|
|
|
|
|
|
|
|
|
|
|
|
|
|
|
|
|
|
|
|
|
| Adjusted EBIT |
|
|
782 |
569 |
241 |
520 |
2,112 |
|
519 |
370 |
452 |
367 |
1,708 |
|
449 |
616 |
615 |
558 |
2,238 |
| |
Amortization of acquired intangible assets |
|
|
12 |
12 |
12 |
12 |
48 |
|
12 |
12 |
11 |
11 |
46 |
|
12 |
13 |
32 |
31 |
88 |
| |
Other expense (income), net |
1 |
|
(58) |
6 |
180 |
(90) |
38 |
|
61 |
426 |
23 |
193 |
703 |
|
142 |
86 |
(4) |
164 |
388 |
| |
Interest expense, net |
|
|
23 |
11 |
22 |
22 |
78 |
|
26 |
20 |
18 |
17 |
81 |
|
20 |
34 |
49 |
53 |
156 |
| |
|
|
|
|
|
|
|
|
|
|
|
|
|
|
|
|
|
|
|
|
|
|
|
| Income (loss) from operations before income taxes |
|
|
805 |
540 |
27 |
576 |
1,948 |
|
420 |
(88) |
400 |
146 |
878 |
|
275 |
483 |
538 |
310 |
1,606 |
| Income tax expense |
|
|
183 |
104 |
10 |
98 |
395 |
|
41 |
57 |
104 |
35 |
237 |
|
58 |
129 |
121 |
12 |
320 |
| |
|
|
|
|
|
|
|
|
|
|
|
|
|
|
|
|
|
|
|
|
|
|
|
| Net income (loss) |
|
|
622 |
436 |
17 |
478 |
1,553 |
|
379 |
(145) |
296 |
111 |
641 |
|
217 |
354 |
417 |
298 |
1,286 |
| (Income) loss attributable to non-controlling interests |
|
|
(7) |
(12) |
(6) |
(14) |
(39) |
|
(15) |
(11) |
(7) |
(16) |
(49) |
|
(8) |
(15) |
(23) |
(27) |
(73) |
| |
|
|
|
|
|
|
|
|
|
|
|
|
|
|
|
|
|
|
|
|
|
|
|
| Net income (loss) attributable to Magna International Inc. |
|
|
615 |
424 |
11 |
464 |
1,514 |
|
364 |
(156) |
289 |
95 |
592 |
|
209 |
339 |
394 |
271 |
1,213 |
| |
|
|
|
|
|
|
|
|
|
|
|
|
|
|
|
|
|
|
|
|
|
|
|
| Diluted earnings (loss) per common share: |
|
|
$ 2.03 |
$ 1.40 |
$ 0.04 |
$ 1.54 |
$ 5.00 |
|
$ 1.22 |
$ (0.54) |
$ 1.00 |
$ 0.33 |
$ 2.03 |
|
$ 0.73 |
$ 1.18 |
$ 1.37 |
$ 0.94 |
$ 4.23 |
| |
|
|
|
|
|
|
|
|
|
|
|
|
|
|
|
|
|
|
|
|
|
|
|
| Weighted average number of Common Shares outstanding |
|
|
|
|
|
|
|
|
|
|
|
|
|
|
|
|
|
|
|
| |
during the period (in millions): |
|
|
303.6 |
303.6 |
302.6 |
301.5 |
302.8 |
|
298.1 |
291.1 |
288.5 |
286.3 |
291.2 |
|
286.6 |
286.3 |
286.8 |
286.6 |
286.6 |
| |
|
|
|
|
|
|
|
|
|
|
|
|
|
|
|
|
|
|
|
|
|
|
|
| |
|
|
|
|
|
|
|
|
|
|
|
|
|
|
|
|
|
|
|
|
|
|
|
| NON-GAAP MEASURES |
|
|
|
|
|
|
|
|
|
|
|
|
|
|
|
|
|
|
|
| |
|
|
|
|
|
|
|
|
|
|
|
|
|
|
|
|
|
|
|
|
|
|
|
| |
Adjusted EBITDA |
|
|
1,134 |
931 |
614 |
897 |
3,576 |
|
876 |
718 |
782 |
705 |
3,081 |
|
802 |
969 |
973 |
930 |
3,674 |
| |
|
|
|
|
|
|
|
|
|
|
|
|
|
|
|
|
|
|
|
|
|
|
|
| |
Adjusted EBIT |
2 |
|
782 |
569 |
241 |
520 |
2,112 |
|
519 |
370 |
452 |
367 |
1,708 |
|
449 |
616 |
615 |
558 |
2,238 |
| |
|
|
|
|
|
|
|
|
|
|
|
|
|
|
|
|
|
|
|
|
|
|
|
| |
Adjusted net income attributable to Magna International Inc. |
|
|
575 |
434 |
179 |
399 |
1,587 |
|
393 |
253 |
317 |
270 |
1,233 |
|
329 |
441 |
419 |
383 |
1,572 |
| |
|
|
|
|
|
|
|
|
|
|
|
|
|
|
|
|
|
|
|
|
|
|
|
| |
Adjusted Diluted earnings (loss) per common share |
|
|
$ 1.89 |
$ 1.43 |
$ 0.59 |
$ 1.32 |
$ 5.24 |
|
$ 1.32 |
$ 0.87 |
$ 1.10 |
$ 0.94 |
$ 4.24 |
|
$ 1.15 |
$ 1.54 |
$ 1.46 |
$ 1.33 |
$ 5.49 |
| |
|
|
|
|
|
|
|
|
|
|
|
|
|
|
|
|
|
|
|
|
|
|
|
| |
|
|
|
|
|
|
|
|
|
|
|
|
|
|
|
|
|
|
|
|
|
|
|
| PROFITABILITY RATIOS |
|
|
|
|
|
|
|
|
|
|
|
|
|
|
|
|
|
|
|
| |
Selling, general and administrative /Sales |
|
|
4.2% |
4.6% |
5.7% |
4.5% |
4.7% |
|
4.0% |
4.4% |
4.2% |
5.0% |
4.4% |
|
4.6% |
4.6% |
4.6% |
5.4% |
4.8% |
| |
Adjusted EBIT /Sales |
|
|
7.7% |
6.3% |
3.0% |
5.7% |
5.8% |
|
5.4% |
4.0% |
4.9% |
3.8% |
4.5% |
|
4.2% |
5.6% |
5.8% |
5.3% |
5.2% |
| |
Operating income /Sales |
|
|
7.9% |
6.0% |
0.3% |
6.3% |
5.4% |
|
4.4% |
-0.9% |
4.3% |
1.5% |
2.3% |
|
2.6% |
4.4% |
5.0% |
3.0% |
3.8% |
| |
Effective tax rate |
|
|
|
|
|
|
|
|
|
|
|
|
|
|
|
|
|
|
|
| |
|
Reported |
|
|
22.7% |
19.3% |
37.0% |
17.0% |
20.3% |
|
9.8% |
-64.8% |
26.0% |
24.0% |
27.0% |
|
21.1% |
26.7% |
22.5% |
3.9% |
19.9% |
| |
|
Excluding Other expense (income) and amortization, net of taxes |
|
|
23.3% |
20.1% |
15.5% |
17.1% |
20.1% |
|
17.2% |
24.6% |
25.3% |
18.3% |
21.2% |
|
21.4% |
21.6% |
21.9% |
18.8% |
21.0% |
| Q4 2023 Financial Review of Magna International Inc. | Page 1 of 6 | |
| FINANCIAL REVIEW OF MAGNA INTERNATIONAL INC. |
| CONSOLIDATED BALANCE SHEETS |
| (United States dollars in millions) (Unaudited) |
| |
|
|
|
|
|
|
|
|
|
|
|
|
|
|
|
|
|
|
|
|
|
|
| |
|
|
|
|
|
|
2021 |
|
|
2022 |
|
|
2023 |
| |
|
|
|
|
|
|
1st Q |
2nd Q |
3rd Q |
4th Q |
|
|
1st Q |
2nd Q |
3rd Q |
4th Q |
|
|
1st Q |
2nd Q |
3rd Q |
4th Q |
| FUNDS EMPLOYED |
|
|
|
|
|
|
|
|
|
|
|
|
|
|
|
|
|
|
| Current assets: |
|
|
|
|
|
|
|
|
|
|
|
|
|
|
|
|
|
|
| |
Accounts receivable |
|
|
7,176 |
6,531 |
6,082 |
6,307 |
|
|
7,006 |
6,764 |
7,082 |
6,791 |
|
|
7,959 |
8,556 |
8,477 |
7,881 |
| |
Inventories |
|
|
3,645 |
3,999 |
4,150 |
3,969 |
|
|
4,258 |
4,064 |
4,108 |
4,180 |
|
|
4,421 |
4,664 |
4,751 |
4,606 |
| |
Prepaid expenses and other |
|
|
290 |
294 |
247 |
278 |
|
|
310 |
262 |
269 |
320 |
|
|
367 |
455 |
387 |
352 |
| |
|
|
|
|
|
|
11,111 |
10,824 |
10,479 |
10,554 |
|
|
11,574 |
11,090 |
11,459 |
11,291 |
|
|
12,747 |
13,675 |
13,615 |
12,839 |
| Current liabilities: |
|
|
|
|
|
|
|
|
|
|
|
|
|
|
|
|
|
|
| |
Accounts payable |
|
|
6,787 |
6,248 |
5,914 |
6,465 |
|
|
6,845 |
6,443 |
6,624 |
6,999 |
|
|
7,731 |
7,984 |
7,911 |
7,842 |
| |
Accrued salaries and wages |
|
|
897 |
912 |
893 |
851 |
|
|
879 |
766 |
810 |
850 |
|
|
822 |
858 |
900 |
912 |
| |
Other accrued liabilities |
|
|
2,298 |
2,186 |
2,070 |
2,156 |
|
|
2,123 |
2,096 |
1,986 |
2,118 |
|
|
2,526 |
2,637 |
2,537 |
2,626 |
| |
Income taxes payable (receivable) |
|
|
109 |
123 |
125 |
200 |
|
|
190 |
136 |
97 |
93 |
|
|
9 |
(14) |
33 |
125 |
| |
|
|
|
|
|
|
10,091 |
9,469 |
9,002 |
9,672 |
|
|
10,037 |
9,441 |
9,517 |
10,060 |
|
|
11,088 |
11,465 |
11,381 |
11,505 |
| |
|
|
|
|
|
|
|
|
|
|
|
|
|
|
|
|
|
|
|
|
|
|
| Working capital |
|
|
1,020 |
1,355 |
1,477 |
882 |
|
|
1,537 |
1,649 |
1,942 |
1,231 |
|
|
1,659 |
2,210 |
2,234 |
1,334 |
| |
|
|
|
|
|
|
|
|
|
|
|
|
|
|
|
|
|
|
|
|
|
|
| Investments |
|
|
|
960 |
1,124 |
1,455 |
1,593 |
|
|
1,487 |
1,375 |
1,323 |
1,429 |
|
|
1,390 |
1,287 |
1,311 |
1,273 |
| Fixed assets, net |
|
|
8,305 |
8,297 |
8,166 |
8,293 |
|
|
8,090 |
7,723 |
7,470 |
8,173 |
|
|
8,304 |
8,646 |
8,778 |
9,618 |
| Goodwill, other assets and intangible assets |
|
|
3,614 |
3,632 |
3,530 |
3,577 |
|
|
3,544 |
3,353 |
3,280 |
3,576 |
|
|
3,640 |
4,733 |
4,726 |
4,962 |
| Operating lease right-of-use assets |
|
|
1,869 |
1,854 |
1,731 |
1,700 |
|
|
1,667 |
1,587 |
1,545 |
1,595 |
|
|
1,638 |
1,667 |
1,696 |
1,744 |
| Funds employed |
|
|
15,768 |
16,262 |
16,359 |
16,045 |
|
|
16,325 |
15,687 |
15,560 |
16,004 |
|
|
16,631 |
18,543 |
18,745 |
18,931 |
| FINANCING |
|
|
|
|
|
|
|
|
|
|
|
|
|
|
|
|
|
|
|
| Straight debt: |
|
|
|
|
|
|
|
|
|
|
|
|
|
|
|
|
|
|
|
| |
Cash and cash equivalents |
|
|
(3,464) |
(3,426) |
(2,748) |
(2,948) |
|
|
(1,996) |
(1,664) |
(1,102) |
(1,234) |
|
|
(2,429) |
(1,281) |
(1,022) |
(1,198) |
| |
Short-term borrowings |
|
|
- |
- |
- |
- |
|
|
- |
- |
- |
8 |
|
|
4 |
150 |
2 |
511 |
| |
Long-term debt due within one year |
|
|
137 |
117 |
101 |
455 |
|
|
127 |
105 |
95 |
654 |
|
|
668 |
1,426 |
1,398 |
819 |
| |
Long-term debt |
|
|
3,935 |
3,941 |
3,908 |
3,538 |
|
|
3,501 |
3,408 |
3,325 |
2,847 |
|
|
4,500 |
4,159 |
4,135 |
4,175 |
| |
Current portion of operating lease liabilities |
|
|
244 |
278 |
269 |
274 |
|
|
276 |
270 |
266 |
276 |
|
|
285 |
303 |
384 |
399 |
| |
Operating lease liabilities |
|
|
1,613 |
1,563 |
1,438 |
1,406 |
|
|
1,369 |
1,294 |
1,254 |
1,288 |
|
|
1,318 |
1,345 |
1,289 |
1,319 |
| |
|
|
|
|
|
|
2,465 |
2,473 |
2,968 |
2,725 |
|
|
3,277 |
3,413 |
3,838 |
3,839 |
|
|
4,346 |
6,102 |
6,186 |
6,025 |
| Long-term employee benefit liabilities |
|
|
733 |
743 |
716 |
700 |
|
|
686 |
651 |
617 |
548 |
|
|
563 |
579 |
564 |
591 |
| Other long-term liabilities |
|
|
414 |
482 |
466 |
376 |
|
|
374 |
390 |
397 |
461 |
|
|
451 |
448 |
453 |
475 |
| Deferred tax liabilities, net |
|
|
104 |
124 |
40 |
19 |
|
|
(51) |
(111) |
(138) |
(179) |
|
|
(218) |
(242) |
(210) |
(437) |
| |
|
|
|
|
|
|
1,251 |
1,349 |
1,222 |
1,095 |
|
|
1,009 |
930 |
876 |
830 |
|
|
796 |
785 |
807 |
629 |
| Shareholders' equity |
|
|
12,052 |
12,440 |
12,169 |
12,225 |
|
|
12,039 |
11,344 |
10,846 |
11,335 |
|
|
11,489 |
11,656 |
11,752 |
12,277 |
| |
|
|
|
|
|
|
15,768 |
16,262 |
16,359 |
16,045 |
|
|
16,325 |
15,687 |
15,560 |
16,004 |
|
|
16,631 |
18,543 |
18,745 |
18,931 |
| |
|
|
|
|
|
|
|
|
|
|
|
|
|
|
|
|
|
|
|
|
|
|
| ASSET UTILIZATION RATIOS |
|
|
|
|
|
|
|
|
|
|
|
|
|
|
|
|
|
|
| |
Days in accounts receivable |
|
|
63.4 |
65.1 |
69.1 |
62.3 |
|
|
65.4 |
65.0 |
68.8 |
63.9 |
|
|
67.1 |
70.1 |
71.4 |
67.8 |
| |
Days in accounts payable |
|
|
70.5 |
72.8 |
77.3 |
74.4 |
|
|
73.3 |
70.2 |
73.4 |
75.0 |
|
|
73.9 |
75.3 |
76.9 |
78.8 |
| |
Inventory turnover - cost of sales |
|
|
9.5 |
7.7 |
6.6 |
7.9 |
|
|
7.9 |
8.1 |
7.9 |
8.0 |
|
|
8.5 |
8.2 |
7.8 |
7.8 |
| |
Working capital turnover |
|
|
39.9 |
26.7 |
21.4 |
41.3 |
|
|
25.1 |
22.7 |
19.1 |
31.1 |
|
|
25.7 |
19.9 |
19.1 |
31.3 |
| |
Total asset turnover |
|
|
2.6 |
2.2 |
1.9 |
2.3 |
|
|
2.4 |
2.4 |
2.4 |
2.4 |
|
|
2.6 |
2.4 |
2.3 |
2.2 |
| |
|
|
|
|
|
|
|
|
|
|
|
|
|
|
|
|
|
|
|
|
|
|
| CAPITAL STRUCTURE |
|
|
|
|
|
|
|
|
|
|
|
|
|
|
|
|
|
|
| |
Straight debt |
|
|
15.6% |
15.2% |
18.1% |
17.0% |
|
|
20.1% |
21.8% |
24.7% |
24.0% |
|
|
26.1% |
32.9% |
33.0% |
31.8% |
| |
Long-term employee benefit liabilities, other long-term |
|
|
|
|
|
|
|
|
|
|
|
|
|
|
|
|
|
|
| |
|
liabilities & deferred tax liabilities, net |
|
|
7.9% |
8.3% |
7.5% |
6.8% |
|
|
6.2% |
5.9% |
5.6% |
5.2% |
|
|
4.8% |
4.2% |
4.3% |
3.3% |
| |
Shareholders' equity |
|
|
76.4% |
76.5% |
74.4% |
76.2% |
|
|
73.7% |
72.3% |
69.7% |
70.8% |
|
|
69.1% |
62.9% |
62.7% |
64.9% |
| |
|
|
|
|
|
|
100.0% |
100.0% |
100.0% |
100.0% |
|
|
100.0% |
100.0% |
100.0% |
100.0% |
|
|
100.0% |
100.0% |
100.0% |
100.0% |
| |
|
|
|
|
|
|
|
|
|
|
|
|
|
|
|
|
|
|
|
|
|
|
| |
Debt to total capitalization |
|
|
33.0% |
32.2% |
32.0% |
31.7% |
|
|
30.5% |
30.9% |
31.3% |
30.9% |
|
|
37.1% |
38.8% |
38.0% |
37.0% |
| |
|
|
|
|
|
|
|
|
|
|
|
|
|
|
|
|
|
|
|
|
|
|
| ANNUALIZED RETURNS |
|
|
|
|
|
|
|
|
|
|
|
|
|
|
|
|
|
|
| |
Return on equity (Net income attributable
to Magna |
|
|
|
|
|
|
|
|
|
|
|
|
|
|
|
|
|
|
| |
|
International Inc. / Average shareholders' equity) |
|
|
20.7% |
13.8% |
0.4% |
15.2% |
|
|
12.0% |
-5.3% |
10.4% |
3.4% |
|
|
7.3% |
11.7% |
13.5% |
9.0% |
| |
Adjusted Return on equity (Adjusted
Net income attributable |
|
|
|
|
|
|
|
|
|
|
|
|
|
|
|
|
|
|
| |
|
to Magna International Inc. / Average shareholders' equity) |
|
|
19.4% |
14.2% |
5.8% |
13.1% |
|
|
13.0% |
8.7% |
11.4% |
9.7% |
|
|
11.5% |
15.2% |
14.3% |
12.8% |
| |
Return on Invested Capital (Annualized
after-tax operating |
|
|
|
|
|
|
|
|
|
|
|
|
|
|
|
|
|
|
| |
|
profits / invested capital) |
|
|
16.3% |
11.1% |
0.9% |
12.2% |
|
|
9.9% |
-3.2% |
7.9% |
3.2% |
|
|
5.7% |
8.7% |
9.8% |
7.2% |
| |
Adjusted Return on Invested Capital (Adjusted
Annualized after-tax |
|
|
|
|
|
|
|
|
|
|
|
|
|
|
|
|
|
|
| |
|
operating profits / invested capital) |
|
|
15.3% |
11.4% |
5.0% |
10.6% |
|
|
10.6% |
7.0% |
8.6% |
7.6% |
|
|
8.7% |
11.0% |
10.3% |
9.6% |
| Q4 2023 Financial Review of Magna International Inc. | Page 2 of 6 | |
| FINANCIAL REVIEW OF MAGNA INTERNATIONAL INC. |
| CONSOLIDATED STATEMENTS OF CASH FLOWS |
| (United States dollars in millions) (Unaudited) |
| |
|
|
|
|
|
|
|
|
|
|
|
|
|
|
|
|
|
|
|
|
|
|
|
| |
|
|
|
|
|
|
2021 |
|
2022 |
|
2023 |
| Cash provided from (used for): |
Note |
|
1st Q |
2nd Q |
3rd Q |
4th Q |
TOTAL |
|
1st Q |
2nd Q |
3rd Q |
4th Q |
TOTAL |
|
1st Q |
2nd Q |
3rd Q |
4th Q |
TOTAL |
| |
|
|
|
|
|
|
|
|
|
|
|
|
|
|
|
| Operating activities |
|
|
|
|
|
|
|
|
|
|
|
|
|
|
|
|
|
|
|
| |
Net income (loss) |
|
|
622 |
436 |
17 |
478 |
1,553 |
|
379 |
(145) |
296 |
127 |
657 |
|
217 |
354 |
417 |
298 |
1,286 |
| |
Items not involving current cash flows |
(i) |
|
349 |
341 |
515 |
371 |
1,576 |
|
370 |
705 |
295 |
406 |
1,776 |
|
351 |
525 |
404 |
362 |
1,642 |
| |
|
|
|
|
(i) |
|
971 |
777 |
532 |
849 |
3,129 |
|
749 |
560 |
591 |
533 |
2,433 |
|
568 |
879 |
821 |
660 |
2,928 |
| |
Changes in operating assets and liabilities |
(i) |
|
(310) |
(249) |
(132) |
502 |
(189) |
|
(569) |
(139) |
(353) |
723 |
(338) |
|
(341) |
(332) |
(24) |
918 |
221 |
| Cash provided from operating activities |
|
|
661 |
528 |
400 |
1,351 |
2,940 |
|
180 |
421 |
238 |
1,256 |
2,095 |
|
227 |
547 |
797 |
1,578 |
3,149 |
| |
|
|
|
|
|
|
|
|
|
|
|
|
|
|
|
|
|
|
|
|
|
|
|
| Investment activities |
|
|
|
|
|
|
|
|
|
|
|
|
|
|
|
|
|
|
|
| |
Fixed asset additions |
|
|
(212) |
(277) |
(334) |
(549) |
(1,372) |
|
(238) |
(329) |
(364) |
(750) |
(1,681) |
|
(424) |
(502) |
(630) |
(944) |
(2,500) |
| |
Increase in equity method investment |
|
|
- |
- |
(454) |
(63) |
(517) |
|
- |
- |
- |
- |
- |
|
- |
- |
- |
- |
- |
| |
Increase in investments, other assets and intangible assets |
|
|
(104) |
(93) |
(101) |
(105) |
(403) |
|
(64) |
(80) |
(125) |
(186) |
(455) |
|
(101) |
(96) |
(176) |
(189) |
(562) |
| |
Net cash (outflow) inflow from disposal of facilities |
1(c), 1(f) |
|
- |
- |
(41) |
- |
(41) |
|
6 |
- |
- |
- |
6 |
|
(25) |
- |
(23) |
- |
(48) |
| |
Increase in public and private equity investments |
|
|
(3) |
(17) |
(3) |
(45) |
(68) |
|
(2) |
(2) |
(25) |
- |
(29) |
|
- |
(3) |
(7) |
(1) |
(11) |
| |
Settlement of long-term receivable from non-consolidated joint venture |
|
50 |
- |
- |
- |
50 |
|
- |
- |
- |
- |
- |
|
- |
- |
- |
- |
- |
| |
Proceeds from disposition |
|
|
19 |
20 |
10 |
32 |
81 |
|
23 |
40 |
41 |
20 |
124 |
|
19 |
44 |
32 |
27 |
122 |
| |
Business combinations |
|
|
39 |
(21) |
- |
(31) |
(13) |
|
- |
- |
- |
(3) |
(3) |
|
- |
(1,475) |
- |
(29) |
(1,504) |
| Cash used for investment activities |
|
|
(211) |
(388) |
(923) |
(761) |
(2,283) |
|
(275) |
(371) |
(473) |
(919) |
(2,038) |
|
(531) |
(2,032) |
(804) |
(1,136) |
(4,503) |
| |
|
|
|
|
|
|
|
|
|
|
|
|
|
|
|
|
|
|
|
|
|
|
|
| Financing activities |
|
|
|
|
|
|
|
|
|
|
|
|
|
|
|
|
|
|
|
| |
Net issues (repayments) of debt |
|
|
(126) |
(33) |
(13) |
5 |
(167) |
|
(328) |
(31) |
(10) |
(22) |
(391) |
|
1,636 |
544 |
(135) |
(119) |
1,926 |
| |
Common Shares issued on exercise of stock options |
|
|
83 |
50 |
3 |
10 |
146 |
|
4 |
- |
1 |
3 |
8 |
|
6 |
- |
8 |
6 |
20 |
| |
Repurchase of Common Shares |
|
|
(162) |
(99) |
(5) |
(251) |
(517) |
|
(383) |
(212) |
(180) |
(5) |
(780) |
|
(9) |
(2) |
- |
(2) |
(13) |
| |
Tax withholdings on vesting of equity awards |
|
|
(12) |
- |
- |
(1) |
(13) |
|
(14) |
(1) |
- |
- |
(15) |
|
(9) |
(1) |
- |
(1) |
(11) |
| |
Contributions to subsidiaries by non-controlling interests |
|
|
- |
- |
- |
8 |
8 |
|
- |
5 |
- |
- |
5 |
|
- |
- |
- |
11 |
11 |
| |
Dividends paid to non-controlling interests |
|
|
- |
(8) |
(2) |
(39) |
(49) |
|
- |
(12) |
(10) |
(24) |
(46) |
|
(7) |
(24) |
(18) |
(25) |
(74) |
| |
Dividends paid |
|
|
(130) |
(127) |
(130) |
(127) |
(514) |
|
(133) |
(130) |
(125) |
(126) |
(514) |
|
(132) |
(129) |
(128) |
(133) |
(522) |
| |
|
|
|
|
|
|
|
|
|
|
|
|
|
|
|
|
|
|
|
|
|
|
|
| Cash provided from (used for) financing activities |
|
|
(347) |
(217) |
(147) |
(395) |
(1,106) |
|
(854) |
(381) |
(324) |
(174) |
(1,733) |
|
1,485 |
388 |
(273) |
(263) |
1,337 |
| Effect of exchange rate changes on cash, cash equivalents |
|
|
|
|
|
|
|
|
|
|
|
|
|
|
|
|
|
|
|
| |
and restricted cash equivalents |
|
|
(13) |
39 |
(8) |
5 |
23 |
|
(3) |
(1) |
(3) |
(31) |
(38) |
|
14 |
(51) |
21 |
(3) |
(19) |
| Net increase (decrease) in cash, cash equivalents |
|
|
|
|
|
|
|
|
|
|
|
|
|
|
|
|
|
|
|
| |
and restricted cash equivalents during the period |
|
|
90 |
(38) |
(678) |
200 |
(426) |
|
(952) |
(332) |
(562) |
132 |
(1,714) |
|
1,195 |
(1,148) |
(259) |
176 |
(36) |
| Cash, cash equivalents and restricted cash equivalents, |
|
|
|
|
|
|
|
|
|
|
|
|
|
|
|
|
|
|
|
| |
beginning of period |
|
|
3,374 |
3,464 |
3,426 |
2,748 |
3,374 |
|
2,948 |
1,996 |
1,664 |
1,102 |
2,948 |
|
1,234 |
2,429 |
1,281 |
1,022 |
1,234 |
| Cash, cash equivalents and restricted cash equivalents, |
|
|
|
|
|
|
|
|
|
|
|
|
|
|
|
|
|
|
|
| |
end of period |
|
|
3,464 |
3,426 |
2,748 |
2,948 |
2,948 |
|
1,996 |
1,664 |
1,102 |
1,234 |
1,234 |
|
2,429 |
1,281 |
1,022 |
1,198 |
1,198 |
| |
|
|
|
|
|
|
|
|
|
|
|
|
|
|
|
|
|
|
|
|
|
|
|
| |
|
|
|
(i) Certain amounts in prior periods have been reclassified to conform with current period presentation. |
| Q4 2023 Financial Review of Magna International Inc. | Page 3 of 6 | |
| FINANCIAL REVIEW OF MAGNA INTERNATIONAL INC. |
| (United States dollars in millions, except per share figures) (Unaudited) |
| |
| |
|
This Analyst should be read in conjunction with the audited consolidated financial statements for the year ended December 31, 2022. |
| |
|
|
|
|
|
|
|
|
|
|
|
|
|
|
|
|
|
|
|
|
|
|
|
| Note 1: |
OTHER EXPENSE (INCOME), NET |
| |
|
Other expense (income), net consists of: |
| |
|
|
|
|
|
|
2021 |
|
2022 |
|
2023 |
| |
|
|
|
|
|
|
1st Q |
2nd Q |
3rd Q |
4th Q |
TOTAL |
|
1st Q |
2nd Q |
3rd Q |
4th Q |
TOTAL |
|
1st Q |
2nd Q |
3rd Q |
4th Q |
TOTAL |
| |
|
|
|
|
|
|
|
|
|
|
|
|
|
|
|
|
|
|
|
|
|
|
|
| |
|
Investment revaluations, (gains) losses on sales, and impairments |
[a] |
|
(33) |
(38) |
81 |
(8) |
2 |
|
61 |
50 |
9 |
101 |
221 |
|
24 |
98 |
(19) |
98 |
201 |
| |
|
Restructuring |
[b] |
|
15 |
44 |
12 |
18 |
89 |
|
- |
- |
- |
22 |
22 |
|
118 |
(35) |
(1) |
66 |
148 |
| |
|
Impairments and loss on sale of operations in Russia |
[c] |
|
- |
- |
- |
- |
- |
|
- |
376 |
- |
- |
376 |
|
- |
- |
16 |
- |
16 |
| |
|
Veoneer related termination fees and transaction costs |
[d] |
|
- |
- |
- |
(100) |
(100) |
|
- |
- |
- |
- |
- |
|
- |
23 |
- |
- |
23 |
| |
|
Loss on sale of business |
[e] |
|
- |
- |
75 |
- |
75 |
|
- |
- |
- |
58 |
58 |
|
- |
- |
- |
- |
- |
| |
|
Impairments |
[f] |
|
- |
- |
12 |
- |
12 |
|
- |
- |
14 |
12 |
26 |
|
- |
- |
- |
- |
- |
| |
|
Gain on business combinations |
[g] |
|
(40) |
- |
- |
- |
(40) |
|
- |
- |
- |
- |
- |
|
- |
- |
- |
- |
- |
| |
|
|
|
|
|
|
|
|
|
|
|
|
|
|
|
|
|
|
|
- |
|
|
|
| |
|
|
|
|
|
|
(58) |
6 |
180 |
(90) |
38 |
|
61 |
426 |
23 |
193 |
703 |
|
142 |
86 |
(4) |
164 |
388 |
| |
[a] |
Investment revaluations, (gains) losses on sales, and impairments |
| |
|
The Company revalues its public and private equity investments and certain public company warrants every quarter. The gains and losses related to this revaluation, as well as gain and losses on disposition, are primarily recorded in Corporate. In the second quarter of 2023, the Company recorded a non-cash impairment charge of $85 million on a private equity investment and related long-term receivables within Other assets in its Corporate segment. In the fourth quarter of 2023, the Company also recorded a non-cash impairment charge of $5 million on a private equity investment in its Power & Vision segment. |
| |
|
|
| |
[b] |
Restructuring |
| |
|
Reversal of restructuring charges: |
|
|
|
|
|
|
|
| |
|
During the second quarter of 2023, the Company’s Power & Vision segment reversed $39 million of charges due to a change in the restructuring plans related to a plant closure. |
| |
|
|
| |
|
Sale of buildings as a result of restructuring activities: |
| |
|
During the second and third quarter of 2023, the Company’s Power & Vision segment recorded a $10 million and $8 million gain on the sale of a building as a result of restructuring activities, respectively. |
| |
|
|
| |
|
Other Restructuring: |
|
|
2021 |
|
2022 |
|
2023 |
| |
|
|
|
|
|
|
1st Q |
2nd Q |
3rd Q |
4th Q |
TOTAL |
|
1st Q |
2nd Q |
3rd Q |
4th Q |
TOTAL |
|
1st Q |
2nd Q |
3rd Q |
4th Q |
TOTAL |
| |
|
Power & Vision |
|
|
15 |
44 |
4 |
4 |
67 |
|
- |
- |
- |
22 |
22 |
|
105 |
5 |
7 |
57 |
174 |
| |
|
Body Exteriors & Structures |
|
|
- |
- |
8 |
- |
8 |
|
- |
- |
- |
- |
- |
|
13 |
9 |
- |
9 |
31 |
| |
|
Seating Systems |
|
|
- |
- |
- |
14 |
14 |
|
- |
- |
- |
- |
- |
|
- |
- |
- |
- |
- |
| |
|
|
|
|
|
|
15 |
44 |
12 |
18 |
89 |
|
- |
- |
- |
22 |
22 |
|
118 |
14 |
7 |
66 |
205 |
| |
[c] |
Impairments and loss on sale of operations in Russia |
| |
|
As a result of the expected lack of future cashflows and the continuing uncertainties connected with the Russian economy, during the second quarter of 2022, the Company recorded a $376 million impairment charge related to its investment in Russia. This included net asset impairments of $173 million and a $203 million reserve against the related foreign currency translation losses that were included in accumulated other comprehensive loss. The net asset impairments consisted of $163 million and $10 million in our Body Exteriors & Structures and our Seating Systems segments, respectively.
During the third quarter of 2023, the Company completed the sale of all of its investments in Russia resulting in a loss of $16 million including a net cash outflow of $23 million. |
| |
|
|
| |
[d] |
Veoneer related termination fees and transaction costs |
| |
|
During 2023, the Company incurred $23 million of transaction costs related to the acquisition of the Veoneer Active Safety Business.
In the fourth quarter of 2021, Veoneer, Inc. (“Veoneer”) terminated its merger agreement with Magna. In connection with the termination of the merger agreement, Veoneer paid the Company a termination fee which, net of the Company’s associated transaction costs, amounted to $100 million. |
| |
|
|
| |
[e] |
Loss on sale of business |
| |
|
During the fourth quarter of 2022, the Company entered into an agreement to sell a European Power & Vision operation. Under the terms of the arrangement, the Company was contractually obligated to provide the buyer with up to $42 million of funding, resulting in a loss of $58 million. During the first quarter of 2023, the Company completed the sale of this operation which resulted in a net cash outflow of $25 million.
During the third quarter of 2021, the Company sold three Body Exteriors & Structures operations in Germany. Under the terms of the arrangement, the Company provided the buyer with $41 million of funding, resulting in a loss on disposal of $75 million. |
| |
|
|
| |
[f] |
Impairments |
|
|
2021 |
|
2022 |
|
2023 |
| |
|
|
|
|
|
|
1st Q |
2nd Q |
3rd Q |
4th Q |
TOTAL |
|
1st Q |
2nd Q |
3rd Q |
4th Q |
TOTAL |
|
1st Q |
2nd Q |
3rd Q |
4th Q |
TOTAL |
| |
|
Body Exteriors & Structures |
|
|
- |
- |
8 |
- |
8 |
|
- |
- |
10 |
12 |
22 |
|
- |
- |
- |
- |
- |
| |
|
Power & Vision |
|
|
- |
- |
- |
- |
- |
|
- |
- |
4 |
- |
4 |
|
- |
- |
- |
- |
- |
| |
|
Seating Systems |
|
|
- |
- |
4 |
- |
4 |
|
- |
- |
- |
- |
- |
|
- |
- |
- |
- |
- |
| |
|
|
|
|
|
|
- |
- |
12 |
- |
12 |
|
- |
- |
14 |
12 |
26 |
|
- |
- |
- |
- |
- |
| |
[g] |
Gain on business combinations |
| |
|
In Seating Systems, during the first quarter of 2021, the Company recognized a $22 million gain on the change in basis of accounting for its previously held equity method investments. Also during the first quarter of 2021, in Power & Vision, substantially all of the assets of the Company's European joint venture with Ford Motor Company, Getrag Ford Transmission GmbH, were distributed to either Ford or the Company, which resulted in the Company recording a gain of $18 million. |
| Q4 2023 Financial Review of Magna International Inc. | Page 4 of 6 | |
| Note 2: |
NON-GAAP MEASURES |
| |
|
The Company presents Adjusted EBIT (Earnings before interest, taxes, Other expense (income),net and amortization of acquired intangible assets); Adjusted Net Income (Net Income before Other expense (income),net, net of tax excluding significant income tax valuation allowance adjustments, and amortization of acquired intangible assets); Adjusted Diluted Earnings per Share and Adjusted EBIT as a percentage of sales; Adjusted Return on Invested Capital and Adjusted Return on Equity. Effective July 1, 2023, the Company revised its calculation of Adjusted EBIT, Adjusted diluted earnings per share and Adjusted Return on Invested Capital to exclude the amortization of acquired intangibles assets. The Company presents these financial figures because such measures are widely used by analysts and investors in evaluating the operating performance of the Company. However, such measures do not have any standardized meaning under U.S. generally accepted accounting principles and may not be comparable to the calculation of similar measures by other companies. Adjusted EBIT, Adjusted Net Income and Adjusted diluted earnings per share presented in the tables below, including for the prior period, have been updated to reflect the revised calculation. |
| |
|
|
| |
|
The following table reconciles Income (loss) from operations before income taxes to Adjusted EBIT: |
| |
|
|
|
|
|
|
2021 |
|
2022 |
|
2023 |
| |
|
|
|
|
|
|
1st Q |
2nd Q |
3rd Q |
4th Q |
TOTAL |
|
1st Q |
2nd Q |
3rd Q |
4th Q |
TOTAL |
|
1st Q |
2nd Q |
3rd Q |
4th Q |
TOTAL |
| |
|
|
|
|
|
|
|
|
|
|
|
|
|
|
|
|
|
|
|
|
|
|
|
| |
|
Income (loss) from operations before income taxes |
|
|
805 |
540 |
27 |
576 |
1,948 |
|
420 |
(88) |
400 |
146 |
878 |
|
275 |
483 |
538 |
310 |
1,606 |
| |
|
|
Exclude: |
|
|
|
|
|
|
|
|
|
|
|
|
|
|
|
|
|
|
|
| |
|
|
|
Amortization of acquired intangible assets |
|
|
12 |
12 |
12 |
12 |
48 |
|
12 |
12 |
11 |
11 |
46 |
|
12 |
13 |
32 |
31 |
88 |
| |
|
|
|
Other expense (income), net |
|
|
(58) |
6 |
180 |
(90) |
38 |
|
61 |
426 |
23 |
193 |
703 |
|
142 |
86 |
(4) |
164 |
388 |
| |
|
|
|
Interest expense |
|
|
23 |
11 |
22 |
22 |
78 |
|
26 |
20 |
18 |
17 |
81 |
|
20 |
34 |
49 |
53 |
156 |
| |
|
Adjusted EBIT |
|
|
782 |
569 |
241 |
520 |
2,112 |
|
519 |
370 |
452 |
367 |
1,708 |
|
449 |
616 |
615 |
558 |
2,238 |
| |
|
|
|
|
|
|
|
|
|
|
|
|
|
|
|
|
|
|
|
|
|
|
|
| |
|
The following table reconciles Net income (loss) attributable to Magna International Inc. to Adjusted net income attributable to Magna International Inc.: |
| |
|
|
|
|
|
|
2021 |
|
2022 |
|
2023 |
| |
|
|
|
|
|
|
1st Q |
2nd Q |
3rd Q |
4th Q |
TOTAL |
|
1st Q |
2nd Q |
3rd Q |
4th Q |
TOTAL |
|
1st Q |
2nd Q |
3rd Q |
4th Q |
TOTAL |
| |
|
|
|
|
|
|
|
|
|
|
|
|
|
|
|
|
|
|
|
|
|
|
|
| |
|
Net income (loss) attributable to Magna International Inc. |
|
|
615 |
424 |
11 |
464 |
1,514 |
|
364 |
(156) |
289 |
95 |
592 |
|
209 |
339 |
394 |
271 |
1,213 |
| |
|
|
Exclude: |
|
|
|
|
|
|
|
|
|
|
|
|
|
|
|
|
|
|
|
| |
|
|
|
Amortization of acquired intangible assets |
|
|
9 |
8 |
9 |
8 |
34 |
|
10 |
10 |
9 |
9 |
38 |
|
10 |
11 |
25 |
25 |
71 |
| |
|
|
|
Investment revaluations, (gains) losses on sales, and impairments |
|
(24) |
(29) |
64 |
(2) |
9 |
|
48 |
38 |
7 |
75 |
168 |
|
18 |
95 |
(14) |
74 |
173 |
| |
|
|
|
Restructuring |
|
|
15 |
31 |
11 |
17 |
74 |
|
- |
- |
- |
22 |
22 |
|
92 |
(26) |
(2) |
60 |
124 |
| |
|
|
|
Impairments and loss on sale of operations in Russia |
|
|
- |
- |
- |
- |
- |
|
- |
361 |
- |
- |
361 |
|
- |
- |
16 |
- |
16 |
| |
|
|
|
Veoneer related termination fees and transaction costs |
|
|
- |
- |
- |
(75) |
(75) |
|
- |
- |
- |
- |
- |
|
- |
22 |
- |
- |
22 |
| |
|
|
|
Impairments |
|
|
- |
- |
9 |
- |
9 |
|
- |
- |
12 |
12 |
24 |
|
- |
- |
- |
- |
- |
| |
|
|
|
Net losses on the sale of business |
|
|
- |
- |
75 |
- |
75 |
|
- |
- |
- |
57 |
57 |
|
- |
- |
- |
- |
- |
| |
|
|
|
Adjustments to Deferred Tax Valuation Allowance |
[i] |
|
- |
- |
- |
(13) |
(13) |
|
(29) |
- |
- |
- |
(29) |
|
- |
- |
- |
(47) |
(47) |
| |
|
|
|
Gain on business combinations |
|
|
(40) |
- |
- |
- |
(40) |
|
- |
- |
- |
- |
- |
|
- |
- |
- |
- |
- |
| |
|
|
|
|
|
|
|
|
|
|
|
|
|
|
|
|
|
|
- |
|
|
|
- |
| |
|
Adjusted net income attributable to Magna International Inc. |
|
|
575 |
434 |
179 |
399 |
1,587 |
|
393 |
253 |
317 |
270 |
1,233 |
|
329 |
441 |
419 |
383 |
1,572 |
| |
|
|
|
|
|
|
|
|
|
|
|
|
|
|
|
|
|
|
|
|
|
|
|
| |
|
The following table reconciles diluted earnings (loss) per common share to Adjusted diluted earnings (loss) per common share: |
| |
|
|
|
|
|
|
2021 |
|
2022 |
|
2023 |
| |
|
|
|
|
|
|
1st Q |
2nd Q |
3rd Q |
4th Q |
TOTAL |
|
1st Q |
2nd Q |
3rd Q |
4th Q |
TOTAL |
|
1st Q |
2nd Q |
3rd Q |
4th Q |
TOTAL |
| |
|
|
|
|
|
|
|
|
|
|
|
|
|
|
|
|
|
|
|
|
|
|
|
| |
|
Diluted earnings (loss) per common share |
|
|
$ 2.03 |
$ 1.40 |
$ 0.04 |
$ 1.54 |
$ 5.00 |
|
$ 1.22 |
$ (0.54) |
$ 1.00 |
$ 0.33 |
$ 2.03 |
|
$ 0.73 |
1.18 |
1.37 |
$ 0.95 |
$ 4.23 |
| |
|
|
Exclude: |
|
|
|
|
|
|
|
|
|
|
|
|
|
|
|
|
|
|
|
| |
|
|
|
Amortization of acquired intangible assets |
|
|
0.03 |
0.04 |
0.03 |
0.02 |
0.11 |
|
0.04 |
0.03 |
0.03 |
0.03 |
0.13 |
|
0.04 |
0.04 |
0.09 |
0.09 |
0.25 |
| |
|
|
|
Investment revaluations, (gains) losses on sales, and impairments |
|
(0.08) |
(0.10) |
0.21 |
(0.01) |
0.03 |
|
0.16 |
0.13 |
0.03 |
0.26 |
0.58 |
|
0.07 |
0.33 |
(0.06) |
0.25 |
0.60 |
| |
|
|
|
Restructuring |
|
|
0.05 |
0.10 |
0.03 |
0.06 |
0.24 |
|
- |
- |
- |
0.08 |
0.08 |
|
0.31 |
(0.09) |
- |
0.20 |
0.43 |
| |
|
|
|
Impairments and loss on sale of operations in Russia |
|
|
- |
- |
- |
- |
- |
|
- |
1.24 |
- |
- |
1.24 |
|
- |
- |
0.06 |
- |
0.06 |
| |
|
|
|
Veoneer related termination fees and transaction costs |
|
|
- |
- |
- |
(0.25) |
(0.25) |
|
- |
- |
- |
- |
- |
|
- |
0.08 |
- |
- |
0.08 |
| |
|
|
|
Impairments |
|
|
- |
- |
0.03 |
- |
0.03 |
|
- |
- |
0.04 |
0.04 |
0.08 |
|
- |
- |
- |
- |
- |
| |
|
|
|
Net losses on the sale of business |
|
|
- |
- |
0.25 |
- |
0.25 |
|
- |
- |
- |
0.20 |
0.20 |
|
- |
- |
- |
- |
- |
| |
|
|
|
Adjustments to Deferred Tax Valuation Allowance |
[i] |
|
- |
- |
- |
(0.04) |
(0.04) |
|
(0.10) |
- |
- |
- |
(0.10) |
|
- |
- |
- |
(0.16) |
(0.16) |
| |
|
|
|
Gain on business combinations |
|
|
(0.14) |
- |
- |
- |
(0.13) |
|
- |
- |
- |
- |
- |
|
- |
- |
- |
- |
- |
| |
|
|
|
|
|
|
|
|
|
|
|
|
|
|
|
|
|
|
|
|
|
|
|
| |
|
Adjusted diluted earnings per common share |
|
|
$ 1.89 |
$ 1.43 |
$ 0.59 |
$ 1.32 |
$ 5.24 |
|
$ 1.32 |
$ 0.87 |
$ 1.10 |
$ 0.94 |
$ 4.24 |
|
$ 1.15 |
$ 1.54 |
$ 1.46 |
$ 1.33 |
$ 5.49 |
| |
|
|
| |
|
[i] Adjustments to Deferred Tax Valuation Allowance |
| |
|
The Company records quarterly adjustments to the valuation allowance against its deferred tax assets in continents like North America, Europe, Asia, and South America. The net effect of these adjustments is a reduction to income expense. |
| Q4 2023 Financial Review of Magna International Inc. | Page 5 of 6 | |
| Note 3: |
SEGMENTED INFORMATION |
|
| |
|
|
| |
|
|
|
|
2021 |
|
2022 |
|
2023 |
| |
|
|
|
|
1st Q |
2nd Q |
3rd Q |
4th Q |
TOTAL |
|
1st Q |
2nd Q |
3rd Q |
4th Q |
TOTAL |
|
1st Q |
2nd Q |
3rd Q |
4th Q |
TOTAL |
| |
|
Body Exteriors & Structures |
|
|
|
|
|
|
|
|
|
|
| |
|
|
Sales |
|
4,025 |
3,647 |
3,185 |
3,620 |
14,477 |
|
4,077 |
3,947 |
3,976 |
4,004 |
16,004 |
|
4,439 |
4,540 |
4,354 |
4,178 |
17,511 |
| |
|
|
Adjusted EBIT |
|
329 |
230 |
100 |
171 |
830 |
|
231 |
194 |
227 |
200 |
852 |
|
272 |
394 |
358 |
280 |
1,304 |
| |
|
|
Adjusted EBIT as a percentage of sales |
|
8.2% |
6.3% |
3.1% |
4.7% |
5.7% |
|
5.7% |
4.9% |
5.7% |
5.0% |
5.3% |
|
6.1% |
8.7% |
8.2% |
6.7% |
7.4% |
| |
|
|
|
|
|
|
|
|
|
|
|
|
|
|
|
|
|
|
|
|
|
| |
|
Power & Vision |
|
|
|
|
|
|
|
|
|
|
|
|
|
|
|
|
|
|
| |
|
|
Sales |
|
3,156 |
2,881 |
2,501 |
2,804 |
11,342 |
|
3,046 |
2,888 |
2,911 |
3,016 |
11,861 |
|
3,323 |
3,462 |
3,745 |
3,775 |
14,305 |
| |
|
|
Adjusted EBIT |
|
306 |
210 |
77 |
178 |
771 |
|
163 |
99 |
124 |
116 |
502 |
|
92 |
124 |
221 |
231 |
668 |
| |
|
|
Adjusted EBIT as a percentage of sales |
|
9.7% |
7.3% |
3.1% |
6.3% |
6.8% |
|
5.4% |
3.4% |
4.3% |
3.8% |
4.2% |
|
2.8% |
3.6% |
5.9% |
6.1% |
4.7% |
| |
|
|
|
|
|
|
|
|
|
|
|
|
|
|
|
|
|
|
|
|
|
| |
|
Seating Systems |
|
|
|
|
|
|
|
|
|
|
|
|
|
|
|
|
|
|
| |
|
|
Sales |
|
1,303 |
1,166 |
1,123 |
1,299 |
4,891 |
|
1,376 |
1,253 |
1,295 |
1,345 |
5,269 |
|
1,486 |
1,603 |
1,529 |
1,429 |
6,047 |
| |
|
|
Adjusted EBIT |
|
56 |
28 |
22 |
51 |
157 |
|
50 |
3 |
37 |
14 |
104 |
|
37 |
67 |
70 |
44 |
218 |
| |
|
|
Adjusted EBIT as a percentage of sales |
|
4.3% |
2.4% |
2.0% |
3.9% |
3.2% |
|
3.6% |
0.2% |
2.9% |
1.0% |
2.0% |
|
2.5% |
4.2% |
4.6% |
3.1% |
3.6% |
| |
|
|
|
|
|
|
|
|
|
|
|
|
|
|
|
|
|
|
|
|
|
| |
|
Complete Vehicles |
|
|
|
|
|
|
|
|
|
|
|
|
|
|
|
|
|
|
| |
|
|
Sales |
|
1,850 |
1,490 |
1,255 |
1,511 |
6,106 |
|
1,275 |
1,403 |
1,213 |
1,330 |
5,221 |
|
1,626 |
1,526 |
1,185 |
1,201 |
5,538 |
| |
|
|
Adjusted EBIT |
|
80 |
79 |
30 |
98 |
287 |
|
50 |
63 |
65 |
57 |
235 |
|
52 |
34 |
(5) |
43 |
124 |
| |
|
|
Adjusted EBIT as a percentage of sales |
|
4.3% |
5.3% |
2.4% |
6.5% |
4.7% |
|
3.9% |
4.5% |
5.4% |
4.3% |
4.5% |
|
3.2% |
2.2% |
-0.4% |
3.6% |
2.2% |
| |
|
|
|
|
|
|
|
|
|
|
|
|
|
|
|
|
|
|
|
|
|
| |
|
Corporate and other |
|
|
|
|
|
|
|
|
|
|
|
|
|
|
|
|
|
|
| |
|
|
Intercompany eliminations |
|
(155) |
(150) |
(145) |
(124) |
(574) |
|
(132) |
(129) |
(127) |
(127) |
(515) |
|
(201) |
(149) |
(125) |
(129) |
(604) |
| |
|
|
Adjusted EBIT |
|
11 |
22 |
12 |
22 |
67 |
|
25 |
11 |
(1) |
(20) |
15 |
|
(4) |
(3) |
(29) |
(40) |
(76) |
| |
|
|
|
|
|
|
|
|
|
|
|
|
|
|
|
|
|
|
|
|
|
| |
|
Total |
|
|
|
|
|
|
|
|
|
|
|
|
|
|
|
|
|
|
| |
|
|
Sales |
|
10,179 |
9,034 |
7,919 |
9,110 |
36,242 |
|
9,642 |
9,362 |
9,268 |
9,568 |
37,840 |
|
10,673 |
10,982 |
10,688 |
10,454 |
42,797 |
| |
|
|
Adjusted EBIT |
|
782 |
569 |
241 |
520 |
2,112 |
|
519 |
370 |
452 |
367 |
1,708 |
|
449 |
616 |
615 |
558 |
2,238 |
| |
|
|
Adjusted EBIT as a percentage of sales |
|
7.7% |
6.3% |
3.0% |
5.7% |
5.8% |
|
5.4% |
4.0% |
4.9% |
3.8% |
4.5% |
|
4.2% |
5.6% |
5.8% |
5.3% |
5.2% |
| Q4 2023 Financial Review of Magna International Inc. |
Page 6 of 6 |
|
Exhibit 99.3

Q4 & Full Year 2023 + 2024 Outlook February 9, 2024

Louis Tonelli Vice President, Investor Relations Q4 & FULL YEAR 2023 + 2024 OUTLOOK 2

Forward Looking Statements Q4 & FULL YEAR 2023 + 2024 OUTLOOK 3 Certain statements in this document constitutes "forward - looking information" or "forward - looking statements" (collectively, "forward - looking statements") . Any such forward - looking statements are intended to provide information about management's current expectations and plans and may not be appropriate for other purposes . Forward - looking statements may include financial and other projections, as well as statements regarding our future plans, strategic objectives or economic performance, or the assumptions underlying any of the foregoing, and other statements that are not recitations of historical fact . We use words such as "may", "would", "could", "should", "will", "likely", "expect", "anticipate", "believe", "intend", "plan", "aim", "forecast", "outlook", "project", "estimate", "target" and similar expressions suggesting future outcomes or events to identify forward - looking statements . The following table identifies the material forward - looking statements contained in this document, together with the material potential risks that we currently believe could cause actual results to differ materially from such forward - looking statements . Readers should also consider all of the risk factors which follow below the table : Material Potential Risks Related to Applicable Forward - Looking Statement Material Forward - Looking Statement Light vehicle sales levels Production disruptions, including as a result of labour strikes Supply disruptions Production allocation decisions by OEMs Light Vehicle Production Same risks as for Light Vehicle Production above The impact of elevated interest rates and availability of credit on consumer confidence and in turn vehicle sales and production The impact of deteriorating vehicle affordability on consumer demand, and in turn vehicle sales and production Misalignment between EV production and sales Strategic and other risks relating to the transition to electromobility Concentration of sales with six customers Shifts in market shares among vehicles or vehicle segments Shifts in consumer "take rates" for products we sell Relative foreign exchange rates Total Sales Unconsolidated Sales Segment Sales Weighted Sales Growth Over Market ( 2023 - 2026 Sales in Megatrend areas (to 2026 ) Same risks as for Total Sales/Unconsolidated Sales/Segment Sales/Weighted Sales Growth/Megatrend Sales above Successful execution of critical program launches Operational underperformance Product warranty/recall risks Production inefficiencies in our operations due to volatile vehicle production allocation decisions by OEMs Higher costs incurred to mitigate the risk of supply disruptions Inflationary pressures Our ability to secure cost recoveries from customers and/or otherwise offset higher input costs Price concessions Risks of conducting business with Fisker and other newer EV - focused OEMs Commodity cost volatility Scrap steel price volatility Higher labour costs Tax risks Adjusted EBIT Margin Segment and Megatrend Area Adjusted EBIT Margin Potential Margin Expansion (to 2026 ) Target Leverage Ratio Same risks as for Total Sales/Unconsolidated Sales/Segment Sales/Weighted Sales Growth/Megatrend Sales and Adjusted EBIT Margin/Segment and Megatrend Area Adjusted EBIT Margin/Potential Margin Expansion/Target Leverage Ratio above Free Cash Flow

Forward Looking Statements (cont.) Q4 & FULL YEAR 2023 + 2024 OUTLOOK 4 Forward - looking statements are based on information currently available to us and are based on assumptions and analyses made by us in light of our experience and our perception of historical trends, current conditions and expected future developments, as well as other factors we believe are appropriate in the circumstances. While we believe we have a reasonable basis for mak ing any such forward - looking statements, they are not a guarantee of future performance or outcomes. In addition to the factors in the table above, whether actual results and developments conform to our expectations and predictions is subject to a number o f r isks, assumptions, and uncertainties, many of which are beyond our control, and the effects of which can be difficult to pred ict , including, without limitation: Acquisition Risks inherent merger and acquisition risks; acquisition integration risk; Other Business Risks risks related to conducting business through joint ventures; intellectual property risks; risks of conducting business in foreign markets; fluctuations in relative currency values; ability to achieve expected returns on capital investments reduced financial flexibility as a result of an economic shock; changes in credit ratings assigned to us; the unpredictability of, and fluctuation in, the trading price of our Common Shares; Legal, Regulatory and Other Risks legal claims and/or regulatory actions against us; changes in laws and regulations, including tax laws and laws related to vehicle emissions; potential restrictions on free trade; and trade disputes/tariffs. Supply Chain Risks semiconductor supply chain disruptions and price increases; other supply chain disruptions; regional energy disruptions and pricing; a deterioration of the financial condition of our supply base; Manufacturing/Operational Risks manufacturing/Operational Risks product and new facility launch risks; operational underperformance; restructuring costs; impairment charges; skilled labour attraction/retention; leadership expertise and succession; Pricing Risks pricing risks between time of quote and start of production; price concessions; commodity price volatility; declines in scrap steel/aluminum prices; Warranty / Recall Risks costs related to repair or replacement of defective products, including due to a recall; warranty or recall costs that exceed warranty provision or insurance coverage limits; product liability claims; Climate Change Risks transition, physical, strategic and other risks related to climate change, as described in our Sustainability Report; IT Security/Cybersecurity Risks IT/Cybersecurity breach; product Cybersecurity breach; Macroeconomic, Geopolitical and Other Risks inflationary pressures; interest rate levels; geopolitical risks; Risks Related to the Automotive Industry economic cyclicality; regional production volume declines; deteriorating vehicle affordability; misalignment between Electric Vehicle (“EV”) production and sales; intense competition; Strategic Risks alignment of our product mix with the "Car of the Future"; our evolving business risk profile as a result of increased investment in battery enclosures, powertrain electrification and autonomous/assisted driving systems and new mobility business models; our ability to consistently develop and commercialize innovative products or processes; our investments in mobility and technology companies; strategic and other risks related to the transition to electromobility; inability to achieve future investment returns that equal or exceed past returns; Customer - Related Risks concentration of sales with six customers; inability to significantly grow our business with Asian customers; growth of EV - focused OEMs, including risks related to limited financial, liquidity/capital or other resources, less mature product development and validation processes, uncertain market acceptance of their products/services and untested business models; dependence on outsourcing; OEM consolidation and cooperation; shifts in market shares among vehicles or vehicle segments; shifts in consumer "take rates" for products we sell; potential loss of any material purchase orders; production disruptions affecting our customers; quarterly sales fluctuations; In evaluating forward - looking statements or forward - looking information, we caution readers not to place undue reliance on any f orward - looking statement. Additionally, readers should specifically consider the various factors which could cause actual events or results to differ materially from those indicated by such forward - looking statements, including the risks, assumptions and un certainties above which are: discussed under the “Industry Trends and Risks” heading of our Management’s Discussion and Analysis; and set out in our revised Annual Information Form filed with securities commissions in Canada, our annual report on Form 40 - F / 40 - F/A filed with the United States Securities and Exchange commission, and subsequent filings. Readers should also consider discussion of our risk mitigation activities with respect to certain risk factors, which can be als o found in our Annual Information Form. Additional information about Magna, including our Annual Information Form, is availab le through the System for Electronic Data Analysis and Retrieval+ (SEDAR+) at www.sedarplus.com .

Q4 & FULL YEAR 2023 + 2024 OUTLOOK 5 Reminders All amounts are in U.S. Dollars. Effective July 1, 2023 we revised our calculation of Non - GAAP measures to exclude amortization of acquired intangible assets. The historical presentation of non - GAAP measures has also been updated to reflect the revised calculations. Today's discussion excludes the impact of other expense (income), net ("Unusual Items") and amortization of acquired intangible assets. Please refer to the reconciliation of Non - GAAP measures in our press release dated February 9, 2024 for further information. "Organic", in the context of sales movements, means "excluding the impact of foreign exchange, acquisitions and divestitures". Weighted Growth over Market ( GoM ) compares organic sales growth (%) to vehicle production change (%) after applying Magna geographic sales weighting, excluding Complete Vehicles, to regional production.

Q4 & FULL YEAR 2023 + 2024 OUTLOOK 6 • 2023 Highlights and Q4 2023 Operating Results • 2024 Outlook • Financial Strategy Agenda

Swamy Kotagiri Chief Executive Officer Q4 & FULL YEAR 2023 + 2024 OUTLOOK 7

2023 Highlights Q4 & FULL YEAR 2023 + 2024 OUTLOOK 8
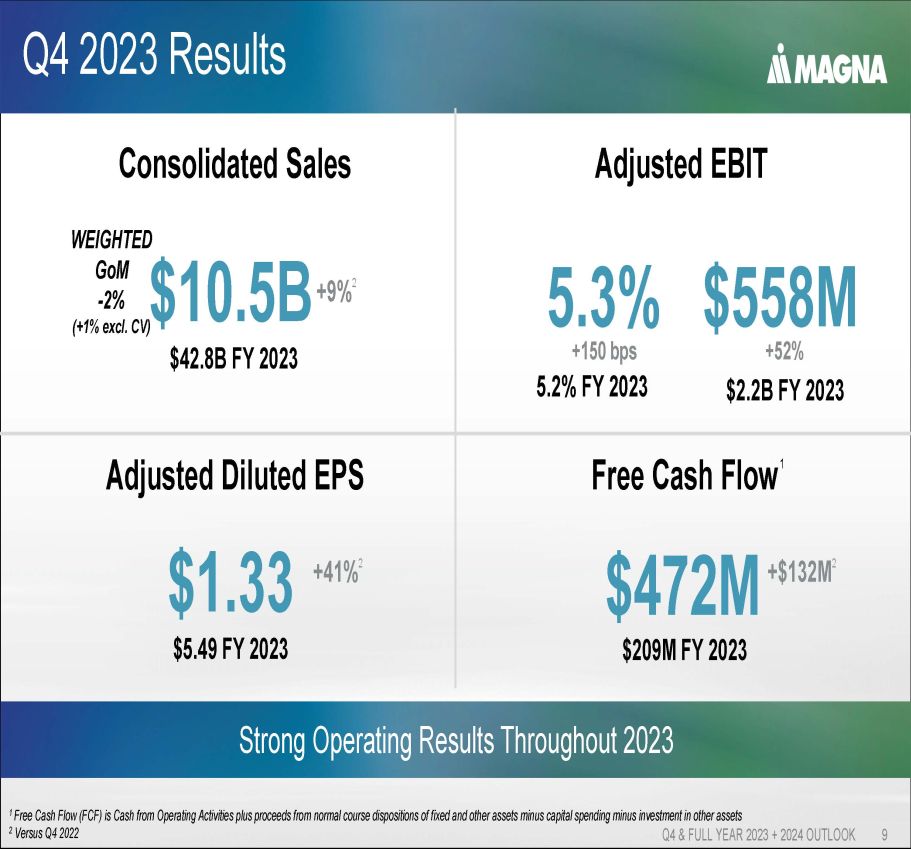
Q4 2023 Results Q4 & FULL YEAR 2023 + 2024 OUTLOOK 9 Strong Operating Results Throughout 2023 1 Free Cash Flow (FCF) is Cash from Operating Activities plus proceeds from normal course dispositions of fixed and other asset s m inus capital spending minus investment in other assets 2 Versus Q4 2022 Consolidated Sales $10.5B WEIGHTED GoM - 2% (+1% excl. CV) $42.8B FY 2023 +9% 2 Adjusted Diluted EPS $1.33 $5.49 FY 2023 +41 % 2 Free Cash Flow 1 $472M $209M FY 2023 +$132M 2 Adjusted EBIT 5.2% FY 2023 5.3% +150 bps $558M +52% $2.2B FY 2023

2023 Accomplishments Q4 & FULL YEAR 2023 + 2024 OUTLOOK 10 • Executed on Operational Excellence activities • 107 customer recognition awards • Committed to net zero by 2050 Operational Excellence • New business in core areas: ‒ Advanced front camera modules ‒ Battery enclosures ‒ E - Drives • Industry - first 100% melt recyclable foam and trim seating solutions Driving Innovation • Launched Operational Management Accelerator program • Named one of Ethisphere's "World's Most Ethical Companies" – 2 nd consecutive year • Named one of Fortune's "World's Most Admired Companies" – 7 th consecutive year People Focus • Weighted Sales Growth over Mark et o f 2% (3% excl. Complete Vehicles) • ~$12 billion in business awards (average annual sales) • Continued progress on Veoneer Active Safety integration Sales Growth

Pat McCann Executive Vice President & Chief Financial Officer Q4 & FULL YEAR 2023 + 2024 OUTLOOK 11

Q4 and 2023 Results Q4 & FULL YEAR 2023 + 2024 OUTLOOK 12

2023 Financial Results Q4 & FULL YEAR 2023 + 2024 OUTLOOK 13 Consolidated Sales ($Billions) $37.8 $42.8 0.0 0.1 0.1 0.1 0.1 0.1 0.1 0.1 $0.0 $5.0 $10.0 $15.0 $20.0 $25.0 $30.0 $35.0 $40.0 $45.0 2022 2023 +13% Adjusted EPS ($) $4.24 $5.49 0.0 0.1 0.1 0.1 0.1 0.1 0.1 0.1 $0.00 $1.00 $2.00 $3.00 $4.00 $5.00 $6.00 2022 2023 +29% 4.5% 5.2% 0.0% 1.0% 2.0% 3.0% 4.0% 5.0% 6.0% 2022 2023 Adjusted EBIT Margin (%) +70bps

Q4 2023 Financial Results Q4 & FULL YEAR 2023 + 2024 OUTLOOK 14 Consolidated Sales ($Billions) $9.6 $10.5 0.0 0.1 0.1 0.1 0.1 0.1 0.1 0.1 $0.0 $2.0 $4.0 $6.0 $8.0 $10.0 Q4'22 Q4'23 +9% Adjusted EPS ($) $0.94 $1.33 0.0 0.1 0.1 0.1 0.1 0.1 0.1 0.1 $0.00 $0.20 $0.40 $0.60 $0.80 $1.00 $1.20 $1.40 Q4'22 Q4'23 +41% Adjusted EBIT Margin (%) 3.8% 5.3% 0.0% 1.0% 2.0% 3.0% 4.0% 5.0% 6.0% Q4'22 Q4'23 +150bps

Q4 2023 Financial Results Q4 & FULL YEAR 2023 + 2024 OUTLOOK 15 Weighted GoM - 2% (+1% excl. Complete Vehicles) Consolidated Sales ($Millions) +9% 1 Q4 2023 PRODUCTION 7% Global 5% North America - 11% Detroit - based 7% Europe 12% China 6% Magna Weighted 1 Includes customer recoveries of certain higher production input costs and contractual customer price givebacks

Q4 2023 Financial Results Q4 & FULL YEAR 2023 + 2024 OUTLOOK 16 • Operational – Operational excellence activities – Productivity and efficiency improvements – Higher tooling contribution • Volumes, Performance & Other – Earnings on higher sales – Impact of UAW strike ( - ) – Program changeover in Complete Vehicles ( - ) • Non - Recurring – Lower warranty costs (+) – Net commercial items (+) – Restructuring costs ( - ) – Lower amortization on pubco securities ( - ) – FX loss on Argentinian peso ( - ) • Lower Net Input Costs – Customer recoveries – Lower costs for energy and commodities – Higher labour costs • Lower Equity Income – Earnings on higher unconsolidated sales (+) – Finalization of year end tax balances in one JV ( - ) – Unfavourable product mix ( - ) 1 Excludes the amortization of acquired intangibles $558 1 $367 1 Adjusted EBIT & Margin ($Millions) 1 1
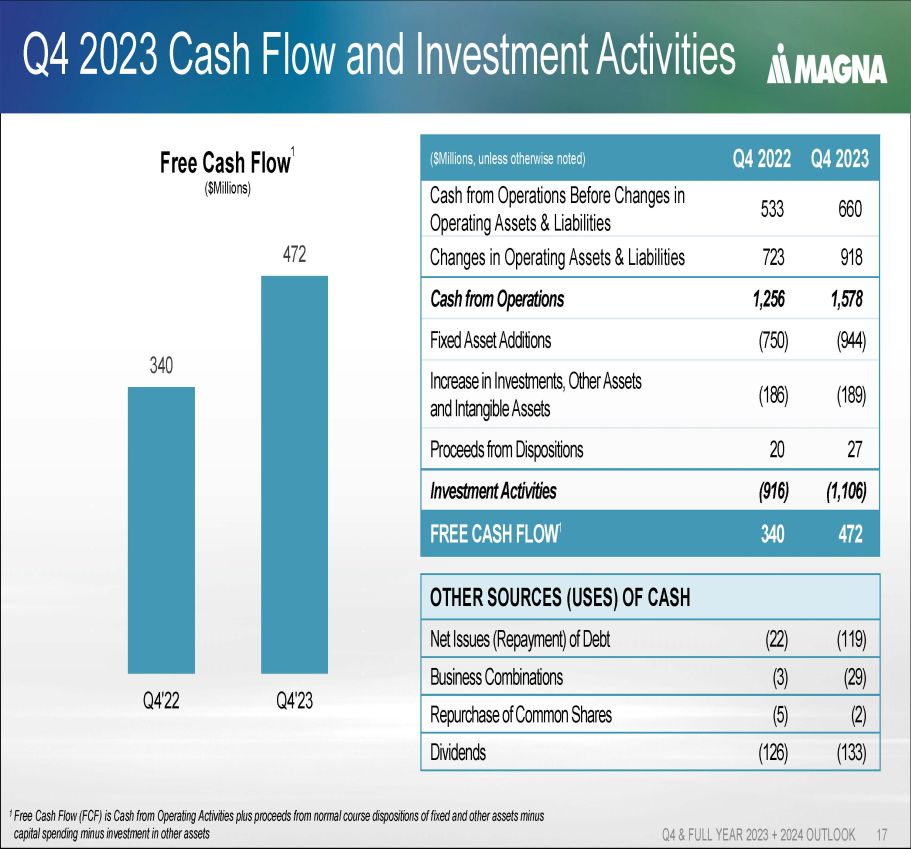
Q4 2023 Cash Flow and Investment Activities Q4 & FULL YEAR 2023 + 2024 OUTLOOK 17 Free Cash Flow 1 ($Millions) OTHER SOURCES (USES) OF CASH (119) (22) Net Issues (Repayment) of Debt (29) (3) Business Combinations (2) (5) Repurchase of Common Shares (133) (126) Dividends Q4 2023 Q4 2022 ($Millions, unless otherwise noted) 660 533 Cash from Operations Before Changes in Operating Assets & Liabilities 918 723 Changes in Operating Assets & Liabilities 1,578 1,256 Cash from Operations (944) (750) Fixed Asset Additions (189) (186) Increase in Investments, Other Assets and Intangible Assets 27 20 Proceeds from Dispositions (1,106) (916) Investment Activities 472 340 FREE CASH FLOW 1 340 472 0.0 0.0 0.0 0.0 0.1 0.1 0.1 0.1 0.1 0.1 0.1 0 50 100 150 200 250 300 350 400 450 500 Q4'22 Q4'23 1 Free Cash Flow (FCF) is Cash from Operating Activities plus proceeds from normal course dispositions of fixed and other asset s m inus capital spending minus investment in other assets

Annualized Dividend 1 Q4 & FULL YEAR 2023 + 2024 OUTLOOK 18 Increased Q4 Dividend for 14 th Straight Year 0.50 0.55 0.64 0.76 0.88 1.00 1.12 1.32 1.46 1.60 1.72 1.80 1.84 1.90 0.0 0.1 0.1 0.1 0.1 0.1 0.1 0.1 0.00 0.20 0.40 0.60 0.80 1.00 1.20 1.40 1.60 1.80 2.00 Q4'10 Q4'11 Q4'12 Q4'13 Q4'14 Q4'15 Q4'16 Q4'17 Q4'18 Q4'19 Q4'20 Q4'21 Q4'22 Q4'23 ($ per share) 11% CAGR 1 Based on Q4 run rate

2024 Outlook Q4 & FULL YEAR 2023 + 2024 OUTLOOK 19
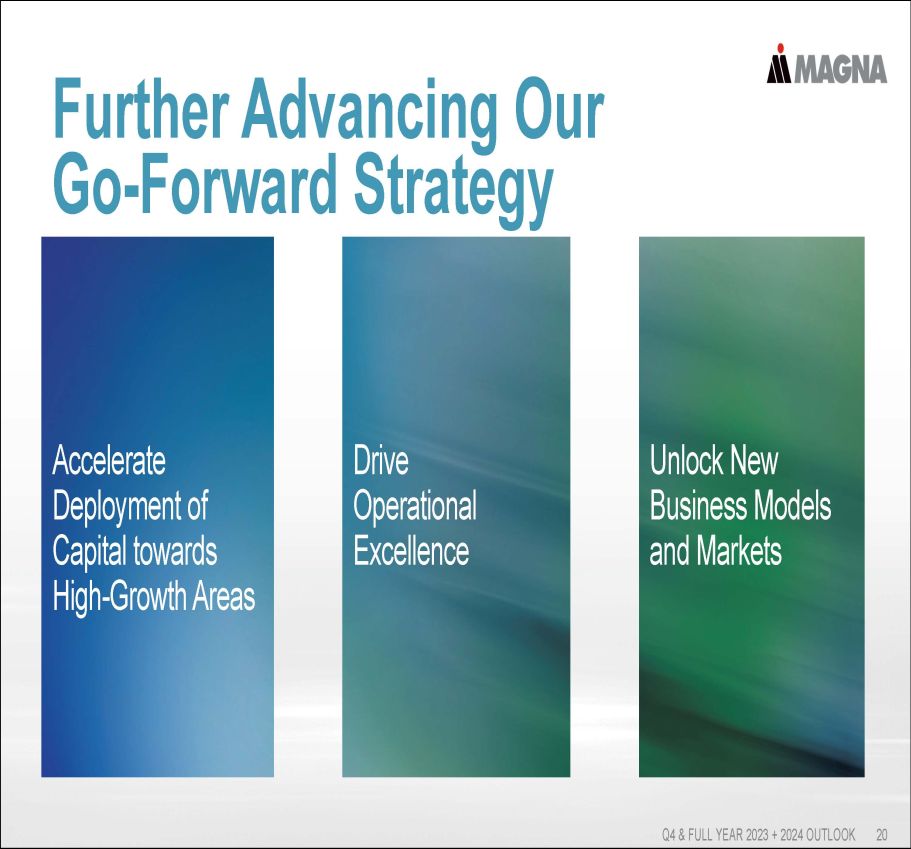
Q4 & FULL YEAR 2023 + 2024 OUTLOOK 20 Further Advancing Our Go - Forward Strategy Accelerate Deployment of Capital towards High - Growth Areas Unlock New Business Models and Markets Drive Operational Excellence
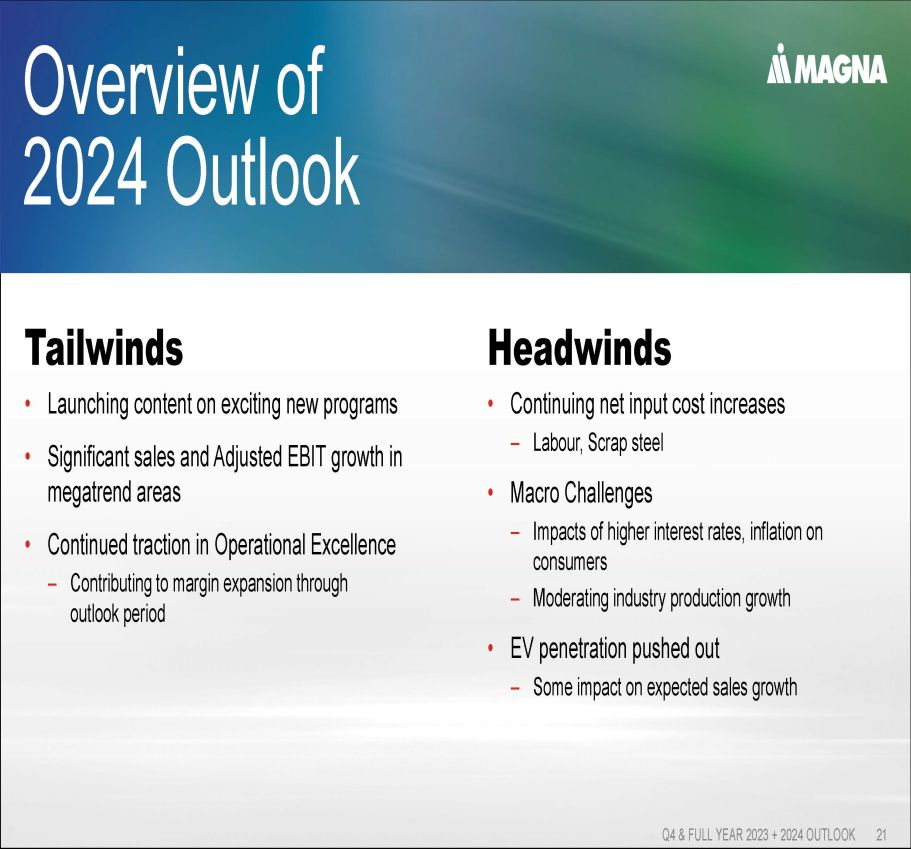
Q4 & FULL YEAR 2023 + 2024 OUTLOOK 21 Tailwinds • Launching content on exciting new programs • Significant sales and Adjusted EBIT growth in megatrend areas • Continued traction in Operational Excellence – Contributing to margin expansion through outlook period Headwinds • Continuing net input cost increases – Labour , Scrap steel • Macro Challenges – Impacts of higher interest rates, inflation on consumers – Moderating industry production growth • EV penetration pushed out – Some impact on expected sales growth Overview of 2024 Outlook
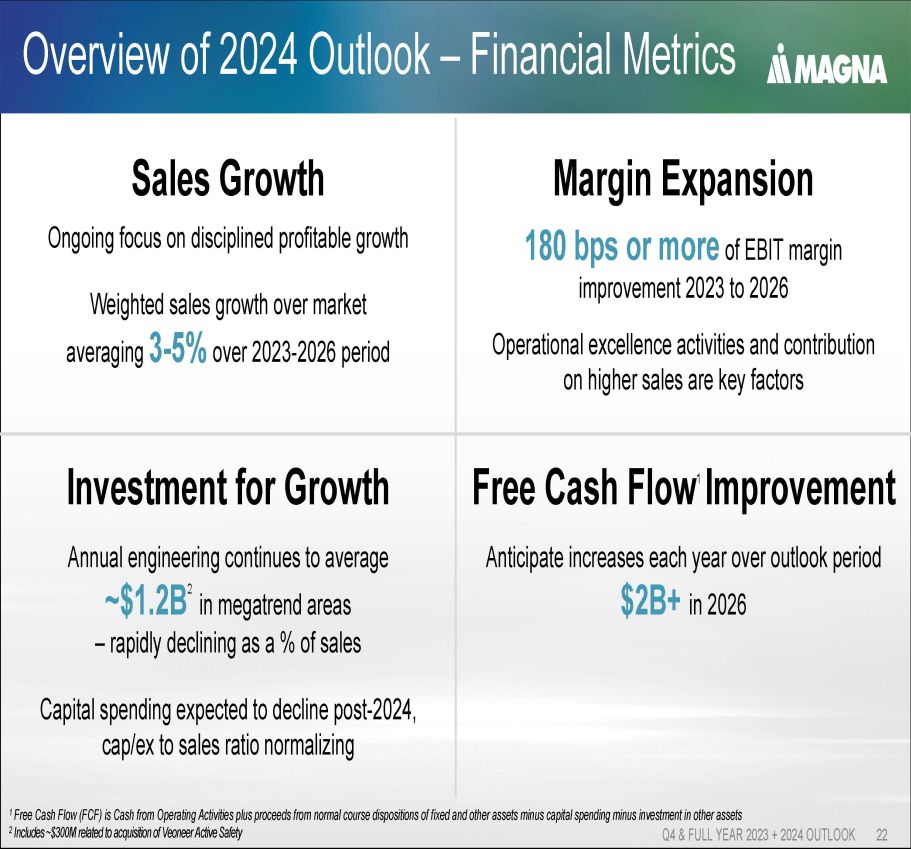
Overview of 2024 Outlook – Financial Metrics Q4 & FULL YEAR 2023 + 2024 OUTLOOK 22 1 Free Cash Flow (FCF) is Cash from Operating Activities plus proceeds from normal course dispositions of fixed and other asset s m inus capital spending minus investment in other assets 2 Includes ~$300M related to acquisition of Veoneer Active Safety Sales Growth Ongoing focus on disciplined profitable growth Weighted sales growth over market averaging 3 - 5% over 2023 - 2026 period Free Cash Flow 1 Improvement Anticipate increases each year over outlook period $2B+ in 2026 Investment for Growth Annual engineering continues to average ~$1.2B 2 in megatrend areas – rapidly declining as a % of sales Capital spending expected to decline post - 2024, cap/ex to sales ratio normalizing Margin Expansion 180 bps or more of EBIT margin improvement 2023 to 2026 Operational excellence activities and contribution on higher sales are key factors

Rapid Megatrend Sales Growth through Outlook Q4 & FULL YEAR 2023 + 2024 OUTLOOK 23 1 Powertrain electrification includes consolidated 48 - volt and high - voltage sales Sales 0% 20% 40% 60% 80% 100% 120% 0.0 1.0 2.0 3.0 4.0 5.0 6.0 7.0 8.0 2022 2023 2024F 2025F 2026F ($Billions) (% of sales) 4.2 - 4.6 2.5 Powertrain Electrification 1 Battery Enclosures Active Safety Eng. % of Sales <1.0 5.5 - 6.0 6.6 - 7.2 >($500) 2022 2023 2024F 2025F 2026F Adjusted EBIT ($Millions) Megatrend profitability inflection point expected in 2026

Consolidated Outlook Q4 & FULL YEAR 2023 + 2024 OUTLOOK 24

Financial Outlook – Key Assumptions Q4 & FULL YEAR 2023 + 2024 OUTLOOK 25 Automotive Light Vehicle Production (millions of units) 2026 2024 2023 16.1 15.7 15.6 North America 17.3 17.4 17.5 Europe 30.6 28.3 28.6 China ~1% ('23 - '26) ~0% ('23 - '24) Weighted GLVP CAGR U.S. Foreign Exchange Rates 2026 2024 2023 0.740 0.740 0.742 Cdn 1.080 1.080 1.082 Euro 0.137 0.137 0.141 RMB Acquisitions/Divestitures No material unannounced acquisitions/divestitures Content Growth Driving Organic Sales

Consolidated Sales Q4 & FULL YEAR 2023 + 2024 OUTLOOK 26 ($Billions) • New and replacement program launches • Higher directed content on MB program (Complete Vehicles) • CV: Program EOPs, full - cost (BMW) versus value - add ( Fisker ) sales accounting • Acquisition of Veoneer Active Safety 43.8 - 45.4 48.8 - 51.2 Organic Sales CAGR 4 - 6% Weighted GoM 3 - 5%
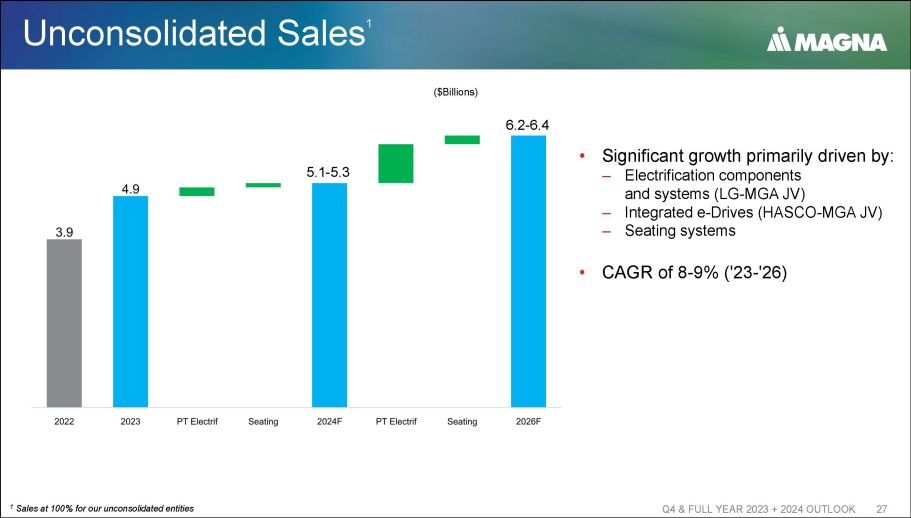
Unconsolidated Sales 1 Q4 & FULL YEAR 2023 + 2024 OUTLOOK 27 ($Billions) 1 Sales at 100% for our unconsolidated entities • Significant growth primarily driven by: – Electrification components and systems (LG - MGA JV) – Integrated e - Drives (HASCO - MGA JV) – Seating systems • CAGR of 8 - 9% ('23 - '26) 5.1 - 5.3 6.2 - 6.4

Consolidated Adjusted EBIT Margin % Q4 & FULL YEAR 2023 + 2024 OUTLOOK 28 • Volumes, performance & other – Contribution on higher sales • Operational – Operational Excellence activities – Productivity and efficiency improvements – H igher launch and facility costs associated with new programs ( - ) • Higher net input costs – Increased labour costs – Lower scrap sales 5.4 - 6.0% Equity Income ($M) 89 112 120 - 150
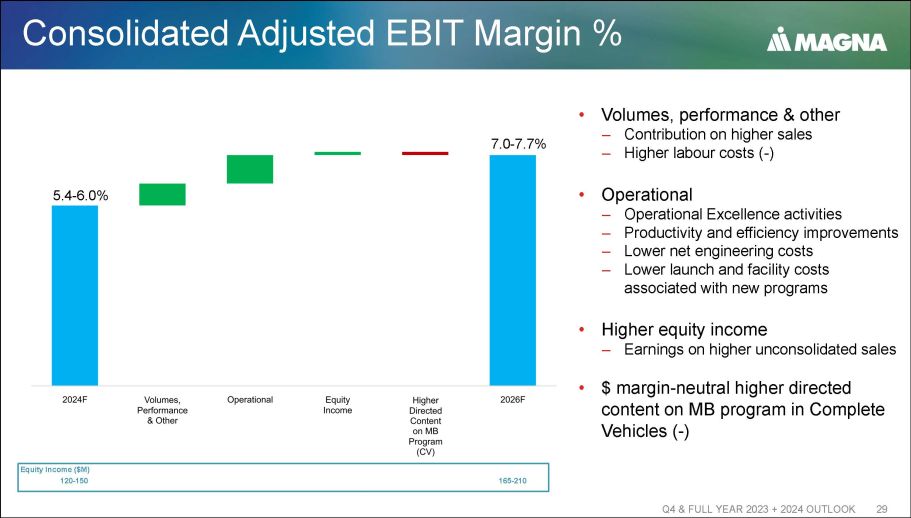
Consolidated Adjusted EBIT Margin % Q4 & FULL YEAR 2023 + 2024 OUTLOOK 29 5.4 - 6.0% 7.0 - 7.7% Equity Income ($M) 120 - 150 165 - 210 • Volumes, performance & other – Contribution on higher sales – Higher labour costs ( - ) • Operational – Operational Excellence activities – Productivity and efficiency improvements – Lower net engineering costs – Lower launch and facility costs associated with new programs • Higher equity income – Earnings on higher unconsolidated sales • $ margin - neutral higher directed content on MB program in Complete Vehicles ( - )

Segment Outlook Q4 & FULL YEAR 2023 + 2024 OUTLOOK 30

Segment Sales & Adjusted EBIT Margin % Q4 & FULL YEAR 2023 + 2024 OUTLOOK 31 2022 2023 2024F 2026F 5.3 7.4 7.4 - 8.0 8.3 - 9.0 2022 2023 2024F 2026F 2.0 3.6 3.1 - 3.7 4.5 - 5.2 2022 2023 2024F 2026F 4.2 4.7 5.5 - 6.1 7.8 - 8.5 2022 2023 2024F 2026F 4.5 2.2 1.2 - 1.8 2.1 - 2.8 Sales ($Billions) Adjusted EBIT Margin % Body Exteriors & Structures 2022 2023 2024F 2026F 16.0 17.5 17.4 - 18.0 19.6 - 20.6 '23 - '26 4 - 6% CAGR Weighted GoM 3 - 5% Power & Vision 2022 2023 2024F 2026F 11.9 15.8 - 16.2 16.8 - 17.4 '23 - '26 6 - 7% CAGR 14.3 Weighted GoM 3 - 5% Seating Systems 2022 2023 2024F 2026F 5.3 6.0 5.5 - 5.8 6.5 - 6.9 '23 - '26 2 - 5% CAGR Weighted GoM 2 - 4% Complete Vehicles 2022 2023 2024F 2026F 5.2 5.5 5.6 - 5.9 6.1 - 6.5 Weighted GoM 3 - 5% '23 - '26 3 - 6% CAGR

Financial Strategy Q4 & FULL YEAR 2023 + 2024 OUTLOOK 32

Q4 & FULL YEAR 2023 + 2024 OUTLOOK 33 Maintain Strong Balance Sheet • Preserve liquidity and high investment grade credit ratings – Adj. debt to Adj. EBITDA ratio between 1.0 - 1.5x • Maintain flexibility to invest for growth Invest For Growth • Organic and inorganic opportunities • Innovation Return Capital To Shareholders • Continued dividend growth over time • Repurchase shares with excess liquidity Capital Allocation Principles

Continued Financial Strength Q4 & FULL YEAR 2023 + 2024 OUTLOOK 34 LEVERAGE RATIO (LTM, 31DEC23) ($M illions) 7,371 Adjusted Debt 3,905 Adjusted EBITDA 1.89 Adjusted Debt / Adjusted EBITDA TOTAL LIQUIDITY (31DEC23) ($M illions) 1,198 Cash 2,989 Available Term & Operating Lines of Credit 4,187 Total Liquidity Investment - grade ratings from Moody's, S&P, DBRS 2.19 2.02 1.89 0.0 0.5 1.0 1.5 2.0 2.5 Q2'23 Q3'23 Q4'23F 2025F Adjusted Debt/EBITDA Back in target range during 2025
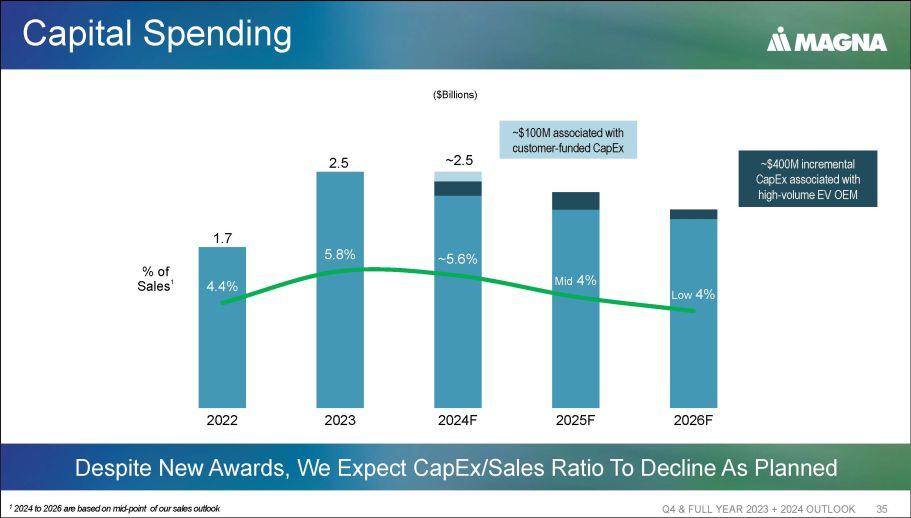
Capital Spending Q4 & FULL YEAR 2023 + 2024 OUTLOOK 35 Despite New Awards, We Expect CapEx /Sales Ratio To Decline As Planned 1 2024 to 2026 are based on mid - point of our sales outlook ($Billions) 1.7 2.5 ~2.5 4.4 % 5.8 % ~ 5.6 % Mid 4% Low 4% 2022 2023 2024F 2025F 2026F % of Sales 1 ~$400M incremental CapEx associated with high - volume EV OEM ~$100M associated with customer - funded CapEx

Free Cash Flow 1 Generation Q4 & FULL YEAR 2023 + 2024 OUTLOOK 36 FCF Accelerating As Earnings Grow and CapEx Declines 1 Free Cash Flow (FCF) is Cash from Operating Activities plus proceeds from normal course dispositions of fixed and other asset s m inus capital spending minus investment in other assets 0.1 0.2 0.6 - 0.8 2.0+ 2022 2023 2024F 2025F 2026F ($Billions)
Q4 & FULL YEAR 2023 + 2024 OUTLOOK 37 In Summary Remain Confident in Executing Plan and Driving Strategy Continued organic sales growth over market • Megatrend sales to increase >$4B over 2023 - 2026 Further margin expansion, including through ongoing Operational Excellence activities Expect at least $1.7B growth in Adjusted EBITDA 2023 - 2026 Free cash flow generation accelerating over outlook period

Q4 & FULL YEAR 2023 + 2024 OUTLOOK 38

Appendix – Q4 2023 Results Q4 & FULL YEAR 2023 + 2024 OUTLOOK 39

Q4 2023 Reconciliation of Reported Results Q4 & FULL YEAR 2023 + 2024 OUTLOOK 40 Adjusted (2) (1) Reported Excluding: (1) Other Expense (Income), Net and (2) Amortization of Acquired and Intangible Assets $Millions, except for share figures $ 505 $ 31 $ 164 $ 310 Income Before Income Taxes 4.8% 3.0% % of Sales $ 95 $ 6 $ 77 $ 12 Income Tax Expense 18.8% 3.9% % of Pretax $ (27) $ - $ - $ (27) Income Attributable to Non - Controlling Interests $ 383 $ 25 $ 87 $ 271 Net Income Attributable to Magna $ 1.33 $ 0.09 $ 0.30 $ 0.94 Earnings Per Share

Q4 2022 Reconciliation of Reported Results Q4 & FULL YEAR 2023 + 2024 OUTLOOK 41 Excl. Other Expense, Net (2) (1) Reported Excluding: (1) Other Expense, Net (2) Restate $Millions, except for share figures $ 350 $ 11 $ 193 $ 146 Income Before Income Taxes 3.7% 1.5% % of Sales $ 64 $ 2 $ 27 $ 35 Income Tax Expense 18.3% 24.0% % of Pretax $ (16) $ - $ - $ (16) Income Attributable to Non - Controlling Interests $ 270 $ 9 $ 166 $ 95 Net Income Attributable to Magna $ 0.94 $ 0.03 $ 0.58 $ 0.33 Earnings Per Share

Sales Performance vs Market Q4 & FULL YEAR 2023 + 2024 OUTLOOK 42 Performance vs Weighted Global Production (Weighted GoM) Organic 1 Reported (3%) 3% 4% Body Exteriors & Structures 5% 11% 25% Power & Vision (1%) 5% 6% Seating Systems (21%) (15%) (10%) Complete Vehicles (2%) 4% 9% TOTAL SALES 7% Unweighted Production Growth 6% Weighted Production Growth 2 1 Organic Sales represents sales excluding acquisitions net of divestitures and FX movements 2 Calculated by applying Magna geographic sales weighting, excluding Complete Vehicles, to regional production Q4 2023 vs Q4 2022

Sales Performance vs Market Q4 & FULL YEAR 2023 + 2024 OUTLOOK 43 Performance vs Weighted Global Production (Weighted GoM) Organic 1 Reported 1% 10% 9% Body Exteriors & Structures 5% 14% 21% Power & Vision 7% 16% 15% Seating Systems (5%) 4% 6% Complete Vehicles 2% 11% 13% TOTAL SALES 8% Unweighted Production Growth 9% Weighted Production Growth 2 1 Organic Sales represents sales excluding acquisitions net of divestitures and FX movements 2 Calculated by applying Magna geographic sales weighting, excluding Complete Vehicles, to regional production 2023 vs 2022

Segment Impact on Adjusted EBIT % of Sales Q4 & FULL YEAR 2023 + 2024 OUTLOOK 44 Adjusted EBIT as a Percentage of Sales Adjusted EBIT Sales ($Millions) 3.8% $ 367 $ 9,568 4 th Quarter of 2022 Increase (Decrease) Related to: 0.7% $ 80 $ 174 Body Exteriors & Structures 0.8% $ 115 $ 759 Power & Vision 0.3% $ 30 $ 84 Seating Systems (0.1%) $ (14) $ (129) Complete Vehicles (0.2%) $ (20) $ (2) Corporate and Other 5.3% $ 558 $ 10,454 4 th Quarter of 2023 Q4 2023 vs Q4 2022

Geographic Sales Q4 & FULL YEAR 2023 + 2024 OUTLOOK 45 Q4 2022 Q4 2023 $4.7B $4.9B $0.0B $1.0B $2.0B $3.0B $4.0B $5.0B $6.0B North America PRODUCTION 5% $3.7B $4.1B $0.0B $0.5B $1.0B $1.5B $2.0B $2.5B $3.0B $3.5B $4.0B $4.5B Europe PRODUCTION 7% $123M $141M $0M $20M $40M $60M $80M $100M $120M $140M $160M S.A. PRODUCTION 4% Rest of World Q4 2023 vs Q4 2022 Asia ASIA PRODUCTION 8% China Production 12% $1.2B $1.7B $0.0B $0.2B $0.4B $0.6B $0.8B $1.0B $1.2B $1.4B $1.6B $1.8B

Q4 2023 Financial Results Q4 & FULL YEAR 2023 + 2024 OUTLOOK 46 CHANGE Q4 2023 Q4 2022 ($Millions, unless otherwise noted) 191 558 367 Adjusted EBIT 1 36 53 17 Interest Expense 155 505 350 Adjusted Pre - Tax Income 31 95 64 Adjusted Income Taxes 11 27 16 Income Attributable to Non - Controlling Interests 113 383 270 Adjusted Net Income Attributable to Magna 0.3 286.6 286.3 Diluted Share Count (millions of units) 0.39 1.33 0.94 Adjusted EPS ($) 18.3% 18.8% 1 Excludes the amortization of acquired intangibles

Capital Allocation Principles Q4 & FULL YEAR 2023 + 2024 OUTLOOK 47 Disciplined, Profitable Approach to Growth Remains a Foundational Principle Q4 2023 • Preserve liquidity and high investment grade credit ratings Maintain Strong Balance Sheet 1.89x LTM 31DEC23 - Adj. debt / Adj. EBITDA ratio between 1.0 - 1.5x • Maintain flexibility to invest for growth $ 944M $ 189M Fixed asset additions Other investments • Organic and inorganic opportunities Invest for Growth • Innovation $ 133M • Continued dividend growth over time Return Capital to Shareholders • Repurchase shares with excess liquidity
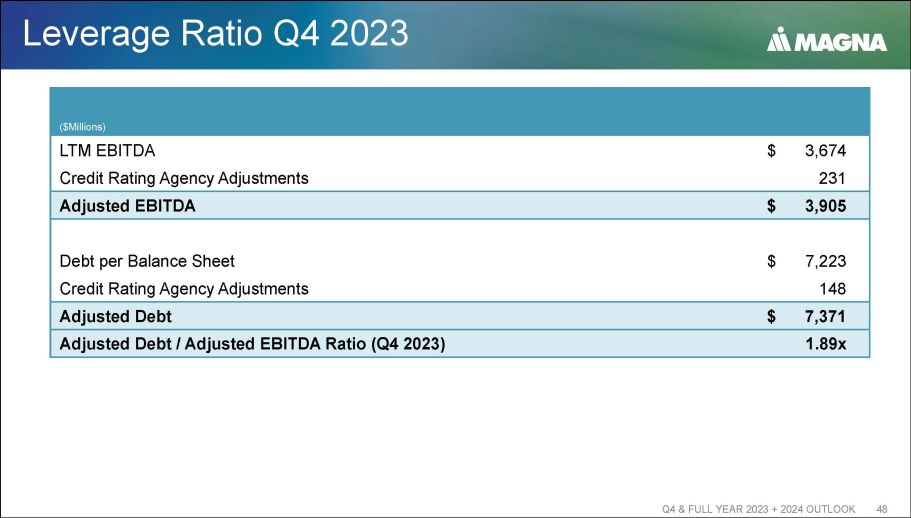
Leverage Ratio Q4 2023 Q4 & FULL YEAR 2023 + 2024 OUTLOOK 48 ($Millions) $ 3,674 LTM EBITDA 231 Credit Rating Agency Adjustments $ 3,905 Adjusted EBITDA $ 7,223 Debt per Balance Sheet 148 Credit Rating Agency Adjustments $ 7,371 Adjusted Debt 1.89x Adjusted Debt / Adjusted EBITDA Ratio (Q4 2023)

Appendix - Outlook Q4 & FULL YEAR 2023 + 2024 OUTLOOK 49

Financial Outlook Q4 & FULL YEAR 2023 + 2024 OUTLOOK 50 2026 2024 ($Billions, unless otherwise noted) Sales: 19.6 – 20.6 17.4 – 18.0 • Body Exteriors & Structures 16.8 – 17.4 15.8 – 16.2 • Power & Vision 6.5 – 6.9 5.5 – 5.8 • Seating Systems 6.1 – 6.5 5.9 – 5.9 • Complete Vehicles 48.8 – 51.2 43.8 – 45.4 Total Sales 7.0% – 7.7% 5.4% – 6.0% Adjusted EBIT Margin % 1 165M – 210M 120M – 150M Equity Income (included in EBIT) ~230M Interest Expense, net ~21% Income Tax Rate 2 1.6 – 1.8 Adjusted Net Income attributable to Magna 3 ~2.5 Capital Spending 1 Adjusted EBIT Margin is the ratio of Adjusted EBIT to Total Sales 2 The Income Tax Rate has been calculated using Adjusted EBIT and is based on current tax legislation 3 Adjusted Net Income attributable to Magna represents Net Income excluding Other expense, net and amortization of acquired int an gible assets, net of tax

Q4 & FULL YEAR 2023 + 2024 OUTLOOK 51
Magna (NYSE:MGA)
Historical Stock Chart
From Apr 2024 to May 2024

Magna (NYSE:MGA)
Historical Stock Chart
From May 2023 to May 2024
