Form 8-K - Current report
January 16 2024 - 5:00PM
Edgar (US Regulatory)
false
0001669779
0001669779
2024-01-16
2024-01-16
iso4217:USD
xbrli:shares
iso4217:USD
xbrli:shares
UNITED STATES
SECURITIES AND EXCHANGE COMMISSION
Washington, D.C. 20549
FORM 8-K
CURRENT REPORT
PURSUANT TO SECTION 13 OR 15(D) OF
THE
SECURITIES EXCHANGE ACT OF 1934
Date of Report (Date of earliest event
reported): January 16, 2024
Camping World Holdings, Inc.
(Exact Name of Registrant as Specified in
its Charter)
| Delaware |
|
001-37908 |
|
81-1737145 |
| (State or Other Jurisdiction of Incorporation) |
|
(Commission File Number) |
|
(IRS Employer Identification No.) |
250 Parkway Drive, Suite 270
Lincolnshire, IL 60069
(Address of principal executive offices) (Zip Code)
Registrant’s telephone number, including area code (847) 808-3000
Not applicable
(Former Name or Former Address, if Changed
Since Last Report)
Check the appropriate box below if the Form 8-K filing
is intended to simultaneously satisfy the filing obligation of the registrant under any of the following provisions:
| ¨ |
Written communications pursuant to Rule 425 under the Securities Act (17 CFR 230.425). |
| ¨ |
Soliciting material pursuant to Rule 14a-12 under the Exchange Act (17 CFR 240.14a-12). |
| ¨ |
Pre-commencement communications pursuant to Rule 14d-2(b) under the Exchange Act (17 CFR 240.14d-2(b)). |
| ¨ |
Pre-commencement communications pursuant to Rule 13e-4(c) under the Exchange Act (17 CFR 240.13e-4(c)). |
Securities registered pursuant to Section 12(b) of the Act:
| Title
of each class |
Trading
Symbol(s) |
Name
of each exchange on which registered |
| Class A
Common Stock, $0.01 par value per share |
CWH |
New York Stock Exchange |
Indicate by check mark whether the registrant is an emerging
growth company as defined in Rule 405 of the Securities Act of 1933 (§230.405 of this chapter) or Rule 12b-2 of
the Securities Exchange Act of 1934 (§240.12b-2 of this chapter).
Emerging growth
company ¨
If an emerging growth company, indicate
by check mark if the registrant has elected not to use the extended transition period for complying with any new or revised financial
accounting standards provided pursuant to Section 13(a) of the Exchange Act. ¨
| Item 7.01 |
Regulation FD Disclosure. |
On January 16, 2024, Camping World Holdings, Inc. (the “Company”)
plans to meet with investors where it expects to discuss (1) the Company’s business strategy and illustrative potential financial
results if the Company had 320 dealerships and (2) an informative presentation on the Company’s Good Sam business. The presentation
materials that will be used in these meetings are furnished hereto as Exhibit 99.1 and Exhibit 99.2 and are incorporated herein by reference.
The information in this Current Report on Form 8-K, including Exhibit
99.1 and Exhibit 99.2 hereto, shall not be deemed “filed” for purposes of Section 18 of the Securities Exchange Act of 1934,
as amended (the “Exchange Act”), or otherwise subject to the liabilities of that Section, nor shall it be deemed to be incorporated
by reference into any filing of the Company under the Securities Act of 1933, as amended, or the Exchange Act, except as expressly set
forth by specific reference in such filing.
| Item 9.01. |
Financial Statements and Exhibits. |
(d) Exhibits.
SIGNATURE
Pursuant to the requirements of the Securities
Exchange Act of 1934, the registrant has duly caused this report to be signed on its behalf by the undersigned hereunto duly authorized.
| |
CAMPING WORLD HOLDINGS, INC. |
| |
By: |
/s/ Lindsey Christen |
| |
Name: |
Lindsey Christen |
| |
Title: |
Chief Administrative and Legal Officer |
Date: January 16, 2024
| This presentation contains forward-looking statements within the meaning of the Private Securities Litigation Reform Act of 1995. All statements contained in this presentation that do not relate
to matters of historical fact should be considered forward-looking statements, including, without limitation, statements about our business plans and goals, including statements regarding the
strength of our business, illustrative financial results, and our long-term plan. These forward-looking statements are based on management’s current expectations.
These statements are neither promises nor guarantees, but involve known and unknown risks, uncertainties and other important factors that may cause our actual results, performance or
achievements to be materially different from any future results, performance or achievements expressed or implied by the forward-looking statements, including, but not limited to, the following:
general economic conditions, including inflation and interest rates; the availability of financing to us and our customers; fuel shortages or high prices for fuel; the success of our manufacturers;
changes in consumer preferences; competition in our industry; risks related to acquisitions, new store openings and expansion into new markets; our failure to maintain the strength and value of
our brands; our ability to manage our inventory; fluctuations in our same store sales; the cyclical and seasonal nature of our business; risks related to the cybersecurity incident announced in
February 2022; our dependence on the availability of adequate capital and risks related to our debt; risks related to COVID-19; our ability to execute and achieve the expected benefits of our cost
cutting or restructuring initiatives; our reliance on our fulfillment and distribution centers; natural disasters, including epidemic outbreaks; our dependence on our relationships with third party
suppliers and lending institutions; risks associated with selling goods manufactured abroad; our ability to retain senior executives and attract and retain other qualified employees; risks
associated with leasing substantial amounts of space; risks associated with our private brand offerings; we may incur asset impairment charges for goodwill, intangible assets or other long-lived assets; tax risks; regulatory risks; data privacy and cybersecurity risks; risks related to our intellectual property; the impact of ongoing or future lawsuits against us and certain of our officers
and directors; and risks related to our organizational structure.
These and other important factors discussed under the caption “Risk Factors” in our Annual Report on Form 10-K filed for the year ended December 31, 2022 and our other reports filed with the
SEC could cause actual results to differ materially from those indicated by the forward-looking statements made in this presentation. Any such forward-looking statements represent
management’s estimates as of the date of this presentation. While we may elect to update such forward-looking statements at some point in the future, we disclaim any obligation to do so, even
if subsequent events cause our views to change, except as required under applicable law. These forward-looking statements should not be relied upon as representing our views as of any date
subsequent to the date of this presentation.
This presentation includes information concerning economic conditions, the Company’s industry, the Company’s markets and the Company’s competitive position that is based on a variety of
sources, including information from independent industry analysts and publications, as well as Camping World’s own estimates and research. Camping World’s estimates are derived from publicly
available information released by third party sources, as well as data from its internal research, and are based on such data and the Company’s knowledge of its industry, which the Company
believes to be reasonable. The independent industry publications used in this presentation were not prepared on the Company’s behalf. While the Company is not aware of any misstatements
regarding any information in this presentation, forecasts, assumptions, expectations, beliefs, estimates and projects involve risk and uncertainties and are subject to change based on various
factors.
2 |
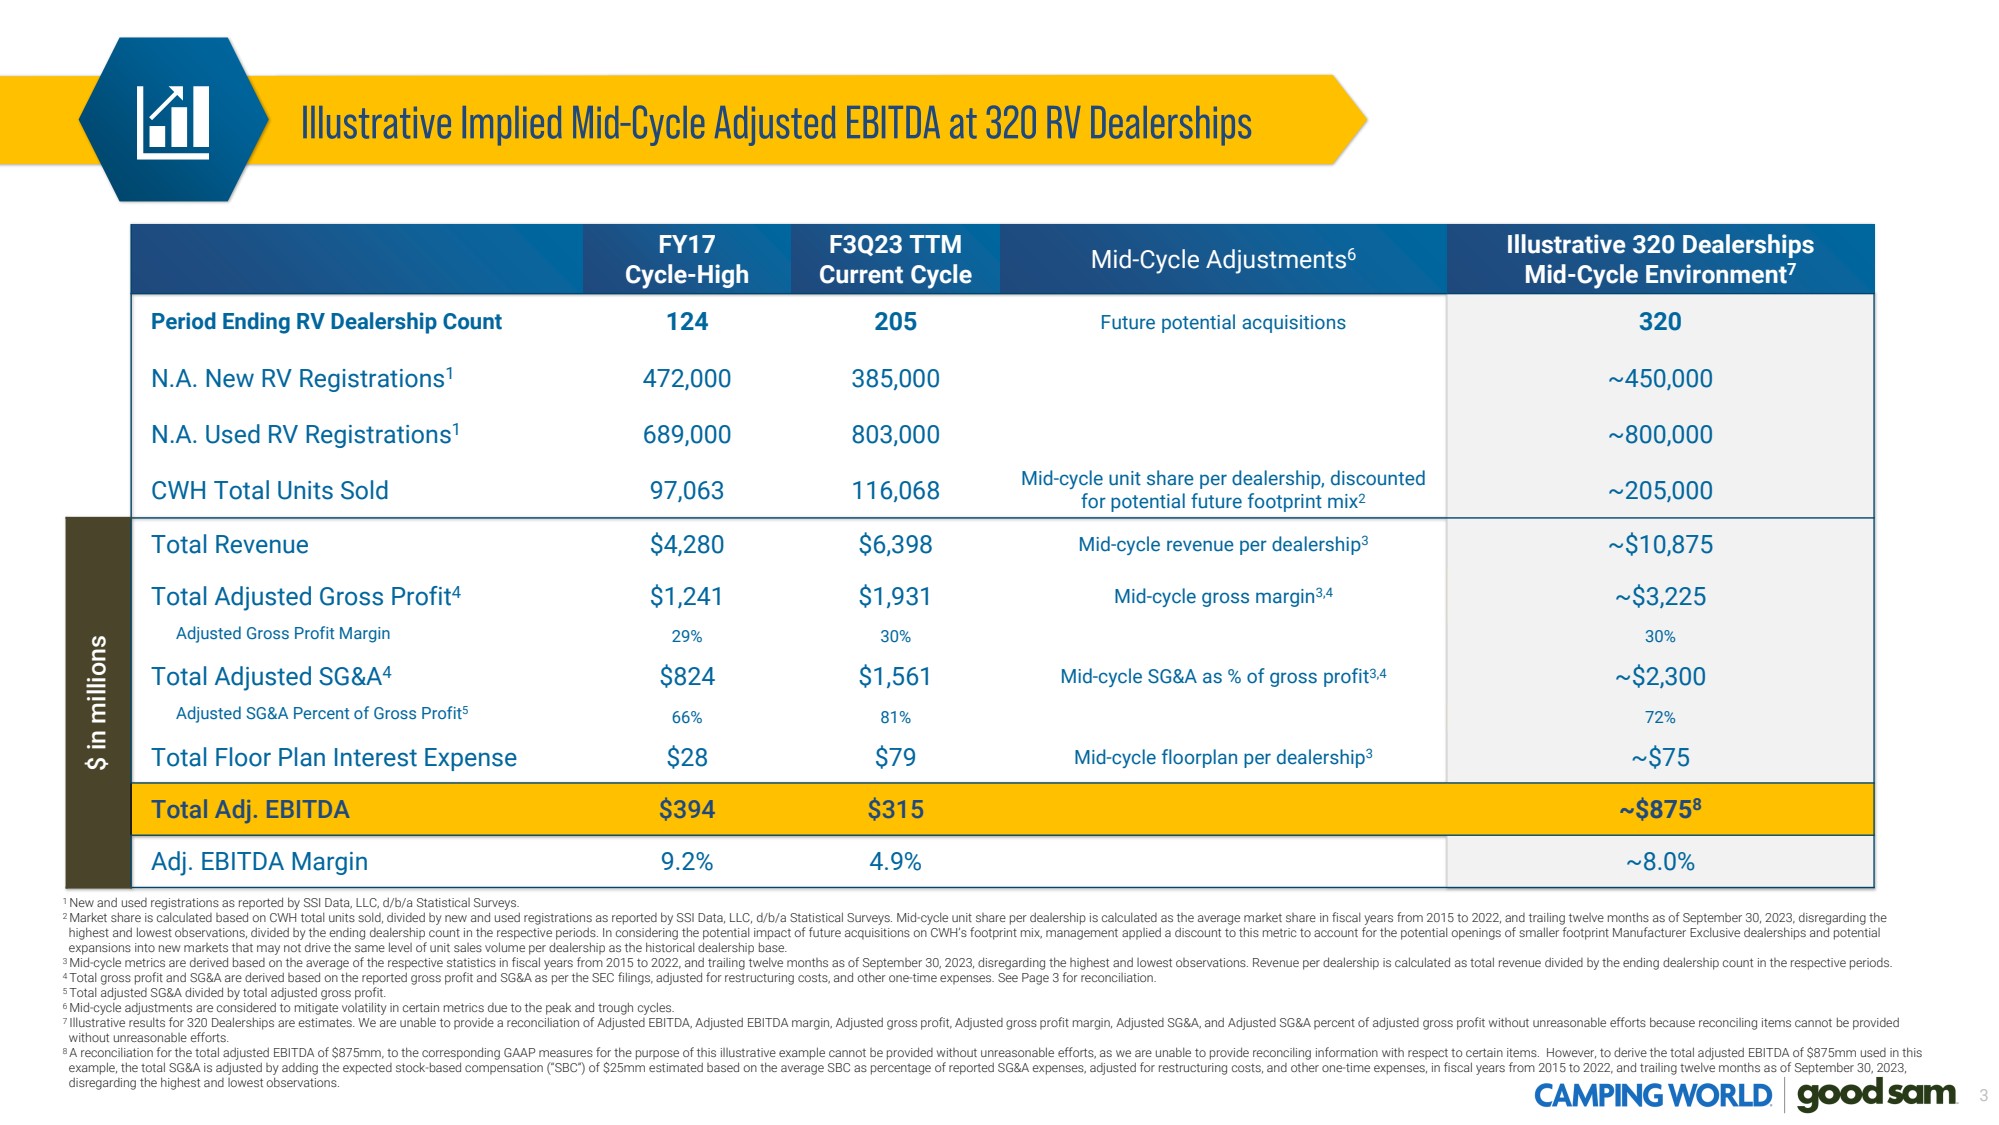
| FY17
Cycle-High
F3Q23 TTM
Current Cycle Mid-Cycle Adjustments6
Illustrative 320 Dealerships
Mid-Cycle Environment
7
Period Ending RV Dealership Count 124 205 Future potential acquisitions 320
N.A. New RV Registrations1 472,000 385,000 ~450,000
N.A. Used RV Registrations1 689,000 803,000 ~800,000
CWH Total Units Sold 97,063 116,068 Mid-cycle unit share per dealership, discounted
for potential future footprint mix2 ~205,000
$ in millions
Total Revenue $4,280 $6,398 Mid-cycle revenue per dealership3 ~$10,875
Total Adjusted Gross Profit4 $1,241 $1,931 Mid-cycle gross margin3,4 ~$3,225
Adjusted Gross Profit Margin 29% 30% 30%
Total Adjusted SG&A4 $824 $1,561 Mid-cycle SG&A as % of gross profit3,4 ~$2,300
Adjusted SG&A Percent of Gross Profit5
66% 81% 72%
Total Floor Plan Interest Expense $28 $79 Mid-cycle floorplan per dealership3 ~$75
Total Adj. EBITDA $394 $315 ~$875
8
Adj. EBITDA Margin 9.2% 4.9% ~8.0%
1 New and used registrations as reported by SSI Data, LLC, d/b/a Statistical Surveys.
2 Market share is calculated based on CWH total units sold, divided by new and used registrations as reported by SSI Data, LLC, d/b/a Statistical Surveys. Mid-cycle unit share per dealership is calculated as the average market share in fiscal years from 2015 to 2022, and trailing twelve months as of September 30, 2023, disregarding the
highest and lowest observations, divided by the ending dealership count in the respective periods. In considering the potential impact of future acquisitions on CWH’s footprint mix, management applied a discount to this metric to account for the potential openings of smaller footprint Manufacturer Exclusive dealerships and potential
expansions into new markets that may not drive the same level of unit sales volume per dealership as the historical dealership base.
3 Mid-cycle metrics are derived based on the average of the respective statistics in fiscal years from 2015 to 2022, and trailing twelve months as of September 30, 2023, disregarding the highest and lowest observations. Revenue per dealership is calculated as total revenue divided by the ending dealership count in the respective periods.
4 Total gross profit and SG&A are derived based on the reported gross profit and SG&A as per the SEC filings, adjusted for restructuring costs, and other one-time expenses. See Page 3 for reconciliation.
5 Total adjusted SG&A divided by total adjusted gross profit.
6 Mid-cycle adjustments are considered to mitigate volatility in certain metrics due to the peak and trough cycles.
7 Illustrative results for 320 Dealerships are estimates. We are unable to provide a reconciliation of Adjusted EBITDA, Adjusted EBITDA margin, Adjusted gross profit, Adjusted gross profit margin, Adjusted SG&A, and Adjusted SG&A percent of adjusted gross profit without unreasonable efforts because reconciling items cannot be provided
without unreasonable efforts.
8 A reconciliation for the total adjusted EBITDA of $875mm, to the corresponding GAAP measures for the purpose of this illustrative example cannot be provided without unreasonable efforts, as we are unable to provide reconciling information with respect to certain items. However, to derive the total adjusted EBITDA of $875mm used in this
example, the total SG&A is adjusted by adding the expected stock-based compensation (“SBC”) of $25mm estimated based on the average SBC as percentage of reported SG&A expenses, adjusted for restructuring costs, and other one-time expenses, in fiscal years from 2015 to 2022, and trailing twelve months as of September 30, 2023,
disregarding the highest and lowest observations.
3 |
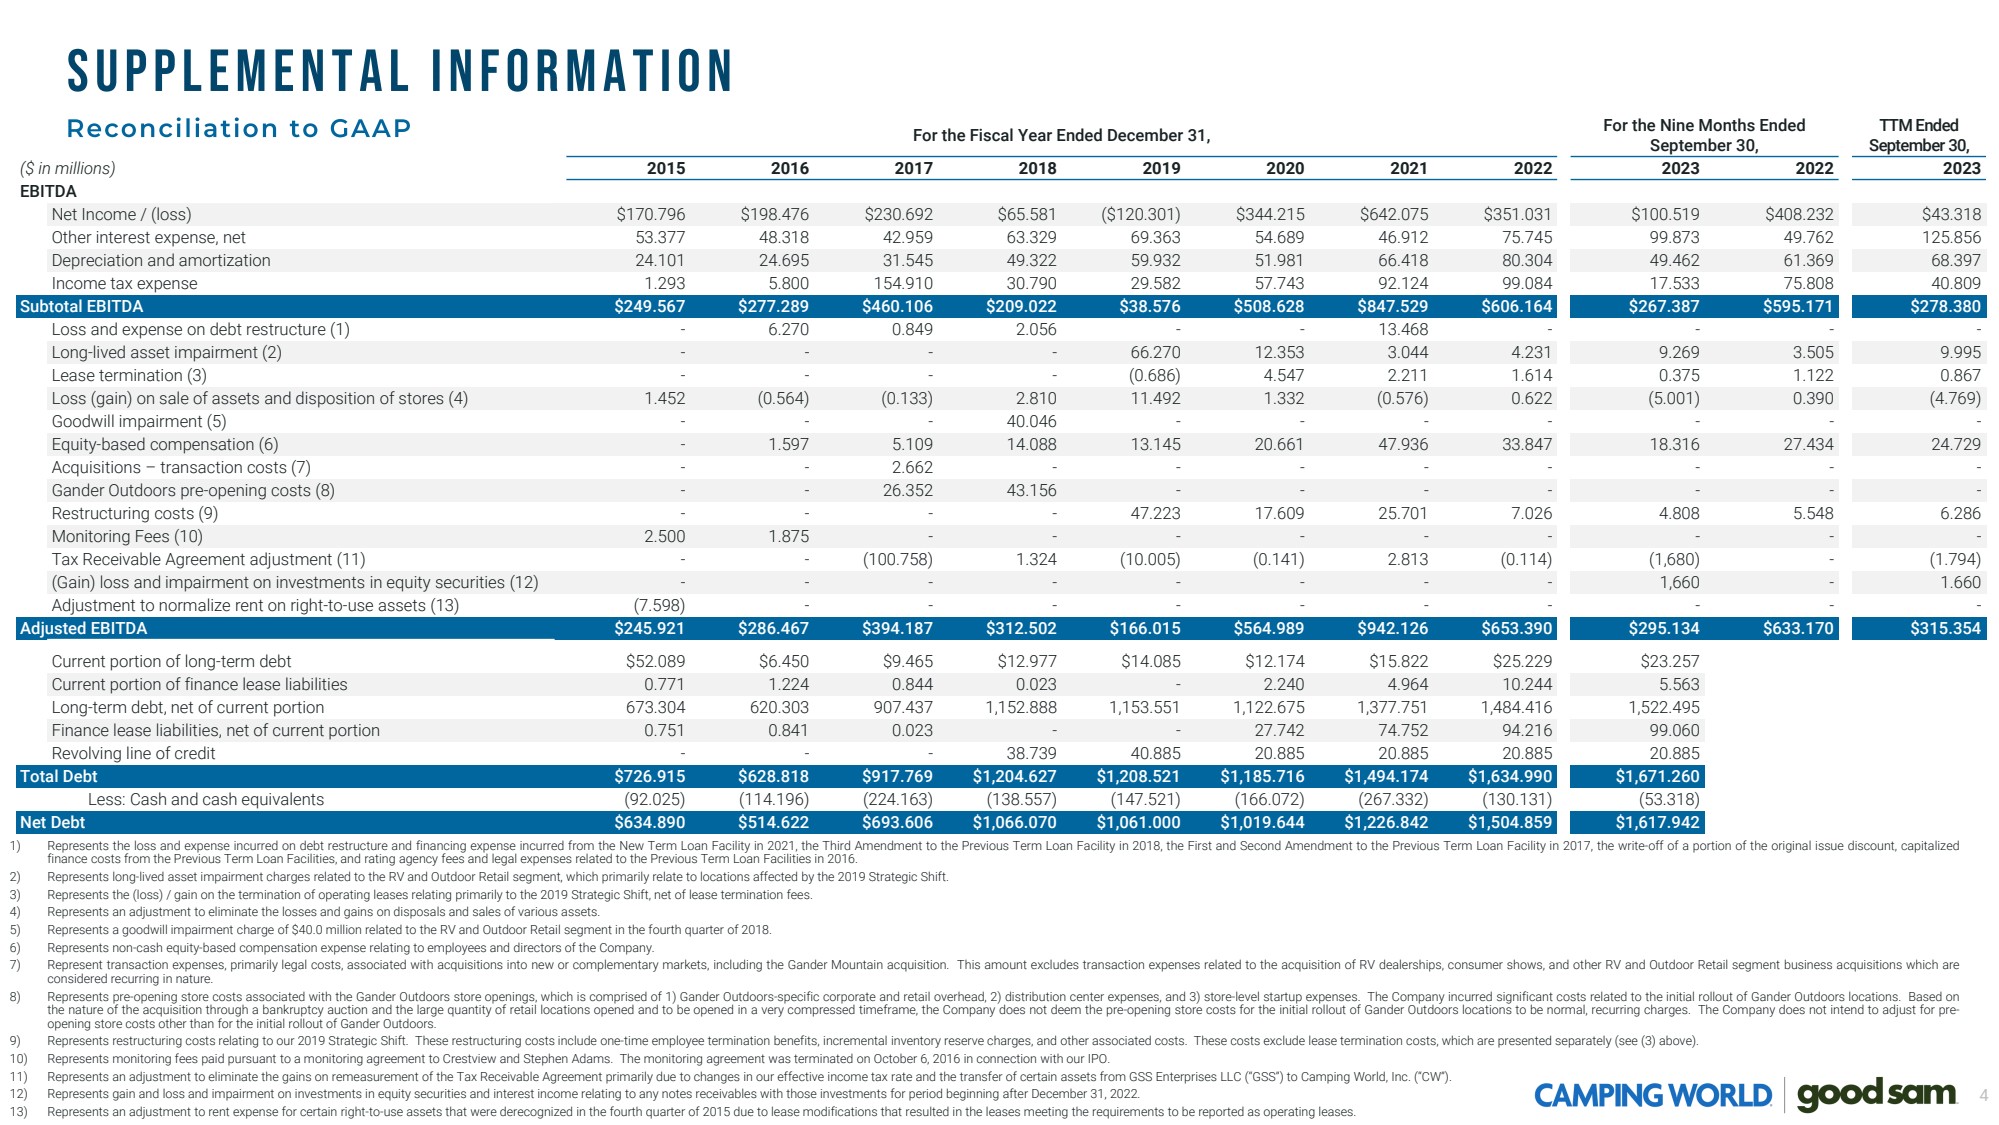
| For the Fiscal Year Ended December 31,
For the Nine Months Ended
September 30,
TTM Ended
September 30,
($ in millions) 2015 2016 2017 2018 2019 2020 2021 2022 2023 2022 2023
EBITDA
Net Income / (loss) $170.796 $198.476 $230.692 $65.581 ($120.301) $344.215 $642.075 $351.031 $100.519 $408.232 $43.318
Other interest expense, net 53.377 48.318 42.959 63.329 69.363 54.689 46.912 75.745 99.873 49.762 125.856
Depreciation and amortization 24.101 24.695 31.545 49.322 59.932 51.981 66.418 80.304 49.462 61.369 68.397
Income tax expense 1.293 5.800 154.910 30.790 29.582 57.743 92.124 99.084 17.533 75.808 40.809
Subtotal EBITDA $249.567 $277.289 $460.106 $209.022 $38.576 $508.628 $847.529 $606.164 $267.387 $595.171 $278.380
Loss and expense on debt restructure (1) - 6.270 0.849 2.056 - - 13.468 - - - -
Long-lived asset impairment (2) - - - - 66.270 12.353 3.044 4.231 9.269 3.505 9.995
Lease termination (3) - - - - (0.686) 4.547 2.211 1.614 0.375 1.122 0.867
Loss (gain) on sale of assets and disposition of stores (4) 1.452 (0.564) (0.133) 2.810 11.492 1.332 (0.576) 0.622 (5.001) 0.390 (4.769)
Goodwill impairment (5) - - - 40.046 - - - - - - -
Equity-based compensation (6) - 1.597 5.109 14.088 13.145 20.661 47.936 33.847 18.316 27.434 24.729
Acquisitions – transaction costs (7) - - 2.662 - - - - - - - -
Gander Outdoors pre-opening costs (8) - - 26.352 43.156 - - - - - - -
Restructuring costs (9) - - - - 47.223 17.609 25.701 7.026 4.808 5.548 6.286
Monitoring Fees (10) 2.500 1.875 - - - - - - - - -
Tax Receivable Agreement adjustment (11) - - (100.758) 1.324 (10.005) (0.141) 2.813 (0.114) (1,680) - (1.794)
(Gain) loss and impairment on investments in equity securities (12) - - - - - - - - 1,660 - 1.660
Adjustment to normalize rent on right-to-use assets (13) (7.598) - - - - - - - - - -
Adjusted EBITDA $245.921 $286.467 $394.187 $312.502 $166.015 $564.989 $942.126 $653.390 $295.134 $633.170 $315.354
Current portion of long-term debt $52.089 $6.450 $9.465 $12.977 $14.085 $12.174 $15.822 $25.229 $23.257
Current portion of finance lease liabilities 0.771 1.224 0.844 0.023 - 2.240 4.964 10.244 5.563
Long-term debt, net of current portion 673.304 620.303 907.437 1,152.888 1,153.551 1,122.675 1,377.751 1,484.416 1,522.495
Finance lease liabilities, net of current portion 0.751 0.841 0.023 - - 27.742 74.752 94.216 99.060
Revolving line of credit - - - 38.739 40.885 20.885 20.885 20.885 20.885
Total Debt $726.915 $628.818 $917.769 $1,204.627 $1,208.521 $1,185.716 $1,494.174 $1,634.990 $1,671.260
Less: Cash and cash equivalents (92.025) (114.196) (224.163) (138.557) (147.521) (166.072) (267.332) (130.131) (53.318)
Net Debt $634.890 $514.622 $693.606 $1,066.070 $1,061.000 $1,019.644 $1,226.842 $1,504.859 $1,617.942
1) Represents the loss and expense incurred on debt restructure and financing expense incurred from the New Term Loan Facility in 2021, the Third Amendment to the Previous Term Loan Facility in 2018, the First and Second Amendment to the Previous Term Loan Facility in 2017, the write-off of a portion of the original issue discount, capitalized
finance costs from the Previous Term Loan Facilities, and rating agency fees and legal expenses related to the Previous Term Loan Facilities in 2016.
2) Represents long-lived asset impairment charges related to the RV and Outdoor Retail segment, which primarily relate to locations affected by the 2019 Strategic Shift.
3) Represents the (loss) / gain on the termination of operating leases relating primarily to the 2019 Strategic Shift, net of lease termination fees.
4) Represents an adjustment to eliminate the losses and gains on disposals and sales of various assets.
5) Represents a goodwill impairment charge of $40.0 million related to the RV and Outdoor Retail segment in the fourth quarter of 2018.
6) Represents non-cash equity-based compensation expense relating to employees and directors of the Company.
7) Represent transaction expenses, primarily legal costs, associated with acquisitions into new or complementary markets, including the Gander Mountain acquisition. This amount excludes transaction expenses related to the acquisition of RV dealerships, consumer shows, and other RV and Outdoor Retail segment business acquisitions which are
considered recurring in nature.
8) Represents pre-opening store costs associated with the Gander Outdoors store openings, which is comprised of 1) Gander Outdoors-specific corporate and retail overhead, 2) distribution center expenses, and 3) store-level startup expenses. The Company incurred significant costs related to the initial rollout of Gander Outdoors locations. Based on
the nature of the acquisition through a bankruptcy auction and the large quantity of retail locations opened and to be opened in a very compressed timeframe, the Company does not deem the pre-opening store costs for the initial rollout of Gander Outdoors locations to be normal, recurring charges. The Company does not intend to adjust for pre-opening store costs other than for the initial rollout of Gander Outdoors.
9) Represents restructuring costs relating to our 2019 Strategic Shift. These restructuring costs include one-time employee termination benefits, incremental inventory reserve charges, and other associated costs. These costs exclude lease termination costs, which are presented separately (see (3) above).
10) Represents monitoring fees paid pursuant to a monitoring agreement to Crestview and Stephen Adams. The monitoring agreement was terminated on October 6, 2016 in connection with our IPO.
11) Represents an adjustment to eliminate the gains on remeasurement of the Tax Receivable Agreement primarily due to changes in our effective income tax rate and the transfer of certain assets from GSS Enterprises LLC (“GSS”) to Camping World, Inc. (“CW”).
12) Represents gain and loss and impairment on investments in equity securities and interest income relating to any notes receivables with those investments for period beginning after December 31, 2022.
13) Represents an adjustment to rent expense for certain right-to-use assets that were derecognized in the fourth quarter of 2015 due to lease modifications that resulted in the leases meeting the requirements to be reported as operating leases.
4 |
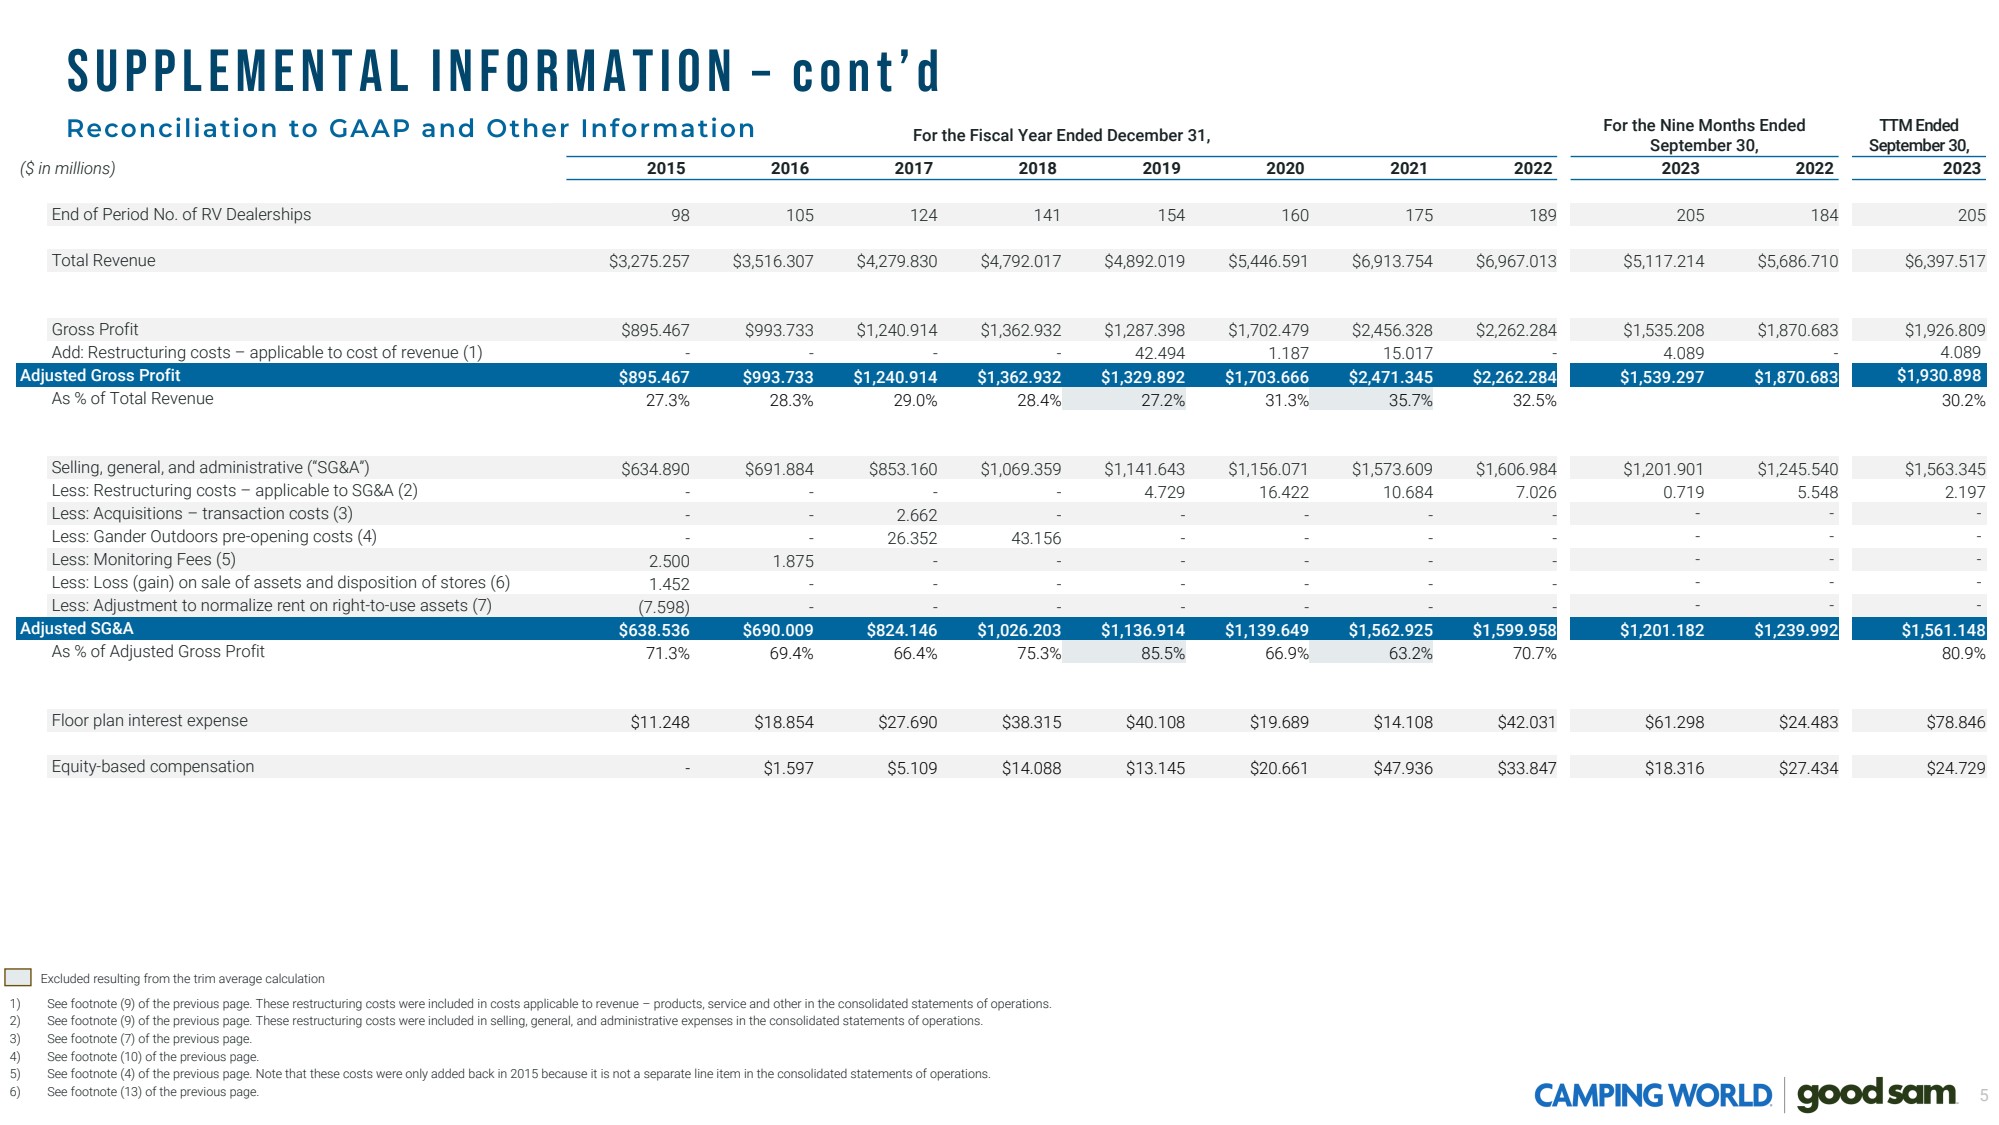
| For the Fiscal Year Ended December 31,
For the Nine Months Ended
September 30,
TTM Ended
September 30,
($ in millions) 2015 2016 2017 2018 2019 2020 2021 2022 2023 2022 2023
End of Period No. of RV Dealerships 98 105 124 141 154 160 175 189 205 184 205
Total Revenue $3,275.257 $3,516.307 $4,279.830 $4,792.017 $4,892.019 $5,446.591 $6,913.754 $6,967.013 $5,117.214 $5,686.710 $6,397.517
Gross Profit $895.467 $993.733 $1,240.914 $1,362.932 $1,287.398 $1,702.479 $2,456.328 $2,262.284 $1,535.208 $1,870.683 $1,926.809
Add: Restructuring costs – applicable to cost of revenue (1) - - - - 42.494 1.187 15.017 - 4.089 - 4.089
Adjusted Gross Profit $895.467 $993.733 $1,240.914 $1,362.932 $1,329.892 $1,703.666 $2,471.345 $2,262.284 $1,539.297 $1,870.683 $1,930.898
As % of Total Revenue 27.3% 28.3% 29.0% 28.4% 27.2% 31.3% 35.7% 32.5% 30.2%
Selling, general, and administrative (“SG&A”) $634.890 $691.884 $853.160 $1,069.359 $1,141.643 $1,156.071 $1,573.609 $1,606.984 $1,201.901 $1,245.540 $1,563.345
Less: Restructuring costs – applicable to SG&A (2) - - - - 4.729 16.422 10.684 7.026 0.719 5.548 2.197
Less: Acquisitions – transaction costs (3) - - 2.662 - - - - - - - -
Less: Gander Outdoors pre-opening costs (4) - - 26.352 43.156 - - - - - - -
Less: Monitoring Fees (5) 2.500 1.875 - - - - - - - - -
Less: Loss (gain) on sale of assets and disposition of stores (6) 1.452 - - - - - - - - - -
Less: Adjustment to normalize rent on right-to-use assets (7) (7.598) - - - - - - - - - -
Adjusted SG&A $638.536 $690.009 $824.146 $1,026.203 $1,136.914 $1,139.649 $1,562.925 $1,599.958 $1,201.182 $1,239.992 $1,561.148
As % of Adjusted Gross Profit 71.3% 69.4% 66.4% 75.3% 85.5% 66.9% 63.2% 70.7% 80.9%
Floor plan interest expense $11.248 $18.854 $27.690 $38.315 $40.108 $19.689 $14.108 $42.031 $61.298 $24.483 $78.846
Equity-based compensation - $1.597 $5.109 $14.088 $13.145 $20.661 $47.936 $33.847 $18.316 $27.434 $24.729
5
1) See footnote (9) of the previous page. These restructuring costs were included in costs applicable to revenue – products, service and other in the consolidated statements of operations.
2) See footnote (9) of the previous page. These restructuring costs were included in selling, general, and administrative expenses in the consolidated statements of operations.
3) See footnote (7) of the previous page.
4) See footnote (10) of the previous page.
5) See footnote (4) of the previous page. Note that these costs were only added back in 2015 because it is not a separate line item in the consolidated statements of operations.
6) See footnote (13) of the previous page.
Excluded resulting from the trim average calculation |
| This presentation contains forward-looking statements within the meaning of the Private Securities Litigation Reform Act of 1995. All statements contained in this presentation that do not relate
to matters of historical fact should be considered forward-looking statements, including, without limitation, statements about our business plans and goals, including statements regarding the
strength of our business, our Good Sam offerings, and our long-term plan. These forward-looking statements are based on management’s current expectations.
These statements are neither promises nor guarantees, but involve known and unknown risks, uncertainties and other important factors that may cause our actual results, performance or
achievements to be materially different from any future results, performance or achievements expressed or implied by the forward-looking statements, including, but not limited to, the following:
general economic conditions, including inflation and interest rates; the availability of financing to us and our customers; fuel shortages or high prices for fuel; the success of our manufacturers;
changes in consumer preferences; competition in our industry; risks related to acquisitions, new store openings and expansion into new markets; our failure to maintain the strength and value of
our brands; our ability to manage our inventory; fluctuations in our same store sales; the cyclical and seasonal nature of our business; risks related to the cybersecurity incident announced in
February 2022; our dependence on the availability of adequate capital and risks related to our debt; risks related to COVID-19; our ability to execute and achieve the expected benefits of our cost
cutting or restructuring initiatives; our reliance on our fulfillment and distribution centers; natural disasters, including epidemic outbreaks; our dependence on our relationships with third party
suppliers and lending institutions; risks associated with selling goods manufactured abroad; our ability to retain senior executives and attract and retain other qualified employees; risks
associated with leasing substantial amounts of space; risks associated with our private brand offerings; we may incur asset impairment charges for goodwill, intangible assets or other long-lived assets; tax risks; regulatory risks; data privacy and cybersecurity risks; risks related to our intellectual property; the impact of ongoing or future lawsuits against us and certain of our officers
and directors; and risks related to our organizational structure.
These and other important factors discussed under the caption “Risk Factors” in our Annual Report on Form 10-K filed for the year ended December 31, 2022 and our other reports filed with the
SEC could cause actual results to differ materially from those indicated by the forward-looking statements made in this presentation. Any such forward-looking statements represent
management’s estimates as of the date of this presentation. While we may elect to update such forward-looking statements at some point in the future, we disclaim any obligation to do so, even
if subsequent events cause our views to change, except as required under applicable law. These forward-looking statements should not be relied upon as representing our views as of any date
subsequent to the date of this presentation.
This presentation includes information concerning economic conditions, the Company’s industry, the Company’s markets and the Company’s competitive position that is based on a variety of
sources, including information from independent industry analysts and publications, as well as Camping World’s own estimates and research. Camping World’s estimates are derived from publicly
available information released by third party sources, as well as data from its internal research, and are based on such data and the Company’s knowledge of its industry, which the Company
believes to be reasonable. The independent industry publications used in this presentation were not prepared on the Company’s behalf. While the Company is not aware of any misstatements
regarding any information in this presentation, forecasts, assumptions, expectations, beliefs, estimates and projects involve risk and uncertainties and are subject to change based on various
factors.
2 |

| Emergency programs | Roadside Assistance, TravelAssist
Financial Protection programs | Extended Service Plan, GS Insurance Agency
Tire & Maintenance programs | Paint & Fab, Tire & Wheel
▪ Good Sam Campgrounds
▪ Good Sam Membership
▪ Travel Guides
1. PROTEC TION PROGRAMS
▪ Coast to Coast Resorts
▪ Good Sam Credit Card
▪ Magazine
▪ RV Rentals
2. CAMPGROUNDS & DESTINATIONS
3. LOYALTY
4. PUBLISHING - WILDSAM
3 |
| 4
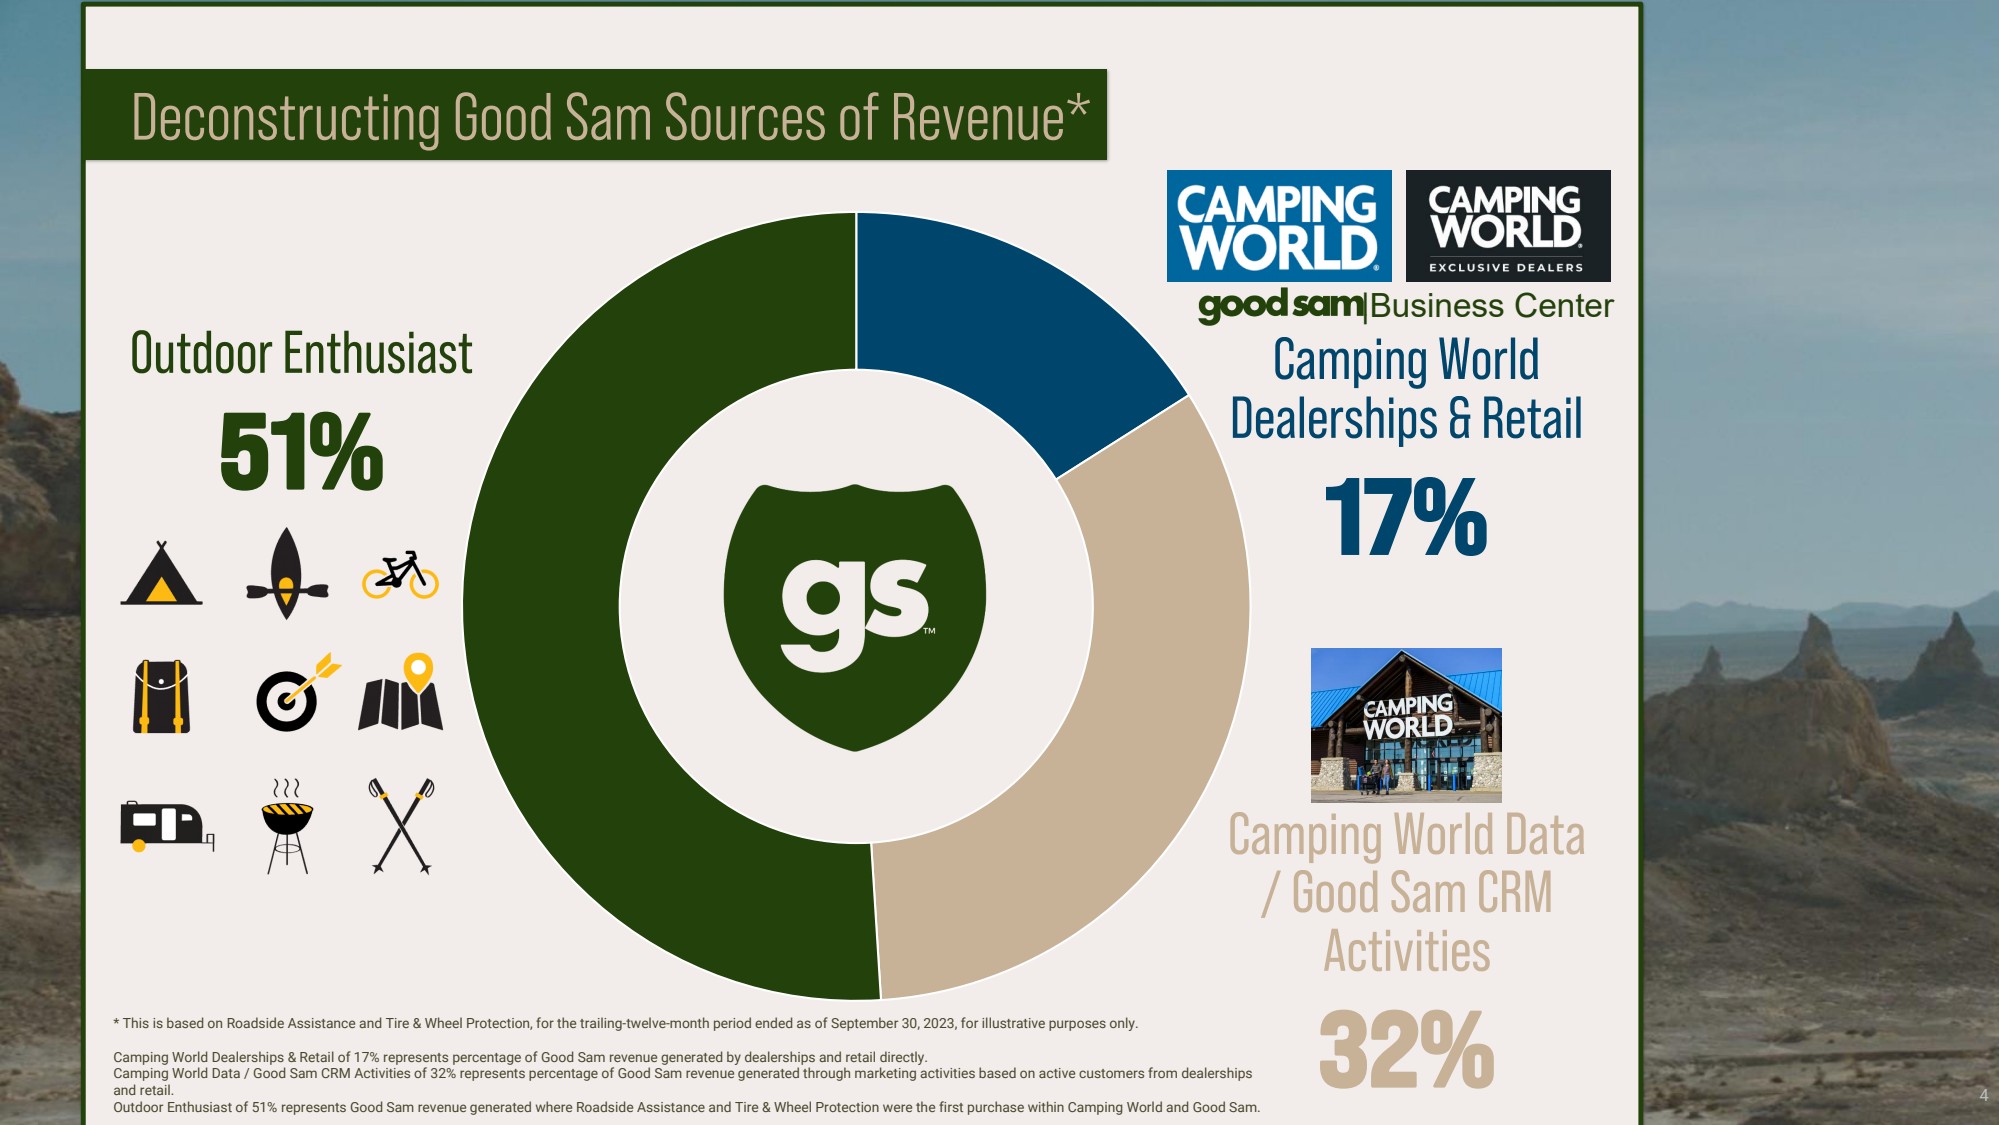
Deconstructing Good Sam Sources of Revenue*
17%
32%
51%
|Business Center
* This is based on Roadside Assistance and Tire & Wheel Protection, for the trailing-twelve-month period ended as of September 30, 2023, for illustrative purposes only.
Camping World Dealerships & Retail of 17% represents percentage of Good Sam revenue generated by dealerships and retail directly.
Camping World Data / Good Sam CRM Activities of 32% represents percentage of Good Sam revenue generated through marketing activities based on active customers from dealerships
and retail.
Outdoor Enthusiast of 51% represents Good Sam revenue generated where Roadside Assistance and Tire & Wheel Protection were the first purchase within Camping World and Good Sam. |
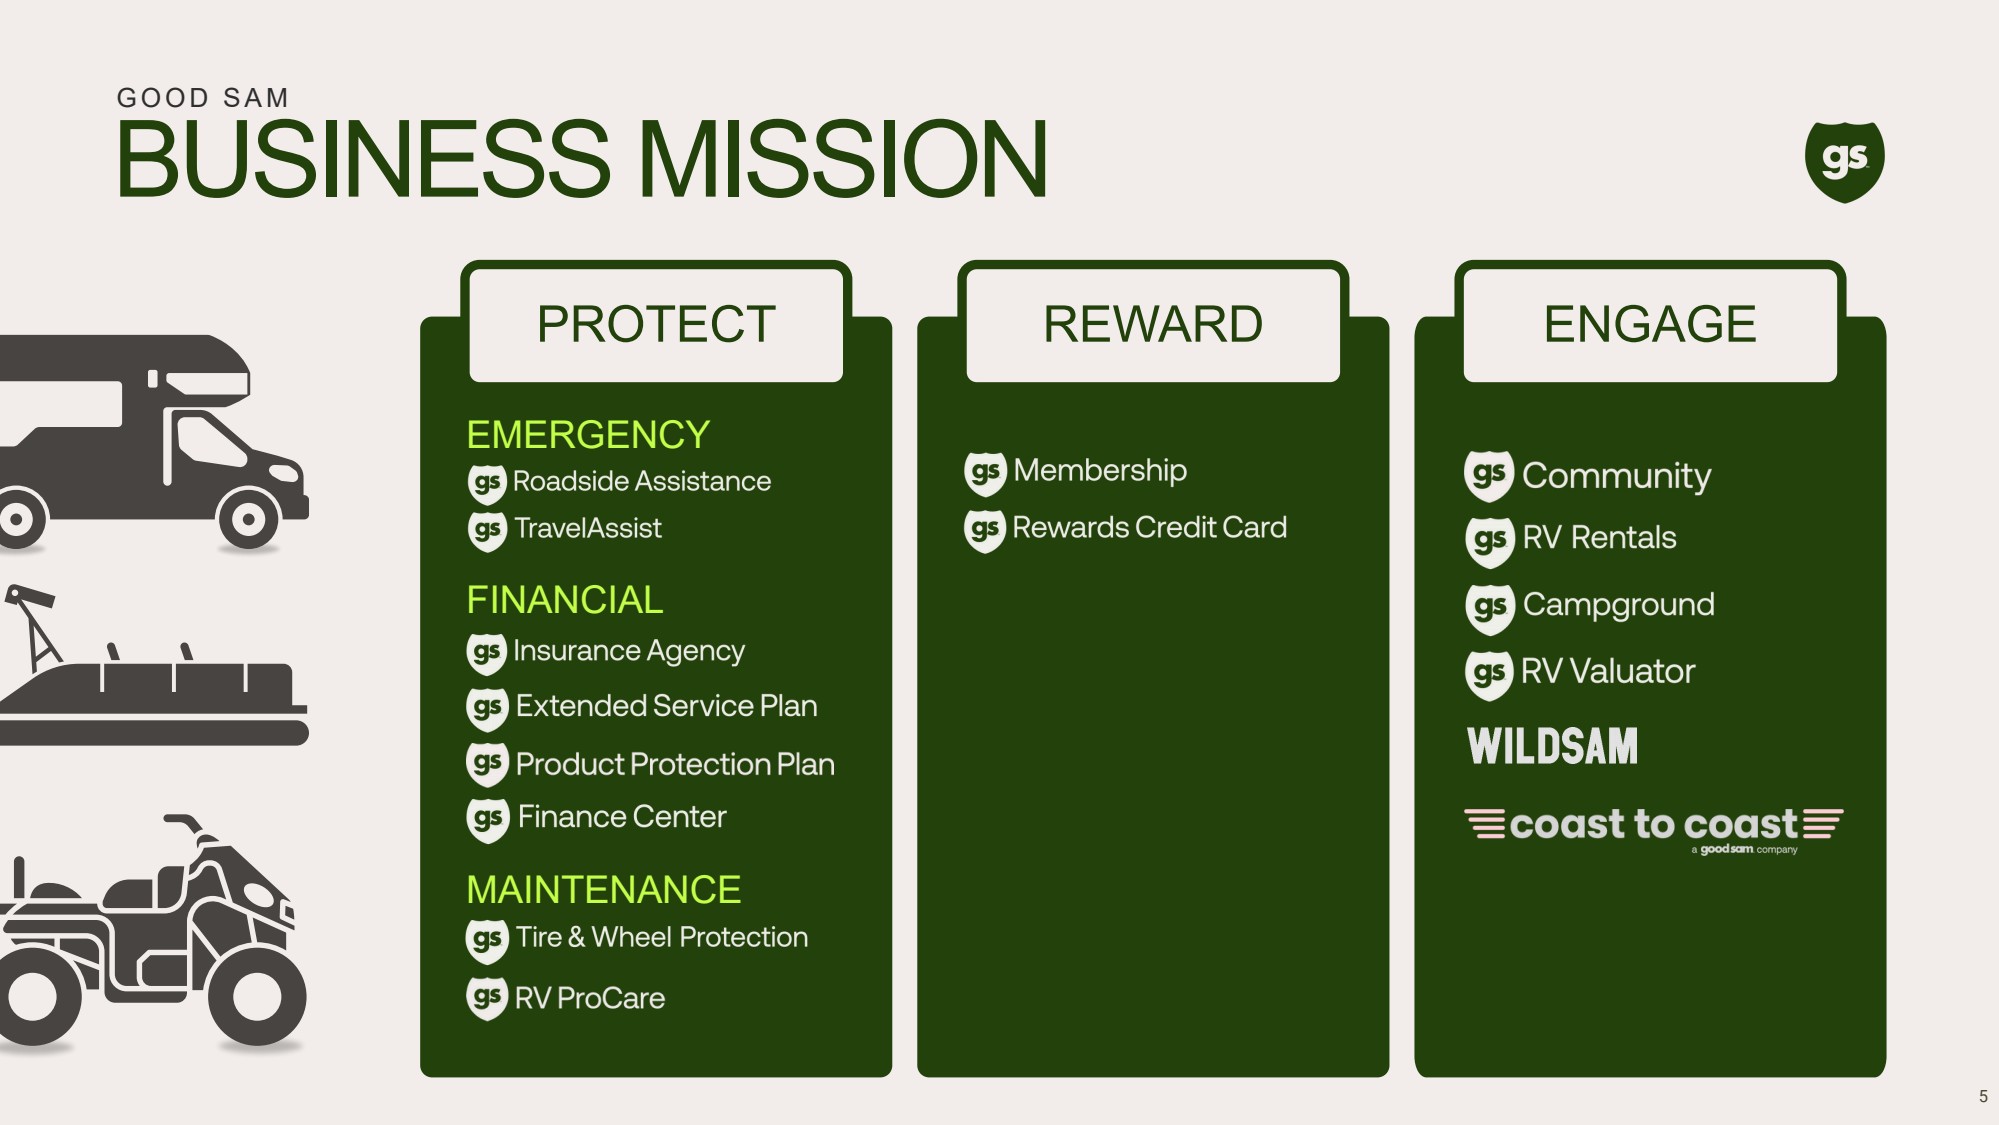
| BUSINESS MISSION
G O O D S A M
PROTECT REWARD ENGAGE
EMERGENCY
FINANCIAL
MAINTENANCE
5 |
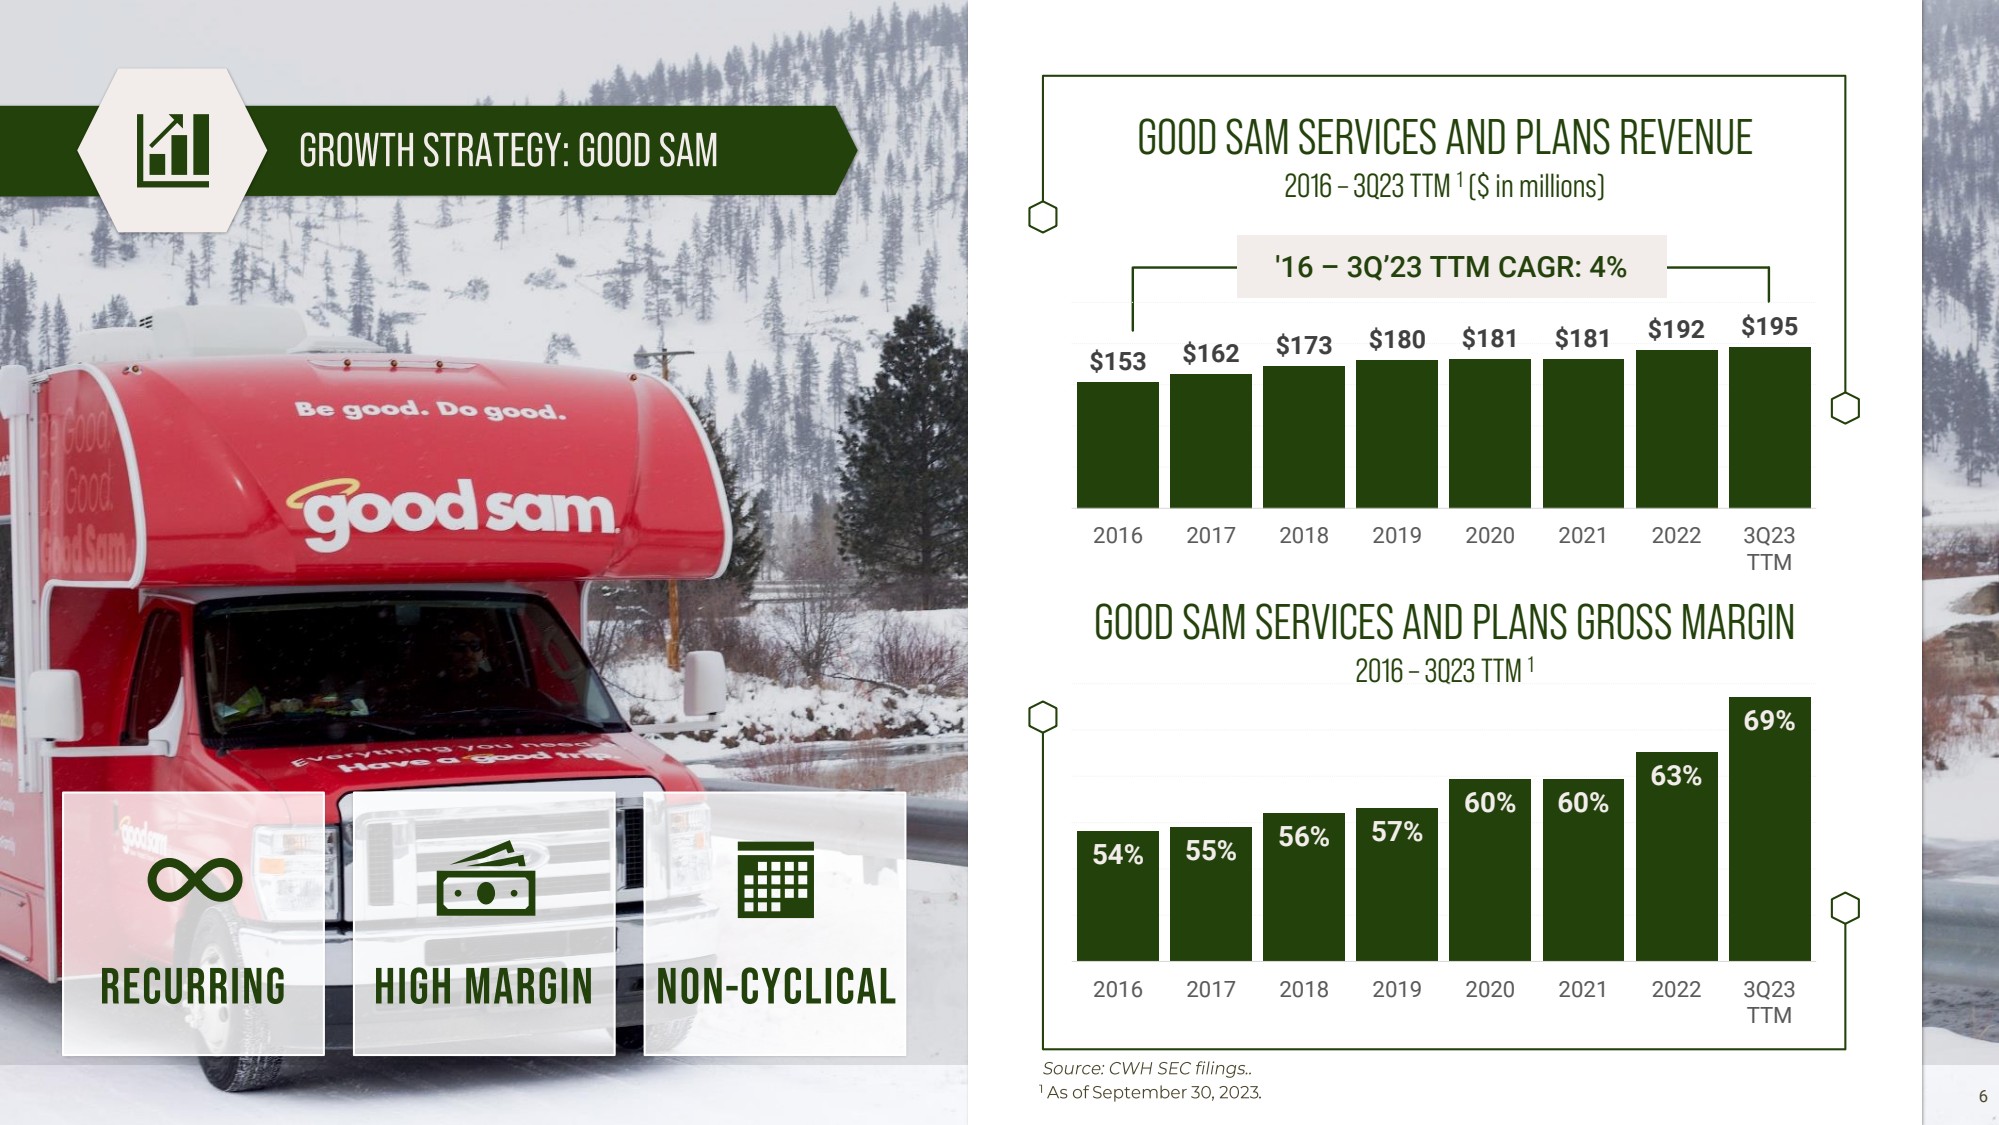
| GOOD SAM SERVICES AND PLANS REVENUE
2016 –3Q23 TTM
1
($ in millions)
GOOD SAM SERVICES AND PLANS GROSS MARGIN
2016 –3Q23 TTM
1
6
'16 – 3Q’23 TTM CAGR: 4%
$153 $162 $173 $180 $181 $181
$192 $195
2016 2017 2018 2019 2020 2021 2022 3Q23
TTM
54% 55% 56% 57%
60% 60%
63%
69%
2016 2017 2018 2019 2020 2021 2022 3Q23
TTM |
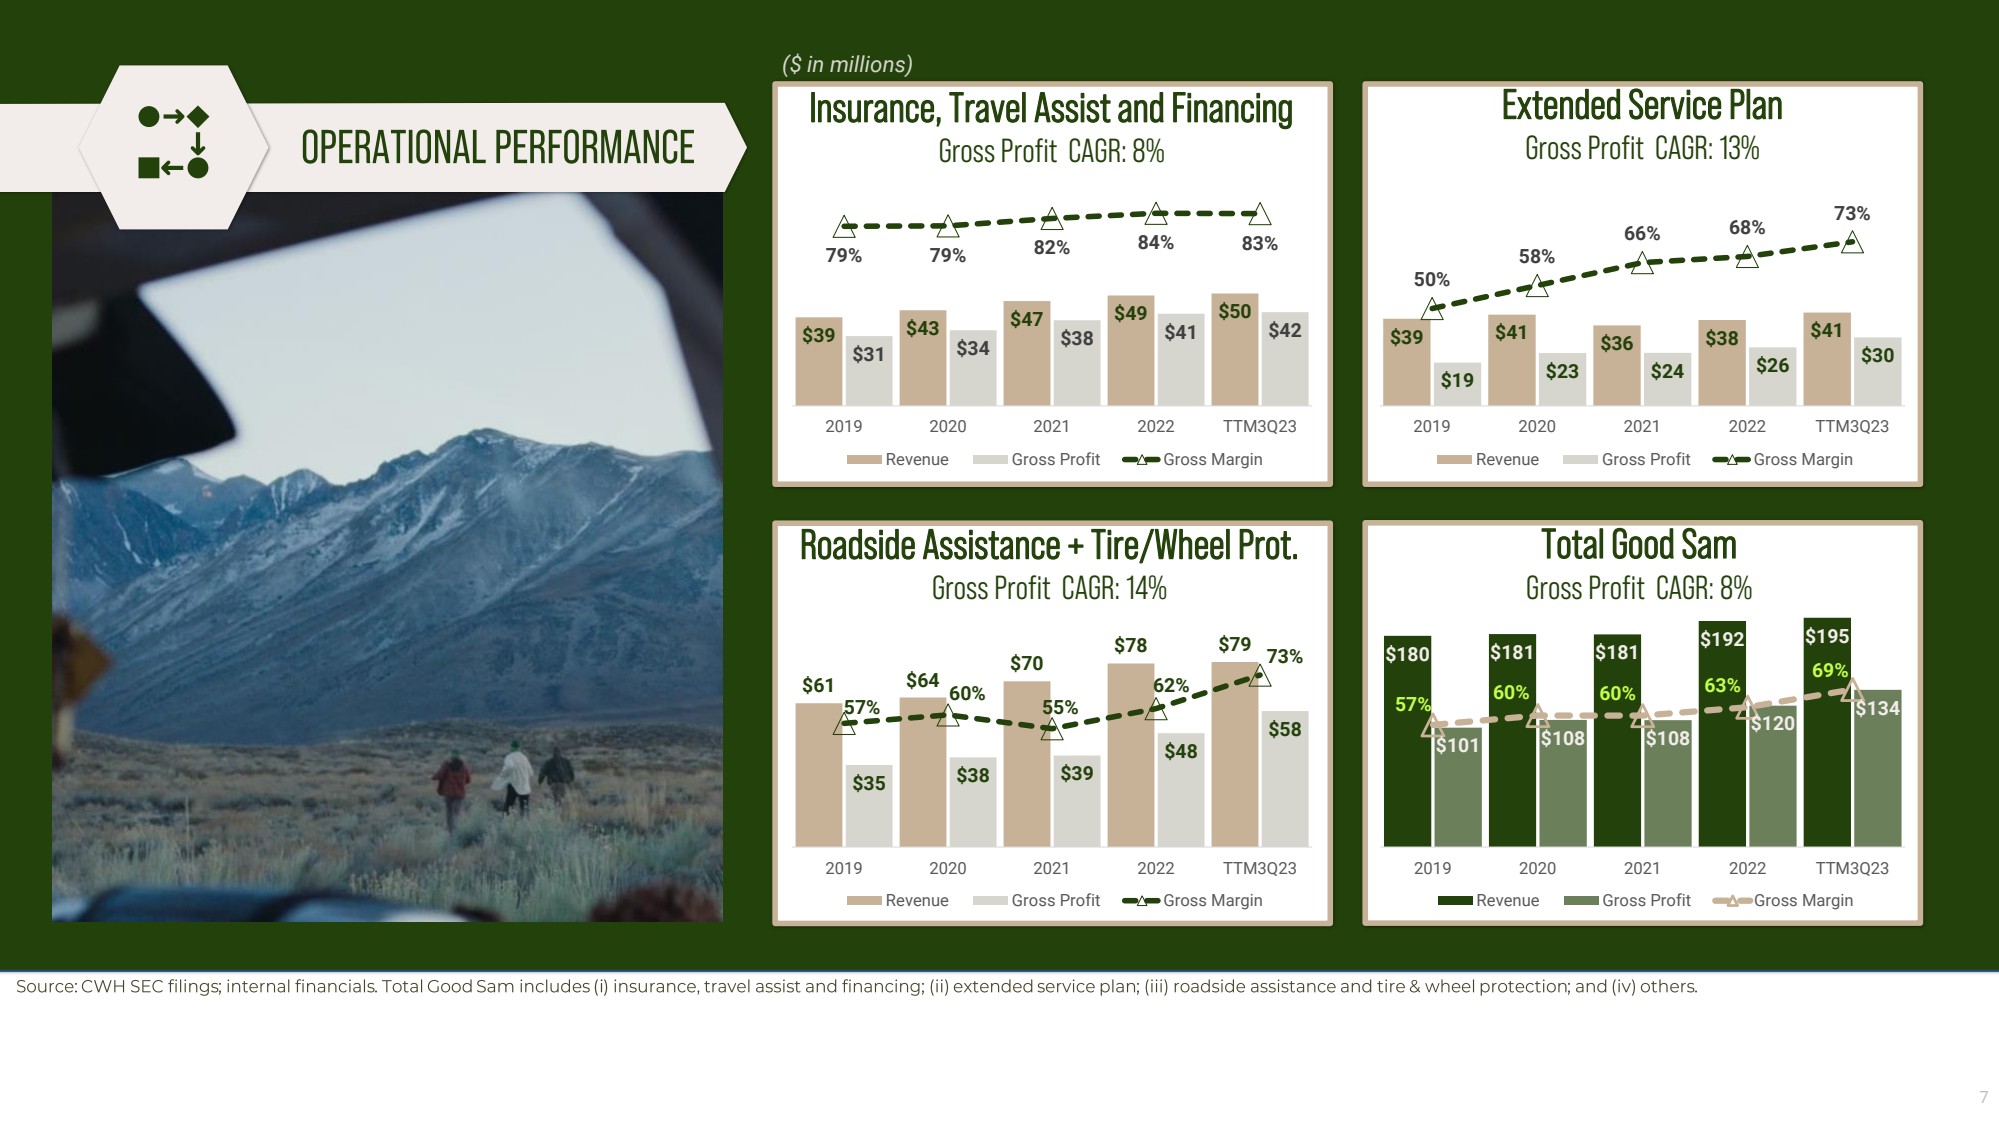
| 7
Insurance, Travel Assist and Financing
Gross Profit CAGR: 8%
Roadside Assistance + Tire/Wheel Prot.
Gross Profit CAGR: 14%
Extended Service Plan
Gross Profit CAGR: 13%
Total Good Sam
Gross Profit CAGR: 8%
($ in millions)
$39 $43 $47 $49 $50
$31 $34 $38 $41 $42
79% 79% 82% 84% 83%
2019 2020 2021 2022 TTM3Q23
Revenue Gross Profit Gross Margin
$61 $64
$70
$78 $79
$35 $38 $39
$48
$58
57%
60% 55%
62%
73%
2019 2020 2021 2022 TTM3Q23
Revenue Gross Profit Gross Margin
$39 $41
$36 $38
$41
$19
$23 $24 $26
$30
50%
58%
66% 68%
73%
2019 2020 2021 2022 TTM3Q23
Revenue Gross Profit Gross Margin
$180 $181 $181
$192 $195
$101
$108 $108
$120
57% $134
60% 60%
63%
69%
2019 2020 2021 2022 TTM3Q23
Revenue Gross Profit Gross Margin |
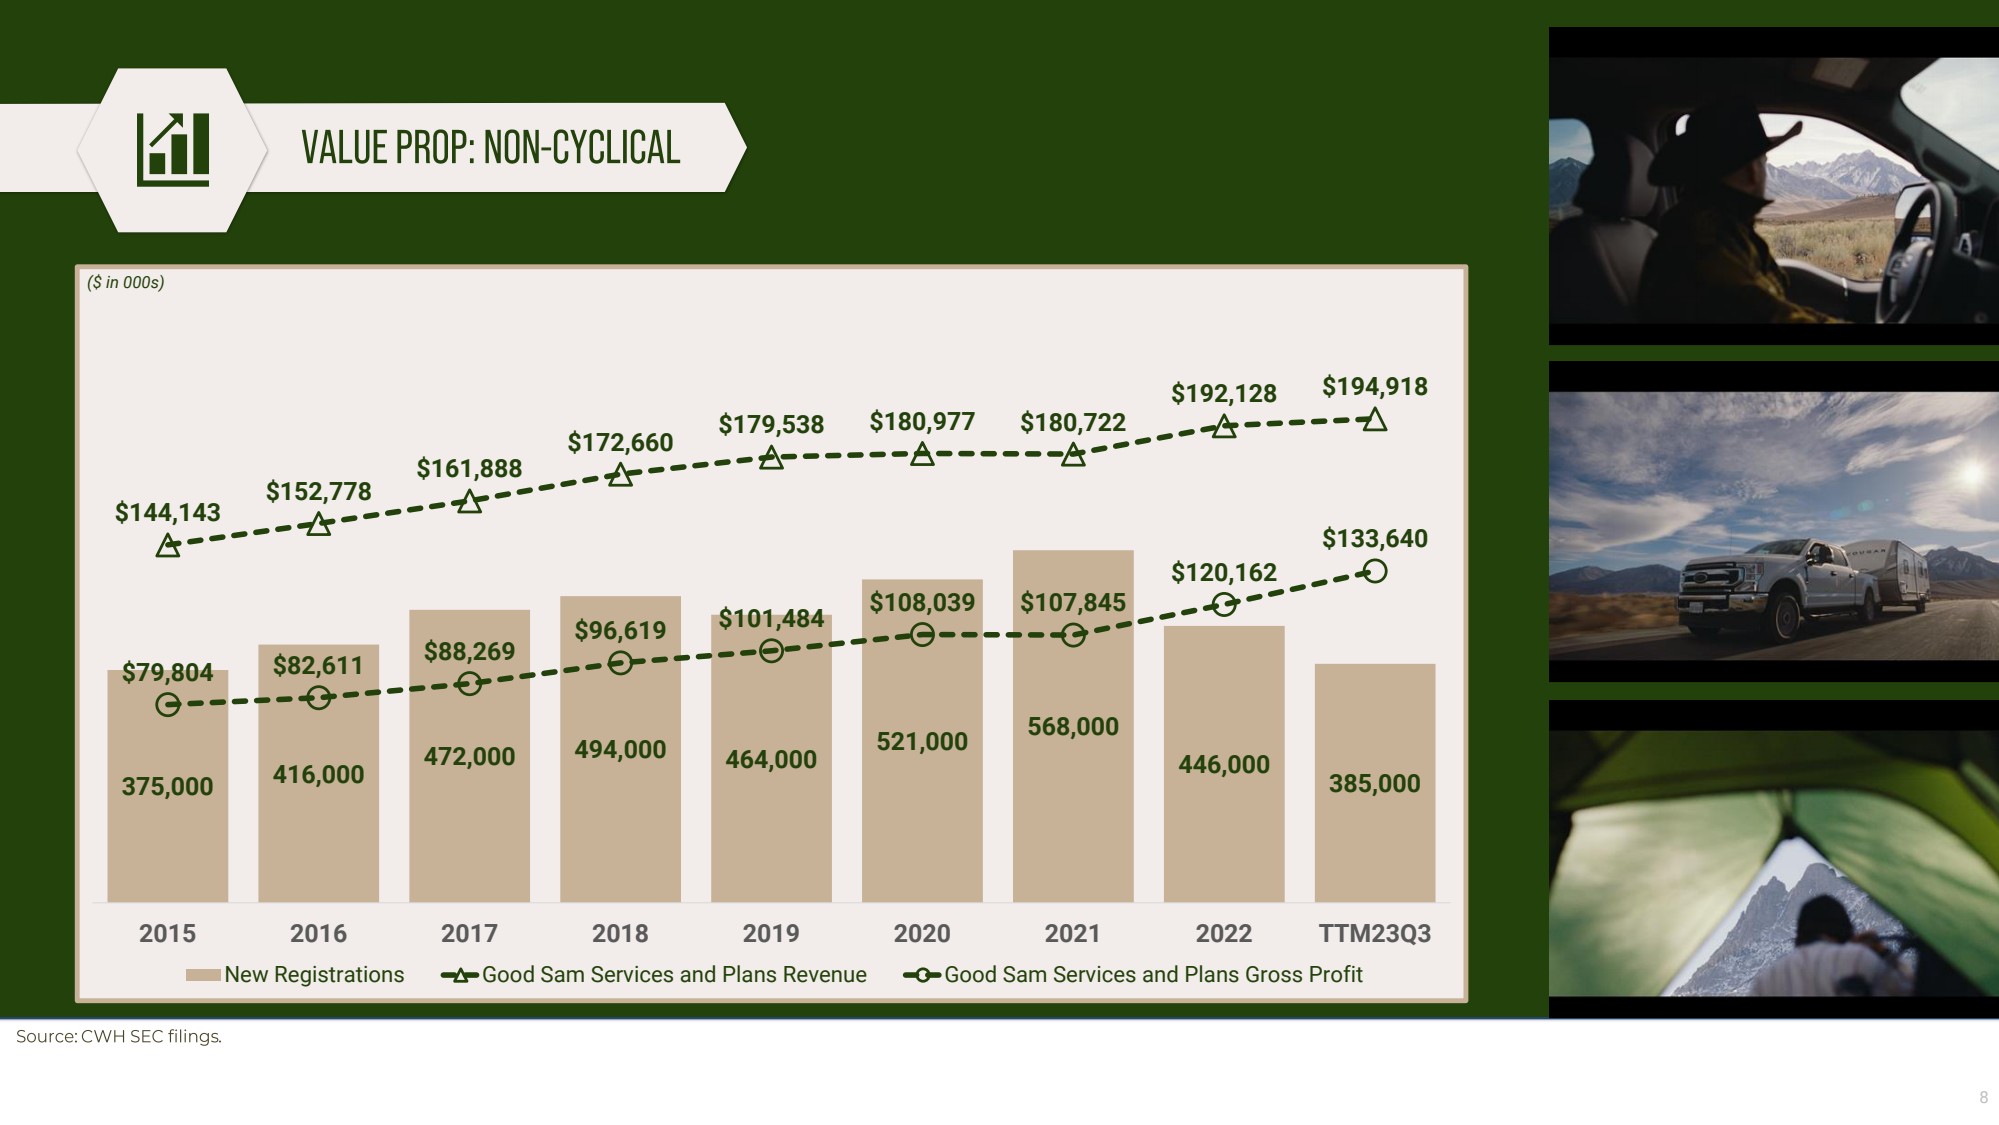
| 8
375,000 416,000 472,000 494,000 464,000 521,000 568,000
446,000
385,000
$144,143
$152,778
$161,888
$172,660 $179,538 $180,977 $180,722
$192,128 $194,918
$79,804 $82,611 $88,269
$96,619 $101,484 $108,039 $107,845
$120,162
$133,640
2015 2016 2017 2018 2019 2020 2021 2022 TTM23Q3
New Registrations Good Sam Services and Plans Revenue Good Sam Services and Plans Gross Profit
($ in 000s)
($ in 000s) |
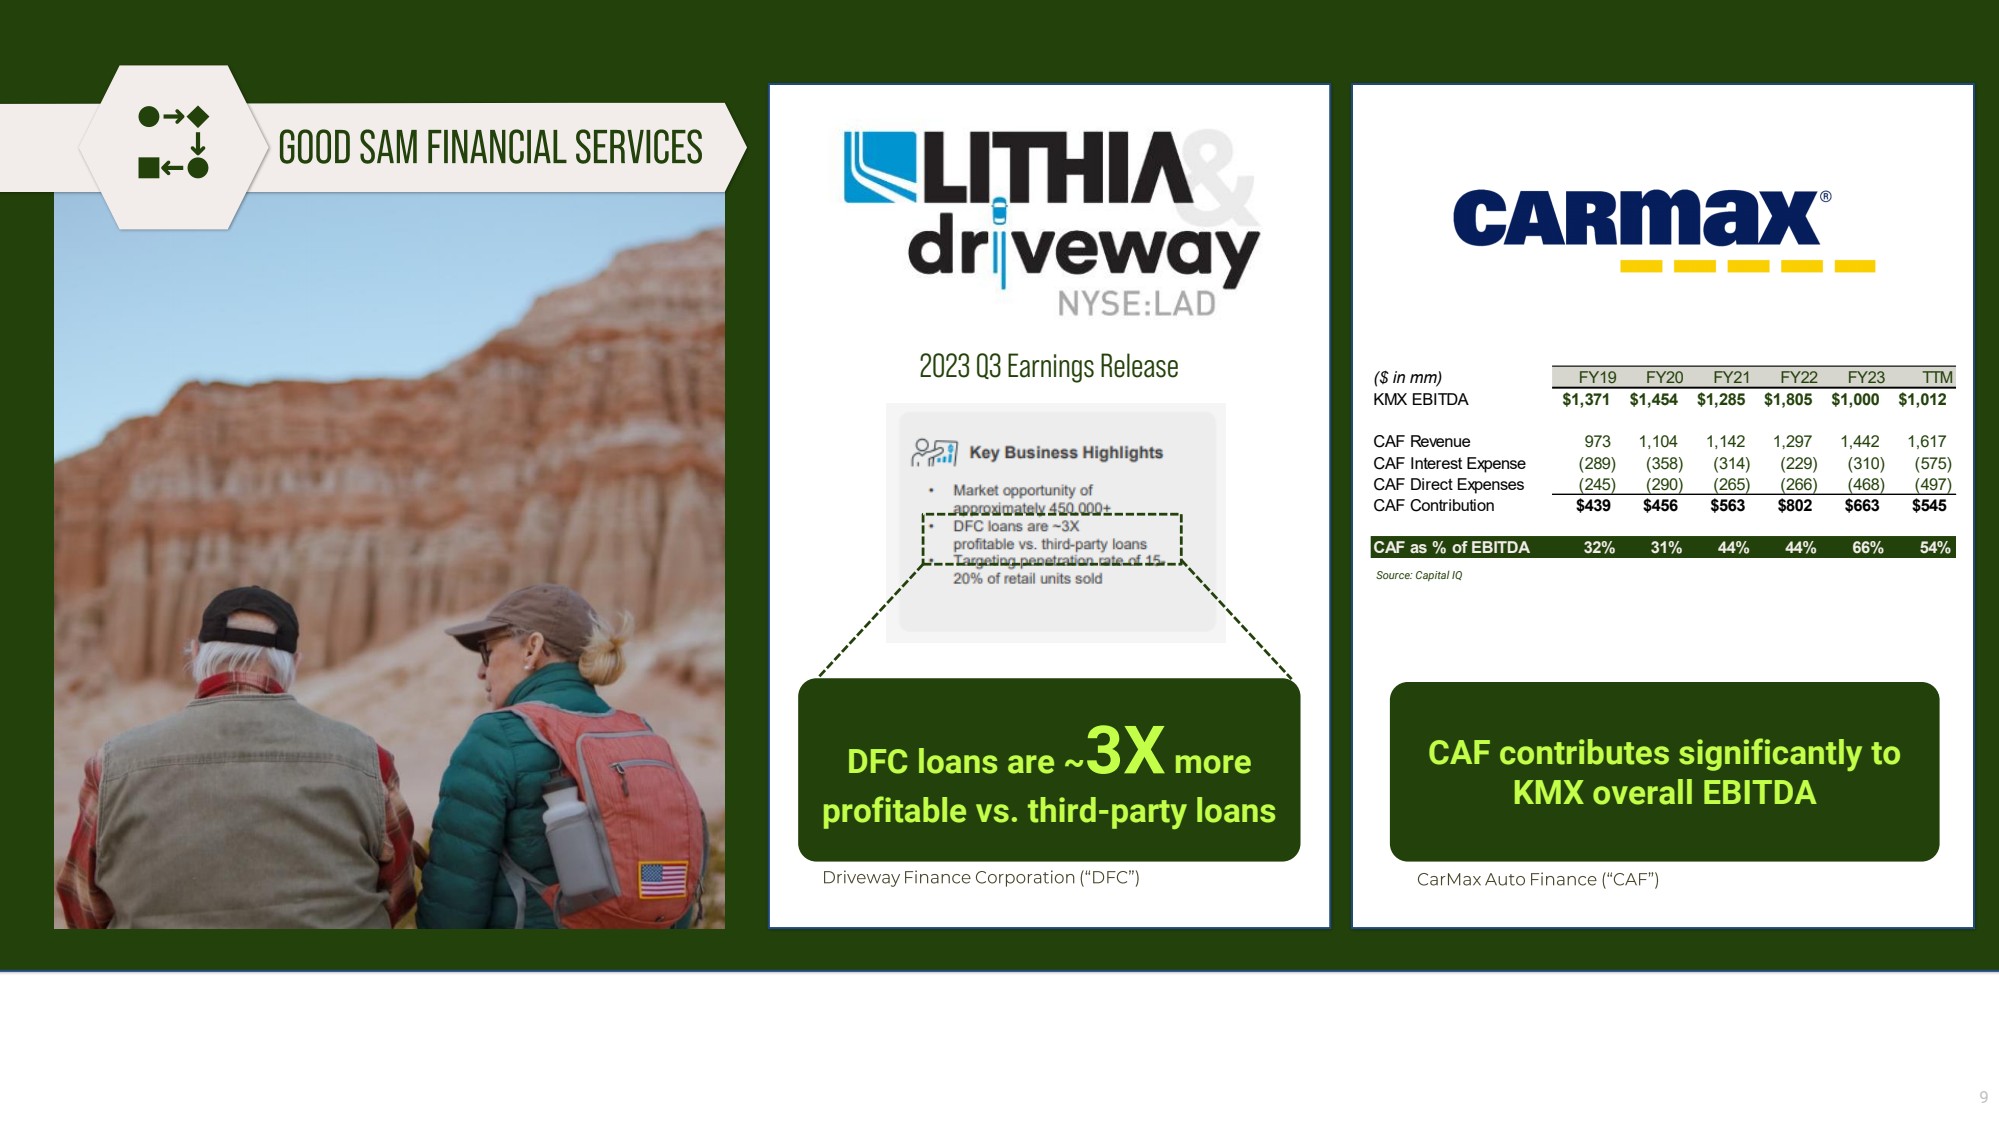
| 9
2023 Q3 Earnings Release
DFC loans are ~3X more
profitable vs. third-party loans
CAF contributes significantly to
KMX overall EBITDA
Source: Capital IQ
($ in mm) FY19 FY20 FY21 FY22 FY23 TTM
KMX EBITDA $1,371 $1,454 $1,285 $1,805 $1,000 $1,012
CAF Revenue 973 1,104 1,142 1,297 1,442 1,617
CAF Interest Expense (289) (358) (314) (229) (310) (575)
CAF Direct Expenses (245) (290) (265) (266) (468) (497)
CAF Contribution $439 $456 $563 $802 $663 $545
CAF as % of EBITDA 32% 31% 44% 44% 66% 54% |
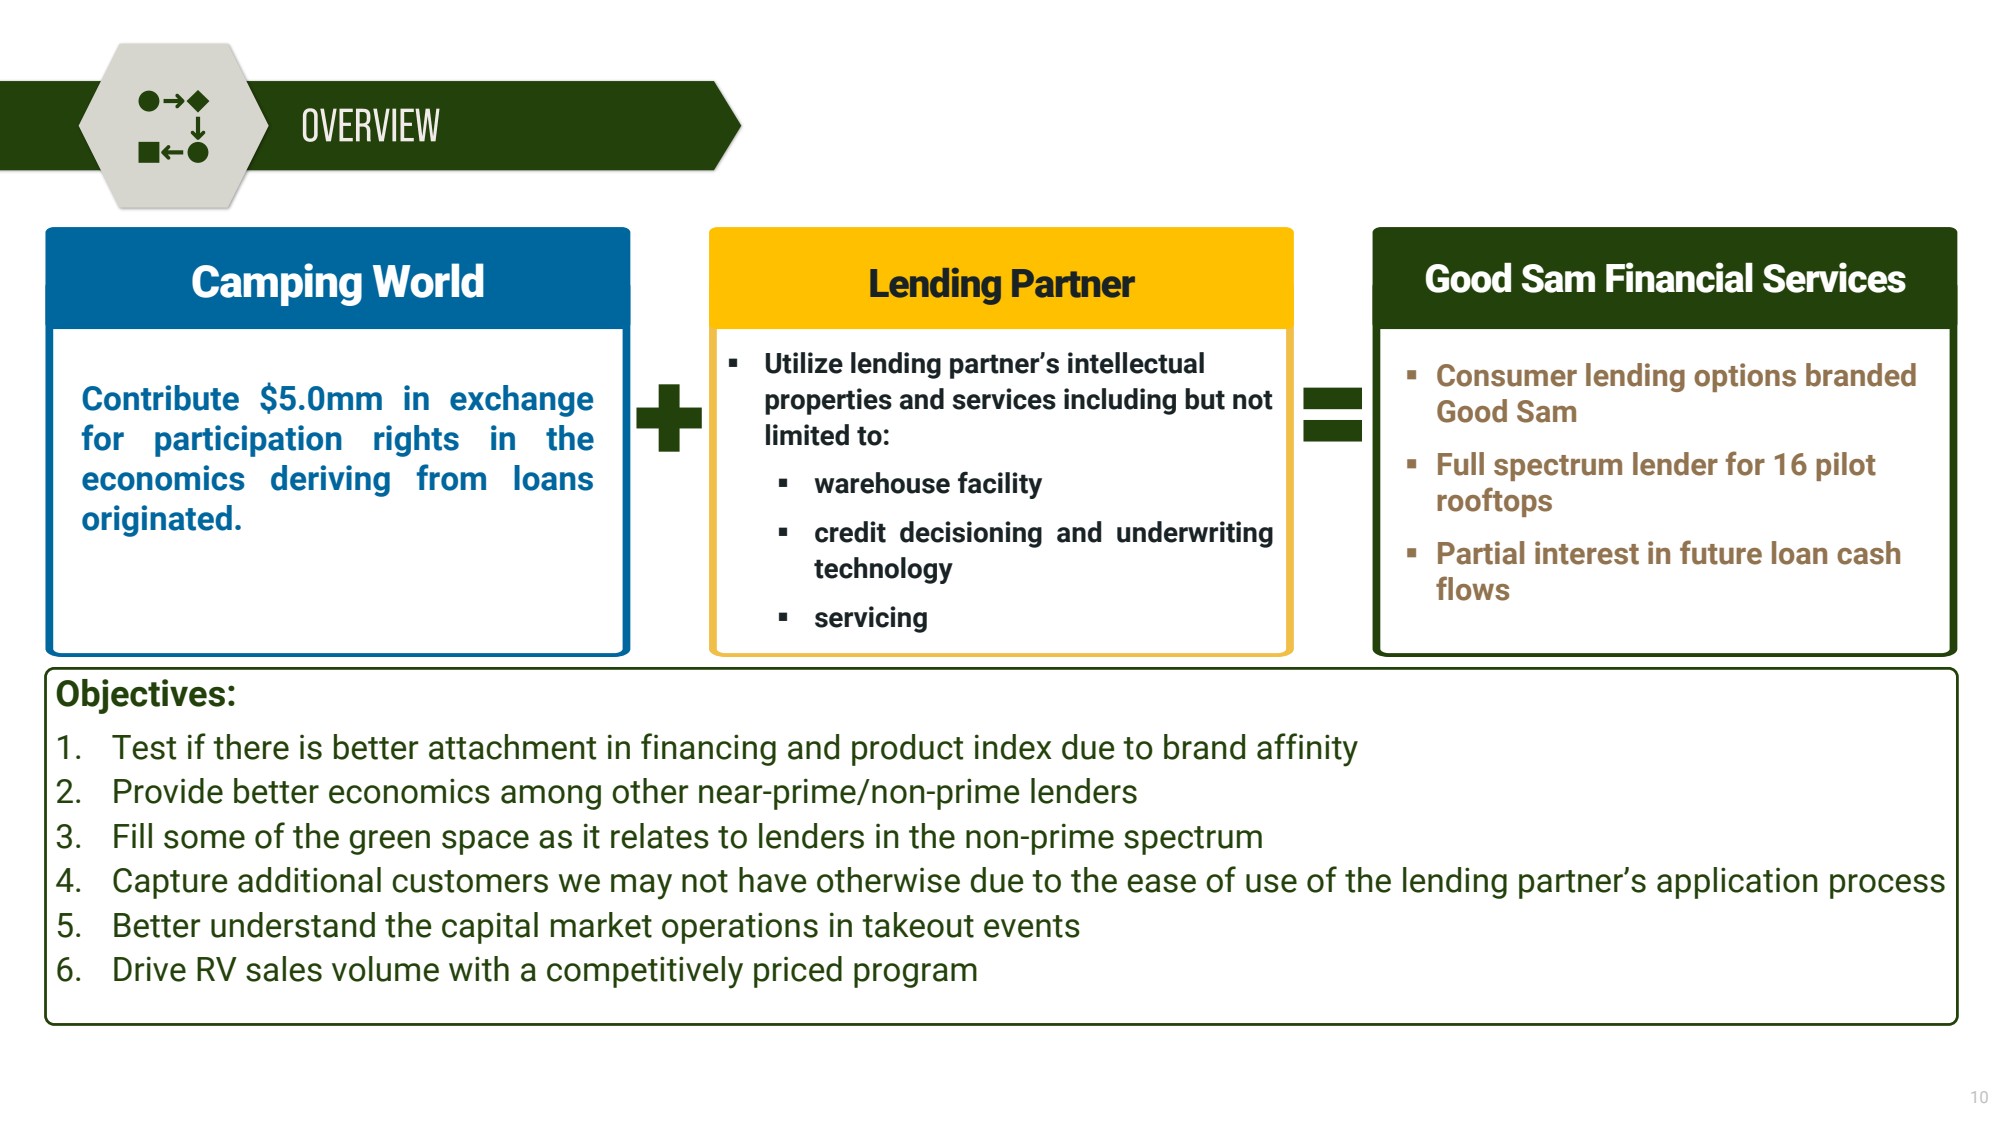
| 10
10
Camping World
Contribute $5.0mm in exchange
for participation rights in the
economics deriving from loans
originated.
Lending Partner
▪ Utilize lending partner’s intellectual
properties and services including but not
limited to:
▪ warehouse facility
▪ credit decisioning and underwriting
technology
▪ servicing
Good Sam Financial Services
▪ Consumer lending options branded
Good Sam
▪ Full spectrum lender for 16 pilot
rooftops
▪ Partial interest in future loan cash
flows
Objectives:
1. Test if there is better attachment in financing and product index due to brand affinity
2. Provide better economics among other near-prime/non-prime lenders
3. Fill some of the green space as it relates to lenders in the non-prime spectrum
4. Capture additional customers we may not have otherwise due to the ease of use of the lending partner’s application process
5. Better understand the capital market operations in takeout events
6. Drive RV sales volume with a competitively priced program |
Cover
|
Jan. 16, 2024 |
| Cover [Abstract] |
|
| Document Type |
8-K
|
| Amendment Flag |
false
|
| Document Period End Date |
Jan. 16, 2024
|
| Entity File Number |
001-37908
|
| Entity Registrant Name |
Camping World Holdings, Inc.
|
| Entity Central Index Key |
0001669779
|
| Entity Tax Identification Number |
81-1737145
|
| Entity Incorporation, State or Country Code |
DE
|
| Entity Address, Address Line One |
250 Parkway Drive
|
| Entity Address, Address Line Two |
Suite 270
|
| Entity Address, City or Town |
Lincolnshire
|
| Entity Address, State or Province |
IL
|
| Entity Address, Postal Zip Code |
60069
|
| City Area Code |
847
|
| Local Phone Number |
808-3000
|
| Written Communications |
false
|
| Soliciting Material |
false
|
| Pre-commencement Tender Offer |
false
|
| Pre-commencement Issuer Tender Offer |
false
|
| Title of 12(b) Security |
Class A
Common Stock, $0.01 par value per share
|
| Trading Symbol |
CWH
|
| Security Exchange Name |
NYSE
|
| Entity Emerging Growth Company |
false
|
| X |
- DefinitionBoolean flag that is true when the XBRL content amends previously-filed or accepted submission.
| Name: |
dei_AmendmentFlag |
| Namespace Prefix: |
dei_ |
| Data Type: |
xbrli:booleanItemType |
| Balance Type: |
na |
| Period Type: |
duration |
|
| X |
- DefinitionFor the EDGAR submission types of Form 8-K: the date of the report, the date of the earliest event reported; for the EDGAR submission types of Form N-1A: the filing date; for all other submission types: the end of the reporting or transition period. The format of the date is YYYY-MM-DD.
| Name: |
dei_DocumentPeriodEndDate |
| Namespace Prefix: |
dei_ |
| Data Type: |
xbrli:dateItemType |
| Balance Type: |
na |
| Period Type: |
duration |
|
| X |
- DefinitionThe type of document being provided (such as 10-K, 10-Q, 485BPOS, etc). The document type is limited to the same value as the supporting SEC submission type, or the word 'Other'.
| Name: |
dei_DocumentType |
| Namespace Prefix: |
dei_ |
| Data Type: |
dei:submissionTypeItemType |
| Balance Type: |
na |
| Period Type: |
duration |
|
| X |
- DefinitionAddress Line 1 such as Attn, Building Name, Street Name
| Name: |
dei_EntityAddressAddressLine1 |
| Namespace Prefix: |
dei_ |
| Data Type: |
xbrli:normalizedStringItemType |
| Balance Type: |
na |
| Period Type: |
duration |
|
| X |
- DefinitionAddress Line 2 such as Street or Suite number
| Name: |
dei_EntityAddressAddressLine2 |
| Namespace Prefix: |
dei_ |
| Data Type: |
xbrli:normalizedStringItemType |
| Balance Type: |
na |
| Period Type: |
duration |
|
| X |
- Definition
+ References
+ Details
| Name: |
dei_EntityAddressCityOrTown |
| Namespace Prefix: |
dei_ |
| Data Type: |
xbrli:normalizedStringItemType |
| Balance Type: |
na |
| Period Type: |
duration |
|
| X |
- DefinitionCode for the postal or zip code
| Name: |
dei_EntityAddressPostalZipCode |
| Namespace Prefix: |
dei_ |
| Data Type: |
xbrli:normalizedStringItemType |
| Balance Type: |
na |
| Period Type: |
duration |
|
| X |
- DefinitionName of the state or province.
| Name: |
dei_EntityAddressStateOrProvince |
| Namespace Prefix: |
dei_ |
| Data Type: |
dei:stateOrProvinceItemType |
| Balance Type: |
na |
| Period Type: |
duration |
|
| X |
- DefinitionA unique 10-digit SEC-issued value to identify entities that have filed disclosures with the SEC. It is commonly abbreviated as CIK. Reference 1: http://www.xbrl.org/2003/role/presentationRef
-Publisher SEC
-Name Exchange Act
-Number 240
-Section 12
-Subsection b-2
| Name: |
dei_EntityCentralIndexKey |
| Namespace Prefix: |
dei_ |
| Data Type: |
dei:centralIndexKeyItemType |
| Balance Type: |
na |
| Period Type: |
duration |
|
| X |
- DefinitionIndicate if registrant meets the emerging growth company criteria. Reference 1: http://www.xbrl.org/2003/role/presentationRef
-Publisher SEC
-Name Exchange Act
-Number 240
-Section 12
-Subsection b-2
| Name: |
dei_EntityEmergingGrowthCompany |
| Namespace Prefix: |
dei_ |
| Data Type: |
xbrli:booleanItemType |
| Balance Type: |
na |
| Period Type: |
duration |
|
| X |
- DefinitionCommission file number. The field allows up to 17 characters. The prefix may contain 1-3 digits, the sequence number may contain 1-8 digits, the optional suffix may contain 1-4 characters, and the fields are separated with a hyphen.
| Name: |
dei_EntityFileNumber |
| Namespace Prefix: |
dei_ |
| Data Type: |
dei:fileNumberItemType |
| Balance Type: |
na |
| Period Type: |
duration |
|
| X |
- DefinitionTwo-character EDGAR code representing the state or country of incorporation.
| Name: |
dei_EntityIncorporationStateCountryCode |
| Namespace Prefix: |
dei_ |
| Data Type: |
dei:edgarStateCountryItemType |
| Balance Type: |
na |
| Period Type: |
duration |
|
| X |
- DefinitionThe exact name of the entity filing the report as specified in its charter, which is required by forms filed with the SEC. Reference 1: http://www.xbrl.org/2003/role/presentationRef
-Publisher SEC
-Name Exchange Act
-Number 240
-Section 12
-Subsection b-2
| Name: |
dei_EntityRegistrantName |
| Namespace Prefix: |
dei_ |
| Data Type: |
xbrli:normalizedStringItemType |
| Balance Type: |
na |
| Period Type: |
duration |
|
| X |
- DefinitionThe Tax Identification Number (TIN), also known as an Employer Identification Number (EIN), is a unique 9-digit value assigned by the IRS. Reference 1: http://www.xbrl.org/2003/role/presentationRef
-Publisher SEC
-Name Exchange Act
-Number 240
-Section 12
-Subsection b-2
| Name: |
dei_EntityTaxIdentificationNumber |
| Namespace Prefix: |
dei_ |
| Data Type: |
dei:employerIdItemType |
| Balance Type: |
na |
| Period Type: |
duration |
|
| X |
- DefinitionLocal phone number for entity.
| Name: |
dei_LocalPhoneNumber |
| Namespace Prefix: |
dei_ |
| Data Type: |
xbrli:normalizedStringItemType |
| Balance Type: |
na |
| Period Type: |
duration |
|
| X |
- DefinitionBoolean flag that is true when the Form 8-K filing is intended to satisfy the filing obligation of the registrant as pre-commencement communications pursuant to Rule 13e-4(c) under the Exchange Act. Reference 1: http://www.xbrl.org/2003/role/presentationRef
-Publisher SEC
-Name Exchange Act
-Number 240
-Section 13e
-Subsection 4c
| Name: |
dei_PreCommencementIssuerTenderOffer |
| Namespace Prefix: |
dei_ |
| Data Type: |
xbrli:booleanItemType |
| Balance Type: |
na |
| Period Type: |
duration |
|
| X |
- DefinitionBoolean flag that is true when the Form 8-K filing is intended to satisfy the filing obligation of the registrant as pre-commencement communications pursuant to Rule 14d-2(b) under the Exchange Act. Reference 1: http://www.xbrl.org/2003/role/presentationRef
-Publisher SEC
-Name Exchange Act
-Number 240
-Section 14d
-Subsection 2b
| Name: |
dei_PreCommencementTenderOffer |
| Namespace Prefix: |
dei_ |
| Data Type: |
xbrli:booleanItemType |
| Balance Type: |
na |
| Period Type: |
duration |
|
| X |
- DefinitionTitle of a 12(b) registered security. Reference 1: http://www.xbrl.org/2003/role/presentationRef
-Publisher SEC
-Name Exchange Act
-Number 240
-Section 12
-Subsection b
| Name: |
dei_Security12bTitle |
| Namespace Prefix: |
dei_ |
| Data Type: |
dei:securityTitleItemType |
| Balance Type: |
na |
| Period Type: |
duration |
|
| X |
- DefinitionName of the Exchange on which a security is registered. Reference 1: http://www.xbrl.org/2003/role/presentationRef
-Publisher SEC
-Name Exchange Act
-Number 240
-Section 12
-Subsection d1-1
| Name: |
dei_SecurityExchangeName |
| Namespace Prefix: |
dei_ |
| Data Type: |
dei:edgarExchangeCodeItemType |
| Balance Type: |
na |
| Period Type: |
duration |
|
| X |
- DefinitionBoolean flag that is true when the Form 8-K filing is intended to satisfy the filing obligation of the registrant as soliciting material pursuant to Rule 14a-12 under the Exchange Act. Reference 1: http://www.xbrl.org/2003/role/presentationRef
-Publisher SEC
-Name Exchange Act
-Section 14a
-Number 240
-Subsection 12
| Name: |
dei_SolicitingMaterial |
| Namespace Prefix: |
dei_ |
| Data Type: |
xbrli:booleanItemType |
| Balance Type: |
na |
| Period Type: |
duration |
|
| X |
- DefinitionTrading symbol of an instrument as listed on an exchange.
| Name: |
dei_TradingSymbol |
| Namespace Prefix: |
dei_ |
| Data Type: |
dei:tradingSymbolItemType |
| Balance Type: |
na |
| Period Type: |
duration |
|
| X |
- DefinitionBoolean flag that is true when the Form 8-K filing is intended to satisfy the filing obligation of the registrant as written communications pursuant to Rule 425 under the Securities Act. Reference 1: http://www.xbrl.org/2003/role/presentationRef
-Publisher SEC
-Name Securities Act
-Number 230
-Section 425
| Name: |
dei_WrittenCommunications |
| Namespace Prefix: |
dei_ |
| Data Type: |
xbrli:booleanItemType |
| Balance Type: |
na |
| Period Type: |
duration |
|
Camping World (NYSE:CWH)
Historical Stock Chart
From Apr 2024 to May 2024

Camping World (NYSE:CWH)
Historical Stock Chart
From May 2023 to May 2024
