false
0001123494
0001123494
2024-01-05
2024-01-05
iso4217:USD
xbrli:shares
iso4217:USD
xbrli:shares
UNITED
STATES
SECURITIES AND EXCHANGE COMMISSION
Washington, D.C. 20549
_________________
FORM 8-K
_________________
CURRENT REPORT
Pursuant to Section 13 or 15(d)
of the Securities Exchange Act of 1934
Date of Report (Date of earliest event reported):
January 5, 2024
_______________________________
HARVARD BIOSCIENCE, INC.
(Exact name of registrant as specified in its charter)
_______________________________
| Delaware |
001-33957 |
04-3306140 |
| (State or Other Jurisdiction of Incorporation) |
(Commission File Number) |
(I.R.S. Employer Identification No.) |
84 October Hill Road
Holliston, MA 01746
(Address of Principal Executive Offices) (Zip Code)
(508) 893-8999
(Registrant's telephone number, including area
code)
(Former name or former address, if changed since
last report)
_______________________________
Check the appropriate box below if the Form 8-K filing is
intended to simultaneously satisfy the filing obligation of the registrant under any of the following provisions:
| ☐ | Written communications pursuant to Rule 425 under the Securities Act (17 CFR 230.425) |
| ☐ | Soliciting material pursuant to Rule 14a-12 under the Exchange Act (17 CFR 240.14a-12) |
| ☐ | Pre-commencement communications pursuant to Rule 14d-2(b) under the Exchange Act (17 CFR 240.14d-2(b)) |
| ☐ | Pre-commencement communications pursuant to Rule 13e-4(c) under the Exchange Act (17 CFR 240.13e-4(c)) |
Securities registered pursuant to Section 12(b) of the Act:
| Title of each class |
Trading Symbol(s) |
Name of each exchange on which registered |
| Common Stock, $0.01 par value |
HBIO |
The NASDAQ Stock Market |
Indicate by check mark whether the registrant is an emerging
growth company as defined in Rule 405 of the Securities Act of 1933 (§230.405 of this chapter) or Rule 12b-2 of the Securities Exchange
Act of 1934 (§240.12b-2 of this chapter).
Emerging growth company ☐
If
an emerging growth company, indicate by check mark if the registrant has elected not to use the extended transition period for complying
with any new or revised financial accounting standards provided pursuant to Section 13(a) of the Exchange Act. ☐
| Item 2.02. | Results
of Operations and Financial Condition |
Attached as Exhibit 99.1 is an investor presentation,
dated January 5, 2024, that provides an overview of Harvard Bioscience, Inc. (the “Company”). The investor presentation includes,
among other things, preliminary, unaudited estimates of the Company’s full year 2023 revenue (the “Preliminary Financial Information”).
The Preliminary Financial Information contained
in the investor presentation is unaudited and preliminary and does not present all information necessary for an understanding of the Company’s
financial condition as of December 31, 2023 or its results of operations as of such date. This Preliminary Financial Information is subject
to completion of the Company’s normal financial close procedures. These procedures and the audit of the Company’s financial
statements for the year ended December 31, 2023 are ongoing and could result in changes to the Preliminary Financial Information.
The information in this Current Report on
Form 8-K (including Exhibit 99.1) is being furnished pursuant to Items 2.02 and 7.01 and shall not be deemed to be “filed”
for purposes of Section 18 of the Securities Exchange Act of 1934 (the “Exchange Act”) or otherwise subject to the liabilities
of that section, nor shall it be deemed to be incorporated by reference in any filing under the Securities Act of 1933 or the Exchange
Act. The information set forth in Items 2.02 and 7.01 shall not be deemed an admission as to the materiality of any information in this
Current Report on Form 8-K that is required to be disclosed solely to satisfy the requirements of Regulation FD.
| Item 7.01. | Regulation
FD Disclosure |
The information contained in Item 2.02 is
hereby incorporated into this Item 7.01 by reference.
| Item 9.01. | Financial
Statements and Exhibits |
(d) Exhibits.
SIGNATURE
Pursuant to the requirements of the Securities Exchange Act of 1934,
the registrant has duly caused this report to be signed on its behalf by the undersigned hereunto duly authorized.
| |
HARVARD BIOSCIENCE, INC. |
| |
|
| |
|
| Date: January 5, 2024 |
By: |
/s/ Jennifer Cote |
|
| |
|
Jennifer Cote |
|
| |
|
Chief Financial Officer |
Exhibit 99.1

Jim Green, Chairman , President & CEO January 5, 2024 HBIO Investor Overview Enabling discovery, safety and production of tomorrow’s therapeutics

Forward - Looking Statements and Non - GAAP Financial Information Forward - Looking Statements This document contains forward - looking statements within the meaning of the federal securities laws, including the Private Securities Litigation Reform Act of 1995 . Forward - looking statements may be identified by the use of words such as “may,” “will,” “expect,” “plan,” “anticipate,” “estimate,” “intend” and similar expressions or statements that do not relate to historical matters . Forward - looking statements include, but are not limited to, information concerning expected future financial and operational performance including revenues, gross margins, earnings, cash and debt position, growth and the introduction of new products, and the strength of the Company’s market position and business model . These forward - looking statements include the Company’s estimated full year 2023 revenue, which is preliminary and unaudited and is subject to completion of the Company’s financial close procedures . These procedures and the audit of the Company’s financial statements for the year ended December 31 , 2023 , are ongoing and could result in changes to such estimated information . Forward - looking statements are not guarantees of future performance and involve known and unknown uncertainties, risks, assumptions, and contingencies, many of which are outside the Company’s control . Risks and other factors that could cause the Company’s actual results to differ materially from those described its forward - looking statements include those described in the “Risk Factors” section of the Company’s most recently filed Annual Report on Form 10 - K as well as in the Company’s other filings with the Securities and Exchange Commission . Forward - looking statements are based on the Company’s expectations and assumptions as of the date of this document . Except as required by law, the Company assumes no obligation to update forward - looking statements to reflect any change in expectations, even as new information becomes available . Management’s Use of Non - GAAP Financial Information This document includes non - GAAP financial information including one or more of adjusted operating income (loss), adjusted net income (loss), adjusted EBITDA, adjusted EBITDA margin, adjusted diluted earnings (loss) per share, foreign exchange adjusted revenue, net debt and net leverage ratio . We believe that this non - GAAP financial information provides investors with an enhanced understanding of the underlying operations of the business . For the periods presented, these non - GAAP financial measures have excluded certain expenses and income resulting from items that we do not believe are representative of the underlying operations of the business . Items excluded include stock - based compensation, amortization of intangibles related to acquisitions, litigation settlement, restructuring and other costs, gain/loss on equity securities, income taxes and the tax impact of the reconciling items . Management believes that this non - GAAP financial information is important in comparing current results with prior period results and is useful to investors and financial analysts in assessing the Company’s operating performance . Non - GAAP historical financial statement information included herein is accompanied by a reconciliation to the nearest corresponding GAAP measure which is included as exhibits below . With respect to forward - looking measures, we provide an outlook for adjusted EBITDA margin, and net leverage ratio . Many of the items that we exclude from these forward - looking measure calculations are less capable of being controlled or reliably predicted by management . These items could cause the forward - looking measures presented in our outlook statements to vary materially from our reported net income and other GAAP results . The non - GAAP financial information provided in this presentation should be considered in addition to, not as a substitute for, the financial information provided and presented in accordance with GAAP and may be different than other companies’ non - GAAP financial information . 2 2

Most trusted partner of leading academic research institutions, contract research organizations, pharmaceutical and bio - techs in the discovery, production, and safety & regulatory testing of tomorrow’s life - saving therapies PRE - CLINICAL SYSTEMS CELLULAR & MOLECULAR TECHNOLOGIES (CMT) ▪ Academic Research / BioPharma Discovery ▪ Leader in Electroporation / Electrofusion for gene editing ▪ Leader in high - density Micro Electrode Arrays (MEA) for advanced cellular applications 3 ▪ Global sales footprint, 3 core manufacturing facilities ▪ Approx. 420 employees, 33 PhD, 54 Masters, 77 Bachelors ▪ Est. FY’23 Revenue: ~ $112.3M incl. $5.1M net discontinued* ▪ Q3’23 YTD Adj EBITDA : $10.9M (13% of rev), up 53% vs PY** ▪ 35%+ recurring revenues ▪ Founded 1901, Public Listing Dec. 2000 “NASDAQ: HBIO” ▪ Headquarters: Greater Boston, MA COMPANY PROFILE BALANCED PORTFOLIO Academic / Research 52% CRO / Government 28% Industrial / Pharma 20% Americas 47% EMEA 28% APAC 25% 2022 REVENUE BY CUSTOMER TYPE 2022 REVENUE BY GEOGRAPHY Revenues allocations are approximate ▪ Market leader GLP telemetry systems for safety pharmacology and toxicology regulatory reporting ▪ Data collection, analysis and regulatory report generation required prior to phase 1 clinical ▪ Widest range of wireless endpoint monitoring * Full year 2023 revenue is a preliminary, unaudited estimate and is subject to the Company’s financial close procedures. Thes e p rocedures and the audit of the Company’s financial statements for the year ended December 31, 2023 are ongoing. Actual revenue may differ from the amounts shown. See slide 5 for information on net dis con tinued products. ** Information as of September 30, 2023. Non - GAAP measure ; reconciliations to GAAP financial measures are available in Appendix.

Harvard Bioscience Highlights Essential, secular growth markets, high barriers, few competitors Growing global marquee customer base High barrier innovative technologies Highly effective sales channel supported by elite applications scientists Strong discipline, lean operating platform DIVERSIFIED CUSTOMER / REVENUE MODEL Systems & Software Services Consumables Global sales, application science and service structure Technology leadership competitive advantage with high barrier innovative technologies Robust pipeline of next - gen solutions 4

FY23 reported revenue down slightly from prior year (includes net headwind of $5.1M of discontinued products) FY23 Guidance as Presented November 13 - 14% **** REVENUES ADJUSTED EBITDA & EBITDA MARGINS* FY23 Prelim (unaudited) ** * Non - GAAP measure ; reconciliations to GAAP financial measures are available in Appendix. ** Full year 2023 revenue is a preliminary, unaudited estimate and is subject to the Company’s financial close procedures. The se procedures and the audit of the Company’s financial statements for the year ended December 31, 2023 are ongoing. Actual revenue may differ from the amounts shown. *** 2022 Revenue includes $5.5 million in sales of discontinued products; 2023 Revenue includes estimated $0.4 million from sal es of discontinued products; net difference is $5.1 million. **** FY23 Guidance as presented in Q3 earnings release on November 7, 2023. This presentation is not a reaffirmation of guidanc e. Covid - 19 Portfolio Optimization Supply Chain Challenges $ 5.5M *** $0.4M *** $113.3M $16M 15% $11M 10% $18M 15% 5 Sales and Earnings Trends $102 M $119 M $107.8 M ~$112.3M $111.9 M

Today’s Global Footprint CELLULAR & MOLECULAR AND HBIO HEADQUARTERS Boston PRE - CLINICAL SYSTEMS Minneapolis Sales Office / Small Centers of Excellence Core Operating Site 12 - 31 - 23 12 - 31 - 18 420 547 Employees* 8 14 Sites *Headcount is approximate CELLULAR & MOLECULAR Stuttgart, Germany 6

Increased funding for research and development of advanced therapeutics Rising incidence of disease – cardiac, cancer, respiratory, diabetes, obesity, Alzheimer’s, neurological, infectious 1) https://www.researchandmarkets.com/reports/5553406/pharmaceuticals - global - market - report - 2022 - by 2) https://www.acumenresearchandconsulting.com/biotechnology - market 3) https://www.emergenresearch.com/request - sample/1221 4) https://ncses.nsf.gov/pubs/nsf22323 5) https://www.grandviewresearch.com/industry - analysis/preclinical - cro - market *Internal estimates calculated based on publicly - available data. Increased demand for research tools, devices and systems that improve efficiency & productivity and enable therapeutics discovery and safety & regulatory through bio - production DRIVERS END MARKET SEGMENTS Estimated size & projected CAGR PHARMACEUTICAL 1 BIOTECH 2 CONTRACT RESEARCH ORGANIZATIONS 3 ACADEMIC RESEARCH 4 Global $1.6T 2022 7.7% 2022 - 2026 Global $372B 2021 15.5% 2022 - 2030 Global $61B 2021 10.9% 2021 - 2030 Essential Technologies Serving Well - funded, High - growth Secular Markets Demographic Tailwinds 7 R&D $222B (2021)* NIH Grants $30.2B (2021)* R&D $60B (2021)* Estimated R&D expenditure within HBIO markets US Federal $179B 2021 9.3% 2016 - 2021 Pre - clinical market $5B (2021) 5 7

Subset of blue - chip recurring customers • Scientific Research labs primarily government & grant funded • Early discovery of new novel drugs and compounds for therapies and vaccines • Advanced cellular testing & gene editing ACADEMIC RESEARCH • Perform early discovery and then transition from discovery through pre - clinical regulatory and on to production • Leverage discoveries from academics & bio - techs • Bridge to bio - production BIOTECH, PHARMACEUTICAL CONTRACT RESEARCH ORGANIZATIONS • Pre - clinical studies to determine safety and efficacy of new pharmaceuticals • Pharmaceutical companies are outsourcing significant pre - clinical activities to CROs Breakthrough technologies and applications, increase innovative publications Reduce test cycle - time, increase volume and study types, drives CROs revenue growth Reduce development cycle time means more compounds drives BioPharma revenue growth Value Proposition 8 Blue Chip Customer Base

9 Adapt Technologies to High Volume CRO & Bioproduction Applications Research & Discovery Pre - Clinical Safety & Toxicology CELLS MOLECULES CLINICAL ORGANOIDS/ ORGANS PRECLINICAL Bio - Production Extend Technology Leadership in Academic Research & Discovery

• Fortify leadership position and expand recurring revenue in therapy research and pre - clinical testing • Pre - clinical Telemetry and GLP compliant Ponemah data management software for data reporting and analysis • Electroporation/Transfection/ Amino Acid Analysis • Micro - Electrode Arrays (MEAs) cellular electrophysiology STRENGTHEN THE BASE • Offerings for higher volume industrial customers including CROs, Biotech, Pharma and Government Labs • Reduce cost and improve cycle time/throughput for therapy testing and development • Expanded Ponemah functionality combined with new VivaMARS system opens door to new pre - clinical opportunities EXPAND HIGH VOLUME APPS • Offerings for Biotech and Pharma customers engaged in therapy development and production • Bridge from research to production in applications that scale with production volume • Leverage technology leadership in Electroporation/Transfection EXPAND TO BIO - PRODUCTION • Offerings for Academic, Biotech, and Pharma customers engaged in therapy discovery, development and testing. • New opportunities for streamlined in vitro testing from cell lines to organoids early in the therapy development cycle. • Leverage leadership in Micro - Electrode Arrays (MEAs) & electrophysiology INNOVATE CELLULAR 10 ACCELERATING REVENUE GROWTH Strategic Growth Drivers

• Gold standard: simultaneous multi - animal wireless telemetry • Full menu offering from smallest to largest animal models • Improved test yields/ reduced cycle time drives customer revenue growth 11 Industry Leading Telemetry & Ponemah Data Management & Reporting Platform Industry Leading Electroporation/Electrofusion Systems • Known for most challenging cell transfection • BTX well established for cell modification, CAR - T Cell creation, CGT, CRISPR applications, electrofusion for monoclonal antibody creation Leader in Electrophysiology & Micro - Electrode Arrays (MEAs) • Leader in electrophysiology testing systems • Discovery leader in MEA data acquisition GOLD STANDARD SUPPORTING CUSTOMER REQUIREMENTS FOR SAFETY AND REGULATORY APPROVAL FOR DRUGS, VACCINES, THERAPIES PRIOR TO HUMAN CLINICAL USE WELL ESTABLISHED TECHNOLOGY FOR NEW DRUG AND THERAPY COMPOUND CREATION LEADING TECHNOLOGY FOR IN VITRO ELECTROPHYSIOLOGY CELLULAR TESTING Strengthen The Base: Maintain Leadership, Expand Recurring Revenue

Ponemah Actimetry Acquisition/Analysis SW Network Router & Switch User‘s computer (local or remote) LAN Value Proposition ▪ Significantly lower operating costs ▪ Significantly reduced test cycle time accelerates revenue ▪ Benchmarked experiment: >2X throughput @ 50 subjects Applications ▪ High throughput drug discovery & development up to 100 subjects ▪ Neuropharmacology / neurotoxicity / Early CNS Drug Discovery ▪ Automated “no touch” remote monitored operation Target Customers: CROs, Pharma, Gov Labs, Academic Cores VivaMARS : Launched at Nov. 2023 Society for Neuroscience 12 AUTOMATED INFRARED TRACKING INTEGRATED WITH OUR INDUSTRY LEADING TELEMETRY/GLP PONEMAH DATA PLATFORM Expand Higher Volume Industrial Applications
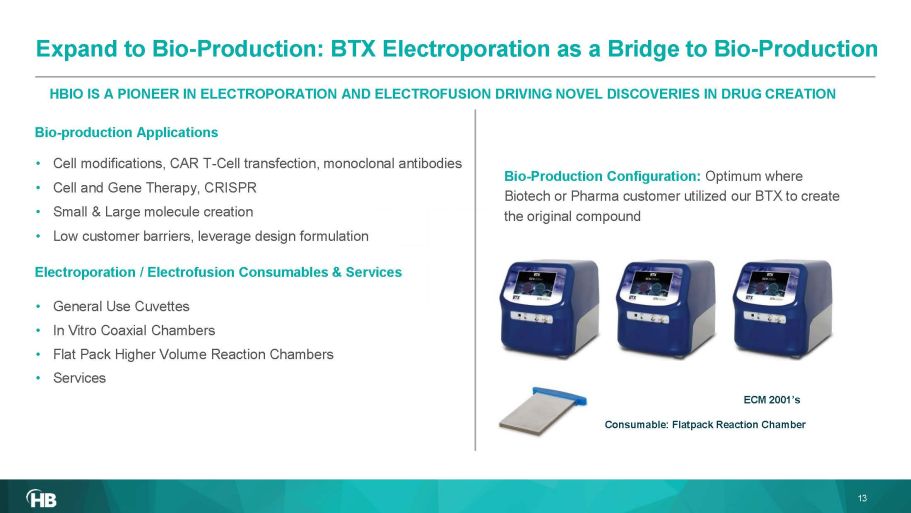
• General Use Cuvettes • In Vitro Coaxial Chambers • Flat Pack Higher Volume Reaction Chambers • Services HBIO IS A PIONEER IN ELECTROP ORATION AND ELECTROFUSION DRIVING NOVEL DISCOVERIES IN DRUG CREATION Electroporation / Electrofusion Consumables & Services • Cell modifications, CAR T - Cell transfection, monoclonal antibodies • Cell and Gene Therapy, CRISPR • Small & Large molecule creation • Low customer barriers, leverage design formulation Consumable: Flat pack Reaction Chamber Bio - Production Configuration: Optimum where Biotech or Pharma customer utilized our BTX to create the original compound ECM 2001’s 13 Bio - production Applications Expand to Bio - Production: BTX Electroporation as a Bridge to Bio - Production
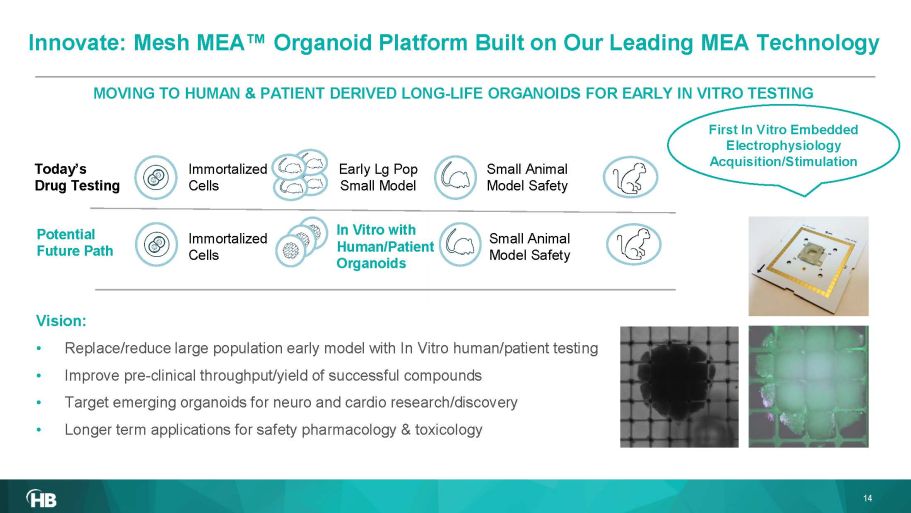
Vision: • Replace/reduce large population early model with In Vitro human/patient testing • Imp rove pre - clinical throughput/yield of successful compounds • Target emerging organoids for neuro and cardio research/discovery • Longer term applications for safety pharmacology & toxicology MOVING TO HUMAN & PATIENT DERIVED LONG - LIFE ORGANOIDS FOR EARLY IN VITRO TESTING Early Lg Pop Small Model Immortalized Cells In Vitro with Human/Patient Organoids Today’s Drug Testing Potential Future Path 14 First In Vitro Embedded Electrophysiology Acquisition/Stimulation Immortalized Cells Small Animal Model Safety Small Animal Model Safety Innovate: Mesh MEA Œ Organoid Platform B uilt on Our L eading MEA Technology

LARGE, LOYAL CUSTOMER BASE IN DRUG RESEARCH & DISCOVERY, SAFETY & REGULATORY, AND BIO - PRODUCTION MARKETS NEW PRODUCT INTRODUCTIONS FOCUSED ON TOP - LINE GROWTH & RECURRING REVENUE Investment Thesis: Deliver Strong, Profitable, Long - Term Growth 15 FOCUSED ON LONG TERM TOPLINE GROWTH WITH 60% GROSS MARGINS & 20%+ ADJUSTED EBITDA MARGINS* * Non - GAAP measure, reconciliations to GAAP financial measures are available in Appendix

Enabling discovery, safety and production of tomorrow’s therapeutics Thank You

Appendix 1 7 17

Reconciliation of GAAP to Non - GAAP Financial Measures HARVARD BIOSCIENCE, INC. Reconciliation of GAAP to Non - GAAP Financial Measures (in thousands) Q3 YTD'23 Q3 YTD'22 Year Ended Year Ended Year Ended 30 - Sep - 23 30 - Sep - 22 31 - Dec - 22 31 - Dec - 21 31 - Dec - 20 ($1,597) ($7,850) ($9,516) ($288) ($7,810) GAAP net loss 3,618 3,401 4,411 4,169 3,647 Stock - based compensation 4,167 4,588 6,236 6,018 5,920 Acquired asset amortization and impairment 46 4,533 5,603 4,462 6,042 Settlement, restructuring, & other 374 - - - - Unrealized loss on equity securities (1,919) (1,409) (1,689) (3,387) (1,469) Income taxes 4,689 3,263 5,045 10,974 6,330 Adjusted net income 1,054 1,024 1,338 1,603 1,712 Depreciation 3,095 1,889 2,426 2,206 5,637 Interest and other expense, net 2,063 972 2,026 3,534 1,987 Adjusted income taxes (1) $10,901 $7,148 $10,835 $18,317 $15,666 Adjusted EBITDA $84,097 $84,908 $113,335 $118,904 $102,100 Revenue 13.0% 8.4% 9.6% 15.4% 15.3% Adjusted EBITDA margin (2) (1) Adjusted income taxes includes the tax effect of adjusting for the reconciling items using the tax rates in the jurisdict ion s in which the reconciling items arise. (2) Adjusted EBITDA margin % is calculated as Adjusted EBITDA / Revenue. 18
v3.23.4
| X |
- DefinitionBoolean flag that is true when the XBRL content amends previously-filed or accepted submission.
| Name: |
dei_AmendmentFlag |
| Namespace Prefix: |
dei_ |
| Data Type: |
xbrli:booleanItemType |
| Balance Type: |
na |
| Period Type: |
duration |
|
| X |
- DefinitionFor the EDGAR submission types of Form 8-K: the date of the report, the date of the earliest event reported; for the EDGAR submission types of Form N-1A: the filing date; for all other submission types: the end of the reporting or transition period. The format of the date is YYYY-MM-DD.
| Name: |
dei_DocumentPeriodEndDate |
| Namespace Prefix: |
dei_ |
| Data Type: |
xbrli:dateItemType |
| Balance Type: |
na |
| Period Type: |
duration |
|
| X |
- DefinitionThe type of document being provided (such as 10-K, 10-Q, 485BPOS, etc). The document type is limited to the same value as the supporting SEC submission type, or the word 'Other'.
| Name: |
dei_DocumentType |
| Namespace Prefix: |
dei_ |
| Data Type: |
dei:submissionTypeItemType |
| Balance Type: |
na |
| Period Type: |
duration |
|
| X |
- DefinitionAddress Line 1 such as Attn, Building Name, Street Name
| Name: |
dei_EntityAddressAddressLine1 |
| Namespace Prefix: |
dei_ |
| Data Type: |
xbrli:normalizedStringItemType |
| Balance Type: |
na |
| Period Type: |
duration |
|
| X |
- Definition
+ References
+ Details
| Name: |
dei_EntityAddressCityOrTown |
| Namespace Prefix: |
dei_ |
| Data Type: |
xbrli:normalizedStringItemType |
| Balance Type: |
na |
| Period Type: |
duration |
|
| X |
- DefinitionCode for the postal or zip code
| Name: |
dei_EntityAddressPostalZipCode |
| Namespace Prefix: |
dei_ |
| Data Type: |
xbrli:normalizedStringItemType |
| Balance Type: |
na |
| Period Type: |
duration |
|
| X |
- DefinitionName of the state or province.
| Name: |
dei_EntityAddressStateOrProvince |
| Namespace Prefix: |
dei_ |
| Data Type: |
dei:stateOrProvinceItemType |
| Balance Type: |
na |
| Period Type: |
duration |
|
| X |
- DefinitionA unique 10-digit SEC-issued value to identify entities that have filed disclosures with the SEC. It is commonly abbreviated as CIK. Reference 1: http://www.xbrl.org/2003/role/presentationRef
-Publisher SEC
-Name Exchange Act
-Number 240
-Section 12
-Subsection b-2
| Name: |
dei_EntityCentralIndexKey |
| Namespace Prefix: |
dei_ |
| Data Type: |
dei:centralIndexKeyItemType |
| Balance Type: |
na |
| Period Type: |
duration |
|
| X |
- DefinitionIndicate if registrant meets the emerging growth company criteria. Reference 1: http://www.xbrl.org/2003/role/presentationRef
-Publisher SEC
-Name Exchange Act
-Number 240
-Section 12
-Subsection b-2
| Name: |
dei_EntityEmergingGrowthCompany |
| Namespace Prefix: |
dei_ |
| Data Type: |
xbrli:booleanItemType |
| Balance Type: |
na |
| Period Type: |
duration |
|
| X |
- DefinitionCommission file number. The field allows up to 17 characters. The prefix may contain 1-3 digits, the sequence number may contain 1-8 digits, the optional suffix may contain 1-4 characters, and the fields are separated with a hyphen.
| Name: |
dei_EntityFileNumber |
| Namespace Prefix: |
dei_ |
| Data Type: |
dei:fileNumberItemType |
| Balance Type: |
na |
| Period Type: |
duration |
|
| X |
- DefinitionTwo-character EDGAR code representing the state or country of incorporation.
| Name: |
dei_EntityIncorporationStateCountryCode |
| Namespace Prefix: |
dei_ |
| Data Type: |
dei:edgarStateCountryItemType |
| Balance Type: |
na |
| Period Type: |
duration |
|
| X |
- DefinitionThe exact name of the entity filing the report as specified in its charter, which is required by forms filed with the SEC. Reference 1: http://www.xbrl.org/2003/role/presentationRef
-Publisher SEC
-Name Exchange Act
-Number 240
-Section 12
-Subsection b-2
| Name: |
dei_EntityRegistrantName |
| Namespace Prefix: |
dei_ |
| Data Type: |
xbrli:normalizedStringItemType |
| Balance Type: |
na |
| Period Type: |
duration |
|
| X |
- DefinitionThe Tax Identification Number (TIN), also known as an Employer Identification Number (EIN), is a unique 9-digit value assigned by the IRS. Reference 1: http://www.xbrl.org/2003/role/presentationRef
-Publisher SEC
-Name Exchange Act
-Number 240
-Section 12
-Subsection b-2
| Name: |
dei_EntityTaxIdentificationNumber |
| Namespace Prefix: |
dei_ |
| Data Type: |
dei:employerIdItemType |
| Balance Type: |
na |
| Period Type: |
duration |
|
| X |
- DefinitionLocal phone number for entity.
| Name: |
dei_LocalPhoneNumber |
| Namespace Prefix: |
dei_ |
| Data Type: |
xbrli:normalizedStringItemType |
| Balance Type: |
na |
| Period Type: |
duration |
|
| X |
- DefinitionBoolean flag that is true when the Form 8-K filing is intended to satisfy the filing obligation of the registrant as pre-commencement communications pursuant to Rule 13e-4(c) under the Exchange Act. Reference 1: http://www.xbrl.org/2003/role/presentationRef
-Publisher SEC
-Name Exchange Act
-Number 240
-Section 13e
-Subsection 4c
| Name: |
dei_PreCommencementIssuerTenderOffer |
| Namespace Prefix: |
dei_ |
| Data Type: |
xbrli:booleanItemType |
| Balance Type: |
na |
| Period Type: |
duration |
|
| X |
- DefinitionBoolean flag that is true when the Form 8-K filing is intended to satisfy the filing obligation of the registrant as pre-commencement communications pursuant to Rule 14d-2(b) under the Exchange Act. Reference 1: http://www.xbrl.org/2003/role/presentationRef
-Publisher SEC
-Name Exchange Act
-Number 240
-Section 14d
-Subsection 2b
| Name: |
dei_PreCommencementTenderOffer |
| Namespace Prefix: |
dei_ |
| Data Type: |
xbrli:booleanItemType |
| Balance Type: |
na |
| Period Type: |
duration |
|
| X |
- DefinitionTitle of a 12(b) registered security. Reference 1: http://www.xbrl.org/2003/role/presentationRef
-Publisher SEC
-Name Exchange Act
-Number 240
-Section 12
-Subsection b
| Name: |
dei_Security12bTitle |
| Namespace Prefix: |
dei_ |
| Data Type: |
dei:securityTitleItemType |
| Balance Type: |
na |
| Period Type: |
duration |
|
| X |
- DefinitionName of the Exchange on which a security is registered. Reference 1: http://www.xbrl.org/2003/role/presentationRef
-Publisher SEC
-Name Exchange Act
-Number 240
-Section 12
-Subsection d1-1
| Name: |
dei_SecurityExchangeName |
| Namespace Prefix: |
dei_ |
| Data Type: |
dei:edgarExchangeCodeItemType |
| Balance Type: |
na |
| Period Type: |
duration |
|
| X |
- DefinitionBoolean flag that is true when the Form 8-K filing is intended to satisfy the filing obligation of the registrant as soliciting material pursuant to Rule 14a-12 under the Exchange Act. Reference 1: http://www.xbrl.org/2003/role/presentationRef
-Publisher SEC
-Name Exchange Act
-Section 14a
-Number 240
-Subsection 12
| Name: |
dei_SolicitingMaterial |
| Namespace Prefix: |
dei_ |
| Data Type: |
xbrli:booleanItemType |
| Balance Type: |
na |
| Period Type: |
duration |
|
| X |
- DefinitionTrading symbol of an instrument as listed on an exchange.
| Name: |
dei_TradingSymbol |
| Namespace Prefix: |
dei_ |
| Data Type: |
dei:tradingSymbolItemType |
| Balance Type: |
na |
| Period Type: |
duration |
|
| X |
- DefinitionBoolean flag that is true when the Form 8-K filing is intended to satisfy the filing obligation of the registrant as written communications pursuant to Rule 425 under the Securities Act. Reference 1: http://www.xbrl.org/2003/role/presentationRef
-Publisher SEC
-Name Securities Act
-Number 230
-Section 425
| Name: |
dei_WrittenCommunications |
| Namespace Prefix: |
dei_ |
| Data Type: |
xbrli:booleanItemType |
| Balance Type: |
na |
| Period Type: |
duration |
|
Harvard Bioscience (NASDAQ:HBIO)
Historical Stock Chart
From Mar 2024 to Apr 2024

Harvard Bioscience (NASDAQ:HBIO)
Historical Stock Chart
From Apr 2023 to Apr 2024
