false
2022
FY
--12-31
0001448597
0001448597
2022-01-01
2022-12-31
0001448597
2022-06-30
0001448597
2023-03-15
iso4217:USD
xbrli:shares
iso4217:USD
xbrli:shares
UNITED STATES
SECURITIES AND EXCHANGE COMMISSION
Washington, D.C. 20549
FORM 10-K/A
(Amendment No. 1)
x ANNUAL
REPORT PURSUANT TO SECTION 13 OR 15(d) OF THE SECURITIES EXCHANGE ACT OF 1934
For the fiscal year ended December 31, 2022
¨ TRANSITION
REPORT UNDER SECTION 13 OR 15(d) OF THE SECURITIES EXCHANGE ACT OF 1934
Commission File No. 000-54653

AUGUSTA GOLD CORP.
(Exact Name of Registrant as Specified in Its
Charter)
| Nevada | |
41-2252162 |
(State or Other Jurisdiction
Of Incorporation or Organization) | |
(I.R.S. Employer Identification
Number) |
Suite
555 – 999 Canada Place
Vancouver, BC,
Canada | |
V6C
3E1 |
| (Address of Principal Executive Offices) | |
(Zip Code) |
Registrant’s telephone number, including
area code (604) 687-1717
Securities registered pursuant to Section 12(b) of the Act: None
Securities registered pursuant to Section 12(g) of the Act: Common
Stock, $0.0001 par value per share
Indicate
by check mark if the registrant is a well-known seasoned issuer, as defined in Rule 405 of the Securities Act. Yes ¨ No x
Indicate
by check mark if the registrant is not required to file reports pursuant to Section 13 or Section 15(d) of the Act. Yes ¨ No x
Indicate
by check mark whether the registrant (1) has filed all reports required to be filed by Section 13 or 15(d) of the Securities Exchange
Act of 1934 during the preceding 12 months (or for such shorter period that the issuer was required to file such reports), and (2) has
been subject to such filing requirements for the past 90 days. Yes x No ¨
Indicate
by check mark whether the registrant has submitted electronically every Interactive Data File required to be submitted pursuant to Rule
405 of Regulation S-T (§232.405 of this chapter) during the preceding 12 months (or for such shorter period that the registrant
was required to submit such files). Yes x No ¨
Indicate by check mark whether the registrant
is a large accelerated filer, an accelerated filer, a non-accelerated filer, a smaller reporting company, or emerging growth company.
See the definitions of “large accelerated filer,” “accelerated filer,” “smaller reporting company,”
and “emerging growth company” in Rule 12b-2 of the Exchange Act. (Check one):
| Large accelerated filer |
¨ |
|
Accelerated filer |
¨ |
| |
|
|
|
|
| Non-accelerated filer |
x |
|
Smaller reporting company |
x |
| |
|
|
|
|
| |
|
|
Emerging growth company |
¨ |
If
an emerging growth company, indicate by check mark if the registrant has elected not to use the extended transition period for complying
with any new or revised financial accounting standards provided pursuant to Section 13(a) of the Exchange Act. ¨
Indicate
by check mark whether the registrant has filed a report on and attestation to its management’s assessment of the effectiveness of
its internal control over financial reporting under Section 404(b) of the Sarbanes-Oxley Act (15 U.S.C. 7262(b)) by the registered public
accounting firm that prepared or issued its audit report. ¨
If securities are registered pursuant to Section 12(b) of the Act,
indicate by check mark whether the financial statements of the registrant included in the filing reflect the correction of an error to
previously issued financial statements. ¨
Indicate
by check mark whether any of those error corrections are restatements that required a recovery analysis of incentive-based compensation
received by any of the registrant’s executive officers during the relevant recovery period pursuant to §240.10D-1(b). ¨
Indicate
by check mark whether the registrant is a shell company (as defined in 12b-2 of the Exchange Act.) Yes ¨
No x
The aggregate market value of the voting and
non-voting common equity held by non-affiliates computed by reference to the price at which the common stock was last sold as of the
last business day of the registrant’s most recently completed second fiscal quarter was $37,573,924.
Indicate the number of shares outstanding of
each of the issuer’s classes of common stock, as of the latest practicable date: 85,929,753 shares of common stock par value $0.0001,
were outstanding on December 19, 2023.
|
Auditor Firm ID:
731 |
Auditor Name:
DAVIDSON & COMPANY LLP |
Auditor Location:
Vancouver, Canada |
EXPLANATORY NOTE
Augusta Gold Corp. (the
“Company”) hereby files this Amendment No. 1 (the “Amended Report”) to its annual report on Form 10-K
as originally filed with the SEC on March 16, 2023 (the “Original Report”) to update our mineral property disclosures
in the Original Report to align with certain of the technical requirements of subpart 1300 of Regulation S-K (“S-K 1300”).
This Amended Report is being filed to (i) amend “Item 2. Properties”, and (ii) file amended versions of “Exhibit 96.1
S-K 1300 Technical Report, Mineral Resource Estimate, Bullfrog Gold Project, Nye County, Nevada” and “Exhibit 96.2 Mineral
Resource Estimate for the Reward Project, Nye County, Nevada, USA”, in each case, to update only the following disclosure:
| · | Revisions to include cutoff grades for our mineral resource estimates and related disclosure thereto; |
| · | Revisions to opinions of certain qualified persons to conform to respective requirements of S-K 1300;
and |
| · | Revisions to explain with particularity, your reasons for using the selected commodity price, including
the material assumptions underlying this selection |
These updates do not
change the conclusions, economic results, or mineral resources estimates. This Amended Report also contains updated consents of
the authors of the revised technical report summary filed as exhibits hereto.
In addition, pursuant
to Rule 12b-15 under the Securities Exchange Act of 1934, as amended, as a result of this Form 10-K/A, the Company is refiling
the certifications of the Company’s Chief Executive Officer and Chief Financial Officer, required pursuant to Section 302 of
the Sarbanes-Oxley Act of 2002, as exhibits 31.1 and 31.2 to this Form 10-K/A.
Outside of changes to
the items and exhibit as noted above, the updated consents of the authors of the technical reports, and the certifications of the Chief
Executive Officer and Chief Financial Officer, this Amended Report does not otherwise amend, supplement, update or revise any portion
of the Original Report which remains unchanged since the date of its filing. Furthermore, this Amended Report does not change any previously
reported financial results, nor does it reflect events occurring after the date of the Original Report. Information not affected by this
Form 10-K/A remains unchanged and reflects the disclosures made at the time the Original Report was filed. Accordingly, this Form 10-K/A
should be read in conjunction with the Original Report and the Company’s other filings with the SEC subsequent to the filing of
the Original Report.
CAUTIONARY NOTE TO INVESTORS REGARDING ESTIMATES
OF MEASURED, INDICATED AND INFERRED RESOURCES AND PROVEN AND PROBABLE MINERAL RESERVES
We are subject to the reporting requirements of
the Securities Exchange Act of 1934, as amended (the “Exchange Act”) and applicable Canadian securities laws, and as
a result we report our mineral reserves and mineral resources according to two different standards. U.S. reporting requirements are governed
by subpart 1300 of Regulation S-K under the Exchange Act (“S-K 1300”). Canadian reporting requirements for disclosure
of mineral properties are governed by NI 43-101. Both sets of reporting standards have similar goals in terms of conveying an appropriate
level of confidence in the disclosures being reported, but the standards embody slightly different approaches and definitions.
In our public filings in the U.S. and Canada and
in certain other announcements not filed with the SEC, we disclose proven and probable reserves and measured, indicated and inferred resources,
each as defined in S-K 1300 and NI 43-101. As currently reported, there are no material differences in our disclosed measured, indicated
and inferred resource under each of S-K 1300 and NI 43-101. The estimation of measured resources and indicated resources involve greater
uncertainty as to their existence and economic feasibility than the estimation of proven and probable reserves, and therefore investors
are cautioned not to assume that all or any part of measured or indicated resources will ever be converted into S-K 1300-compliant or
NI 43-101-compliant reserves. The estimation of inferred resources involves far greater uncertainty as to their existence and economic
viability than the estimation of other categories of resources, and therefore it cannot be assumed that all or any part of inferred resources
will ever be upgraded to a higher category. Therefore, investors are cautioned not to assume that all or any part of inferred resources
exist, or that they can be mined legally or economically.
CAUTIONARY STATEMENT REGARDING FORWARD-LOOKING
STATEMENTS
This Annual Report on Form 10-K/A and the
exhibits attached hereto contain “forward-looking statements” within the meaning of the United States Private Securities Litigation
Reform Act of 1995, as amended, and “forward-looking information” within the meaning of applicable Canadian securities legislation,
collectively “forward-looking statements”. Such forward-looking statements concern our anticipated results and developments
in the operations of the Company in future periods, planned exploration activities, the adequacy of the Company’s financial resources
and other events or conditions that may occur in the future. Forward-looking statements are frequently, but not always, identified by
words such as “expects,” “anticipates,” “believes,” “intends,” “estimates,”
“potential,” “possible” and similar expressions, or statements that events, conditions or results “will,”
“may,” “could” or “should” (or the negative and grammatical variations of any of these terms) occur
or be achieved. These forward looking statements may include, but are not limited to, statements concerning:
| · | the Company’s strategies and objectives, both generally and in respect of the Bullfrog Gold Project
and Reward Gold Project; |
| · | the recommendations of the Technical Reports for the Bullfrog Gold Project and Reward Gold Project; |
| · | the Company’s decisions regarding the timing and costs of exploration programs with respect to,
and the issuance of the necessary permits and authorizations required for, the Company’s exploration programs at the Bullfrog Gold
Project and Reward Gold Project; |
| · | the Company’s estimates of the quality and quantity of the mineralized materials at its mineral
properties; |
| · | the potential discovery and delineation of mineral deposits/reserves and any expansion thereof beyond
the current estimate; |
| · | the Company’s expectation that it will become a gold producer; |
| · | the Company’s estimates of future operating and financial performance; |
| · | the Company’s potential funding requirements and sources of capital, including near-term sources
of additional cash and long-term financing through the sale of equity and/or debt financings and through the exercise of stock options
and warrants; |
| · | the Company’s expectation that the Company will continue to raise capital; |
| · | the Company’s expectation that the Company will continue to incur losses and will not pay dividends
for the foreseeable future; |
| · | the Company’s estimates of its future cash position; |
| · | the Company’s anticipated general business and economic conditions; |
| · | the Company’s ability to meet its financial obligations as they come due, and to be able to raise
the necessary funds to continue operations; and |
| · | that the Company will operate at a loss for the foreseeable future. |
Such forward-looking statements reflect the Company’s
current views with respect to future events and are subject to certain known and unknown risks, uncertainties and assumptions. Many factors
could cause actual results, performance or achievements to be materially different from any future results, performance or achievements
that may be expressed or implied by such forward-looking statements, including, among others, risks related to:
| · | our limited operating history; |
| · | increased costs affecting our financial condition; |
| · | the Bullfrog Gold Project and Reward Gold Project being in the exploration stage; |
| · | whether the Bullfrog Gold Project and Reward Gold Project are feasible; |
| · | the Bullfrog Gold Project and Reward Gold Project requiring substantial capital investment; |
| · | our inability to obtain required permits; |
| · | our status as a junior mining company; |
| · | difficulties in managing growth; |
| · | our potential loss of key persons; |
| · | risks related to the evolving novel coronavirus (“COVID-19”) pandemic and health crisis and
the governmental and regulatory actions taken in response thereto; |
| · | the risks of mineral exploration; |
| · | evaluation uncertainty in estimating mineralized material; |
| · | changes in estimates of mineralized material; |
| · | our exploration projects not succeeding; |
| · | price volatility of gold and silver; |
| · | environmental regulations; |
| · | challenges to title to our properties; |
| · | amendments to mining law; |
| · | inability to maintain infrastructure to conduct exploration activities; |
| · | new regulation related to climate change; |
| · | relationships with communities in which we operate; |
| · | newly adopted mining disclosure regulations; |
| · | evolving corporate standards; |
| · | Canadian reporting requirements; and |
| · | The price of the shares of common stock being volatile. |
Should one or more of these risks or uncertainties
materialize, or should underlying assumptions prove incorrect, actual results may vary materially from those described herein. This list
of factors that may affect any of the Company’s forward-looking statements is not exhaustive. Forward-looking statements are statements
about the future and are inherently uncertain, and actual achievements of the Company or other future events or conditions may differ
materially from those reflected in the forward-looking statements due to a variety of risks, uncertainties and other factors, including
without limitation those discussed in “Part I, Item 1A, Risk Factors”, of our Annual Report on Form 10-K as
filed with the SEC on March 16, 2023, as well as other factors described elsewhere in that Annual Report, this report and the Company’s
other reports filed with the SEC.
The Company’s forward-looking statements
contained in this Annual Report on Form 10-K/A are based on the beliefs, expectations and opinions of management as of the date of
this Annual Report. The Company does not assume any obligation to update forward-looking statements if circumstances or management’s
beliefs, expectations or opinions should change, except as required by law. For the reasons set forth above, investors should not attribute
undue certainty to or place undue reliance on forward-looking statements.
GLOSSARY OF SELECTED MINING TERMS
| Ag |
Silver |
| |
|
| Au |
Gold |
| |
|
| Breccia |
Broken sedimentary and volcanic rock fragments cemented by a fine-grained matrix |
| |
|
| Clastic Rock |
Fragments, or clasts, of pre-existing minerals |
| |
|
| Cutoff Grade |
The grade (i.e., the concentration of metal or mineral in rock) that determines the destination of the material during mining. For purposes of establishing “prospects of economic extraction,” the cut-off grade is the grade that distinguishes material deemed to have no economic value (it will not be mined in underground mining or if mined in surface mining, its destination will be the waste dump) from material deemed to have economic value (its ultimate destination during mining will be a processing facility). Other terms used in similar fashion as cut-off grade include net smelter return, pay limit, and break-even stripping ratio. |
| |
|
| Deposit |
A mineralized body which has been physically delineated by sufficient drilling, trenching, and/or underground work, and found to contain a sufficient average grade of metal or metals to warrant further exploration and/or development expenditures. Such a deposit does not qualify as a commercially mineable ore body or as containing reserves or ore, unless final legal, technical and economic factors are resolved |
| |
|
| Detachment Fault |
A regionally extensive, gently dipping normal fault that is commonly associated with extension in large blocks of the earth’s crust |
| |
|
| g/t |
Grams per metric tonne |
| |
|
| Metamorphic Rock |
Rock that has transformed to another rock form after intense heat and pressure |
| |
|
| Miocene |
A geologic era that extended from 5 million to 23 million years ago |
| |
|
| Mineralization |
The concentration of metals and their chemical compounds within a body of rock |
| |
|
| Net Smelter Royalty |
A percentage payable to an owner or lessee from the production or net proceeds received by the operator from a smelter or refinery, less transportation, insurance, smelting and refining costs and penalties as set out in a royalty agreement. |
| |
|
| Paleozoic |
A geologic era extending from 230 million to 540 million years ago |
| |
|
| Photogrammetry |
The science of making measurements from photographs; the output is typically a map or a drawing |
| |
|
| Proterozoic |
A geologic era extending from 540 million years to 2,500 million years ago. |
| |
|
| Reverse Circulation (RC) |
A drilling method whereby drill cuttings are returned to the surface through the annulus between inner and outer drill rods, thereby minimizing contamination from wall rock. |
| |
|
| Rhyolite |
An igneous, volcanic extrusive rock containing more than 65% silica. |
| |
|
| Schist |
A group metamorphic rocks that contain more than 50% platy and elongated minerals such as mica. |
| |
|
| Siliciclastic Rock |
Non-carbonate sedimentary rocks that are almost exclusively silicas-bearing, either as quartz or silicate minerals. |
| |
|
| Tertiary |
A geologic era from 2.6 million to 65 million years ago. |
S-K 1300 Definitions
| Exploration Stage Issuer |
An “exploration stage issuer” is an issuer that has no material property with mineral reserves disclosed. |
| |
|
| Exploration Stage Property |
An “exploration stage property” is a property that has no mineral reserves disclosed. |
| |
|
| Development Stage Issuer |
A “development stage issuer” is an issuer that is engaged in the preparation of mineral reserves for extraction on at least one material property. |
| |
|
| Development Stage Property |
A “development stage property” is a property that has mineral reserves disclosed, pursuant to this subpart, but no material extraction. |
| |
|
| Indicated Mineral Resource |
An “indicated mineral resource” is that part of a mineral resource for which quantity and grade or quality are estimated on the basis of adequate geological evidence and sampling. The level of geological certainty associated with an indicated mineral resource is sufficient to allow a qualified person to apply modifying factors in sufficient detail to support mine planning and evaluation of the economic viability of the deposit. Because an indicated mineral resource has a lower level of confidence than the level of confidence of a measured mineral resource, an indicated mineral resource may only be converted to a probable mineral reserve |
| |
|
| Inferred Mineral Resource |
An “inferred mineral resource” is that part of a mineral resource for which quantity and grade or quality are estimated on the basis of limited geological evidence and sampling. The level of geological uncertainty associated with an inferred mineral resource is too high to apply relevant technical and economic factors likely to influence the prospects of economic extraction in a manner useful for evaluation of economic viability. Because an inferred mineral resource has the lowest level of geological confidence of all mineral resources, which prevents the application of the modifying factors in a manner useful for evaluation of economic viability, an inferred mineral resource may not be considered when assessing the economic viability of a mining project, and may not be converted to a mineral reserve. |
| |
|
| Measured Mineral Resource |
A “measured mineral resource” is that part of a mineral resource for which quantity and grade or quality are estimated on the basis of conclusive geological evidence and sampling. The level of geological certainty associated with a measured mineral resource is sufficient to allow a qualified person to apply modifying factors, as defined in this section, in sufficient detail to support detailed mine planning and final evaluation of the economic viability of the deposit. Because a measured mineral resource has a higher level of confidence than the level of confidence of either an indicated mineral resource or an inferred mineral resource, a measured mineral resource may be converted to a proven mineral reserve or to a probable mineral reserve. |
| |
|
| Mineral Reserve |
A “mineral reserve” is an estimate of tonnage and grade or quality of indicated and measured mineral resources that, in the opinion of the qualified person, can be the basis of an economically viable project. More specifically, it is the economically mineable part of a measured or indicated mineral resource, which includes diluting materials and allowances for losses that may occur when the material is mined or extracted |
| |
|
| Mineral Resource |
A “mineral resource” is a concentration or occurrence of material of economic interest in or on the Earth's crust in such form, grade or quality, and quantity that there are reasonable prospects for economic extraction. A mineral resource is a reasonable estimate of mineralization, taking into account relevant factors such as cut-off grade, likely mining dimensions, location or continuity, that, with the assumed and justifiable technical and economic conditions, is likely to, in whole or in part, become economically extractable. It is not merely an inventory of all mineralization drilled or sampled. |
| Modifying Factors |
Modifying factors are the factors that a qualified person must apply to indicated and measured mineral resources and then evaluate in order to establish the economic viability of mineral reserves. A qualified person must apply and evaluate modifying factors to convert measured and indicated mineral resources to proven and probable mineral reserves. These factors include, but are not restricted to: Mining; processing; metallurgical; infrastructure; economic; marketing; legal; environmental compliance; plans, negotiations, or agreements with local individuals or groups; and governmental factors. The number, type and specific characteristics of the modifying factors applied will necessarily be a function of and depend upon the mineral, mine, property, or project. |
| |
|
| Probable Reserve |
A “probable mineral reserve” is the economically mineable part of an indicated and, in some cases, a measured mineral resource. |
| |
|
| Production Stage Issuer |
A “production stage issuer” is an issuer that is engaged in material extraction of mineral reserves on at least one material property. |
| |
|
| Production Stage Property |
A “production stage property” is a property with material extraction of mineral reserves. |
| |
|
| Proven Reserve |
A “proven mineral reserve” is the economically mineable part of a measured mineral resource and can only result from conversion of a measured mineral resource. |
USE OF NAMES
In this Annual Report on Form 10-K/A, unless
the context otherwise requires, the terms "we", "us", "our", "Augusta Gold", "Augusta Gold
Corp." or the "Company" refer to Augusta Gold Corp., a Delaware corporation, and its subsidiaries.
CURRENCY
References to CDN or C$ refer to Canadian currency
and USD or $ to United States currency.
METRIC CONVERSION TABLE
| To Convert Metric Measurement Units |
|
To Imperial Measurement Units |
|
Multiply by |
| Hectares |
|
Acres |
|
2.4710 |
| Meters |
|
Feet |
|
3.2808 |
| Kilometers |
|
Miles |
|
0.6214 |
| Tonnes |
|
Tons (short) |
|
1.1023 |
| Liters |
|
Gallons |
|
0.2642 |
| Grams |
|
Ounces (troy) |
|
0.0322 |
| Grams per tonne |
|
Ounces (troy) per ton (short) |
|
0.0292 |
PART I
ITEM 2. PROPERTIES
Technical Report Summaries
The technical report
for the Bullfrog Gold Project is the technical report summary, prepared pursuant to S-K 1300, entitled “S-K 1300 Technical Report,
Mineral Resource Estimate, Bullfrog Gold Project, Nye County, Nevada” with an effective date of December 31, 2021, and an issue
date of March 16, 2022 (the “Bullfrog Technical Report”).
The Bullfrog Technical
Report was prepared by Forte Dynamics, Inc. under the supervision of Russ Downer, P. Eng. and Adam House, MMSA QP, each of whom is
a qualified person under S-K 1300 and NI 43-101.
The description of the
Bullfrog Gold Project contained herein is based upon the Bullfrog Technical Report.
The technical report
for the Reward Gold Project is the technical report summary, prepared pursuant to S-K 1300, entitled “Mineral Resource Estimate
for the Reward Project, Nye County, Nevada” with an effective date of May 31, 2022, and an issue date of June 29, 2022
(the “Reward Technical Report”).
The Reward Technical
Report was prepared by Michael Dufresne, M.Sc., P. Geol., P.Geo, and Timothy D. Scott, SME, each of whom is a qualified person under S-K
1300 and NI 43-101.
The description of the
Reward Gold Project contained herein is based upon the Reward Technical Report.
Summary of Mineral Properties
Augusta Gold currently
has interests in four gold exploration properties located in the state of Nevada, including the Bullfrog Gold Project and the Reward Gold
Project. Each of the properties are exploration stage properties with measured, indicated and inferred resources but no known mineral
reserves and our primary operations are exploring these properties to move them towards a development decision.
Ownership Interests
|
· |
At our Bullfrog Project, we have four option/lease/purchase agreements in place and, with the additional claims it has located, give it control of 734 unpatented lode mining claims and mill site claims, and 87 patented mining claims. The claims do not have an expiration date, as long as the fees and obligations are maintained. For additional details see “Bullfrog Gold Project, Nye County Nevada – Property Holdings” below. |
|
· |
At our Reward Project, the project encompasses 123 unpatented Bureau of Land Management (BLM) placer and lode mining claims and six patented placer mining claims, totalling approximately 2,333 net acres (944 hectares). Only the patented claims have been legally surveyed. Under United States mining law, claims may be renewed annually for an unlimited number of years upon a small payment per claim (currently $155 per claim due to the BLM and an aggregate $1,502 due to Nye County) and the same claim status-whether lode or placer-may be used for exploration or exploitation of the lodes or placers. |
Several blocks of unpatented claims are leased
by CR Reward from underlying owners, and are referred to as Connolly, Webster, Orser-McFall and Van Meeteren leases.
In total our options
and leases cover 15,998 net acres in the aggregate, consisting of a mix of 93 patented mining claims, 857 unpatented mining claims
either leased with option to purchase, or joint ventured, and private property leases.
Summary Mineral Resources
Summary Mineral Resources
at End of Fiscal Year Ended December 31, 2022
| | |
Measured mineral
resources (koz) | | |
Indicated mineral
resources (koz) | | |
Measured and indicated
mineral resources (koz) | | |
Inferred mineral
resources (koz) | |
| Gold | |
| | | |
| | | |
| | | |
| | |
| United States (Nevada) | |
| | | |
| | | |
| | | |
| | |
| Bullfrog Project | |
| 526.7 | | |
| 682.6 | | |
| 1,209.3 | | |
| 257.9 | |
| Reward Project | |
| 169.9 | | |
| 256.8 | | |
| 426.7 | | |
| 27.1 | |
| Total Gold | |
| 696.6 | | |
| 939.4 | | |
| 1636.0 | | |
| 285.0 | |
| | |
| | | |
| | | |
| | | |
| | |
| Silver | |
| | | |
| | | |
| | | |
| | |
| United States (Nevada) | |
| | | |
| | | |
| | | |
| | |
| Bullfrog Project | |
| 1309.1 | | |
| 1557.5 | | |
| 2866.6 | | |
| 515.7 | |
| Total Silver | |
| 1309.1 | | |
| 1557.5 | | |
| 2866.6 | | |
| 515.7 | |
Notes:
| · | Bullfrog oxide estimated Mineral Resources are reported within a pit shell using the Lerch Grossman algorithm, a gold price of US$1,550/oz
and a recovery of 82% for Au and silver price of US$20/oz and a recovery of 20% For Ag. |
| · | Bullfrog sulphide estimated Mineral Resources are reported within a pit shell using the Lerch Grossman algorithm, a gold price of
US$1,550/oz and a recovery of 50% for Au and silver price of US$20/oz and a recovery of 12% for Ag. |
| · | Gold price and Silver price used in the Bullfrog estimated Mineral Resources were based on a review of commodity prices and compared
to a three-year trailing average at the time of the estimates with a good correlation. |
| · | Reward oxide estimated Mineral Resources are reported within a pit shell using the Lerch Grossman algorithm, a gold price of US$1,700/oz
and a recovery of 80% for Au were utilized. |
| · | Gold price used in the Reward estimated Mineral Resources were based on a review of commodity prices at the time of the estimate and
assumed a price of US$1,700 per oz of gold based upon a 3 year trailing average. |
| · | Bullfrog oxide Mineral Resources are reported using a breakeven cutoff grade of 0.192 g/tonne and sulphide Mineral Resources are reported
using a breakeven cutoff grade of 0.315 g/tonne. |
| · | Reward Mineral Resources are reported using a 0.2 g/tonne incremental cut-off grade. |
| · | Bullfrog mining costs for mineralized material and waste are US$2.25/tonne. |
| · | Reward mining costs for mineralized material and waste are US$2.20/tonne |
| · | Bullfrog processing, general and administration, and refining costs are US$5.00/tonne, US$0.50/tonne, and US$0.05/tonne respectively. |
| · | Reward processing and general and administration are US$6.06/tonne and US$0.83/tonne per tonne processed, respectively |
| · | Bullfrog Estimated Mineral Resources are stated as in situ dry metric tonnes. |
| · | The estimate of Mineral Resources may be materially affected by legal, title, taxation, socio-political, marketing, or other relevant
issues |
Bullfrog Gold Project, Nye County, Nevada
Summary Disclosure
We hold the Bullfrog
Project through our wholly-owned subsidiaries Bullfrog Mines, Rocky Mountain Minerals Corp., a Nevada corporation (“RMMC”)
and Standard Gold Corp., a Nevada corporation (“SGC”).
Property Location
and Access
The Bullfrog Gold Project
is located in the Bullfrog Hills of Nye County, Nevada and in the southern half of the Bullfrog Mining District (Figure 1). Project properties
are located in Sections 3, 4, 5, 6, 8, 9, 10, 14, 15, 16, 17, 21, 22, 23, 25, 26, 35 and 36 of T11S, R46E and Sections 1, 2, 3, 4, 5,
6, 8 9, 10, 11, 12, 13, 14, 15, 16, 17, and 23 of T12S, R46E, Mt. Diablo Meridian.
The Bullfrog Gold Project
is accessible via a 2½ hour (120 mile) drive north of Las Vegas, Nevada on US Highway 95. Las Vegas, the largest city in Nevada,
is serviced by a major international airport, and has ample equipment, supplies and services to support many of the project’s needs.
The project is 4 miles west of the Town of Beatty, Nevada via a paved highway. Beatty has a population of approximately 1,000 and can
provide basic housing, services, and supplies. Access around the project is by a series of reasonably good gravel roads that extend to
the open pit mines and most of the significant exploration areas.

Figure 1: Location
Map
Project Stage
The Bullfrog Gold Project
is an exploration stage property with measured, indicated and inferred mineral resources but no known mineral reserves.
Mineral Resources
Estimates
Mineral resources utilize
all new drilling through the end of 2021 in addition to updated geologic models and database improvements by the Company’s staff.
Three-dimensional block models for each area (Bullfrog, Montgomery-Shoshone and Bonanza) were created using Vulcan software. Surfaces
and solids representing topography, overburden, geologic units, historic stope shapes and gold mineralization were incorporated into the
resource models. Resource estimates utilize drill hole, survey, analytical and bulk density information provided by the project personnel.
Gold and silver values have been given null values for all material that has been historically mined by both open pit and underground
methods. Bulk density has been adjusted for backfill material placed in the historical open pit and underground operations.
Mineral resources are
pit constrained using reasonable cost assumptions, however detailed costing and economic evaluations have not been performed. The resources
only consider mining mineralization and waste that will take place on lands controlled by the Company. Pit slope parameters are based
on the existing pit wall angles and vary by geology, depth and lateral extent. Different metallurgical recoveries were assigned to oxide
and sulphide material and used in the calculation of the optimized pit shells.
Mineral resources are
reported inside optimized pit shells with Minemax software using high-level economic assumptions, geotechnical pit slope parameters and
property boundaries. Estimated mineral resources for the Bullfrog Project are being reported for the Bullfrog, Montgomery-Shoshone and
Bonanza areas, respectively.
The following table presents
the combined global gold and silver mineral resources for the three areas, Bullfrog, Montgomery-Shoshone and Bonanza, at the Bullfrog
Gold Project.
Bullfrog Gold Project
- Summary of Gold and Silver Mineral Resources at the End of the Fiscal Year Ended December 31, 2022 Based on $1,550/oz. Gold and
$20/oz. Silver
| Combined Global Resources - Oxide and Sulphide |
| Classification | |
Tonnes (Mt) | | |
Au grade (g/t) | | |
Ag grade (g/t) | | |
Au Contained (koz) | | |
Ag Contained (koz) | |
| Measured | |
| 30.13 | | |
| 0.544 | | |
| 1.35 | | |
| 526.68 | | |
| 1,309.13 | |
| Indicated | |
| 40.88 | | |
| 0.519 | | |
| 1.18 | | |
| 682.61 | | |
| 1,557.49 | |
| Measured and Indicated | |
| 71.01 | | |
| 0.530 | | |
| 1.26 | | |
| 1,209.29 | | |
| 2,866.62 | |
| Inferred | |
| 16.69 | | |
| 0.481 | | |
| 0.96 | | |
| 257.90 | | |
| 515.72 | |
Notes:
| 1. |
Oxide estimated Mineral Resources are reported within a pit shell using the Lerch Grossman algorithm, a gold price of US$1,550/oz and a recovery of 82% for Au and silver price of US$20/oz and a recovery of 20% For Ag. |
| 2. |
Sulphide estimated Mineral Resources are reported within a pit shell using the Lerch Grossman algorithm, a gold price of US$1,550/oz and a recovery of 50% for Au and silver price of US$20/oz and a recovery of 12% for Ag. No sulphide material was reported for Montgomery-Shoshone or Bonanza. |
| 3. |
Gold price and Silver price used in the Bullfrog estimated Mineral Resources were based on a review of commodity prices and compared to a three-year trailing average at the time of the estimate with good correlation. |
| 4. |
Bullfrog oxide Mineral Resources are reported using a breakeven cutoff grade of 0.192 g/tonne and sulphide Mineral Resources are reported using a breakeven cutoff grade of 0.315 g/tonne.. |
| 5. |
Mining costs for mineralized material and waste are US$2.25/tonne. |
| 6. |
Processing, general and administration, and refining costs are US$5.00/tonne, US$0.50/tonne, and US$0.05/tonne respectively. |
| 7. |
Due to rounding, some columns or rows may not compute as shown. |
| 8. |
Estimated Mineral Resources are stated as in situ dry metric tonnes. |
| 9. |
The estimate of Mineral Resources may be materially affected by legal, title, taxation, socio-political, marketing, or other relevant issues. |
The following tables
present the gold and silver mineral resources for each of the three project areas, Bullfrog, Montgomery-Shoshone and Bonanza.
Bullfrog Gold Project
- Bullfrog Area, Gold and Silver Mineral Resources at the End of the Fiscal Year Ended December 31, 2022 Based on $1,550/oz. Gold
and $20/oz. Silver
| Mineral Resources - Bullfrog |
| Redox | |
Classification | |
Tonnes
(Mt) | | |
Au grade
(g/t) | | |
Ag grade
(g/t) | | |
Au Contained
(koz) | | |
Ag Contained
(koz) | |
| | |
Measured | |
| 24.50 | | |
| 0.537 | | |
| 1.28 | | |
| 422.77 | | |
| 1,010.02 | |
| | |
Indicated | |
| 36.32 | | |
| 0.515 | | |
| 1.14 | | |
| 602.02 | | |
| 1,332.18 | |
| Oxide | |
Measured and Indicated | |
| 60.82 | | |
| 0.524 | | |
| 1.20 | | |
| 1,024.79 | | |
| 2,342.20 | |
| | |
Inferred | |
| 14.40 | | |
| 0.460 | | |
| 0.77 | | |
| 213.06 | | |
| 358.49 | |
| | |
| |
| | | |
| | | |
| | | |
| | | |
| | |
| | |
Measured | |
| 1.30 | | |
| 0.710 | | |
| 1.28 | | |
| 29.77 | | |
| 53.52 | |
| | |
Indicated | |
| 1.99 | | |
| 0.625 | | |
| 1.32 | | |
| 39.94 | | |
| 84.47 | |
| Sulphide | |
Measured and Indicated | |
| 3.29 | | |
| 0.659 | | |
| 1.30 | | |
| 69.72 | | |
| 137.99 | |
| | |
Inferred | |
| 1.05 | | |
| 0.657 | | |
| 1.14 | | |
| 22.14 | | |
| 38.53 | |
| | |
| |
| | | |
| | | |
| | | |
| | | |
| | |
| | |
Measured | |
| 25.80 | | |
| 0.545 | | |
| 1.28 | | |
| 452.55 | | |
| 1,063.54 | |
| | |
Indicated | |
| 38.31 | | |
| 0.521 | | |
| 1.15 | | |
| 641.96 | | |
| 1,416.65 | |
| Total - Oxide and Sulphide | |
Measured and Indicated | |
| 64.12 | | |
| 0.531 | | |
| 1.20 | | |
| 1,094.51 | | |
| 2,480.19 | |
| | |
Inferred | |
| 15.44 | | |
| 0.474 | | |
| 0.80 | | |
| 235.20 | | |
| 397.02 | |
Notes:
| 1. |
Oxide estimated Mineral Resources are reported within a pit shell using the Lerch Grossman algorithm, a gold price of US$1,550/oz and a recovery of 82% for Au and silver price of US$20/oz and a recovery of 20% For Ag. |
| 2. |
Sulphide estimated Mineral Resources are reported within a pit shell using the Lerch Grossman algorithm, a gold price of US$1,550/oz and a recovery of 50% for Au and silver price of US$20/oz and a recovery of 12% for Ag. |
| 3. |
Gold price and Silver price used in the Bullfrog estimated Mineral Resources were based on a review of commodity prices and compared to a three-year trailing average at the time of the estimate with good correlation. |
| 4. |
Bullfrog oxide Mineral Resources are reported using a breakeven cutoff grade of 0.192 g/tonne and sulphide Mineral Resources are reported using a breakeven cutoff grade of 0.315 g/tonne. |
| 5. |
Mining costs for mineralized material and waste are US$2.25/tonne. |
| 6. |
Processing, general and administration, and refining costs are US$5.00/tonne, US$0.50/tonne, and US$0.05/tonne respectively. |
| 7. |
Due to rounding, some columns or rows may not compute as shown. |
| 8. |
Estimated Mineral Resources are stated as in situ dry metric tonnes. |
| 9. |
The estimate of Mineral Resources may be materially affected by legal, title, taxation, socio-political, marketing, or other relevant issues. |
Bullfrog Gold Project
- Montgomery-Shoshone Area, Gold and Silver Mineral Resources at the End of the Fiscal Year Ended December 31, 2022 Based on $1,550/oz.
Gold and $20/oz. Silver
| Mineral Resources - Montgomery-Shoshone |
| Redox | |
Classification | |
Tonnes (Mt) | | |
Au grade (g/t) | | |
Ag grade (g/t) | | |
Au Contained (koz) | | |
Ag Contained (koz) | |
| | |
Measured | |
| 1.97 | | |
| 0.637 | | |
| 3.35 | | |
| 40.35 | | |
| 212.12 | |
| | |
Indicated | |
| 1.35 | | |
| 0.555 | | |
| 2.85 | | |
| 24.04 | | |
| 123.66 | |
| Oxide | |
Measured and Indicated | |
| 3.32 | | |
| 0.603 | | |
| 3.15 | | |
| 64.38 | | |
| 335.78 | |
| | |
Inferred | |
| 1.05 | | |
| 0.586 | | |
| 3.45 | | |
| 19.76 | | |
| 116.41 | |
Notes:
| 1. |
Oxide estimated Mineral Resources are reported within a pit shell using the Lerch Grossman algorithm, a gold price of US$1,550/oz and a recovery of 82% for Au and silver price of US$20/oz and a recovery of 20% For Ag. |
| 2. |
Sulphide estimated Mineral Resources are reported within a pit shell using the Lerch Grossman algorithm, a gold price of US$1,550/oz and a recovery of 50% for Au and silver price of US$20/oz and a recovery of 12% for Ag. No sulphide material was reported for Montgomery-Shoshone. |
| 3. |
Gold price and Silver price used in the Bullfrog estimated Mineral Resources were based on a review of commodity prices and compared to a three-year trailing average at the time of the estimate with good correlation. |
| 4. |
Bullfrog oxide Mineral Resources are reported using a breakeven cutoff grade of 0.192 g/tonne and sulphide Mineral Resources are reported using a breakeven cutoff grade of 0.315 g/tonne. |
| 5. |
Mining costs for mineralized material and waste are US$2.25/tonne. |
| 6. |
Processing, general and administration, and refining costs are US$5.00/tonne, US$0.50/tonne, and US$0.05/tonne respectively. |
| 7. |
Due to rounding, some columns or rows may not compute as shown. |
| 8 |
Estimated Mineral Resources are stated as in situ dry metric tonnes. |
| 9. |
The estimate of Mineral Resources may be materially affected by legal, title, taxation, socio-political, marketing, or other relevant issues. |
Bullfrog Gold Project
- Bonanza Area, Gold and Silver Mineral Resources at the End of the Fiscal Year Ended December 31, 2022 Based on $1,550/oz. Gold
and $20/oz. Silver
| Mineral Resources - Bonanza |
| Redox | |
Classification | |
Tonnes (Mt) | | |
Au grade (g/t) | | |
Ag grade (g/t) | | |
Au Contained (koz) | | |
Ag Contained (koz) | |
| | |
Measured | |
| 2.35 | | |
| 0.446 | | |
| 0.44 | | |
| 33.78 | | |
| 33.48 | |
| | |
Indicated | |
| 1.22 | | |
| 0.422 | | |
| 0.44 | | |
| 16.61 | | |
| 17.17 | |
| Oxide | |
Measured and Indicated | |
| 3.58 | | |
| 0.438 | | |
| 0.44 | | |
| 50.40 | | |
| 50.65 | |
| | |
Inferred | |
| 0.19 | | |
| 0.473 | | |
| 0.37 | | |
| 2.94 | | |
| 2.28 | |
Notes:
| 1. |
Oxide estimated Mineral Resources are reported within a pit shell using the Lerch Grossman algorithm, a gold price of US$1,550/oz and a recovery of 82% for Au and silver price of US$20/oz and a recovery of 20% For Ag. |
| 2. |
Sulphide estimated Mineral Resources are reported within a pit shell using the Lerch Grossman algorithm, a gold price of US$1,550/oz and a recovery of 50% for Au and silver price of US$20/oz and a recovery of 12% for Ag. No sulphide material was reported for Bonanza. |
| 3. |
Gold price and Silver price used in the Bullfrog estimated Mineral Resources were based on a review of commodity prices and compared to a three-year trailing average at the time of the estimate with good correlation. |
| 4. |
Bullfrog oxide Mineral Resources are reported using a breakeven cutoff grade of 0.192 g/tonne and sulphide Mineral Resources are reported using a breakeven cutoff grade of 0.315 g/tonne. |
| 5. |
Mining costs for mineralized material and waste are US$2.25/tonne. |
| 6. |
Processing, general and administration, and refining costs are US$5.00/tonne, US$0.50/tonne, and US$0.05/tonne respectively. |
| 7. |
Due to rounding, some columns or rows may not compute as shown. |
| 8. |
Estimated Mineral Resources are stated as in situ dry metric tonnes. |
| 9. |
The estimate of Mineral Resources may be materially affected by legal, title, taxation, socio-political, marketing, or other relevant issues |
In each case above, Estimated
Mineral Resources have not changed from December 31, 2021 to December 31, 2022 due to the fact that Bullfrog Gold Project is
in the exploration stage and no new resources were added to the project through exploration activities in 2022. The material assumptions
underlying mineral resources as previously disclosed at December 31, 2021 remain current in all material respects.
Property Holdings
We have four option/lease/purchase
agreements in place and, with the additional claims it has located, give it control of 734 unpatented lode mining claims and mill site
claims, and 87 patented mining claims. The claims do not have an expiration date, as long as the fees and obligations are maintained.
NPX Assignment of
Lands
In September 2011,
we issued 14.4 million shares of the Company to the shareholders of SGC to acquire 100% of SGC and its assets. SGC is a private Nevada
corporation and now wholly owned by the Company. Concurrently, NPX Metals, Inc. (“NPX”) and Bull Frog Holding, Inc.
(“BHI”) assigned all title and interests in 79 claims and two patents to SGC. The Company granted a production royalty of
3% NSR on the property to NPX and BHI, plus an aggregate 3% NSR cap on any acquired lands within one mile of the 2011 boundary. Thus,
NPX and BHI would not receive any royalty on acquisitions having a 3% or greater NSR.
Mojave Gold Option
In March 2014, we
formed RMMC, a private Nevada corporation, as a wholly owned subsidiary, specifically for holding and acquiring assets. On October 29,
2014, RMMC exercised an option to purchase from Mojave Gold Mining Co. 12 patents west and adjacent to our initial property holdings and
that cover the NE half of the M-S pit. Mojave was paid 750,000 shares of our common stock plus $16,000. RMMC agreed to make annual payments
totaling $180,000 over nine years to fully exercise the option, and expend as a minimum work commitment for the benefit of the Property
$100,000 per year and a total of $500,000 over five years on the properties and surrounding lands within one-half mile of the 12 Mojave
patents. Alternatively, RMMC can pay cash to Mojave at 50% of the difference between the minimum required and the actual expenditures.
Mojave retained a sliding scale Net Smelter Return royalty ranging from 1% for gold prices below $1,200/ounce and up to 4% for gold prices
above $3,200 per ounce.
Lunar Landing Lease
On July 1, 2017,
RMMC entered a lease with Lunar Landing LLC on 24 patents in the Bullfrog District:
| |
· |
Two patents are adjacent and west of the M-S pit that could allow potential expansion of the pit down dip of the Polaris vein and stock work system. |
| |
· |
Ten patents have provided the Company with contiguous and connecting lands between the M-S and Bullfrog pits. These patents will also allow further expansions of the Bullfrog pit to the north and east. |
| |
· |
Four patents are within 0.5 to 1.2 miles west of the Bullfrog pit in the vicinity of the Bonanza Mountain open pit mine. |
| |
· |
Eight patents are in an exploration target area located about 1.5 miles NW of the Bullfrog pit and where the Company has owned the Aurium patent since 2011. |
The lease includes the
following:
| |
· |
The Company paid $26,000 on signing and is scheduled to annually pay $16,000 for years 2-5, $21,000 for years 6-10, $25,000 for years 11-15, $30,000 for years 16-20, $40,000 for years 21-25 and $45,000 for years 26-30. |
| |
· |
Production royalty of 5% net smelter returns with the right to buy-down to 2.5%. |
| |
· |
The Company is to expend as a work commitment not less than $50,000 per year and $500,000 in total to maintain the lease. |
| |
· |
The Company has rights to commingle ores and the flexibility to operate the Project as a logical land and mining unit. |
Brown Claims
On January 29, 2018,
RMMC purchased two patented claims (the “Brown Claims”), thereby eliminating minor constraints to expand the Bullfrog pit
to the north. As partial consideration for the Brown Claims, RMMC granted the sellers of the Brown Claims a 5% net smelter returns royalty
on the Brown Claims, of which 2.5% can be purchased by RMMC for aggregate consideration of US$37,500.
Barrick Claims
On October 26, 2020,
the Company completed its acquisition of Bullfrog Mines pursuant to the MIPA with the Barrick Parties.
Pursuant to the MIPA,
the Company purchased from the Barrick Parties all of the Equity Interests in Bullfrog Mines for aggregate consideration of (i) 54,600,000
units of the Company, each unit consisting of one share of common stock of the Company and one four-year warrant purchase one share of
common stock of the Company at an exercise price of C$0.30 (such number of units and exercise price are set out on a pre-Consolidation
basis), (ii) a 2% net smelter returns royalty (the “Barrick Royalty”) granted on all minerals produced from all of the
patented and unpatented claims (subject to the adjustments set out below), pursuant to a royalty deed, dated October 26, 2020 by
and among Bullfrog Mines and the Barrick Parties (the “Royalty Deed”), (iii) the Company granting indemnification to
the Barrick Parties pursuant to an indemnity deed, dated October 26, 2020 by and among the Company, the Barrick Parties and Bullfrog
Mines, and (iv) certain investor rights, including anti-dilution rights, pursuant to the investor rights agreement, dated October 26,
2020, among the Company, Augusta Investments Inc., and Barrick.
Through the Company’s
acquisition of the Equity Interests, the Company acquired rights to the 1,500 acres of claims adjoining the Company’s Bullfrog Gold
deposit.
Pursuant to the Royalty
Deed, the Barrick Royalty is reduced to the extent necessary so that royalties burdening any individual parcel or claim included in the
Barrick Properties on October 26, 2020, inclusive of the Barrick Royalty, would not exceed 5.5% in the aggregate, provided that the
Barrick Royalty in respect of any parcel or claim would not be less than 0.5%, even if the royalties burdening a parcel or claim included
in the Barrick Properties would exceed 5.5%.
Abitibi Royalties
Option
On December 9, 2020,
Bullfrog Mines entered into a mining option agreement with Abitibi Royalties (USA) Inc. (“Abitibi”) granting Bullfrog Mines
the option (the “Abitibi Option”) to acquire forty-three unpatented lode mining claims to the south of the Bullfrog deposit.
The Abitibi Option was amended on December 9, 2022, to extend the exercise deadline and to increase the last payment amount required
to exercise the option. Bullfrog Mines made an initial payment to Abitibi of C$25,000 and exercised the Abitibi Option in full on January 30,
2023, by:
| |
· |
Paying to Abitibi C$50,000 in cash before December 9, 2021; |
| |
· |
Paying to Abitibi C$78,750 in cash before January 30, 2023; and |
| |
· |
Granting to Abitibi a 2% net smelter royalty on the claims subject to the Abitibi Option on January 30, 2023, of which Bullfrog Mines has the option to purchase 0.5% for C$500,000 on or before December 9, 2030. |
Other Property Holding
Payments
All the unpatented lode
mining claims are on U.S. public land administered by the Bureau of Land Management (“BLM”) and, therefore, are subject to
exploration and development permits as required by the several current regulations. The unpatented lode mining claims require annual payments
of $155 per claim to the BLM and $12 per claim to Nye County.
Infrastructure
Augusta Gold maintains
sufficient surface rights to support mining operations, including areas for potential waste disposal, tailings storage, heap leach pads
and potential mill sites. The Company recently located additional mining claims and is pursuing the acquisition of other lands in the
area. Most claim blocks are contiguous, and the water rights that Barrick held through Bullfrog Mines were indirectly acquired by Augusta
Gold as part of its acquisition of Bullfrog Mines.
The towns of Beatty,
Pahrump and Tonopah in Nye County have populations that support mining operations in the area.
Valley Electric Association
based in Pahrump, Nevada owns a 138 KV transmission line and a 24.9 KV distribution line that remain on-site and serviced mining at the
site previously. The substation connected to the 24.9 KV line remains on-site, but the transformers and switchgear have been removed.
Current monthly demand and energy rates are $3.75/kw and $0.12/kw-h, respectively.
Pumping from relatively
shallow wells completed near the bottom of the Bullfrog pit is required to access deeper mineralization and could produce most of the
Project water needs. Water may also be available from Barrick’s production wells located a few miles south of Highway 374, possibly
from the Town of Beatty wellfield in Section 2, and to a limited extent from deepening the M-S pit.
Geological Setting,
Mineralization, and Deposit Type
The Bullfrog Gold Project
is in the southern Walker Lane trend within brittle upper-plate volcanic host rocks that were severely broken from dominant detachment
faulting and associated dip-slip and strike-slip displacements. Epithermal solutions permeated the broken host rocks in the Montgomery-Shoshone
(M-S) and Bullfrog deposits precipitating micron-sized and relatively high-grade gold (Au) within major quartz-calcite veins and disseminated
gold in associated stock-work veins. The veins contain gangue minerals other than quartz, such as calcite and manganese oxides, the latter
of which contributes associated silver (Ag) recoveries and gold.
The strike length of
the Bullfrog mineralization is about 1,600 m, including the underground portion which accounts for about 600 m of the strike length. True
widths mined in the underground, where the ore cutoff was 3.0 g/t Au, typically average 5-10 m and local zones may be as much as 15-20
m wide. The highest grades typically correlate with zones of black manganese-rich material, where much of the early manganiferous calcite
has been leached out, rendering the vein a rubble zone of quartz, calcite, and wad. Veins continue up dip and down dip, but the gold grades
and thicknesses diminish rapidly above and below these elevations.
As in the underground
mine, the highest grades in the open pit were associated with veins and vein breccias along the MP fault and its immediate hanging wall.
Higher ore grades also occurred in veins along the UP fault, but widths were generally narrow. Zones of quartz stockwork veins and breccia
were developed between the MP and UP faults in intensely silicified and adularized wall rocks. The ore zone in the hanging wall of the
MP fault, was termed the upper stockwork zone (Jorgensen et al., 1989). Many of the stockwork veins are subparallel in strike to the MP
and UP faults, but dip more steeply. A zone of stockwork quartz veins also occurs in the footwall latite lavas (Tr1g) immediately beneath
the MP fault, but here the ore zone is usually <10-15 m thick. This was termed the lower stockwork zone (Jorgensen et al., 1989). In
this zone individual veins are often subparallel to the MP fault, and vein densities are typically in the range of 5-15%.
In most parts of the
open pit, mineralized rock is truncated by the erosional surface and gravels. The ore zone thinned up-dip and only a modest amount of
ore was probably lost to erosion. Below the open pit, ore grade values persist.
In the Bullfrog mineralization,
the high-grade zones do not comprise obvious discrete plunging ore shoots. Instead high-grade ore zones are developed along the plane
of the MP fault/vein, within 10-20° of the dip of the fault. The overall geometry of these zones is that of elongate lenses in the
plane of the fault, with long dimensions that strike roughly north-south at a low angle of plunge. The highest gold grades roughly coincided
with the oxidation-reduction boundary in the deposit and the pre-mining water table, and modest localized supergene enrichment of precious
metals near this boundary is suggested.
The gold deposits of
the southern Bullfrog Hills are contained in epithermal quartz-calcite veins and stockworks.
Historical Operations
In 1904 the Original
Bullfrog and Montgomery-Shoshone mines were discovered by local prospectors. Prospecting activity was widespread over the Bullfrog Hills
and encompassed a 200 square mile area but centered within a two-mile radius around the town of Rhyolite and included part of the Company’s
property. The Montgomery-Shoshone mine reportedly produced about 67,000 ounces of gold averaging 0.47 gold opt prior to its closure in
1911. The District produced about 94,000 ounces of gold prior to 1911. Mines in the District were sporadically worked from 1911 through
1941, but the Company has no production records of such limited activities.
The Company’s Providence
lode mining claim designated by the Surveyor General as Survey No. 2470 was located in October 1904, surveyed in April 1906,
patented in May 1906 and recorded in Nye County Nevada in June 1908. The unpatented Lucky Queen claim is immediately east and
adjacent to the Providence patent and is believed to have been located in the same time period but was not patented.
With the rise of precious
metal prices in the early 1970’s, the Bullfrog District again underwent intense prospecting and exploration activity for gold as
well as uranium. Companies exploring the area included Texas Gas Exploration, Inc., Phillips Uranium, Tenneco /Copper Range, U.S.
Borax, Western States Minerals, Rayrock, St. Joe American and successors Bond, Lac and Barrick Minerals, Noranda, Angst Mining Company,
Placer Dome, Lac-Sunshine Mining Company Joint Venture, Homestake, and others. In addition to these major companies, several junior mining
companies and individuals were involved as prospectors, promoters and owners. These scientific investigations yielded a new deposit model
for the gold deposits that were mined by others in the Bullfrog District. The identification and understanding of the detachment fault
system led to significant changes in exploration program techniques, focus, and success.
In 1982 St. Joe American, Inc.
initiated drilling in the Montgomery-Shoshone mine area. By 1986, sixty holes had been drilled and a mineral inventory was defined. Subsequent
drilling outlined a reported 2.9 million ounces of gold equivalent in the Bullfrog deposit. A series of corporate takeovers transferred
ownership from St. Joe, to Bond Gold, to Lac Minerals and eventually to Barrick Minerals. Production started in 1989 and recovered approximately
200,000 ounces of gold annually from a conventional, 9,000 ton/day cyanidation mill mainly fed from open pit operations and later supplemented
with underground production. Barrick discontinued production operations in 1999 and completed reclamation in 2003. Thereafter several
groups continued exploration on a limited basis on some of the lands currently held by the Company, but no reserves were ever defined
by these companies on those portions of the Company’s lands.
Exploration and Drilling
The Company’s exploration activities
to date have focused on the following:
| |
· |
Exploration drilling, data acquisition and geologic modeling; |
| |
· |
Acquiring, organizing, digitizing and vetting electronic and paper data bases obtained from Barrick mainly related to drill data, metallurgy and project infrastructure; and |
| |
· |
Maintaining and expanding the land holdings. |
The project drilling
includes 1,311 holes, for a total of 263,757 meters completed between 1983 and early 2021. The holes were drilled using both core and
reverse circulation methods, as detailed in the drilling section of this report.
The following table summarizes project drilling
by year:
Table 1: Project Drilling
by Year
| | |
Total Drilling | | |
Coring | | |
Reverse Circulation | |
| Year | |
Holes | | |
Meters | | |
Holes | | |
Meters | | |
Holes | | |
Meters | |
| 1983 | |
| 6 | | |
| 975 | | |
| 6 | | |
| 975 | | |
| 0 | | |
| 0 | |
| 1984 | |
| 37 | | |
| 3,560 | | |
| | | |
| 0 | | |
| 37 | | |
| 3,560 | |
| 1985 | |
| 3 | | |
| 303 | | |
| | | |
| 0 | | |
| 3 | | |
| 303 | |
| 1986 | |
| 29 | | |
| 3,364 | | |
| | | |
| 0 | | |
| 29 | | |
| 3,364 | |
| 1987 | |
| 163 | | |
| 29,479 | | |
| 3 | | |
| 732 | | |
| 163 | | |
| 28,747 | |
| 1988 | |
| 321 | | |
| 66,325 | | |
| 32 | | |
| 6,121 | | |
| 321 | | |
| 60,204 | |
| 1989 | |
| 71 | | |
| 12,285 | | |
| | | |
| 0 | | |
| 71 | | |
| 12,285 | |
| 1990 | |
| 154 | | |
| 37,114 | | |
| 33 | | |
| 3,676 | | |
| 154 | | |
| 33,438 | |
| 1991 | |
| 79 | | |
| 22,954 | | |
| 42 | | |
| 3,627 | | |
| 79 | | |
| 19,327 | |
| 1992 | |
| 23 | | |
| 4,907 | | |
| | | |
| 0 | | |
| 23 | | |
| 4,907 | |
| 1993 | |
| 9 | | |
| 387 | | |
| | | |
| 0 | | |
| 9 | | |
| 387 | |
| 1994 | |
| 210 | | |
| 31,362 | | |
| 9 | | |
| 1,412 | | |
| 210 | | |
| 29,951 | |
| 1995 | |
| 99 | | |
| 22,370 | | |
| 3 | | |
| 248 | | |
| 99 | | |
| 22,122 | |
| 1996 | |
| 58 | | |
| 15,254 | | |
| 19 | | |
| 3,329 | | |
| 45 | | |
| 11,924 | |
| 2020 | |
| 26 | | |
| 4,405 | | |
| 1 | | |
| 502 | | |
| 25 | | |
| 3,903 | |
| 2021 | |
| 43 | | |
| 14,820 | | |
| 38 | | |
| 12,749 | | |
| 5 | | |
| 2,071 | |
| 2022 | |
| 6 | | |
| 2,596 | | |
| 6 | | |
| 2,596 | | |
| 0 | | |
| 0 | |
| Total | |
| 1,337 | | |
| 272,460 | | |
| 192 | | |
| 35,967 | | |
| 1,273 | | |
| 236,493 | |
A total of 69 drill holes,
30 reverse circulation (RC) and 39 core holes have been drilled by Augusta from 2020-2021. The purpose of the drilling was to further
define resources and the ultimate limits of the Bullfrog and Montgomery-Shoshone pits and gather data to support advanced geotechnical
and metallurgical studies. The 2020 program also fulfilled a final work commitment for the Company to purchase a 100% interest in lands
under lease from Barrick by mid-September 2020. Two holes were drilled at the Paradise Ridge target.
Permitting
Baseline studies necessary
to advance permitting are in progress.
The following outlines
the general framework for permitting a mine in Nevada and the required permits. Many of the permits discussed herein apply to the construction
stage and are not currently being pursued.
Exploration activities
on Federal mining claims on BLM lands requires a Notice of Intent (NOI) for exploration activities under five acres of disturbance and
a Plan of Operations for larger scale exploration activities. A Plan of Operations is also required with the Nevada Department of Environmental
Protection (NDEP) to fulfill the State of Nevada permitting obligations on private and public lands, respectively. Reclamation bonds related
to environmental liabilities need to be calculated and posted to cover activities on the Project. Additional permits and bonding will
be required for developing, constructing, operating, and reclaiming the Project.
Additional Baseline Studies
will be required to update the historical studies completed by Barrick. This will include geochemistry, hydrologic studies of the in-pit
water and water in existing wells, plant, wildlife and threatened and endangered species surveys, meteorological information, and cultural
surveys:
| |
· |
Water Pollution Control Permits (WPCP): The WPCP application must address the open pit, heap leach pad, mining activities and water management systems with respect to potentially degrading of the waters of Nevada. Sufficient engineering, design and modeling data must be included in the WPCP. A Tentative Permit Closure Plan must be submitted to the NDEP-BMRR in conjunction with the WPCP. A Final Permanent Closure Plan will be needed two years prior to Project closure. |
| |
· |
Air Quality: An application for a Class II Air Quality Permit must be prepared using Bureau of Air Pollution Control (BAPC) forms. The application must include descriptions of the facilities, a detailed emission inventory, plot plans, process flow diagrams and a fugitive dust control plan for construction and operation of the Project. A Mercury Operating Permit and a Title V Operating permit will also be necessary for processing loaded carbon or electro-winning precipitates. |
| |
· |
Water Right: Additional water rights will need to be acquired from third parties or obtained from the Nevada Division of Water Resources (NDWR) for producing Project water. |
| |
· |
Industrial Artificial Pond: Water storage ponds, which are part of the water management systems, will require Industrial Artificial Pond permits (IAPP) from the Nevada Department of wildlife. Approval from the Nevada State Engineer’s Office is also required if embankments exceed specified heights. |
Additional minor permits
will be required for the project to advance to production and are listed in Table 8.
Table 8: Additional
Minor Permits Required
| Notification/Permit |
|
Agency |
| Mine Registry |
|
Nevada Division of Minerals |
| Mine Opening Notification |
|
State Inspector of Mines |
| Solid Waste Landfill |
|
Nevada Bureau of Waste Management |
| Hazardous Waste Management Permit |
|
Nevada Bureau of Waste Management |
| General Storm Water Permit |
|
Nevada Bureau of Water Pollution Control |
| Hazardous Materials Permit |
|
State Fire Marshall |
| Fire and Life Safety |
|
State Fire Marshall |
| Explosives Permit |
|
Bureau of Alcohol, Tobacco, Firearms & Explosives |
| Notification of Commencement of Operation |
|
Mine Safety and Health Administration |
| Radio License |
|
Federal Communications Commission |
| Public Water Supply Permit |
|
NV Division of Environmental Protection |
| MSHA Identification Number and MSHA Coordination |
|
U.S. Department of Labor Mine Safety and Health Administration (MSHA) |
| Septic Tank |
|
NDEP-Bureau of Water Pollution Control |
| Petroleum Contaminated Soils |
|
NV Division of Environmental Protection |
2023 Project Exploration
Plans
Subject to funding, the
Company’s focus in 2023 for exploration at the Bullfrog Gold Project is drilling at the Gap Target, an epithermal lithocap at the
northern end of the Bullfrog land package, as well as continued support of ongoing permitting and engineering work.
Reward Gold Project,
Nye County, Nevada
Property Location
and Access
The Reward Gold Project
(the “Project” or “Reward Project”) is situated about 11.3 km (7 miles) south-southeast of the town of Beatty,
NV about 3.2 km (2 miles) east of US Highway 95 in Nye County (Figure 1). The Project can be accessed from Beatty by paved road on Highway
95 followed by traveling two miles east on a gravel road. Several dirt roads diverge into various canyons of the Bare Mountains. The Project
area lies within Sections 1, 2, 3, 4, 9, 10, 11 and 16 of Township 13 South, Range 47 East and Sections 33, 34, and 35 of Township 12
South, Range 47 East, all referred to the Mount Diablo Baseline and Meridian. The Project can be accessed from Beatty by paved road on
Highway 95 followed by traveling two miles east on a gravel road. Several dirt roads diverge into various canyons of the Bare Mountains.
Project Stage
The Project is an exploration
stage property with measured, indicated and inferred mineral resources but no known mineral reserves.
Mineral Resource
Estimates
Mineral Resources were
classified using a combination of assessment of geological confidence, data quality and grade continuity. Reasonable prospects of eventual
economic extraction were considered by constraining the estimate within a conceptual pit shell that used the assumptions in Table 9.
Table 9. Reward Conceptual
Open Pit Parameters.
| Parameter | |
Unit (Imperial) | |
Cost (Imperial) | | |
Unit (Metric) | |
Cost (Metric) | |
| Gold Price | |
US$/oz | |
| 1,700 | | |
US$/g | |
| 54.656 | |
| Gold Metallurgical Recovery | |
% | |
| 80 | | |
% | |
| 80 | |
| Pit Wall Angles | |
° | |
| 48-58 | | |
° | |
| 48-58 | |
| Mining Cost | |
US$/st | |
| 2.00 | | |
US$/tonne | |
| 2.20 | |
| Processing Rate | |
Mst/a | |
| 3 | | |
Mtonne/a | |
| 2.7 | |
| Processing Cost | |
US$/st | |
$ | 5.50 | | |
US$/tonne | |
$ | 6.06 | |
| G & A Cost | |
US$/st | |
| 0.75 | | |
US$/tonne | |
| 0.80 | |
| Cut-off Grade (break even) | |
oz/st | |
| 0.0047 | | |
g/tonne | |
| 0.158 | |
| Royalty | |
% | |
| 3 | | |
% | |
| 3 | |
The Mineral Resource Estimate for the Reward
Project is presented in Table 10 below.
Table 10. Reward Project
Mineral Resource Estimate at December 31, 2022 Based on USD$1,700/oz. Au
| Classification | |
Tonnage (Mt) | | |
Average Grade (g/t) | | |
Contained Au (koz) | |
| Good Hope | |
| | | |
| | | |
| | |
| Measured | |
| 6.19 | | |
| 0.86 | | |
| 169.9 | |
| Indicated | |
| 10.76 | | |
| 0.69 | | |
| 240.0 | |
| M&I Total | |
| 16.94 | | |
| 0.75 | | |
| 409.9 | |
| Inferred | |
| 0.29 | | |
| 0.56 | | |
| 5.3 | |
| Gold Ace | |
| | | |
| | | |
| | |
| Indicated | |
| 0.83 | | |
| 0.63 | | |
| 16.8 | |
| Inferred | |
| 1.03 | | |
| 0.73 | | |
| 21.8 | |
| Reward (Combined Good Hope and Gold Ace) | |
| | | |
| | | |
| | |
| Measured | |
| 6.19 | | |
| 0.86 | | |
| 169.9 | |
| Indicated | |
| 11.58 | | |
| 0.69 | | |
| 256.8 | |
| M&I Total | |
| 17.77 | | |
| 0.75 | | |
| 426.7 | |
| Inferred | |
| 1.23 | | |
| 0.68 | | |
| 27.1 | |
Notes:
| 1. |
Oxide estimated Mineral Resources are reported within a pit shell using the Lerch Grossman algorithm, a gold price of US$1,700/oz and a recovery of 80% for Au were utilized. |
| 2. |
Gold price used in the Reward estimated Mineral Resources were
based on a review of commodity prices at the time of the estimate and assumed a price of US$1,700 per oz of gold based upon a three year
trailing average. |
| 3. |
Mining costs for mineralized material and waste are US$2.20/tonne. |
| 4. |
Processing and general and administration are US$6.06/tonne and US$0.83/tonne per tonne processed, respectively. |
| 5. |
Reward Mineral Resources are reported using a 0.2 g/tonne incremental cut-off grade. |
| 6 |
Due to rounding, some columns or rows may not compute as shown. |
| 7. |
Estimated Mineral Resources are stated as in situ dry metric tonnes and are partially diluted. |
| 8. |
The estimate of Mineral Resources may be materially affected by legal, title, taxation, socio-political, marketing, or other relevant issues. |
| 9. |
The effective date of the Reward mineral resource estimate is December 31, 2022. |
Estimated Mineral Resources
have not changed from May 22, 2022 (the date estimates were initially reported to the Commission in the Company Current Report on
Form 8-K dated July 7, 2022) to December 31, 2022 due to the fact that the Reward Gold Project is in the exploration stage
and no new resources were added to the project through exploration activities in the remainder of 2022. The material assumptions underlying
mineral resources as previously disclosed at May 31, 2022 remain current in all material respects.
Property Holdings
The Project area lies
within Sections 1, 2, 3, 4, 9, 10, 11 and 16 of Township 13 South, Range 47 East and Sections 33, 34, and 35 of Township 12 South, Range
47 East, all referred to the Mount Diablo Baseline and Meridian.
Canyon Resources Corporation
(Canyon Resources) holds a 100% interest in the mineral claims that form the Project. In 2008, Canyon Resources assigned all of the patented
and unpatented claims comprising the Project to an entity which was subsequently converted into CR Reward.
The Project encompasses
123 unpatented Bureau of Land Management (BLM) placer and lode mining claims and six patented placer mining claims, totalling approximately
2,333 net acres (944 hectares). Only the patented claims have been legally surveyed. Under United States mining law, claims may be renewed
annually for an unlimited number of years upon a small payment per claim (currently $155 per claim due to the BLM and an aggregate $1,502
due to Nye County) and the same claim status-whether lode or placer-may be used for exploration or exploitation of the lodes or placers.
Several blocks of unpatented
claims are leased by CR Reward from underlying owners, and are referred to as Connolly, Webster, Orser-McFall and Van Meeteren leases.
Connolly
Lease
This lease agreement
(the Connolly Lease), effective as of September 28th, 2004, covers a two-third interest in each of the Sunshine and Reward
unpatented lode claims (collectively, the Connolly Claims). The Connolly Lease is for an initial term of 20 years and continues so long
thereafter as the Project remains in commercial production. A 3% NSR royalty is payable on any minerals mined from the Connolly Claims,
but is reduced to 2% due to the fact that CR Reward only owns a two-third interest in the Connolly Claims. Annual advance minimum royalty
payments are payable under the Connolly Lease in an amount equal to $10,000 per year. These annual advance minimum royalty payments shall
be applied toward, credited against and fully deductible from earned mineral production royalty payments due from the Connolly Claims.
Webster
Lease
This lease agreement
(the Webster lease), effective as of November 9, 2004 (as amended on November 9th, 2004 and November 8th,
2006), covers a one-third interest in each of the Sunshine and Reward unpatented lode claims and a half interest in the Good Hope unpatented
lode claim (collectively, the Webster Claims). The Webster Lease is for an initial term of 20 years and continues so long thereafter as
the Project remains in commercial production. A 3% NSR royalty is payable on any minerals mined from the Webster Claims, but is (i) reduced
to 1% on the Sunshine and Reward claims due to the fact that the lessee only owns a one-third interest, and (ii) reduced to 1.5%
on the Good Hope claim due to the fact that CR Reward only owns a half interest in this claim. Annual advance minimum royalty payments
are payable under the Webster Lease in an amount equal to $7,500 per year. The annual advance minimum royalty payments paid in any given
year may be applied toward, credited against and fully deductible from any earned mineral production royalty payments due on the Webster
Claims during the calendar year in which such annual advance minimum royalty payments are due.
Orser-McFall Lease
This lease agreement
(the Orser-McFall Lease), effective as of February 5, 2005 (as amended on August 18th, 2005 and November 14th,
2006), applies to 12 unpatented lode and six unpatented placer mining claims (collectively, the Orser-McFall Claims). The Orser-McFall
Lease is for an initial term of 20 years and continues so long thereafter as the Project remains in commercial production. The lessors
under the Orser-McFall Lease own 100% of the Orser-McFall Claims, except for the Good Hope claim, in which they own a half interest (the
other half being owned by the Daniel D. Webster Living Trust and leased to CR Reward pursuant to the Webster Lease). A 3% NSR royalty
is payable on minerals mined from the Orser-McFall Claims, but is reduced to 1.5% on the Good Hope claim due to the fact that the lessee
only owns a half interest in that claim. Annual advance minimum royalty payments are payable under the Orser-McFall Lease in an amount
equal to $20,000 per year. These annual advance minimum royalty payments shall be applied toward, credited against and fully deductible
from earned mineral production royalty payments due from the Orser-McFall Claims.
Van
Meeteren et al Lease
This lease agreement
(the Van Meeteren Lease), effect as of December 1st, 2011 (applies to the Double RS and the Durlers Hope unpatented placer
claims (the Van Meeteren Claims). The Van Meeteren Lease is for an initial term of 20 years and continues so long thereafter as the Project
remains in commercial production or CR Reward is actively conducting exploration, development, reclamation or remediation operations.
A 3% NSR royalty is payable on minerals mined from the Van Meeteren Claims. Annual advance minimum royalty payments are payable under
the Van Meeteren Lease in an amount equal to $15/acre from 2011 through 2020, for a total of $1,800 per year, and $20/acre from and after
2021, for a total of $2,400 per year. These annual advance minimum royal payments are recoupable from earned mineral production royalties.
All payments described above have been timely paid by CR Reward and its predecessor and the agreements are all in good standing.
The Project area mainly
consists of Federal public domain lands administered by the BLM. There are no State or private tracts within the Project area, except
the six patented claims owned by CR Reward, all of which carry surface and mineral rights ownership.
The Project is not subject
to any other back-in rights payments, agreements or encumbrances.
CR Reward has the right
to use 391,494 m3 (317.39 acre-ft) of water annually under Application No. 61412, Certificate No. 16384 and Permit No. 76390.
The Amargosa River basin
is an enclosed basin, and the water rights are thus not affected by the Colorado River Compact or other agreements.
Infrastructure
The Project is located
seven miles by road southeast of Beatty, a town of approximately 1,000 people that serves as a transit hub and service centre for travellers
between Las Vegas and Reno, and those going to Death Valley. Several motels and restaurants, gas stations, a post office, and several
small stores provide basic services.
The Project is currently
serviced by an existing 14.4/24.9 kV power line owned and operated by Valley Electric. A water well currently provides water for exploration
activities.
Project employees would
likely be recruited from the local area, including the communities of Beatty, Amargosa, and Pahrump, located within Nye County, and the
regional urban centre of Las Vegas, located within Clark County. There is available nearby accommodation to the Project site in Beatty
and other smaller communities
The Project has sufficient
land area, with adjacent public-domain lands also potentially available, to allow mine development, including space for the mining operations,
waste rock disposal facilities (WRDs), heap leach pads and processing plants.
Geological Setting, Mineralization and
Deposit Type
Mineralization in the
Good Hope Deposit and Golden Ace Zone can be classified as examples of a structurally controlled, locally disseminated, sediment hosted,
mesothermal quartz vein gold deposit.
The Project is hosted
within the Bare Mountain Complex which lies within an intricate tectonic setting of the Nevada Basin and Range Province.
The Bare Mountain Complex
consist of up to 6,096 m (20,000 ft) of Upper Proterozoic to Paleozoic marine sedimentary rocks in the lower plate that have been juxtaposed
against Miocene silicic volcanic sequences in the upper plate. The lower plate units were deformed through folding, thrust faulting, low
and high angle normal faulting during a Mesozoic compression event, and have been metamorphosed from lower amphibolite to sub-greenschist
grade. Two dominant normal fault sets have been mapped in the lower plate, including the moderately east-dipping Bare Mountain and Gold
Ace faults, and shallowly southeast-dipping faults that cut or curve into east-dipping faults.
The Project is located
on the southwestern flank of the Bare Mountain Complex and is underlain by moderately-deformed marine clastic and carbonate rocks of Late
Proterozoic and Late Cambrian age that have been metamorphosed to greenschist grade. Tertiary and younger alluvium cover the lower slopes
and the adjacent Armagosa Valley to the south and west. The east-dipping Gold Ace fault, locally termed the Good Hope fault zone, separates
northeast dipping Late Proterozoic to Early Cambrian units in the footwall block from Middle to Late Cambrian units in the hanging wall
block.
The gold mineralization
in the Good Hope Deposit is spatially associated with, and along, the Good Hope fault zone, and is primarily hosted in altered and veined
Wood Canyon Formation, and to a lesser extent, in the Juhl and Sutton Members of the Stirling Formation. Mineralization hosted along the
contact between the Sutton and Morris Marble Members of the Stirling Formation is referred to as the Gold Ace Zone. Although there are
small historic prospects along the Good Hope fault zone, most of the historic production came from the Gold Ace Zone.
Historical Operations
Historical exploration
of the Project was completed by several other companies from 1976 to 2004, including Galli Exploration Associates (Galli Exploration),
Teco Inc. (Teco), St. Joe Minerals Corporation (St Joe), Gexa Gold Corp (Gexa), Cloverleaf Gold Inc. (Cloverleaf), Homestake Mining Company
(Homestake), Pathfinder Gold Corporation (Pathfinder), Bond Gold Exploration Inc. (Bond Gold), Barrick, US Nevada Gold Search (USNGS),
Rayrock Mines, Inc (Rayrock), Glamis Gold, Ltd. (Glamis Gold), and Marigold Mining Company (Marigold Mining). Historical exploration
included airborne geophysics, reverse circulation (RC) and core drilling, initial metallurgical testwork, mineral resource estimates and
technical studies.
Canyon Resources acquired
the Project in 2004, and together with Atna Resources Ltd. (Atna) and CR Reward, have completed data compilation and validation, ground
induced polarization/resistivity geophysical surveys, RC and core drilling, mineral resource and mineral reserve estimates, metallurgical
testwork, permitting studies, environmental baseline studies, and technical studies. The following permits and authorizations were granted
to CR Reward in 2007:
| · |
Plan of Operations authorized under N-82840. |
| · |
Water Pollution Control Permit (WPCP); WPCP NEV2007101. |
| · |
General construction permit; NVR100000 CSW-17415. |
| · |
Water rights permitted by Nevada Division of Water Resources (NDWR) under Mining, Milling, & Domestic permit 76390. |
| · |
Mining reclamation permit granted by the Bureau of Mining Regulation and Reclamation (BMRR) under mine site permit #0300. |
| · |
Nevada Bureau of Air Pollution Control (BAPC) authorized Class II Air Quality permit AP1041-2492. |
Permitting
The current Project area
includes public and private lands within Nye County, Nevada. The Project, therefore, falls under the jurisdiction and permitting requirements
of Nye County, the State of Nevada (primarily the BMRR) and the BLM.
The following permits
and authorizations were granted to CR Reward:
| · |
Plan of Operations authorized under N-82840. |
| · |
Water Pollution Control Permit (WPCP); WPCP NEV2007101. |
| · |
Water rights permitted by Nevada Division of Water Resources (NDWR) under Mining, Milling, & Domestic permit 76390 and permit 89658. |
| · |
Mining reclamation permit granted by the Bureau of Mining Regulation and Reclamation (BMRR) under mine site permit #0300. |
| · |
Nevada Bureau of Air Pollution Control (BAPC) authorized Class II Air Quality permit AP1041-2492. |
The reader is referred
to Evans et al. (2019) for additional information regarding permitting considerations for mining activities at the Project. Regarding
exploration activities, during early phases of exploration, when surface disturbance is generally limited, authorization from the BLM
is conditionally granted under a notice (40 CFR § 3890.21). There are currently no exploration notices associated with the Project
and none are likely to be granted given the Project has a mine plan of operations (MPO) that was granted in 2020.
2023 Project Exploration
Plans
Subject to funding, the
Company’s focus in 2023 for exploration at the Reward Project is expanding the resource down-dip, and performing infill drilling
where there are gaps in the current resource model.
PART IV
ITEM 15. EXHIBITS
Documents Filed as
Part of Report
Financial Statements
The following Consolidated
Financial Statements of the Company were filed with the Company’s Annual Report on Form 10-K filed on March 16, 2023:
| |
1. |
Report of Independent Registered Public Accounting Firm (Davidson & Company LLP. |
| |
2. |
Consolidated Balance Sheets – As of December 31, 2022 and 2021. |
| |
3. |
Consolidated Statements of Income/(Loss) – Years ended December 31, 2022 and 2021. |
| |
4. |
Consolidated Statements of Shareholders’ Equity – Years ended December 31, 2022 and 2021. |
| |
5. |
Consolidated Statements of Cash Flows – Years ended December 31, 2022 and 2021. |
| |
6. |
Notes to Consolidated Financial Statements. |
See
“Item 8. Financial Statements and Supplementary Data”.
Financial Statement
Schedules
No financial statement
schedules are filed as part of this report because such schedules are not applicable or the required information is shown in the Consolidated
Financial Statements or notes thereto. See “Item 8. Financial Statements and Supplementary Data”.
Exhibits:
The exhibits, listed on the following exhibit
index are filed or furnished as part of this Amended Report on Form 10-K/A. These exhibits should be read in conjunction with the
exhibits in Item 15 of the Company’s Annual Report on Form 10-K filed on February 24, 2022.
SIGNATURES
Pursuant to the requirements of Sections 13 or
15(d) of the Securities Exchange Act of 1934, the registrant has duly caused this report to be signed on its behalf by the undersigned,
thereunto duly authorized.
| Date: December 20, 2023 |
AUGUSTA GOLD CORP. |
| |
|
| |
By: |
/s/ Donald R. Taylor |
| |
|
Name: Donald R. Taylor |
| |
|
Title: President and Chief Executive Officer
(Principal Executive Officer) |
| |
|
|
| Date: December 20, 2023 |
AUGUSTA GOLD CORP. |
| |
|
| |
By: |
/s/ Michael McClelland |
| |
|
Name: Michael McClelland |
| |
|
Title: Chief Financial Officer
(Principal Financial and Accounting Officer) |
Exhibit 31.1
CERTIFICATION
I, Donald R. Taylor, certify that:
| 1. | I have reviewed this annual report on Form 10-K/A of Augusta Gold Corp.; |
| 2. | Based on my knowledge, this report does not contain any untrue statement of a material fact or omit to
state a material fact necessary to make the statements made, in light of the circumstances under which such statements were made, not
misleading with respect to the period covered by this report; |
| 3. | Based on my knowledge, the financial statements, and other financial information included in this report,
fairly present in all material respects the financial condition, results of operations and cash flows of the registrant as of, and for,
the periods presented in this report; |
| 4. | The registrant’s other certifying officer and I are responsible for establishing and maintaining
disclosure controls and procedures (as defined in Exchange Act Rules 13a-15(e) and 15d-15(e)) and internal control
over financial reporting (as defined in Exchange Act Rules 13a-15(f) and 15d-15(f)) for the registrant and have: |
| |
a) |
Designed such disclosure controls and procedures, or caused such disclosure controls and procedures to be designed under our supervision, to ensure that material information relating to the registrant, including its consolidated subsidiaries, is made known to us by others within those entities, particularly during the period in which this report is being prepared; |
| |
b) |
Designed such internal control over financial reporting, or caused such internal control over financial reporting to be designed under our supervision, to provide reasonable assurance regarding the reliability of financial reporting and the preparation of financial statements for external purposes in accordance with generally accepted accounting principles; |
| |
c) |
Evaluated the effectiveness of the registrant’s disclosure controls and procedures and presented in this report our conclusions about the effectiveness of the disclosure controls and procedures, as of the end of the period covered by this report based on such evaluation; and |
| |
d) |
Disclosed in this report any change in the registrant’s internal control over financial reporting that occurred during the registrant’s most recent fiscal quarter (the registrant’s fourth fiscal quarter in the case of an annual report) that has materially affected, or is reasonably likely to materially affect, the registrant’s internal control over financial reporting; and |
| 5. | The registrant’s other certifying officer and I have disclosed, based on our most recent evaluation
of internal control over financial reporting, to the registrant’s auditors and the audit committee of the registrant’s board
of directors (or persons performing the equivalent functions): |
| |
a) |
All significant deficiencies and material weaknesses in the design or operation of internal control over financial reporting which are reasonably likely to adversely affect the registrant’s ability to record, process, summarize and report financial information; and |
| |
b) |
Any fraud, whether or not material, that involves management or other employees who have a significant role in the registrant’s internal control over financial reporting. |
| Dated: December 20, 2023 | |
/s/ Donald
R. Taylor |
| | |
|
| | |
Donald R. Taylor, |
| | |
Chief Executive Officer |
Exhibit 31.2
CERTIFICATION
I, Michael McClelland, certify that:
| 1. | I have reviewed this annual report on Form 10-K/A of Augusta Gold Corp.; |
| 2. | Based on my knowledge, this report does not contain any untrue statement of a material fact or omit to
state a material fact necessary to make the statements made, in light of the circumstances under which such statements were made, not
misleading with respect to the period covered by this report; |
| 3. | Based on my knowledge, the financial statements, and other financial information included in this report,
fairly present in all material respects the financial condition, results of operations and cash flows of the registrant as of, and for,
the periods presented in this report; |
| 4. | The registrant’s other certifying officer and I are responsible for establishing and maintaining
disclosure controls and procedures (as defined in Exchange Act Rules 13a-15(e) and 15d-15(e)) and internal control
over financial reporting (as defined in Exchange Act Rules 13a-15(f) and 15d-15(f)) for the registrant and have: |
| |
a) |
Designed such disclosure controls and procedures, or caused such disclosure controls and procedures to be designed under our supervision, to ensure that material information relating to the registrant, including its consolidated subsidiaries, is made known to us by others within those entities, particularly during the period in which this report is being prepared; |
| |
b) |
Designed such internal control over financial reporting, or caused such internal control over financial reporting to be designed under our supervision, to provide reasonable assurance regarding the reliability of financial reporting and the preparation of financial statements for external purposes in accordance with generally accepted accounting principles; |
| |
c) |
Evaluated the effectiveness of the registrant’s disclosure controls and procedures and presented in this report our conclusions about the effectiveness of the disclosure controls and procedures, as of the end of the period covered by this report based on such evaluation; and |
| |
d) |
Disclosed in this report any change in the registrant’s internal control over financial reporting that occurred during the registrant’s most recent fiscal quarter (the registrant’s fourth fiscal quarter in the case of an annual report) that has materially affected, or is reasonably likely to materially affect, the registrant’s internal control over financial reporting; and |
| 5. | The registrant’s other certifying officer and I have disclosed, based on our most recent evaluation
of internal control over financial reporting, to the registrant’s auditors and the audit committee of the registrant’s board
of directors (or persons performing the equivalent functions): |
| |
a) |
All significant deficiencies and material weaknesses in the design or operation of internal control over financial reporting which are reasonably likely to adversely affect the registrant’s ability to record, process, summarize and report financial information; and |
| |
b) |
Any fraud, whether or not material, that involves management or other employees who have a significant role in the registrant’s internal control over financial reporting. |
| Dated: December 20, 2023 | |
/s/ Michael McClelland |
| | |
|
| | |
Michael McClelland, |
| | |
Chief Financial Officer |
Exhibit 96.1
 |
S-K
1300 Technical Report
Mineral
Resource Estimate
Bullfrog
Gold Project
Nye
County, Nevada
EFFECTIVE
DATE: December 31, 2021
Amended:
December 18, 2023
PREPARED
FOR:
Augusta
Gold Corp.
Vancouver,
BC
BY
QUALIFIED
PERSONS:
Forte
Dynamics, Inc.
120
Commerce Drive, Units 3-4
Fort
Collins, CO 80524 |
|
 | | Augusta Gold Corp. |
Date
and Signature Page
This
report titled “S-K 1300 Technical Report Mineral Resource Estimate on the Bullfrog Gold Project, Nye County, Nevada”
is current as of December 31, 2021 and was prepared and signed by Forte Dynamics, Inc., acting as a Qualified Person Firm.
(signed
and sealed)
Date:
December 18, 2023
Forte
Dynamics, Inc.
120
Commerce Drive, Units 3-4
Fort
Collins, CO 80524
FORTE DYNAMICS, INC
120 Commerce Drive., Units 3 & 4, Fort Collins, CO 80524 | P a g e | 2 of 178 | December 2023 |
| | Augusta Gold Corp. |
Table
of Contents
| 1. |
Executive Summary |
9 |
| |
|
|
|
| |
1.1 |
Location, Property Description and Ownership |
9 |
| |
1.2 |
Geology and Mineralization |
10 |
| |
1.3 |
Exploration, Drilling, Sampling and QA/QC |
11 |
| |
1.3.1 |
Exploration |
11 |
| |
1.3.2 |
Drilling |
12 |
| |
1.3.3 |
Sampling |
13 |
| |
1.3.4 |
QA/QC |
14 |
| |
1.3.5 |
Database Improvements |
14 |
| |
1.4 |
Mineral Processing and Metallurgical Testing |
14 |
| |
1.5 |
Mineral Resource Estimates |
17 |
| |
1.6 |
Conclusions |
20 |
| |
1.6.1 |
Geology and Mineral Resources |
20 |
| |
1.6.2 |
Metallurgical Test Work and Mineral Processing |
21 |
| |
1.6.3 |
Infrastructure |
22 |
| |
1.7 |
Recommendations |
22 |
| |
|
|
|
| 2. |
Introduction |
23 |
| |
|
|
|
| |
2.1 |
Units of Measure |
23 |
| |
2.2 |
Abbreviations |
24 |
| |
2.3 |
Qualified Persons and Details of Inspection |
24 |
| |
|
|
|
| 3. |
Property Description |
25 |
| |
|
|
|
| |
3.1 |
NPX Assignment of Lands |
51 |
| |
3.2 |
Mojave Gold Option |
51 |
| |
3.3 |
Barrick Bullfrog Inc. Lease and Option |
51 |
| |
3.4 |
Lunar Landing Lease |
51 |
| |
3.5 |
Brown Claims |
52 |
| |
3.6 |
Barrick Claims (2020) |
52 |
| |
3.7 |
Abitibi Royalties Option |
53 |
| |
3.8 |
Other Property Considerations |
53 |
| |
3.9 |
Environmental and Permitting |
53 |
| |
3.10 |
Significant Risk Factors |
54 |
| |
|
|
|
| 4. |
Accessibility, Climate, Local Resources, Infrastructure and Physiography |
55 |
| |
|
|
|
| |
4.1 |
Accessibility |
55 |
| |
4.2 |
Physiography, Climate and Vegetation |
55 |
| |
4.3 |
Local Resources and Infrastructure |
56 |
| |
|
|
|
|
| 5. |
History |
57 |
| |
|
|
|
| 6. |
Geological Setting, Mineralisation and Deposit |
59 |
| |
|
|
|
| |
6.1 |
Regional Geology |
59 |
| |
6.2 |
Local and Property Geology |
60 |
| |
6.2.1 |
Cenozoic Rocks |
62 |
| |
6.2.2 |
Pre-14 Ma Rocks |
62 |
| |
6.2.3 |
14 to 11 Ma Rocks |
64 |
| |
6.2.4 |
Post 11 Ma to 7.6 Ma Rocks |
66 |
FORTE DYNAMICS, INC
120 Commerce Drive., Units 3 & 4, Fort Collins, CO 80524 | P a g e | 3 of 178 | December 2023 |
| | Augusta Gold Corp. |
| |
6.2.5 |
10.6-10.0 Ma Rainbow Mountain Sequence (Trm,
Tr11-16 and other units) |
67 |
| |
6.3 |
District Geology |
68 |
| |
6.4 |
Mineralization and Veining |
69 |
| |
6.4.1 |
Bullfrog Mineralization |
69 |
| |
6.4.2 |
Montgomery-Shoshone Mineralization |
70 |
| |
6.4.3 |
Bonanza Mineralization |
72 |
| |
6.5 |
Deposit |
72 |
| |
|
|
|
| 7. |
Exploration |
74 |
| |
|
|
| |
7.1 |
Bullfrog |
75 |
| |
7.1.1 |
Mystery Hills |
75 |
| |
7.1.2 |
Ladd Mountain |
75 |
| |
7.2 |
Montgomery-Shoshone Area |
75 |
| |
7.2.1 |
Polaris Vein |
75 |
| |
7.2.2 |
East Zone |
75 |
| |
7.2.3 |
Deep Potential |
75 |
| |
7.3 |
Bonanza Mountain |
76 |
| |
7.4 |
Gap |
76 |
| |
7.5 |
Drilling |
77 |
| |
7.5.1 |
2020 - 2021 Drilling |
79 |
| |
7.5.2 |
2021 Additional Drilling Included in the End of Year 2021 Resource
Model |
89 |
| |
|
|
|
|
| 8. |
Sample Preparation, Analyses, and Security |
95 |
| |
|
|
|
| |
8.1 |
Historic Data (1983 – 1996) |
95 |
| |
8.2 |
Augusta Gold Corp. (2020-2021) |
95 |
| |
8.2.1 |
Augusta Gold Corp. 2020 |
95 |
| |
8.2.2 |
Augusta Gold Corp 2021 |
97 |
| |
|
|
|
|
| 9. |
Data Verification |
107 |
| |
|
|
|
| |
9.1 |
Check Assay |
108 |
| |
9.2 |
Qualified Person’s Opinion |
111 |
| |
|
|
|
| 10. |
Mineral Processing and Metallurgical Testing |
112 |
| |
|
|
|
| |
10.1 |
St. Joe |
112 |
| |
10.1.1 |
Large Column Leach Test |
112 |
| |
10.1.2 |
Bottle Roll Tests on UG Samples |
113 |
| |
10.1.3 |
Column Testing by Kappes Cassiday & Associates |
113 |
| |
10.2 |
Pilot Testing by Barrick |
114 |
| |
10.3 |
Column Leach Tests |
115 |
| |
10.4 |
Conclusions for Heap Leaching |
116 |
| |
10.5 |
Leach Pad Siting |
117 |
| |
10.6 |
Additional Testing |
118 |
| |
10.7 |
Qualified Person’s Opinion |
119 |
| |
|
|
|
| 11. |
Mineral Resource Estimates |
120 |
| |
|
|
|
| |
11.1 |
Summary |
120 |
| |
11.2 |
Database |
123 |
| |
11.2.1 |
Vulcan Isis Drillhole Database |
124 |
| |
11.2.2 |
Drillhole Exclusion |
126 |
| |
11.3 |
Grade Shells |
127 |
FORTE DYNAMICS, INC
120 Commerce Drive., Units 3 & 4, Fort Collins, CO 80524 | P a g e | 4 of 178 | December 2023 |
| | Augusta Gold Corp. |
| |
11.4 |
Statistical Analyses and Capping of Outlier Values |
129 |
| |
11.5 |
Compositing |
130 |
| |
11.6 |
Variography |
130 |
| |
11.7 |
Block Model |
133 |
| |
11.8 |
Estimation Methodology |
135 |
| |
11.9 |
Resource Estimate Classification |
138 |
| |
11.10 |
Density Data |
138 |
| |
11.11 |
Pit Slopes |
140 |
| |
11.12 |
Reblocking |
141 |
| |
11.13 |
Pit Shell Optimization |
142 |
| |
|
|
|
|
| 12. |
Mineral Reserve Estimates |
145 |
| |
|
|
| 13. |
Mining Methods |
145 |
| |
|
|
| 14. |
Process and Recovery Methods |
145 |
| |
|
|
|
| 15. |
Infrastructure |
145 |
| |
|
|
|
| 16. |
Market Studies |
145 |
| |
|
|
|
| 17. |
Environmental Studies, Permitting, and Plans,
Negotiations, or Agreements with Local Individuals or Groups |
145 |
| |
|
|
|
| 18. |
Capital and Operating Costs |
145 |
| |
|
|
|
| 19. |
Economic Analysis |
145 |
| |
|
|
|
| 20. |
Adjacent Properties |
146 |
| |
|
|
|
| 21. |
Other Relevant Data and Information |
147 |
| |
|
|
|
| 22. |
Interpretation and Conclusions |
148 |
| |
|
|
|
| |
22.1 |
Geology and Mineral Resources |
148 |
| |
22.2 |
Metallurgical Test Work and Mineral Processing |
149 |
| |
22.3 |
Infrastructure |
149 |
| |
|
|
|
| 23. |
Recommendations |
150 |
| |
|
|
|
| |
23.1 |
Exploration |
150 |
| |
23.2 |
Baseline Studies |
150 |
| |
23.3 |
Additional Studies |
150 |
| |
23.4 |
Estimated Costs |
150 |
| |
|
|
|
| 24. |
References |
152 |
| |
|
|
|
| 25. |
Reliance on Information Provided by the Registrant |
158 |
| |
|
|
|
| 26. |
Appendix 1 |
159 |
| |
|
|
|
| |
26.1 |
Statistical Analysis of Drillhole Data for Gold Assays |
159 |
| |
26.2 |
Statistical Analysis of Drillhole Data for Silver
Assays |
166 |
| |
26.3 |
Swath Plots |
173 |
FORTE DYNAMICS, INC
120 Commerce Drive., Units 3 & 4, Fort Collins, CO 80524 | P a g e | 5 of 178 | December 2023 |
| | Augusta Gold Corp. |
List
Of Tables
| Table
1-1: Location and Depth of 2020 - 2021 Holes |
12 |
| Table
1-2: 1994 Leach Test Results |
14 |
| Table
1-3: 1995 Pilot Heap Leach Test Results |
15 |
| Table
1-4: 2018 Column Leach Test Results |
15 |
| Table
1-5: 2019 Column Leach Test Results |
16 |
| Table
1-6: 2020 Bottle Roll Test Results |
17 |
| Table
1-7: Bullfrog Mineral Resources |
18 |
| Table
1-8: Montgomery-Shoshone Mineral Resources |
19 |
| Table
1-9: Bonanza Mineral Resources |
19 |
| Table
1-10: Combined Mineral Resources |
20 |
| Table
3-1: Lands Under the Control of Augusta Gold Corp. |
26 |
| Table
3-2: Additional Minor Permits Required |
54 |
| Table
5-1: Bullfrog Project Production |
57 |
| Table
7-1: Drilling Totals by Type |
78 |
| Table
7-2: Active Years by Operator |
79 |
| Table
7-3: Location and Depth of 2020 - 2021 Holes |
81 |
| Table
7-4: Drilling Results from the 2020 - 2021 Program |
84 |
| Table
7-5: Location and Depth of Additional 2021 Holes |
90 |
| Table
7-6: Drilling Results from Additional Drilling in 2021 Program |
91 |
| Table
8-1: CRM Expected Values |
96 |
| Table
8-2: Summary of Gold in CRM’s |
96 |
| Table
8-3: CRM Expected Values |
96 |
| Table
8-4: Blank Failure Threshold |
97 |
| Table
8-5: Duplicate Sample Results |
97 |
| Table
8-6: CRM Expected Values |
104 |
| Table
8-7: Summary of Gold in CRMs |
105 |
| Table
8-8: Blank Failure Threshold |
105 |
| Table
9-1: Check Assay Gold Statistics |
110 |
| Table
10-1: Typical Processing Statistics from 1989-1999 |
112 |
| Table
10-2: Leach Test Results |
113 |
| Table
10-3: Heap Leach Pilot Tests – Barrick |
114 |
| Table
10-4: Column Leach Test Results (2018) |
115 |
| Table
10-5: Column Leach Test Results (2019) |
116 |
| Table
10-6: Estimated Heap Leach Recovery |
116 |
| Table
10-7: Summary Metallurgical Results – Bottle Roll Tests |
118 |
| Table
11-1: Bullfrog Mineral Resources |
121 |
| Table
11-2: Montgomery-Shoshone Mineral Resources |
122 |
| Table
11-3: Bonanza Mineral Resources |
122 |
| Table
11-4: Combined Property Mineral Resources |
123 |
| Table
11-5: Drillhole Exclusion for Bullfrog Deposit |
126 |
| Table
11-6: Drillhole Exclusion for Montgomery-Shoshone Deposit |
127 |
| Table
11-7: DOMAIN Codes and Corresponding Grade Shell Triangulations |
129 |
| Table
11-8: Capping Values and Statistics for Gold Assays |
130 |
| Table
11-9: Capping Values and Statistics for Silver Assays |
130 |
| Table
11-10: Block Model Extents |
133 |
FORTE DYNAMICS, INC
120 Commerce Drive., Units 3 & 4, Fort Collins, CO 80524 | P a g e | 6 of 178 | December 2023 |
| | Augusta Gold Corp. |
| Table
11-11: Block Estimation Parameters |
136 |
| Table
11-12: Block Estimation Parameters |
138 |
| Table
11-13: Density Assignments for Mineralized Domains |
139 |
| Table
11-14: Density Assignments for Unmineralized Domains |
139 |
| Table
11-15: Density Assignments for Dump, Fill and Alluvium |
139 |
| Table
11-16: LG Pit Optimization Parameters |
142 |
| Table
23-1: Land Positions of the Bullfrog Project and Adjacent Properties |
151 |
List
Of Figures
| Figure
1-1: Location Map |
10 |
| Figure
1-2: District Geology Map |
11 |
| Figure
3-1: Location Map |
25 |
| Figure
3-2: Property Map of the Bullfrog Project |
50 |
| Figure
4-1: Photo of Bullfrog Hills at Rhyolite |
55 |
| Figure
6-1: Regional Setting of the Bullfrog Mine (Eng et al., 1996) |
59 |
| Figure
6-2: Bullfrog District – Stratigraphy and Mineralization |
61 |
| Figure
6-3: Cross Section of the Bullfrog Project Area |
62 |
| Figure
6-4: District Geology Map — Each Section is 1.6 km, or 1 Mile Square |
69 |
| Figure
7-1: Exploration and Mining Targets at the Bullfrog Project |
74 |
| Figure
7-2: Plan Map of Drill Hole Collars |
80 |
| Figure
7-3: Drilling in the Montgomery-Shoshone Area from the 2020 - 2021 Drill Campaign |
83 |
| Figure
7-4: Drilling in the Bullfrog Area from the 2020 - 2021 Drill Campaign |
83 |
| Figure
8-1: Truck Mounted Core Rig |
98 |
| Figure
8-2: Laydown Yard and Sample Storage |
98 |
| Figure
8-3: Logging Laptop |
99 |
| Figure
8-4: Core Shed and Quick Log Station |
100 |
| Figure
8-5: Logging Facility |
101 |
| Figure
8-6: Core Saw |
102 |
| Figure
8-7: Sampling Tables |
102 |
| Figure
8-8: Core Cutting Facility |
103 |
| Figure
8-9: Sample Pick Up Area |
104 |
| Figure
8-10: Gold Pulp Comparison |
106 |
| Figure
9-1: Check Assay Gold Comparison |
109 |
| Figure
9-2: Check Assay Gold - Percent Difference |
110 |
| Figure
9-3: Silver Check Assay Comparison |
111 |
| Figure
10-1: Leach Test Results |
114 |
| Figure
10-2: Potential Leach Pad Sites & Approximate Capacities |
117 |
| Figure
11-1: Drillhole Collar Locations |
125 |
| Figure
11-2: Grade Shell (DOMAIN) Triangulations |
128 |
| Figure
11-3: Variogram for Bullfrog Low Grade Domain (11) |
131 |
| Figure
11-4: Variogram for Bullfrog High Grade Vein Domain (12) |
131 |
| Figure
11-5: Variogram for Montgomery-Shoshone Low Grade Domain (21) |
132 |
| Figure
11-6: Variogram for Bonanza Low Grade Domain (31) |
132 |
| Figure
11-7: Bullfrog Underground Stope Shapes |
134 |
| Figure
11-8: Bullfrog 8620N Cross-Section Showing Gold Blocks and Composites |
137 |
| Figure
11-9: Oxide and Sulfide Coding – Bullfrog Section 8600N |
138 |
FORTE DYNAMICS, INC
120 Commerce Drive., Units 3 & 4, Fort Collins, CO 80524 | P a g e | 7 of 178 | December 2023 |
| | Augusta Gold Corp. |
| Figure
11-10: Bullfrog Pit Slope Angles and Slope Sector Assignments |
140 |
| Figure
11-11: Bonanza Pit Slope Angles and Slope Sector Assignments |
141 |
| Figure
11-12: Montgomery-Shoshone Pit Slope Angles and Slope Sector Assignments |
141 |
| Figure
11-13: Bullfrog |
143 |
| Figure
11-14: Montgomery-Shoshone |
143 |
| Figure
11-15: Bonanza |
144 |
| Figure
20-1: Land Positions of the Bullfrog Project and Adjacent Properties |
146 |
FORTE DYNAMICS, INC
120 Commerce Drive., Units 3 & 4, Fort Collins, CO 80524 | P a g e | 8 of 178 | December 2023 |
| | Augusta Gold Corp. |
This
report has been updated from the Technical Report Summary submitted on July 14, 2023.
PP11.1
– Added a paragraph to the report describing the cut off grade selection. Added the oxide and sulfide cutoff grades to the
tables.
Break-even
cutoff grades, which consider mining cost and can identify blocks have a positive net value, including mining costs. Mineral resources
are reported at break-even cutoffs of 0.192g/t for oxide-leach and 0.315 g/t for sulfide-leach.
PP9.2
- The qualified person has reviewed these data and believes that they are sufficient and appropriate for use in this report to
determine the mineral resource estimate.
PP10.7
– “The qualified person has reviewed these data and believes that they are sufficient and appropriate for use in this
report to determine the mineral resource estimate.”
PP11.1
– “The comparable pricing for gold of $1,550 compares well with the three-year trailing average of $1,558/oz Au in
June 2021, an accepted method for a mineral resource reporting price. The $20/oz silver price compares to a three-year average
of $19.07 and was typical of other similar reports.”
This
technical report has been prepared for Augusta Gold Corp. (Augusta, Augusta Gold, or the Company) by Forte Dynamics for the Bullfrog
Gold Project (Project, project, or Bullfrog Project) in Nye County, Nevada. This is a Technical Report Summary (TRS) summarizing
an Initial Assessment of Mineral Resources aligned with Securities and Exchange Commission Regulation S-K subpart 1300 (S-K 1300).
This
report was prepared for the purpose of producing an updated mineral resource statement for the project that includes new drilling
information, and geologic modeling associated with the work that was completed through 2021.
New
resource models were completed for the three deposits at Bullfrog (Bullfrog, Montgomery-Shoshone, Bonanza) and mineral resource
estimates were calculated within optimized pit shells for the Bullfrog area, Montgomery-Shoshone area and the Bonanza area. Previously,
resources were reported from earlier models in an August 2021 NI 43-101 technical report.
| 1.1 | Location,
Property Description and Ownership |
The
Company’s wholly owned Bullfrog Gold Project is located in the Bullfrog Hills of Nye County, Nevada and in the southern
half of the Bullfrog Mining District (Figure 1-1). Basic amenities are available in the town of Beatty, which is situated 6.5
km east of the Project. Las Vegas is the largest regional city with full services and is a 260 km drive to the site. Project properties
are located in Sections 25, 26, 35 and 36 of T11S, R46E and Sections 1, 2, 3, 4, 5, 6, 8 9, 10, 11, 12, 13, 14, 15, 16, 17, and
23 of T12S, R46E, Mt. Diablo Meridian. The location of the property is shown in Figure 1-1.
The
Company has four option/lease/purchase agreements in place and has located 61 claims that give it control of 439 unpatented lode
mining claims and mill site claims, and 86 patented. The claims do not have an expiration date, as long as the fees and obligations
are maintained.
FORTE DYNAMICS, INC
120 Commerce Drive., Units 3 & 4, Fort Collins, CO 80524 | P a g e | 9 of 178 | December 2023 |
| | Augusta Gold Corp. |
Figure
1-1: Location Map

| 1.2 | Geology and Mineralization |
The Project is in the southern
Walker Lane trend within brittle upper-plate volcanic host rocks that were severely deformed from dominant detachment faulting
and associated dip-slip and strike-slip displacements. Epithermal solutions permeated the broken host rocks in the Bullfrog Montgomery-Shoshone
(M-S) and Bonanza areas precipitating micron-sized and relatively high-grade gold (Au) within major quartz-calcite veins and disseminated
gold in associated stock-works. The veins contain gangue minerals other than quartz, such as calcite and manganese oxides, the
latter of which contributes associated silver (Ag) recoveries and gold. The district geology map is shown below in Figure 1-2.
FORTE DYNAMICS, INC
120 Commerce Drive., Units 3 & 4, Fort Collins, CO 80524 | P a g e | 10 of 178 | December 2023 |
| | Augusta Gold Corp. |
Figure
1-2: District Geology Map
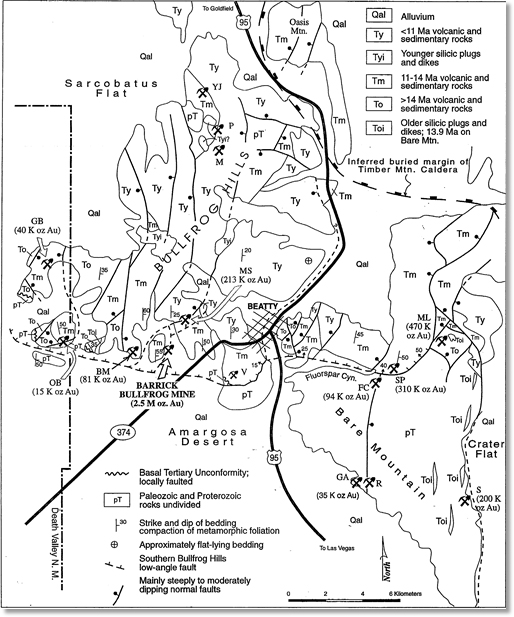
| 1.3 | Exploration,
Drilling, Sampling and QA/QC |
The
Company’s exploration activities to date have focused on the following:
| ● | Exploration
drilling, data acquisition and geologic modeling; |
| ● | Acquiring,
organizing, digitizing and vetting electronic and paper data bases obtained from Barrick mainly related to drill data, metallurgy
and project infrastructure; and |
| ● | Maintaining
and expanding the land holdings. |
FORTE DYNAMICS, INC
120 Commerce Drive., Units 3 & 4, Fort Collins, CO 80524 | P a g e | 11 of 178 | December 2023 |
| | Augusta Gold Corp. |
The
project drilling includes 1,311 holes, for a total of 263,757 meters completed between 1983 and early 2021. The holes were drilled
using both core and reverse circulation methods, as detailed in the drilling section of this report. Table 1-1 summarizes the
project drilling by year.
Table
1-1: Location and Depth of 2020 - 2021 Holes
| Year |
Total Drilling |
Coring |
Reverse Circulation |
| Holes |
Meters |
Holes |
Meters |
Holes |
Meters |
| 1983 |
6 |
975 |
6 |
975 |
0 |
0 |
| 1984 |
37 |
3,560 |
|
0 |
37 |
3,560 |
| 1985 |
3 |
303 |
|
0 |
3 |
303 |
| 1986 |
29 |
3,364 |
|
0 |
29 |
3,364 |
| 1987 |
163 |
29,479 |
3 |
732 |
163 |
28,747 |
| 1988 |
321 |
66,325 |
32 |
6,121 |
321 |
60,204 |
| 1989 |
71 |
12,285 |
|
0 |
71 |
12,285 |
| 1990 |
154 |
37,114 |
33 |
3,676 |
154 |
33,438 |
| 1991 |
79 |
22,954 |
42 |
3,627 |
79 |
19,327 |
| 1992 |
23 |
4,907 |
|
0 |
23 |
4,907 |
| 1993 |
9 |
387 |
|
0 |
9 |
387 |
| 1994 |
210 |
31,362 |
9 |
1,412 |
210 |
29,951 |
| 1995 |
99 |
22,370 |
3 |
248 |
99 |
22,122 |
| 1996 |
58 |
15,254 |
19 |
3,329 |
45 |
11,924 |
| 2020 |
26 |
4,405 |
1 |
502 |
25 |
3,903 |
| 2021 |
43 |
14,820 |
38 |
12,749 |
5 |
2,071 |
| Total |
1,331 |
269,864 |
186 |
33,371 |
1,273 |
236,493 |
A
total of 69 drill holes, 30 reverse circulation (RC) and 39 core holes have been drilled by Augusta from 2020-2021. The purpose
of the drilling was to further define resources and the ultimate limits of the Bullfrog and Montgomery-Shoshone pits and gather
data to support advanced geotechnical and metallurgical studies. The 2020 program also fulfilled a final work commitment for the
Company to purchase a 100% interest in lands under lease from Barrick by mid-September 2020. Two holes were drilled at the Paradise
Ridge target. Section 7 of this report details the results of the 2020 - 2021 drilling program.
FORTE DYNAMICS, INC
120 Commerce Drive., Units 3 & 4, Fort Collins, CO 80524 | P a g e | 12 of 178 | December 2023 |
| | Augusta Gold Corp. |
| 1.3.3.1 | Historic
(1983-1986) |
Historic
drilling and coring information used in this resource estimate was obtained from several drill programs that began in 1983 with
St. Joe Minerals, continued with Bond Gold and Lac Minerals, and ended by Barrick in late 1996. Of 1,262 total holes drilled in
the area, 147 holes included core and 1,243 holes were drilled using reverse circulation methods. Most of the cored holes included
intervals of core plus RC segments. Percent recovery and RQD measurements were made on all core intervals. An assessment was made
of the quality of the orientation data and the core was marked accordingly. The core was then logged, recording lithological,
alteration, mineralization, and structural information including the orientation of faults, fault lineation’s, fractures,
veins, and bedding. With few exceptions, the entire lengths of the holes were sampled. Sample intervals were 5 feet and occasionally
based on the geological logging, separating different lithologies and styles of mineralization and alteration. Samples were marked
and tagged in the core box before being photographed, after which the core was sawed in half, with one half sent for assay and
one half retained for future reference. Each sample interval was bagged separately and shipped to the lab for analysis.
Cuttings
from nearly all reverse circulation drill programs were divided into two streams, one was sampled and the other was disposed during
the reclamation of each drill site. Using a Jones splitter, the sample stream was further divided into two sample bags, one designated
for assaying and the second duplicate designated as a field reject. Samples were collected at five-foot intervals and bagged at
the drill site. Each five-foot sample was sealed at the drill site and not opened until it reached the analytical lab. At each
20-foot rod connection, the hole was blown clean to eliminate material that had fallen into the hole during the connection. The
designated assay samples for each five-foot interval were collected by the site geologist and moved to a secure sample collection
area for shipment to accredited laboratories off site. When duplicate samples were collected, they were retained at the drill
site as a reference sample, if needed. If the duplicate samples were not used, they were blended with site materials during site
reclamation.
| 1.3.3.2 | Augusta
Gold Corp (2020-2021) |
Augusta
Gold Corporation (Augusta Gold) commenced exploration on the Bullfrog Gold Project in 2020, continuing through the second quarter
of 2021. Work performed consisted of oriented diamond core drilling, conventional Reverse Circulation (RC) drilling and reconnaissance
mapping and surface sampling for drill target generation. A digital, Access based database (GeoSpark) has been maintained by Augusta
Gold, including all assays from drill samples and geochemical analysis from surface rock chip samples, completed on the project.
Oriented
diamond core drilling (HQ3) was performed using two track-mounted LF-90 drills and one truck mounted LF-90 drill. Core orientation
was collected using Reflex ACTIII tooling, overseen by staff geologists and verified by a third-party contractor. All drill core
was logged, photographed, split, and sampled on-site.
Conventional
Reverse Circulation drilling was performed using a single Atlas Copco RD 10+, with a hole diameter of 6.75 inches. All RC samples
were logged and sampled on-site. Samples were air dried, sealed in bulk bags on-site. Additionally, surface rock chip samples
were collected during field reconnaissance. These samples were collected, described, and geolocated in the field before being
in sealed rice bags for transport.
FORTE DYNAMICS, INC
120 Commerce Drive., Units 3 & 4, Fort Collins, CO 80524 | P a g e | 13 of 178 | December 2023 |
| | Augusta Gold Corp. |
The
sampling QA/QC program was originally established by St. Joe Minerals. Subsequent owners followed the procedures with any necessary
updates to meet quality assurance standards of the time. The standard practices included the supervision of drilling, logging
of core, as well as in-stream sample submittal for blanks, certified standards, and duplicate testing to ensure laboratory performance.
All assay testing was completed by outside, fully accredited laboratories, such as Skyline, Legend, Iron King, Barringer, American
Assay, Chemex, ALS and Paragon Geochemical. Assay certificates are available and have been electronically scanned to complete
the project drilling database.
| 1.3.5 | Database
Improvements |
During
the later half of 2021, Augusta Gold Corp. staff conducted an in-depth review and update of legacy data in the Bullfrog drilling
database. During the process, previously missing assay information was found on old assay certificates, was verified against drill
logs, and added to the database. Additionally, assay grades were checked throughout the legacy data set and consistent conversions
from imperial to metric grade units were updated where needed. During the process, it was discovered that some series of older
drillholes had improper imperial-metric grade conversions and were subsequently updated, resulting in grade increases for the
majority of affected drillholes. Forte Dynamics requested and received assay certificate and logging data for approximately 10%
of the relevant legacy drillholes in the economically important portions of gold deposits and has verified the accuracy of the
database for those drillholes.
| 1.4 | Mineral
Processing and Metallurgical Testing |
Metallurgical
testing programs that are relevant to the development plans of the Project are summarized below.
In
1986 St. Joe American performed two large column tests on composites of M-S samples and recovered 56% of the gold after 59 days
of leaching material grading 0.034 opt and crushed to -19 mm (-3/4 inch). The other column recovered 49% of the gold after 59
days of leaching minus 304.8 mm (-12-inch) material grading 0.037 opt. Projected 90-day recoveries were 61% and 54% respectively.
Results
from leach tests performed in 1994 by Kappes Cassiday of Reno, Nevada on 250 kg of sub-grade material from the Bullfrog mine are
shown below:
Table
1-2: 1994 Leach Test Results
| |
Bottle |
Column |
Column |
| Size,
mesh, & mm (inch) |
-100
mesh |
-38
mm (-1.5”) |
-9.5
mm (-3/8”) |
| Calc. Head,
opt Au |
0.029 |
0.035 |
0.029 |
| Rec
% |
96.6 |
71.4 |
75.9 |
| Leach
time, days |
2.0 |
41 |
41 |
| NaCN,
kg/t (lb/short ton) |
0.5
(0.1) |
0.385
(0.77) |
5.35
(10.7) |
| Lime,
kg/t (lb/short ton |
1.0
(2.0) |
0.155
(0.31) |
1.75
(0.35) |
FORTE DYNAMICS, INC
120 Commerce Drive., Units 3 & 4, Fort Collins, CO 80524 | P a g e | 14 of 178 | December 2023 |
| | Augusta Gold Corp. |
In
1995 Barrick performed pilot heap leach tests on 765 t (844 short tons) of BF subgrade material and 730 t (805 short tons)
from the M-S pit. Both composites were crushed to 12.7 mm (-1/2 inch). Results are shown in Table 1-3 below.
Table
1-3: 1995 Pilot Heap Leach Test Results
| |
BF
Low-Grade |
M-S
Mineralization |
| Calc. Head,
opt Au |
0.019 |
0.048 |
| Calc. Head,
opt Ag |
0.108 |
0.380 |
| Projected
Au Rec % |
67 |
74 |
| Projected
Ag Rec % |
9 |
32 |
| Leach
Time, days |
41 |
37 |
| NaCN,
kg/t (lb/short ton) |
0.10
(0.20) |
0.125
(0.25) |
| Lime,
kg/t (lb/short ton) |
Nil
(Nil) |
Nil
(Nil) |
In
2018 and 2019, standard column leach tests were performed on materials from the Bullfrog property by McClelland Laboratories,
located in Reno, NV. The sample tested in 2018 was a composite sample created from a bulk sample representing “Brecciated
Vein Ore Type”. Results from the 2018 test work are shown in Table 1-4 below.
Table
1-4: 2018 Column Leach Test Results
| Feed
Size |
Crush
Method |
Test |
Time |
Au
Recovery, % |
| 9.5mm
(3/8”) |
Conventional |
Column |
60
days |
58 |
| 9.5mm
(3/8”) |
Conventional |
Bottle
Roll |
4
days |
59 |
| 1.7mm
(10 mesh) |
HPGR |
Column |
60
days |
77 |
| 1.7mm
(10 mesh) |
HPGR |
Bottle
Roll |
4
days |
70 |
| 150µm |
Conventional/Grind |
Bottle
Roll |
4
days |
89 |
The
2018 column leach test results suggest a crush size dependency where HPGR crushing (high pressure grinding rolls) may have the
potential to significantly improve recovery. The lime requirement for protective alkalinity was low and cyanide consumption was
moderate. The results of the 2019 program are summarized in Table 1-5 below.
FORTE DYNAMICS, INC
120 Commerce Drive., Units 3 & 4, Fort Collins, CO 80524 | P a g e | 15 of 178 | December 2023 |
| | Augusta Gold Corp. |
Table
1-5: 2019 Column Leach Test Results
| Sample |
Feed
Size |
Crush
Method |
Test |
Time |
Au
Rec., % |
| Composite
E |
9.5mm
(3/8”) |
Conventional |
Column |
151
days |
75 |
| Composite
E |
6.3mm
(1/4”) |
HPGR |
Column |
122
days |
77 |
| Composite
E |
1.7mm
(10 mesh) |
HPGR |
Column |
102
days |
89 |
| MS-M-1 |
9.5mm
(3/8”) |
Conventional |
Column |
108
days |
66 |
| MS-M-1 |
6.3mm
(1/4”) |
HPGR |
Column |
108
days |
77 |
| MS-M-1 |
1.7mm
(10 mesh) |
HPGR |
Column |
89
days |
85 |
| MH-M-2 |
9.5mm
(3/8”) |
Conventional |
Column |
109
days |
83 |
| MH-M-2 |
6.3mm
(1/4”) |
HPGR |
Column |
105
days |
88 |
| MH-M-2 |
1.7mm
(10 mesh) |
HPGR |
Column |
86
days |
91 |
In
2020, cyanidation bottle rolls tests were conducted on 14 variability composites from the Bullfrog project. Details of this testing
can be found in Section 10 of this report. The Bullfrog variability composites generally were amenable to agitated cyanidation
treatment at a nominal 1.7 mm feed size. The samples were not crushed with an HPGR. Gold recovery ranged from 38.7% to 86.8% and
averaged 68.0%. Recovery was 58.1% or greater for 12 of the 14 composites. Gold recovery was not correlated to gold head grades
for these 14 composites. Gold recovery consistently decreased with increasing sulfide sulfur content. Results from the bottle
roll test are shown below in Table 1-6.
FORTE DYNAMICS, INC
120 Commerce Drive., Units 3 & 4, Fort Collins, CO 80524 | P a g e | 16 of 178 | December 2023 |
| | Augusta Gold Corp. |
Table
1-6: 2020 Bottle Roll Test Results
| Composite |
Drillhole |
|
REAGENT
REQUIREMENTS |
| Interval
(ft) |
Au
Rec. |
Head
Grade Au
g/tonne |
kg/tonne
mineralized
material |
| From |
To |
% |
Calculated |
Assayed |
NaCN
Cons. |
Lime
Added |
| 4594-001 |
BM-20-1 |
0 |
40 |
67.8 |
0.59 |
0.80 |
0.15 |
1.1 |
| 4594-002 |
BM-50-1 |
40 |
75 |
67.2 |
0.58 |
0.50 |
0.11 |
1.2 |
| 4594-003 |
BM-20-4 |
280 |
335 |
44.4 |
0.27 |
0.26 |
0.12 |
1.7 |
| 4594-004 |
BM-20-4 |
335 |
390 |
38.7 |
0.31 |
0.30 |
0.17 |
1.5 |
| 4594-005 |
BM-20-6 |
295 |
395 |
66.7 |
0.27 |
0.29 |
0.11 |
1.4 |
| 4594-006 |
BM-20-6 |
395 |
485 |
58.5 |
1.06 |
0.86 |
0.11 |
1.6 |
| 4594-007 |
BM-20-11 |
95 |
185 |
72.7 |
0.22 |
0.18 |
<0.07 |
1.1 |
| 4594-008 |
BM-20-14 |
0 |
45 |
58.1 |
0.31 |
0.27 |
<0.07 |
1.8 |
| 4594-009 |
BM-20-14 |
90 |
135 |
80.0 |
0.15 |
0.13 |
0.14 |
1.5 |
| 4594-010 |
BM-20-14 |
170 |
235 |
84.2 |
0.19 |
0.21 |
0.14 |
1.2 |
| 4594-011 |
BM-20-14 |
235 |
260 |
86.8 |
0.53 |
0.57 |
0.09 |
1.2 |
| 4594-012 |
BM-20-15 |
35 |
130 |
72.3 |
0.47 |
0.46 |
0.17 |
1.4 |
| 4594-013 |
BM-20-19 |
0 |
115 |
73.3 |
0.30 |
0.27 |
0.08 |
1.4 |
| 4594-014 |
BM-20-22 |
305 |
385 |
81.0 |
0.63 |
0.67 |
0.09 |
1.6 |
| 1.5 | Mineral
Resource Estimates |
Mineral
resources were updated based on technical information as of December 31, 2021, by Forte Dynamics for the Bullfrog project. The
update utilizes all new drilling through the end of 2021 in addition to updated geologic models and database improvements by Augusta
Gold Corp. staff. Three-dimensional block models for each area (Bullfrog, Montgomery-Shoshone and Bonanza) were created using
Vulcan software. Surfaces and solids representing topography, overburden, geologic units, historic stope shapes and gold mineralization
were incorporated into the resource models. Resource estimates utilize drill hole, survey, analytical and bulk density information
provided by the project personnel. Gold and silver values have been given null values for all material that has been historically
mined by both open pit and underground methods. Bulk density has been adjusted for backfill material placed in the historical
open pit and underground operations.
Mineral
resources are pit constrained using reasonable cost assumptions, however detailed costing and economic evaluations have not been
performed. The resources only consider mining mineralization and waste that will take place on lands controlled by Augusta Gold
Corp. Pit slope parameters are based on the existing pit wall angles and vary by geology, depth and lateral extent. Different
metallurgical recoveries were assigned to oxide and sulphide material and used in the calculation of the optimized pit shells.
Mineral
resources are reported inside optimized pit shells with Minemax software using high-level economic assumptions, geotechnical pit
slope parameters and property boundaries. Estimated mineral resources for the Bullfrog Project are being reported for the Bullfrog,
Montgomery-Shoshone and Bonanza areas, respectively.
FORTE DYNAMICS, INC
120 Commerce Drive., Units 3 & 4, Fort Collins, CO 80524 | P a g e | 17 of 178 | December 2023 |
| | Augusta Gold Corp. |
Table
1-7: Bullfrog Mineral Resources
| Mineral
Resources as of December 31, 2021 - Bullfrog |
Redox/
Cutoff
|
Classification |
Tonnes
(Mt) |
Au
grade
(g/t) |
Ag
grade
(g/t) |
Au
Contained
(koz) |
Ag
Contained
(koz) |
Oxide/
0.192
g/t
|
Measured |
24.50 |
0.537 |
1.28 |
422.77 |
1,010.02 |
| Indicated |
36.32 |
0.515 |
1.14 |
602.02 |
1,332.18 |
| Measured
and Indicated |
60.82 |
0.524 |
1.20 |
1,024.79 |
2,342.20 |
| Inferred |
14.40 |
0.460 |
0.77 |
213.06 |
358.49 |
| |
Sulfide/
0.315g/t
|
Measured |
1.30 |
0.710 |
1.28 |
29.77 |
53.52 |
| Indicated |
1.99 |
0.625 |
1.32 |
39.94 |
84.47 |
| Measured
and Indicated |
3.29 |
0.659 |
1.30 |
69.72 |
137.99 |
| Inferred |
1.05 |
0.657 |
1.14 |
22.14 |
38.53 |
| |
|
|
|
|
|
|
Total
-
Oxide
and
Sulfide |
Measured |
25.80 |
0.545 |
1.28 |
452.55 |
1,063.54 |
| Indicated |
38.31 |
0.521 |
1.15 |
641.96 |
1,416.65 |
| Measured
and Indicated |
64.12 |
0.531 |
1.20 |
1,094.51 |
2,480.19 |
| Inferred |
15.44 |
0.474 |
0.80 |
235.20 |
397.02 |
Notes:
| 1. | Oxide
estimated Mineral Resources are reported within a pit shell using the Lerch Grossman
algorithm, a gold price of US$1,550/oz and a recovery of 82% for Au and silver price
of US$20/oz and a recovery of 20% For Ag. |
| 2. | Sulphide
estimated Mineral Resources are reported within a pit shell using the Lerch Grossman
algorithm, a gold price of US$1,550/oz and a recovery of 50% for Au and silver price
of US$20/oz and a recovery of 12% for Ag. |
| 3. | Mining
costs for mineralized material and waste are US$2.25/tonne. |
| 4. | Processing,
general and administration, and refining costs are US$5.00/tonne, US$0.50/tonne, and
US$0.05/tonne respectively. |
| 5. | Due
to rounding, some columns or rows may not compute as shown. |
| 6. | Estimated
Mineral Resources are stated as in situ dry metric tonnes. |
| 7. | The
estimate of Mineral Resources may be materially affected by legal, title, taxation, socio-political,
marketing, or other relevant issues. |
FORTE DYNAMICS, INC
120 Commerce Drive., Units 3 & 4, Fort Collins, CO 80524 | P a g e | 18 of 178 | December 2023 |
| | Augusta Gold Corp. |
Table
1-8: Montgomery-Shoshone Mineral Resources
| Mineral
Resources as of December 31, 2021 - Montgomery-Shoshone |
Redox/
Cutoff |
Classification |
Tonnes
(Mt) |
Au
grade
(g/t) |
Ag
grade
(g/t) |
Au
Contained
(koz) |
Ag
Contained
(koz) |
Oxide/
0.192
g/t
|
Measured |
1.97 |
0.637 |
3.35 |
40.35 |
212.12 |
| Indicated |
1.35 |
0.555 |
2.85 |
24.04 |
123.66 |
| Measured
and Indicated |
3.32 |
0.603 |
3.15 |
64.38 |
335.78 |
| Inferred |
1.05 |
0.586 |
3.45 |
19.76 |
116.41 |
Notes:
| 1. | Oxide
estimated Mineral Resources are reported within a pit shell using the Lerch Grossman
algorithm, a gold price of US$1,550/oz and a recovery of 82% for Au and silver price
of US$20/oz and a recovery of 20% For Ag. |
| 2. | Sulphide
estimated Mineral Resources are reported within a pit shell using the Lerch Grossman
algorithm, a gold price of US$1,550/oz and a recovery of 50% for Au and silver price
of US$20/oz and a recovery of 12% for Ag. No sulphide material was reported for Montgomery-Shoshone. |
| 3. | Mining
costs for mineralized material and waste are US$2.25/tonne. |
| 4. | Processing,
general and administration, and refining costs are US$5.00/tonne, US$0.50/tonne, and
US$0.05/tonne respectively. |
| 5. | Due
to rounding, some columns or rows may not compute as shown. |
| 6. | Estimated
Mineral Resources are stated as in situ dry metric tonnes. |
| 7. | The
estimate of Mineral Resources may be materially affected by legal, title, taxation, socio-political,
marketing, or other relevant issues. |
Table
1-9: Bonanza Mineral Resources
| Mineral
Resources as of December 31, 2021 - Bonanza |
Redox/
Cutoff |
Classification |
Tonnes
(Mt) |
Au
grade
(g/t) |
Ag
grade
(g/t) |
Au
Contained
(koz) |
Ag
Contained
(koz) |
Oxide/
0.192
g/t
|
Measured |
2.35 |
0.446 |
0.44 |
33.78 |
33.48 |
| Indicated |
1.22 |
0.422 |
0.44 |
16.61 |
17.17 |
| Measured
and Indicated |
3.58 |
0.438 |
0.44 |
50.40 |
50.65 |
| Inferred |
0.19 |
0.473 |
0.37 |
2.94 |
2.28 |
Notes:
| 1. | Oxide
estimated Mineral Resources are reported within a pit shell using the Lerch Grossman
algorithm, a gold price of US$1,550/oz and a recovery of 82% for Au and silver price
of US$20/oz and a recovery of 20% For Ag. |
| 2. | Sulphide
estimated Mineral Resources are reported within a pit shell using the Lerch Grossman
algorithm, a gold price of US$1,550/oz and a recovery of 50% for Au and silver price
of US$20/oz and a recovery of 12% for Ag. No sulphide material was reported for Bonanza. |
| 3. | Mining
costs for mineralized material and waste are US$2.25/tonne. |
| 4. | Processing,
general and administration, and refining costs are US$5.00/tonne, US$0.50/tonne, and
US$0.05/tonne respectively. |
| 5. | Due
to rounding, some columns or rows may not compute as shown. |
| 6. | Estimated
Mineral Resources are stated as in situ dry metric tonnes. |
| 7. | The
estimate of Mineral Resources may be materially affected by legal, title, taxation, socio-political,
marketing, or other relevant issues. |
FORTE DYNAMICS, INC
120 Commerce Drive., Units 3 & 4, Fort Collins, CO 80524 | P a g e | 19 of 178 | December 2023 |
| | Augusta Gold Corp. |
Table
1-10: Combined Mineral Resources
| |
Combined
Global Resources as of December 31, 2021 - Oxide and Sulphide |
| |
Classification |
Tonnes
(Mt) |
Au
grade
(g/t) |
Ag
grade
(g/t) |
Au
Contained
(koz) |
Ag
Contained
(koz) |
| |
Measured |
30.13 |
0.544 |
1.35 |
526.68 |
1,309.13 |
| |
Indicated |
40.88 |
0.519 |
1.18 |
682.61 |
1,557.49 |
| |
Measured
and Indicated |
71.01 |
0.530 |
1.26 |
1,209.29 |
2,866.62 |
| |
Inferred |
16.69 |
0.481 |
0.96 |
257.90 |
515.72 |
Notes:
| 1. | Oxide
estimated Mineral Resources are reported within a pit shell using the Lerch Grossman
algorithm, a gold price of US$1,550/oz and a recovery of 82% for Au and silver price
of US$20/oz and a recovery of 20% For Ag. |
| 2. | Sulphide
estimated Mineral Resources are reported within a pit shell using the Lerch Grossman
algorithm, a gold price of US$1,550/oz and a recovery of 50% for Au and silver price
of US$20/oz and a recovery of 12% for Ag. No sulphide material was reported for Montgomery-Shoshone
or Bonanza. |
| 3. | Mining
costs for mineralized material and waste are US$2.25/tonne. |
| 4. | Processing,
general and administration, and refining costs are US$5.00/tonne, US$0.50/tonne, and
US$0.05/tonne respectively. |
| 5. | Due
to rounding, some columns or rows may not compute as shown. |
| 6. | Estimated
Mineral Resources are stated as in situ dry metric tonnes. |
| 7. | The
estimate of Mineral Resources may be materially affected by legal, title, taxation, socio-political,
marketing, or other relevant issues. |
Combined
Mineral Resources presented in this report have increased over those reported in the June 2021 Bullfrog NI 43-101 technical report.
Measured and Indicated Resources increased by 18.7 million tonnes, 329,500 gold ounces, and 476,000 silver ounces. Inferred Resources
increased by 7.6 million tonnes, 127,900 gold ounces, and 272,200 silver ounces. The changes are primarily due to new drilling,
database improvements, and the updated geological controls that have led to greater continuity of higher-grade material in lower
portions of the Bullfrog pit resulting in a more robust pit optimization.
This
report is based on all technical and scientific data as of December 31, 2021, the effective date of this report. Mineral resources
are considered by the QP to meet the reasonable prospects of eventual economic extraction. Analytical data has been collected
and analyzed using industry standard methods at the time they were collected. Geologic data has been interpreted and modeled using
historic maps, reports, field mapping, drillhole logging and three-dimensional computer modeling. Resource block models were developed
using the geologic and analytical data to best represent the mineralization within each of the areas and accounts for historic
mining of the resource by open pit and underground methods. Lerch-Grossman optimized pit shells have been generated for each area
using representative costs, metal recoveries and slope angles and resources have been summarized within those pit shells.
| 1.6.1 | Geology
and Mineral Resources |
| ● | The
exploration potential within the district is high and recent drilling has shown that
mineralized structures and features continue both laterally and vertically along the
known mineralized trends in and near all three major areas. Specific areas for additional
exploration drilling and interpretation include Ladd Mountain and Mystery Hills near
the Bullfrog pit; the Polaris vein and related disseminated mineralization near the Montgomery-Shoshone
pit; along strike and beneath Bonanza Mountain near the Bonanza pit; and in the structurally
prospective Gap area in the northern portion of the property. |
FORTE DYNAMICS, INC
120 Commerce Drive., Units 3 & 4, Fort Collins, CO 80524 | P a g e | 20 of 178 | December 2023 |
| | Augusta Gold Corp. |
| ● | Considerable
effort has been placed on verifying historic assays and surveys by checking against historic
drill logs and assay certificates. The database has been updated to include additional
assay certificate data that was recently discovered. Problems with imperial-metric grade
conversions in a porting of the legacy data have been corrected. |
| ● | Forte
Dynamics completed a review of the drilling database for Bullfrog and has verified assay
data against lab certificates for approximately 10% of drillholes in the economically
important portions of the deposits. |
| ● | The
recent assay data has been collected in a manner appropriate for the deposit type and
mineralization style. Assay QA/QC analyses have been taken to ensure that assays are
of a quality suitable for the estimation of mineral resources. |
| ● | The
level of understanding of the geology is very good. A district wide geologic model has
been constructed using historic maps, geology reports and field mapping. Drillhole logs
are used in the interpretation, when possible, but more effort should be placed on utilizing
the downhole logging data to help refine the geologic models. |
| ● | Drillholes
excluded from resource estimation have been reviewed and the list has been updated. Some
holes now have assay data and have been removed from the exclusion list. A few additional
RC drillholes with downhole contamination have been added to the exclusion list. Location
and downhole survey issues for a few holes have also been identified. |
| ● | Historical
production data, blastholes, pit maps, underground maps, stope surveys should be extracted
from the historical archives and digitized into a format that can aid in the interpretation
of the geologic model and resource block model. The historic data can be used to calibrate
the resource model and provide a validation check. |
| ● | The
treatment of outlier assays in the database is appropriate and reasonable. The block
grade interpretations have been carried out using conventional methods consistent with
common industry practice. |
| ● | Block
model grades have been zeroed out in areas of historic underground and open pit mining.
Block model grades were also zeroed out within geologic units known to be barren. Backfilled
areas within the open pit and underground mines have been accounted for in the volume
and tonnage to be mined. |
| ● | Mining
and processing costs based on similar Nevada operations have been applied in the pit
optimization. The existing pit walls remain very stable with steep overall slope angles
on a majority of the pit walls. The existing wall angles have been measured and applied
in the pit optimization. |
| 1.6.2 | Metallurgical
Test Work and Mineral Processing |
Metallurgical
testing performed to date indicates reasonable gold recovery at small particle sizes. The column leach tests on HPGR fine crushed
materials suggest gold recovery could exceed 85% on 10 mesh material; however, further testing is required to properly characterize
the recovery potential for each mineralized zone.
The
metallurgical test program should be comprehensive, and include the following (at a minimum):
| ● | Full
characterization of composite samples – Au/Ag content, carbon and sulfur speciation,
typical Geochem including Hg, solids specific gravity |
| ● | Crushing
work index testing |
FORTE DYNAMICS, INC
120 Commerce Drive., Units 3 & 4, Fort Collins, CO 80524 | P a g e | 21 of 178 | December 2023 |
| | Augusta Gold Corp. |
| ● | Column
leach testing at various HPGR crush sizes, including comparative bottle roll tests and
size fraction recovery analysis |
| ● | Compacted
permeability testing |
| ● | Any
required environmental tests on column test residues measured |
| ● | The
project is in a jurisdiction that is amenable to mining. |
| ● | The
project site is near the town of Beatty, Nevada which has adequate amenities and services. |
| ● | The
project was open pit and underground mined from 1989-1999 and has remaining infrastructure
that includes power lines on site, a paved highway to site and a network of roads across
the district. |
| ● | Availability
of adequate power through the local utility, as well as available water and water rights
to support operations require further evaluation. |
The
current estimation of mineral resources indicate the potential for further work to advance the project to a Preliminary Economic
Assessment (PEA).
Additional
exploration drilling and delineation drilling should be carried out to expand the resource base and to further refine the geologic
models and resource block models.
Metallurgical
testing performed to date indicates gold recovery is reasonable at small particle sizes. The column leach tests on HPGR fine crushed
materials suggest gold recovery could exceed 85% on 10 mesh material; however, further testing is required to properly characterize
the recovery potential for each mineralized zone.
Baseline
study work across a range of activities can be started to support permitting activities for future study stages.
FORTE DYNAMICS, INC
120 Commerce Drive., Units 3 & 4, Fort Collins, CO 80524 | P a g e | 22 of 178 | December 2023 |
| | Augusta Gold Corp. |
This
report has been prepared for Augusta Gold Corp. for the Bullfrog Gold Project in Nevada with the purpose of updating and reporting
mineral resources utilizing the most recent drilling and geologic models. The drillhole and geologic information has been used
to generate a three-dimensional block model of the mineralized areas and optimized pit shells have been developed from those block
models to report mineral resources.
Technical
information, including locations, orientations, mapping, and analytical data has been supplied by Augusta Gold Corp. Information
pertaining to title, environment, permitting and access has also been supplied by Augusta Gold Corp. Introductory summaries pertaining
to infrastructure, location, geology, and mineralization have been primarily sourced from the historical reports from past producers
and by Augusta Gold Corp.
The
project site was inspected by Forte on December 14, 2021.
All
references to dollars in this report are to U.S. dollars (US$) unless otherwise noted. Distances, areas, volumes, and masses are
expressed in the metric system unless indicated otherwise. Historic data is expressed in English units, such as feet and tons.
For
the purpose of this report, common measurements are given in metric units. All tonnages shown are in Tonnes (t) of 1,000 kilograms,
and precious metal grade values are given in grams per tonne (g/t), precious metal quantity values are given in troy ounces (toz).
To convert to English units, the following factors should be used:
| ● | 1
short ton = 0.907 tonne (T) |
| ● | 1
troy ounce = 31.1035 grams (g) |
| ● | 1
troy ounce/short ton = 34.286 grams per tonne (g/t) |
| ● | 1
foot = 30.48 centimeters (cm) = 0.3048 meters (m) |
| ● | 1
mile = 1.61 kilometer (km) |
| ● | 1
acre = 0.405 hectare (ha) |
FORTE DYNAMICS, INC
120 Commerce Drive., Units 3 & 4, Fort Collins, CO 80524 | P a g e | 23 of 178 | December 2023 |
| | Augusta Gold Corp. |
The
following is a list of the abbreviations used in this report:
| Abbreviation |
Unit
or Term |
| 2D |
two-dimensional |
| 3D |
three-dimensional |
| Ag |
silver |
| Au |
gold |
| cm |
centimeter |
| cm3 |
cubic centimeters |
| g |
gram |
| g/t |
grams per tonne |
| g/cm3 |
grams per cubic centimeter |
| ha |
hectare |
| kg |
kilogram |
| km |
kilometer |
| km2 |
square kilometers |
| km/h |
kilometers per hour |
| kw-h |
kilowatt per hour |
| m |
meter |
| M |
million |
| Mm |
millimeter |
| mm/yr |
millimeters per year |
| Mya |
million years before present |
| NDEP |
Nevada Department of Environmental Projection |
| NI 43-101 |
Canadian Securities Administrators’ National
Instrument 43-101 |
| NSR |
Net Smelting Return |
| Pb |
lead |
| PEA |
Preliminary Economic Assessment |
| ppm |
parts per million |
| QA/QC |
quality assurance/quality control |
| T |
metric ton |
| toz |
Troy ounces |
| T/d |
Tonnes per day |
| US$ |
United States dollars |
| 2.3 | Qualified
Persons and Details of Inspection |
Forte
is acting as a Qualified Person firm consisting of mining experts to prepare the report. Below is a list of details of the QPs
inspection of the property.
A
Forte QP conducted a site visit of the property on December 14, 2021, where he was able to review infrastructure, existing pits,
waste dumps, roads, and the observable geologic features of the site. The exploration program had been completed earlier so logging
and sample preparation were not directly reviewed, although the sampling and logging procedures were reviewed. The Forte team
did receive a thorough geologic review of the site by the project geologist.
Information
contained in the report is current as of December 31, 2021.
The
reports and documents listed in Chapter 24 and Chapter 25 of this Report were used to support Report preparation.
Augusta
Gold has not previously filed a technical report summary on the Project.
FORTE DYNAMICS, INC
120 Commerce Drive., Units 3 & 4, Fort Collins, CO 80524 | P a g e | 24 of 178 | December 2023 |
| | Augusta Gold Corp. |
The
Project is located in the Bullfrog Hills of Nye County, Nevada (Figure 3-1). Bullfrog Mine’s property covers approximately
3,157 hectares of patented and unpatented lode mining claims in Sections 25, 26, 35 and 36 of T11S, R46E and Sections 1, 2, 3,
4, 5, 6, 8, 9, 10, 11, 12, 14, 15, 16, 17, and 23 of T12S, R46E, Mt. Diablo Meridian. The Project is accessible via a 2¼
hour (260 km) drive north of Las Vegas, Nevada along US Highway 95. Las Vegas is serviced by a major international airport and
is the closest major hub for providing equipment, supplies, services, and other support to the Project. The Project lies 4 miles
west of the Town of Beatty, Nevada, which has a population of approximately 1,000 and contains most basic services, including
motels, gasoline stations, schools, and a variety of stores and services. Access around the Project is provided by a series of
reasonably good gravel roads that extend to the existing mines and important exploration areas.
Figure
3-1: Location Map
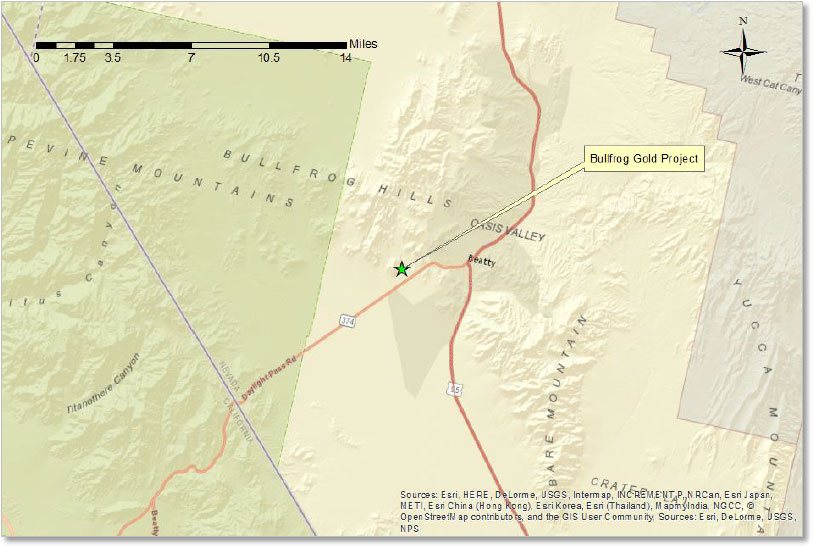
Augusta
Gold has four option/lease/purchase agreements in place and has located 61 claims that give it control of 439 unpatented lode
mining claims and mill site claims, and 86 patented. These lands are listed in Table 3-1. A property map with the locations shown
in detail can be seen in Figure 3-2. The claims do not have an expiration date, as long as the fees and obligations are maintained.
FORTE DYNAMICS, INC
120 Commerce Drive., Units 3 & 4, Fort Collins, CO 80524 | P a g e | 25 of 178 | December 2023 |
| | Augusta Gold Corp. |
Table
3-1: Lands Under the Control of Augusta Gold Corp.
| Augusta
Gold Corp. Patented Claims |
| Standard
Gold |
| Patent
Name |
Mineral
Survey No. |
| Providence |
2470 |
| Aurium |
2654 |
| Augusta
Gold Corp. Patented Claims |
| Mojave
Gold Mining |
| Patent
Name |
Mineral
Survey No. |
| Polaris
Fraction |
2426 |
| Inaugural
Fraction |
2426 |
| Three
Peaches |
2426 |
| Little
Fraction |
2471A |
| Indian
Johnnie |
2471A |
| Shoshone |
2471A |
| Del
Monte Fraction |
2501A |
| Shoshone
Two |
2471A |
| Shoshone
Three |
2471A |
| Oro
Grande |
2470 |
| Shoshone
Extension |
2470 |
| Greenhorn |
2470 |
FORTE DYNAMICS, INC
120 Commerce Drive., Units 3 & 4, Fort Collins, CO 80524 | P a g e | 26 of 178 | December 2023 |
| | Augusta Gold Corp. |
| Augusta
Gold Corp. Patented Claims |
| Brown
Claims |
| Patent
Name |
Mineral
Survey No. |
| Crystal |
2418 |
| Oliver |
2340 |
| Augusta
Gold Corp. Patented Claims |
| Lunar
Landing Claims |
| Patent
Name |
Mineral
Survey No. |
| Elkhorn |
2736 |
| Red
Bluff |
2540 |
| Black
Bull |
2425 |
| Bell
Boy Fraction |
2425 |
| South
Fraction |
2425 |
| Lookout |
2461 |
| Molly
Gibson #1 |
3043 |
| Molly
Gibson # 2 |
3043 |
| Molly
Gibson #3 |
3043 |
| Molly
Gibson #4 |
3043 |
| Molly
Gibson #5 |
3043 |
| Rand |
2784 |
| Rand
#1 |
2784 |
| Rand
#2 |
2784 |
| Rand
#3 |
2784
|
| Rand
Fraction |
2784 |
| Early
Bird |
2491 |
FORTE DYNAMICS, INC
120 Commerce Drive., Units 3 & 4, Fort Collins, CO 80524 | P a g e | 27 of 178 | December 2023 |
| | Augusta Gold Corp. |
| Augusta
Gold Corp. Patented Claims |
| Lunar
Landing Claims |
| Patent
Name |
Mineral
Survey No. |
| Unexpected |
2735 |
| Scorpion |
2411 |
| St.
Anthony |
2734 |
| Eva
Bell |
2576 |
| Gem
Fraction |
2377 |
| Quartzsite
Fraction |
2422 |
| Annex |
2715 |
| Augusta
Gold Corp. Unpatented Claims |
| Claim
Name |
BLM
Serial Number |
| BFGC
1 |
NMC1147851 |
| BFGC
2 |
NMC1147852 |
| BFGC
3 |
NMC1147853 |
| BFGC
4 |
NMC1147854 |
| BFGC
5 |
NMC1147855 |
| BFGC
6 |
NMC1147856 |
| BFGC
8 |
NMC1147857 |
| BFGC
9 |
NMC1147858 |
| BFGC
10 |
NMC1147859 |
| BFGC
11 |
NMC1147860 |
| BFGC
12 |
NMC1147861 |
| BFGC
13 |
NMC1147862 |
| BFGC
14 |
NMC1147863 |
FORTE DYNAMICS, INC
120 Commerce Drive., Units 3 & 4, Fort Collins, CO 80524 | P a g e | 28 of 178 | December 2023 |
| | Augusta Gold Corp. |
| Augusta
Gold Corp. Unpatented Claims |
| Claim
Name |
BLM
Serial Number |
| BFGC
15 |
NMC1147864 |
| BFGC
16 |
NMC1147865 |
| BFGC
17 |
NMC1147866 |
| BFGC
18 |
NMC1147867 |
| BFGC
19 |
NMC1147868 |
| BFGC
20 |
NMC1147869 |
| BFGC
21 |
NMC1147870 |
| BFGC
22 |
NMC1147871 |
| BFGC
23 |
NMC1147872 |
| BFGC
24 |
NMC1147873 |
| BFGC
25 |
NMC1147874 |
| BFGC
26 |
NMC1147875 |
| BFGC
27 |
NMC1147876 |
| BFGC
28 |
NMC1147877 |
| BFGC
29 |
NMC1147878 |
| BFGC
30 |
NMC1147879 |
| BFGC
31 |
NMC1147880 |
| BFGC
32 |
NMC1147881 |
| BFGC
33 |
NMC1147882 |
| BFGC
34 |
NMC1147883 |
| BFGC
35 |
NMC1147884 |
| BFGC
36 |
NMC1147885 |
| BFGC
37 |
NMC1147886 |
| BFGC
38 |
NMC1147887 |
FORTE DYNAMICS, INC
120 Commerce Drive., Units 3 & 4, Fort Collins, CO 80524 | P a g e | 29 of 178 | December 2023 |
| | Augusta Gold Corp. |
| Augusta
Gold Corp. Unpatented Claims |
| Claim
Name |
BLM
Serial Number |
| BFGC
39 |
NMC1147888 |
| BFGC
40 |
NMC1147889 |
| BFGC
41 |
NMC1147890 |
| BFGC
42 |
NMC1147891 |
| BFGC
43 |
NMC1147892 |
| BFGC
44 |
NMC1147893 |
| BFGC
45 |
NMC1147894 |
| BFGC
46 |
NMC1147895 |
| BFGC
47 |
NMC1147896 |
| BFGC
48 |
NMC1147897 |
| BFGC
49 |
NMC1147898 |
| BFGC
50 |
NMC1147899 |
| BFGC
51 |
NMC1147900 |
| BFGC
52 |
NMC1147901 |
| BFGC
53 |
NMC1147902 |
| BFGC
54 |
NMC1147903 |
| BFGC
55 |
NMC1147904 |
| BFGC
56 |
NMC1147905 |
| BFGC
57 |
NMC1147906 |
| BFGC
58 |
NMC1147907 |
| BFGC
59 |
NMC1147908 |
| BFGC
60 |
NMC1147909 |
| BFGC
61 |
NMC1147910 |
| BFGC
62 |
NMC1147911 |
FORTE DYNAMICS, INC
120 Commerce Drive., Units 3 & 4, Fort Collins, CO 80524 | P a g e | 30 of 178 | December 2023 |
| | Augusta Gold Corp. |
| Augusta
Gold Corp. Unpatented Claims |
| Claim
Name |
BLM
Serial Number |
| BFGC
7 |
NMC1154057 |
| BFGC
63 |
NMC1154058 |
| BFGC
64 |
NMC1154059 |
| BFGC
65 |
NMC1154060 |
| BFGC
66 |
NMC1154061 |
| BFGC
67 |
NMC1154062 |
| BFGC
68 |
NMC1154063 |
| BFGC
69 |
NMC1154064 |
| BFGC
70 |
NMC1154065 |
| BFGC
71 |
NMC1154066 |
| BFGC
72 |
NMC1154067 |
| BFGC
73 |
NMC1154068 |
| BFGC
74 |
NMC1154069 |
| BFGC
75 |
NMC1154070 |
| BFGC
76 |
NMC1154071 |
| BFGC
77 |
NMC1154072 |
| BFGC
78 |
NMC1154073 |
| BFGC
79 |
NMC1154074 |
| BFGC
80 |
NMC1154075 |
| BFGC
81 |
NMC1154076 |
| BFGC
82 |
NMC1154077 |
| BFGC
83 |
NMC1154078 |
| BFGC
84 |
NMC1154079 |
| BFGC
85 |
NMC1154080 |
FORTE DYNAMICS, INC
120 Commerce Drive., Units 3 & 4, Fort Collins, CO 80524 | P a g e | 31 of 178 | December 2023 |
| | Augusta Gold Corp. |
| Augusta
Gold Corp. Unpatented Claims |
| Claim
Name |
BLM
Serial Number |
| BFGC
86 |
NMC1154081 |
| BFGC
87 |
NMC1154082 |
| BFGC
88 |
NMC1154083 |
| BFGC
89 |
NMC1177609 |
| BFGC
90 |
NMC1177610 |
| BFGC
91 |
NMC1177611 |
| BFGC
92 |
NMC1177612 |
| BFGC
93 |
NMC1177613 |
| BFGC
94 |
NMC1177614 |
| BFGC
95 |
NMC1177615 |
| BFGC
96 |
NMC1177616 |
| BFGC
97 |
NMC1177617 |
| BFGC
98 |
NMC1177618 |
| BFGC
99 |
NMC1177619 |
| BFGC
100 |
NMC1177620 |
| BFGC
101 |
NMC1177621 |
| BFGC
102 |
NMC1177622 |
| BFGC
103 |
NMC1177623 |
| BFGC
104 |
NMC1177624 |
| BFGC
105 |
NMC1177625 |
| BFGC
106 |
NMC1177626 |
| BFGC
107 |
NMC1177627 |
| BFGC
108 |
NMC1177628 |
| BFGC
109 |
NMC1177629 |
FORTE DYNAMICS, INC
120 Commerce Drive., Units 3 & 4, Fort Collins, CO 80524 | P a g e | 32 of 178 | December 2023 |
| | Augusta Gold Corp. |
| Augusta
Gold Corp. Unpatented Claims |
| Claim
Name |
BLM
Serial Number |
| BFGC
110 |
NMC1177630 |
| BFGC
111 |
NMC1177631 |
| BFGC
112 |
NMC1185280 |
| BFGC
113 |
NMC1185281 |
| BFGC
114 |
NMC1185282 |
| BFGC
115 |
NMC1185283 |
| BFGC
116 |
NMC1185284 |
| BFGC
117 |
NMC1185285 |
| BFGC
118 |
NMC1185286 |
| BFGC
119 |
NMC1185287 |
| BFGC
120 |
NMC1185288 |
| BFGC
121 |
NMC1185289 |
| BFGC
122 |
NMC1185290 |
| BFGC
123 |
NMC1185291 |
| BFGC
124 |
NMC1185292 |
| BFGC
125 |
NMC1185293 |
| BFGC
126 |
NMC1185294 |
| BFGC
127 |
NMC1185295 |
| BFGC
128 |
NMC1185296 |
| BFGC
129 |
NMC1185297 |
| BFGC
130 |
NMC1185298 |
| BFGC
131 |
NMC1185299 |
| BFGC
132 |
NMC1185300 |
| BFGC
133 |
NMC1185301 |
FORTE DYNAMICS, INC
120 Commerce Drive., Units 3 & 4, Fort Collins, CO 80524 | P a g e | 33 of 178 | December 2023 |
| | Augusta Gold Corp. |
| Augusta
Gold Corp. Unpatented Claims |
| Claim
Name |
BLM
Serial Number |
| BFGC
134 |
NMC1185302 |
| BEATTY
CON # 1 |
NMC109662 |
| LUCKY
QUEEN |
NMC109667 |
| BC
# 8 BABINGTON |
NMC109697 |
| BC
# 9 CORNELL |
NMC109698 |
| BC
# 10 FLIN FLON 2 |
NMC109699 |
| BVD
6 |
NMC987963 |
| BVD
5 |
NMC987964 |
| BVD
324 |
NMC987965 |
| BVD
323 |
NMC987966 |
| BVD
322 |
NMC987967 |
| BVD
321 |
NMC987968 |
| BVD
317 |
NMC987969 |
| BVD
316 |
NMC987970 |
| BVD
315 |
NMC987971 |
| BVD
314 |
NMC987972 |
| BVD
303 |
NMC987973 |
| BVD
302 |
NMC987974 |
| BVD
301 |
NMC987975 |
| BVD
300 |
NMC987976 |
| BVD
207 |
NMC987977 |
| BVD
206 |
NMC987978 |
| BVD
205 |
NMC987979 |
| BVD
204 |
NMC987980 |
FORTE DYNAMICS, INC
120 Commerce Drive., Units 3 & 4, Fort Collins, CO 80524 | P a g e | 34 of 178 | December 2023 |
| | Augusta Gold Corp. |
| Augusta
Gold Corp. Unpatented Claims |
| Claim
Name |
BLM
Serial Number |
| BVD
203 |
NMC987981 |
| BVD
202 |
NMC987982 |
| BVD
201 |
NMC987983 |
| BVD
200 |
NMC987984 |
| BVD
107 |
NMC987985 |
| BVD
106 |
NMC987986 |
| BVD
105 |
NMC987987 |
| BVD
41 |
NMC987988 |
| BVD
40 |
NMC987989 |
| BVD
32 |
NMC987990 |
| BVD
31 |
NMC987991 |
| BVD
30 |
NMC987992 |
| BVD
29 |
NMC987993 |
| BVD
36 |
NMC987994 |
| BVD
35 |
NMC987995 |
| BVD
34 |
NMC987996 |
| BVD
33 |
NMC987997 |
| BVD
28 |
NMC987998 |
| BVD
27 |
NMC987999 |
| BVD
26 |
NMC988000 |
| BVD
25 |
NMC988001 |
| BVD
19 |
NMC988002 |
| BVD
18 |
NMC988003 |
| BVD
17 |
NMC988004 |
FORTE DYNAMICS, INC
120 Commerce Drive., Units 3 & 4, Fort Collins, CO 80524 | P a g e | 35 of 178 | December 2023 |
| | Augusta Gold Corp. |
| Augusta
Gold Corp. Unpatented Claims |
| Claim
Name |
BLM
Serial Number |
| BVD
16 |
NMC988005 |
| BVD
24 |
NMC988006 |
| BVD
23 |
NMC988007 |
| BVD
22 |
NMC988008 |
| BVD
21 |
NMC988009 |
| BVD
20 |
NMC988010 |
| BVD
15 |
NMC988011 |
| BVD
14 |
NMC988012 |
| BVD
13 |
NMC988013 |
| BVD
12 |
NMC988014 |
| BVD
11 |
NMC988015 |
| BVD
39 |
NMC988016 |
| BVD
38 |
NMC988017 |
| BVD
37 |
NMC988018 |
| BVD
10 |
NMC988019 |
| BVD
9 |
NMC988020 |
| BVD
8 |
NMC988021 |
| BVD
7 |
NMC988022 |
| BVD
4 |
NMC988023 |
| BVD
3 |
NMC988024 |
| BVD
2 |
NMC988025 |
| BVD
1 |
NMC988026 |
| BVD
401 |
NMC992989 |
| BVD
402 |
NMC992990 |
FORTE DYNAMICS, INC
120 Commerce Drive., Units 3 & 4, Fort Collins, CO 80524 | P a g e | 36 of 178 | December 2023 |
| | Augusta Gold Corp. |
| Augusta
Gold Corp. Unpatented Claims |
| Claim
Name |
BLM
Serial Number |
| BVD
403 |
NMC992991 |
| BVD
404 |
NMC992992 |
| BVD
405 |
NMC992993 |
| BVD
406 |
NMC992994 |
| BVD
407 |
NMC992995 |
| BVD
408 |
NMC992996 |
| BVD
409 |
NMC992997 |
| BVD
410 |
NMC992998 |
| BFG
135 |
NV105225834 |
| BFG
136 |
NV105225835 |
| BFG
137 |
NV105225836 |
| BFG
138 |
NV105225837 |
| Augusta
Gold Corp. Unpatented Claims |
| Abitibi
Option |
| Claim
Name |
BLM
Serial Number |
| AR
1 |
1209019 |
| AR
2 |
1209020 |
| AR
3 |
1209021 |
| AR
4 |
1209022 |
| AR
5 |
1209023 |
| AR
6 |
1209024 |
| AR
7 |
1209025 |
| AR
8 |
1209026 |
FORTE DYNAMICS, INC
120 Commerce Drive., Units 3 & 4, Fort Collins, CO 80524 | P a g e | 37 of 178 | December 2023 |
| | Augusta Gold Corp. |
| Augusta
Gold Corp. Unpatented Claims |
| Abitibi
Option |
| Claim
Name |
BLM
Serial Number |
| AR
9 |
1209027 |
| AR
10 |
1209028 |
| AR
11 |
1209029 |
| AR
12 |
1209030 |
| AR
13 |
1209031 |
| AR
14 |
1209032 |
| AR
15 |
1209033 |
| AR
16 |
1209034 |
| AR
17 |
1209035 |
| AR
18 |
1209036 |
| AR
19 |
1209037 |
| AR
20 |
1209038 |
| AR
21 |
1209039 |
| AR
22 |
1209040 |
| AR
23 |
1209041 |
| AR
24 |
1209042 |
| AR
25 |
1209043 |
| AR
26 |
1209044 |
| AR
27 |
1209045 |
| AR
28 |
1209046 |
| AR
29 |
1209047 |
| AR
30 |
1209048 |
| AR
31 |
1209049 |
FORTE DYNAMICS, INC
120 Commerce Drive., Units 3 & 4, Fort Collins, CO 80524 | P a g e | 38 of 178 | December 2023 |
| | Augusta Gold Corp. |
| Augusta
Gold Corp. Unpatented Claims |
| Abitibi
Option |
| Claim
Name |
BLM
Serial Number |
| AR
32 |
1209050 |
| AR
33 |
1209051 |
| AR
34 |
1209052 |
| AR
35 |
1209053 |
| AR
36 |
1209054 |
| AR
37 |
1209055 |
| AR
38 |
1209056 |
| AR
39 |
1209057 |
| AR
40 |
1209058 |
| AR
41 |
1209059 |
| AR
42 |
1209060 |
| AR
43 |
1209061 |
| Augusta
Gold Corp. Patented Claims |
| Barrick
Claims |
| Claim
Name |
Patent
Number |
| EMERALD |
44862 |
| RUBY |
44862 |
| NORTHSTAR |
45830 |
| LOUISVILLE |
35256 |
| DENVER
FRACTION |
45316 |
| TRAMP
NO. 2 |
46191 |
| SIDEWINDER |
45387 |
FORTE DYNAMICS, INC
120 Commerce Drive., Units 3 & 4, Fort Collins, CO 80524 | P a g e | 39 of 178 | December 2023 |
| | Augusta Gold Corp. |
| Augusta
Gold Corp. Patented Claims |
| Barrick
Claims |
| Claim
Name |
Patent
Number |
| TIGER |
45387 |
| TRAMP
EXTENSION |
46171 |
| TRAMP
NO. 1 |
46171 |
| HOBO |
45253 |
| VIRGINIA |
529024 |
| DIAMOND
HITCH |
46187 |
| COMET |
46182 |
| LE
ROI |
46181 |
| UGLY
DUCKLING |
46180 |
| LE
ROI FRACTION |
46179 |
| DEL
MONTE |
46173 |
| POLARIS |
46173 |
| DENVER
NO. 2 |
45348 |
| VENTURE |
45348 |
| DENVER
NO. 3 |
77975 |
| SUNSET
NO. 1 |
45371 |
| SUNSET
NO. 2 |
45371 |
| CHIEF |
45815 |
| PRINCE |
45815 |
| S.L. |
46223 |
| SPEARHEAD |
46223 |
| SUMMIT |
46223 |
| AURORA |
47481 |
FORTE DYNAMICS, INC
120 Commerce Drive., Units 3 & 4, Fort Collins, CO 80524 | P a g e | 40 of 178 | December 2023 |
| | Augusta Gold Corp. |
| Augusta
Gold Corp. Patented Claims |
| Barrick
Claims |
| Claim
Name |
Patent
Number |
| GRAND
PRIZE |
47481 |
| QUARTETTE |
47481 |
| H071
TRACT 37 PATENT |
|
| BULL
FROG NO. 2 |
44644 |
| BULLFROG |
44644 |
| BULLFROG
FRACTION LODE |
45120 |
| DELAWARE
NO. 1 |
46263 |
| ETHEL |
46263 |
| JUMBO |
46263 |
| NEVADA |
88070 |
| ROOSEVELT |
88070 |
| TEDDY |
88070 |
| TEDDY
FRACTION |
88070 |
| PACIFIC
PLACER |
952102 |
| NEVADA
PLACER |
952102 |
| PARIAN
PLACER |
952102 |
| Augusta
Gold Corp. Unpatented Claims |
| Barrick
Claims |
| Mine
Claims |
| Claim
Name |
BLM
Serial Number |
| Shorty
1 |
NMC
1058705 |
| Shorty
2 |
NMC
1058706 |
FORTE DYNAMICS, INC
120 Commerce Drive., Units 3 & 4, Fort Collins, CO 80524 | P a g e | 41 of 178 | December 2023 |
| | Augusta Gold Corp. |
| Augusta
Gold Corp. Unpatented Claims |
| Barrick
Claims |
| Mine
Claims |
| Claim
Name |
BLM
Serial Number |
| Shorty
3 |
NMC
1058707 |
| Shorty
4 |
NMC
1058708 |
| Shorty
5 |
NMC
1058709 |
| Shorty
6 |
NMC
1058710 |
| Shorty
7 |
NMC
1058711 |
| Shorty
8 |
NMC
1058712 |
| Shorty
10 |
NMC
1058713 |
| Shorty
11 |
NMC
1058714 |
| Shorty
12 |
NMC
1058715 |
| ACE
NUMBER 1 |
NMC
112229 |
| ACE
NO. 2* |
NMC
112230 |
| ACE
NO. 3* |
NMC
112231 |
| RHYOLITE
NO. 1 |
NMC
128702 |
| RHYOLITE
NO. 5 |
NMC
128705 |
| WEST
SIDE RHYOLITE |
NMC
128708 |
| EAST
SIDE |
NMC
128709 |
| YANKEE
GIRL # 2 |
NMC
128710 |
| FROG
EXTENSION |
NMC
128711 |
| FROG
NO. 1 |
NMC
128712 |
| BOLIVAR
NO. 1 |
NMC
128713 |
| CASH
BOY |
NMC
128714 |
| GOLDEN
EAGLE # 2* |
NMC
298788 |
FORTE DYNAMICS, INC
120 Commerce Drive., Units 3 & 4, Fort Collins, CO 80524 | P a g e | 42 of 178 | December 2023 |
| | Augusta Gold Corp. |
| Augusta
Gold Corp. Unpatented Claims |
| Barrick
Claims |
| Mine
Claims |
| Claim
Name |
BLM
Serial Number |
| GOLDEN
EAGLE # 3* |
NMC
298789 |
| GOLDEN
AGE # 1* |
NMC
298790 |
| GOLDEN
AGE # 2* |
NMC
298791 |
| GOLDEN
AGE # 3* |
NMC
298792 |
| GOLDEN
AGE # 4* |
NMC
298793 |
| GOLDEN
AGE # 5* |
NMC
298794 |
| GOLDEN
AGE # 15* |
NMC
298802 |
| GOLDEN
AGE # 16* |
NMC
298803 |
| BEV
# 43 |
NMC
350754 |
| BEV
# 44 |
NMC
350755 |
| BEV
# 45 |
NMC
350756 |
| BEV
# 46 |
NMC
350757 |
| BEV
# 53 |
NMC
350764 |
| BEV
# 54 |
NMC
350765 |
| BEV
# 65 |
NMC
350776 |
| BEV
# 73 |
NMC
350784 |
| RACHAEL
# 3 |
NMC
400293 |
| RACHAEL
# 4 |
NMC
400294 |
| RACHAEL
# 5 |
NMC
400295 |
| MIKE
9 |
NMC
415141 |
| MIKE
10 |
NMC
415142 |
| IRBF
# 5 |
NMC
418634 |
FORTE DYNAMICS, INC
120 Commerce Drive., Units 3 & 4, Fort Collins, CO 80524 | P a g e | 43 of 178 | December 2023 |
| | Augusta Gold Corp. |
| Augusta
Gold Corp. Unpatented Claims |
| Barrick
Claims |
| Mine
Claims |
| Claim
Name |
BLM
Serial Number |
| IRBF
# 6 |
NMC
418635 |
| IRBF
# 8 |
NMC
418637 |
| IRISH
EYES # 2 |
NMC
436850 |
| CHERYL
MARIE # 3 |
NMC
436852 |
| GOLDEN
SLIVER |
NMC
436855 |
| TOTO
# 1 |
NMC
436856 |
| TOTO
# 2 |
NMC
436857 |
| TOTO
# 3 |
NMC
436858 |
| TOTO
# 4 |
NMC
436859 |
| TOTO
# 5 |
NMC
436860 |
| TOTO
# 6 |
NMC
436861 |
| TOTO
# 7 |
NMC
436862 |
| OVERSIGHT |
NMC
436870 |
| ERICA
ANN # 1 |
NMC
436876 |
| DINY
F |
NMC
443898 |
| DOUG’S
DESPAIR # 1 |
NMC
453427 |
| LITTLE
BEV # 7 |
NMC
462038 |
| BEV
NO. 17 |
NMC
507261 |
| BEV
NO. 18 |
NMC
507262 |
| BEV
NO. 19 |
NMC
507263 |
| BEV
NO. 20 |
NMC
507264 |
| BEV
NO. 55 |
NMC
507277 |
FORTE DYNAMICS, INC
120 Commerce Drive., Units 3 & 4, Fort Collins, CO 80524 | P a g e | 44 of 178 | December 2023 |
| | Augusta Gold Corp. |
| Augusta
Gold Corp. Unpatented Claims |
| Barrick
Claims |
| Mine
Claims |
| Claim
Name |
BLM
Serial Number |
| BEV
NO. 66 |
NMC
507287 |
| BEV
NO. 67 |
NMC
507288 |
| LITTLE
BEV # 9 |
NMC
523201 |
| BROTHER
1 |
NMC
551789 |
| BROTHER
2 |
NMC
551790 |
| GOLDEN
AGE # 6 |
NMC
583381 |
| GOLDEN
AGE # 7* |
NMC
583382 |
| GOLDEN
AGE # 8* |
NMC
583383 |
| GOLDEN
AGE # 9* |
NMC
583384 |
| GOLDEN
AGE # 12* |
NMC
583385 |
| GOLDEN
AGE # 13* |
NMC
583386 |
| GOLDEN
AGE # 14* |
NMC
583387 |
| GOLDEN
AGE # 17* |
NMC
583388 |
| BEV
47 A |
NMC
819978 |
| BEV
48 A |
NMC
819979 |
| Augusta
Gold Corp. Millsite Claims |
| Barrick
Claims |
| Claim
Name |
BLM
Serial Number |
| BFMS
NO. 1 |
NMC
519933 |
| BFMS
NO. 2 |
NMC
519934 |
| BFMS
NO. 3 |
NMC
519935 |
FORTE DYNAMICS, INC
120 Commerce Drive., Units 3 & 4, Fort Collins, CO 80524 | P a g e | 45 of 178 | December 2023 |
| | Augusta Gold Corp. |
| Augusta
Gold Corp. Millsite Claims |
| Barrick
Claims |
| Claim
Name |
BLM
Serial Number |
| BFMS
NO. 4 |
NMC
519936 |
| BFMS
NO. 5 |
NMC
519937 |
| BFMS
NO. 6 |
NMC
519938 |
| BFMS
NO. 7 |
NMC
519939 |
| BFMS
NO. 8 |
NMC
519940 |
| BFMS
NO. 9 |
NMC
519941 |
| BFMS
NO. 10 |
NMC
519942 |
| BFMS
11 |
NMC
519943 |
| BFMS
NO. 12 |
NMC
519944 |
| BFMS
NO. 13 |
NMC
519945 |
| BFMS
NO. 14 |
NMC
519946 |
| BFMS
NO. 15 |
NMC
519947 |
| BFMS
NO. 16 |
NMC
519948 |
| BFMS
NO. 17 |
NMC
519949 |
| BFMS
NO. 18 |
NMC
519950 |
| BFMS
NO. 19 |
NMC
519951 |
| BFMS
NO. 20 |
NMC
519952 |
| BFMS
NO. 21 |
NMC
519953 |
| BFMS
NO. 22 |
NMC
519954 |
| BFMS
NO. 23 |
NMC
519955 |
| BFMS
NO. 24 |
NMC
519956 |
| BFMS
NO. 25 |
NMC
519957 |
| BFMS
NO. 26 |
NMC
519958 |
FORTE DYNAMICS, INC
120 Commerce Drive., Units 3 & 4, Fort Collins, CO 80524 | P a g e | 46 of 178 | December 2023 |
| | Augusta Gold Corp. |
| Augusta
Gold Corp. Millsite Claims |
| Barrick
Claims |
| Claim
Name |
BLM
Serial Number |
| BFMS
NO. 27 |
NMC
519959 |
| BFMS
NO. 28 |
NMC
519960 |
| BFMS
NO. 29 |
NMC
519961 |
| BFMS
NO. 30 |
NMC
519962 |
| BFMS
NO. 31 |
NMC
519963 |
| BFMS
NO. 32 |
NMC
519964 |
| BFMS
NO. 33 |
NMC
519965 |
| BFMS
NO. 36 |
NMC
519968 |
| BFMS
NO. 37 |
NMC
519969 |
| BFMS
NO. 38 |
NMC
519970 |
| BFMS
41 |
NMC
519973 |
| BFMS
NO. 42 |
NMC
519974 |
| BFMS
NO. 43 |
NMC
519975 |
| BFMS
NO. 46 |
NMC
519978 |
| BFMS
NO. 48 |
NMC
519980 |
| BFMS
NO. 49 |
NMC
519981 |
| BFMS
NO. 50 |
NMC
519982 |
| BFMS
NO. 51 |
NMC
519983 |
| BFMS
NO. 52 |
NMC
519984 |
| BFMS
NO. 53 |
NMC
519985 |
| BFMS
NO. 56 |
NMC
519988 |
| BFMS
NO. 57 |
NMC
519989 |
| BFMS
NO. 58 |
NMC
519990 |
FORTE DYNAMICS, INC
120 Commerce Drive., Units 3 & 4, Fort Collins, CO 80524 | P a g e | 47 of 178 | December 2023 |
| | Augusta Gold Corp. |
| Augusta
Gold Corp. Millsite Claims |
| Barrick
Claims |
| Claim
Name |
BLM
Serial Number |
| BFMS
NO. 59 |
NMC
519991 |
| BFMS
NO. 60 |
NMC
519992 |
| BFMS
NO. 61 |
NMC
519993 |
| BFMS
NO. 63 |
NMC
519995 |
| BFMS
NO. 64 |
NMC
519996 |
| BFMS
NO. 65 |
NMC
519997 |
| BFMS
NO. 66 |
NMC
519998 |
| BFMS
NO. 67 |
NMC
519999 |
| BFMS
NO. 71 |
NMC
528590 |
| BFMS
72 |
NMC
528591 |
| BFMS
NO. 73 |
NMC
528592 |
| BFMS
NO. 92 |
NMC
528611 |
| BFMS
NO. 93 |
NMC
528612 |
| BFMS
NO. 94 |
NMC
528613 |
| BFMS
NO. 95 |
NMC
528614 |
| BFMS
NO. 96 |
NMC
528615 |
| BFMS
NO. 97 |
NMC
528616 |
| BFMS
NO. 98 |
NMC
528617 |
| BFMS
NO. 101 |
NMC
528620 |
| BFMS
NO. 104 |
NMC
528623 |
| BFMS
NO. 105 |
NMC
528624 |
| BFMS
NO. 106 |
NMC
528625 |
| BFMS
NO. 107 |
NMC
528626 |
FORTE DYNAMICS, INC
120 Commerce Drive., Units 3 & 4, Fort Collins, CO 80524 | P a g e | 48 of 178 | December 2023 |
| | Augusta Gold Corp. |
| Augusta
Gold Corp. Millsite Claims |
| Barrick
Claims |
| Claim
Name |
BLM
Serial Number |
| BFMS
NO. 110 |
NMC
528629 |
| BFMS
NO. 111 |
NMC
528630 |
| BFMS
NO. 114 |
NMC
528633 |
| BFMS
NO. 115 |
NMC
528634 |
| BFMS
NO. 116 |
NMC
528635 |
| BFMS
NO. 119 |
NMC
528638 |
| BFMS
NO. 205 |
NMC
528724 |
| BFMS
NO. 206 |
NMC
528725 |
| BFMS
NO. 207 |
NMC
528726 |
| BFMS
NO. 208 |
NMC
528727 |
| BFMS
NO. 209 |
NMC
528728 |
| BFMS
NO. 250 |
NMC
528769 |
| BFMS
NO. 251 |
NMC
528770 |
| BFMS
NO. 252 |
NMC
528771 |
| BFMS
NO. 253 |
NMC
528772 |
| BFMS
NO. 254 |
NMC
528773 |
| BFMS
NO. 255 |
NMC
528774 |
| BFMS
NO. 256 |
NMC
528775 |
| BFMS
257 |
NMC
528776 |
| BGMW
NO. 1 |
NMC
551064 |
| BGMW
NO. 3 |
NMC
551065 |
| BGMW
NO. 11 |
NMC
551066 |
| BGMW
NO. 13 |
NMC
551067 |
FORTE DYNAMICS, INC
120 Commerce Drive., Units 3 & 4, Fort Collins, CO 80524 | P a g e | 49 of 178 | December 2023 |
| | Augusta Gold Corp. |
| Augusta
Gold Corp. Millsite Claims |
| Barrick
Claims |
| Claim
Name |
BLM
Serial Number |
| BFMS
47 A |
NMC
817723 |
Figure
3-2: Property Map of the Bullfrog Project
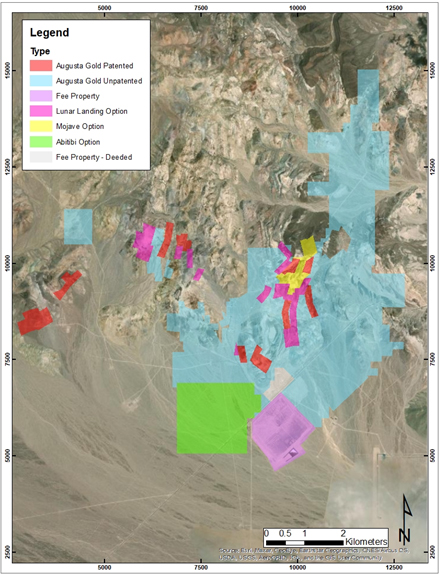
FORTE DYNAMICS, INC
120 Commerce Drive., Units 3 & 4, Fort Collins, CO 80524 | P a g e | 50 of 178 | December 2023 |
| | Augusta Gold Corp. |
| 3.1 | NPX
Assignment of Lands |
In
September 2011, the Company issued 14.4 million shares of the Company to the shareholders of Standard Gold Corp. (SGC) to acquire
100% of SGC and its assets. SGC is a private Nevada corporation and now wholly owned by the Company. Concurrently, NPX Metals,
Inc. (NPX) and Bull Frog Holding, Inc. (BHI) assigned all title and interests in 79 claims and two patents to SGC. The Company
granted a production royalty of 3% NSR on the property to NPX and BHI, plus an aggregate 3% NSR cap on any acquired lands within
one mile of the 2011 boundary. Thus, NPX and BHI would not receive any royalty on acquisitions having a 3% or greater NSR.
In
March 2014, the Company formed Rocky Mountain Minerals Corp. (RMMC), a private Nevada corporation, as a wholly owned subsidiary
specifically for holding and acquiring assets. On October 29, 2014, RMMC exercised an option to purchase from Mojave Gold Mining
Co. 12 patents west and adjacent to the Company’s initial property and that cover the NE half of the M-S pit. Mojave was
paid 750,000 shares of BFGC plus $16,000. RMMC agreed to make annual payments totaling $180,000 over nine years to fully exercise
the option and expend as a minimum work commitment for the benefit of the Property $100,000 per year and a total of $500,000 over
five years on the Properties and surrounding lands within one-half mile of the 12 Mojave patents. Alternatively, RMMC can pay
cash to Mojave at 50% of the difference between the minimum required and the actual expenditures. Mojave retained a sliding scale
Net Smelter Return royalty ranging from 1% for gold prices below $1,200/ounce and up to 4% for gold prices above $3,200 per ounce.
For reference, Barrick terminated a lease on the 12 Mojave patents in mid-2000 (then known as the Dees group) and all residual
access rights in 2010.
| 3.3 | Barrick
Bullfrog Inc. Lease and Option |
On
March 23, 2015, Bullfrog Mines LLC (Bullfrog Mines), the successor by conversion of Barrick Bullfrog Inc., and RMMC, among others,
entered into a lease and option to purchase agreement (the Lease and Option Agreement) dated March 23, 2015, for RMMC to acquire
six patents, 20 unpatented claims, and eight mill site claims from Bullfrog Mines. The Lease and Option Agreement terminated upon
execution of the Membership Interest Purchase Agreement (MIPA).
On
July 1, 2017, RMMC entered a lease with Lunar Landing LLC on 24 patents in the Bullfrog District:
| ● | Two
patents are adjacent and west of the M-S pit that could allow potential expansion of
the pit down dip of the Polaris vein and stock work system. |
| ● | Ten
patents have provided the Company with contiguous and connecting lands between the M-S
and Bullfrog pits. These patents will also allow further expansions of the Bullfrog pit
to the north and east. |
| ● | Four
patents are within 0.5 to 1.2 miles west of the Bullfrog pit in the vicinity of the Bonanza
Mountain open pit mine. |
| ● | Eight
patents are in an exploration target area located about 1.5 miles NW of the Bullfrog
pit and where the Company has owned the Aurium patent since 2011. |
FORTE DYNAMICS, INC
120 Commerce Drive., Units 3 & 4, Fort Collins, CO 80524 | P a g e | 51 of 178 | December 2023 |
| | Augusta Gold Corp. |
The
lease includes the following:
| ● | The
Company paid $26,000 on signing and is scheduled to annually pay $16,000 for years 2-5,
$21,000 for years 6-10, $25,000 for years 11-15, $30,000 for years 16-20, $40,000 for
years 21-25 and $45,000 for years 26-30. |
| ● | Production
royalty of 5% net smelter returns with the right to buy-down to 2.5%. |
| ● | The
Company is to expend as a work commitment not less than $50,000 per year and $500,000
in total to maintain the lease. |
| ● | The
Company has rights to commingle mineralization and the flexibility to operate the Project
as a logical land and mining unit. |
On
January 29, 2018, RMMC purchased the two patented claims, thereby eliminating minor constraints to expand the Bullfrog pit to
the north. As partial consideration for the Brown Claims, RMMC granted the sellers of the Brown Claims a 5% net smelter returns
royalty on the Brown Claims, of which 2.5% can be purchased by RMMC for aggregate consideration of US$37,500.
On
October 26, 2020, the Company completed its acquisition of Bullfrog Mines pursuant to the MIPA with Homestake Mining Company of
California (Homestake) and Lac Minerals (USA) LLC (Lac Minerals and together with Homestake, the Barrick Parties).
Pursuant
to the MIPA, the Company purchased from the Barrick Parties all of the equity interests (the Equity Interests) in Bullfrog Mines
for aggregate consideration of (i) 54,600,000 units of the Company, each unit consisting of one share of common stock of the Company
and one four-year warrant purchase one share of common stock of the Company at an exercise price of C$0.30, (ii) a 2% net smelter
returns royalty (the Barrick Royalty) granted on all minerals produced from all of the patented and unpatented claims (subject
to the adjustments set out below), pursuant to a royalty deed, dated October 26, 2020 by and among Bullfrog Mines and the Barrick
Parties (the Royalty Deed), (iii) the Company granting indemnification to the Barrick Parties pursuant to an indemnity deed, dated
October 26, 2020 by and among the Company, the Barrick Parties and Bullfrog Mines, and (iv) certain investor rights, including
anti-dilution rights, pursuant to the investor rights agreement, dated October 26, 2020, by and among the Company, Augusta Investments
Inc., and Barrick.
Through
the Company’s acquisition of the Equity Interests, the Company acquired rights to the 1,500 acres of claims adjoining the
Company’s Bullfrog Gold deposit.
Pursuant
to the Royalty Deed, the Barrick Royalty is reduced to the extent necessary so that royalties burdening any individual parcel
or claim included in the Barrick Properties on October 26, 2020, inclusive of the Barrick Royalty, would not exceed 5.5% in the
aggregate, provided that the Barrick Royalty in respect of any parcel or claim would not be less than 0.5%, even if the royalties
burdening a parcel or claim included in the Barrick Properties would exceed 5.5%.
FORTE DYNAMICS, INC
120 Commerce Drive., Units 3 & 4, Fort Collins, CO 80524 | P a g e | 52 of 178 | December 2023 |
| | Augusta Gold Corp. |
| 3.7 | Abitibi
Royalties Option |
On
December 9, 2020, Bullfrog Mines entered into a mining option agreement with Abitibi Royalties (USA) Inc. (Abitibi) granting Bullfrog
Mines the option (the Abitibi Option) to acquire forty-three unpatented lode mining claims to the south of the Bullfrog deposit.
Bullfrog Mines made an initial payment to Abitibi of C$25,000 and can exercise the Abitibi Option by:
| ● | Paying
to Abitibi C$50,000 in cash or shares of Company common stock by December 9, 2021; |
| ● | Paying
to Abitibi C$75,000 in cash or shares of Company common stock by December 9, 2022; and |
| ● | Granting
to Abitibi a 2% net smelter royalty on the claims subject to the Abitibi Option by December
9, 2022, of which Bullfrog Mines would have the option to purchase 0.5% for C$500,000
on or before December 9, 2030. |
In
order to exercise the Abitibi Option, Bullfrog Mines is also required to keep the underlying claims in good standing.
| 3.8 | Other
Property Considerations |
All
the unpatented lode mining claims are on U.S. public land administered by the Bureau of Land Management (“BLM”) and,
therefore, are subject to exploration and development permits as required by the several current regulations. The unpatented lode
mining claims require annual payments of $155 per claim to the BLM and $12 per claim to Nye County.
Total
fees paid in 2020 for the lode and mill site claims was $26,739. Nye County property taxes paid in 2020 was approximately $1,781.
In
summary, the lands controlled by Augusta Gold Corp. are in good standing with no significant liens, encumbrances, or title adversities.
| 3.9 | Environmental
and Permitting |
The
author is not aware of any outstanding environmental, reclamation or permitting issues that would impact future exploration work.
Future exploration work will require a Plan of Operations to be filed with the BLM and the Nevada Department of Environmental
Protection.
The
following outlines the general framework for permitting a mine in Nevada and the required permits. Many of the permits discussed
herein apply to the construction stage and are not currently being pursued.
Exploration
activities on Federal mining claims on BLM lands requires a Notice of Intent (NOI) for exploration activities under five acres
of disturbance and a Plan of Operations for larger scale exploration activities. A Plan of Operations is also required with the
Nevada Department of Environmental Protection (NDEP) to fulfill the State of Nevada permitting obligations on private and public
lands, respectively. Reclamation bonds related to environmental liabilities need to be calculated and posted to cover activities
on the Project. Additional permits and bonding will be required for developing, constructing, operating, and reclaiming the Project.
Additional
Baseline Studies will be required to update the historical studies completed by Barrick. This will include geochemistry, hydrologic
studies of the in-pit water and water in existing wells, plant, wildlife and threatened and endangered species surveys, meteorological
information, and cultural surveys.
FORTE DYNAMICS, INC
120 Commerce Drive., Units 3 & 4, Fort Collins, CO 80524 | P a g e | 53 of 178 | December 2023 |
| | Augusta Gold Corp. |
Major
permits, not inclusive of the Plan of Operations above, that will be required include:
| ● | Water
Pollution Control Permits (WPCP): The WPCP application must address the open pit,
heap leach pad, mining activities and water management systems with respect to potentially
degrading of the waters of Nevada. Sufficient engineering, design and modeling data must
be included in the WPCP. A Tentative Permit Closure Plan must be submitted to the NDEP-BMRR
in conjunction with the WPCP. A Final Permanent Closure Plan will be needed two years
prior to Project closure. |
| ● | Air
Quality: An application for a Class II Air Quality Permit must be prepared using
Bureau of Air Pollution Control (BAPC) forms. The application must include descriptions
of the facilities, a detailed emission inventory, plot plans, process flow diagrams and
a fugitive dust control plan for construction and operation of the Project. A Mercury
Operating Permit and a Title V Operating permit will also be necessary for processing
loaded carbon or electro-winning precipitates. |
| ● | Water
Right: Additional water rights will need to be acquired from third parties or obtained
from the Nevada Division of Water Resources (NDWR) for producing Project water. |
| ● | Industrial
Artificial Pond: Water storage ponds, which are part of the water management systems,
will require Industrial Artificial Pond permits (IAPP) from the Nevada Department of
wildlife. Approval from the Nevada State Engineer’s Office is also required if
embankments exceed specified heights. |
Additional
minor permits will be required for the project to advance to production and are listed in Table 3-2.
Table
3-2: Additional Minor Permits Required
| Notification/Permit |
Agency |
| Mine
Registry |
Nevada
Division of Minerals |
| Mine
Opening Notification |
State
Inspector of Mines |
| Solid
Waste Landfill |
Nevada
Bureau of Waste Management |
| Hazardous
Waste Management Permit |
Nevada
Bureau of Waste Management |
| General
Storm Water Permit |
Nevada
Bureau of Water Pollution Control |
| Hazardous
Materials Permit |
State
Fire Marshall |
| Fire
and Life Safety |
State
Fire Marshall |
| Explosives
Permit |
Bureau
of Alcohol, Tobacco, Firearms & Explosives |
| Notification
of Commencement of Operation |
Mine
Safety and Health Administration |
| Radio
License |
Federal
Communications Commission |
| Public
Water Supply Permit |
NV
Division of Environmental Protection |
| MSHA
Identification Number and MSHA Coordination |
U.S.
Department of Labor Mine Safety and Health Administration (MSHA) |
| Septic
Tank |
NDEP-Bureau
of Water Pollution Control |
| Petroleum
Contaminated Soils |
NV
Division of Environmental Protection |
| 3.10 | Significant
Risk Factors |
The
author is not aware of any outstanding environmental, reclamation or permitting issues that would impact future exploration work.
The
author is unaware of any other significant risk factors that may affect access, title, or right or ability to perform work on the property.
FORTE DYNAMICS, INC
120 Commerce Drive., Units 3 & 4, Fort Collins, CO 80524 | P a g e | 54 of 178 | December 2023 |
| | Augusta Gold Corp. |
| 4. | ACCESSIBILITY,
CLIMATE, LOCAL RESOURCES, INFRASTRUCTURE AND PHYSIOGRAPHY |
The
Bullfrog Project is accessible via a 2½ hour (120 mile) drive north of Las Vegas, Nevada on US Highway 95. Las Vegas, the
largest city in Nevada, is serviced by a major international airport, and has ample equipment, supplies and services to support
many of the Project’s needs. The Project is 4 miles west of the Town of Beatty, Nevada via a paved highway. Beatty has a
population of approximately 1,000 and can provide basic housing, services, and supplies. Access around the Project is by a series
of reasonably good gravel roads that extend to the open pit mines and most of the significant exploration areas.
| 4.2 | Physiography,
Climate and Vegetation |
Figure
4-1: Photo of Bullfrog Hills at Rhyolite

The
Bullfrog Project is in Western Nevada’s high desert, which receives about 15 cm of precipitation per year, mostly as modest
snowfall in the winter and thunderstorms in the summer. Temperatures typically range from -12°C (10°F) in winter to 43.3°C
(110°F) in the summer. Due to the relatively mild climate at the Project, the operating season is year-round.
The
hills at the Project are covered with sparse low brush including creosote, four-wing saltbush, rabbit brush, and Nevada
ephedra. The Project is in the Basin and Range province, but the local topographic relief is only a few hundred feet.
Elevations in the main Project areas range from 1,035 m in the valleys to 1,270 m at the peak of Ladd Mountain and
1,320 m at the peak of Montgomery Mountain. Most of the Project is characterized by low hills separated by modest width
valleys. Although the U.S. Fish and Wildlife Service has designated the area as habitat for desert tortoise—a
threatened and endangered species—Barrick and others have successfully coped with this designation, and the rough
terrain is not conducive for these species. Additional studies may be required to meet requirements regarding the tortoise
habitat.
FORTE DYNAMICS, INC
120 Commerce Drive., Units 3 & 4, Fort Collins, CO 80524 | P a g e | 55 of 178 | December 2023 |
| | Augusta Gold Corp. |
| 4.3 | Local
Resources and Infrastructure |
Augusta
Gold Corp. maintains sufficient surface rights to support mining operations, including areas for potential waste disposal, tailings
storage, heap leach pads and potential mill sites. The Company recently located additional mining claims and is pursuing the acquisition
of other lands in the area. Most claim blocks are contiguous, and the water rights that Barrick held through Bullfrog Mines were
indirectly acquired by Augusta Gold Corp. as part of its acquisition of Bullfrog Mines.
The
towns of Beatty, Pahrump and Tonopah in Nye County have populations that support mining operations in the area.
Valley
Electric Association based in Pahrump, Nevada owns a 138 KV transmission line and a 24.9 KV distribution line that remain on-site
and serviced mining at the site previously. The substation connected to the 24.9 KV line remains on-site, but the transformers
and switchgear have been removed.
Pumping
from wells completed near the bottom of the Bullfrog pit is required to access deeper mineralization and could produce most of
the Project water needs. Water may also be available from Barrick’s production wells located a few miles south of Highway
374, possibly from the Town of Beatty wellfield, and to a limited extent from deepening the M-S pit.
FORTE DYNAMICS, INC
120 Commerce Drive., Units 3 & 4, Fort Collins, CO 80524 | P a g e | 56 of 178 | December 2023 |
| | Augusta Gold Corp. |
The
original Bullfrog deposit was discovered in 1904 by Frank “Shorty” Harris and Ernest Cross. This deposit is located
3.5 miles WSW of the Montgomery Shoshone (M-S) mine and initially had un-recorded but minor production. In 1904 the M-S deposit
was discovered, and an underground mine was developed to the 700-foot level. A 300-tpd cyanidation mill was constructed for processing
the mined material. The M-S operation recovered 67,000 gold equivalent ounces from 141,000 tons or 0.48 gold ounce/ton (opt) during
the period 1907 to 1911. The mine was shut down in late 1910 due to declining grades and operating issues at depth. The adjacent
Polaris mine produced 4,900 ounces of gold from 9,500 tons, or an average recovery of 0.52 gold opt.
Through
1911 the District produced 94,000 ounces of gold, but thereafter only minor exploration, development, and production activities
occurred until St. Joe American successfully initiated modern exploration programs in 1982. In July 1987, Bond International Gold
acquired St. Joe and constructed a nominal 9,000-tpd cyanidation mill in July 1989. In November 1989, Lac Minerals acquired Bond’s
interest. In September 1994, Lac was acquired by Barrick. Recorded Project gold production from 1989 to 1999 is summarized in
Table 5-1.
Table
5-1: Bullfrog Project Production
| Year |
Mined
Tons |
Gold
Rec.
OPT |
Gold
Rec.
Oz |
Silver
Rec.
Oz |
Source
Report
|
| 1989 |
1,025,000 |
0.060 |
56,771 |
35,752 |
Bond
Gold |
| 1990 |
3,036,000 |
0.080 |
220,192 |
228,647 |
Bond
Gold |
| 1991 |
2,988,000 |
0.073 |
198,863 |
188,824 |
Lac
Min. |
| 1992 |
3,173,000 |
0.111 |
323,825 |
313,100 |
Lac
Min. |
| 1993 |
3,080,000 |
0.125 |
354,900 |
469,899 |
Lac
Min. |
| 1994 |
3,093,000 |
0.105 |
301,000 |
NR |
Barrick |
| 1995 |
3,110,100 |
0.062 |
176,307 |
NR |
Barrick |
| 1996 |
3,008,600 |
0.073 |
205,300 |
NR |
Barrick |
| 1997 |
3,070,700 |
0.073 |
206,571 |
NR |
Barrick |
| 1998 |
3,213,000 |
0.070 |
208,123 |
NR |
Barrick |
| 1999 |
From
Stockpiles |
|
77,000 |
NR |
NV
G.S. |
| Total/Avg. |
28,797,400 |
0.081 |
2,328,852 |
2,493,591
est. |
|
| |
Mine |
Mineralized
Material
Tonnes |
g
Gold/T
Mineralization |
Gold Oz
Rec. |
Years
Mined |
| |
BF
Pit |
18,428,840 |
2.44 |
1,346,852 |
1989
– 1994 |
| |
BF
UG |
2,782,077 |
8.30 |
690,000 |
1992
– 1998 |
| |
M-S
Pit |
3,504,309 |
2.10 |
220,000 |
1994
– 1997 |
| |
Bonanza
Pit |
1,416,715 |
1.70 |
72,000 |
1995
– 1996 |
| |
|
26,131,942 |
2.98 |
2,328,852 |
|
FORTE DYNAMICS, INC
120 Commerce Drive., Units 3 & 4, Fort Collins, CO 80524 | P a g e | 57 of 178 | December 2023 |
| | Augusta Gold Corp. |
Open
pit mine production began in 1989 and underground mine production started in 1992 in the Bullfrog deposit. Bullfrog pit operations
were terminated in late 1994, with the underground mine scheduled to produce the remaining Bullfrog reserves. The M-S deposit
was open pit mined between 1994 and 1997, during which time the Bonanza Mountain deposit was also mined. Underground operations
were shut down in late 1998 due to adverse economic conditions and depletion of remaining reserves. During the last years of mill
operations, all remaining low- and high-grade stockpiles, grading +0.5 gold g/t, were blended with underground ores. For reference,
gold prices averaged less than $290 per ounce during 1998 and 1999 and hit a multi-year low of $252/oz in August 1999.
By
December 2000 Barrick completed all major reclamation and closure requirements, and subsequently removed all mine and processing
equipment and buildings. Per Barrick’s permit requirements, the deep north part of the Bullfrog pit has now been backfilled
with alluvium to an elevation of 927 meters to cover the gradually rising water table, which currently is at an elevation of 906
m. There has been no backfilling in the M-S pit since it is above the water table. Since 2000 no significant activities in the
south half of the Bullfrog Mining District have been performed, other than reclamation by Barrick.
Notably,
on October 26, 2020, Augusta acquired Bullfrog Mines LLC (the successor by conversion of Barrick Bullfrog Inc.) from certain wholly
owned subsidiaries of Barrick Gold Corporation.
FORTE DYNAMICS, INC
120 Commerce Drive., Units 3 & 4, Fort Collins, CO 80524 | P a g e | 58 of 178 | December 2023 |
| | Augusta Gold Corp. |
| 6. | Geological
Setting, Mineralisation and Deposit |
The
following Geological Setting and Mineralization section was in large measure excerpted with permission from a paper presented
at the Geological Society of Nevada Symposium “Geology and Ore Deposits of the American Cordillera”, April 10-13,
1995, titled “Geology and Mineralization of the Bullfrog Mine and Vicinity Nye County, Nevada.”
Figure
6-1: Regional Setting of the Bullfrog Mine (Eng et al., 1996)
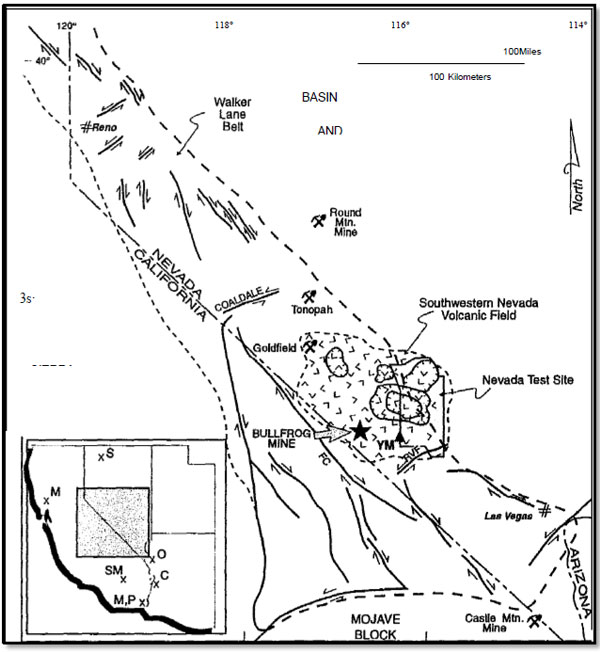
FORTE DYNAMICS, INC
120 Commerce Drive., Units 3 & 4, Fort Collins, CO 80524 | P a g e | 59 of 178 | December 2023 |
| | Augusta Gold Corp. |
The
Bullfrog Project lies in the southwestern portion of the Great Basin along the southern part of the Walker Lane structural belt
(Stewart, 1988) and in the southwestern part of the southwestern Nevada Volcanic Field (Noble et al., 1991). The Walker Lane lies
along the western margin of the Great Basin and is bounded to the west by the Sierra Nevada province (Figure 6-1). Stewart (1988)
divided the north-trending Walker Lane belt into nine blocks characterized by different structural fabric and development. The
boundaries between blocks are commonly major strike slip faults or ill-defined transitions of structural fabric. The Bullfrog
District lies near the southwestern margin of the Goldfield block. This block shows a general lack of strike slip faults but has
locally substantial large-scale Late Tertiary extension faults notably in the Mineral Ridge Weepah Hills area to the north and
detachment type faulting in the Bullfrog Hills, and Bare Mountain area to the south.
The
Goldfield block is bounded on the west by the northwest-striking right-lateral Death Valley-Furnace Creek fault zone, which is
one of the largest strike-slip faults in the Walker Lane with approximately 40-100 km of right-lateral displacement (cf. Stewart,
1967; McKee, 1968), and on the north and south by the east-northeast striking, left-lateral Coaldale fault zone and Mine Mountain-Rock
Valley fault zones, respectively. The eastern boundary of the Goldfield block is less well defined; it lies buried under alluvium
of Cactus Flat and is further obscured by volcanic centers of the southwest Nevada volcanic field.
The
Bullfrog Hills are in the western part of the south-western Nevada volcanic field (Figure 6-1) which encompasses a complex of nested
and overlapping calderas that developed between about 15 - 11 Ma (see Byers et al., 1989; Sawyer et al., 1994 and references therein).
Two additional volcanic centers formed to the northwest at 9.4 Ma and 7.5 Ma (Noble et al., 1984). Many of the Tertiary volcanic
rocks in the Bullfrog Hills came from these volcanic centers which collectively erupted >13,500 km3 of magma. Source
areas for some of the older volcanic units (>14 Ma) in the Bullfrog Hills are less well known, whereas the younger small-volume
tuffs and lavas (11-10 Ma) appear derived mainly from flow domes within the Bullfrog Hills (Noble et al., 1991; Connors, 1995;
Weiss et al., 1995).
Large-scale
extension of the Bullfrog Hills in the mid- to late-Miocene led to moderate to steep eastward tilting of rocks along listric normal
faults in the hanging wall of a major low angle fault zone, recently referred to as a “detachment fault” (e.g., Hamilton,
1988, Maldonado 1990a, b). Most of the extensional faulting and tilting in the Bullfrog Hills temporally overlapped with volcanism
in the southwestern Nevada volcanic field and with eruption of local tuffs and lavas in the Bullfrog Hills. Precious metal mineralization
in the southern Bullfrog Hills occurred during the final episodes of large-scale extension and tilting.
| 6.2 | Local
and Property Geology |
Rocks
in the southern Bullfrog Hills consist of lower- and upper-Proterozoic metamorphic rocks, Paleozoic marine sedimentary rocks,
and Cenozoic volcanic and sedimentary rocks; Mesozoic sedimentary rocks are absent. Tertiary volcanic and less abundant sedimentary
rocks are exceptionally well exposed and record an episode of major crustal extension and volcanism and are the principal hosts
to precious metal deposits. The Proterozoic and Paleozoic rocks are only exposed locally, and because they have limited potential
for hosting economic precious metal deposits in the area they were not studied in detail and are only discussed briefly here.
FORTE DYNAMICS, INC
120 Commerce Drive., Units 3 & 4, Fort Collins, CO 80524 | P a g e | 60 of 178 | December 2023 |
| | Augusta Gold Corp. |
Figure
6-2: Bullfrog District – Stratigraphy and Mineralization
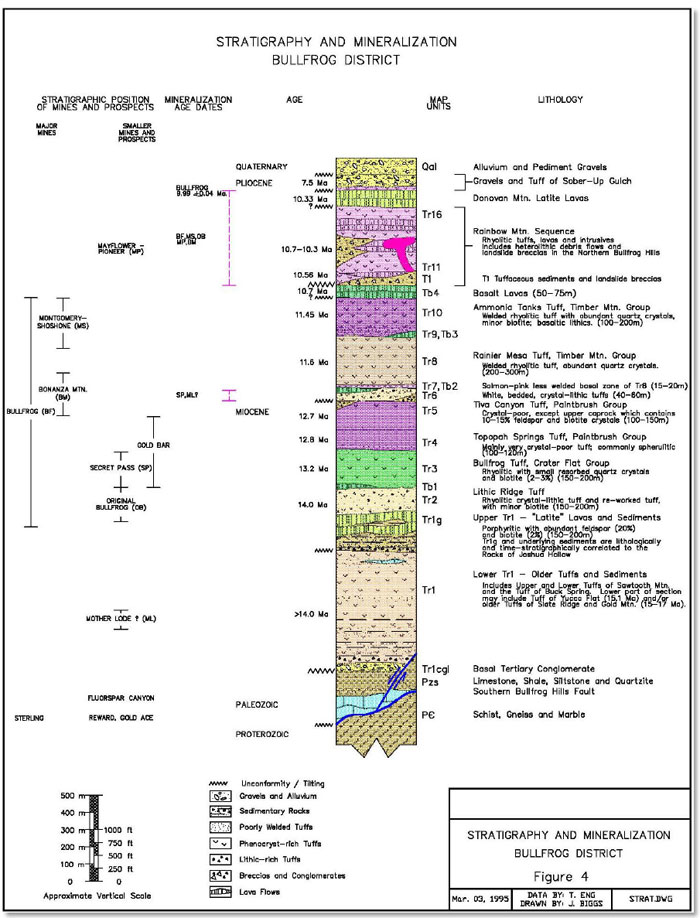
FORTE DYNAMICS, INC
120 Commerce Drive., Units 3 & 4, Fort Collins, CO 80524 | P a g e | 61 of 178 | December 2023 |
| | Augusta Gold Corp. |
Figure
6-3: Cross Section of the Bullfrog Project Area
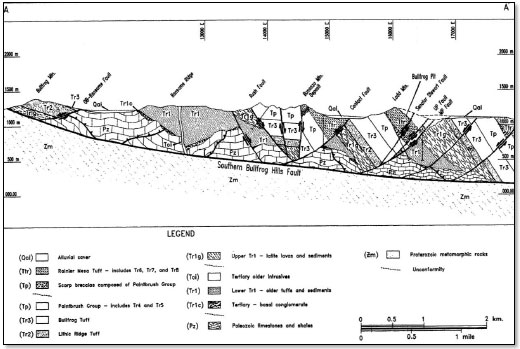
The
Tertiary section in the southern Bullfrog Hills is dominated by volcanic rocks, in particular ash-flow tuffs, and subordinate
interbedded volcaniclastic and epiclastic sedimentary rocks. These rocks range in age from >14 Ma to about 7.5 Ma in the southern
Bullfrog Hills.
Pre-14
Ma rocks are a heterogeneous assemblage of variably welded crystal-poor to crystal-rich ash-flow tuffs, conglomerate and fanglomerate,
pumiceous gritstones, tuffaceous sedimentary shales (locally carbonaceous and calcareous), and a capping sequence of porphyritic
lava flows and associated ruffs. This group of rocks comprises almost half of the Tertiary section (approximately 2.5 km aggregate
thickness) and is the least understood because of abrupt facies changes, several nondescript units, and widespread alteration.
| 6.2.2.1 | Basal
Fanglomerate and Breccia |
The
unit is discontinuously exposed along the southwest foot of Ransome Ridge, where it forms a clast-supported fanglomerate or breccia,
including cobble- to boulder-size clasts of Paleozoic limestone, quartzite, phyllitic shale, and lesser Tertiary porphyritic volcanic
rocks. A coarse-grained feldspathic-lithic sandstone comprises the matrix. The unit is interpreted to mark a basal Tertiary fanglomerate
shed from nearby highlands underlain mostly by Paleozoic rocks.
FORTE DYNAMICS, INC
120 Commerce Drive., Units 3 & 4, Fort Collins, CO 80524 | P a g e | 62 of 178 | December 2023 |
| | Augusta Gold Corp. |
| 6.2.2.2 | Tuffs
and Tuffaceous Sedimentary Rocks of Buck Spring |
These
rocks are the oldest clearly volcanic and volcaniclastic rocks in the district and are exposed in the immediate footwall of the
Ransome fault. Overlying these lower units is a compound cooling unit consisting of a lower poorly to moderately welded crystal-lithic
ash-flow tuff overlain by a thick densely welded crystal-rich ash-flow tuff. Total thickness of this unit is about 175 m.
| 6.2.2.3 | Tuffs
and Tuffaceous Sedimentary Rocks of Sawtooth Mountain |
This
is also a heterogeneous sequence of rocks, subdivided into the lower and upper tuffs of Sawtooth Mountain following terminology
of Maldonado and Hausback (1990). Good outcrops of these rocks are exposed on Ransome Ridge (Figure 6-3) and on Sawtooth Mountain
3 km to the north where the combined thickness is approximately 1 km. The rocks also crop out on the east side of Beatty, but
drilling suggests that the units probably thin to the east. The lower tuff of Sawtooth Mountain is dominated by variably reworked
crystal-lithic ruffs and interbedded lacustrine and volcaniclastic sedimentary rocks that have an aggregate thickness of 370 m
to 550 m. The upper tuff of Sawtooth Mountain underlies much of Ransome Ridge and is approximately 500 m thick. It has a 10-15
m thick poorly welded base that grades abruptly into densely welded ash-flow tuff. The unit is characterized by hackly fracture
and is widely bleached and weakly silicified.
| 6.2.2.4 | Thin-Bedded
Calcareous to Carbonaceous Shales |
These
variably carbonaceous to calcareous shales and siltstones are also locally exposed in the footwall of the Bullfrog deposit. The
contact with the underlying tuffs of Sawtooth Mountain is poorly exposed; it appears to be an angular unconformity.
| 6.2.2.5 | Latitic
Flows and Associated Tuffs and Volcaniclastic Rocks (Tr1g) |
This
sequence of rocks is best exposed in central Box Canyon and in the foot-wall of the mineralized vein zone at the Bullfrog deposit.
This unit consists predominantly of porphyritic lava; variably reworked tuff occurs at the base and middle of the unit. The sequence
which has an exposed aggregate thickness of about 400 m, is collectively termed Tr1g by exploration staff at the Bullfrog mine
following an earlier stratigraphic division of rhyolite unit one of Ransome et al. (1910). The rock has been mapped and described
as quartz latite (Maldonado and Hausback, 1990). The sequence of latitic lavas and associated tuffs rests conformably on underlying
carbonaceous shales in Box Canyon. Soft sediment deformation in the shales is common in proximity to the contact. At the Bullfrog
mine, carbonaceous shales are locally interbedded with flows of latite.
Intrusive
rocks of this age group consist of diabase/diorite dikes, silicic porphyry dikes, and porphyritic quartz latite. The diabase/diorite
dikes intrude Proterozoic gneiss and schist south and southwest of the Original Bullfrog mine. They consist of fine- to medium-grained,
generally equigranular pyroxene-hornblende diabase or diorite. Unlike the rocks they intrude, the diabase dikes are un-foliated
and postdate probable Cretaceous age metamorphism (Hoisch et al., in press). The diabase dikes have not been observed to intrude
Tertiary volcanic and sedimentary rocks. Silicic porphyry dikes consist of a quartz porphyry and feldspar porphyry. Both rock
types contain about 25% phenocrysts of mostly plagioclase and (or) quartz. The dikes are exposed on Ransome Ridge where they intrude
the lower tuff of Sawtooth Mountain. The quartz porphyry dikes are typically moderately to strongly propylitized, whereas the
feldspar porphyry dikes are relatively fresh suggesting that they may be younger. Porphyritic quartz latite forms dikes that fill
faults and small plugs. The rock is only observed intruding porphyritic latite lavas at the top of the pre-14-Ma age group of
rocks in central Box Canyon. The rock is lithologically like the intruded latite lavas, but it contains several percent quartz
phenocrysts. It may represent the eroded parts of flow domes that fed the latite lavas.
FORTE DYNAMICS, INC
120 Commerce Drive., Units 3 & 4, Fort Collins, CO 80524 | P a g e | 63 of 178 | December 2023 |
| | Augusta Gold Corp. |
This
age group consists of rocks ranging from the 14.0-Ma Lithic Ridge Tuff to the 11.45-Ma Ammonia Tanks Tuff. Most of the rocks of
this age group are units of rhyolite ash flow tuff erupted from calderas in the southwestern Nevada volcanic field and have a
total thickness of approximately 1.5 km in the southern Bullfrog Hills.
| 6.2.3.1 | 14.0-Ma
Lithic Ridge Tuff (Tr2) and Basalt Flow One (Tbl) |
The
Lithic Ridge Tuff is prominently exposed in the hills north of Ransome Ridge and on Bullfrog Mountain, where the total thickness
is about 270 m. Most of the unit consists of poorly to moderately welded, crystal-lithic rhyolite ash-flow ruff, containing as
much as 20% lithic clasts of mainly intermediate to mafic volcanic rocks.
| 6.2.3.2 | Bullfrog
Tuff (Tr3) |
The
Bullfrog Tuff is exposed on Bullfrog Mountain, and more locally on the lower southwest flank of Ladd Mountain and in the Bullfrog
open pit. The Bullfrog Tuff is the middle unit of the Crater Flat Group, and is the principal unit exposed in the southern Bullfrog
Hills; it corresponds to what Ransome et al. (1910) mapped as rhyolite three. Radiometric age (40Ar/39Ar)
for the Bullfrog Tuff is 13.25 ± 0.04 Ma (Sawyer et al., 1994).
| 6.2.3.3 | Tuffs
of the Paintbrush Group (Tr4, Tr5) |
The
Topopah Spring (Tr4) and overlying Tiva Canyon (Tr5) Tuffs comprise the Paintbrush Group in the southern Bullfrog Hills. These
tuffs have 40Ar/39Ar ages of 12.8 ± 0.03 Ma and 12.7 Ma ± 0.03 Ma, respectively (Sawyer et
al., 1994) and broadly correlate with rhyolite units four and five of Ransome et al. (1910). The Topopah Spring Tuff thickens
eastward from 25 m on Bullfrog Mountain, to 110 m on the lower western flank of Ladd Mountain. Lithologically, it is a densely
welded fine-grained, very crystal-poor ash-flow tuff. The unit contains 1% crystals of feldspar, except in the uppermost 3-5 m
where the crystal content increases to 5%. The unit is also shard-rich and fiamme-poor. In many places, the Topopah Spring Tuff
is characterized by a vuggy to knobby or pimply appearance due to pronounced spherulitic or lithophysal devitrification.
The
Tiva Canyon Tuff (Tr5) is exposed over a wide area from Bullfrog Mountain on the west to Ladd Mountain on the east. It is separated
from the underlying Topopah Spring Tuff by a thin layer (<1 m) of reworked tuff. Total thickness of the Tiva Canyon Tuff ranges
from about 215 m on Bullfrog Mountain to approximately 120 m along the west side of Ladd Mountain. The Tiva Canyon Tuff consists
of two mappable subunits. The lower subunit (Tr5a) consists of a 5 m thick poorly welded devitrified zone that grades upward into
densely welded tuff containing dark grey wavy lenticles in its lower part. The lower subunit contains 3-5% crystals of sanidine,
and ranges in thickness from about 100 m on Ladd Mountain to 150 m at Bullfrog and Bonanza Mountains. The contact between the
lower and upper subunits is marked by a thin (<1.0 m) laterally persistent horizon of spherulitic devitrification. The upper
subunit (Tr5b), for most of its extent, forms a lithological distinctive caprock distinguished by 10- 15% crystals of feldspar
and conspicuous biotite. The upper subunit of Tr5 ranges in thickness from 70-75 m on Bullfrog Mountain to about 15 m on the west
side of Ladd Mountain.
FORTE DYNAMICS, INC
120 Commerce Drive., Units 3 & 4, Fort Collins, CO 80524 | P a g e | 64 of 178 | December 2023 |
| | Augusta Gold Corp. |
| 6.2.3.4 | Monolithic
(Paintbrush Group) Scarp Breccia (Tr5c) |
Overlying
the upper subunit of the Tiva Canyon Tuff is a newly identified, a restricted avalanche or scarp breccia (Tr5). The unit is locally
exposed in the hanging wall of the Rush fault in Box Canyon (Figure 6-3), where it ranges in thickness from 0-30 m and consists
of lenses of mostly monolithic clast supported fragments of Topopah Spring and Tiva Canyon Tuffs.
| 6.2.3.5 | Bedded
Tuffs and Local Debris Breccias (Tr6) |
This
distinct unit consists mostly of an interbedded mixture of light-colored, poorly welded crystal-lithic rhyolite ash-flow tuff
and tuffaceous sedimentary rocks. Sanidine from an ash-flow tuff layer at the base of the sequence (Huysken et al., 1994) indicating
that deposition of these rocks began almost immediately after eruption of the 12.7-Ma Tiva Canyon Tuff. The unit is about 40-50
m thick on Bonanza and Ladd Mountains but thickens rapidly eastward to as much as 200 m in the southwest portion of the Bullfrog
open pit. West of Box Canyon, however, Tr6 pinches out and it is absent on Bullfrog Mountain.
| 6.2.3.6 | Basalt
Flow Number Two (Tb2) |
This
basalt flow is exposed on Sutherland Mountain (located between Bonanza Mountain and Box Canyon) where it forms the conspicuous
dark layer below the summit. The unit is restricted in area as evidenced by its discontinuous presence just to the east on Bonanza
Mountain, and its general absence on Ladd Mountain and in the Bullfrog pit Thickness ranges from 0-18 m.
| 6.2.3.7 | Tuffs
of the Timber Mountain Group (Tr7, 8, 9, 10) |
This
sequence consists of the Rainier Mesa and Ammonia Tanks Tuffs, which have 40Ar/39Ar ages of 11.6 Ma
± 0.03 and 11.45 ± 0.03 Ma, respectively (Sawyer et al., 1994). They are well exposed throughout the southern Bullfrog
Hills and have an aggregate thickness of about 600 m. The Rainier Mesa Tuff (Tr7, Tr8) consists of a salmon-pink, poorly to moderately
welded base (Tr7) that grades upward into a brown purple, densely welded interior that comprises the bulk of the tuff (Tr8). The
main densely welded part of the Rainier Mesa Tuff can be sub-divided, in many places, into three subunits—a lower subunit
of moderately welded fiamme-rich quartzose tuff, a middle subunit of densely welded quartzose tuff containing 15-20% crystals,
and a capping subunit marked by noticeable increase in biotite (l.0-1.5%). Lithics are sparse throughout. The Rainier Mesa Tuff
is about 400 m thick on Ladd Mountain and is a main host for mineralization at the Bullfrog deposit.
In
most places the Rainier Mesa Tuff is overlain by a massive to vesicular flow of basalt (Tb3). The basalt forms subdued outcrops
but is well exposed in the north wall of the Bullfrog open pit, where the unit is 20-25 m thick. At the Montgomery-Shoshone deposit,
the basalt flow is generally absent, and a 1-3 m thick basaltic, chlorite-bearing gritstone and reworked tuff horizon is present.
FORTE DYNAMICS, INC
120 Commerce Drive., Units 3 & 4, Fort Collins, CO 80524 | P a g e | 65 of 178 | December 2023 |
| | Augusta Gold Corp. |
The
Ammonia Tanks Tuff consists of a poorly welded base (Tr9) that grades upward into light grayish, moderately to densely welded
tuff that comprises most of the tuff (Tr10). In and near the Montgomery-Shoshone deposit, a distinctive light green to dark gray
vitrophyre is present near the base and is about 5 m thick. The Ammonia Tanks Tuff has a maximum exposed thickness of about 250
m.
Intrusive
rocks of this age group are volumetrically minor in the southern Bullfrog Hills and consist of crystal-poor rhyolite and basalt
dikes. The rhyolite occurs as small bodies intruding latite lava (Tr1g) and the Topopah Spring Tuff (Tr4) near Box Canyon. The
rhyolite is crystal-poor to aphyric and is typically finely flow laminated. Dikes of basalt are the most widespread intrusive
rock.
| 6.2.4 | Post
11 Ma to 7.6 Ma Rocks |
This
age group includes a basal flow of basalt overlain by epiclastic breccias and conglomerates, a thick sequence of tuffs and lavas,
and locally capping gravels and intercalated ash- flow tuff. The thick sections of tuffs and lavas have been referred to as the
tuffs and lavas of the Bullfrog Hills (Noble et al., 1991; Connors, 1995; Weiss et al., 1995) and as the rhyolite tuffs and lavas
of Rainbow Mountain (Maldonado and Hausback 1990).
| 6.2.4.1 | Basalt
Flow Number Four (Tb4) |
This
basalt forms subdued exposures north and south of highway 374 south of Burton Mountain (Figure 6-2). There, the basalt
has an exposed true thickness of about 200 m, but it is thinner elsewhere. A K-Ar age of 10.3 ± 0.4 Ma is reported for
this unit (Marvin et al., 1989; Maldonado and Hausback, 1990). A lithological similar basalt flow at the same stratigraphic position
in Fluorspar Canyon east of Beatty yielded a K-Ar age of 10.7 ± 0.2 Ma (Monsen et al., 1992). In the southern Bullfrog
Hills, angular discordance between the basalt and underlying Ammonia Tanks Tuff (Tr10) is probably minor (<5°).
| 6.2.4.2 | Epiclastic
Rocks and Breccias |
This
unit overlies basalt Tb4 and is best exposed north of highway 374 about 1.5 km west of Beatty. These rocks weather into conspicuous
pale green to reddish pink northwest-trending hogbacks. Ransome et al. (1910) designated this sequence as tuff unit one (t1),
and Maldonado and Hausback (1990) mapped the unit as sedimentary rocks and tuff. The unit thins to the northwest and is absent
along the west base of Rainbow Mountain. Near the Mayflower and Pioneer mines in the northern Bullfrog Hills, this sedimentological
diverse section of rocks was mapped as an early phase of a debris flow sequence (Conners et al., in Conners, 1995). In areas west
of Beatty, the unit is comprised of thinly bedded tuffaceous shale, siltstone, and local pebbly conglomerate, coarse fanglomerates,
and mega-breccia slide blocks. Dips of bedding decrease upward through the unit from 45-50° at the base to about 30-35°
at the top. Breccia deposits in the unit are heterolytic to monolithic with clasts ranging from <1 m to several meters across.
In some breccia deposits, clasts rest in a muddy matrix suggesting deposition into a shallow lake from nearby over-steepened slopes.
Stratigraphically lower breccia deposits contain clasts derived from underlying basalt flow four, whereas higher breccia deposits
contain clasts from the Rainier Mesa and Ammonia Tanks Tuffs. A megalithic block (-100 m long) of a portion of the Rainier Mesa
Tuff and underlying bedded tuffs (Tr6) occurs near the top of the unit just north of highway 374. The upward change of breccia
clasts in the unit suggests progressive uplift and erosion of the source rocks from which the breccia deposits were derived.
FORTE DYNAMICS, INC
120 Commerce Drive., Units 3 & 4, Fort Collins, CO 80524 | P a g e | 66 of 178 | December 2023 |
| | Augusta Gold Corp. |
| 6.2.5 | 10.6-10.0
Ma Rainbow Mountain Sequence (Trm, Tr11-16 and other units) |
This
sequence is well exposed on Rainbow Mountain and nearby Black Peak. Total thickness of section exposed in these areas is about
760 m. New 40Ar/39Ar ages from this study indicate most of the sequence was deposited between 10.6 and 10.3
Ma. Unlike the ash-flow tuffs of the 14-11 Ma group which came from calderas to the east, these deposits are locally derived from
scattered plugs and volcanic domes in the Bullfrog Hills.
| 6.2.5.1 | Basalt,
Gravels of Sober-up Gulch, and Stonewall Flat Tuff |
These
rocks are exposed mainly in the east-central and northern Bullfrog Hills and are essentially flat lying. The gravels of Sober-up
Gulch are loosely consolidated alluvial deposits containing well-rounded pebbles and boulders of pre· dominantly locally
derived Tertiary volcanic rocks. The Spearhead Member of the Stonewall Flat Tuff is locally interbedded with the gravels of Sober-up
Gulch (Noble et al., 1991) and has a 40Ar/39Ar age of 7.61 ± 0.3 Ma (Hausback et al., 1990).
Few
intrusive rocks of this age group occur in the southern Bullfrog Hills. However, rhyolitic plugs and domes are common in the central
and northern Bullfrog Hills where they appear to mark the sources of the flows and ash-flow tuffs of the Rainbow Mountain sequence
(Maldonado and Hausback, 1990; Noble et al., 1991; Weiss et al., 1995). They are sparsely to moderately porphyritic and contain
phenocrysts of quartz, plagioclase, sanidine, and accessory biotite.
| 6.2.5.3 | Timing
of Tertiary Deformational Events |
The
oldest Tertiary structural event is recorded by the basal Tertiary fanglomerate and breccia, which consists of mainly Paleozoic
clasts, but also includes Tertiary volcanic rocks. Uplift and erosion that produced these localized deposits of fanglomerate and
breccia took place prior to 15 Ma as indicated from previously discussed stratigraphic relationships. Continued episodic structural
events between about 15 Ma and 14 Ma are indicated by local angular unconformities, and by variable thicknesses and abrupt
lateral fades changes of rock units laid down during this time. East of the district on the lower northeast flank of Bare Mountain,
Fridrich, 1999 documents a major angular unconformity between a round stone conglomerate and overlying carbonaceous sedimentary
rocks of Joshua Hollow (Monsen et al., 1992), indicating that tectonic activity was widespread in the region prior to 14 Ma.
A
significant episode of faulting occurred at about 12.7 Ma as evidenced by (1) fault scarp breccia and coarse conglomerate that
directly overlies the 12.7 Ma Tiva Canyon Tuff and underlies the inferred 12.7 Ma base of Tr6 in the hanging wall of the
Rush fault, (2) absence of Tonopah Spring and Tiva Canyon Tuffs in the Bullfrog pit and presence instead of volcaniclastic debris
breccia whose clasts consist of those units and of older rocks, and (3) a modest angular unconformity (10-20°) between the
Tiva Canyon Tuff and overlying bedded tuffs in the lower and middle parts of Tr6 on the west side of Ladd Mountain. This episode
of faulting appears to have been quite widespread as evidenced by a major angular unconformity between the Paintbrush and Timber
Mountain Groups in upper Fluorspar Canyon (Monsen et al., 1992) and by the presence of landslide breccias intersected in drill
holes along the west side of Crater Flat (the valley east of Bare Mountain) that lie between the Paintbrush and Timber Mountain
Groups in the hanging wall of the Bare Mountain fault (Fredrich, 1999). The next episode of faulting in the southern Bullfrog
Hills is chronicled by a syntectonic sedimentary unit that lies between a 10.7-Ma basalt flow (Tb4) and the lowest part of the
Rainbow Mountain sequence dated at 10.56 Ma. During this time 15-20° of eastward tilting occurred. Most of the Rainbow Mountain
sequence is tilted uniformly about 30° east. Although negligible differences in tilting are evident, episodes of faulting
are recorded by intercalated lenses of fanglomerate and breccia that punctuate the Rainbow Mountain sequence. Between the latite,
dated at 10.33 Ma, and the capping quartz-bearing latite, the tilt decreases 10-15° indicating a renewed phase of tilting
between 10.3 and about 10 Ma. The final 15° of tilting occurred between about 10 Ma and the time of deposition of an un-tilted
basalt dated at 8.1 Ma in the western Bullfrog Hills (Marvin et al., 1989).
FORTE DYNAMICS, INC
120 Commerce Drive., Units 3 & 4, Fort Collins, CO 80524 | P a g e | 67 of 178 | December 2023 |
| | Augusta Gold Corp. |
The
District is located in the southern Walker Lane trend within brittle upper plate volcanic host rocks that were severely broken
from dominant detachment faulting and associated dip-slip and strike-slip displacements. Epithermal solutions permeating the broken
host rocks in the Bullfrog, M-S and Bonanza areas precipitated micron-sized but relatively high-grade gold within major quartz-calcite
veins and disseminated gold in associated stock works. The veins contain very little gangue minerals other than quartz, calcite
and manganese oxides, the latter of which contributes to low silver recoveries. The Montgomery system occurs on the east side
of the M-S pit, strikes northerly and dips 70-85° west. The Polaris fault occurs on the west side of the pit, strikes nearly
due north and dips 50-60° west.
Detachment-related
structures and mineral trends are projected to extend onto the Company’s lands to the north and east of the M-S open pit
and deep drill holes intercepted thick zones of lower-grade mineralization that are 300 meters below the existing pit. Prior to
oxidation the veins contained less than 2% sulfides, the low content of which is favorable with respect to processing and environmental
concerns. Surface geology is shown in Figure 6-4.
FORTE DYNAMICS, INC
120 Commerce Drive., Units 3 & 4, Fort Collins, CO 80524 | P a g e | 68 of 178 | December 2023 |
| | Augusta Gold Corp. |
Figure
6-4: District Geology Map — Each Section is 1.6 km, or 1 Mile Square

| 6.4 | Mineralization
and Veining |
The
gold mineralization of the southern Bullfrog Hills is contained in epithermal quartz-calcite veins and stockworks. The main host
rocks are middle Miocene volcanic rocks ranging from latite lavas (Tr1g, >14 Ma) to rhyolitic Ammonia Tanks Tuff (Tr10, 11.45
Ma).
| 6.4.1 | Bullfrog
Mineralization |
The
strike length of the Bullfrog mineralization is about 1,600 m, including the underground portion which accounts for about 600
m of the strike length. True widths mined in the underground, where the ore cutoff was 3.0 g/t Au, typically average 5-10 m and
local zones may be as much as 15-20 m wide. The highest grades typically correlate with zones of black manganese-rich material,
where much of the early manganiferous calcite has been leached out, rendering the vein a rubble zone of quartz, calcite, and wad.
Veins continue up dip and down dip, but the gold grades and thicknesses diminish rapidly above and below these elevations.
As
in the underground mine, the highest grades in the open pit were associated with veins and vein breccias along the MP fault and
its immediate hanging wall. Higher ore grades also occurred in veins along the UP fault, but widths were generally narrow. Zones
of quartz stockwork veins and breccia were developed between the MP and UP faults in intensely silicified and adularized wall
rocks. The ore zone in the hanging wall of the MP fault, was termed the upper stockwork zone (Jorgensen et al., 1989). Many of
the stockwork veins are subparallel in strike to the MP and UP faults, but dip more steeply. A zone of stockwork quartz veins
also occurs in the footwall latite lavas (Tr1g) immediately beneath the MP fault, but here the ore zone is usually <10-15 m
thick. This was termed the lower stockwork zone (Jorgensen et al., 1989). In this zone individual veins are often subparallel
to the MP fault, and vein densities are typically in the range of 5-15%.
FORTE DYNAMICS, INC
120 Commerce Drive., Units 3 & 4, Fort Collins, CO 80524 | P a g e | 69 of 178 | December 2023 |
| | Augusta Gold Corp. |
In
most parts of the open pit, mineralized rock is truncated by the erosional surface and gravels. The ore zone thinned up-dip and
only a modest amount of ore was probably lost to erosion. Below the open pit, ore grade values persist.
In
the Bullfrog mineralization, the high-grade zones do not comprise obvious discrete plunging ore shoots. Instead, high-grade ore
zones are developed along the plane of the MP fault/vein, within 10-20° of the dip of the fault. The overall geometry of these
zones is that of elongate lenses in the plane of the fault, with long dimensions that strike roughly north-south at a low angle
of plunge. The highest gold grades roughly coincided with the oxidation-reduction boundary in the deposit and the pre-mining water
table, and modest localized supergene enrichment of precious metals near this boundary is suggested.
The
zoning patterns of ore grades, veins, and altered rock indicate that the MP-UP fault system was the main ore control and fluid
pathway for the Bullfrog mineralization. Minor local changes in the strike and (or) dip of these faults created dilatant zones
aiding deposition of gold, particularly some of the higher-grade ore. Northeast-trending faults were also an important control,
acting as secondary fluid pathways and providing additional ground preparation. This is indicated by changes in ore character
and geometry where these faults intersect the MP-UP fault system. As in most epithermal systems, physicochemical conditions limit
precious metal ore deposition to a particular vertical interval. In the case of the Bullfrog mineralization, the apparent maximum
extent is 250-300 m, between about 1,075 and 775 m in elevation. Supergene and (or) hypogene oxidation may have also aided in
local enrichment of ore and is supported by the location of higher gold grades near the redox boundary and the pre-mining water
table. The common occurrence of visible gold (electrum) in limonitic pyrite casts is also evidence for the concentration of gold
during oxidation. However, unlike porphyry copper deposits, the enrichment and redeposition of precious metals was probably over
the scale of millimeters or micrometers (Castor and Sjoberg, 1993).
| 6.4.2 | Montgomery-Shoshone
Mineralization |
The
main host for the Montgomery-Shoshone deposit is the lowermost part of unit Tr10 (Ammonia Tanks Tuff, 11.45 Ma). The uppermost
portion of unit Tr8 (Rainier Mesa Tuff, 11.6 Ma) is a less important host, along with Tb3, basalt dikes, and (or) unit Tb4. Basalt
flow Tb4 appears to have acted as a barrier to ore fluids (Jorgensen et al., 1989), as virtually no mineralized rock occurs stratigraphically
above unit Tr10 in the rhyolite tuffs and lavas of the Rainbow Mountain sequence, even though these rocks are all pre-mineral
in age. The best marker bed is Tb3, which at Montgomery-Shoshone consists mainly of a 1-3 m thick irregular zone of basaltic,
chlorite-bearing volcanic gritstone and re-worked tuff; a thin irregular basalt flow is less common at this horizon. The base
of Tr10 is often a useful marker and consists of a light greenish or dark gray zone of more densely welded and vitrophyric tuff;
the vitrophyric portion is usually less than 5-6 m thick.
Altered
rocks are similar to those at the Bullfrog deposit, although rocks are more strongly clay altered and oxidized at Montgomery-Shoshone.
Unlike at Bullfrog, carbon-pyrite is absent at depth. In the hanging wall of the deposit, rocks of the Rainbow Mountain sequence
are argillized and bleached and contain 1-2% fine-grained disseminated pyrite. Wall rocks adjacent to veins and stockwork zones
are typically flooded with silica-adularia, especially in Tr8 (Rainier Mesa Tuff) in the footwall of the deposit. Such silicified
and adularized rock is absent, however, in the Rainbow Mountain sequence. Basalts of Tb4 in the hanging wall of the deposit are
mostly unaltered, except along their margins near faults where they are argillized and clay altered.
FORTE DYNAMICS, INC
120 Commerce Drive., Units 3 & 4, Fort Collins, CO 80524 | P a g e | 70 of 178 | December 2023 |
| | Augusta Gold Corp. |
There
are two key structures for controlling mineralization at M-S: the Montgomery and Polaris faults. At the northern end of the deposit,
these faults are about 100-150m apart. The Montgomery fault occurs on the east and strikes northerly and dips 10-85 degrees west.
In the southern part of the deposit the fault strikes about N30-40 degrees east. The Montgomery is actually composed of a series
of several subparallel faults developed over a width of about 25-35 meters, which collectively has about 70-80 meters of normal
displacement. The Polaris fault strikes almost due north for most of its extent (about 500 m), and dips about 50-60 degrees west,
and has slightly less displacement than the Montgomery.
The
Contact fault is a major structure that bounds the mineralization on the north side of the deposit. The fault is composed of a
series of splays developed over a width of 100-200 meters, which has an average strike of N60 degrees E and dips of 60 degrees
NW. Net stratigraphic offset across the Contact fault zone is on the order of 400-600 meters. In the upper portion of the deposit
(above 1200m), the Contact fault is postmineral in age, as both the Polaris and Montgomery zones are clearly terminated, and fault
gouge and breccia contain clasts of crushed vein. In the lower portion of the deposit the, Ransome (1910) described and mapped
the “contact vein” which is developed along the fault as well as narrow veins in the footwall. Based on these observations,
the Contact fault is interpreted to be pre-mineral in age but was later reactivated.
Mineralized
zones at Montgomery-Shoshone consists mainly of stockwork quartz-calcite veins forming 5-35% of the rock, with less abundant narrow
irregular quartz-calcite-Mn oxide veins generally <1-3 m wide. Many of the textures that typify the high-grade veins at the
Bullfrog deposit—such as strong banding and chaotic vein breccia—are absent, and it appears that the main-stage event
was not as well developed. The widest zones of mineralization developed are along the Montgomery zone north of about 9,900N, and
may locally be as much as 60-80 m wide. However, individual mineralized zones with >0.5 - 1 g/t Au in many portions of the
deposit are commonly only 10-30 m wide, and the continuity of mineralization down dip and along strike is relatively poor.
Ransome
(1910) noted that most of the higher-grade veins were localized within about 45 m of the basalt (Tb4) at the Contact fault, and
that the veins decreased in grade and thickness below the 300 level (1,170 m). The veins were explored in these workings to about
1,050 m in elevation (700 level). The structures and veins continue below the 1,125 m elevation level, but as at the Bullfrog
deposit, the grade and thickness of the mineralized zones uniformly diminish, with much of the rock containing only 0.1-0.5 g/t
Au. However, deep exploration drilling encountered thick intervals of mineralized rock about 200-250 m in elevation below the
current pit; the controls for this mineralized zone are unclear and further evaluation continues.
The
veins generally increase in calcite content along strike to the south, as well as down dip, and this corresponds to a general
decrease in the grade of mineralized rock; a similar change was noted by Ransome (1910). The Polaris vein zone exposed in the
south pit high wall, consists of friable and leached, gray-brown quartz pseudomorphs after calcite, with minor Mn oxides. These
types of veins characterize much of the southern half of the deposit and are uniformly of low grade or below pit cutoff (0.50
g/t Au).
FORTE DYNAMICS, INC
120 Commerce Drive., Units 3 & 4, Fort Collins, CO 80524 | P a g e | 71 of 178 | December 2023 |
| | Augusta Gold Corp. |
| 6.4.3 | Bonanza
Mineralization |
Primary
host rocks for mineralization at Bonanza Mountain are unites Tr5b (upper most Tiva Canyon Tuff), Tr6 and Tr7 (lower most Rainier
Mesa Tuff). The majority (>60%) of the mineralization is between the contact of Tr5b and Tr6, which suggests some stratigraphic
control, with fluid migration outward from the main mineralized faults along this permeable horizon. The wall rocks in the vicinity
of the deposit are silica flooded and adularized, especially Tr6 and Tr5a.
The
rocks at Bonanza Mountain are cut by a complex series of normal faults, all with relative minor displacements. The two primary
structures are the Hobo and Scepter faults, which together define a narrow, northerly-trending graben structure 700-100 meters
wide. The Hobo fault defines the east side of the graben, is better mineralized and dips 55 degrees west. Displacement on the
Hobo is as much as 90-100 meters. The Scepter bounds the west side of the graben and has as much as 50-100 meters of displacement.
The Scepter dips mainly east at about 75-85 degrees.
Mineralization
at Bonanza Mountain consists of irregular quartz-calcite-Mn veins and stockworks emplaced along faults. The veins are usually
less than 5-10 meters wid. By volume, the bulk of the mineralization (<75%) is contained in stockwork with an average vein
density between 5-20 percent. The quartz is typically fine-grained and may be locally interlayered with medium-grained calcite.
Overall, the veins are similar to those of the Bullfrog mineralization, although cockscomb and drusy quartz, replacement of bladed
calcite by quartz and banded quartz are less common.
Fine-grained
gold as much as 0.1-0.2 mm has been observed in some of the highest-grade historic drill cuttings and was associated with limonite
after pyrite. Very local high-grade values (15-30 g/t) were found in a few historic drill holes but are difficult to correlate.
The higher grades at Bonanza extend for a strike length of 300 meters. Two to three discrete sub-parallel mineralized zones are
associated with the Hobo and Scepter structures, these individual zones are as much as 15-20 meters wide in true thickness. Veins
and continuity of mineralization grades are very erratic – hence the area was historically drilled on 25-meter centers.
The
Bonanza Mountain and Bullfrog areas are geochemically similar. Bonanza Mountain has a very low Ag:Au ratio averaging around 1:1.
Epithermal Au pathfinder elements are also very low, although similar to Bullfrog and Montgomery-Shoshone, preliminary data suggest
that As and Mo may be weekly anomalous in the silica-adularia flooded wall rocks adjacent to the veins. The age of mineralization
at Bonanza Mountain is probably about 10 Ma on adularia-gold mineralization from the Rush fault, about 1 km northwest of Bonanza
Mountain.
The
gold deposits of the southern Bullfrog Hills are contained in epithermal quartz-calcite veins and stockworks. The main host rocks
are middle Miocene volcanic rocks ranging from latite lavas (Tr1g, >14 Ma) to rhyolitic Ammonia Tanks Tuff (Tr10, 11.45 Ma).
The veins contain little gangue other than quartz, calcite, and manganese oxides; adularia is present in trace to minor amounts,
but it is usually microscopic. Fluorite and barite were noted during the development of the Bullfrog deposit (Jorgensen et al.,
1989), but these minerals were only rarely observed during mining. The veins are commonly banded and crustiform, and although
now mostly oxidized, originally contained minor amounts (<1-2%) of sulfide minerals, principally pyrite. The deposits fit the
“adularia-sericite” type classification of Heald et al. (1987), although adularia and sericite (or illite) are only minor
or trace constituents in the veins.
FORTE DYNAMICS, INC
120 Commerce Drive., Units 3 & 4, Fort Collins, CO 80524 | P a g e | 72 of 178 | December 2023 |
| | Augusta Gold Corp. |
The
deposits would also fit the “low-sulfidation” or “low-sulfur” classification (Sillitoe, 1993; Bonham, 1988)
due to the impoverishment of sulfides and sulfates. The veins and stockworks fill open spaces and are often sheeted. They are
hosted and controlled by northerly striking normal faults with modest to large displacements (50-1000 m), and moderate to steep
dips (35-85°). Northeast-striking faults are also locally important but are generally less mineralized. Within and adjacent
to the veins and stockworks, the volcanic wall rocks are pervasively replaced by very-fine-grained hydrothermal quartz and adularia,
and, where unoxidized, may contain 1-3% disseminated pyrite. In proximity to the deposits, clay minerals are not especially pronounced,
except in poorly welded portions of the ash-flow tuffs, and in post- mineral fault gouge or oxidized zones.
Latite
lavas (Tr1g) in the footwall of the orebody are altered to a propylitic alteration assemblage, characterized in hand specimen
by thin fracture fillings or coatings of chlorite, calcite, and quartz, with disseminated or fracture filling pyrite. Petrographic
and lithogeochemical data indicate that these rocks become strongly hydrothermally altered as the orebody is approached, with
additions of potassium, silica, and rubidium; secondary albite also replaces plagioclase phenocrysts (Lac unpublished data; Weiss
et al., 1995). Carbon-pyrite is also present in the footwall lavas; the carbon usually occurs as sooty coatings on fractures,
but also locally occurs as glassy carbon in cavities. Laboratory studies show that the carbon is an organic, amorphous phase between
bitumen and graphite (Allison, 1993), and it was probably remobilized by hydrothermal solutions from underlying carbonaceous Tertiary
sedimentary or Paleozoic rocks.
Stratigraphic
offset across the MP and UP fault zone decreases from about 1,000 m at the north end of the pit where the two faults converge,
to about 600-800 m at the south end of the pit. As the Southern Bullfrog Hills fault is approached, offset decreases to about
500 m or less; farther south, the faults flatten and merge into or are cut off by the Southern Bullfrog Hills fault. Deep drilling
on the southwest flank of Ladd Mountain indicates that the MP-UP faults become listric down dip, flattening to about 25°.
Drilling in this area also suggests that the faults merge into or are cut off by the Southern Bullfrog Hills fault. Overall, the
MP-UP fault system appears to have a scissored normal displacement, steepening to the north away from the Southern Bullfrog Hills
fault, with generally increasing amounts of displacement as far north as the Montgomery South faults.
FORTE DYNAMICS, INC
120 Commerce Drive., Units 3 & 4, Fort Collins, CO 80524 | P a g e | 73 of 178 | December 2023 |
| | Augusta Gold Corp. |
Despite
the long history of drilling and mining at the Bullfrog Project, there is still significant exploration potential. Mineralized
zones remain open at the three historically mined areas and there are several unexplored areas within the property that exhibit
hydrothermal alteration and structural setting to host high-grade deposits. Figure 7-1 highlights the primary exploration targets
on the property.
Figure
7-1: Exploration and Mining Targets at the Bullfrog Project

FORTE DYNAMICS, INC
120 Commerce Drive., Units 3 & 4, Fort Collins, CO 80524 | P a g e | 74 of 178 | December 2023 |
| | Augusta Gold Corp. |
The
Bullfrog area has two primary target areas; Mystery Hills and Ladd Mountain.
Mystery
Hills is located on the east side of the Bullfrog deposit in the footwall of the Middle Plate Fault (MP) which is the main mineralizing
structure. The MP fault appears to be the source of epithermal solutions that mineralized the MHF. The extensions of the MH mineralized
fault down-dip and along strike have good potential for adding a large volume of low-grade mineralization to the project. Drilling
in the target area has intercepted broad zones of mineralization (>100 meters grading 0.3 g/t) which outcrops on surface and
extends at depth several hundred meters. This zone was targeted in 2020 and 2021 drilling conducted by Augusta Gold. The zone
remains open along strike and at depth and warrants additional drilling. (See Figure 7-1)
Historic
drilling suggests there are multiple mineralized structures east and along strike of the existing open pit. These mineralized
structures have the potential to host narrow HG veins with adjacent low-grade zones of stockwork mineralization. Discovery and
delineation of mineralized material under Ladd Mountain has the potential to add a significant volume of mineralized material
to the current resource and lower the strip ratio.
| 7.2 | Montgomery-Shoshone
Area |
The
M-S area has three discernible target areas that have the potential to add additional resources to the area.
The
Polaris vein and associated stockwork is one of the two primary hosts of mineralization at M-S. Historically, the northern portion
of the vein was extensively drilled and mined but the southern portion remains open along strike and down-dip. Augusta Gold drilling
in 2021 targeted the southern extension confirming the mineralization extents to the south. Additional drilling will be required
to further delineate the mineralization. Highlights from the 2021 drilling are shown in Table 7-4.
East
of the M-S pit is an area that is 700 meters by 1,300 meters and only has one shallow historic hole for which no data is available.
Only a portion of this area may be prospective, but additional study and exploration drilling is warranted. Lac’s 1994 map
shows a hole south of this area that had anomalous mineralization (BB-9 with no data available), but holes edh-18 and -19 appear
to have tested this to the south.
Deep
intercepts were encountered in four of ten deep angle holes drilled by Barrick below the M-S pit. The depths and grades of these
intercepts are not foreseeably economic, but they demonstrate that additional gold occurs in a potentially large epithermal system
with the potential for expansion and possible high-grade discovery. In this regard, there is no deep drilling northwest of holes
RDH-733, 717, 734 and 778, and no drilling south of holes RDH-732, 777 and 779.
FORTE DYNAMICS, INC
120 Commerce Drive., Units 3 & 4, Fort Collins, CO 80524 | P a g e | 75 of 178 | December 2023 |
| | Augusta Gold Corp. |
These
deep intercepts could be part of a feeder zone that created the upper M-S mineralization and may range from a limited area, or
possibly extend along strike as well as up- and down-dip. A potential mineral inventory cannot be estimated in the deep zone based
on the limited amount of drilling completed to date. Three of the deep holes also had significant shallow intercepts in the Polaris
vein/stock-works (52 meters of 1.35 g/t, 12 m of 1.14 g/t and 4.6 m of 6.03 g/t).
Holes
RDH-779 and RDH-777 were barren below 900 meters elevation, thereby limiting the down-dip extension of mineralization in RDH-732,
but there are not enough holes to fully assess this deep zone.
The
Bonanza Mountain pit area is located 2 km west of the Bullfrog deposit. Historically the area likely produced about 10,000 ounces
in the early 1900’s from several underground mines. Barrick’s open pit mining began in late 1995 with a resource of
1.3 million tonnes averaging 1.8 g/t, based on a 0.5 g/t cutoff grade and a strip ratio of 4:1. Most of the mineralization occurs
in the Hobo, Lester and Sceptre veins, which had limited widths of adjacent mineralization. Notwithstanding, the Bonanza Mountain
area has several veins that have not been thoroughly drilled to the north and south. An estimate of mineralization around the
Bonanza pit was not prepared for this report. The Company recently leased three patents and staked two claims to cover an exploration
target in the west Bonanza Mountain area; further study is required before a drill program can be proposed.
The
Gap area is located approximately 2.5 km northeast of the M-S pit. This area has been vastly under explored and has a prospective
structural setting with a strong alteration signature. There are multiple areas of interest at the Gap.
The
main splays of the Donovan fault skirt around the Gap on the western side. Proceeding east from the Donovan fault, which forms
the western boundary of the Gap area, the rocks are cut by several steep north-south trending faults with minor offset. Silicification
is locally strong along these faults, and small stockworks of translucent banded quartz +/- pyrite are rarely present. These faults
are commonly strongly oxidized, with significant hematite, and locally moderate manganese oxide present. A large damage zone,
with pervasive clay alteration and “pods” of strongly silicified rock is present within the tuff sequence. This damage
zone has a roughly linear trend to the northwest.
A
second target area is roughly centered on the Contact fault to the north-east and comprises a wide fault zone. This target area
is a north-south trending strip of land roughly paralleling the Contact fault. The Contact fault is a major district scale structure.
It is strongly brecciated in places, and pervasively silicified along its eastern side. In general, there are three structural
trends identified in this area: major north-south trending steeply dipping normal faults which host some small quartz veins, minor
east-west trending normal faults which host some small quartz veins, and moderately sized northwest-southeast trending moderately
dipping normal faults that appear to bridge the Donovan and Contact faults. Faults are weakly to moderately stained with hematite
and pyrolusite and can host discontinuous flow-banded quartz veins with colloform texture.
FORTE DYNAMICS, INC
120 Commerce Drive., Units 3 & 4, Fort Collins, CO 80524 | P a g e | 76 of 178 | December 2023 |
| | Augusta Gold Corp. |
Overall,
the Gap target demonstrates strong oxidization, clay alteration, hydrothermally breccia and pervasive silicification, with some
ashy beds within the tuffs being entirely altered to chalcedony. Flow banded rhyolites exhibit strong chalcedonic silica alteration.
Local patches of tuffs appear to have been particularly susceptible to silicification due to porosity and have locally been altered
to residual vuggy silica.
Between
1983 and 1996, 1,262 reverse circulation (RC) and core holes totaling 253,255 meters were drilled in the Bullfrog, Montgomery-Shoshone,
and Bonanza areas by Barrick and three predecessor companies who conducted sampling and assaying using customary industry standards.
Between 2020 and early 2021, Augusta drilled 30 RC holes and 39 core holes for a total of 19,225 meters, average core recovery
for Augusta drilling in 2020 – 2021 was 89%. These drill statistics are summarized in Table 7-1 and operators are listed
in Table 7-2. Tom John, Geological Consultant to Augusta Gold, and Barrick Bullfrog’s former Exploration Manager from 1995
through 1997, has presented information on the quality control of the data collected under his supervision as well as the data
obtained from the exploration departments of St. Joe, Bond International Gold, and Lac Minerals.
Augusta
Goldinitially obtained a partial electronic/digital drill hole database, but eventually scanned Barrick’s complete paper
drill-hole database stored in Elko, Nevada. These scanned files included assay certificates, geologic logs, surface and down-hole
survey data and notes, and maps prepared by site geologists. The data missing from the partial electronic/digital files was used
to create a complete digital data on 1,262 holes in the Bullfrog area.
FORTE DYNAMICS, INC
120 Commerce Drive., Units 3 & 4, Fort Collins, CO 80524 | P a g e | 77 of 178 | December 2023 |
| | Augusta Gold Corp. |
Table 7-1: Drilling Totals by Type
| Year |
Total Drilling |
Coring |
Reverse Circulation |
| Holes |
Meters |
Holes |
Meters |
Holes |
Meters |
| 1983 |
6 |
975 |
6 |
975 |
0 |
0 |
| 1984 |
37 |
3,560 |
|
0 |
37 |
3,560 |
| 1985 |
3 |
303 |
|
0 |
3 |
303 |
| 1986 |
29 |
3,364 |
|
0 |
29 |
3,364 |
| 1987 |
163 |
29,479 |
3 |
732 |
163 |
28,747 |
| 1988 |
321 |
66,325 |
32 |
6,121 |
321 |
60,204 |
| 1989 |
71 |
12,285 |
|
0 |
71 |
12,285 |
| 1990 |
154 |
37,114 |
33 |
3,676 |
154 |
33,438 |
| 1991 |
79 |
22,954 |
42 |
3,627 |
79 |
19,327 |
| 1992 |
23 |
4,907 |
|
0 |
23 |
4,907 |
| 1993 |
9 |
387 |
|
0 |
9 |
387 |
| 1994 |
210 |
31,362 |
9 |
1,412 |
210 |
29,951 |
| 1995 |
99 |
22,370 |
3 |
248 |
99 |
22,122 |
| 1996 |
58 |
15,254 |
19 |
3,329 |
45 |
11,924 |
| 2020 |
26 |
4,405 |
1 |
502 |
25 |
3,903 |
| 2021 |
43 |
14,820 |
38 |
12,749 |
5 |
2,071 |
| Total |
1,331 |
269,864 |
186 |
33,371 |
1,273 |
236,493 |
* NOTE: Many core holes were pre-collared using RC
drilling and a few included deeper RC intervals.
FORTE DYNAMICS, INC
120 Commerce Drive., Units 3 & 4, Fort Collins, CO 80524 | P a g e | 78 of 178 | December 2023 |
| | Augusta Gold Corp. |
Table 7-2: Active Years by Operator
| Operator |
Years Active |
| St. Joe American |
August 1983 - July 1987 |
| Bond International Gold |
July 1987 - November 1989 |
| Lac Minerals |
November 1989 - September 1994 |
| Barrick Bullfrog Inc. |
September 1994 - 1999 |
| 7.5.1 | 2020 - 2021 Drilling |
Twenty-seven RC holes and twenty-two core holes
were drilled by Augusta Gold in 2020 – early 2021 and were available for inclusion in the June resource model update. An additional
three RC holes and seventeen core holes were drilled later in 2021 and were available for the end-of-year model update presented in this
technical report. The purpose of this drilling program was to further define resources and ultimate limits of the Bullfrog and Montgomery-Shoshone
pits. Two holes were drilled at the Paradise Ridge Target. Table 7-3 lists the location, azimuth, dip, and total depth of each of the
2020 – 2021 holes and Figure 7-2 through Figure 7-4 show the location of the holes drilled by Augusta Gold.
FORTE DYNAMICS, INC
120 Commerce Drive., Units 3 & 4, Fort Collins, CO 80524 | P a g e | 79 of 178 | December 2023 |
| | Augusta Gold Corp. |
Figure 7-2: Plan Map of Drill Hole Collars
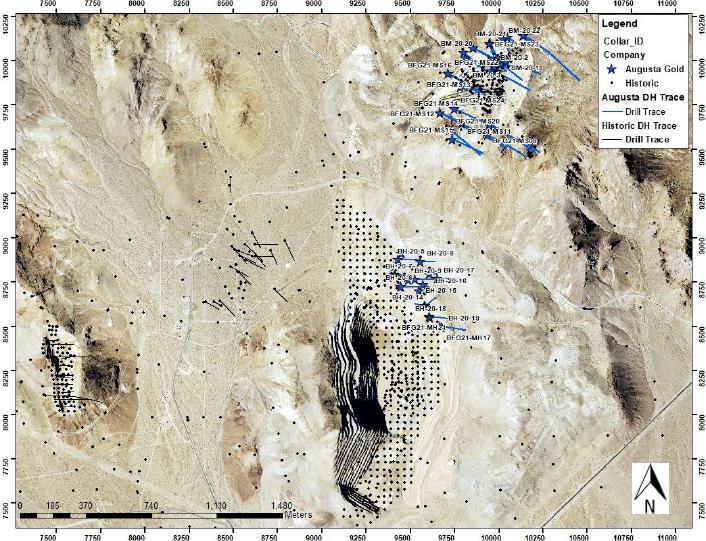
FORTE DYNAMICS, INC
120 Commerce Drive., Units 3 & 4, Fort Collins, CO 80524 | P a g e | 80 of 178 | December 2023 |
| | Augusta Gold Corp. |
Table 7-3: Location and Depth of 2020 - 2021
Holes
| Hole ID |
Easting |
Northing |
Elevation |
Azimuth |
Dip |
Total
Depth |
| BM-20-1 |
10,040 |
9,995 |
1,117 |
135 |
-70 |
68.58 |
| BM-20-2 |
9,979 |
9,967 |
1,120 |
100 |
-57 |
89.92 |
| BM-20-3 |
9,823 |
9,868 |
1,139 |
130 |
-53 |
120.4 |
| BH-20-4 |
9,450 |
8,910 |
1,143 |
90 |
-60 |
190.49 |
| BH-20-5 |
9,431 |
8,875 |
1,144 |
90 |
-60 |
220.98 |
| BH-20-6 |
9,409 |
8,839 |
1,138 |
90 |
-60 |
227.08 |
| BH-20-7 |
9,419 |
8,790 |
1,128 |
90 |
-60 |
71.63 |
| BH-20-7A |
9,416 |
8,787 |
1,128 |
90 |
-65 |
71.63 |
| BH-20-8 |
9,560 |
8,864 |
1,128 |
90 |
-57 |
141.73 |
| BH-20-9 |
9,491 |
8,764 |
1,119 |
90 |
-80 |
193.55 |
| BH-20-10 |
9,449 |
8,723 |
1,116 |
90 |
-60 |
199.64 |
| BH-20-11 |
9,530 |
8,764 |
1,127 |
90 |
-60 |
199.64 |
| BH-20-12 |
9,575 |
8,737 |
1,127 |
120 |
-60 |
138.68 |
| BH-20-13 |
9,580 |
8,613 |
1,110 |
285 |
-70 |
169.16 |
| BH-20-14 |
9,584 |
8,615 |
1,111 |
50 |
-54 |
120.4 |
| BH-20-15 |
9,552 |
8,703 |
1,117 |
0 |
-90 |
163.07 |
| BH-20-16 |
9,609 |
8,797 |
1,123 |
90 |
-60 |
120.4 |
| BH-20-17 |
9,656 |
8,768 |
1,122 |
90 |
-60 |
114.3 |
| BH-20-18 |
9,611 |
8,548 |
1,109 |
0 |
-90 |
105.16 |
| BH-20-19 |
9,682 |
8,494 |
1,104 |
90 |
-60 |
105.16 |
| BM-20-20 |
9,805 |
10,048 |
1,223 |
135 |
-58 |
211.84 |
| BM-20-21 |
9,952 |
10,103 |
1,226 |
155 |
-60 |
217.93 |
| BM-20-22 |
10,026 |
10,122 |
1,226 |
155 |
-57 |
187.45 |
| BP-20-23 |
11,560 |
8,102 |
1,110 |
65 |
-60 |
187.45 |
| BP-20-24 |
11,560 |
8,099 |
1,110 |
135 |
-60 |
266.7 |
| BFG20-MS01 |
9,858 |
10,072 |
1,223 |
114 |
-55 |
502.01 |
| BFG21-MS02 |
9,858 |
10,072 |
1,223 |
114 |
-70 |
626.06 |
FORTE DYNAMICS, INC
120 Commerce Drive., Units 3 & 4, Fort Collins, CO 80524 | P a g e | 81 of 178 | December 2023 |
| | Augusta Gold Corp. |
| Hole ID |
Easting |
Northing |
Elevation |
Azimuth |
Dip |
Total
Depth |
| BFG21-MS03 |
9,783 |
9,851 |
1,143 |
115 |
-80 |
245.67 |
| BFG21-MS04 |
9,954 |
9,632 |
1,270 |
115 |
-57 |
498.96 |
| BFG21-MS05 |
10,139 |
10,142 |
1,226 |
114 |
-60 |
648.61 |
| BFG21-MS06 |
9,954 |
9,632 |
1,270 |
115 |
-45 |
449.88 |
| BFG21-MS07 |
10,139 |
10,142 |
1,226 |
114 |
-85 |
558.09 |
| BFG21-MS08 |
9,936 |
9,581 |
1,273 |
115 |
-65 |
432.21 |
| BFG21-MS09 |
9,792 |
9,644 |
1,247 |
115 |
-45 |
392.28 |
| BFG21-MS10 |
10,054 |
10,132 |
1,228 |
114 |
-85 |
572.11 |
| BFG21-MS11 |
9,792 |
9,644 |
1,247 |
115 |
-65 |
161.24 |
| BFG21-MS12 |
9,670 |
9,707 |
1,201 |
115 |
-45 |
295.05 |
| BFG21-MS13 |
9,714 |
9,927 |
1,205 |
114 |
-45 |
350.22 |
| BFG21-MS14 |
9,669 |
9,708 |
1,201 |
115 |
-65 |
230.43 |
| BFG21-MS15 |
9,738 |
9,558 |
1,266 |
115 |
-45 |
258.47 |
| BFG21-MS16 |
9,714 |
9,927 |
1,205 |
114 |
-65 |
299.92 |
| BFG21-MH17 |
9,670 |
8,496 |
1,104 |
90 |
-45 |
204.83 |
| BFG21-MS18 |
10,016 |
9,983 |
1,117 |
90 |
-45 |
373.38 |
| BFG21-MS19 |
9,816 |
10,017 |
1,214 |
114 |
-70 |
365.15 |
| BFG21-MS20 |
9,725 |
9,609 |
1,259 |
115 |
-45 |
288.95 |
| BFG21-MH21 |
9,608 |
8,555 |
1,110 |
90 |
-65 |
346.86 |
| BFG21-MS22 |
9,959 |
9,943 |
1,123 |
114 |
-45 |
373.38 |
| BFG21-MS23 |
9,948 |
10,099 |
1,219 |
155 |
-70 |
360.58 |
| BFG21-MS24 |
9,751 |
9,729 |
1,218 |
115 |
-45 |
380.39 |
FORTE DYNAMICS, INC
120 Commerce Drive., Units 3 & 4, Fort Collins, CO 80524 | P a g e | 82 of 178 | December 2023 |
| | Augusta Gold Corp. |
Figure 7-3: Drilling in the Montgomery-Shoshone
Area from the 2020 - 2021 Drill Campaign
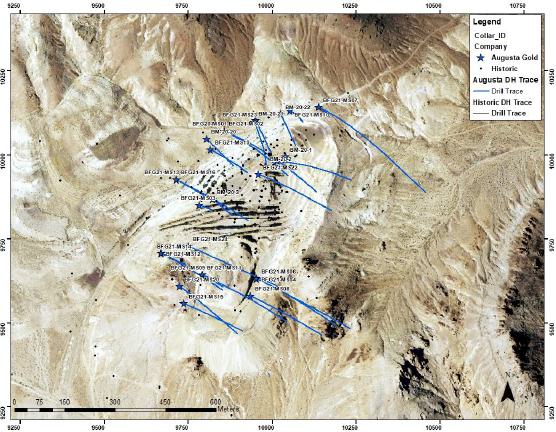
Figure 7-4: Drilling in the Bullfrog Area
from the 2020 - 2021 Drill Campaign

FORTE DYNAMICS, INC
120 Commerce Drive., Units 3 & 4, Fort Collins, CO 80524 | P a g e | 83 of 178 | December 2023 |
| | Augusta Gold Corp. |
Table 7-4: Drilling Results from the 2020
- 2021 Program
| Hole ID |
Interval in meters |
Au |
Ag |
Zone |
| From |
To |
Length |
g/t |
g/t |
| BM-20-1 |
0 |
41 |
41 |
0.42 |
2.26 |
MS Vein Zone |
| includes |
0 |
23 |
23 |
0.55 |
1.95 |
MS Vein Zone |
| |
| BM-20-2 |
0 |
26 |
26 |
0.33 |
1.04 |
MS Vein Zone |
| includes |
0 |
20 |
20 |
0.37 |
1.15 |
MS Vein Zone |
| |
| BM-20-3 |
49 |
59 |
11 |
0.26 |
0.33 |
MS Vein Zone |
| |
| BH-20-4 |
76 |
81 |
5 |
0.35 |
1.54 |
Mystery Hills |
| BH-20-4 |
85 |
119 |
34 |
0.27 |
0.6 |
Mystery Hills |
| BH-20-4 |
157 |
184 |
27 |
0.32 |
0.93 |
Mystery Hills |
| |
| BH-20-5 |
101 |
108 |
8 |
0.26 |
1.22 |
Mystery Hills |
| BH-20-5 |
117 |
168 |
50 |
0.24 |
0.49 |
Mystery Hills |
| BH-20-5 |
175 |
209 |
34 |
0.58 |
0.82 |
Mystery Hills |
| |
| BH-20-6 |
90 |
200 |
110 |
0.41 |
0.61 |
Mystery Hills |
| includes |
120 |
146 |
26 |
0.91 |
0.91 |
Mystery Hills |
| |
| BH-20-7 |
46 |
53 |
8 |
3.23 |
3.36 |
Mystery Hills |
| |
| BH-20-8 |
35 |
40 |
5 |
1.13 |
0.21 |
Mystery Hills |
| BH-20-8 |
47 |
53 |
6 |
0.38 |
0.25 |
Mystery Hills |
| |
| BH-20-9 |
23 |
29 |
6 |
0.53 |
0.91 |
Mystery Hills |
| BH-20-9 |
37 |
43 |
6 |
0.31 |
0.45 |
Mystery Hills |
FORTE DYNAMICS, INC
120 Commerce Drive., Units 3 & 4, Fort Collins, CO 80524 | P a g e | 84 of 178 | December 2023 |
| | Augusta Gold Corp. |
| BH-20-9 |
46 |
53 |
8 |
0.31 |
0.33 |
Mystery Hills |
| BH-20-9 |
104 |
195 |
91 |
0.33 |
0.32 |
Mystery Hills |
| |
| BH-20-10 |
41 |
55 |
14 |
2.42 |
2.19 |
Mystery Hills |
| includes |
41 |
47 |
6 |
4.89 |
4.14 |
Mystery Hills |
| BH-20-10 |
104 |
110 |
6 |
0.58 |
0.26 |
Mystery Hills |
| |
| BH-20-11 |
27 |
40 |
12 |
0.3 |
0.2 |
Mystery Hills |
| BH-20-11 |
49 |
56 |
8 |
0.31 |
0.08 |
Mystery Hills |
| BH-20-11 |
67 |
91 |
24 |
0.35 |
0.18 |
Mystery Hills |
| BH-20-11 |
128 |
139 |
11 |
0.2 |
0.34 |
Mystery Hills |
| |
| BH-20-12 |
32 |
52 |
20 |
0.35 |
0.33 |
Mystery Hills |
| BH-20-12 |
79 |
91 |
12 |
0.45 |
0.18 |
Mystery Hills |
| |
| BH-20-13 |
0 |
21 |
21 |
0.24 |
0.28 |
Mystery Hills |
| BH-20-13 |
38 |
50 |
12 |
0.44 |
0.34 |
Mystery Hills |
| BH-20-13 |
94 |
140 |
46 |
0.3 |
0.2 |
Mystery Hills |
| |
| BH-20-14 |
0 |
12 |
12 |
0.22 |
0.3 |
Mystery Hills |
| BH-20-14 |
23 |
29 |
6 |
0.3 |
0.21 |
Mystery Hills |
| BH-20-14 |
49 |
55 |
6 |
0.28 |
0.2 |
Mystery Hills |
| BH-20-14 |
67 |
79 |
12 |
0.44 |
0.47 |
Mystery Hills |
| BH-20-14 |
84 |
93 |
9 |
0.4 |
0.16 |
Mystery Hills |
| BH-20-14 |
116 |
122 |
6 |
0.24 |
0.46 |
Mystery Hills |
| |
| BH-20-15 |
11 |
40 |
29 |
0.29 |
0.26 |
Mystery Hills |
| BH-20-15 |
96 |
111 |
15 |
0.26 |
0.19 |
Mystery Hills |
| BH-20-15 |
120 |
165 |
44 |
0.31 |
0.39 |
Mystery Hills |
FORTE DYNAMICS, INC
120 Commerce Drive., Units 3 & 4, Fort Collins, CO 80524 | P a g e | 85 of 178 | December 2023 |
| | Augusta Gold Corp. |
| |
| BH-20-18 |
5 |
11 |
6 |
0.23 |
0.21 |
Mystery Hills |
| BH-20-18 |
40 |
69 |
29 |
0.22 |
0.16 |
Mystery Hills |
| BH-20-18 |
75 |
96 |
21 |
0.24 |
0 |
Mystery Hills |
| |
| BH-20-19 |
0 |
35 |
35 |
0.44 |
0.3 |
Mystery Hills |
| includes |
2 |
17 |
15 |
0.64 |
0.31 |
Mystery Hills |
| BH-20-19 |
43 |
59 |
17 |
0.27 |
0.25 |
Mystery Hills |
| BH-20-19 |
70 |
78 |
8 |
0.21 |
0.09 |
Mystery Hills |
| |
| BM-20-20 |
171 |
184 |
12 |
0.3 |
0.76 |
MS Vein Zone |
| |
| BFG20-MS01 |
114.77 |
154.35 |
39.58 |
0.34 |
2.82 |
MS Vein Zone |
| BFG20-MS01 |
246.21 |
259.37 |
13.16 |
1.30 |
2.79 |
MS Vein Zone |
| BFG20-MS01 |
275.23 |
284.77 |
9.54 |
0.89 |
5.60 |
MS Vein Zone |
| |
| BFG21-MS02 |
125.56 |
166.62 |
41.06 |
0.35 |
1.39 |
MS Vein Zone |
| BFG21-MS02 |
229.73 |
254.04 |
24.31 |
0.31 |
0.23 |
MS Vein Zone |
| BFG21-MS02 |
298.31 |
310.53 |
12.22 |
0.22 |
0.55 |
MS Vein Zone |
| |
| BFG21-MS03 |
105.19 |
115.39 |
10.20 |
0.49 |
0.37 |
Polaris Vein |
| |
| BFG21-MS04 |
121.15 |
122.67 |
1.52 |
0.60 |
0.50 |
Other |
| |
| BFG21-MS05 |
99.95 |
102.99 |
3.04 |
0.39 |
0.35 |
MS Vein Zone |
| |
| BFG21-MS06 |
NSV |
Other |
| |
| BFG21-MS07 |
149.96 |
151.49 |
1.53 |
0.29 |
1.50 |
MS Vein Zone |
FORTE DYNAMICS, INC
120 Commerce Drive., Units 3 & 4, Fort Collins, CO 80524 | P a g e | 86 of 178 | December 2023 |
| | Augusta Gold Corp. |
| BFG21-MS07 |
175.87 |
177.32 |
1.45 |
0.35 |
0.10 |
MS Vein Zone |
| |
| BFG21-MS08 |
NSV |
Other |
| |
| BFG21-MS09 |
81.82 |
109.12 |
27.30 |
0.42 |
5.03 |
Polaris Vein |
| including |
93.88 |
98.50 |
4.62 |
1.10 |
13.22 |
Polaris Vein |
| BFG21-MS09 |
133.50 |
141.07 |
7.57 |
0.19 |
0.94 |
Polaris Vein |
| BFG21-MS09 |
163.98 |
168.16 |
4.18 |
0.27 |
0.10 |
Polaris Vein |
| BFG21-MS09 |
179.70 |
185.32 |
5.62 |
0.39 |
0.27 |
Polaris Vein |
| |
| BFG21-MS10 |
203.00 |
229.21 |
26.21 |
0.52 |
3.29 |
MS Vein Zone |
| including |
216.52 |
219.50 |
2.98 |
1.38 |
5.34 |
MS Vein Zone |
| and including |
224.00 |
229.21 |
5.21 |
0.90 |
8.66 |
MS Vein Zone |
| |
| BFG21-MS11 |
79.75 |
84.31 |
4.56 |
0.23 |
0.33 |
Polaris Vein |
| BFG21-MS11 |
99.30 |
160.00 |
60.70 |
0.35 |
2.12 |
Polaris Vein |
| |
| BFG21-MS12 |
170.08 |
184.52 |
14.44 |
0.26 |
0.44 |
Polaris Vein |
| |
| BFG21-MS13 |
105.45 |
116.33 |
10.88 |
0.39 |
0.55 |
MS Vein Zone |
| including |
105.94 |
108.20 |
2.26 |
0.91 |
0.75 |
MS Vein Zone |
| BFG21-MS13 |
179.22 |
211.75 |
32.53 |
0.88 |
1.58 |
Polaris Vein |
| including |
183.79 |
192.40 |
8.61 |
2.32 |
4.61 |
Polaris Vein |
| |
| BFG21-MS14 |
179.30 |
189.89 |
10.59 |
0.17 |
0.11 |
Polaris Vein |
| |
| BFG21-MS15 |
135.33 |
138.38 |
3.05 |
0.32 |
5.38 |
Polaris Vein |
| BFG21-MS15 |
153.62 |
161.22 |
7.60 |
0.52 |
0.72 |
Polaris Vein |
| |
FORTE DYNAMICS, INC
120 Commerce Drive., Units 3 & 4, Fort Collins, CO 80524 | P a g e | 87 of 178 | December 2023 |
| | Augusta Gold Corp. |
| BFG21-MS16 |
178.00 |
205.18 |
27.18 |
0.26 |
0.32 |
MS Vein Zone |
| |
| BFG21-MH17 |
0.00 |
36.88 |
36.88 |
0.27 |
0.12 |
Mystery Hills |
| BFG21-MH17 |
47.55 |
99.61 |
52.06 |
0.19 |
0.25 |
Mystery Hills |
| |
| BFG21-MS18 |
0.00 |
51.82 |
51.82 |
0.33 |
2.02 |
MS Vein Zone |
| including |
0.00 |
4.57 |
4.57 |
0.73 |
3.29 |
MS Vein Zone |
| |
| BFG21-MS19 |
145.00 |
157.80 |
12.80 |
0.48 |
1.08 |
MS Vein Zone |
| BFG21-MS19 |
188.06 |
205.44 |
17.38 |
0.33 |
0.56 |
MS Vein Zone |
| BFG21-MS19 |
211.56 |
217.68 |
6.12 |
0.41 |
0.15 |
MS Vein Zone |
| |
| BFG21-MS20 |
151.18 |
197.51 |
46.33 |
0.42 |
0.98 |
Polaris Vein |
| including |
159.71 |
163.07 |
3.36 |
1.58 |
4.39 |
Polaris Vein |
| |
| BFG21-MH21 |
7.46 |
10.05 |
2.59 |
0.20 |
0.10 |
Mystery Hills |
| BFG21-MH21 |
54.25 |
62.00 |
7.75 |
0.22 |
0.10 |
Mystery Hills |
| BFG21-MH21 |
73.76 |
76.81 |
3.05 |
0.19 |
0.10 |
Mystery Hills |
| BFG21-MH21 |
95.11 |
101.96 |
6.85 |
0.35 |
0.25 |
Mystery Hills |
| BFG21-MH21 |
128.38 |
131.20 |
2.82 |
0.24 |
0.30 |
Mystery Hills |
| |
| BFG21-MS22 |
15.24 |
16.76 |
1.52 |
0.45 |
0.30 |
MS Vein Zone |
| BFG21-MS22 |
94.49 |
96.01 |
1.52 |
0.23 |
0.50 |
MS Vein Zone |
| |
| BFG21-MS23 |
93.68 |
163.98 |
70.30 |
0.32 |
4.12 |
MS Vein Zone |
| including |
94.94 |
106.07 |
11.13 |
0.63 |
16.04 |
MS Vein Zone |
| BFG21-MS23 |
229.10 |
238.05 |
8.95 |
0.75 |
2.36 |
MS Vein Zone |
| BFG21-MS23 |
257.27 |
298.65 |
41.38 |
0.36 |
0.51 |
MS Vein Zone |
| including |
276.75 |
286.54 |
9.79 |
0.89 |
0.91 |
MS Vein Zone |
FORTE DYNAMICS, INC
120 Commerce Drive., Units 3 & 4, Fort Collins, CO 80524 | P a g e | 88 of 178 | December 2023 |
| | Augusta Gold Corp. |
| BFG21-MS23 |
325.87 |
331.96 |
6.09 |
0.27 |
0.17 |
MS Vein Zone |
| |
| BFG21-MS24 |
123.58 |
157.08 |
33.50 |
0.34 |
1.63 |
Polaris Vein |
| including |
144.86 |
147.90 |
3.04 |
0.82 |
2.25 |
Polaris Vein |
| BFG21-MS24 |
166.13 |
173.73 |
7.60 |
0.23 |
1.24 |
Polaris Vein |
| BFG21-MS24 |
191.00 |
195.22 |
4.22 |
0.27 |
0.61 |
Polaris Vein |
| 7.5.2 | 2021 Additional Drilling Included in the End of Year 2021 Resource Model |
Twenty new core and RC drillholes were unavailable
when the model was completed in June 2021 and have since been drilled and added to this report Drillhole collar coordinates, depths,
and orientations are listed below. *RC drillhole.
FORTE DYNAMICS, INC
120 Commerce Drive., Units 3 & 4, Fort Collins, CO 80524 | P a g e | 89 of 178 | December 2023 |
| | Augusta Gold Corp. |
Table 7-5: Location and Depth of Additional
2021 Holes
| Hole ID |
Easting |
Northing |
Elevation |
Azimuth |
Dip |
Total
Depth |
| BFG21-MH25 |
9,438 |
8,908 |
1,142 |
90 |
-70 |
419.1 |
| *BFG21-IS26 |
11,782 |
12,882 |
1,189 |
90 |
-45 |
470.9 |
| BFG21-MS27 |
9,947 |
10,101 |
1,224 |
155 |
-60 |
380.4 |
| BFG21-MH28 |
9,437 |
8,908 |
1,142 |
90 |
-85 |
353.3 |
| BFG21-MS29 |
9,836 |
9,695 |
1,237 |
117 |
-50 |
258.5 |
| BFG21-IS30 |
10,667 |
12,927 |
1,219 |
45 |
-45 |
639.2 |
| BFG21-MH31 |
9,411 |
8,786 |
1,127 |
90 |
-45 |
358.8 |
| *BFG21-IS32 |
11,391 |
13,286 |
1,211 |
90 |
-45 |
449.6 |
| *BFG21-IS33 |
11,641 |
14,190 |
1,304 |
115 |
-45 |
403.9 |
| BFG21-MH34 |
9,411 |
8,786 |
1,127 |
90 |
-65 |
394.7 |
| BFG21-MS35 |
10,012 |
9,985 |
1,116 |
90 |
-45 |
179.2 |
| BFG21-MS36 |
9,868 |
9,718 |
1,231 |
115 |
-45 |
224.9 |
| BFG21-MH37 |
9,411 |
8,786 |
1,127 |
90 |
-85 |
346.6 |
| BFG21-IS38 |
10,666 |
12,926 |
1,219 |
45 |
-70 |
328.6 |
| BFG21-IS39 |
10,668 |
12,930 |
1,219 |
90 |
-45 |
403.9 |
| BFG21-MS40 |
9,847 |
9,550 |
1,267 |
115 |
-45 |
180.8 |
| BFG21-BF41 |
9,063 |
8,728 |
1,135 |
90 |
-45 |
343.1 |
| BFG21-BF42 |
9,071 |
8,788 |
1,135 |
90 |
-50 |
349.5 |
| BFG21-BF45 |
9,072 |
8,788 |
1,135 |
90 |
-75 |
505.4 |
| BFG21-BF44 |
9,065 |
8,728 |
1,135 |
90 |
-75 |
999.0 |
| BFG21-MH25 |
9,438 |
8,908 |
1,142 |
90 |
-70 |
419.1 |
Results from the new drilling available since the
June resource model are listed below.
FORTE DYNAMICS, INC
120 Commerce Drive., Units 3 & 4, Fort Collins, CO 80524 | P a g e | 90 of 178 | December 2023 |
| | Augusta Gold Corp. |
Table 7-6: Drilling Results from Additional
Drilling in 2021 Program
| Hole ID |
Interval in meters |
Au |
Ag |
Zone |
| From |
To |
Length |
g/t |
g/t |
| BFG21-MH25 |
80.40 |
175.20 |
94.80 |
0.27 |
0.44 |
BF Vein |
| BFG21-MH25 |
236.17 |
242.25 |
6.08 |
0.61 |
2.42 |
Mystery Hills |
| |
| BFG21-IS26 |
138.68 |
146.30 |
7.62 |
0.36 |
0.84 |
Indian Springs |
| |
| BFG21-MS27 |
90.19 |
143.71 |
53.52 |
0.97 |
8.24 |
MS Vein Zone |
| includes |
139.15 |
143.71 |
4.56 |
7.02 |
39.70 |
MS Vein Zone |
| BFG21-MS27 |
224.60 |
235.24 |
10.64 |
1.39 |
1.31 |
MS Vein Zone |
| |
| BFG21-MH28 |
92.24 |
114.00 |
21.76 |
1.04 |
1.00 |
BF Vein |
| includes |
93.73 |
96.72 |
2.99 |
5.73 |
5.86 |
BF Vein |
| BFG21-MH28 |
217.62 |
223.72 |
6.10 |
0.34 |
0.10 |
Mystery Hills |
| BFG21-MH28 |
241.30 |
249.85 |
8.55 |
0.31 |
0.10 |
Mystery Hills |
| |
| BFG21-MS29 |
61.86 |
80.16 |
18.30 |
0.60 |
5.48 |
Polaris Vein |
| includes |
70.40 |
74.98 |
4.58 |
1.43 |
8.02 |
Polaris Vein |
| BFG21-MS29 |
85.95 |
87.78 |
1.83 |
0.72 |
5.50 |
Polaris Vein |
| BFG21-MS29 |
123.00 |
124.21 |
1.21 |
0.85 |
3.50 |
Polaris Vein |
| |
| BFG21-IS30 |
274.89 |
276.45 |
1.56 |
0.83 |
0.30 |
Indian Springs - Main Gap |
| |
| BFG21-MH31 |
75.44 |
87.22 |
11.78 |
1.62 |
3.38 |
BF Vein |
| BFG21-MH31 |
125.54 |
197.55 |
72.01 |
0.24 |
0.13 |
Mystery Hills |
| BFG21-MH31 |
203.04 |
207.70 |
4.66 |
0.26 |
0.10 |
Mystery Hills |
FORTE DYNAMICS, INC
120 Commerce Drive., Units 3 & 4, Fort Collins, CO 80524 | P a g e | 91 of 178 | December 2023 |
| | Augusta Gold Corp. |
| BFG21-MH31 |
223.42 |
233.69 |
10.27 |
0.23 |
0.15 |
Mystery Hills |
| BFG21-MH31 |
256.66 |
278.09 |
21.43 |
0.22 |
0.10 |
Mystery Hills |
| |
| BFG21-IS30 |
NSV |
|
|
|
|
Indian Springs South |
| BFG21-IS33 |
NSV |
|
|
|
|
Indian Springs South |
| |
| BFG21-MH34 |
77.88 |
221.00 |
143.12 |
0.32 |
0.57 |
Mystery Hills |
| |
| BFG21-MS35 |
1.83 |
54.50 |
52.67 |
0.39 |
1.60 |
MS Vein Zone |
| includes |
3.30 |
7.92 |
4.62 |
1.13 |
3.30 |
MS Vein Zone |
| |
| BFG21-MS36 |
64.61 |
80.97 |
16.36 |
0.34 |
3.27 |
Polaris Vein |
| BFG21-MS36 |
112.60 |
115.09 |
2.49 |
0.21 |
0.15 |
Polaris Vein |
| BFG21-MH37 |
| BFG21-MH37 |
85.04 |
134.72 |
49.68 |
0.57 |
6.65 |
BF Vein |
| includes |
92.35 |
100.42 |
8.07 |
2.54 |
5.25 |
BF Vein |
| BFG21-MH37 |
147.55 |
178.19 |
30.64 |
0.20 |
0.11 |
Mystery Hills |
| BFG21-MH37 |
205.44 |
221.74 |
16.30 |
0.32 |
0.17 |
Mystery Hills |
| |
| BFG21-IS38 |
NSV |
|
|
|
|
Indian Springs - Main Gap |
| |
| BFG21-IS39 |
250.50 |
251.52 |
1.02 |
1.74 |
0.50 |
Indian Springs - Main Gap |
| |
| BFG21-MS40 |
NSV |
|
|
|
|
Other |
| |
FORTE DYNAMICS, INC
120 Commerce Drive., Units 3 & 4, Fort Collins, CO 80524 | P a g e | 92 of 178 | December 2023 |
| | Augusta Gold Corp. |
| BFG21-BF41 |
177.76 |
182.60 |
4.84 |
0.39 |
1.44 |
BF Hanging Wall |
| BFG21-BF41 |
296.53 |
324.78 |
28.25 |
0.25 |
2.99 |
BF Hanging Wall |
| BFG21-BF41 |
329.79 |
339.55 |
9.76 |
0.59 |
2.80 |
BF Vein |
| includes |
329.79 |
332.72 |
2.93 |
1.29 |
2.70 |
BF Vein |
| |
| BFG21-BF42 |
129.13 |
140.40 |
11.27 |
0.82 |
17.38 |
BF Hanging Wall |
| BFG21-BF42 |
163.21 |
176.17 |
12.96 |
0.21 |
0.23 |
BF Hanging Wall |
| BFG21-BF42 |
232.56 |
329.78 |
97.22 |
0.41 |
2.45 |
BF Hanging Wall |
| BFG21-BF42 |
335.00 |
340.77 |
5.77 |
13.55 |
33.17 |
BF Vein |
| BFG21-BF42 |
346.25 |
349.45 |
3.20 |
0.50 |
5.39 |
BF Foot Wall |
| |
| BFG21-BF44 |
213.97 |
217.21 |
3.24 |
0.49 |
1.26 |
BF Hanging Wall |
| BFG21-BF44 |
274.93 |
282.30 |
7.37 |
0.20 |
0.78 |
BF Hanging Wall |
| BFG21-BF44 |
290.96 |
313.42 |
22.46 |
0.26 |
1.32 |
BF Hanging Wall |
| BFG21-BF44 |
325.67 |
338.94 |
13.27 |
0.26 |
0.79 |
BF Hanging Wall |
| BFG21-BF44 |
344.13 |
353.40 |
9.27 |
0.27 |
0.70 |
BF Hanging Wall |
| BFG21-BF44 |
357.17 |
371.25 |
14.08 |
0.29 |
0.94 |
BF Hanging Wall |
| BFG21-BF44 |
371.25 |
376.28 |
5.03 |
2.11 |
5.07 |
BF Vein |
| BFG21-BF44 |
376.28 |
390.29 |
14.01 |
0.26 |
0.67 |
BF Foot Wall |
| |
| BFG21-BF45 |
137.92 |
144.00 |
6.08 |
0.37 |
8.72 |
BF Hanging Wall |
FORTE DYNAMICS, INC
120 Commerce Drive., Units 3 & 4, Fort Collins, CO 80524 | P a g e | 93 of 178 | December 2023 |
| | Augusta Gold Corp. |
| BFG21-BF45 |
160.93 |
177.82 |
16.89 |
0.33 |
0.36 |
BF Hanging Wall |
| BFG21-BF45 |
303.06 |
308.90 |
5.84 |
0.24 |
0.56 |
BF Hanging Wall |
| BFG21-BF45 |
325.22 |
335.98 |
10.76 |
0.64 |
0.96 |
BF Hanging Wall |
| BFG21-BF45 |
340.77 |
369.57 |
28.80 |
0.53 |
1.96 |
BF Hanging Wall |
| includes |
350.58 |
353.66 |
3.08 |
1.47 |
1.70 |
BF Hanging Wall |
| BFG21-BF45 |
375.80 |
382.57 |
6.77 |
1.54 |
4.55 |
BF Vein |
FORTE DYNAMICS, INC
120 Commerce Drive., Units 3 & 4, Fort Collins, CO 80524 | P a g e | 94 of 178 | December 2023 |
| | Augusta Gold Corp. |
| 8. | Sample Preparation, Analyses, and Security |
| 8.1 | Historic Data (1983 – 1996) |
Drilling and coring information used in this resource
estimate was obtained from several drill programs that began in 1983 with St. Joe Minerals, continued with Bond Gold and Lac Minerals,
and continued with Barrick in late 1996. Of 1,262 total holes drilled in the area, 147 holes included core and 1,243 holes were drilled
using reverse circulation methods. Most of the cored holes included intervals of core plus RC segments. Percent recovery and RQD measurements
were made on all core intervals. An assessment was made of the quality of the orientation data and the core was marked accordingly. The
core was then logged, recording lithological, alteration, mineralization, and structural information including the orientation of faults,
fault lineation’s, fractures, veins, and bedding. With few exceptions, the entire lengths of the holes were sampled. Sample intervals
were 5 feet and occasionally based on the geological logging, separating different lithologies and styles of mineralization and alteration.
Samples were marked and tagged in the core box before being photographed, after which the core was sawed in half, with one half sent for
assay and one half retained for future reference. Each sample interval was bagged separately and shipped to the lab for analysis.
Cuttings from nearly all reverse circulation drill
programs were divided into two streams, one was sampled and the other was disposed during the reclamation of each drill site. Using a
Jones splitter, the sample stream was further divided into two sample bags, one designated for assaying and the second duplicate designated
as a field reject. Samples were collected at five-foot intervals and bagged at the drill site. Each five-foot sample was sealed at the
drill site and not opened until it reached the analytical lab. At each 20-foot rod connection, the hole was blown clean to eliminate material
that had fallen into the hole during the connection. The designated assay samples for each five-foot interval were collected by the site
geologist and moved to a secure sample collection area for shipment to accredited laboratories off site. When duplicate samples were collected,
they were retained at the drill site as a reference sample, if needed. If the duplicate samples were not used, they were blended with
site materials during site reclamation.
| 8.2 | Augusta Gold Corp. (2020-2021) |
Augusta Gold Corporation (Augusta Gold) commenced
exploration on the Bullfrog Gold Project in 2020, continuing through the second quarter of 2021. Work performed consisted of oriented
diamond core drilling, conventional Reverse Circulation (RC) drilling and reconnaissance mapping and surface sampling for drill target
generation. A digital, Access based database (GeoSpark) has been maintained by Augusta Gold, including all assays from drill samples
and geochemical analysis from surface rock chip samples, completed on the project.
| 8.2.1 | Augusta Gold Corp. 2020 |
The 2020 drilling program drilled 25 reverse circulation
holes. To ensure reliable sample results, Augusta has a QA/QC program in place that monitors the chain-of-custody of samples and includes
the insertion of blanks and certified reference materials (CRMs). Barren coarse-grained blanks (“blanks”) were inserted at
lithology changes. Three CRMs with variations in gold grade were inserted at the end of each batch by random selection. The following
QA/QC program was followed for the 2020 drilling. All testing for the 2020 program was done by American Assay Laboratories (AAL), an independent
ISO/IEC 17025 certified laboratory in Sparks, Nevada.
FORTE DYNAMICS, INC
120 Commerce Drive., Units 3 & 4, Fort Collins, CO 80524 | P a g e | 95 of 178 | December 2023 |
| | Augusta Gold Corp. |
A74383, B74110, and C73909 standards were purchased
from Legend, a wholesale distributor for mining products. The standards were made by KLEN International, a Western Australian company
that specializes in the manufacture and supply of fire assay fluxes. A total of 8 A74383, 8 B74110, and 8 C73909 were inserted with RC
drill samples. Expected values for each CRM are listed in Table 8-1 through Table 8-3.
Table 8-1: CRM Expected Values
| CRM |
Au (ppm) |
Ag (ppm) |
| A 74383 |
4.93 |
47.6 |
| B 74110 |
0.237 |
No certified value |
| C 73909 |
0.778 |
No certified value |
Table 8-2: Summary of Gold in CRM's
| RM |
N |
Outliers
Excluded |
Failures
Excluded |
Au ppm |
Observed Au ppm |
Percent
of
Accepted |
| Accepted |
Std. Dev. |
Average |
Std. Dev. |
| C 73909 |
8 |
- |
- |
0.778 |
0.023 |
0.775 |
0.018 |
99.6% |
| B 74110 |
8 |
- |
- |
0.237 |
0.009 |
0.240 |
0.005 |
101.2% |
| A 74383 |
7 |
1 |
- |
4.930 |
0.080 |
4.913 |
0.074 |
99.7% |
| Total |
23 |
|
|
|
|
|
Weighted
Average |
100.2% |
Table 8-3: CRM Expected Values
| RM |
N |
Outliers
Excluded |
Failures
Excluded |
Ag ppm |
Observed Ag ppm |
Percent
of
Accepted |
| Accepted |
Std. Dev. |
Average |
Std. Dev. |
| A 74383 |
4 |
1 |
3 |
47.600 |
1.200 |
45.329 |
0.878 |
95.2% |
| Total |
4 |
|
|
|
|
|
Weighted
Average |
95.2% |
Barren coarse-grained blanks were submitted with
samples to determine if there has been contamination or sample cross-contamination. Three types of blanks were used with sample submission.
BM-20-1 and BM-20-2 used material from an outcrop nearby, BP-20-23 and BP-20-24 used garden pumice obtained from Home Depot, and the remainder
of the holes used Black Basalt Cinders provided by AAL. Certificate of Analysis’ with Au and Ag thresholds for blank materials used
are not available.
A total of 108 blanks were inserted with RC chip
samples, blank materials are determined to have failed if the values exceed the maximum threshold of the analyte. Maximum threshold values
are listed in Table 8-4.
FORTE DYNAMICS, INC
120 Commerce Drive., Units 3 & 4, Fort Collins, CO 80524 | P a g e | 96 of 178 | December 2023 |
| | Augusta Gold Corp. |
Table 8-4: Blank Failure Threshold
| Blank |
Gold (ppm) |
Silver (ppm) |
| Blank (ASL) |
0.03 |
2 |
Duplicates were inserted into the sample sequence
every 100-ft. RC chip samples were split at the drill rig. The second half of a RC sample is assayed to determine if the reproducibility
of assays for different chips, and if there is any sampling bias. A total of 115 duplicates were submitted with sample submissions. Only
duplicate pairs above 10 times the lower detection are considered significant and are included in calculations. 65% or 75 pairs are considered
significant for gold, and 2.61% or 3 pairs are considered significant for silver. Duplicate sample results (Table 8-5) show that 100%
of the duplicates agree within +/-5% for gold and silver.
Table 8-5: Duplicate Sample Results
| |
|
% of Sample Pairs (>10x d.l.) Reporting Within |
| Analyte |
# of Pairs above 10x d.l. |
±5 |
| Au |
75 |
100% |
| Ag |
3 |
100% |
| 8.2.2 | Augusta Gold Corp 2021 |
| 8.2.2.1 | Sample Preparation and Security |
Oriented diamond core drilling (HQ3) was performed
using two track-mounted LF-90 drills and one truck mounted LF-90 drill. Core orientation was collected using Reflex ACTIII tooling, overseen
by staff geologists and verified by a third-party contractor. All drill core was logged, photographed, split and sampled on-site.
FORTE DYNAMICS, INC
120 Commerce Drive., Units 3 & 4, Fort Collins, CO 80524 | P a g e | 97 of 178 | December 2023 |
| | Augusta Gold Corp. |
Figure 8-1: Truck Mounted Core Rig
Conventional Reverse Circulation drilling was
performed using a single Atlas Copco RD 10+, with a hole diameter of 6.75 inches. All RC samples were logged and sampled on-site. Samples
were air dried, sealed in bulk bags on-site. Additionally, surface rock chip samples were collected during field reconnaissance. These
samples were collected, described, and geolocated in the field before being sealed in rice bags for transport. All samples were stored
in sealed bulk bags and transported weekly to Paragon Geochemical in Reno, Nevada, USA. Paragon is independent of Augusta Gold and is
ISO 9001 compliant.
Figure 8-2: Laydown Yard and Sample Storage
FORTE DYNAMICS, INC
120 Commerce Drive., Units 3 & 4, Fort Collins, CO 80524 | P a g e | 98 of 178 | December 2023 |
| | Augusta Gold Corp. |
All surface rock chip samples collected were described
in the field and located using hand-held global positioning system (GPS) methods. Sample descriptions were completed either in field notebooks
or using a tablet computer. Hard copy notes were digitized for archive, and field notebooks were retained. All sample descriptions were
compiled into a master Excel spreadsheet before being imported into the GeoSpark database maintained by Augusta Gold. Samples were bagged
and stored in a secure building before being shipped to the lab.
Drill core was transported from the rig to the
logging facility daily by staff geologists, where washing, logging, photographing, and sampling were completed. Logging data was recorded
directly into the GeoSpark database on laptop computers. All core logs and digital core photos were backed up on Microsoft Teams.
Figure 8-3: Logging Laptop
Rock chip samples from RC drilling were transported
from the rig to the logging facility daily by staff geologists, where they were air-dried and placed in sealed bulk bags for transport.
A geologist was present at the drill rig during all drilling operations, where they oversaw sample collection, built chip trays with representative
material, and logged chips on-site. Bulk reject bags were stacked out adjacent to the drill pad and were retained until lab results were
received and checked.
Surface Rock Chip Sampling: Grab samples
were collected from outcrop or rubble crop. These were spot samples taken from well-mineralized or altered rock. Float samples represent
transported rock of uncertain origin. All rock samples were located in the field using GPS methods and field descriptions and notes were
entered into a master digital database at the end of each field day.
Diamond Drill Core Processing: Drill core
was transported by pickup truck from the drill site to the logging facility located eight miles north of Beatty, Nevada, proximal to the
project area. Upon arrival at the core shack, core was laid out on outdoor quick-logging tables where it was washed, and RQD and recovery
measurements were collected. Core was then brought indoors and laid out on tables for detailed geologic logging.
FORTE DYNAMICS, INC
120 Commerce Drive., Units 3 & 4, Fort Collins, CO 80524 | P a g e | 99 of 178 | December 2023 |
| | Augusta Gold Corp. |
Figure 8-4: Core Shed and Quick Log Station

First, the quality of orientation marks and lines
were checked, and any necessary corrections were made. Core was then marked up using china markers and permanent marking pens to identify
important features for logging and recording in photographs. Oriented structural measurements were recorded using the Reflex IQ logger
where possible, and manual protractor methods when rock quality precluded the use of the logging device. Sample tags were stapled inside
the wax-impregnated cardboard core boxes at geologically determined intervals by the geologist, leaving every fifteenth sample tag available
for either a blank or a standard.
FORTE DYNAMICS, INC
120 Commerce Drive., Units 3 & 4, Fort Collins, CO 80524 | P a g e | 100 of 178 | December 2023 |
| | Augusta Gold Corp. |
Figure 8-5: Logging Facility

Core was cut using Husqvarna masonry saws, and
core techs were instructed to cut core along the orientation line. Split core was then placed back in the core boxes until it was sampled.
During sampling, one half of the split core from each sample interval was placed in a cloth bag with the sample number written on it.
A corresponding barcode sample tag was placed in each bag, and the bag was tied closed. Sample bags were then stacked in 1-ton super sacks,
sealed, and stored in the core yard while waiting for shipment to the lab.
FORTE DYNAMICS, INC
120 Commerce Drive., Units 3 & 4, Fort Collins, CO 80524 | P a g e | 101 of 178 | December 2023 |
| | Augusta Gold Corp. |
Figure 8-6: Core Saw

The remnant half core was retained in the core
boxes, which were palletized and tarped for storage in the core yard at the logging facility. Significant intercepts and holes of interest
were stored in locked shipping containers at the logging facility.
Figure 8-7: Sampling Tables

FORTE DYNAMICS, INC
120 Commerce Drive., Units 3 & 4, Fort Collins, CO 80524 | P a g e | 102 of 178 | December 2023 |
| | Augusta Gold Corp. |
Figure 8-8: Core Cutting Facility
Reverse Circulation Chip-Sample Processing:
Samples were collected from a rotary splitter mounted to the cyclone discharge on the drill rig. The rotary splitter was adjusted to provide
a sample with a nominal weight of 15 lbs (6.8 kg). A small split was collected in a mesh screen for populating chip trays for geologic
logging, and the remaining sample reject was bagged separately and stacked next to the drill pad to be retained until laboratory results
had been received and quality checked. Chips collected in the screen were washed and put into chip trays, which were labelled with the
corresponding interval footage. The chips were quick-logged at the drill rig by a geologist using a hand lens, and were then transported
back to the logging facility at the end of each day for detailed logging under a binocular microscope.
RC samples were collected in cloth bags with the
sample number and footage interval written on them and a corresponding sample tag inside. As with diamond core samples, every fifteenth
sample number was reserved for either a blank or a standard. Samples were transported to the logging facility by pickup truck each day,
where they were stacked outside on metal trays for airdrying. Once deemed sufficiently dry, the sample bags were stacked in 1-ton super
sacks, sealed, and stored in the core yard while waiting for shipment to the lab.
All samples collected during the 2020-2021 exploration
program at the Bullfrog Project were stored at the logging facility until being transported directly to Paragon Geochemical in Reno, Nevada.
A chain-of-custody form was signed by on-site staff at the time of sample pickup by the laboratory courier service.
FORTE DYNAMICS, INC
120 Commerce Drive., Units 3 & 4, Fort Collins, CO 80524 | P a g e | 103 of 178 | December 2023 |
| | Augusta Gold Corp. |
Figure 8-9: Sample Pick Up Area

The company used three standards; OREAS 250, OREAS-250b,
and OREAS 253. These reference materials were purchased from OREAS North America. The reference materials are high quality and were analyzed
at more than fifteen laboratories to determine expected values and tolerances. The materials are matrix-matched for the Bullfrog Project
mineral style and were prepared from a blend of gold-bearing Wilber Lode oxide ore from the Andy Well Gold Project and barren basaltic
saprolite and siltstone (OREAS-250 and OREAS-250b) and basaltic scoria (OREAS-253) sourced from quarries north of Melbourne, Australia.
OREAS-250b was ordered as the replacement for
OREAS-250, both being nearly identical low grade gold standards. This report contains data from both CRMs. Expected values for the CRMs
are based on aqua regia digest inductively coupled plasma analyses for silver and fire assay for gold and are available in Table 8-6.
Summary statistics of CRMs performance during the exploration program are summarized in Table 8-7.
Table 8-6: CRM Expected Values
| CRM |
Gold (ppm) |
Silver (ppm) |
| OREAS-250 |
0.309 |
0.258 |
| OREAS-250b |
0.332 |
0.073 |
| OREAS-253 |
1.22 |
- |
FORTE DYNAMICS, INC
120 Commerce Drive., Units 3 & 4, Fort Collins, CO 80524 | P a g e | 104 of 178 | December 2023 |
| | Augusta Gold Corp. |
Table 8-7: Summary of Gold in CRMs
| RM |
N |
Outliers
Excluded |
Failures
Excluded |
Au ppm |
Observed Au ppm |
Percent
of
Accepted |
| Accepted |
Std. Dev. |
Average |
Std. Dev. |
| OREAS-253 |
110 |
- |
2 |
1.220 |
0.045 |
1.236 |
0.041 |
101.3% |
| OREAS-250b |
12 |
- |
1 |
0.332 |
0.011 |
0.322 |
0.012 |
96.9% |
| OREAS-250 |
94 |
- |
2 |
0.309 |
0.013 |
0.320 |
0.013 |
103.7% |
| Total |
216 |
|
|
|
|
|
Weighted Average |
102.1% |
Barren coarse-grained blanks were submitted with
samples to determine if there has been contamination or sample cross-contamination. Elevated values for blanks may also indicate sources
of contamination in the analytical procedure (contaminated reagents or test tubes) or sample solution carry-over during instrumental finish.
A total of 220 blanks were inserted with samples and blank materials are determined to have failed if the values exceed the maximum threshold
of the analyte. Maximum threshold values are listed in Table 8-8.
Table 8-8: Blank Failure Threshold
| Blank |
Gold (ppm) |
Silver (ppm) |
| Blank |
0.03 |
2 |
Based on 42 pairs of pulp duplicates above 0.005
ppm gold, 76% duplicates agree within 20% of the original assay. 10 pairs were outside of the limits being 20% above or below the original.
The comparison is shown in Figure 8-10.
FORTE DYNAMICS, INC
120 Commerce Drive., Units 3 & 4, Fort Collins, CO 80524 | P a g e | 105 of 178 | December 2023 |
| | Augusta Gold Corp. |
Figure 8-10: Gold Pulp Comparison

| · | Two mislabels were identified and changed in the database. As a result, sampling procedures were updated
in Q1 2021 to avoid mislabels. |
| · | Five failures were flagged. Four are a result of two consecutive failures outside two standard deviations.
One failure reported outside three standard deviations. These were corrected. |
| · | Silver values were only evaluated for blanks and not standards in this report due to very low values reporting
below or close to analytical detection limits. |
| · | Standard OREAS-250 was replaced by OREAS-250b; data from both standards are included in this report. |
| · | Pulp duplicates performed as expected with 76% of pairs reporting within 20%. |
| · | Check assay analysis determined that Paragon reported higher gold values than SGS for 70% of the 80 sample
pulps with gold greater than 0.5 g/t Au. |
| · | QC analysis indicates that the CRMs performed well with only 2% of CRMs reporting outside of expectations,
the blanks indicate that no instances of contamination occurred. |
| · | In the author’s opinion, the security, sampling and analytical procedures are appropriate and consistent
with common industry practice. |
FORTE DYNAMICS, INC
120 Commerce Drive., Units 3 & 4, Fort Collins, CO 80524 | P a g e | 106 of 178 | December 2023 |
| | Augusta Gold Corp. |
The data for this mineral resource estimate comes
from historical exploration and operations. The original laboratory certificates were available for most of the drilling. Data collected
by previous operators has in part been verified by the corroborating data in the original laboratory certifications, as well as existing
physical and digital records. Blind entry spot checks were run against the database and the laboratory certificates to ensure the quality
of the database. No additional exploration drilling has been performed since the closure of the Bullfrog Mine, until the program carried
out by Augusta in 2020. QA/QC protocols were followed and reviewed for the 2020 drilling program, including blanks, standards, and duplicates.
Lab certificates were available for the 2020 drilling program.
A site visit was performed by Patrick Garretson
in June 2021 with the purpose of observing and reviewing the site infrastructure, exploration drilling program, core logging and sample
preparation facilities. All three existing pits were observed from the highwall or from within the pit. Special attention was given to
pit limit boundaries, pit highwall integrity, waste dump placement and pit backfill areas. Infrastructure in terms of roads, claim boundaries
and previous site infrastructure were observed and cross-referenced with available property maps and diagrams. The geology of each area
was discussed with the project geologists and important geologic features such as faults, veins and lithologic contacts were observed
in the exposed pit walls or on surface outcrops.
The core storage, sample preparation area and
logging facility were visited and site personnel were observed while performing these activities. The facilities have recently been built
and the area was very clean and well organized. The core logging facility was well lit and core tables were constructed to allow personnel
to log core in an ergonomic position. The core boxes and core within were properly marked for downhole measurements. Geologic data was
being logged via laptop computers using a logging program (GeoSpark) with dropdown fields for the selection of geologic features. Sample
preparation, bagging and labeling took place in a separate area to avoid cross-contamination. Samples were properly bagged, labeled and
prepared for transport to the assay lab. A large whiteboard posted in the logging facility was used to track the progress of a drillhole
from the time it was received at the facility to the time it was bagged and ready for transport. A procedure and process for measuring
specific gravity via the wax and water immersion process was in place.
Core and chip trays from the pre-2020 drilling
are no longer available.
During the later half of 2021, Augusta Gold Corp.
staff conducted an in-depth review and update of legacy data in the Bullfrog drilling database. During the process, previously missing
assay information was found on old assay certificates, was verified against drill logs, and added to the database. Additionally, assay
grades were checked throughout the legacy data set and consistent conversions from imperial to metric grade units were updated where needed.
During the process, it was discovered that some series of older drillholes had improper imperial-metric grade conversions and were subsequently
updated, resulting in grade increases for the majority of affected drillholes.
In order to verify the updated database, Forte
Dynamics requested and received assay certificate and logging data for approximately 10% of the relevant legacy drillholes in the economically
important portions of the three gold deposits at Bullfrog. Although there were a few random, single assay discrepancies, most of the drillholes
had all their assays match between the new database and assay certificates. Some of the drillholes checked were ones earlier identified
with problematic imperial-metric grade conversions and those now match certificate grades and now have correct converted metric grades.
Legacy drillholes with newly found assay data were also checked against scans of the assay certificates and they were correct in the new
database. Some of the drillholes that were selected for verification had missing runs of assay data and it was verified from the logs
and certificates that there were data gaps for those drillholes.
FORTE DYNAMICS, INC
120 Commerce Drive., Units 3 & 4, Fort Collins, CO 80524 | P a g e | 107 of 178 | December 2023 |
| | Augusta Gold Corp. |
The Company submitted 148 core pulps to SGS for
multi-element check assays. Samples that are below detection limits are not included in the graphs. The comparison between Paragon and
SGS for gold and silver are shown in Figures 9-1 to 9-3.
FORTE DYNAMICS, INC
120 Commerce Drive., Units 3 & 4, Fort Collins, CO 80524 | P a g e | 108 of 178 | December 2023 |
| | Augusta Gold Corp. |
Figure 9-1: Check Assay Gold Comparison

Of the 147 pulps, 68 pairs agree within 20% for
gold. Figure 9.2 shows the relative percent different (Paragon less SGS divided by the Paragon result) vs. the Paragon result. There are
more cases with positive differences showing that Paragon tends to report higher than SGS.
FORTE DYNAMICS, INC
120 Commerce Drive., Units 3 & 4, Fort Collins, CO 80524 | P a g e | 109 of 178 | December 2023 |
| | Augusta Gold Corp. |
Figure 9-2: Check Assay Gold - Percent Difference

Table 9-1: Check Assay Gold Statistics
| Grade |
N |
# with Paragon>SGS |
# with Paragon <SGS |
Average Bias* |
| 0.1 - 0.5 g/t |
30 |
17 |
13 |
6 |
| >0.5 g/t |
80 |
56 |
24 |
19 |
There is better agreement between Paragon and
SGS results for assays less than 0.5 g/t Au. For these samples, there is a nearly even number of cases with positive and negative differences.
For samples with assays greater than 0.5 g/t Au, Paragon reports higher assays for more than twice the cases compared to SGS reporting
higher than Paragon.
FORTE DYNAMICS, INC
120 Commerce Drive., Units 3 & 4, Fort Collins, CO 80524 | P a g e | 110 of 178 | December 2023 |
| | Augusta Gold Corp. |
Figure 9-3: Silver Check Assay Comparison
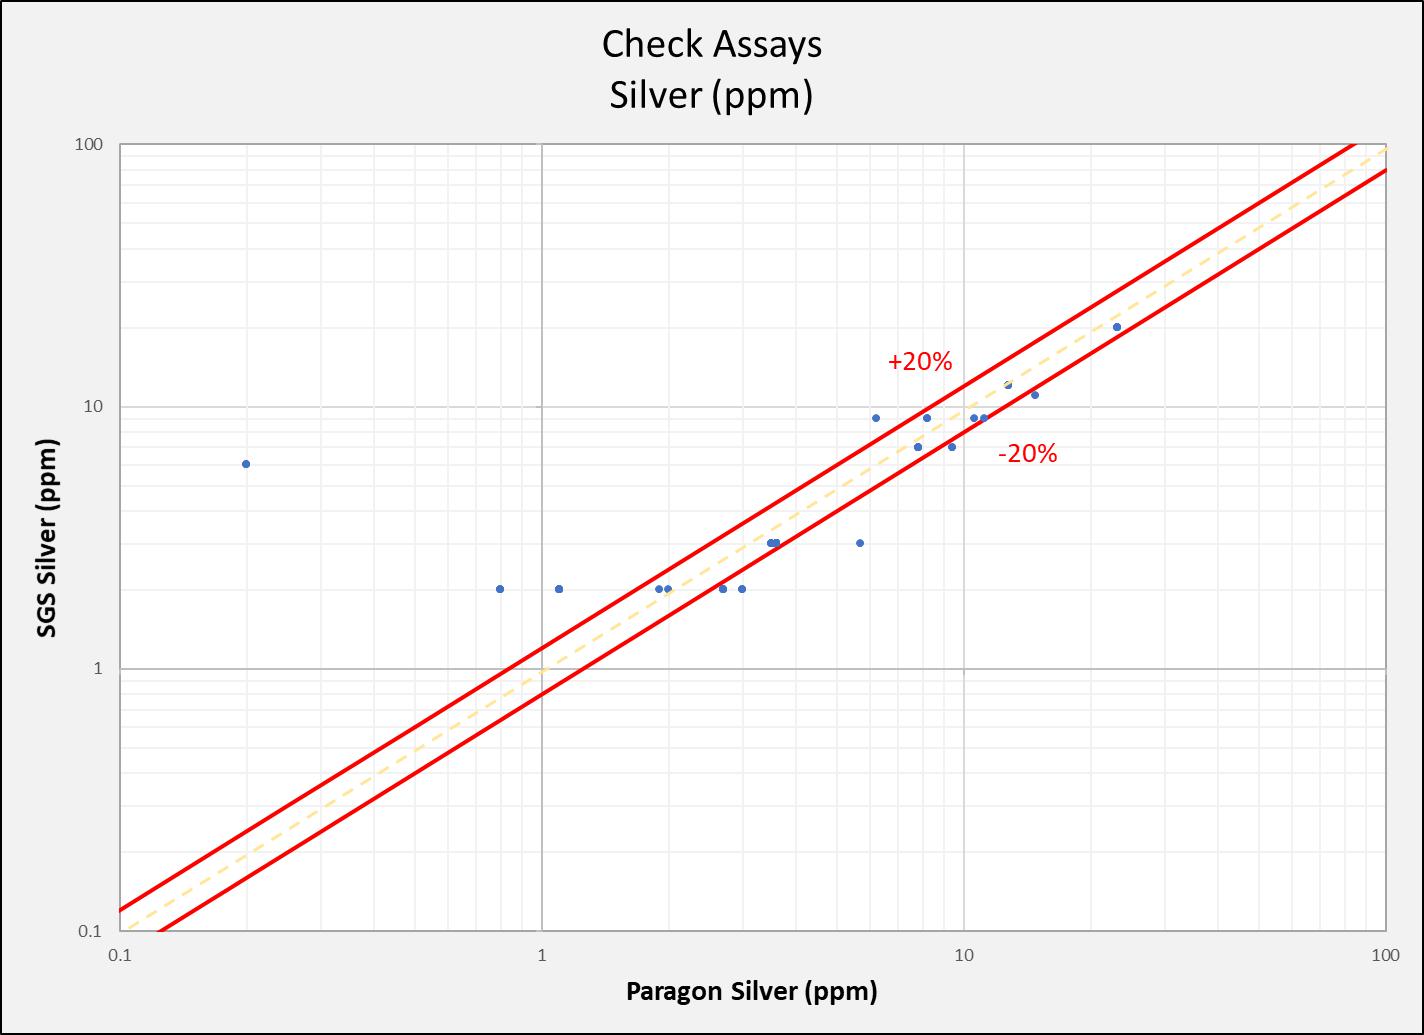
There are 19 pulps where silver values are above
detection limit in both labs and results are compared in Figure 9.2. The detection limit for silver at SGS is 1 ppm and due to the poor
precision of the method, good agreement below 5 ppm is not expected. The silver values greater than 5 ppm show good agreement.
In summary, Paragon reported higher gold values
than SGS for 70% of the 80 sample pulps with gold greater than 0.5 g/t Au. Given that there were no certified reference materials assayed
by SGS, it is not possible to determine which laboratory is more accurate. Paragon performed reasonably well on CRMs and there is no other
indication of high bias. The mean of the relative differences is 0.064 with a 0.16 standard deviation. A T-test on the two sets of samples
shows that there is no significant difference between the labs.
Additional check assays are recommended perhaps
at a different lab than SGS, and care should be taken in handling and splitting duplicate samples.
| 9.2 | Qualified Person’s Opinion |
The qualified person has reviewed these data and
believes that they are sufficient and appropriate for use in this report to determine the mineral resource estimate.
FORTE DYNAMICS, INC
120 Commerce Drive., Units 3 & 4, Fort Collins, CO 80524 | P a g e | 111 of 178 | December 2023 |
| | Augusta Gold Corp. |
| 10. | Mineral Processing and Metallurgical Testing |
Most of the metallurgical tests on the Project
were conducted on high-grade ores using conventional milling and agitated leaching methods. Typical processing statistics from 1989 into
1999 are shown in Table 10-1.
Table 10-1: Typical Processing Statistics
from 1989-1999
| Gold Recovery |
91% |
| Silver Recovery |
65% |
| Leach Time |
48 hours |
| Grind |
80% -150 mesh |
| Rod Consumption |
2.3 lbs/ tonne |
| Ball Consumption |
2.1 lbs/ tonne |
| Cyanide Consumption |
0.5 lbs/ tonne |
| Lime Consumption |
1.2 lbs/ tonne |
Barrick’s mill recoveries were good for
gold, but silver recoveries were lower mainly due to its refractory association with manganese. As a result, the 26 million tonnes of
tailings stored south of NV Hwy 374 currently have little value.
| 10.1.1 | Large Column Leach Test |
Reports by St. Joe Minerals provide detailed information
on two large column tests on bulk samples of the M-S area. The test facility included a carbon adsorption plant and two concrete columns
24-feet high with inside diameters of 5.5 feet.
An area surrounding reverse circulation hole RDH-20
in the M-S area was drilled and blasted to produce 250 tons of bulk sample. The mined sample was split to produce 20 tons of uncrushed
or run-of-mine column feed and 22 tons of crushed column feed. The columns were then loaded with efforts to minimize compaction and size
sorting of the sample. Solution was applied at a rate of 0.004 gpm/sq. ft. Results after 59 days of leaching are shown below. A 90-day
projected recovery was 61% Au on 19 mm (3/4”) crushed ore and 54% on 305 mm (12”) run-of-mine ore. Previous bottle roll tests
on drill cuttings in this area averaged 78% gold and 33% silver.
Screen analyses of the -19 mm (-3/4”) leached
residue shows that the -65 mesh and -10 to + 65 mesh fractions yielded gold recoveries 96% and 86% for respective head assays of 0.074
and 0.057 oz/ton gold. The screen analyses also show that the loss of fines from a sample (which did occur) will not only depress the
apparent gold grade but will also cause an even greater depression in the apparent gold recovery.
St. Joe came to the following conclusions:
| · | M-S mineral is permeable
and readily heap leachable. Cyanide and lime consumptions were reported as “average”, but not quantified. |
| · | Fine fractions yield the
highest recovery, and if lost will depress gold recovery. |
| · | Evidence suggests many
fines were lost during handling and the recoveries were deemed minimum or conservative. |
FORTE DYNAMICS, INC
120 Commerce Drive., Units 3 & 4, Fort Collins, CO 80524 | P a g e | 112 of 178 | December 2023 |
| | Augusta Gold Corp. |
| · | There appeared to be little
correlation between recovery and grade. |
| · | There were no observable
chemical or percolation problems with the sample. |
| 10.1.2 | Bottle Roll Tests on UG Samples |
Bottle roll tests on 39 underground sample composites
obtained from the glory hole and 200 and 300 levels of the M-S mine recovered 78% of the gold from material averaging 0.16 opt and crushed
to -8 mesh. Recoveries ranged from 52% to 98% with no obvious correlation between grade and recovery. St. Joe concluded that bottle roll
test (presumably for 24 hours) on material crushed to -8 mesh provides good representation as to what may be achieved in a column test
sized at 19 mm (3/4-inch).
| 10.1.3 | Column Testing by Kappes Cassiday & Associates |
Results from leach tests performed in 1994 by
Kappes Cassiday & Associates (KCA) from a 250-kg composite of low-grade material from the Bullfrog mine are shown below:
Table 10-2: Leach Test Results
| |
Bottle |
Column |
Column |
| Size, mesh, & mm (inch) |
-100 mesh |
-38 mm (-1.5”) |
-9.5 mm (-3/8”) |
| Calc. Head, opt Au |
0.029 |
0.035 |
0.029 |
| Rec % |
96.6 |
71.4 |
75.9 |
| Leach time, days |
2.0 |
41 |
41 |
| NaCN, kg/t (lb/short ton) |
0.5 (0.1) |
0.385 (0.77) |
5.35 (10.7) |
| Lime, kg/t ( lb/short ton) |
1.0 (2.0) |
0.155 (0.31) |
1.75 (0.35) |
Two 45 kg samples were crushed and loaded into
6-inch diameter columns to heights of five feet. Leach solution was applied at a rate ranging from 0.004 to 0.006 gpm/sq ft and initially
contained 1.0 g NaCN/l and 0.5 g/l lime. Input solutions were 0.4 to 0.6 g/l NaCN while maintaining a pH of 9.5 to 10.5. The initial solution
was clear and bright yellow, and the final solution was clear and colorless. Column tailings retained 6% to 7.5% moisture after drain
down, and each were screened and assayed for size fractions. The leach recovery curves are shown below in Figure 10-1.
FORTE DYNAMICS, INC
120 Commerce Drive., Units 3 & 4, Fort Collins, CO 80524 | P a g e | 113 of 178 | December 2023 |
| | Augusta Gold Corp. |
Figure 10-1: Leach Test Results

The recovery in the coarse crush (-38.1 mm [-1.5”])
was a 2-stage crush size and was 4.5% less than the fine crush (-9.5mm [-3/8”]), which would require 3-stage crushing. The 41-day
leach periods are also short and ultimate heap leach recoveries may be greater.
| 10.2 | Pilot Testing by Barrick |
In 1995, Barrick performed pilot heap leach tests
on 844 tons of low-grade material from the Bullfrog pit and 805 tons of typical material from the M-S pit. Both materials were crushed
to -1/2 inch and leached at an application rate of 0.006 gpm/sq ft. Lift heights were 12 feet. Results are listed below:
Table 10-3: Heap Leach Pilot Tests –
Barrick
| |
BF
Low-Grade |
M-S
Mineralization |
| Calc. Head, opt Au |
0.019 |
0.048 |
| Calc. Head, opt Ag |
0.108 |
0.380 |
| Projected Au Rec % |
67 |
74 |
| Projected Ag Rec % |
9 |
32 |
| Leach Time, days |
41 |
37 |
| NaCN, kg/t (lb/short ton) |
0.10 (0.20) |
0.125 (0.25) |
| Lime, kg/t ( lb/short ton) |
Nil (Nil) |
Nil (Nil) |
FORTE DYNAMICS, INC
120 Commerce Drive., Units 3 & 4, Fort Collins, CO 80524 | P a g e | 114 of 178 | December 2023 |
| | Augusta Gold Corp. |
Low-grade material was stockpiled during pit operations
and ranged from a cutoff of 0.5 g/t gold and Barrick’s operating mill cutoff of 0.85 g/t. These stockpiles were later blended with
underground ore and milled during 1998 and early 1999. All pit material below 0.5 g/t was dumped as waste rock. Based on the source and
grade of this material, it is representative of the mineralization remaining in the Bullfrog deposit. The M-S sample represented ore that
was in large measure mined by Barrick after this pilot test, but the information on reagent consumption is applicable to remaining mineralization
and the recovery has reference value.
Acceptable solution grades at the end of the tests
and leaching beyond 41 days at lower solution application rates could result in higher ultimate recoveries. Lime and cyanide consumptions
were low. The test heap also did not reach maximum recovery due to poor solution distribution in the first couple of feet, which could
be recovered from multiple lifts in a production scenario and improved solution distribution.
In 2018 and 2019, standard column leach tests
were performed on materials from the Bullfrog property by McClelland Laboratories, located in Reno, NV. The sample tested in 2018 was
a composite sample created from a bulk sample representing “Brecciated Vein Ore Type”. The exact location (or locations) of
the sample is not known, and it is unclear whether these samples can be considered representative of the entire deposit. The results of
the 2018 program are summarized in Table 10-4 below.
Table 10-4: Column Leach Test Results (2018)
| Feed Size |
Crush Method |
Test |
Time |
Au Recovery, % |
| 9.5mm (3/8”) |
Conventional |
Column |
60 days |
58 |
| 9.5mm (3/8”) |
Conventional |
Bottle Roll |
4 days |
59 |
| 1.7mm (10 mesh) |
HPGR |
Column |
60 days |
77 |
| 1.7mm (10 mesh) |
HPGR |
Bottle Roll |
4 days |
70 |
| 150µm |
Conventional/Grind |
Bottle Roll |
4 days |
89 |
The 2018 column leach test results suggest a crush
size dependency where HPGR crushing (high pressure grinding rolls) may have the potential to significantly improve recovery. The lime
requirement for protective alkalinity was low and cyanide consumption was moderate. The samples tested in 2019 were prepared from three
(3) bulk samples. The exact location (or locations) of these samples is not known, and it is unclear whether these samples can be considered
representative of the entire deposit. The results of the 2019 program are summarized in Table 10-5 below.
FORTE DYNAMICS, INC
120 Commerce Drive., Units 3 & 4, Fort Collins, CO 80524 | P a g e | 115 of 178 | December 2023 |
| | Augusta Gold Corp. |
Table 10-5: Column Leach Test Results (2019)
| Sample |
Feed Size |
Crush Method |
Test |
Time |
Au Rec., % |
| Composite E |
9.5mm (3/8”) |
Conventional |
Column |
151 days |
75 |
| Composite E |
6.3mm (1/4”) |
HPGR |
Column |
122 days |
77 |
| Composite E |
1.7mm (10 mesh) |
HPGR |
Column |
102 days |
89 |
| MS-M-1 |
9.5mm (3/8”) |
Conventional |
Column |
108 days |
66 |
| MS-M-1 |
6.3mm (1/4”) |
HPGR |
Column |
108 days |
77 |
| MS-M-1 |
1.7mm (10 mesh) |
HPGR |
Column |
89 days |
85 |
| MH-M-2 |
9.5mm (3/8”) |
Conventional |
Column |
109 days |
83 |
| MH-M-2 |
6.3mm (1/4”) |
HPGR |
Column |
105 days |
88 |
| MH-M-2 |
1.7mm (10 mesh) |
HPGR |
Column |
86 days |
91 |
The 2019 column leach test results further highlight
the size dependency on recovery and suggest that HPGR crushing may have the potential to significantly improve gold recovery. The cement
required for agglomeration of the samples was adequate for maintaining protective alkalinity. The cyanide consumption was low. Based on
these test programs, Bullfrog mineralization types appear amenable to heap leach recovery methods. Further testing is required to properly
assess the benefit of HPGR crushing and better define the optimal particle size for heap leaching.
| 10.4 | Conclusions for Heap Leaching |
Based on the test work completed to-date that
is applicable to the remaining mineralization in the BF and M-S pits, preliminary ultimate heap leach recoveries are projected as follows:
Table 10-6: Estimated Heap Leach Recovery
| Leach Size |
80% - 9.5 mm
(3/8 inch) |
ROM
Low Grade |
| Estimated Recovery |
70% |
50% |
* Silver Recovery is estimated at 1.07 x gold
recovered ounces, which is the typical recovery attained by Barrick.
All mineralization known to-date would be heap
leached and the pregnant solutions would be processed through a carbon ADR plant to be constructed on site.
FORTE DYNAMICS, INC
120 Commerce Drive., Units 3 & 4, Fort Collins, CO 80524 | P a g e | 116 of 178 | December 2023 |
| | Augusta Gold Corp. |
The Bullfrog and M-S deposits originally contained
less than 2% sulfide minerals that were thoroughly oxidized below existing and proposed mining depths, including the current water table
and virtually all deep drill holes. The historic water table was much lower in the geologic past, and the detachment and associated faults
allowed epithermal solutions to oxidize the host and adjacent wall rocks to great depths. There is a small volume of mineralization in
the footwall stock-works or east side of the central Bullfrog area near section 8148 north that contains carbon-pyrite alteration with
attendant reductions in leach recoveries. This area needs to be researched further as to extent and recovery. Additional leach tests are
needed to optimize performance versus crush size, as well as better understand silver recovery, agglomeration, permeability, and potential
impacts from sulfides or organic carbon.
There are seven areas that potentially could serve
as leach pad sites within reasonable trucking or conveying distances from the Bullfrog and M-S pits as described below in Figure 10-2.
Figure 10-2: Potential Leach Pad Sites &
Approximate Capacities
| |
|
|
|
|
|
|
Comments |
| |
Criteria: |
Stacked Density: |
1.8 |
t/m3 |
|
|
Swell factor of 35% for in place density of 2.45 |
| |
|
Heap Height : |
30 |
m |
|
|
As crushed material percolates well with minimum fines and |
| |
|
Min.Pad Slope: |
3% |
|
|
clay, heights likely could be higher subject to confirmation |
| |
|
Max. Pad Slope: |
Site & Design Dependent |
testing. |
| Priority |
|
|
|
|
|
| |
|
|
|
|
|
| 1 |
South Rainbow Mtn. |
|
|
360,000 |
|
m2 |
Has the shortests conveying/trucking distances and lowest |
| |
West of M-S pit and N of Rhyolite |
|
10,800,000 |
|
m3 |
operating costs, but expansion is limited. M-S waste dump is |
| |
Area: 600 x 600 |
Typ. Slope |
5% |
19,440,000 |
|
tonnes |
on NE side of area. |
| |
|
|
|
|
|
|
|
| 2 |
South Paradise Mtn. |
|
|
270,000 |
|
m2 |
Second shortest convey/truck distance. Could be used after |
| |
1200 m east BF pit & 1600 m SE MS pit |
8,100,000 |
|
m3 |
No. 1 is filled. |
| |
Area: 450 x 600 |
Typ. Slope |
7% |
14,580,000 |
|
tonnes |
|
| |
|
|
|
|
|
|
|
| 3 |
South Burton Mtn. |
|
|
975,000 |
|
m2 |
|
| |
2300 m NE BF pit & 2000 m E MS pit |
|
29,250,000 |
|
m3 |
|
| |
Area: 1300 x 750 |
Typ. Slope |
5% |
52,650,000 |
|
tonnes |
|
| |
|
|
|
|
|
|
|
| 4 |
NE Barrick Tail Pond |
|
3,600,000 |
|
m2 |
Requires a conveyor or truck bridge over Hwy 374. This area |
| |
S of Hwy 374 |
|
|
108,000,000 |
|
m3 |
could be substantially expanded, but this not foreseeably |
| |
Area:1800 x 2000 |
Typ. Slope |
4% |
194,400,000 |
|
tonnes |
needed. |
| |
|
|
|
|
|
|
|
| 5 |
Barrick Tail Pond |
|
|
1,000,000 |
|
m2 |
Requires a conveyor or truck bridge over Hwy 374 and |
| |
S. of Hwy 374. Contains 26 mm tonnes |
30,000,000 |
|
m3 |
geotech studies on tailings. Lining this pad would be easy |
| |
Area:1000 x 1000 |
Typ. Slope |
1% |
54,000,000 |
|
tonnes |
easy, but obtaining a 3+% slope requires earthworks. |
| |
|
|
|
|
|
|
|
| 6 |
West Plantsite |
|
|
4,410,000 |
|
m2 |
Requires a conveyor/truck bridge to cross the road |
| |
West of road to Rhyolite and a cemetary |
132,300,000 |
|
m3 |
to Rhyolite. Cannot be easily expanded but this |
| |
Area: 2100 x 2100 |
Typ. Slope |
4% |
238,140,000 |
|
tonnes |
is not foreseeably needed. |
| |
|
|
|
|
|
|
|
| 7 |
Indian Springs |
|
|
2,560,000 |
|
m2 |
Long haul from Buffrog and M-S pits. M-S pit impairs |
| |
3300 m NE BF pit & 2300 m NE MS pit |
76,800,000 |
|
m3 |
direct route |
| |
Area:1600 x 1600 |
Typ. Slope |
4% |
138,240,000 |
|
tonnes |
|
In all cases, additional drilling is required
to adequately explore or condemn these areas, and considerable technical and economic studies are needed to select any site.
FORTE DYNAMICS, INC
120 Commerce Drive., Units 3 & 4, Fort Collins, CO 80524 | P a g e | 117 of 178 | December 2023 |
| | Augusta Gold Corp. |
In 2020 a new test program was completed, and
this information is summarized below.
Cyanidation bottle rolls tests were conducted
on 14 variability composites from the Bullfrog project. The samples are considered representative of the various types and styles of mineralization.
The composites were generated from coarse assay rejects from a reverse circulation drilling program. Composite gold grades ranged from
0.14 to 0.91 Au g/tonne, with an average grade of 0.42 Au g/tonne. A nominal crush size of 1.7 mm was used for the test work. The samples
were not crushed using an HPGR. Summary bottle roll testing results are showed in Table 10-7.
Table 10-7: Summary Metallurgical Results
– Bottle Roll Tests
| Composite |
Drillhole |
|
REAGENT
REQUIREMENTS |
| Interval (ft) |
Au
Rec. |
Head Grade Au
g/tonne |
kg/tonne mineralized
material |
| From |
To |
% |
Calculated |
Assayed |
NaCN Cons. |
Lime
Added |
| 4594-001 |
BM-20-1 |
0 |
40 |
67.8 |
0.59 |
0.80 |
0.15 |
1.1 |
| 4594-002 |
BM-50-1 |
40 |
75 |
67.2 |
0.58 |
0.50 |
0.11 |
1.2 |
| 4594-003 |
BM-20-4 |
280 |
335 |
44.4 |
0.27 |
0.26 |
0.12 |
1.7 |
| 4594-004 |
BM-20-4 |
335 |
390 |
38.7 |
0.31 |
0.30 |
0.17 |
1.5 |
| 4594-005 |
BM-20-6 |
295 |
395 |
66.7 |
0.27 |
0.29 |
0.11 |
1.4 |
| 4594-006 |
BM-20-6 |
395 |
485 |
58.5 |
1.06 |
0.86 |
0.11 |
1.6 |
| 4594-007 |
BM-20-11 |
95 |
185 |
72.7 |
0.22 |
0.18 |
<0.07 |
1.1 |
| 4594-008 |
BM-20-14 |
0 |
45 |
58.1 |
0.31 |
0.27 |
<0.07 |
1.8 |
| 4594-009 |
BM-20-14 |
90 |
135 |
80.0 |
0.15 |
0.13 |
0.14 |
1.5 |
| 4594-010 |
BM-20-14 |
170 |
235 |
84.2 |
0.19 |
0.21 |
0.14 |
1.2 |
| 4594-011 |
BM-20-14 |
235 |
260 |
86.8 |
0.53 |
0.57 |
0.09 |
1.2 |
| 4594-012 |
BM-20-15 |
35 |
130 |
72.3 |
0.47 |
0.46 |
0.17 |
1.4 |
| 4594-013 |
BM-20-19 |
0 |
115 |
73.3 |
0.30 |
0.27 |
0.08 |
1.4 |
| 4594-014 |
BM-20-22 |
305 |
385 |
81.0 |
0.63 |
0.67 |
0.09 |
1.6 |
FORTE DYNAMICS, INC
120 Commerce Drive., Units 3 & 4, Fort Collins, CO 80524 | P a g e | 118 of 178 | December 2023 |
| | Augusta Gold Corp. |
The Bullfrog variability composites generally
were amenable to agitated cyanidation treatment at a nominal 1.7 mm feed size. Gold recovery ranged from 38.7% to 86.8% and averaged 68.0%.
Recovery was 58.1% or greater for 12 of the 14 composites. Gold recovery rates were moderate, and generally, gold extraction was substantially
complete in 24 hours of leaching. Gold recovery was not correlated to gold head grades for these 14 composites. Gold recovery consistently
decreased with increasing sulfide sulfur content.
Silver extractions were 1.4 Ag g/tonne or less
for all composites. Silver composite extraction ranged from 14.3% to 66.7%.
Bottle roll test cyanide consumption was consistently
low and was 0.17 kg NaCN/tonne mineralized material or less for all 14 composites. Lime requirements for pH control were also low and
were 1.8 kg/tonne mineralized material or less.
There are no additional relevant processing factors
that the author of this report is aware of that could materially affect the mineral resource estimate presented in this technical report.
| 10.7 | Qualified Person’s Opinion |
The qualified person has reviewed these data and
believes that they are sufficient and appropriate for use in this report to determine the mineral resource estimate.
FORTE DYNAMICS, INC
120 Commerce Drive., Units 3 & 4, Fort Collins, CO 80524 | P a g e | 119 of 178 | December 2023 |
| | Augusta Gold Corp. |
| 11. | Mineral Resource Estimates |
Mineral resources were updated based on technical
information as of December 31, 2021, by Forte Dynamics.for the Bullfrog project. The update utilizes all new drilling through the end
of 2021 in addition to updated geologic models and database improvements by Augusta Gold Corp. staff. The mineral resources were estimated
utilizing conventional 3D computer block modeling based on most current drillhole database, grade shells, vein shapes, geologic constraints,
current topography, as-built underground solids and as-built open pit surfaces. The grade shells and the vein shapes were constructed
using Leapfrog software and follow the dominant structural and mineralized trends within each geologic setting. Geologic constraints were
applied to the block model to prevent grade estimation into barren rock types. The underground as-built solids were expanded by 1m in
all directions and mined out in the block model. Open pit as-built surfaces accounted for post-mining backfill that has been placed as
part of the site reclamation practices. The resource block models were estimated in Vulcan software using ordinary kriging and multiple
estimation passes with expanding search distances and varying composite selection criteria.
Lerch-Grossman pit optimizations were done in
Minemax software. Assumptions for gold price, silver price, metallurgical recovery, pit slopes, mining costs, processing costs and G&A
costs were selected based on data that was available and comparing to other comparable operations. The optimized pits were limited to
the property boundaries. The comparable pricing for gold of $1,550 compares well with the three-year trailing average of $1,558/ozAu in
June 2021, an accepted method for a mineral resource reporting price. The $20/oz silver price compares to a three-year average of $19.07
and was typical of other similar reports.
The open pit Mineral Resources for each area (Bullfrog,
Montgomery-Shoshone and Bonanza) were calculated inside the pit shell and only blocks with a positive net value (revenue minus costs)
were reported as mineral resource. The Mineral Resources are presented in the following tables.
Incremental cutoff grades are automatically calculated
by the Minemax software, and silver adds some additional value. The incremental cutoff considers process, G&A, and refining costs,
but not mining with assumption it is simply deciding whether already mined material will have greater in an ore destination or as waste.
The incremental gold cutoff grades are 0.137 g/tonne for oxide-leach and 0.224 g/tonne for sulfide leach.
Break-even cutoff grades, which consider mining
cost and can identify blocks have a positive net value, including mining costs. Mineral resources are reported at break-even cutoffs of
0.192g/t for oxide-leach and 0.315 g/t for sulfide-leach.
FORTE DYNAMICS, INC
120 Commerce Drive., Units 3 & 4, Fort Collins, CO 80524 | P a g e | 120 of 178 | December 2023 |
| | Augusta Gold Corp. |
Table 11-1: Bullfrog Mineral Resources
| Mineral Resources as of December 31, 2021 - Bullfrog |
Redox/
Cutoff |
Classification |
Tonnes
(Mt) |
Au grade
(g/t) |
Ag grade
(g/t) |
Au Contained
(koz) |
Ag Contained
(koz) |
|
Oxide/
0.192 g/t |
Measured |
24.50 |
0.537 |
1.28 |
422.77 |
1,010.02 |
| Indicated |
36.32 |
0.515 |
1.14 |
602.02 |
1,332.18 |
| Measured and Indicated |
60.82 |
0.524 |
1.20 |
1,024.79 |
2,342.20 |
| Inferred |
14.40 |
0.460 |
0.77 |
213.06 |
358.49 |
| |
|
Sulfide/
0.315g/t |
Measured |
1.30 |
0.710 |
1.28 |
29.77 |
53.52 |
| Indicated |
1.99 |
0.625 |
1.32 |
39.94 |
84.47 |
| Measured and Indicated |
3.29 |
0.659 |
1.30 |
69.72 |
137.99 |
| Inferred |
1.05 |
0.657 |
1.14 |
22.14 |
38.53 |
| |
|
|
|
|
|
|
| Total - Oxide and Sulfide |
Measured |
25.80 |
0.545 |
1.28 |
452.55 |
1,063.54 |
| Indicated |
38.31 |
0.521 |
1.15 |
641.96 |
1,416.65 |
| Measured and Indicated |
64.12 |
0.531 |
1.20 |
1,094.51 |
2,480.19 |
| Inferred |
15.44 |
0.474 |
0.80 |
235.20 |
397.02 |
Notes:
| 1. | Oxide estimated Mineral Resources are reported within a pit shell using the Lerch Grossman algorithm, a gold price of US$1,550/oz
and a recovery of 82% for Au and silver price of US$20/oz and a recovery of 20% For Ag. |
| 2. | Sulphide estimated Mineral Resources are reported within a pit shell using the Lerch Grossman algorithm, a gold price of US$1,550/oz
and a recovery of 50% for Au and silver price of US$20/oz and a recovery of 12% for Ag. |
| 3. | Mining costs for mineralized material and waste are US$2.25/tonne. |
| 4. | Processing, general and administration, and refining costs are US$5.00/tonne, US$0.50/tonne, and US$0.05/tonne respectively. |
| 5. | Due to rounding, some columns or rows may not compute as shown. |
| 6. | Estimated Mineral Resources are stated as in situ dry metric tonnes. |
| 7. | The estimate of Mineral Resources may be materially affected by legal, title, taxation, socio-political, marketing, or other relevant
issues. |
FORTE DYNAMICS, INC
120 Commerce Drive., Units 3 & 4, Fort Collins, CO 80524 | P a g e | 121 of 178 | December 2023 |
| | Augusta Gold Corp. |
Table 11-2: Montgomery-Shoshone Mineral Resources
| Mineral Resources as of December 31, 2021 - Montgomery-Shoshone |
Redox/
Cutoff |
Classification |
Tonnes
(Mt) |
Au grade
(g/t) |
Ag grade
(g/t) |
Au Contained
(koz) |
Ag Contained
(koz) |
|
Oxide/
0.192 g/t |
Measured |
1.97 |
0.637 |
3.35 |
40.35 |
212.12 |
| Indicated |
1.35 |
0.555 |
2.85 |
24.04 |
123.66 |
| Measured and Indicated |
3.32 |
0.603 |
3.15 |
64.38 |
335.78 |
| Inferred |
1.05 |
0.586 |
3.45 |
19.76 |
116.41 |
Notes:
| 1. | Oxide estimated Mineral Resources are reported within a pit shell using the Lerch Grossman algorithm, a gold price of US$1,550/oz
and a recovery of 82% for Au and silver price of US$20/oz and a recovery of 20% For Ag. |
| 2. | Sulphide estimated Mineral Resources are reported within a pit shell using the Lerch Grossman algorithm, a gold price of US$1,550/oz
and a recovery of 50% for Au and silver price of US$20/oz and a recovery of 12% for Ag. No sulphide material was reported for Montgomery-Shoshone. |
| 3. | Mining costs for mineralized material and waste are US$2.25/tonne. |
| 4. | Processing, general and administration, and refining costs are US$5.00/tonne, US$0.50/tonne, and US$0.05/tonne respectively. |
| 5. | Due to rounding, some columns or rows may not compute as shown. |
| 6. | Estimated Mineral Resources are stated as in situ dry metric tonnes. |
| 7. | The estimate of Mineral Resources may be materially affected by legal, title, taxation, socio-political, marketing, or other relevant
issues. |
Table 11-3: Bonanza Mineral Resources
| Mineral Resources as of December 31, 2021 - Bonanza |
Redox/
Cutoff/ |
Classification |
Tonnes
(Mt) |
Au grade
(g/t) |
Ag grade
(g/t) |
Au Contained
(koz) |
Ag Contained
(koz) |
|
Oxide
0.192 g/t |
Measured |
2.35 |
0.446 |
0.44 |
33.78 |
33.48 |
| Indicated |
1.22 |
0.422 |
0.44 |
16.61 |
17.17 |
| Measured and Indicated |
3.58 |
0.438 |
0.44 |
50.40 |
50.65 |
| Inferred |
0.19 |
0.473 |
0.37 |
2.94 |
2.28 |
Notes:
| 1. | Oxide estimated Mineral Resources are reported within a pit shell using the Lerch Grossman algorithm, a gold price of US$1,550/oz
and a recovery of 82% for Au and silver price of US$20/oz and a recovery of 20% For Ag. |
| 2. | Sulphide estimated Mineral Resources are reported within a pit shell using the Lerch Grossman algorithm, a gold price of US$1,550/oz
and a recovery of 50% for Au and silver price of US$20/oz and a recovery of 12% for Ag. No sulphide material was reported for Bonanza. |
| 3. | Mining costs for mineralized material and waste are US$2.25/tonne. |
| 4. | Processing, general and administration, and refining costs are US$5.00/tonne, US$0.50/tonne, and US$0.05/tonne respectively. |
| 5. | Due to rounding, some columns or rows may not compute as shown. |
| 6. | Estimated Mineral Resources are stated as in situ dry metric tonnes. |
| 7. | The estimate of Mineral Resources may be materially affected by legal, title, taxation, socio-political, marketing, or other relevant
issues. |
FORTE DYNAMICS, INC
120 Commerce Drive., Units 3 & 4, Fort Collins, CO 80524 | P a g e | 122 of 178 | December 2023 |
| | Augusta Gold Corp. |
Table 11-4: Combined Property Mineral Resources
| |
Combined Global Resources as of December 31, 2021 - Oxide and Sulphide |
| |
Classification |
Tonnes
(Mt) |
Au grade
(g/t) |
Ag grade
(g/t) |
Au Contained
(koz) |
Ag Contained
(koz) |
| |
Measured |
30.13 |
0.544 |
1.35 |
526.68 |
1,309.13 |
| |
Indicated |
40.88 |
0.519 |
1.18 |
682.61 |
1,557.49 |
| |
Measured and Indicated |
71.01 |
0.530 |
1.26 |
1,209.29 |
2,866.62 |
| |
Inferred |
16.69 |
0.481 |
0.96 |
257.90 |
515.72 |
Notes:
| 1. | Oxide estimated Mineral Resources are reported within a pit shell using the Lerch Grossman algorithm, a gold price of US$1,550/oz
and a recovery of 82% for Au and silver price of US$20/oz and a recovery of 20% For Ag. |
| 2. | Sulphide estimated Mineral Resources are reported within a pit shell using the Lerch Grossman algorithm, a gold price of US$1,550/oz
and a recovery of 50% for Au and silver price of US$20/oz and a recovery of 12% for Ag. No sulphide material was reported for Montgomery-Shoshone
or Bonanza. |
| 3. | Mining costs for mineralized material and waste are US$2.25/tonne. |
| 4. | Processing, general and administration, and refining costs are US$5.00/tonne, US$0.50/tonne, and US$0.05/tonne respectively. |
| 5. | Due to rounding, some columns or rows may not compute as shown. |
| 6. | Estimated Mineral Resources are stated as in situ dry metric tonnes. |
| 7. | The estimate of Mineral Resources may be materially affected by legal, title, taxation, socio-political, marketing, or other relevant
issues. |
The drillhole database was provided as an Excel
spreadsheet with multiple data tabs for collar, downhole survey, assay, and lithologic information (AGC Master Export_20220204.xls). Additionally,
the spreadsheet tabs included notes and other meta-data to help discern data quality. The primary collar, survey, and assay tabs were
exported to individual spreadsheets for the data types (AGC_Master_collar_20220204_LS1.xls, AGC_Master_survey_20220204_LS1.xls, AGC_Master_assay_20220204_LS1.xls).
The three spreadsheets, which include extra meta-data
were compared with logging and available certificate data and against each other to determine match-ability between the three basic data
types used to import into the Vulcan software. Each of the three include tabs for final sorted data to be exported to csv.
A common scenario for many drillholes was to have
a second collar name with a “C”, “c”, “A”, or “a” after it to identify that portion of
a drillhole as a second drillhole, or a core tail of an RC drillhole (example is RDH-373 and RDH-373C). However, the dh-survey, collar
coordinate, or assay data were not always synchronised into a single common drillhole name for both the core and core tail. The data for
export in each spreadsheet was synchronized to common HoleID’s and holes with missing assay or collar data were removed. The final
database consisted of 1,322 collar records, 6,082 survey records and 173,509 assay interval records. The final number of valid drillholes
is less than the previous data set from June 2021 due to duplicate collar with different spellings being removed.
A major difference between the most recent database
provided by Augusta Gold and the database for June, 2021 was the treatment of missing assay data. In the old data, many missing intervals
had 0 or near-0 grades applied. The newest database had no record at all and the resulting drillhole data in Vulcan has missing portions
of the drillhole trace. These are treated as no-grade in the estimation process while the 0’s or near-0’s in the old database
tended to lower grades in the gold estimation process. It is generally excepted that missing intervals be treated as null or missing intervals
instead of 0’s as the lack of sample could be due to poor sample recovery or lost assay data.
FORTE DYNAMICS, INC
120 Commerce Drive., Units 3 & 4, Fort Collins, CO 80524 | P a g e | 123 of 178 | December 2023 |
| | Augusta Gold Corp. |
| 11.2.1 | Vulcan Isis Drillhole Database |
The three primary drillhole data spreadsheets
were saved as csv files and were imported into an Isis drillhole database in Vulcan. The the Isis database was setup with 18 fields including:
HOLEID, FROM, TO, FROM_FT, TO_FT, SAMPLETYPE,
SAMPLE_KG, REJECT, AU_RES, AG_RES, AUPPM, AGPPM, AUCAP, AGCAP, AREA, DOMAIN, LITH_A, LITH_N
These include new fields that are not in the original
database to aid in data usage, domaining, and estimation. The feet version of downhole intervals aids in comparing to legacy drill logs,
were in feet. The sample_kg field helps with sample recovery where available. The reject field was setup in the Excel assay spreadsheet
and was coded there to identify rejected drillholes in Vulcan after import. The AUPPM, AU_RES, and AU_CAP fields (and similar AG fields)
are a hierarchy of initial imported gold grade, the gold grade considered for estimation and is of resource quality, and a capped version
of that grade. The RES grades usually equal AUPPM, except where the interval is rejected. The rejections include both entire rejected
drillhole and portions of drillholes were assay grades are not to be used. The AU_CAP is set with a capping script later on.
Figure 11-1 shows the drillhole collars and traces
within the respective model boundaries for each of the block models.
FORTE DYNAMICS, INC
120 Commerce Drive., Units 3 & 4, Fort Collins, CO 80524 | P a g e | 124 of 178 | December 2023 |
| | Augusta Gold Corp. |
Figure 11-1: Drillhole Collar Locations
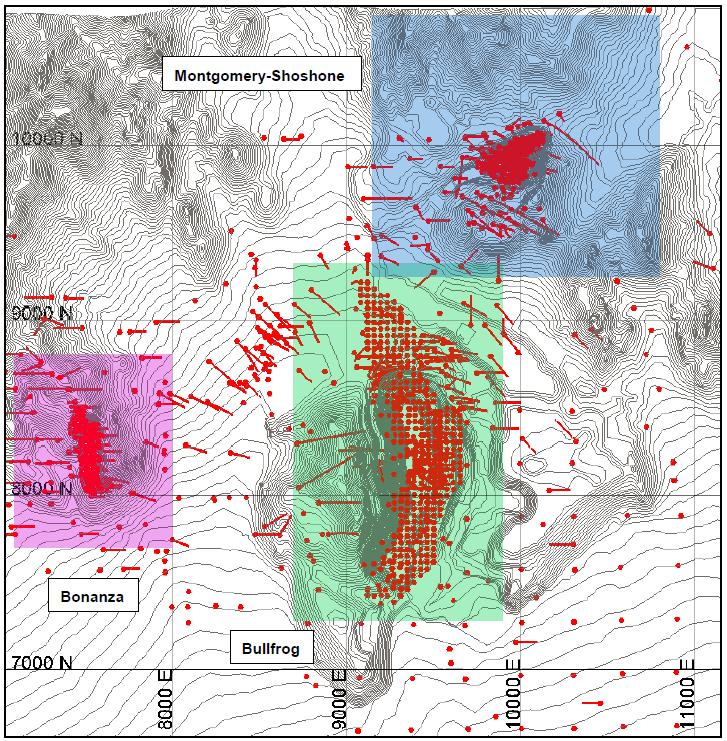
FORTE DYNAMICS, INC
120 Commerce Drive., Units 3 & 4, Fort Collins, CO 80524 | P a g e | 125 of 178 | December 2023 |
| | Augusta Gold Corp. |
| 11.2.2 | Drillhole Exclusion |
Drillholes excluded from estimation are listed
below. At Bullfrog, 25 holes have been excluded from resource estimation due primarily to downhole contamination and a few location and
downhole survey issues. Several drillholes were re-instated compared to last year due primarily to newly available data. At Montgomery-Shoshone
21 drillholes now have numerous data gaps with unknown grades in the new database and are inappropriate for local mineral estimation.
Table 11-5: Drillhole Exclusion for Bullfrog
Deposit
| HoleID |
Rejected 2022 |
Rejected 2021 |
Notes: |
| CRDH-5A |
Yes |
No |
Downhole contamination |
| CRDH-7A |
Yes |
No |
Downhole contamination |
| DDH-041 |
Yes |
No |
Underground collar in unlikely location |
| RDH-105 |
Yes |
No |
Downhole contamination and conflicts with two other close drillholes |
| RDH-148 |
Yes |
No |
Downhole contamination and conflicts with core hole nearby |
| RDH-195 |
Yes |
Yes |
Downhole contamination |
| RDH-244 |
Yes |
Yes |
Downhole contamination |
| RDH-330 |
Yes |
No |
Downhole contamination |
| RDH-359 |
Yes |
Yes |
Downhole contamination |
| RDH-375 |
Yes |
No |
No downhole surveys and poor match with nearby drillholes |
| RDH-832 |
Yes |
Yes |
Downhole contamination |
| RDH-855 |
Yes |
Yes |
Downhole contamination |
| RDH-856 |
Yes |
Yes |
Downhole contamination |
| RDH-857 |
Yes |
Yes |
Downhole contamination |
| RDH-859 |
Yes |
Yes |
Downhole contamination |
| RDH-868 |
Yes |
Yes |
Downhole contamination |
| RDH-882C |
Yes |
Yes |
RC portion is rejected due to downhole contamination, Core tail unrejected |
| RDH-891 |
Yes |
Yes |
Downhole contamination |
| RDH-898 |
Yes |
Yes |
Downhole contamination |
| RDH-912 |
Yes |
Yes |
Downhole contamination |
| RDH-924 |
Yes |
Yes |
Downhole contamination |
| RDH-927 |
Yes |
Yes |
Downhole contamination |
| RDH-966 |
Yes |
No |
Location shift of 100 meters in new data causing conflict with other drillhole data |
| RDH-817C |
Yes |
No |
Survey data causes unlikely hole kink and moves highgrade intercept outside of highgrade structure |
| RDH-827 |
Yes |
No |
Survey data causes unlikely hole kink and moves highgrade intercept outside of highgrade structure |
| DDH-014 |
No |
Yes |
Unrejected - Core hole with good data |
| DDH-016 |
No |
Yes |
Unrejected - Core hole with good data |
| DDH-017 |
No |
Yes |
Unrejected - Core hole with good data |
| EDH-008 |
No |
Yes |
Unrejected - Now has assay data |
| ES-002 |
No |
Yes |
Unrejected - Now has assay data |
| RDH-108 |
No |
Yes |
Unrejected - Now has assay data |
| RDH-185 |
No |
Yes |
Unrejected - Now has assay data |
| RDH-495 |
No |
Yes |
Unrejected - Has no assay data anyway and doesn't export from database |
| RDH-921 |
No |
Yes |
Unrejected - Now has assay data |
FORTE DYNAMICS, INC
120 Commerce Drive., Units 3 & 4, Fort Collins, CO 80524 | P a g e | 126 of 178 | December 2023 |
| | Augusta Gold Corp. |
Table 11-6: Drillhole Exclusion for Montgomery-Shoshone
Deposit
| HoleID |
Rejected
2022 |
Rejected
2021 |
Notes: |
| MS-94-1 |
Yes |
No |
Sporadic,
discontinuous, short assay intervals |
| MS-94-2 |
Yes |
No |
Sporadic,
discontinuous, short assay intervals |
| MS-94-3 |
Yes |
No |
Sporadic,
discontinuous, short assay intervals |
| MS-94-4 |
Yes |
No |
Sporadic,
discontinuous, short assay intervals |
| MSDH-1 |
Yes |
No |
Sporadic,
discontinuous, short assay intervals |
| MSDH-2 |
Yes |
No |
Sporadic,
discontinuous, short assay intervals |
| MSDH-3 |
Yes |
No |
Sporadic,
discontinuous, short assay intervals |
| MSDH-4 |
Yes |
No |
Sporadic,
discontinuous, short assay intervals |
| MSDH-6 |
Yes |
No |
Sporadic,
discontinuous, short assay intervals |
| MSDH-7 |
Yes |
No |
Sporadic,
discontinuous, short assay intervals |
| MSDH-8 |
Yes |
No |
Sporadic,
discontinuous, short assay intervals |
| MSDH-9 |
Yes |
No |
Sporadic,
discontinuous, short assay intervals |
| RDH-027 |
Yes |
No |
Sporadic,
discontinuous, short assay intervals |
| RDH-028 |
Yes |
No |
Sporadic,
discontinuous, short assay intervals |
| RDH-034 |
Yes |
No |
Sporadic,
discontinuous, short assay intervals |
| RDH-036 |
Yes |
No |
Sporadic,
discontinuous, short assay intervals |
| RDH-057 |
Yes |
No |
Sporadic,
discontinuous, short assay intervals |
| RDH-058 |
Yes |
No |
Sporadic,
discontinuous, short assay intervals |
| RDH-568A |
Yes |
No |
Sporadic,
discontinuous, short assay intervals |
| RDH-581 |
Yes |
No |
Sporadic,
discontinuous, short assay intervals |
| RDH-577 |
Yes |
No |
Sporadic,
discontinuous, short assay intervals |
Grade shells representing an 0.18 g/t gold value
were developed for each area in Leapfrog software and exported to Vulcan. The grade shells were developed using 3 meter composites and
modeled using the principal structural or mineralized trend in each of the respective areas. The Bullfrog area also contained a vein solid
to represent the high grade vein. The vein solid was constructed using the hanging wall and footwall of the historic underground stope
shapes combined with the drillhole logging information. The vein shape approximates a 3.0 g/t gold value. The Leapfrog triangulations
were filtered to eliminate extraneous solids that were constructed on limited drillhole data and didn’t represent continuous mineralization
based on multiple drillhole intercepts.
The drillhole data was flagged using the grade
shells that were provided and the integer values for the DOMAIN field are shown in Table 11-7.
FORTE DYNAMICS, INC
120 Commerce Drive., Units 3 & 4, Fort Collins, CO 80524 | P a g e | 127 of 178 | December 2023 |
| | Augusta Gold Corp. |
Figure 11-2: Grade Shell (DOMAIN) Triangulations

FORTE DYNAMICS, INC
120 Commerce Drive., Units 3 & 4, Fort Collins, CO 80524 | P a g e | 128 of 178 | December 2023 |
| | Augusta Gold Corp. |
Table 11-7: DOMAIN Codes and Corresponding
Grade Shell Triangulations
DOMAIN
Code |
Area |
Triangulation Name |
Description |
| 10 |
Bullfrog |
Modlim_BF.00t |
Background |
| 11 |
Bullfrog |
AU_GPT_INDICATOR_0_18_BULLFROG_trim.00t |
Low Grade Shell |
| 12 |
Bullfrog |
GM_RESDOMS_-_BF_MAIN_PART1.00t |
Vein Shape |
| 20 |
Montgomery-Shoshone |
Modlim_MS.00t |
Background |
| 21 |
Montgomery-Shoshone |
AU_GPT_INDICATOR_0_18_MS_-_INSI_PART1.00t |
Low Grade Shell |
| 30 |
Bonanza |
Modlim_BZ.00t |
Background |
| 31 |
Bonanza |
AU_GPT_INDICATOR_0_18_BONANZA_-_PART1 |
Low Grade Shell |
| 11.4 | Statistical Analyses and Capping of Outlier Values |
All raw drillhole intervals available in mid-2021
were analyzed utilizing histograms, cumulative distribution plots and summary statistics to check the overall distribution of assays and
provide guidance for grade capping. Gold and Silver assays were capped for each grade domain utilizing a combination of cumulative distribution
plots, total metal lost and coefficient of variation (CV). Breaks or inflections in the cumulative distribution plots were used as the
first set of criteria for choosing a capping value followed by limiting the total metal lost between 5% and 10% and/or maintaining a CV
less than 2.0. Histograms, cumulative distribution plots and summary statistics for gold and silver assays are listed in Appendix 1.
Separate database fields were generated for the
capped Gold and Silver assays and a script was used to set the capped values in the drillhole database. Tables 11-8 and 11-9 summarize
the capping statistics for Gold and Silver assays.
FORTE DYNAMICS, INC
120 Commerce Drive., Units 3 & 4, Fort Collins, CO 80524 | P a g e | 129 of 178 | December 2023 |
| | Augusta Gold Corp. |
Table 11-8: Capping Values and Statistics
for Gold Assays
| DOMAIN |
Au Min
(g/t) |
Au Max
(g/t) |
Au Avg
(g/t) |
Au Cap
Value |
Percentile
(%) |
Total GT
Lost (%) |
CV
(capped) |
Samples
Capped |
| 10 |
0.000 |
23.800 |
0.074 |
11.000 |
99.94 |
3.36 |
4.67 |
4 |
| 11 |
0.000 |
141.748 |
0.534 |
12.500 |
99.77 |
5.87 |
1.87 |
40 |
| 12 |
0.000 |
135.000 |
4.387 |
60.000 |
99.65 |
2.78 |
1.58 |
12 |
| 20 |
0.000 |
7.080 |
0.040 |
1.900 |
99.85 |
2.84 |
1.89 |
6 |
| 21 |
0.000 |
44.460 |
0.679 |
7.000 |
99.42 |
5.41 |
1.32 |
42 |
| 30 |
0.000 |
57.910 |
0.065 |
2.000 |
99.78 |
11.17 |
1.63 |
21 |
| 31 |
0.000 |
52.800 |
0.675 |
10.000 |
99.16 |
11.30 |
1.85 |
32 |
Table 11-9: Capping Values and Statistics
for Silver Assays
| DOMAIN |
Ag Min
(g/t) |
Ag Max
(g/t) |
Ag Avg
(g/t) |
Ag Cap
Value |
Percentile
(%) |
Total GT
Lost (%) |
CV
(capped) |
Samples
Capped |
| 10 |
0.000 |
180.000 |
0.352 |
13.000 |
99.83 |
6.75 |
1.89 |
36 |
| 11 |
0.000 |
179.000 |
1.325 |
30.000 |
99.79 |
2.96 |
1.64 |
41 |
| 12 |
0.000 |
503.203 |
7.911 |
100.000 |
99.60 |
5.03 |
1.43 |
13 |
| 20 |
0.000 |
100.000 |
0.349 |
10.000 |
98.90 |
12.17 |
1.35 |
36 |
| 21 |
0.000 |
867.000 |
4.655 |
100.000 |
99.78 |
6.15 |
1.76 |
18 |
| 30 |
0.000 |
59.440 |
0.527 |
4.300 |
99.54 |
2.00 |
1.32 |
58 |
| 31 |
0.000 |
86.000 |
1.246 |
25.000 |
99.55 |
6.38 |
1.84 |
18 |
The capped assay intervals for gold and silver
were composited on 3.0-meter down-hole lengths and broken on DOMAIN boundaries. The 3.0-meter composite length corresponds to the 3.0-meter
sub-block size in the resource block model and aligns with the anticipated 9.0-meter bench height to be used in the mining of the mineral
resource.
Variograms were generated in Vulcan Analyzer for
the composited data contained within the low-grade domains for the three areas and also within the high grade vein shape at Bullfrog.
This variography study was completed for the June 2021 resource model update.
FORTE DYNAMICS, INC
120 Commerce Drive., Units 3 & 4, Fort Collins, CO 80524 | P a g e | 130 of 178 | December 2023 |
| | Augusta Gold Corp. |
Figure 11-3: Variogram for Bullfrog Low Grade
Domain (11)
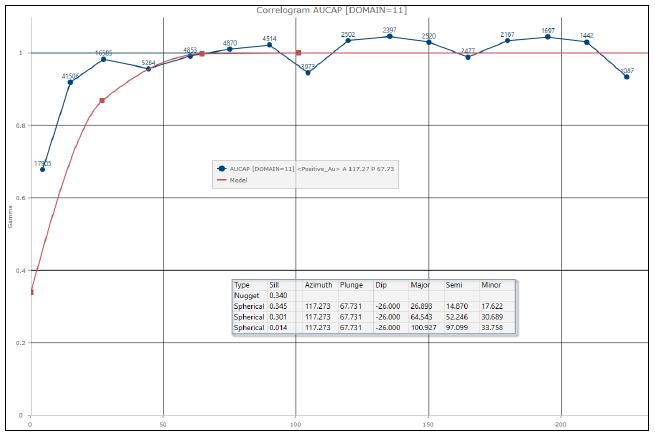
Figure 11-4: Variogram for Bullfrog High Grade
Vein Domain (12)

FORTE DYNAMICS, INC
120 Commerce Drive., Units 3 & 4, Fort Collins, CO 80524 | P a g e | 131 of 178 | December 2023 |
| | Augusta Gold Corp. |
Figure 11-5: Variogram for Montgomery-Shoshone
Low Grade Domain (21)

Figure 11-6: Variogram for Bonanza Low Grade
Domain (31)
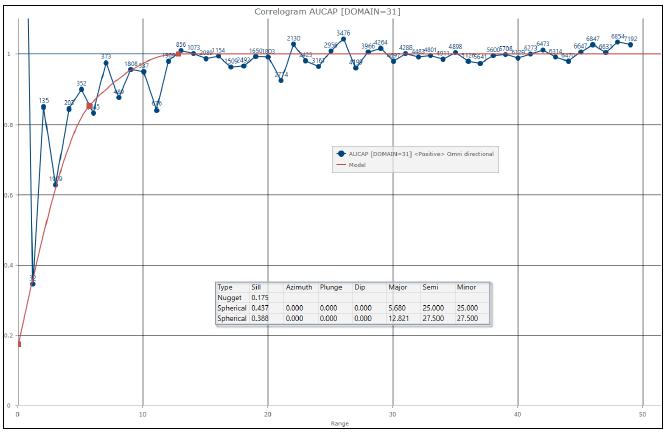
FORTE DYNAMICS, INC
120 Commerce Drive., Units 3 & 4, Fort Collins, CO 80524 | P a g e | 132 of 178 | December 2023 |
| | Augusta Gold Corp. |
Three separate block models were generated for
the mineralized areas. The origin and extents of the models were based on the extents of the geologic models, drillhole density and potential
open pit extents. A 9m x 9m x 9m parent block size was chosen to best match historic mining benches in each of the pit areas and a 3m
x 3m x 3m sub-block size was chosen to provide increased resolution along topographic, geologic and grade shell boundaries. Table 11-10
lists the block model coordinates and extents.
Table 11-10: Block Model Extents
| |
Bullfrog (BF) |
Montgomery-
Shoshone (MS) |
Bonanza (BZ) |
| Minimum Easting (m) |
8,695 |
9,150 |
7,100 |
| Maximum Easting (m) |
9,901 |
10,806 |
8,000 |
| Minimum Northing (m) |
7,280 |
9,250 |
7,700 |
| Maximum Northing (m) |
9,323 |
10,753 |
8,807 |
| Minimum Elevation (m) |
701 |
739 |
600 |
| Maximum Elevation (m) |
1,304 |
1,468 |
1,401 |
| Block Size X (Parent, Sub) |
9 meters, 3 meters |
9 meters, 3 meters |
9 meters, 3 meters |
| Block Size Y (Parent, Sub) |
9 meters, 3 meters |
9 meters, 3 meters |
9 meters, 3 meters |
| Block Size Z (Parent, Sub) |
9 meters, 3 meters |
9 meters, 3 meters |
9 meters, 3 meters |
| Number Blocks X |
134 |
184 |
100 |
| Number Blocks Y |
227 |
167 |
123 |
| Number Blocks Z |
67 |
81 |
89 |
| Easting Extents (m) |
1,206 |
1,656 |
900 |
| Northing Extents (m) |
2,043 |
1,503 |
1,107 |
| Elevation Extents (m) |
603 |
729 |
801 |
The topographic surfaces used to construct the
block models at Bullfrog include a combination of surfaces created from 10-meter contour intervals and detailed high-resolution DEM surfaces
create from flyover data. The high-resolution DEM surfaces were used inside the current pit while the contour surfaces were used for the
overall project area. The bottom of the Bullfrog pit, which has recently been backfilled during the reclamation process, has been captured
by a deepest mining surface in the project data that was created from toe-crest-ramp as-builts information.
Triangulated solids that represent surface waste
dump material were generated from aerial photo data, current topographic surfaces and the drillhole collar locations prior to placement
of the waste dumps. Sub-blocks were created along all topographic surfaces and a topo percentage field was calculated to quantify the
percentage of a given block below the topographic surface.
FORTE DYNAMICS, INC
120 Commerce Drive., Units 3 & 4, Fort Collins, CO 80524 | P a g e | 133 of 178 | December 2023 |
| | Augusta Gold Corp. |
Solids that represent the historic underground
stope shapes in the Bullfrog area were provided. These solids were analyzed in context with the Bullfrog vein shape and were expanded
by 1m in all directions to account for differences between the vein shape and underground stope shapes. The expansion of the stopes also
provides a buffer to account for potential collapse along the stope boundaries that could result in increased dilution and mineralization
loss. Sub-blocks were created along all underground stope boundaries. Figure 11-7 displays an East-West cross-section showing the original
stope shape (as-built) with the 1 meter expanded stope shape. The modeled Bullfrog vein shape is displayed as reference.
Figure 11-7: Bullfrog Underground Stope Shapes

The same grade shell solids used to flag the DOMAIN
field in the drillhole and composite files were used to flag the DOMAIN field in the block models. Sub-blocks were created along all grade
shell boundaries.
Block model fields were created to capture gold
values, silver values, distance to nearest composite, number of composites and number of drillholes used in the block estimation. A lithology
field was flagged using the lithologic solids and used to assign rock density. Block tonnes and block ounce fields were calculated based
on block volume, topo percent, density and estimated gold and silver grades. These fields were used in the subsequent re-blocking of the
model to a regularized 9m x 9m x 9m block model for pit optimization work.
FORTE DYNAMICS, INC
120 Commerce Drive., Units 3 & 4, Fort Collins, CO 80524 | P a g e | 134 of 178 | December 2023 |
| | Augusta Gold Corp. |
| 11.8 | Estimation Methodology |
Gold and silver grades were ordinary kriged using
multiple-pass estimation runs based on estimation domain and expanding search distances. The first three estimation passes were set at
a search distance equivalent to the variogram range corresponding to 50%, 80% and 90% of the variogram sill generated from 9 meter gold
composites, respectively. A fourth estimation pass was done at longer search ranges to generate mineral inventory. Composite selection
criteria were also varied by estimation pass in terms of the minimum/maximum samples required and number of samples per drillhole. Gold
and silver grades were estimated using the same estimation parameters. A nearest-neighbor estimate and an inverse-distance estimate were
also completed for each of the models and used for block model validation purposes. The variogram models used in the estimation were taken
from the variograms presented in Section 11.6. Table 11-11 summarizes the major estimation parameters used in the estimation runs.
FORTE DYNAMICS, INC
120 Commerce Drive., Units 3 & 4, Fort Collins, CO 80524 | P a g e | 135 of 178 | December 2023 |
| | Augusta Gold Corp. |
Table 11-11: Block Estimation Parameters
| Area |
Pass |
Domain |
Bearing |
Dip |
Plunge |
Major
Axis
(m) |
Semi-
Major
Axis
(m) |
Minor
Axis
(m) |
Max
Samples/
DH |
Samples
Min |
Samples
Max |
| BF |
1 |
11 - LG |
170 |
-45 |
0 |
10 |
10 |
10 |
3 |
9 |
2 |
| BF |
2 |
11 - LG |
170 |
-45 |
0 |
50 |
50 |
20 |
6 |
18 |
3 |
| BF |
3 |
11 - LG |
170 |
-45 |
0 |
75 |
75 |
20 |
6 |
18 |
3 |
| BF |
4 |
11 - LG |
170 |
-45 |
0 |
100 |
100 |
30 |
6 |
18 |
3 |
| BF |
1 |
12 - Vein |
170 |
-45 |
0 |
10 |
10 |
10 |
3 |
9 |
2 |
| BF |
2 |
12 - Vein |
170 |
-45 |
0 |
50 |
50 |
20 |
6 |
18 |
3 |
| BF |
3 |
12 - Vein |
170 |
-45 |
0 |
75 |
75 |
20 |
6 |
18 |
3 |
| BF |
4 |
12 - Vein |
170 |
-45 |
0 |
100 |
100 |
30 |
6 |
18 |
3 |
| MS |
1 |
21 - LG |
45 |
45 |
0 |
10 |
10 |
10 |
3 |
9 |
2 |
| MS |
2 |
21 - LG |
45 |
45 |
0 |
30 |
30 |
15 |
6 |
18 |
3 |
| MS |
3 |
21- LG |
45 |
45 |
0 |
55 |
55 |
28 |
6 |
18 |
3 |
| MS |
4 |
21 - LG |
45 |
45 |
0 |
100 |
100 |
50 |
6 |
18 |
3 |
| MS |
1 |
22 - Polaris |
0 |
60 |
0 |
10 |
10 |
10 |
3 |
9 |
2 |
| MS |
2 |
22 - Polaris |
0 |
60 |
0 |
30 |
30 |
15 |
6 |
18 |
3 |
| MS |
3 |
22 - Polaris |
0 |
60 |
0 |
55 |
55 |
28 |
6 |
18 |
3 |
| MS |
4 |
22 - Polaris |
0 |
60 |
0 |
150 |
150 |
75 |
6 |
18 |
3 |
| BZ |
1 |
31 - LG |
170 |
-60 |
0 |
10 |
10 |
10 |
3 |
9 |
2 |
| BZ |
2 |
31 - LG |
170 |
-60 |
0 |
40 |
40 |
20 |
6 |
18 |
3 |
| BZ |
3 |
31 - LG |
170 |
-60 |
0 |
60 |
60 |
30 |
6 |
18 |
3 |
| BZ |
4 |
31 - LG |
170 |
-60 |
0 |
100 |
100 |
30 |
6 |
18 |
3 |
A soft boundary approach was used within the low
grade estimation domains to allow the estimation to use drillhole composites from outside of the domain. A 50m x 50m x 25m soft boundary
search was used for Bullfrog while a 25m x 25m x 10m soft boundary search was used for Bonanza.
Visual validations between drillhole composites
and estimated blocks were done on sections and plans. An example cross-section is shown in Figure 11-8.
FORTE DYNAMICS, INC
120 Commerce Drive., Units 3 & 4, Fort Collins, CO 80524 | P a g e | 136 of 178 | December 2023 |
| | Augusta Gold Corp. |
Figure 11-8: Bullfrog 8620N Cross-Section
Showing Gold Blocks and Composites

The kriged estimates were validated using statistical
comparisons between the nearest-neighbor estimate and the inverse-distance estimate. Swath plots between the kriged estimate and the nearest
neighbor estimate were generated on Easting, Northing and Elevation. The swath plots can be found in Appendix 1.
The estimated gold and silver grades were copied
to new variables (Au_use, Ag_use) within the block model and post-estimation calculations were performed on those variables. All gold
and silver grades were set to zero inside the 1 meter expanded stope shape, dump shapes and pit fill shapes. The unmineralized and barrenTB3
basalt unit was also assigned null values for gold and silver. All blocks above the mined-out topography were set to zero.
A triangulation representing oxide mineralization
was provided and coded to the block model as oxide. All material in the hanging wall of the MP Fault is also considered to be oxide. All
remaining blocks were coded as sulfide.
FORTE DYNAMICS, INC
120 Commerce Drive., Units 3 & 4, Fort Collins, CO 80524 | P a g e | 137 of 178 | December 2023 |
| | Augusta Gold Corp. |
Figure 11-9: Oxide and Sulfide Coding –
Bullfrog Section 8600N
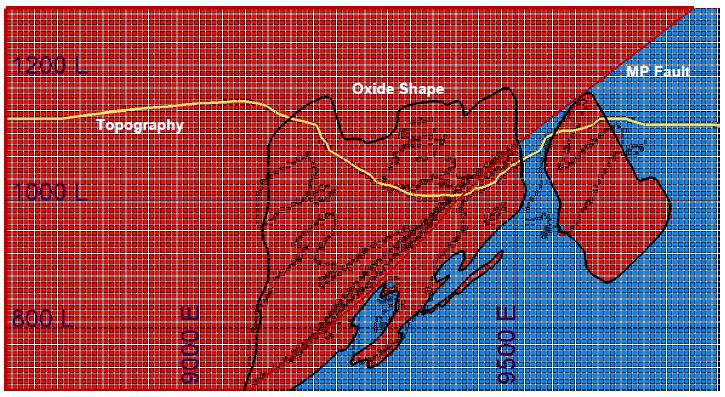
| 11.9 | Resource Estimate Classification |
Resource classification was based on the distance
to the nearest composite and the number of holes used in the block estimate. The distances and number of drillholes used were based on
geologic continuity as observed by the project geologist. Also, the ranges associated with 50%, 80% and 90% of the variogram sill were
used as a guide in selecting the appropriate distances. Table 11-12 shows the parameters used in the assignment of classification.
Table 11-12: Block Estimation Parameters
| |
Distance to Nearest
Composite |
Number of Drillholes used
in Estimate |
Classification Assignment |
| Measured |
<= 15 meters |
>= 3 drillholes |
CATEG = 1 |
| Indicated |
<= 50 meters |
>= 3 drillholes |
CATEG = 2 |
| Inferred |
<= 75 meters |
>= 2 drillholes |
CATEG = 3 |
All blocks estimated in Pass 4 were not classified.
Specific gravity was assigned to the block model
based on approximately 280 density measurements recently taken in mineralized rock and unmineralized rock. Further delineation of the
density values in the unmineralized rock were done using the assigned lithology. Tables 11-13 to 11-15 summarize the assignment of density
values to the block model.
FORTE DYNAMICS, INC
120 Commerce Drive., Units 3 & 4, Fort Collins, CO 80524 | P a g e | 138 of 178 | December 2023 |
| | Augusta Gold Corp. |
Table 11-13: Density Assignments for Mineralized
Domains
| Mineralized Rock |
|
|
| Area |
Mineralized Domain |
SG Assignment |
| BF |
Low Grade (11) |
2.52 |
| BF |
Vein (12) |
2.71 |
| MS |
Low Grade (21) |
2.52 |
| MS |
Low Grade, Polaris (22) |
2.52 |
| BZ |
Low Grade (31) |
2.52 |
Table 11-14: Density Assignments for Unmineralized
Domains
| Unmineralized Rock |
|
|
|
| Area |
Unmineralized DOMAIN |
Lithology (LITH) |
SG Assignment (SG) |
| BF, MS & BZ |
Unmineralized (10, 20, 30) |
1, 2 |
2.38 |
| BF, MS & BZ |
Unmineralized (10, 20, 30) |
3, 4, 5, 6 |
2.36 |
| BF, MS & BZ |
Unmineralized (10, 20, 30) |
7 |
2.25 |
| BF, MS & BZ |
Unmineralized (10, 20, 30) |
8 |
2.42 |
| BF, MS & BZ |
Unmineralized (10, 20, 30) |
9, 10 |
2.26 |
| BF, MS & BZ |
Unmineralized (10, 20, 30) |
20, 30 |
2.60 |
Table 11-15: Density Assignments for Dump,
Fill and Alluvium
| Special Assignments |
|
|
| Area |
Description |
SG Assignment |
| BF, MS & BZ |
Waste Dump |
2.05 |
| BF, MS & BZ |
Pit Backfill |
2.05 |
| BF, MS & BZ |
UG Stope Backfill/Pastefill |
2.00 |
| BF, MS & BZ |
Alluvium |
2.21 |
FORTE DYNAMICS, INC
120 Commerce Drive., Units 3 & 4, Fort Collins, CO 80524 | P a g e | 139 of 178 | December 2023 |
| | Augusta Gold Corp. |
The pit slopes were reviewed and measured using
recent topography, aerial photos and observations of the current pit highwalls. Pit slope angles were estimated by measuring the overall
slope angle (toe to crest) of the existing pit walls. Measurements were taken along the pit walls where noticeable pit slope changes occur
both laterally and vertically. Triangulations were generated from the pit slope measurements and fault surfaces to represent the slope
sectors and assign overall slope angles for use during the pit shell optimization. The following figures show the pit slope measurements,
slope sector triangulations and overall slope angle assignment for each slope sector.
Figure 11-10: Bullfrog Pit Slope Angles and
Slope Sector Assignments
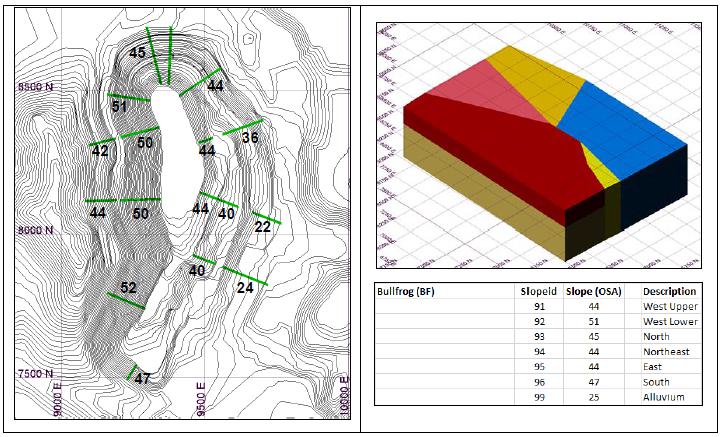
FORTE DYNAMICS, INC
120 Commerce Drive., Units 3 & 4, Fort Collins, CO 80524 | P a g e | 140 of 178 | December 2023 |
| | Augusta Gold Corp. |
Figure 11-11: Bonanza Pit Slope Angles and
Slope Sector Assignments
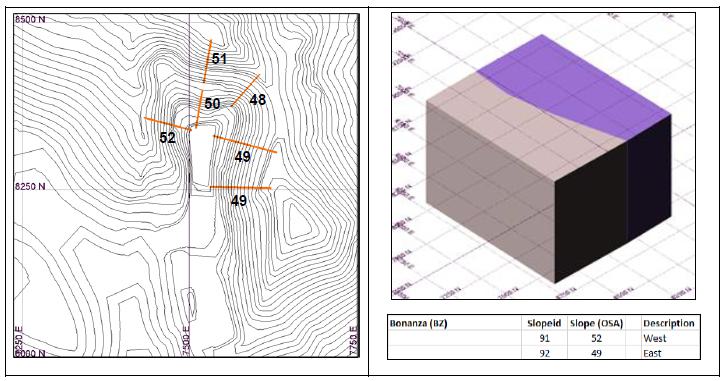
Figure 11-12: Montgomery-Shoshone Pit Slope
Angles and Slope Sector Assignments
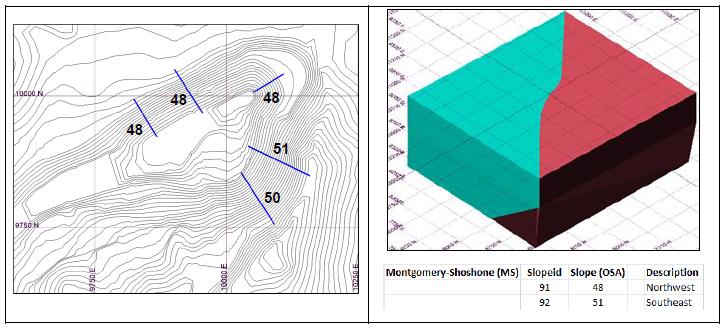
The sub-blocked model was re-blocked to a regularized
size of 9m x 9m x 9m for use in the Minemax LG optimization software. Tonnes per block were calculated for the sub-blocked model by multiplying
the block volume, specific gravity and percentage below topography. Gold and silver ounces were then calculated for each block by multiplying
the block tonnage and the gold and silver grades. The block regularization exercise in Vulcan summed the sub-block tonnes and the sub-block
ounces during the re-blocking to the 9m x 9m x 9m regularized blocks. Resource classification used the majority code assignment during
re-blocking.
FORTE DYNAMICS, INC
120 Commerce Drive., Units 3 & 4, Fort Collins, CO 80524 | P a g e | 141 of 178 | December 2023 |
| | Augusta Gold Corp. |
| 11.13 | Pit Shell Optimization |
Lerch Grossman pit shell optimizations in Minemax
software were performed on the re-blocked models using the parameters in Table 11-16.
Table 11-16: LG Pit Optimization Parameters
| Parameter: |
Input |
Unit |
| Gold Price |
1,550.00 |
US$/oz |
| Silver Price |
20.00 |
US$/oz |
| |
|
|
| Mining Cost Mineralized Material and Waste |
2.25 |
US$/tonne |
| Processing Cost |
5.00 |
US$/tonne |
| General and Administrative (G&A) |
0.50 |
US$/tonne |
| Refining Cost |
0.05 |
US$/tonne |
| Selling Cost |
10.00 |
US$/oz |
| |
|
|
| Gold Recovery (Oxide Material) |
82.0 |
% |
| Gold Recovery (Sulphide Material) |
50.0 |
% |
| Silver Recovery (Oxide Material) |
20.0 |
% |
| Silver Recovery (Sulphide Material) |
12.0 |
% |
Pit optimization in Minemax implies an incremental
cutoff grade block by block counting costs and revenues from the estimated block parameters. For reporting, the incremental gold cutoff
grades used are 0.137 g/tonne for oxide-leach and 0.224 g/tonne for sulphide leach. Break-even cutoff grades, which consider mining cost
and can identify blocks with overall positive net value, are 0.192 for oxide-leach and 0.315 for sulphide-leach.
Property boundaries were observed during the pit
optimization and no mineralized material or waste mining was allowed to occur outside of the property boundaries. Figures 11-13 to 11-15
represent the results of the pit optimization and the bounding surfaces for which mineral resources have been calculated within.
FORTE DYNAMICS, INC
120 Commerce Drive., Units 3 & 4, Fort Collins, CO 80524 | P a g e | 142 of 178 | December 2023 |
| | Augusta Gold Corp. |
Figure 11-13: Bullfrog

Figure 11-14: Montgomery-Shoshone
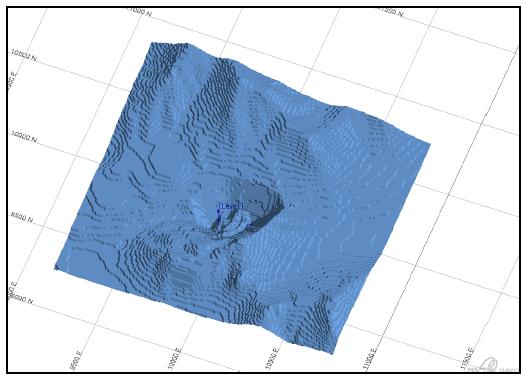
FORTE DYNAMICS, INC
120 Commerce Drive., Units 3 & 4, Fort Collins, CO 80524 | P a g e | 143 of 178 | December 2023 |
| | Augusta Gold Corp. |
Figure 11-15: Bonanza

In addition to the surfaces, a csv version of
the block model is exported from Minemax with additional pitshell and destination fields. The “pitshell” field with a code
of 1 represents all blocks within the optimized pit. Additionally, a “destination” field with a code of 1 represents blocks
with positive net values using both gold and silver values and economic parameters. These two fields are imported into the regularized
Vulcan resource model and are used directly for tabulating resources.
FORTE DYNAMICS, INC
120 Commerce Drive., Units 3 & 4, Fort Collins, CO 80524 | P a g e | 144 of 178 | December 2023 |
| | Augusta Gold Corp. |
| 12. | Mineral Reserve Estimates |
N/A
N/A
| 14. | Process and Recovery Methods |
N/A
N/A
N/A
| 17. | Environmental Studies, Permitting, and Plans, Negotiations, or Agreements with Local Individuals or Groups |
N/A
| 18. | Capital and Operating Costs |
N/A
N/A
FORTE DYNAMICS, INC
120 Commerce Drive., Units 3 & 4, Fort Collins, CO 80524 | P a g e | 145 of 178 | December 2023 |
| | Augusta Gold Corp. |
Corvus Gold Corp (Corvus) controls most of the
northern half of the Bullfrog Mining District. Corvus’ North Bullfrog southern land boundary is 2.4 km (1.5 miles) north of the
Company’s northern land boundary, or 8 km (5 miles) north of the M-S pit. Corvus also controls the Mother Lode property approximately
3.8 km from Bullfrog’s eastern property boundary to the western boundary of Mother Lode. Corvus released results in two technical
reports titled “Technical Report and Preliminary Economic Assessment for Biox Mill and Heap Leach Processing At The Mother Lode
Project, Bullfrog Mining District, Nye County, Nevada”, and “Technical Report and Preliminary Economic Assessment for Gravity
Milling and Heap Leach Processing at the North Bullfrog Project, Bullfrog Mining District, Nye County Nevada, both with an effective date
of October 7, 2020. The QP has been unable to verify the information in the foregoing technical report and the information is not necessarily
indicative of the mineralization at the Bullfrog Gold Project.
Figure 20-1 below shows the land positions of
Augusta, Corvus and other properties in the area.
Figure 20-1: Land Positions of the Bullfrog
Project and Adjacent Properties
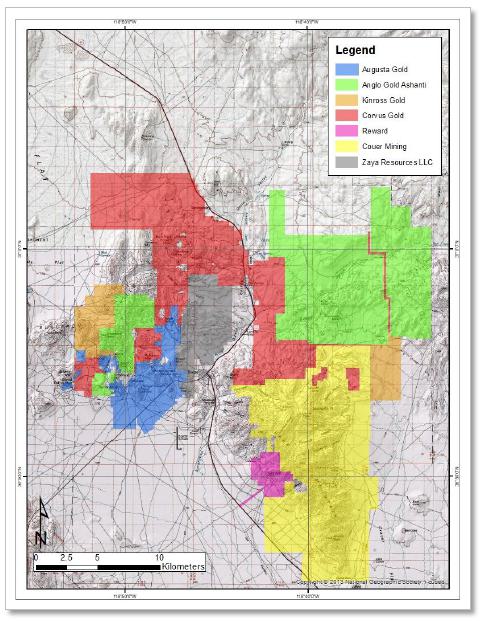
FORTE DYNAMICS, INC
120 Commerce Drive., Units 3 & 4, Fort Collins, CO 80524 | P a g e | 146 of 178 | December 2023 |
| | Augusta Gold Corp. |
| 21. | Other Relevant Data and Information |
Relevant data and information have been included
within the respective sections.
FORTE DYNAMICS, INC
120 Commerce Drive., Units 3 & 4, Fort Collins, CO 80524 | P a g e | 147 of 178 | December 2023 |
| | Augusta Gold Corp. |
| 22. | Interpretation and Conclusions |
This report is based on all technical and scientific
data as of December 31, 2021, the effective date of this report. Mineral resources are considered by the QP to meet the reasonable prospects
of eventual economic extraction. Analytical data has been collected and analyzed using industry standard methods at the time they were
collected. Geologic data has been interpreted and modeled using historic maps, reports, field mapping, drillhole logging and three-dimensional
computer modeling. Resource block models were developed using the geologic and analytical data to best represent the mineralization within
each of the areas and accounts for historic mining of the resource by open pit and underground methods. Lerch-Grossman optimized pit shells
have been generated for each area using representative costs, metal recoveries and slope angles and resources have been summarized within
those pit shells.
| 22.1 | Geology and Mineral Resources |
| · | The exploration potential within the district is high and recent drilling has shown that mineralized structures
and features continue both laterally and vertically along the known mineralized trends in and near all three major areas. Specific areas
for additional exploration drilling and interpretation include Ladd Mountain and Mystery Hills near the Bullfrog pit; the Polaris vein
and related disseminated mineralization near the Montgomery-Shoshone pit; along strike and beneath Bonanza Mountain near the Bonanza pit;
and in the structurally prospective Gap area in the northern portion of the property. |
| · | Considerable effort has been placed on verifying historic assays and surveys by checking against historic
drill logs and assay certificates. The database has been updated to include additional assay certificate data that was recently discovered.
Problems with imperial-metric grade conversions in a porting of the legacy data have been corrected. |
| · | Forte Dynamics completed a review of the drilling database for Bullfrog and has verified assay data against
lab certificates for approximately 10% of drillholes in the economically important portions of the deposits. |
| · | The recent assay data has been collected in a manner appropriate for the deposit type and mineralization
style. Assay QA/QC analyses have been taken to ensure that assays are of a quality suitable for the estimation of mineral resources. |
| · | The level of understanding of the geology is very good. A district wide geologic model has been constructed
using historic maps, geology reports and field mapping. Drillhole logs are used in the interpretation, when possible, but more effort
should be placed on utilizing the downhole logging data to help refine the geologic models. |
| · | Drillholes excluded from resource estimation have been reviewed and the list has been updated. Some holes
now have assay data and have been removed from the exclusion list. A few additional RC drillholes with downhole contamination have been
added to the exclusion list. Location and downhole survey issues for a few holes have also been identified. |
| · | Historical production data, blastholes, pit maps, underground maps, stope surveys should be extracted
from the historical archives and digitized into a format that can aid in the interpretation of the geologic model and resource block model.
The historic data can be used to calibrate the resource model and provide a validation check. |
| · | The treatment of outlier assays in the database is appropriate and reasonable. The block grade interpretations
have been carried out using conventional methods consistent with common industry practice. |
FORTE DYNAMICS, INC
120 Commerce Drive., Units 3 & 4, Fort Collins, CO 80524 | P a g e | 148 of 178 | December 2023 |
| | Augusta Gold Corp. |
| · | Block model grades have been zeroed out in areas of historic underground and open pit mining. Block model
grades were also zeroed out within geologic units known to be barren. Backfilled areas within the open pit and underground mines have
been accounted for in the volume and tonnage to be mined. |
| · | Mining and processing costs based on similar Nevada operations have been applied in the pit optimization.
The existing pit walls remain very stable with steep overall slope angles on a majority of the pit walls. The existing wall angles have
been measured and applied in the pit optimization. |
| 22.2 | Metallurgical Test Work and Mineral Processing |
Metallurgical testing performed to date indicates
reasonable gold recovery at small particle sizes. The column leach tests on HPGR fine crushed materials suggest gold recovery could exceed
85% on 10 mesh material; however, further testing is required to properly characterize the recovery potential for each mineralized zone.
The metallurgical test program should be comprehensive,
and include the following (at a minimum):
| · | Full characterization of composite samples – Au/Ag content, carbon and sulfur speciation, typical
Geochem including Hg, solids specific gravity |
| · | Crushing work index testing |
| · | Column leach testing at various HPGR crush sizes, including comparative bottle roll tests and size fraction
recovery analysis |
| · | Compacted permeability testing |
| · | Any required environmental tests on column test residues measured |
| · | The project is in a jurisdiction that is amenable to mining. |
| · | The project site is near the town of Beatty, Nevada which has adequate amenities and services. |
| · | The project was open pit and underground mined from 1989-1999 and has remaining infrastructure that includes
power lines on site, a paved highway to site and a network of roads across the district. |
| · | Availability of adequate power through the local utility, as well as available water and water rights
to support operations require further evaluation. |
FORTE DYNAMICS, INC
120 Commerce Drive., Units 3 & 4, Fort Collins, CO 80524 | P a g e | 149 of 178 | December 2023 |
| | Augusta Gold Corp. |
Further exploration through drilling, geophysics
and mapping should continue throughout the district in order to define the current resource around the known mineralization, but also
to test potential greenfield exploration targets. Geologic models representing structure, lithology, alteration and mineralization should
continue to be developed utilizing historic data combined with new information. Historic mining information including open pit production
data, blasthole data, pit mapping, underground production data, underground mapping and underground sampling should be extracted from
the historic data sets and made available in a format that can be used in future geologic and resource modeling.
Baseline study work needs to be completed in the
following areas to provide additional information to support permitting activities and social-cultural work prior to pre-feasibility,
feasibility and mining operations.
| · | Geochemical characterization of waste rock |
| · | Hydrologic data collection and modeling to develop district-wide hydrology model |
| · | Geotechnical data collection and modeling to determine pit slope parameters |
| · | Plant and wildlife surveys with emphasis on Desert Tortoise and Bat habitats |
| · | Cultural/Archeological surveys |
| · | Meteorological data collection |
A Preliminary Economic Assessment should be completed
for the project taking into account detailed mine designs, production scheduling, process designs and detailed operating and capital cost
estimates. The advancement to Pre-Feasibility stage will require the baseline studies listed in Section 26.2 to be developed and initiated.
Further drilling, data acquisition and modeling will be required across all future study stages and a technical framework including QAQC,
geologic modeling, resource modeling, mine planning and process planning should be put in place to ensure all data and work meets industry
standard guidelines. The database should be thoroughly reviewed.
The cost estimates associated with further exploration
drilling, baseline studies and additional studies to advance the project are listed in Table 23-1.
FORTE DYNAMICS, INC
120 Commerce Drive., Units 3 & 4, Fort Collins, CO 80524 | P a g e | 150 of 178 | December 2023 |
| | Augusta Gold Corp. |
Table 23-1: Land Positions of the Bullfrog
Project and Adjacent Properties
| Task |
Cost (USD) |
| Exploration/Delineation Drilling (11,000 meters) |
$5,000,000 |
| Metallurgical Studies |
$500,000 |
| Preliminary Economic Assessment (PEA) |
$250,000 |
| Permitting |
$2,000,000 |
| Total |
$7,750,000 |
FORTE DYNAMICS, INC
120 Commerce Drive., Units 3 & 4, Fort Collins, CO 80524 | P a g e | 151 of 178 | December 2023 |
| | Augusta Gold Corp. |
Allison, A., 1993,
Geology of the Bullfrog gold deposit, Nye County, Nevada: unpublished abstract for Lac Bullfrog mine.
Applegate, J.D.R.,
Walker, J.D., and Hodges, K.V., 1992, Late Cretaceous extensional unroofing in the Funeral Mountains metamorphic core complex:
Geology, v. 20, p. 519-522.
Arnold, T.D., 1996,
Underground Mining: A Challenge to Established Open Pit Mining, Mining Engineering, p. 25-29.
Arnold, T.D., 2011-present.
Former Barrick Bullfrog UG Mine Supt., personal communications and meetings, Ashley, R.P., 1990, The Goldfield gold district, Esmeralda
and Nye Counties, Nevada: U.S. Geol. Survey Bulletin 1857-H, Hl-H7.
Beane, R.E., 1991,
Results of geochemical studies in the Bullfrog district: unpub. company report, Lac Minerals, 31 p.
Beling, D.C., 2017,
Bullfrog Project Report & Corporate Evaluation, internal confidential report, Bullfrog Gold Corp., 137 p.
Bonham, H.F., Jr.,
1988, Models for volcanic-hosted precious metal deposits: A review, in Schafer, R.W., Cooper, J.J. and Vikre, P.O., eds., Bulk
Mineable Precious Metal Deposits of the Western United States: Geological Society of Nevada, p. 259-271.
Bonham, H.F., Jr.,
and Garside, L.J., 1979, Geology of the Tonopah, Lone Mountain, Klondike, and northern Mud Lake quadrangles, Nevada: Nevada Bur.
Mines Geol. Bull. 92, 142 p.
Bonham, H.F., Jr.,
and Hess RH., 1995, The Nevada Mineral industry, 1995: Nevada Bur. Mines Geol., Spec. Pub. MI-1995.
Buchanan, L.J.,
1981; Precious metal deposits associated with volcanic environments in the southwest, in Dickinson, W.R., and Payne, W.D. eds.,
Relations of tectonics to ore deposits in the southern Cordillera: Arizona Geol. Soc. Digest, v. XIV, p. 237-262.
Byers, F.M., Jr.,
Carr, W.J., and Orkild, P.P., 1989, Volcanic Centers of Southwestern Nevada-Evolution of understanding, 1960-1988: Journal of Geophysical
Research, v. 94, p. 5908-5924.
Capps, R.C., and
Moore, J.A., 1991, Geologic setting of mid-Miocene gold deposits in the Castle Mountains, San Bernardino County, California and Clark
County, Nevada, in Raines, G.L., Lisle, R.E., Schafer, R.W., and Wilkinson, W.H., eds., Geology and Ore Deposits of the Great Basin,
Symposium Proceedings, Geol. Soc. Nevada, Reno/Sparks, p. 1195-1219.
Carr, W.J., Byers,
F.M., Jr., and Orkild, P.P., 1986, Stratigraphic and volcano-tectonic relations of the Crater Flat Tuff and some older volcanic units:
U.S. Geol. Survey Prof. Paper 1323, 28 p.
Carr, M.D., and
Monsen, S.A., 1988, A field trip guide to the geology of Bare Mountain, in Weide, D.L., and Faber, M.L, eds. This extended Geological
journeys in the southern Basin and Range: Geol. Soc. America, Cordilleran Section, Field Trip Guidebook, p. 50·57.
Castor, S.B., and
Weiss, S.I., 1992, Contrasting styles of epithermal precious-metal mineralization in the southwestern Nevada volcanic field, USA:
Ore Geology Reviews, v. 7, p. 193-223.
Castor, S.B., and
Sjoberg, J.J., 1993, Uytenbogaardtite, Ag3AuS2, in the Bullfrog mining district, Nevada: Canadian Mineralogist, v. 31, p. 89-98.
Connors, K.A.,
1995, Studies of silicic volcanic geology and geo-chemistry in the Great Basin of western North America: Part I Geology of the western
margin of the Timber Mountain caldera complex and Post-Timber Mountain syntectonic volcanism in the Bullfrog Hills Oasis Valley area,
southwestern Nevada volcanic field; Part II Initial gold contents of silicic volcanic rocks: Implication for behavior of gold in magmatic
systems and significance in evaluating source materials for gold deposits: unpublished Ph.D. thesis, University of Nevada, Reno, 216
p.
FORTE DYNAMICS, INC
120 Commerce Drive., Units 3 & 4, Fort Collins, CO 80524 | P a g e | 152 of 178 | December 2023 |
| | Augusta Gold Corp. |
Conrad, J.E., and
McKee, E.H., 1995, High precision 40Ar/39Ar ages of rhyolitic host rock at Sleeper deposit, Humboldt County,
Nevada: in Geology and Ore Deposits of the American Cordillera, Reno/Sparks, Nevada, Geological Society of Nevada, Abstracts with
Programs, p. 20-21 (updated data presented at meeting).
Cornwall, H.R.,
and Kleinhampl, F.J., 1964, Geology of the Bullfrog quadrangle and ore deposits related to the Bullfrog Hills caldera, Nye County,
Nevada, and Inyo County, California: U.S. Geol. Survey Prof. Paper 454-J, 25 p.
Couch, B.F. and
Carpenter, J.A., 1943, Nevada's metal and mineral production (1859-1940): Univ. Nevada Bull., V. 37, 159 p.
Crowe, D.E., Mitchell,
T.L, and Capps, R.C., 1995, Geology and stable isotope geochemistry of the Jumbo gold deposit, California: An example of an unusual
magmatic fluid-dominated adularia-sericite gold system: Geology and Ore Deposits of the American Cordillera, Reno/Sparks, Nevada,
Geological Society of Nevada, Abstracts with Programs, p. 21-22.
DeWitt, E., Thorson,
J.P., and Smith, R.C., 1991, Geology and gold deposits of the Oatman District, northwestern Arizona, in Geology and Resources of
Gold in the United States, U.S. Geol. Survey Bull., 1857-1, p. 11-128.
Drobeck, P.A.,
Hillemeyer, F.L., Frost, E.G., and Liebler, G.S., 1986, The Picacho mine: a gold mineralized detachment in southeastern California,
in Beatty, B., and Wilkinson, P.A.K., eds., Frontiers in Geology and Ore Deposits of Arizona and the Southwest: Arizona Geol. Soc. Digest,
v. 16, p. 187-221.
Dubendorfer, E.M.,
and Simpson, D.A, 1994, Kinematics and timing of Tertiary extension in the western Lake Mead region, Nevada: Geol. Soc. America
Bull., v. 106, p. 1057-1073.
Eng, T., Boden,
D.R., Reischman, M.R., and Biggs, J.O., 1996, Geology and Mineralization of the Bullfrog Mine and vicinity, Nye County, Nevada,
in Coyner, A.R., Fahey, P.L., eds., Geology and Ore Deposits of the American Cordillera, Symposium proceedings, Reno, Geological Society
of Nevada, vol. I, pp. 353-399.
Eng, T., 2011 –
present. Former Bullfrog Exploration Manager – Lac Minerals. Personal communications and meetings.
Fridrich, C.J.,
Tectonic evolution of the Crater Flat basin, Yucca Mountain region, Nevada, in Wright, L, and Troxel, B., eds., Cenozoic Basins
of the Death Valley Region, California and Nevada: Geol. Soc. America Spec. Paper.
Goldstrand, P.,
1996, Analysis of sedimentary rocks from drill holes in the southern Bullfrog Hills: unpublished consulting report for Barrick
Bullfrog Mine, Inc.
Greybeck, J.D.,
and Wallace, A.B., 1991, Gold mineralization at Fluorspar Canyon near Beatty, Nye County, Nevada, in Raines, G.L, Lisle, R.E.,
Schafer, R.W., and Wilkinson, W.H., eds., Geology and Ore Deposits of the Great Basin, Symposium Proceedings, Geol. Soc. Nevada, Reno,
Nevada, p. 935-946.
Haas, J.L, 1971,
The effect of salinity on the maximum thermal gradient of a hydrothermal system at hydrostatic pressure: Economic Geology v. 66,
p. 940-946.
Hamilton, W.B.,
1988, Detachment faulting in the Death Valley region, California, and Nevada: U.S. Geol. Survey Bull. 1790, p. 51-85.
Hausback, B.P.,
Deino, A.L, Turrin, B.T., McKee, E.H., Frizzell, V.A., Jr., Noble, D.C., and Weiss, S.I., 1990, New 40Ar/39Ar
ages for the Spearhead and Civet Cat Canyon Members of the Stonewall Flat Tuff, Nye County, Nevada: Evidence for systematic errors in
standard K-Ar age determination on sanidine: Isochron/West, no. 56, p. 3-7.
FORTE DYNAMICS, INC
120 Commerce Drive., Units 3 & 4, Fort Collins, CO 80524 | P a g e | 153 of 178 | December 2023 |
| | Augusta Gold Corp. |
Heald, P., Foley,
J.K. and Hayba, D.0., 1987, Comparative anatomy of volcanic-hosted epithermal deposits: acid-sulfate and adularia-sericite types:
Econ. Geol., v. 82, p. 1-26.
Hedenquist, J.W.,
and Henley, R.W., 1985, Hydrothermal eruptions in the Waiotapu geothermal system, New Zealand: Their origin, associated breccias, and
relation to precious metal mineralization: Econ. Geol., v. 80, p. 1640-1668.
Henry, C.D., Castor,
S.B., and Elson, H.B., 1996, Geology and 40Ar/39Ar geochronology of volcanism and mineralization at Round Mountain,
Nevada, in Coyner A., ed., Geology and Ore Deposits of the American Cordillera, Reno/Sparks, Nevada, Geological Society of Nevada.
Hinrichs, E.N.,
1968, Geologic map of the Camp Desert quadrangle, Nye County, Nevada: U.S. Geol. Survey Map GQ-726, scale 1:24,000.
Hoisch, T.D., Heizler,
M.T., and Zartman, R.E., Timing of detachment faulting in the Bullfrog Hills and Bare Mountain, southwest Nevada: Inferences from 40Ar/39Ar1
K-Ar, U-Pb, and fission-track thermochronology: J. of Geophysics Res.
Hoisch, T.D., and
Simpson, 1993, Rise and tilt of metamorphic rocks in the lower plate of a detachment fault in the Funeral Mountain, Death Valley, California:
J. of Geophysics Res. v. 98, p. 6805-6827.
Huysken, K.T.,
Vogel, T.A., and Layer, P.W., 1994, Incremental growth of a large volume, chemically zoned magma body: a study of tephra sequence beneath
the Rainier Mesa ash flow sheet of the Tiber Mountain Tuff: Bulletin Volcanology, v. 56, p. 377-385.
John, T.W., 2011-present.
Former Barrick Bullfrog Exploration Manager, personal communications and meetings
Jorgensen, D.K.,
Rankin, J.W., and Wilkins, J. Jr., 1989, The geology, alteration and mineralogy of the Bullfrog gold deposit, Nye County, Nevada:
AIME Preprint 89-135, 13 p.
Jorgensen, D.K.,
Tillman, T.D. and Benedict, J.F., Montgomery-Shoshone Project summary report, St. Joe American Corp. 1986, 80 p.
Kappes, Cassiday
& Assoc., Bullfrog Project, Column Leach test Report-Subgrade Sample, 1995
Kral, V.E., 1951,
Mineral Resources of Nye County, Nevada: Univ. of Nevada, Reno Bull. v. 45, no. 3, 223 p.
Kump, Dan, 2001,
Backfill – Whatever it takes, Mining Engineering, p. 50-52.
Liebler, G.S.,
1988, Geology and gold mineralization at the Picachu mine, Imperial County, California, in Schafer, R.W., Cooper, J.J., and Vikre,
P.G., eds., Bulk Mineable Precious Metal Deposits of the Western United States, Symposium Proceedings, Geol. Sue. Nevada, Reno/Sparks,
Nevada, p. 453-472.
Lincoln, F.C.,
1923, Mining districts and mineral resources of Nevada: Reno, Nevada Newsletter Publishing Co., 296 p.
Mahmoud, S.H.,
1993, Geochemistry, mineralogy, and genesis of the Copperstone gold deposit, La Paz, County, Arizona: Unpublished Ph.D. dissertation,
University of Arizona, Tucson, Arizona, 206 p.
Maldonado, F.,
1990a, Structural geology of the upper plate of the Bullfrog Hills detachment system: Geol. Soc. America Bull., v. 102, p. 992-1006.
Maldonado, F.,
1990b, Geologic map of the northwest quarter of the Bullfrog 15-minute quadrangle, Nye County, Nevada: U.S. Geol. Survey Misc.
Invest. Map I-1985, scale 1:24,000.
FORTE DYNAMICS, INC
120 Commerce Drive., Units 3 & 4, Fort Collins, CO 80524 | P a g e | 154 of 178 | December 2023 |
| | Augusta Gold Corp. |
Maldonado, F.,
and Hausback, B.P., 1990, Geologic map of the northeast quarter of the Bullfrog 15-minute quadrangle, Nye County, Nevada: U.S.
Geol. Survey Misc. Invest. Map I-2049, scale 1:24,000.
Manske, S.L, Matlack,
W.F., Springett, M.W., Strakele, A.E. Jr., Watowich, S.N., Yeomans, B., and E. Yeomans, 1988, Geology of the Mesquite deposit, Imperial
County, California: Mining Engineering, v. 40, p. 439-444.
Marvin, R.F., and
Mehnert, H.H., and Naeser, C.W., 1989, U.S. Geologic Survey radiometric ages compilation "C", part 3: California and Nevada:
Isochron/West, no. 52, p. 3-11.
McKee, E.H., 1968,
Age and rate of movement of the northern part of the Death Valley-Furnace Creek fault zone, California: Geol. Soc. America Bull.,
v. 29, p. 509-512.
McKee, E.H., 1983,
Reset K-Ar ages-Evidence for three metamorphic cure complexes, western Nevada: Isochron/West, p. 38, p. 17-20.
Minor, S.A., Sawyer,
D.A., Wahl, R.R., Frizzell, V.A., Jr., Schilling, S.P., Warren, R.G., Orkild, P.P., Coe, J.A., Hudson, M.R., Fleck, R.J., Lanphere, M.A.,
Swadley, W.C., and Coe, J.C., 1993, Preliminary geologic map of the Pahute Mesa 30' x 60' quadrangle, Nevada: U.S. Geol. Survey
Open-File Rept. 93-299.
Monsen, S.A., Carr,
M.D., Reheis, M.C., and Orkild, P.P., 1992, Geologic map of Bare Mountain, Nye County, Nevada: U.S. Geol. Survey Misc. Invest.
Map I-2201, scale 1:24,000.
Morton, J.L, Silberman,
M.L, Bonham, H.F., Garside, L.J., and Noble, D.C., 1977, K-Ar ages of volcanic rocks, plutonic rocks, and ore deposits in Nevada and
eastern California: lsochron/West, no. 20, p. 19-29.
Nash, J.T., Utterback,
W.C., and Trudel, W.S., 1995, Geology and geochemistry of Tertiary volcanic host rocks, Sleeper gold-silver deposit, Humboldt County,
Nevada: U.S. Geol. Survey Bull. 2090, 63 p.
Noble, D.C., Vogel,
T.A., Weiss, S.I., Erwin, J.W., McKee, E.H., and Younker, L.W., 1984, Stratigraphic relations and source areas of ash flow sheets of
the Black Mountain and Stonewall volcanic centers, Nevada: J. of Geophysics Res., v. 89, p. 8593-8602.
Noble, D.C., Weiss,
S.I., and McKee, E.H., 1991, Magmatic and hydrothermal activity, caldera geology, and regional extension in the western part of the
southwestern Nevada volcanic field, in Raines, G.L, Lisle, R.E., Shafer, R.W., and Wilkinson, W.H. eds., Geology and Ore Deposits
of the Great Basin, Symposium Proceedings: Reno, Nevada, Geological Society of Nevada, p. 913-934.
Odt, D.A., 1983,
Geology and geochemistry of the Sterling gold deposit, Nye County, Nevada: Unpublished M.Sc. thesis, Univ. Nevada, Reno, 100 p.
Peterson, M.A.,
and Ahler, B.A., 1990, Geology of the Bullfrog gold deposit, Nye County, Nevada (Abs): Geological Society of Nevada, November monthly
meeting newsletter.
Polovina,
J.S., 1984, Origin and structural evolution of gold-silver-copper-bearing hydrothermal breccias in the Stedman district,
southeastern California, in Wilkins, J. ed., Gold and Silver Deposits of the Basin and Range Province, Western USA: Arizona
Geol. Soc. Digest, v. 15, p. 159-166.
Proffett, J., 1994,
Notes on the geology and exploration potential of the Bullfrog district, southern Nevada: unpub. consulting report. for Lac Minerals,
20 p.
Ransome, F.L, Garrey,
G.H., and Emmons, W.H., 1910, Geology and ore deposits of the Bullfrog district: U.S. Geol. Survey Bull. 407, 130 p.
Ray, H.M., Morrissey,
J.C., IV, Montgomery-Shoshone Gold Project Onsite Large Column Test Results, St. Joe Minerals Corp., 1986, 31 p.
Reynolds, M.W.,
1969, Stratigraphy and structural geology of the Titus and Titanothere Canyons area, Death Valley, California: unpublished Ph.D.
dissertation, University of California, Berkeley, California, 310 p.
FORTE DYNAMICS, INC
120 Commerce Drive., Units 3 & 4, Fort Collins, CO 80524 | P a g e | 155 of 178 | December 2023 |
| | Augusta Gold Corp. |
Richard, S.M.,
Spencer, J.E., and Haxel, G.B., 1996, Geologic constraints on gold mineralization in the Picacho mine area, southeast California:
Soc. of Mining and Exploration Technical Program with Abstracts, p. 131-132.
Ristorcelli, S.J.,
and Ernst, D.R., 1991, Summary report: USNGS exploration 1990-1991, Nye County, Nevada: unpublished company report, U.S. Nevada
Gold Search Joint Venture, Carson City, 104 p.
Sander, M.V., and
Einaudi, M.T., 1990, Epithermal deposition of gold during transition from propylitic to potassic alteration at Round Mountain, Nevada:
Econ. Geol. v. 85, p. 285-311.
Sawyer, D.A., Fleck,
R.J., Lanphere, M.A., Warren, R.G., Broxton, D.E., and Hudson, M.R., 1994, Episodic caldera volcanism in the Miocene southwestern Nevada
volcanic field: Revised stratigraphic framework, 40Ar/39Ar geochronology, and implications for magmatism and extension:
Geol. Soc. America Bull., v. 106, p. 1304-1318.
Sherlock, R.L.,
Tosdal, R.M., Lehrman, N.J., Graney, J.R., Losh, S., Jowett, E.C.1 and Kesler, S.E., 1995, Origin of the McLaughlin mine sheeted vein
complex: Metal zoning, fluid inclusion, and isotopic evidence: Econ. Geol. v. 90, n. 8, p. 2156- 2181.
Sillitoe, R.H.,
1993, Epithermal models: Genetic types, geometrical controls and shallow features, in Kirkham, R.V., Sinclair, W.D., Thorpe, R.L.
and Duke, J.M. eds., Mineral Deposit Modeling: Geological Association of Canada, Special Paper 40, p. 403-417.
Spencer, J.E.,
and Welty, J.W., 1986, Possible controls of base-and precious metal mineralization with Tertiary detachment fault in the lower Colorado
River trough, Arizona, and California: Geology, v. 14, p. 195-198.
Spencer, J.E.,
Duncan, J.T., and Burton, W.D., 1988, The Copper-stone mine: Arizona's new gold producer: Arizona Bureau of Geology and Mineral
Technology, Field notes, v. 18, no. 2, p. 1-3.
Stewart, J.H.,
1967, Possible large right-lateral displacement along fault and shear zones in Death Valley Las Vegas area, California, and Nevada:
Geol. Soc. America Bull., v. 78, p. 131-142.
Stewart,
J.H., 1988, Tectonics of the Walker Lane belt, western Great Basin: Mesozoic and Cenozoic deformation in a zone of shear, in
Ernst, W.G., Metamorphism and Crustal Evolution of the Western United States, Rubey Volume VII: Englewood Cliffs, New Jersey,
Prentice Hall, p. 683-713.
Stock, C., and
Bode, F.D., 1935, Occurrence of lower Oligocene mammal-bearing beds near Death Valley, California: Proceedings of the National
Academy of Science, v. 21, n. 10, p. 571-579.
Tetra Tech, 2017,
NI 43-101 Technical Report Mineral Resource Estimate Bullfrog Gold Project Nye County, Nevada.
Tingley, J.V.,
1984, Trace element associations in mineral deposits, Bare Mountain (Fluorine) mining district, southern Nye County, Nevada: Nevada
Bur. Mines Geol. Report 39, 28 p.
Weiss, S.I., Noble,
D.C., Worthington, J.E., and McKee, E.H., 1993, Neogene tectonism form the southern Nevada volcanic field to the White Mountains, California,
Part I. Miocene volcanic stratigraphy, paleo topography, extensional faulting and uplift between northern Death Valley and Pahute Mesa,
in Lahren, M.M., Trexler, J.H., Jr., and Spinosa, C., eds., Crustal Evolution of the Great Basin and Sierra Nevada: Cordilleran/Rocky
Mountain Sectional Mtg., Geol. Soc. America Guidebook, Dept. of Geol. Sci., University of Nevada, Reno, p. 353-382.
Weiss, S.I., Noble,
D.C., McKee, E.H., Connors, K.A, and Jackson, M.R., 1995, Multiple episodes of hydrothermal activity and epithermal mineralization
in the southwestern Nevada volcanic field and their relations to magmatic activity, volcanism, and regional extension. Appendix
B, in Weiss, S.I., Noble, D.C., and Larson, L.T., 1995, Task 3: Evaluation of mineral resource potential, caldera geology and volcano-tectonic
frame-work at and near Yucca Mountain; report for October, 1994 September, 1995: Center for Neotectonics’ Studies, University
of Nevada, Reno, 44 p. plus appendices.
FORTE DYNAMICS, INC
120 Commerce Drive., Units 3 & 4, Fort Collins, CO 80524 | P a g e | 156 of 178 | December 2023 |
| | Augusta Gold Corp. |
Weiss, S.I., 1996,
Hydrothermal activity, epithermal mineralization, and regional extension in the southwestern Nevada volcanic field: Unpublished
PhD. dissertation, Univ. Nevada, Reno, 212 p.
White, D.E., 1981,
Active geothermal systems and hydrothermal ore deposits: Econ. Geol., 75th Anniversary Volume, p. 393-423.
Willis, G.F., and
Tosdal, R.M., 1992, Formation of gold veins and breccias during dextral strike-slip faulting in the Mesquite mining district, southeastern
California: Econ. Geol., v. 87, p. 2002- 2022.
Worthington, J.E.,
IV, 1992, Neogene structural and volcanic geology of the Gold Mountain-Slate Ridge area, Esmeralda County, Nevada: unpublished
M.S. thesis, University of Nevada, Reno, 76 p.
Yopps, S., and
Manning, K.L. Pilot Heap Leach Tests for Lac Bullfrog “Sub-Grade” Ore Evaluation. 1995, 10 p.
FORTE DYNAMICS, INC
120 Commerce Drive., Units 3 & 4, Fort Collins, CO 80524 | P a g e | 157 of 178 | December 2023 |
| | Augusta Gold Corp. |
| 25. | Reliance on Information Provided by the Registrant |
The QPs opinion contained herein are based on
information provided by Augusta Gold Corp. and others throughout the course of the update. The QPs have taken responsible measures to
confirm information provided by others and take responsibility for the information.
To the extent permitted, the QPs disclaim responsibility
for the relevant section(s) of the Technical Report.
The following disclosure is made in respect to
the Expert
| · | Tom Ladner, Vice President, Legal, Augusta Gold Corp., Vancouver, BC, Canada. |
| · | Report, opinion, or statement(s) relied upon: |
| o | Legal Information on mineral tenure and status, title, royalty obligations and surface access, provided
on or about the date hereof and as set out herein. |
| · | Extent of reliance: Full reliance following a review by the QP. |
| · | Portion of the Technical Report to which disclaimer applies: Section 3. |
FORTE DYNAMICS, INC
120 Commerce Drive., Units 3 & 4, Fort Collins, CO 80524 | P a g e | 158 of 178 | December 2023 |
| | Augusta Gold Corp. |
| 26.1 | Statistical Analysis of Drillhole Data for Gold Assays |

FORTE DYNAMICS, INC
120 Commerce Drive., Units 3 & 4, Fort Collins, CO 80524 | P a g e | 159 of 178 | December 2023 |
| | Augusta Gold Corp. |
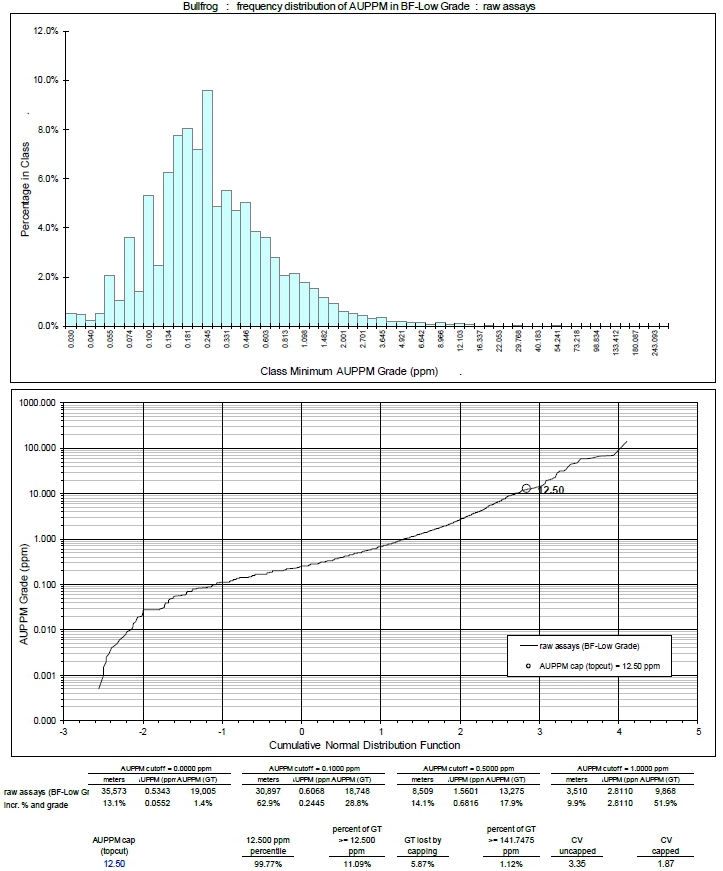
FORTE DYNAMICS, INC
120 Commerce Drive., Units 3 & 4, Fort Collins, CO 80524 | P a g e | 160 of 178 | December 2023 |
| | Augusta Gold Corp. |
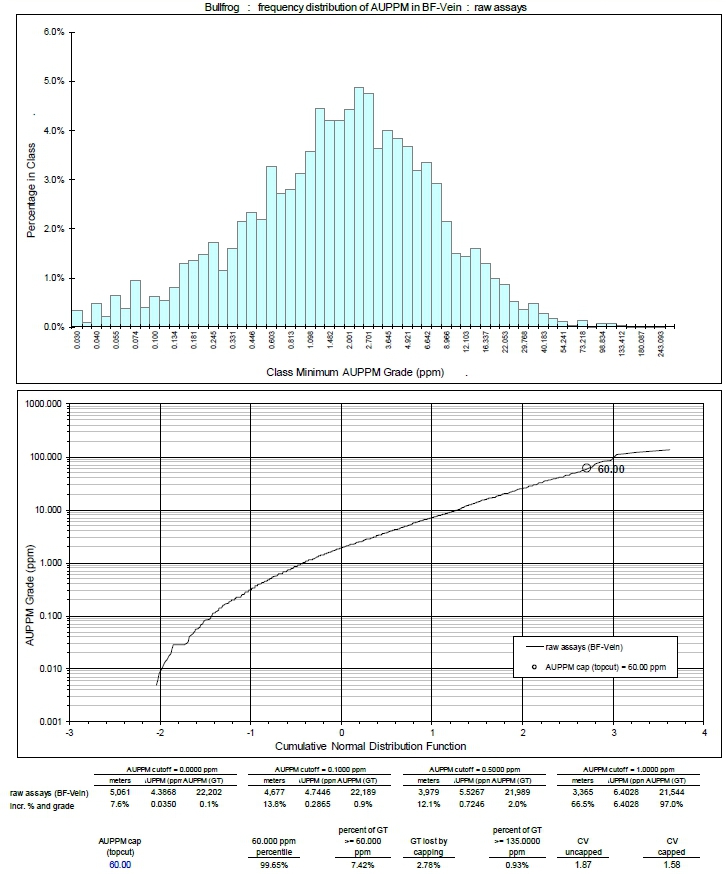
FORTE DYNAMICS, INC
120 Commerce Drive., Units 3 & 4, Fort Collins, CO 80524 | P a g e | 161 of 178 | December 2023 |
| | Augusta Gold Corp. |
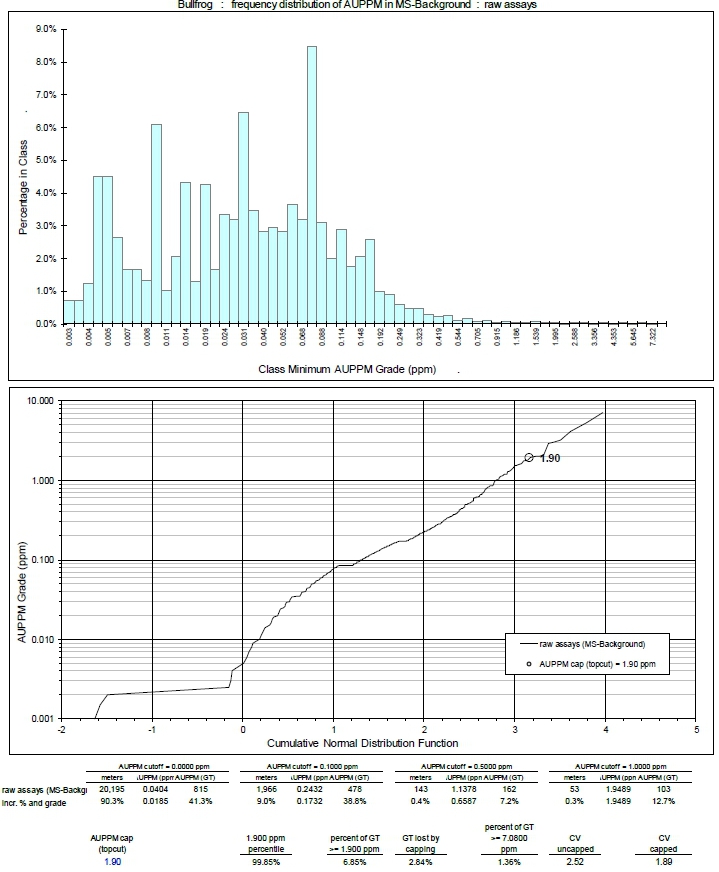
FORTE DYNAMICS, INC
120 Commerce Drive., Units 3 & 4, Fort Collins, CO 80524 | P a g e | 162 of 178 | December 2023 |
| | Augusta Gold Corp. |

FORTE DYNAMICS, INC
120 Commerce Drive., Units 3 & 4, Fort Collins, CO 80524 | P a g e | 163 of 178 | December 2023 |
| | Augusta Gold Corp. |

FORTE DYNAMICS, INC
120 Commerce Drive., Units 3 & 4, Fort Collins, CO 80524 | P a g e | 164 of 178 | December 2023 |
| | Augusta Gold Corp. |

FORTE DYNAMICS, INC
120 Commerce Drive., Units 3 & 4, Fort Collins, CO 80524 | P a g e | 165 of 178 | December 2023 |
| | Augusta Gold Corp. |
| 26.2 | Statistical Analysis of Drillhole Data for Silver Assays |

FORTE DYNAMICS, INC
120 Commerce Drive., Units 3 & 4, Fort Collins, CO 80524 | P a g e | 166 of 178 | December 2023 |
| | Augusta Gold Corp. |
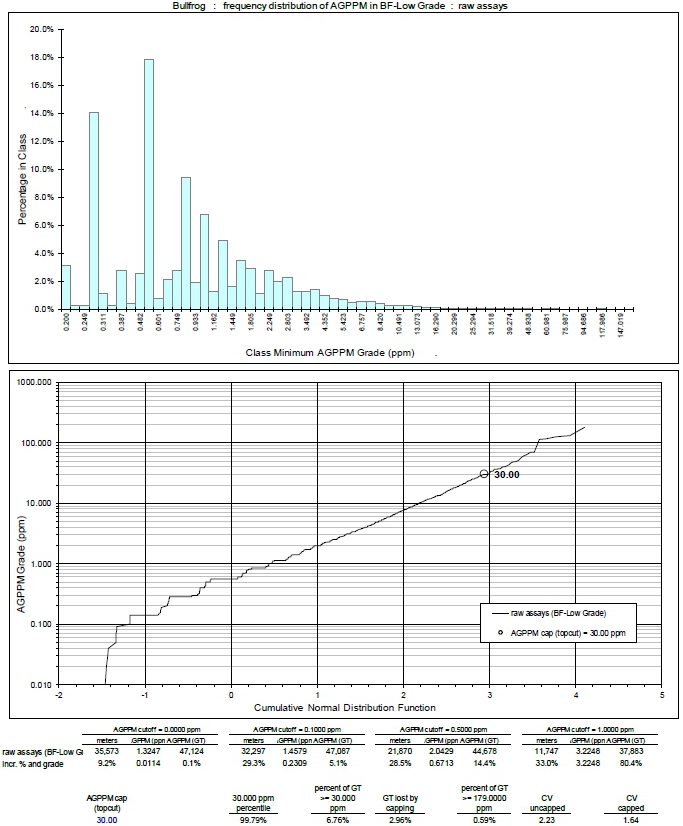
FORTE DYNAMICS, INC
120 Commerce Drive., Units 3 & 4, Fort Collins, CO 80524 | P a g e | 167 of 178 | December 2023 |
| | Augusta Gold Corp. |

FORTE DYNAMICS, INC
120 Commerce Drive., Units 3 & 4, Fort Collins, CO 80524 | P a g e | 168 of 178 | December 2023 |
| | Augusta Gold Corp. |

FORTE DYNAMICS, INC
120 Commerce Drive., Units 3 & 4, Fort Collins, CO 80524 | P a g e | 169 of 178 | December 2023 |
| | Augusta Gold Corp. |

FORTE DYNAMICS, INC
120 Commerce Drive., Units 3 & 4, Fort Collins, CO 80524 | P a g e | 170 of 178 | December 2023 |
| | Augusta Gold Corp. |

FORTE DYNAMICS, INC
120 Commerce Drive., Units 3 & 4, Fort Collins, CO 80524 | P a g e | 171 of 178 | December 2023 |
| | Augusta Gold Corp. |

FORTE DYNAMICS, INC
120 Commerce Drive., Units 3 & 4, Fort Collins, CO 80524 | P a g e | 172 of 178 | December 2023 |
| | Augusta Gold Corp. |

FORTE DYNAMICS, INC
120 Commerce Drive., Units 3 & 4, Fort Collins, CO 80524 | P a g e | 173 of 178 | December 2023 |
| | Augusta Gold Corp. |

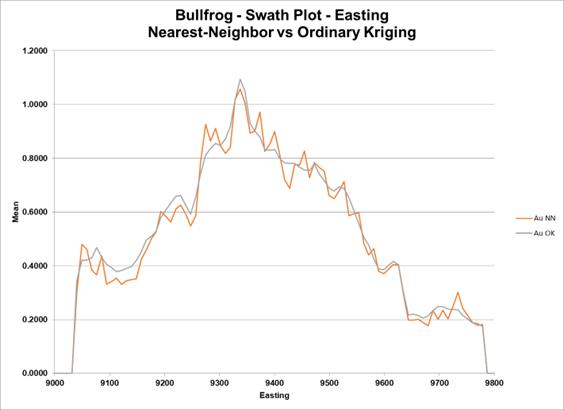
FORTE DYNAMICS, INC
120 Commerce Drive., Units 3 & 4, Fort Collins, CO 80524 | P a g e | 174 of 178 | December 2023 |
| | Augusta Gold Corp. |
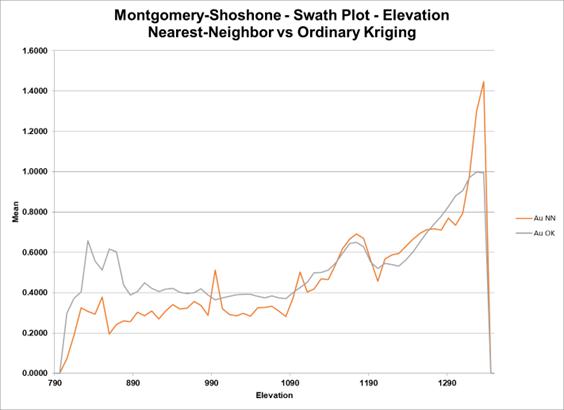

FORTE DYNAMICS, INC
120 Commerce Drive., Units 3 & 4, Fort Collins, CO 80524 | P a g e | 175 of 178 | December 2023 |
| | Augusta Gold Corp. |
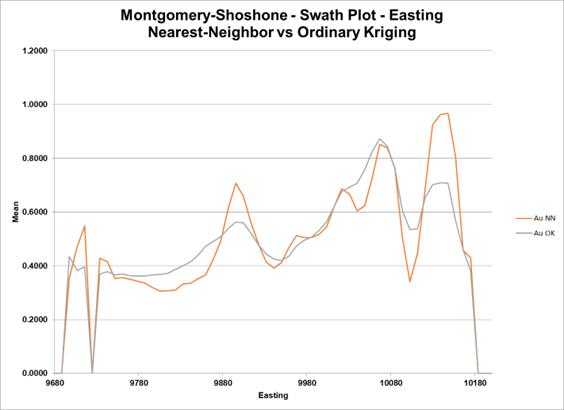
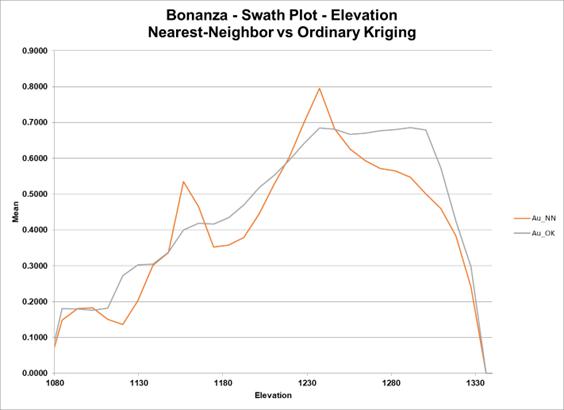
FORTE DYNAMICS, INC
120 Commerce Drive., Units 3 & 4, Fort Collins, CO 80524 | P a g e | 176 of 178 | December 2023 |
| | Augusta Gold Corp. |
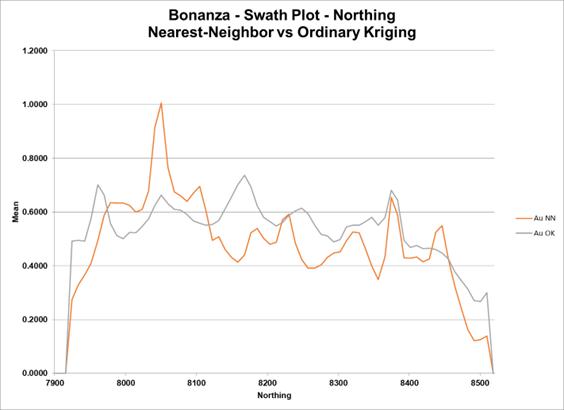

FORTE DYNAMICS, INC
120 Commerce Drive., Units 3 & 4, Fort Collins, CO 80524 | P a g e | 177 of 178 | December 2023 |
| | Augusta Gold Corp. |


FORTE DYNAMICS, INC
120 Commerce Drive., Units 3 & 4, Fort Collins, CO 80524 | P a g e | 178 of 178 | December 2023 |
Exhibit 96.2
MINERAL RESOURCE ESTIMATE FOR THE
REWARD PROJECT, NYE COUNTY, NEVADA, USA
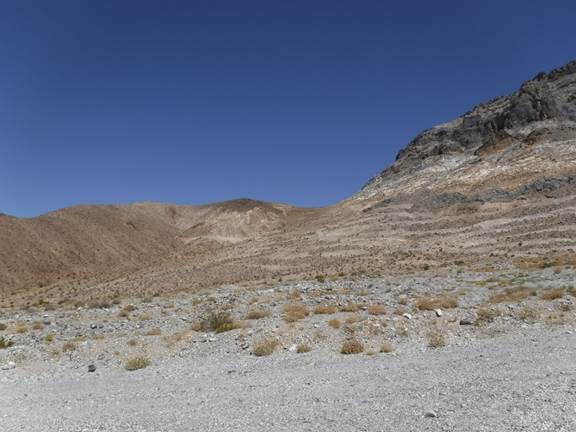
| Prepared For: |
CR Reward LLC & Augusta Gold Corp.
Suite 555 – 999, Canada Place
Vancouver, BC V6C 3E1
Canada |
 |
| |
|
|
| Prepared by: |
APEX Geoscience Ltd.
#100, 11450-160th Street NW
Edmonton AB T5M 3Y7 Canada |
 |
| |
|
|
| |
Kappes, Cassiday & Associates
7950 Security Circle
Reno, NV USA 89506 |
 |
Michael Dufresne, M.Sc., P. Geol., P.Geo.
Timothy D. Scott, BA.Sc., RM SME
Effective Date: May 31st,
2022
Signing Date: June 29th, 2022
Amended Date: December 18, 2023
Technical
Report - Mineral Resource Estimate Reward Project, Nye County, Nevada, USA
Contents
| 1 |
Summary |
1 |
| |
1.1 |
Issuer and Purpose |
1 |
| |
1.2 |
Authors, Contributors and Site Inspection |
1 |
| |
1.3 |
Project Setting |
2 |
| |
1.4 |
Mineral Tenure, Surface Rights, Water Rights, Royalties and Agreements |
2 |
| |
1.5 |
Geology and Mineralization |
4 |
| |
1.6 |
History |
5 |
| |
1.7 |
Drilling and Sampling |
5 |
| |
1.8 |
Data Verification |
6 |
| |
1.9 |
Metallurgical Testing |
7 |
| |
1.10 |
Current Mineral Resource |
7 |
| |
1.11 |
Conclusions |
10 |
| |
1.12 |
Recommendations |
10 |
| 2 |
Introduction |
11 |
| |
2.1 |
Issuer and Purpose |
11 |
| |
2.2 |
Authors, Contributors and Site Inspection |
12 |
| |
2.3 |
Sources of Information |
14 |
| |
2.4 |
Units of Measure |
14 |
| 3 |
Reliance on Other Experts |
15 |
| 4 |
Property Description and Location |
15 |
| |
4.1 |
Description and Location |
15 |
| |
4.2 |
Property and Title in Nevada |
15 |
| |
|
4.2.1 |
Mineral Title |
15 |
| |
|
4.2.2 |
Surface Rights |
16 |
| |
|
4.2.3 |
Environmental Regulations |
18 |
| |
|
4.2.4 |
Water Rights |
18 |
| |
4.3 |
Ownership |
18 |
| |
4.4 |
Mineral Properties |
19 |
| |
|
4.4.1 |
Claim Status |
19 |
| |
|
4.4.2 |
Claim Retention Obligations |
19 |
| |
|
4.4.3 |
Encumbrances |
25 |
| |
4.5 |
Mineral Lease Agreements |
25 |
| |
|
4.5.1 |
Connolly Lease |
25 |
| |
|
4.5.2 |
Webster Lease |
25 |
| |
|
4.5.3 |
Orser–McFall Lease |
26 |
| |
|
4.5.4 |
Van Meeteren et al Lease |
26 |
| |
4.6 |
Encumbrances |
26 |
| |
4.7 |
Surface Ownership |
26 |
| |
4.8 |
Water Rights |
27 |
| |
4.9 |
Permitting Considerations |
27 |
| |
4.10 |
Environmental Considerations |
27 |
| |
4.11 |
Comments on Property Description and Location |
28 |
| 5 |
Accessibility, Climate, Local Resources, Infrastructure and Physiography |
28 |
| |
5.1 |
Accessibility |
28 |
| Effective Date: May 31st, 2022 |  | i |
Technical
Report - Mineral Resource Estimate Reward Project, Nye County, Nevada, USA
| |
5.2 |
Site Topography, Elevation and Vegetation |
28 |
| |
5.3 |
Climate |
29 |
| |
5.4 |
Local Resources and Infrastructure |
29 |
| 6 |
History |
30 |
| |
6.1 |
Exploration History |
30 |
| |
6.2 |
Production History |
30 |
| 7 |
Geological Setting and Mineralization |
33 |
| |
7.1 |
Regional Geology |
33 |
| |
7.2 |
Local Geology |
34 |
| |
7.3 |
Stratigraphy |
37 |
| |
|
7.3.1 |
Late Proterozoic |
38 |
| |
|
7.3.2 |
Proterozoic-Cambrian |
40 |
| |
|
7.3.3 |
Cambrian |
40 |
| |
7.4 |
Structure |
41 |
| |
|
7.4.1 |
Good Hope Fault Zone |
41 |
| |
7.5 |
Alteration |
44 |
| |
7.6 |
Oxidation (Redox) |
44 |
| |
7.7 |
Mineralization |
45 |
| |
|
7.7.1 |
Description of Mineralization: Good Hope Deposit |
45 |
| |
|
7.7.2 |
Description of Mineralization: Gold Ace Mineralized Zone |
47 |
| |
|
7.7.3 |
Description of Mineralization: Exploration Update |
49 |
| 8 |
Deposit Types |
50 |
| 9 |
Exploration |
51 |
| |
9.1 |
Introduction |
51 |
| |
9.2 |
CR Reward Exploration (2015-Present) |
51 |
| 10 |
Drilling |
52 |
| |
10.1 |
Drill Methods, Logging and Surveys |
55 |
| |
|
10.1.1 |
Gexa (1987) |
55 |
| |
|
10.1.2 |
Pathfinder (1991) |
55 |
| |
|
10.1.3 |
Barrick (1995-1996) and Glamis (1998-2000) |
55 |
| |
|
10.1.4 |
Canyon (2006-2007) |
56 |
| |
|
10.1.5 |
Atna (2011-2013) |
56 |
| |
10.2 |
CR Reward Core Drilling Program (2017-2018) |
56 |
| |
10.3 |
Twin Holes |
59 |
| |
10.4 |
Comments on Drilling |
60 |
| 11 |
Sample Preparation, Analyses and Security |
60 |
| |
11.1 |
Pre-CR Reward Drill Sampling, Analysis and Security |
60 |
| |
|
11.1.1 |
Gexa (1987) |
60 |
| |
|
11.1.2 |
Barrick (1995-1996) |
61 |
| |
|
11.1.3 |
Glamis (1998-2000) |
61 |
| |
|
11.1.4 |
Canyon (2006-2007) |
61 |
| |
|
11.1.5 |
Atna (2011-2013) |
62 |
| |
11.2 |
CR Reward Sampling, Analysis and Security (2017-2018) |
63 |
| |
|
11.2.1 |
Diamond Drill Core Sample Preparation and Analysis |
64 |
| |
11.3 |
CR Reward QAQC Results (2017-2018) |
66 |
| |
|
11.3.1 |
Blanks |
66 |
| Effective Date: May 31st, 2022 | | ii |
Technical
Report - Mineral Resource Estimate Reward Project, Nye County, Nevada, USA
| |
|
11.3.2 |
Standard Reference Materials |
67 |
| |
|
11.3.3 |
Duplicates |
69 |
| |
11.4 |
Comments on Sample Preparation, Analyses and Security |
69 |
| 12 |
Data Verification |
70 |
| |
12.1 |
Verification Program |
70 |
| |
|
12.1.1 |
Protocols and Error Tracking of Pre-CR Reward Drill Holes |
70 |
| |
12.2 |
Collar Data Verification |
71 |
| |
12.3 |
Down-Hole Survey Data Verification |
72 |
| |
12.4 |
Assay Verification |
72 |
| |
12.5 |
Author and QP Site Visits |
73 |
| 13 |
Mineral Processing and Metallurgical Testing |
78 |
| |
13.1 |
1998 Rayrock Column Tests – Drill Core |
78 |
| |
13.2 |
1998 Rayrock Column Tests – Trench Samples |
79 |
| |
13.3 |
2007 McClelland Bottle Roll Tests |
79 |
| |
13.4 |
McClelland 2008 Column Test Campaign |
80 |
| |
|
13.4.1 |
2008 Column Test Results |
82 |
| |
|
13.4.2 |
2008 Bottle Roll Test Results at Crush Size and at 200 Mesh |
82 |
| |
|
13.4.3 |
2008 Bottle Roll Size versus Recovery on Composite 5 |
84 |
| |
|
13.4.4 |
Drain-Down Data |
84 |
| |
|
13.4.5 |
Conclusions from 2008 McClelland Program |
84 |
| |
13.5 |
2018 Kappes Cassidy Associates Test Program |
84 |
| |
|
13.5.1 |
2018 KCA Composite Generation |
86 |
| |
|
13.5.2 |
2018 Physical Characterization |
86 |
| |
|
13.5.3 |
2018 KCA Pulverized Bottle Roll Tests |
88 |
| |
|
13.5.4 |
KCA 2018 Column Leach Tests |
97 |
| |
|
13.5.5 |
2018 KCA Program Conclusions |
99 |
| |
13.6 |
Analysis and Discussion |
99 |
| |
|
13.6.1 |
Crush Size and Grade versus Recovery |
99 |
| |
|
13.6.2 |
Leach Cycle |
101 |
| |
|
13.6.3 |
Reagent Consumptions |
101 |
| |
|
|
13.6.3.1 |
Cyanide |
101 |
| |
|
|
13.6.3.2 |
Lime |
101 |
| |
|
13.6.4 |
Conclusions and Key Design Parameters |
101 |
| 14 |
Mineral Resource Estimates |
103 |
| |
14.1 |
Introduction |
103 |
| |
14.2 |
Data |
105 |
| |
|
14.2.1 |
Drill Hole Data |
105 |
| |
|
14.2.2 |
APEX Micromine Database Validation |
107 |
| |
14.3 |
Geological Model and Domains |
108 |
| |
|
14.3.1 |
Good Hope Deposit |
108 |
| |
|
|
14.3.1.1 |
Low-Grade Alteration Domain (LG) |
109 |
| |
|
|
14.3.1.2 |
High Grade Gold Shell (HG) |
109 |
| |
|
14.3.2 |
Gold Ace Zone |
110 |
| |
14.4 |
Drill Hole Flagging and Compositing |
110 |
| |
|
14.4.1 |
Sample Width Analysis |
110 |
| |
|
14.4.2 |
Remnant Analysis |
111 |
| Effective Date: May 31st, 2022 | | iii |
Technical
Report - Mineral Resource Estimate Reward Project, Nye County, Nevada, USA
| |
14.5 |
Capping |
113 |
| |
14.6 |
Variography and Grade Continuity |
116 |
| |
14.7 |
Bulk Density |
118 |
| |
14.8 |
Block Model |
122 |
| |
|
14.8.1 |
Block Model Parameters |
122 |
| |
|
14.8.2 |
Volumetric Checks |
124 |
| |
14.9 |
Grade Estimation |
124 |
| |
|
14.9.1 |
Estimation Methodology |
124 |
| |
14.10 |
Model Validation |
128 |
| |
|
14.10.1 |
Visual Validation |
128 |
| |
|
14.10.2 |
Statistical Validation |
130 |
| |
14.11 |
Mineral Resource Classification |
136 |
| |
|
14.11.1 |
2019 CIM and SK 1300 Definitions |
136 |
| |
|
14.11.2 |
Classification Criteria |
138 |
| |
14.12 |
Evaluation of Reasonable Prospects for Eventual Economic Extraction |
138 |
| |
14.13 |
Mineral Resource Statement |
140 |
| |
14.14 |
Discussion of Mineral Resources Modelling, Risks and Uncertainties |
144 |
| 23 |
Adjacent Properties |
145 |
| |
23.1 |
Bullfrog |
145 |
| |
23.2 |
Sterling and Crown |
146 |
| 24 |
Other Relevant Data and Information |
147 |
| 25 |
Interpretation and Conclusions |
147 |
| |
25.1 |
Introduction |
147 |
| |
25.2 |
Mineral Tenure, Surface Rights, Water Rights, Royalties/Agreements |
147 |
| |
25.3 |
Geology |
148 |
| |
25.4 |
Exploration, Drilling and Analytical Data Collection in Support of Mineral Resource Estimation |
149 |
| |
25.5 |
Metallurgical Test work |
149 |
| |
25.6 |
Mineral Resource Estimate |
150 |
| |
25.7 |
Risks and Uncertainties |
150 |
| |
25.8 |
Conclusions |
151 |
| 26 |
Recommendations |
152 |
| 27 |
References |
154 |
| 28 |
Date and Signature |
160 |
| 29 |
Certificate of Author |
161 |
Tables
| Table 1.1. Reward Conceptual Open Pit Parameters |
9 |
| Table 1.2. Reward Project Mineral Resource Estimate at May 31, 2022 |
9 |
| Table 1.3. Estimated budget for the recommended PFS |
10 |
| Table 4.1. Summary of the Reward Project Claims |
20 |
| Table 6.1. Project Exploration History |
30 |
| Table 7.1. Stratigraphy and Unit Thickness of the Bare Mountains Complex |
37 |
| Table 10.1. Reward Drilling Summary |
53 |
| Table 10.2. CR Reward Drill Hole Collars (2017-2018) |
57 |
| Effective Date: May 31st, 2022 | | iv |
Technical
Report - Mineral Resource Estimate Reward Project, Nye County, Nevada, USA
| Table 10.3. Results of CR Reward Drill Holes (2017-2018) |
58 |
| Table 10.4. Results of Reward Twin Holes |
60 |
| Table 11.1. Summary Results of Blank Material from the 2017-2018 Drill Program |
67 |
| Table 11.2. Summary Results of Standards from the 2017-2018 Drill Program |
67 |
| Table 12.1. Drill Hole Coordinate Comparison |
74 |
| Table 12.2. Significant Intercepts of Drill Holes Reviewed During Mr. Dufresne’s Inspection of the CR Reward Core Facility |
75 |
| Table 13.1. 1998 Rayrock Drill Core Column Tests Results |
79 |
| Table 13.2. 1998 Rayrock Surface Trench Column Test Gold Recovery |
80 |
| Table 13.3. 1998 10 Mesh Reverse Circulation Drill Holes Bottle Roll Results |
80 |
| Table 13.4. 2008 McClelland Sample/Drill Hole Composite Information |
81 |
| Table 13.5. 2008 McClelland Summary Column Test Results |
83 |
| Table 13.6. 2008 McClelland Bottle Roll Tests – Gold Recovery % |
84 |
| Table 13.7. 2008 McClelland Bottle Roll Size versus Gold Recovery – Composite 5 |
85 |
| Table 13.8. 2008 McClelland Drain-Down Data from Column Tests |
85 |
| Table 13.9. 2018 KCA Composite Head Screen Analyses – Gold and Silver |
88 |
| Table 13.10. 2018 KCA Composite Head Screen Analyses – Mercury and Copper |
88 |
| Table 13.11. 2018 Hazen Bond Impact Work and Abrasion Index |
88 |
| Table 13.12. 2018 High-Grade Sample Intervals |
89 |
| Table 13.13. 2018 KCA Bottle Roll Test Results |
90 |
| Table 13.14. KCA 2018 Preliminary Agglomeration Test Work |
92 |
| Table 13.15. KCA 2018 Compacted Permeability Tests |
93 |
| Table 13.16. KCA 2018 Column Leach Tests |
98 |
| Table 14.1. Summary Statistics of Raw Gold Assays of Sample Intervals Flagged within the Good Hope and Gold Ace Estimation Domains |
107 |
| Table 14.2. Remnant Analysis comparing the Gold Statistics of Raw Assays and Uncapped Composite Samples with and without Orphans |
112 |
| Table 14.3. Summary Statistics of Gold Grade of Capped Composite Intervals Flagged within the Good Hope and Gold Ace Estimation Domains |
116 |
| Table 14.4. Gold Variogram Model Parameters |
117 |
| Table 14.5. Bulk Density Measurements, Good Hope Deposit and Gold Ace Zone |
119 |
| Table 14.6. Percentage of Blocks Flagged within each Formation for the Good Hope and Gold Ace Zones |
121 |
| Table 14.7. Project Block Model Size and Extents |
123 |
| Table 14.8. Wireframe versus Block Model Volume Comparison |
124 |
| Table 14.9. Estimation Search and Kriging Parameters |
125 |
| Table 14.10. Interpolation Search Restrictions |
138 |
| Table 14.11. Parameters for Pit Optimization for Mineral Resource Estimate |
139 |
| Table 14.12. Measured and Indicated Mineral Resource Statement |
140 |
| Table 14.13. Inferred Mineral Resource Statement |
141 |
| Table 14.14. Sensitivity Table, Measured and Indicated Mineral Resources, Good Hope |
141 |
| Table 14.15. Sensitivity Table, Inferred Mineral Resources, Good Hope |
142 |
| Table 14.16. Sensitivity Table, Indicated Mineral Resources, Gold Ace |
142 |
| Table 14.17. Sensitivity Table, Inferred Mineral Resources, Gold Ace |
143 |
| Effective Date: May 31st, 2022 | | v |
Technical
Report - Mineral Resource Estimate Reward Project, Nye County, Nevada, USA
| Table 14.18. Sensitivity Table, Measured and Indicated Mineral Resources, Good Hope and Gold Ace |
143 |
| Table 14.19. Sensitivity Table, Inferred Mineral Resources, Good Hope and Gold Ace |
144 |
| Table 25.1. Reward Project Mineral Resource Estimate at May 31, 2022 |
152 |
| Table 26.1. Estimated budget for the recommended PFS |
153 |
Figures
| Figure 2.1. Project Location Map |
12 |
| Figure 4.1. Project Location Plan |
17 |
| Figure 4.2. CR Reward LLC Controller Mineral Claims at Reward Project |
23 |
| Figure 4.3. Detail of Reward Claims and Proposed Infrastructure for the Core Area |
24 |
| Figure 7.1. Simplified Geology of the Bare Mountain Area |
34 |
| Figure 7.2. Simplified Geologic Map of Project Area |
35 |
| Figure 7.3. Local Geology Map |
36 |
| Figure 7.4. 3D Geological Schematic of the Main Rock Units and Faults |
37 |
| Figure 7.5. Lower Portion of the Bare Mountains Complex Stratigraphic Column Observed at the Project |
39 |
| Figure 7.6. 3500N Geology Cross-Section |
42 |
| Figure 7.7. Photo Highlighting Vein Orientation in Outcrop |
43 |
| Figure 7.8. Gold Mineralization at Reward Intersected by Drilling |
46 |
| Figure 7.9. Mineralization along Section 5600 N Looking North |
47 |
| Figure 7.10. Mineralization along Section 4200 N Looking North |
48 |
| Figure 7.11. Mineralization along Section 4800 N, Looking North |
48 |
| Figure 7.12. Mineralization along Section 2900 N Looking North |
49 |
| Figure 9.1. Plan View of the Project Area Showing the Locations of the IP/Resistivity Survey Lines |
52 |
| Figure 10.1. Reward Drill Hole Locations |
54 |
| Figure 11.1. CR Reward Sample Flow Chart |
65 |
| Figure 11.2. Blank Results from 2017-2018 Drilling Sorted by Date Analyzed |
66 |
| Figure 11.3. CDN-GS-P6B Results from 2017-2018 Program Sorted by Date Analyzed |
68 |
| Figure 11.4. CDN-GS-2L Results from 2017-2018 Program Sorted by Date Analyzed |
68 |
| Figure 11.5. Duplicate Results from the 2017-2018 Program |
69 |
| Figure 12.1. Drill hole CRR17-009, Wood Canyon Formation Mineralized Interval of Phyllite and Oxidized Quartzite |
75 |
| Figure 12.2. Drill hole CRR18-014, Wood Canyon Formation Mineralized Interval of Brecciated/Re-healed Quartzite and Sheared and Foliated Phyllite |
76 |
| Figure 12.3. Drill Hole CRR18-024, Wood Canyon Formation Mineralized Interval of Quartzite |
77 |
| Figure 13.1. 1998 10 Mesh Bottle Roll Recovery Curves |
81 |
| Figure 13.2. 2008 McClelland Drill Hole Location Map |
82 |
| Figure 13.3. 2008 McClelland 10 Gold Recovery Curves – Column Tests |
83 |
| Figure 13.4. 2008 McClelland Bottle Roll Tests Recovery Curves – Splits from Column Tests |
83 |
| Effective Date: May 31st, 2022 | | vi |
Technical
Report - Mineral Resource Estimate Reward Project, Nye County, Nevada, USA
| Figure 13.5. 2008 McClelland Bottle Roll Size versus Gold Recovery – Composite 5 |
85 |
| Figure 13.6. 2018 KCA Metallurgical Sample Drill Hole Location Map |
87 |
| Figure 13.7. 2018 KCA Bottle Roll Test Results |
91 |
| Figure 13.8. KCA 2018 Column Leach Curves – Carbon Assays |
97 |
| Figure 13.9. KCA 2018 Column Leach Curves – Tonnes Solution per Tonne Ore |
99 |
| Figure 13.10. Size versus Recovery – 2018 KCA and 2008 McClelland Test Data |
100 |
| Figure 14.1. Mineral Resource Estimate Mineralized Domain Outlines |
104 |
| Figure 14.2. Histogram of the Raw Gold Assay Values of Sample Intervals Flagged within the Good Hope and Gold Ace Estimation Domains |
106 |
| Figure 14.3. Cumulative Frequency Plot of Raw Gold Assay Values of Sample Intervals Flagged within the Good Hope Zone Estimation Domains |
106 |
| Figure 14.4. Cumulative Frequency Plot of Raw Gold Assay Values of Sample Intervals Flagged within the Gold Ace Estimation Domain |
107 |
| Figure 14.5. Orthogonal View of LGand HG Estimation Domains, Good Hope Deposit |
109 |
| Figure 14.6. Orthogonal View of the LG Estimation Domain, Gold Ace Zone |
110 |
| Figure 14.7. Histogram of Sample Lengths within Estimation Domains for both the Good Hope and Gold Ace Zones |
111 |
| Figure 14.8. Remnant Analysis Illustrating the Gold Distribution of Calculated Composite within the Good Hope Deposit |
112 |
| Figure 14.9. Orphan Analysis Illustrating the Gold Distribution of Calculated Composite within the Gold Ace Zone |
113 |
| Figure 14.10. Probability Plot of the Composited Gold Grade at the Good Hope Zone before Capping |
114 |
| Figure 14.11. Cumulative Frequency Plots of the Composited and Capped Gold Grade within the Good Hope Zone Estimation Domains |
114 |
| Figure 14.12. Probability Plot of the Composited Gold Grade at the Gold Ace Zone before Capping |
115 |
| Figure 14.13. Cumulative Frequency Plot of the Composited and Capped Gold Grade within Gold Ace Zone Estimation Domain |
115 |
| Figure 14.14. Calculated and Modelled Semi-Variogram of Gold within the Good Hope Zone. Dip Direction and Dip for each Principle Direction is in each Subplot Title |
117 |
| Figure 14.15. Calculated and Modelled Semi-Variogram of Gold within the Gold Ace Zone. Dip Direction and Dip for each Principle Direction is in each Subplot Title |
118 |
| Figure 14.16. Bulk Density Box Plots, Good Hope Deposit |
119 |
| Figure 14.17. Bulk Density Scatter Plots Showing 3D Solids vs. Gold Grade, Good Hope Deposit |
120 |
| Figure 14.18. Bulk Density Box Plots, Gold Ace Zone |
121 |
| Figure 14.19. Bulk Density Scatter Plots Showing 3D Solids vs. Gold Grade, Gold Ace Zone |
121 |
| Figure 14.20. Cumulative Frequency Plot Illustrating the Distance from each Block Centroid to the nearest Composite Sample within the Good Hope Zone |
122 |
| Figure 14.21. Cumulative Frequency Plot Illustrating the Distance from each Block Centroid to the nearest Composite Sample within the Gold Ace Zone |
123 |
| Effective Date: May 31st, 2022 | | vii |
Technical
Report - Mineral Resource Estimate Reward Project, Nye County, Nevada, USA
| Figure 14.22. Gold Grade Contact Plot Analysis, Good Hope LG and HG Grade Domain Contacts |
126 |
| Figure 14.23. Contact Plot Analysis, Good Hope Grade and Waste Domain Contacts |
127 |
| Figure 14.24. Contact Analysis, Gold Ace Grade and Waste Domain Contacts |
127 |
| Figure 14.25. Cross-Section 6000N, Showing Block Gold Estimates at the Good Hope Deposit |
128 |
| Figure 14.26. Cross-Section 4800N, Showing Block Gold Estimates at the Good Hope Deposit |
129 |
| Figure 14.27. Cross-Section 4100N, Showing Block Gold Estimates at the Good Hope Deposit |
129 |
| Figure 14.28. Cross-Section 2700N, Showing Block Gold Estimates at the Gold Ace Deposit |
130 |
| Figure 14.29. Swath Plots Showing Composite versus Estimated Gold Grade, Good Hope |
131 |
| Figure 14.30. Swath Plots Showing Composite versus Estimated, Gold Grade Gold Ace |
132 |
| Figure 14.31. Volume Variance Check, Good Hope |
133 |
| Figure 14.32. Volume Variance Check, Gold Ace |
134 |
| Figure 14.33. Contact Analysis, Good Hope Grade and Waste Domain Boundary |
135 |
| Figure 14.34. Contact Analysis, Gold Ace Grade and Waste Domain Boundary |
135 |
| Figure 23.1. Adjacent Properties |
146 |
| Effective Date: May 31st, 2022 | | viii |
Technical
Report - Mineral Resource Estimate Reward Project, Nye County, Nevada, USA
This Technical Report (the
Technical Report) was prepared by APEX Geoscience Ltd. (APEX) and Kappes, Cassiday & Associates (KCA) for CR Reward LLC (CR Reward)
and Augusta Gold Corp. (Augusta or the Company). Augusta is a publicly traded company listed on the Toronto Stock Exchange (TSX:G) in
Canada and the OTCQB Venture Market (OTCQB:AUGG) in the United States of America (USA) focused on the exploration, advancement and development
of gold properties in Nevada. CR Reward is a private Nevada limited liability company that is a wholly owned subsidiary of Augusta.
The Company engaged APEX
in May, 2022 to complete an updated Mineral Resource Estimate (MRE) for the Reward Project under National Instrument 43-101 Standards
of Disclosure for Mineral Projects (NI 43-101) and an Initial Assessment of Mineral Resources in accordance with Item 1300 of Regulation
S-K under the United States Securities Exchange Act of 1934, as amended (SK 1300). The focus of this Technical Report is an updated MRE
for the Reward Project (Reward or the Project), a gold exploration project situated in Nye County, Nevada (NV), USA. The Project is located
11.3 km (7 miles) to the southeast of the Company’s Bullfrog project within the Walker Lane Trend, a prolifically mineralized belt
that is host to numerous gold deposits and current and past producing mines in south-central Nevada.
This Technical Report summarizes a NI 43-101 and SK 1300 updated MRE
for the Project and provides a technical summary of the relevant location, tenure, historical and geological information, a summary of
the recent exploration work conducted by CR Reward and recommendations for future exploration programs. This Technical Report summarizes
the technical information available up to the effective date of May 31, 2022. This Technical Report was amended on December 18, 2023
to make certain additions to address technical compliance with SK 1300 in relation to (i) the adequecy of the metallurgical data and (ii)
the reasoning for using the selected commodity prices and material assumptions in relation thereto. No updates or amendments were made
to the technical information which remains as of the effective date of May 31, 2022
This Technical Report has
been prepared in accordance with the Canadian Securities Administration’s (CSA’s) NI 43-101 and guidelines for technical reporting
Canadian Institute of Mining, Metallurgy and Petroleum (CIM) “Best Practices and Reporting Guidelines” for disclosing mineral
exploration and in accordance with the requirements of SK 1300. The mineral resource has been estimated using the CIM “Estimation
of Mineral Resources and Mineral Reserves Best Practice Guidelines”, dated November 29, 2019, and the CIM “Definition
Standards for Mineral Resources and Mineral Reserves”, amended and adopted May 10th, 2014 and in accordance with the requirements
of SK 1300.
| 1.2 | Authors, Contributors and Site Inspection |
This Technical Report
has been prepared by Mr. Michael B. Dufresne, M.Sc., P. Geol., P. Geo., of APEX and Mr. Timothy D. Scott, BA.Sc., RM SME, of
KCA. Both authors are independent and not employed by either Augusta or CR Reward and are Qualified Persons (QPs) as defined in NI
43-101 and as defined under SK 1300. Contributors to this Technical Report include Mr. Warren Black, M.Sc., P.Geo. and
Mr. Steven Nicholls, BA.Sc., MAIG, all of APEX and who are independent and not employed by either Augusta or CR Reward. Neither
APEX or KCA are affiliated with Augusta or CR Reward. Under the direct supervision of Mr. Dufresne, Mr. Black prepared the
resource estimation statistical analysis, three-dimensional modelling, block modelling and resource estimations presented in
Section 14. Mr. Steven Nicholls, BA.Sc., MAIG, a QP, and APEX’s senior resource geologist performed an internal
audit of the MRE presented in Section 14. Mr. Dufresne takes responsibility for the MRE reported herein.
| Effective Date: May 31st, 2022 | | 1 |
Technical
Report - Mineral Resource Estimate Reward Project, Nye County, Nevada, USA
Mr. Dufresne has visited
the Project on two separate occasions in 2017 and 2019. During the site inspections, Mr. Dufresne reviewed drill core and verified
the location of a number of drill collars. As a result of the site inspections, Mr. Dufresne can verify the land position, the geological
setting and the mineralization that is the subject of this Technical Report. Mr. Scott visited the Project on September 22,
2018 and on May 16, 2022.
The Project is situated about
11.3 km (7 miles) south-southeast of the town of Beatty, NV about 3.2 km (2 miles) east of US Highway 95 in Nye County. The Project can
be accessed from Beatty by paved road on Highway 95 followed by traveling two miles east on a gravel road. Several dirt roads diverge
into various canyons of the Bare Mountains.
The Project is situated in
the Amargosa Desert in southwestern Nevada on the southwestern flank of the Bare Mountains in the northern Amargosa Valley. The western
flank of the Bare Mountains drains into the Amargosa Desert which is drained by the ephemeral Amargosa River. Beatty, on the Amargosa
River, lies at 1,006 m (3,300 ft) elevation. Elevations in the Project area range from about 1,160 to 1,310 m (3,800 ft to 4,300
ft). Vegetation is sparse. The climate is typical of middle-elevation desert. Operations are planned to be conducted year-round.
The Project is currently
serviced by an existing 14.4/24.9 kV power line owned and operated by Valley Electric. A water well provides water for exploration activities.
Project employees will be recruited from the local area, including the communities of Beatty, Amargosa, and Pahrump, located within Nye
County, and the regional urban centre of Las Vegas, located within Clark County.
The Project has sufficient
land area, with adjacent public-domain lands also potentially available, to allow mine development, including space for the mining operations,
waste rock disposal facilities (WRDs) and heap leach pads as envisaged in prior historical economic studies.
| 1.4 | Mineral Tenure, Surface Rights, Water Rights, Royalties and Agreements |
The Project area lies within
Sections 1, 2, 3, 4, 9, 10, 11 and 16 of Township 13 South, Range 47 East and Sections 33, 34, and 35 of Township 12 South, Range 47 East,
all referred to the Mount Diablo Baseline and Meridian.
| Effective Date: May 31st, 2022 | | 2 |
Technical
Report - Mineral Resource Estimate Reward Project, Nye County, Nevada, USA
Canyon Resources Corporation
(Canyon Resources) holds a 100% interest in the mineral claims that form the Project. In 2008, Canyon Resources assigned all of the patented
and unpatented claims comprising the Project to an entity which was subsequently converted into CR Reward.
The Project encompasses 121
unpatented Bureau of Land Management (BLM) placer and lode mining claims and six patented placer mining claims, totalling approximately
2,333 net acres (944 hectares). Only the patented claims have been legally surveyed. Under United States mining law, claims may be renewed
annually for an unlimited number of years upon a small payment per claim (currently $155 per claim due to the BLM and an aggregate $1,502
due to Nye County) and the same claim status—whether lode or placer—may be used for exploration or exploitation of the lodes
or placers.
Several blocks of unpatented
claims are leased by CR Reward from underlying owners, and are referred to as Connolly, Webster, Orser–McFall and Van Meeteren leases.
These have the following royalties payable:
| • | A 3% Net Smelter Return (NSR) royalty is payable
on any minerals mined from the Connolly Claims, but is reduced to 2% as CR Reward only owns a two-third interest in the Connolly Claims.
Annual advance minimum royalty payments are payable under the Connolly Lease in an amount equal to $10,000/year. |
| • | A 3% NSR royalty is payable on any minerals mined
from the Webster Claims but is (i) reduced to 1% on the Sunshine and Reward claims as the lessee only owns a one-third interest,
and (ii) reduced to 1.5% on the Good Hope claim as CR Reward only owns a half interest in this claim. Annual advance minimum royalty
payments are payable under the Webster Lease in an amount equal to $7,500/ year. |
| • | A 3% NSR royalty is payable on minerals mined
from the Orser–McFall Claims but is reduced to 1.5% on the Good Hope claim as the lessee only owns a half interest in that claim.
Annual advance minimum royalty payments are payable under the Orser–McFall Lease in an amount equal to $20,000/year. |
| • | A 3% NSR royalty is payable on minerals mined
from the Van Meeteren Claims. Annual advance minimum royalty payments are payable under the Van Meeteren Lease in an amount equal to $15/acre
from 2011 through 2020, for a total of $1,800/year, and $20/acre from and after 2021, for a total of $2,400/year. |
The Project area mainly consists
of Federal public domain lands administered by the BLM. There are no State or private tracts within the Project area, except the six patented
claims owned by CR Reward, all of which carry surface and mineral rights ownership.
The Project is not subject
to any other back-in rights payments, agreements or encumbrances.
| Effective Date: May 31st, 2022 | | 3 |
Technical
Report - Mineral Resource Estimate Reward Project, Nye County, Nevada, USA
Water rights have been obtained
through a Water Lease agreement with Barrick Gold Corp’s (Barrick) Bullfrog mining operations. Under the Water Lease, CR Reward
has the right to use 317.39 acre-ft of water annually under Application No. 61412, Certificate No. 16384 and Permit No. 76390
in exchange for paying Barrick USD$150.00/acre-ft of water per year for water actually pumped.
To the extent known to the
QPs, there are no other significant factors and risks that may affect access, title, or the right or ability to perform work on the Project
that have not been discussed in this Report.
| 1.5 | Geology and Mineralization |
Mineralization in the Good
Hope Deposit and Golden Ace Zone can be classified as examples of a structurally controlled, locally disseminated, sediment hosted, mesothermal
quartz vein gold deposit.
The Project is hosted within
the Bare Mountain Complex which lies within an intricate tectonic setting of the Nevada Basin and Range Province.
The Bare Mountain Complex
consist of up to 6,096 m (20,000 ft) of Upper Proterozoic to Paleozoic marine sedimentary rocks in the lower plate that have been juxtaposed
against Miocene silicic volcanic sequences in the upper plate. The lower plate units were deformed through folding, thrust faulting, low
and high angle normal faulting during a Mesozoic compression event, and have been metamorphosed from lower amphibolite to sub-greenschist
grade. Two dominant normal fault sets have been mapped in the lower plate, including the moderately east-dipping Bare Mountain and Gold
Ace faults, and shallowly southeast-dipping faults that cut or curve into east-dipping faults.
The Project is located on
the southwestern flank of the Bare Mountain Complex and is underlain by moderately-deformed marine clastic and carbonate rocks of Late
Proterozoic and Late Cambrian age that have been metamorphosed to greenschist grade. Tertiary and younger alluvium cover the lower slopes
and the adjacent Armagosa Valley to the south and west. The east-dipping Gold Ace fault, locally termed the Good Hope fault zone, separates
northeast dipping Late Proterozoic to Early Cambrian units in the footwall block from Middle to Late Cambrian units in the hanging wall
block.
The gold mineralization in
the Good Hope Deposit is spatially associated with, and along, the Good Hope fault zone, and is primarily hosted in altered and veined
Wood Canyon Formation, and to a lesser extent, in the Juhl and Sutton Members of the Stirling Formation. Mineralization hosted along the
contact between the Sutton and Morris Marble Members of the Stirling Formation is referred to as the Gold Ace Zone. Although there are
small historic prospects along the Good Hope fault zone, most of the historic production came from the Gold Ace Zone.
| Effective Date: May 31st, 2022 | | 4 |
Technical
Report - Mineral Resource Estimate Reward Project, Nye County, Nevada, USA
Historical exploration of
the Project was completed by several other companies from 1976 to 2004, including Galli Exploration Associates (Galli Exploration), Teco
Inc. (Teco), St. Joe Minerals Corporation (St Joe), Gexa Gold Corp (Gexa), Cloverleaf Gold Inc. (Cloverleaf), Homestake Mining Company
(Homestake), Pathfinder Gold Corporation (Pathfinder), Bond Gold Exploration Inc. (Bond Gold), Barrick, US Nevada Gold Search (USNGS),
Rayrock Mines, Inc (Rayrock), Glamis Gold, Ltd. (Glamis Gold), and Marigold Mining Company (Marigold Mining). Historical exploration
included airborne geophysics, reverse circulation (RC) and core drilling, initial metallurgical testwork, mineral resource estimates and
technical studies.
Canyon Resources acquired
the Project in 2004, and together with Atna Resources Ltd. (Atna) and CR Reward, have completed data compilation and validation, ground
induced polarization/resistivity geophysical surveys, RC and core drilling, mineral resource and mineral reserve estimates, metallurgical
testwork, permitting studies, environmental baseline studies, and technical studies. The following permits and authorizations were granted
to CR Reward in 2007:
| • | Plan of Operations authorized under N-82840. |
| • | Water Pollution Control Permit (WPCP); WPCP NEV2007101. |
| • | General construction permit; NVR100000 CSW-17415. |
| • | Water rights permitted by Nevada Division of
Water Resources (NDWR) under Mining, Milling, & Domestic permit 76390. |
| • | Mining reclamation permit granted by the Bureau
of Mining Regulation and Reclamation (BMRR) under mine site permit #0300. |
| • | Nevada Bureau of Air Pollution Control (BAPC)
authorized Class II Air Quality permit AP1041-2492. |
A total of 376 drill holes,
totalling 43,729.7 m (143,470 ft) have been completed at the Project between 1987 and 2018. Of this total, 35 are core holes totalling
4,094.4 m (13,433 ft) and 341 are RC holes totalling 39,635.3 m (130,037 ft).
For CR Reward’s 2017–2018
drill program, drill hole locations were established using hand-held global positioning system (GPS) instruments and upon completion of
the program, the collar locations were re-surveyed by a licensed surveyor. Down-hole surveys were completed at regular intervals, usually
7.6 m (25 ft), using an EZ-Shot system that records the magnetic heading, dip of the hole and magnetic field in the hole. A total of 398
measurements were collected for the 28 holes drilled in 2017–2018. Core recovery during the core drilling was very good, exceeding
95% on average, with losses mainly in highly shattered zones.
| Effective Date: May 31st, 2022 | | 5 |
Technical
Report - Mineral Resource Estimate Reward Project, Nye County, Nevada, USA
There is limited documentation
available detailing the sample preparation, analyses and security of historical drill sampling programs conducted from 1987 to 2000 by
Homestake, Gexa, Pathfinder, Cloverleaf, USNGS and Barrick. RC drill holes completed in 2006–2007 were sampled on 1.5 m (5 ft) intervals,
and cores on 0.9 m (3 ft) intervals. The 2011–2013 RC holes were also sampled at 1.5 m (5 ft) intervals.
Independent assay laboratories
were used in the 2006-2007 Canyon Resources, the 2011-2013 Atna and 2017-2018 CR Reward programs, including ALS Chemex Laboratory in Sparks,
Nevada (certified to ISO 9001:2000 for selected techniques), Inspectorate America Corporation (Inspectorate) in Sparks, Nevada (certified
to ISO 9001:2000 for selected techniques), Florin Analytical Services (FAS) in Reno, Nevada (not certified).
The 2006–2007, 2011-2013
and the CR Reward 2017-2018 drilling programs included the submission of standard and blank materials as part of the Quality Assurance
and Quality Control (QA/QC) program. Assay control protocols during these modern periods of drilling included the insertion of certified
standards, blanks and duplicates at acceptable insertion rates for all of the data.
The sample collection, security,
transportation, preparation, insertion of geochemical standards and blanks, and analytical procedures are within industry norms and best
practices. The procedures used by CR Reward personnel are considered adequate to ensure that the results disclosed are accurate within
scientific limitations and are not misleading. The procedures and assay control protocols employed by CR Reward in the 2017–2018
drill program are considered reasonable and acceptable for use in Mineral Resource estimation.
Keith Fowlow of CR Reward
performed a comprehensive data verification program in 2017 consisting of collar and down-hole survey checks, and evaluation of assay
values versus laboratory certificates or geologic logs where certificates were not available. Errors identified were corrected where applicable.
For non-analytical drill hole information, CR Reward employed a protocol of continuous data checking to ensure accurate data transcription,
including collar and down hole surveys, and geological and geotechnical information. The procedures employed are considered reasonable
and are adequate with respect to ensuring data integrity.
Mr. Dufresne reviewed
all aspects of the Reward drill hole database and available non-analytical procedures for historical and the CR Reward 2017–2018
drilling programs including the verification program by Mr. Fowlow. The drill hole database was validated using Micromine 2018 and
was inspected visually in Excel files and on drill section. Mr. Dufresne has reviewed the adequacy of the exploration information
and the visual, physical and geological characteristics of the Project and has found no significant issues or inconsistencies that would
cause one to question the validity of the data. Mr. Dufresne, the QP, considers the CR Reward drill hole database, including the
historical pre-2017 data and the 2017 to 2018 data, well validated and suitable for the preparation of the MRE presented in Section 14
of this Technical Report.
| Effective Date: May 31st, 2022 | | 6 |
| Technical Report - Mineral Resource Estimate Reward Project, Nye County, Nevada, USA |
Metallurgical test work on
the Project includes historical work completed by Rayrock Mines Inc. during 1998 and McClellend in 2007 and 2008 with confirmatory test
work being performed by KCA in 2018. Metallurgical test work completed to date includes 34 bottle roll tests and 21 column tests along
together with preliminary agglomeration and compacted permeability testing. Results from these tests show that the mineralization is amenable
to cyanide leaching with reasonable reagent consumptions.
Metallurgical samples from
historical and recent KCA test programs appear to be spatially representative for the Good Hope Deposit. Results from KCA’s 2018
test program confirmed the results from the 2007–2008 McClelland campaign with an average laboratory gold recovery of 81% for the
Good Hope Deposit. The program also included bottle roll and duplicate column leach tests on the Gold Ace Zone. Results for Gold Ace show
significantly lower column recoveries compared to the Good Hope Deposit.
Key design parameters from
the metallurgical test work for the Good Hope Deposit include:
| • | Crush size P80 of ¼ inch. |
| • | Estimated field gold recovery of 79% including
a 2% field deduction. Based on column tests, it is possible additional ounces may be realized during secondary leaching of ore from leaching
upper lifts and during heap rinsing as it appears most columns were still slowly leaching at the termination of the columns. |
| • | Design leach cycle of 125 days. |
| • | Average field sodium cyanide consumption of 0.73
lb/st ore. |
| • | Average field lime consumption of 1.53 lb/st
of material based on 100% CaO purity. |
| • | Cement agglomeration is not required up to heap
heights of 262 ft. |
No deleterious elements are
known from the processing perspective.
| 1.9.1 | Qualified
Person’s Opinion |
The metallurgical test work and analytical methods used followed regular
mining industry accepted practice. The samples and composite samples used in the metallurgical evaluation were deemed representative for
the deposit as sampled for process development. Appropriate test work in sufficient quantity has been conducted to derive the metallurgical
conclusions presented.
| 1.10 | Current Mineral Resource |
This Technical Report details
an updated mineral resource estimate (MRE) for the Reward Project. The 2022 MRE for Reward was completed by Mr. Warren Black, M.Sc.,
P.Geo., of APEX under the direct supervision of Mr. Dufresne, M.Sc., P.Geol., P.Geo. and the QP who takes responsibility for the
MRE contained herein. Mr. Steven Nicholls, BA.Sc., MAIG, a QP and APEX’s senior resource geologist performed an internal audit
of the MRE in Section 14.
| Effective Date: May 31st, 2022 | | 7 |
| Technical Report - Mineral Resource Estimate Reward Project, Nye County, Nevada, USA |
CR Reward and Augusta provided
APEX with a drill hole database that consisted of analytical, geological, density, and collar survey information, initial estimation domains
for the Good Hope Deposit and Gold Ace Zone, and a geological model that contained a stratigraphic and structural 3D interpretation. A
block model size of 20 ft (X) by 20 ft (Y) by 20 ft (Z) was used for the gold estimation.
The assay data was examined
using a combination of histograms, cumulative frequency plots, and summary statistics; this indicated gold samples generally exhibited
a single assay population. Samples were composited to 10 ft lengths. Probability plots were used to evaluate grade statistics and determine
whether capping was warranted. A capping level of 0.292 oz/st (10.01 grams per tonne [g/t]) Au was applied to samples in the Good Hope
Deposit, and a cap level of 0.146 oz/st (5.01 g/t) Au to samples in the Gold Ace Zone. Semi-variograms for gold were modelled using the
10 ft composites flagged within the estimation domains. A bulk density of 2.59 g/cm3 was applied to all blocks in the Good
Hope Deposit. As there is evidence for the need for a higher bulk density value for blocks flagged within the Morris Member in the Good
Ace Zone, they were assigned a value of 2.70 g/cm3. However, as there is an insufficient number of bulk density measurements
of the Sutton Member within the Gold Ace estimation domain, all other blocks at the Gold Ace Zone were assigned a bulk density of 2.59
g/cm3.
Ordinary kriging (OK) was
used to estimate gold grades for those blocks that contained more than 1.56% mineralized material by volume. A block discretization of
2 (X) by 2 (Y) by 2 (Z) was applied to all blocks during estimation. A two-pass method was used. The first pass required
a minimum of two drill holes, a maximum of 15 composites and no more than three composites from any one drill hole. Soft boundaries were
used between the high and low-grade domains in the Good Hope Deposit, and mineralization and waste in the Good Hope Deposit and the Gold
Ace Zone.
Estimation validation included
visual inspection in plan view and in cross-section, examination of swath plots, review of mineralization/waste contact profiles and volume-variance
effects. The estimate was found to be reasonable.
Mineral Resources were classified
using a combination of assessment of geological confidence, data quality and grade continuity. Resource classification was determined
using a three-pass strategy, where Measured was classified in the first run, Indicated in the second, and Inferred in the third run.
A small portion of blocks at the northern (>6500 N) and southern (<2750 N) extents of the Good Hope Deposit were manually adjusted
to Inferred as there is insufficient drilling density in the QP’s opinion to justify higher confidence classifications.
| Effective Date: May 31st, 2022 | | 8 |
| Technical Report - Mineral Resource Estimate Reward Project, Nye County, Nevada, USA |
Reasonable prospects of eventual
economic extraction were considered by constraining the estimate within a conceptual pit shell that used the assumptions in Table 1.1.
Table 1.1. Reward Conceptual Open Pit Parameters.
| Parameter |
Unit
(Imperial) |
Cost
(Imperial) |
Unit
(Metric) |
Cost
(Metric) |
| Gold Price |
US$/oz |
1,700 |
US$/g |
54.656 |
| Gold Metallurgical Recovery |
% |
80 |
% |
80 |
| Pit Wall Angles |
° |
48-58 |
° |
48-58 |
| Mining Cost |
US$/st |
2.00 |
US$/tonne |
2.20 |
| Processing Rate |
Mst/a |
3 |
Mtonne/a |
2.7 |
| Processing Cost |
US$/st |
$5.50 |
US$/tonne |
$6.06 |
| G & A Cost |
US$/st |
0.75 |
US$/tonne |
0.80 |
| Cut-off Grade (break even) |
oz/st |
0.0047 |
g/tonne |
0.158 |
| Royalty |
% |
3 |
% |
3 |
The MRE for the Reward Project
is presented in Table 1.2 below.
Table 1.2. Reward Project Mineral Resource
Estimate at May 31, 2022 Based on USD$1,700/oz. Au and a lower cutoff grade of 0.2 g/t Au.
| Classification |
Tonnage (Mt) |
Average Grade (g/t) |
Contained Au (koz) |
| Good Hope |
|
Measured
Indicated
M&I Total |
6.19
10.76
16.94 |
0.86
0.69
0.75 |
169.9
240.0
409.9 |
| Inferred |
0.29 |
0.56 |
5.3 |
| Gold Ace |
|
Indicated
Inferred |
0.83
1.03 |
0.63
0.73 |
16.8
21.8 |
| Reward (Combined Good Hope and Gold Ace) |
|
Measured
Indicated
M&I Total |
6.19
11.58
17.77 |
0.86
0.69
0.75 |
169.9
256.8
426.7 |
| Inferred |
1.23 |
0.68 |
27.1 |
Notes:
| 1. | Oxide estimated Mineral Resources are reported within a pit shell using the Lerch Grossman algorithm, a gold price of US$1,700/oz
and a recovery of 80% for Au were utilized. |
| 2. | Gold
price used in the mineral resource estimate was based on a review of the 3 year trailing
average. |
| 3. | Mining costs for mineralized material and waste are US$2.20/tonne. |
| 4. | Processing and general and administration are US$6.06/tonne and US$0.83/tonne per tonne processed, respectively. |
| 5. | The
mineral resources are reported utilizing a 0.2 g/t Au incremental lower cut-off grade. |
| 6. | Due to rounding, some columns or rows may not compute as shown. |
| 7. | Estimated Mineral Resources are stated as in situ dry metric tonnes and are partially diluted. |
| 8. | The estimate of Mineral Resources may be materially affected by legal, title, taxation, socio-political, marketing, or other relevant
issues. |
| 9. | The effective date of the Reward mineral resource estimate is May 31, 2022. |
| Effective Date: May 31st, 2022 | | 9 |
| Technical Report - Mineral Resource Estimate Reward Project, Nye County, Nevada, USA |
Based upon a review of available
information, historical and recent exploration data, the authors site visits and the current MRE for the Good Hope Deposit and Gold Ace
Zone of the Reward Project, the authors view the Project as a property of merit prospective for the additional discovery, and future development,
of potentially economic structurally-controlled, locally-disseminated, sediment-hosted, mesothermal quartz vein gold mineralization. This
contention is supported by the following:
| • | The favourable geological setting of the Reward
Project and its position within the Walker Land Trend, a prolifically mineralized belt that is host to numerous gold deposits and current
and past producing mines in south-central Nevada. |
| • | Historical exploration and recent work by CR
Reward has delineated a large zone of gold mineralization at Good Hope and Gold Ace and led to the calculation of the current MRE. |
| • | Recent metallurgical testwork indicates projected
gold recoveries of 81% for the Good Hope Deposit. |
Based on the outcomes of
this report and prior work conducted by CR Reward, it is recommended that CR Reward and Augusta proceed to a Preliminary Feasibility Study
(PFS) for the Reward Project in order to examine opportunities to develop the Project. The PFS will be an update to a historical internal
Feasibility Study (FS) prepared in 2019 on behalf of CR Reward and Waterton. The recommended PFS will incorporate current pricing for
major equipment, contract mining costs, construction costs, major consumables, and labor costs.
The budget for completing
a PFS for the Project is USD$1,100,000, including contingency, as summarized in Table 1.3 below.
Table 1.3. Estimated budget for the recommended
PFS.
| Item |
Cost
USD$ |
| Primary Engineer, includes Process and Infrastructure |
420,000 |
| Mineral Resource Estimate |
20,000 |
| Mining and Mineral Reserve |
40,000 |
| Geotechnical and Earthworks |
110,000 |
| Power and Other Consulting |
400,000 |
| Contingency |
110,000 |
| Total |
1,100,000 |
| Effective Date: May 31st, 2022 | | 10 |
| Technical Report - Mineral Resource Estimate Reward Project, Nye County, Nevada, USA |
This Technical Report (the
Technical Report) was prepared by APEX Geoscience Ltd. (APEX) and Kappes, Cassiday & Associates (KCA) for CR Reward LLC (CR Reward)
and Augusta Gold Corp. (Augusta or the Company). Augusta is a publicly traded company listed on the Toronto Stock Exchange (TSX:G) in
Canada and the OTCQB Venture Market (OTCQB:AUGG) in the United States of America (USA) focused on the exploration, advancement and development
of gold properties in Nevada. CR Reward is a private Nevada limited liability company that is a wholly owned subsidiary of Augusta.
On June 13, 2022, Augusta
acquired the Reward Project (Reward or the Project), from Waterton Nevada Splitter LLC (Waterton) by the purchase of CR Reward.
The Reward Project is considered
to be an intermediate stage exploration project within a favourable geological setting, situated within the Walker Lane Trend, a prolifically
mineralized belt this is host to numerous gold deposits and current and past producing mines in south-central Nevada. The Project is situated
approximately 11.3 km (7 miles) south-southeast of the town of Beatty, NV, approximately 3.2 km (2 miles) east of US Highway 95 in Nye
County (Figure 2.1). The Project encompasses 121 unpatented Bureau of Land Management (BLM) placer and lode mining claims and six patented
placer mining claims, totalling approximately 2,333 net acres (944 hectares).
This Technical Report summarizes
a National Instrument 43-101 Standards of Disclosure for Mineral Projects (NI 43-101) and Item 1300 of Regulation S-K of the United
States Securities Exchange Act of 1934, as amended (SK 1300) mineral resource estimation for the Reward Project and provides a technical
summary of the relevant location, tenure, historical and geological information, a summary of the recent exploration work and recommendations
for future exploration programs. This Technical Report summarizes the technical information available up to the effective date of May 31st,
2022.
This Technical Report has
been prepared in accordance with the Canadian Securities Administration’s (CSA) NI 43-101 and guidelines for technical reporting
Canadian Institute of Mining, Metallurgy and Petroleum (CIM) “Best Practices and Reporting Guidelines” for disclosing mineral
exploration and in accordance with the requirements of SK 1300. The mineral resource has been estimated using the CIM “Estimation
of Mineral Resources and Mineral Reserves Best Practice Guidelines” dated November 29, 2019, and the CIM “Definition
Standards for Mineral Resources and Mineral Reserves” amended and adopted May 10th, 2014 and in accordance with the requirements
of SK 1300.
| Effective Date: May 31st, 2022 | | 11 |
| Technical Report - Mineral Resource Estimate Reward Project, Nye County, Nevada, USA |
Figure 2.1. Project Location Map (Lycopodium,
2019).

Note: Figure prepared by Lycopodium,
2019.
| 2.2 | Authors, Contributors and Site Inspection |
This Technical Report has
been prepared by Mr. Michael B. Dufresne, M.Sc., P. Geol., P. Geo., of APEX and Mr. Timothy D. Scott, RM SME, of KCA. Both authors
are independent and not employed by either Augusta or CR Reward and are Qualified Persons (QPs) as defined in NI 43-101 and SK 1300. The
CIM and NI 43-101 defines a QP as “an individual who is a geoscientist with at least five years of experience in mineral exploration,
mine development or operation or mineral project assessment, or any combination of these; has experience relevant to the subject matter
of the mineral project and the technical report; and is a member or licensee in good standing of a professional association.” SK
1300 defines a QP as “an individual who is (1) a mineral industry professional with at least five years of relevant experience
in the type of mineralization and type of deposit under consideration and in the specific type of activity that person is undertaking
on behalf of the registrant; and (2) an eligible member or licensee in good standing of a recognized professional organization at
the time the technical report is prepared.”
| Effective Date: May 31st, 2022 | | 12 |
| Technical Report - Mineral Resource Estimate Reward Project, Nye County, Nevada, USA |
Mr. Dufresne, M.Sc.,
P.Geol., P.Geo. takes responsibility for the preparation and publication of Sections 1.1 to 1.8, 1.10 to 12, 14 to 25.4, 25.6 and 25.8
to 27 and is co-responsible for section 25.7 of this Technical Report. Mr. Dufresne is a Professional Geologist with the Association
of Professional Engineers and Geoscientists of Alberta (APEGA; membership number 48439), a Professional Geoscientist with the Association
of Professional Engineers and Geoscientists of British Columbia (EGBC; membership number 37074) and has worked as a mineral exploration
geologist for more than 35 years since his graduation from university. Mr. Dufresne has been involved in all aspects of mineral exploration
and mineral resource estimations for precious and base metal mineral projects and deposits in Canada and internationally, including structurally-controlled,
locally-disseminated, sediment-hosted, quartz vein gold mineralization in Nevada.
Mr. Timothy Scott, BA.Sc.
Geological Engineering, takes responsibility for Sections 1.9, 13, 25.5 and is co-responsible for section 25.7 of this Technical Report.
Mr. Scott visited the Project on September 22nd, 2018 and on May 16th, 2022. He inspected the access
and associated infrastructure. Mr. Scott has worked for 35 years in all aspects of mineral processing and gold extraction; heap leaching;
and design and construction of mineral processing and metals extraction facilities. He has held management positions at major mining companies
as well as led the design, construction, and commissioning teams for the construction of five operating mines.
Contributors to this Technical
Report include Mr. Warren Black, M.Sc., P.Geo. and Mr. Steven Nicholls, BA.Sc., MAIG, of APEX. Under the direct supervision
of Mr. Dufresne, Mr. Black prepared the resource estimation statistical analysis, three-dimensional modelling, block modelling
and resource estimations presented in Section 14. Mr. Black has a research background in the use of multivariate simulation
for probabilistic mineral prospectivity modelling and has experience with exploration for precious and base metal deposits of various
deposit types in North America. Mr. Steven Nicholls, BA.Sc., MAIG, QP, conducted a thorough audit of the Mineral Resource Estimate
(MRE) and Section 14. Mr. Nicholls is a QP, as defined in NI 43-101 and SK 1300, and has worked as a geologist for more than
20 years since his graduation from university. Mr. Nicholls is APEX’s senior resource geologist and has extensive experience
with exploration/resource estimation for, and the evaluation of, gold deposits of various types, including sediment-hosted mineralization.
Mr. Dufresne has visited
the Project for data verification purposes on two separate occasions in 2017 and 2019. On August 2, 2017, Mr. Dufresne visited
the Property and reviewed drill core at CR Reward’s office in Reno, NV. On August 12, 2019, Mr. Dufresne visited the Property
and verified the location of a number of drill collars. On August 15, 2019, Mr. Dufresne performed an inspection of the Lovelock,
NV, core facility and reviewed Reward Project drill core from the 2017-2018 drill program. No material field based exploration work has
occurred at the Reward Project since the 2017-2018 drill program. Therefore, Mr. Dufresne considers the most recent site visit as
current. As a result of the site visits, Mr. Dufresne can verify the land position, the geological setting and the mineralization
that is the subject of this Technical Report.
| Effective Date: May 31st, 2022 | | 13 |
| Technical Report - Mineral Resource Estimate Reward Project, Nye County, Nevada, USA |
| 2.3 | Sources of Information |
This Technical Report is
largely based on sections derived from the 2019 Feasibility Study titled, “Reward Project Feasibility Study Report, Nevada, USA”,
prepared for CR Reward by Lycopodium Minerals Canada Ltd. (Lycopodium; Lycopodium, 2019) and the 2019 Feasibility Study Technical Report
titled, “Reward Project Feasibility Study, NI 43-101 Technical Report Nevada, USA,” prepared by Lycopodium and co-authored
by Mr. Dufresne and Mr. Scott (Evans et al., 2019).
Additional sources of information
are listed in Section 27, References. The sources of information and data used in this Technical Report are based on the compilation
of proprietary and publicly available geological and geochemical data. The authors have deemed these reports, data, and information as
valid contributions to the best of their knowledge.
Based on the site visits
and review of the available literature and data, the authors take responsibility for the information herein.
With respect to units of
measure, unless otherwise stated, this Technical Report uses:
| • | Abbreviated shorthand consistent with the International
System of Units (International Bureau of Weights and Measures, 2006). |
| • | ‘Bulk’ weight is presented in both
United States short tons (“tons”; 2,000 lbs or 907.2 kg) and metric tonnes (“tonnes”; 1,000 kg or 2,204.6 lbs.). |
| • | Assay and analytical results for precious metals
are quoted in parts per million (“ppm”), parts per billion (“ppb”), ounces per short ton (“opt” or
ozt/st), where “ounces” refers to “troy ounces” and “ton” means “short ton”. Where ppm
(also commonly referred to as grams per metric tonne [g/t]) have been converted to opt (or ozt/st), a conversion factor of 0.029166 (or
34.2857) was used. |
| • | Geographic coordinates are projected in the Universal
Transverse Mercator (“UTM”) system relative to Zone 11 of the North American Datum (“NAD”) 1983. and, |
| • | Currency in United States dollars (USD$), unless
otherwise specified (e.g., Canadian, CAD$. |
| Effective Date: May 31st, 2022 | | 14 |
| Technical Report - Mineral Resource Estimate Reward Project, Nye County, Nevada, USA |
| 3 | Reliance
on Other Experts |
The authors are not qualified
to provide an opinion or comment on issues related to legal agreements, royalties, permitting and environmental matters. Accordingly,
the authors of this Technical Report disclaim portions of the Technical Report particularly in Section 4, Property Description and
Location.
The authors relied entirely
on background information and details regarding CR Reward’s legal ownership (in Section 4.1) as provided in title reports prepared
by CR Rewards legal counsel dated April 9-12, 2022 (Jensen, 2022a,b,c,d). Permitting as well as the legal and survey validation of
the claims is not in the authors’ expertise and the QPs have relied on the Company’s representatives with respect to such
information.
The authors have confirmed
the claims are active and in good standing as of the Effective Date of this Report using the BLM’s MLRS register. The authors have
no reason to question the validity or status of the mineral claims.
| 4 | Property
Description and Location |
| 4.1 | Description and Location |
The Project is located in
Nye County, Nevada, about seven miles south–southeast of the town of Beatty as shown in Figure 4.1. The Project area lies within
Sections 1, 2, 3, 4, 9, 10, 11 and 16 of Township 13 South, Range 47 East, and Sections 33, 34, and 35 of Township 12 South, Range 47
East, all referred to the Mount Diablo Baseline and Meridian (CAM, 2012).
The Project is situated at
an approximate latitude and longitude corresponding to 36° 50 minutes and 116° 42 minutes, respectively (CAM, 2012). The centre
of the proposed open pit is located at 1,729,330 E, 13,375,050 N (UTM coordinates, NAD27, Zone 11, US feet).
The Project area falls within
the USGS Carrara Canyon 1:24,000 scale topographic quadrangle map.
| 4.2 | Property and Title in Nevada |
Information in this section
is sourced from Papke and Davis (2019).
Federal (30 USC and 43 CFR)
and Nevada (NRS 517) laws concerning mining claims on Federal land are based on an 1872 Federal law titled “An Act to Promote the
Development of Mineral Resources of the United States.” Mining claim procedures still are based on this law, but the original scope
of the law has been reduced by several legislative changes.
| Effective Date: May 31st, 2022 | | 15 |
| Technical Report - Mineral Resource Estimate Reward Project, Nye County, Nevada, USA |
The Mineral Leasing Act of
1920 (30 USC Chapter 3A) provided for leasing of some non-metallic materials; and the Multiple Mineral Development Act of 1954 (30 USC
Chapter 12) allowed simultaneous use of public land for mining under the mining laws and for lease operation under the mineral leasing
laws. Additionally, the Multiple Surface Use Act of 1955 (30 USC 611-615) made “common variety” materials non-locatable; the
Geothermal Steam Act of 1970 (30 USC Chapter 23) provided for leasing of geothermal resources; and the Federal Land Policy and Management
Act of 1976 (the BLM Organic Act, 43 USC Chapter 35) granted the Secretary of the Interior broad authority to manage public lands. Most
details regarding procedures for locating claims on Federal lands have been left to individual states, providing that state laws do not
conflict with Federal laws (30 USC 28; 43 CFR 3831.1).
Mineral deposits are located
either by lode or placer claims (43 CFR 3840). The locator must decide whether a lode or placer claim should be used for a given material;
the decision is not always easy but is critical. A lode claim is void if used to acquire a placer deposit, and a placer claim is void
if used for a lode deposit. The 1872 Federal law requires a lode claim for “veins or lodes of quartz or other rock in place”
(30 USC 26; 43 CFR 3841.1), and a placer claim for all “forms of deposit, excepting veins of quartz or other rock in place”
(30 USC 35). The maximum size of a lode claim is 457 m (1,500 ft) in length and 183 m (600 ft) in width, whereas an individual or company
can locate a placer claim as much as 8 hectares (20 acres) in area.
Claims may be patented or
unpatented. A patented claim is a lode or placer claim or mill site for which a patent has been issued by the Federal Government, whereas
an unpatented claim means a lode or placer claim, tunnel right or mill site located under the Federal (30 USC) act, for which a patent
has not been issued.
Information in this section
is sourced from Papke and Davis (2019).
About 85% of the land in
Nevada is controlled by the Federal Government; most of this land is administered by the BLM, the US Forest Service (USFS), the US Department
of Energy (DOE), or the US Department of Defence (DOD). Much of the land controlled by the BLM and the USFS is open to prospecting and
claim location.
| Effective Date: May 31st, 2022 | | 16 |
| Technical Report - Mineral Resource Estimate Reward Project, Nye County, Nevada, USA |
Figure 4.1. Project Location Plan.
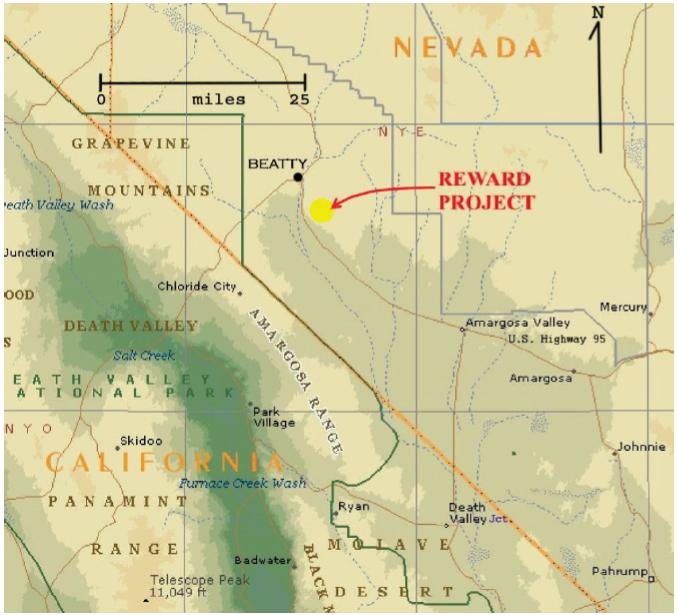
Note: Figure prepared by Lycopodium, 2019.
Bureau of Land Management
regulations regarding surface disturbance and reclamation require that a notice be submitted to the appropriate BLM Field Office for exploration
activities in which five acres or fewer are proposed for disturbance (43 CFR 3809.1-1 through 3809.1-4). A Federal Plan of Operations
is needed for all mining and processing activities, plus all activities exceeding five acres of proposed disturbance. A Plan of Operations
is also needed for any bulk sampling in which 1,000 or more tons of presumed mineralized material are proposed for removal (43 CFR 3802.1
through 3802.6, 3809.1-4, 3809.1-5). The BLM also requires the posting of bonds for reclamation for any surface disturbance caused by
more than casual use (43 CFR 3809.500 through 3809.560). The USFS has regulations regarding land disturbance in forest lands (36 CFR Subpart
A). Both agencies also have regulations pertaining to land disturbance in proposed wilderness areas.
| Effective Date: May 31st, 2022 | | 17 |
| Technical Report - Mineral Resource Estimate Reward Project, Nye County, Nevada, USA |
| 4.2.3 | Environmental Regulations |
Information in this section
is sourced from Papke and Davis (2019).
All surface management activities,
including reclamation, must comply with all pertinent Federal laws and regulations, and all applicable State environmental laws and regulations.
The fundamental requirement, implemented in 43 CFR 3809, is that all hard-rock mining under a Plan of Operations or Notice on the public
lands must prevent unnecessary or undue degradation. The Plan of Operations and any modifications to the approved Plan of Operations must
meet the requirement to prevent unnecessary or undue degradation.
Authorization to allow the
release of effluents into the environment must be in compliance with the Clean Water Act, Safe Drinking Water Act, Endangered Species
Act, and other applicable Federal and State environmental laws, consistent with BLM’s multiple-use responsibilities under the Federal
Land Policy and Management Act and fully reviewed in the appropriate National Environmental Policy Act (NEPA) document.
Information in this section
is sourced from the State of Nevada Water Resources and the US Department of the Interior Bureau of Reclamation websites.
Allocation of water rights
in Nevada uses two principles, prior appropriation, and beneficial use. Prior appropriation (also known as the "first in time, first
in right") allows for the orderly use of the state's water resources by granting priority to senior water rights. This concept ensures
that senior users are protected, even as new uses for water are allocated. Under the Revised Nevada Statutes (Chapters 533 and 534), all
water can be appropriated for beneficial use. Irrigation, mining, recreation, commercial/industrial and municipal uses are examples of
beneficial uses.
Water supplied by the Colorado
River is managed and operated under numerous compacts, federal laws, court decisions and decrees, contracts, and regulatory guidelines
collectively known as the "Law of the River." This collection of documents apportions the water and regulates the use and management
of the Colorado River among the seven basin states (Wyoming, Colorado, Utah, New Mexico, California, Nevada and Arizona) and Mexico.
The primary document is the 1922 Colorado River Compact.
Canyon Resources Corporation
(Canyon Resources), CR Reward’s predecessor, concluded lease agreements to four unpatented lode claims blocks from private owners
in 2004 and 2005.
| Effective Date: May 31st, 2022 | | 18 |
| Technical Report - Mineral Resource Estimate Reward Project, Nye County, Nevada, USA |
In 2006, Canyon Resources
completed the acquisition of six patented placer claims from Barrick Gold Corporation (Barrick). Canyon Resources also staked 99 new unpatented
lode claims during 2005 and 2006.
In 2008, Canyon Resources
assigned all of the patented and unpatented claims comprising the Project to CR Reward, which was subsequently converted into a Nevada
limited liability company. CR Reward holds a 100% interest in the mineral claims that form the Project, including 99 unpatented lode mineral
claims and 6 patented placer claims (Table 4.1). The remaining 22 unpatented lode and placer claims are held through a number of lease
agreements (Table 4.1).
On June 13th,
2022, Augusta acquired the Reward Project (Reward or the Project), from Waterton Nevada Splitter LLC (Waterton) by the purchase of CR
Reward. Upon closing of the transaction, Waterton received USD$12.5 million cash and USD$15 million comprised of 7,800,000 Augusta shares,
with the remaining payable at the time of Augusta’s next equity financing, in cash or shares, providing the additional amount of
shares does not result in Waterton owning more than 9.99% of Augusta’s issued and outstanding shares. In addition, USD$17.5 million
cash is to be paid within 90 days of closing of the transaction (Augusta Gold Corp., 2022).
The Project consists of 121
unpatented Bureau of Land Management (BLM) placer and lode mining claims and six patented placer mining claims (Jensen, 2022a,b,c,d),
totalling approximately 2,333 net acres (Table 4.1). Figure 4.2 is an overview plan showing the entire package of claim locations. Figures
4.3 show details of the mineral claims in relation to the main mineralized zones at the Reward Project.
BLM and tax payments are
up to date as of the effective date of this report.
Only patented claims have
been legally surveyed.
| 4.4.2 | Claim Retention Obligations |
Under U.S. mining law, claims
may be renewed annually for an unlimited number of years upon a small payment per claim (currently $165 per claim due to the BLM and an
aggregate $1,502 due to Nye County) and the same claim status—whether lode or placer—may be used for exploration or exploitation
of the lodes or placers.
State, Federal and local
regulations involving environmental, mining and business activities must also be followed.
| Effective Date: May 31st, 2022 | | 19 |
| Technical Report - Mineral Resource Estimate Reward Project, Nye County, Nevada, USA |
Table 4.1. Summary of the Reward Project Claims.
| Claim
Name |
BLM
NMC#/
Parcel # |
Claim
Type |
Location/
Section
Number |
Area, Acres
(nominal
Number
Unless
patented) |
Control (% owned,
or name of lessor) |
Year
Staked or
Patented |
Taxes or BLM
Rentals Paid
Until |
| American |
000-000-97 |
Patented placer |
1 & 2 |
40 |
100% CR Reward LLC |
1916 |
31 Aug 2022 |
| Pentellic |
000-000-97 |
Patented placer |
2 |
20 |
100% CR Reward LLC |
1916 |
31 Aug 2022 |
| Regius |
000-000-97 |
Patented placer |
1 & 2 |
60 |
100% CR Reward LLC |
1916 |
31 Aug 2022 |
| Marion |
000-000-97 |
Patented placer |
2 |
40 |
100% CR Reward LLC |
1916 |
31 Aug 2022 |
| Valencia |
000-000-97 |
Patented placer |
2 |
20 |
100% CR Reward LLC |
1923 |
31 Aug 2022 |
| Trinity |
000-000-97 |
Patented placer |
1 & 2 |
40 |
100% CR Reward LLC |
1925 |
31 Aug 2022 |
| Sunshine |
NMC27580 |
Unpatented lode |
2 |
20.66 |
Connolly/Webster leases |
1957 |
31 Aug 2022 |
| Reward |
NMC27581 |
Unpatented lode |
2 & 3 |
20.66 |
Connolly/Webster leases |
1957 |
31 Aug 2022 |
| Hardway |
NMC853089 |
Unpatented lode |
2 |
20.66 |
Orser-McFall lease |
2003 |
31 Aug 2022 |
| Bull Moose #1 |
NMC855150 |
Unpatented lode |
2 & 3 |
12.39 |
Orser-McFall lease |
2003 |
31 Aug 2022 |
| Bull Moose #2 |
NMC855151 |
Unpatented lode |
2 & 3 |
12.39 |
Orser-McFall lease |
2003 |
31 Aug 2022 |
| Bull Moose #3 |
NMC855152 |
Unpatented lode |
2 |
11.02 |
Orser-McFall lease |
2003 |
31 Aug 2022 |
| Bull Moose #4 |
NMC862531 |
Unpatented lode |
2 |
11.02 |
Orser-McFall lease |
2004 |
31 Aug 2022 |
| Bull Moose #5 |
NMC855153 |
Unpatented lode |
2 |
4.13 |
Orser-McFall lease |
2003 |
31 Aug 2022 |
| Bull Moose #6 |
NMC855154 |
Unpatented lode |
2 |
13.77 |
Orser-McFall lease |
2003 |
31 Aug 2022 |
| Reward South #1 |
NMC868938 |
Unpatented lode |
2 & 3 |
20.66 |
Orser-McFall lease |
2004 |
31 Aug 2022 |
| Reward South #2 |
NMC868939 |
Unpatented lode |
2 & 3 |
20.66 |
Orser-McFall lease |
2004 |
31 Aug 2022 |
| McOrser |
NMC870349 |
Unpatented lode |
2 |
20.66 |
Orser-McFall lease |
2004 |
31 Aug 2022 |
| April Gold Ace |
NMC871261 |
Unpatented lode |
3 |
20.66 |
Orser-McFall lease |
2004 |
31 Aug 2022 |
| Bull Moose #9 |
NMC871255 |
Unpatented placer |
2 |
11.47 |
Orser-McFall lease |
2004 |
31 Aug 2022 |
| Bull Moose #10 |
NMC871256 |
Unpatented placer |
2 |
11.47 |
Orser-McFall lease |
2004 |
31 Aug 2022 |
| Bull Moose #11 |
NMC871257 |
Unpatented placer |
2 |
11.47 |
Orser-McFall lease |
2004 |
31 Aug 2022 |
| Bull Moose #12 |
NMC871258 |
Unpatented placer |
2 & 3 |
11.47 |
Orser-McFall lease |
2004 |
31 Aug 2022 |
| Bull Moose #13 |
NMC871259 |
Unpatented placer |
2, 3 & 10 |
11.47 |
Orser-McFall lease |
2004 |
31 Aug 2022 |
| Bull Moose #14 |
NMC871260 |
Unpatented placer |
2, 3, 34, 35 |
19.97 |
Orser-McFall lease |
2004 |
31 Aug 2022 |
| Good Hope |
NMC853090 |
Unpatented lode |
2 |
20.66 |
Orser/McFall/Webster Lease |
2003 |
31 Aug 2022 |
| Double RS |
NMC125600 |
Unpatented placer |
3 & 10 |
80 |
VanMeeteren et al lease |
1966 |
31 Aug 2022 |
| Durlers Hope |
NMC124956 |
Unpatented placer |
3 |
40 |
VanMeeteren et al lease |
1966 |
31 Aug 2022 |
| RP 1 |
NMC915581 |
Unpatented lode |
33 |
20.66 |
100% CR Reward LLC |
2005 |
31 Aug 2022 |
| RP 2 |
NMC915582 |
Unpatented lode |
33 & 34 |
20.66 |
100% CR Reward LLC |
2005 |
31 Aug 2022 |
| RP 3 |
NMC915583 |
Unpatented lode |
34 |
20.66 |
100% CR Reward LLC |
2005 |
31 Aug 2022 |
| RP 4 |
NMC915584 |
Unpatented lode |
34 |
20.66 |
100% CR Reward LLC |
2005 |
31 Aug 2022 |
| RP 5 |
NMC915585 |
Unpatented lode |
34 |
20.66 |
100% CR Reward LLC |
2005 |
31 Aug 2022 |
| RP 6 |
NMC915586 |
Unpatented lode |
34 |
20.66 |
100% CR Reward LLC |
2005 |
31 Aug 2022 |
| RP 7 |
NMC915587 |
Unpatented lode |
34 |
20.66 |
100% CR Reward LLC |
2005 |
31 Aug 2022 |
| RP 8 |
NMC915588 |
Unpatented lode |
34 |
20.66 |
100% CR Reward LLC |
2005 |
31 Aug 2022 |
| RP 9 |
NMC915589 |
Unpatented lode |
34 |
20.66 |
100% CR Reward LLC |
2005 |
31 Aug 2022 |
| RP 10 |
NMC915590 |
Unpatented lode |
34 |
20.66 |
100% CR Reward LLC |
2005 |
31 Aug 2022 |
| RP 11 |
NMC915591 |
Unpatented lode |
34 |
20.66 |
100% CR Reward LLC |
2005 |
31 Aug 2022 |
| RP 12 |
NMC915592 |
Unpatented lode |
34 |
20.66 |
100% CR Reward LLC |
2005 |
31 Aug 2022 |
| RP 13 |
NMC915593 |
Unpatented lode |
34 |
20.66 |
100% CR Reward LLC |
2005 |
31 Aug 2022 |
| RP 14 |
NMC915594 |
Unpatented lode |
34 |
20.66 |
100% CR Reward LLC |
2005 |
31 Aug 2022 |
| Effective Date: May 31st, 2022 | | 20 |
| Technical Report - Mineral Resource Estimate Reward Project, Nye County, Nevada, USA |
| Claim
Name |
BLM
NMC#/
Parcel # |
Claim
Type |
Location/
Section
Number |
Area, Acres
(nominal
Number
Unless
patented) |
Control (% owned,
or name of lessor) |
Year
Staked or
Patented |
Taxes or BLM
Rentals Paid
Until |
| RP 15 |
NMC915595 |
Unpatented lode |
34 |
20.66 |
100% CR Reward LLC |
2005 |
31 Aug 2022 |
| RP 16 |
NMC915596 |
Unpatented lode |
34 |
20.66 |
100% CR Reward LLC |
2005 |
31 Aug 2022 |
| RP 17 |
NMC915597 |
Unpatented lode |
34 & 35 |
20.66 |
100% CR Reward LLC |
2005 |
31 Aug 2022 |
| RP 18 |
NMC915598 |
Unpatented lode |
34 & 35 |
20.66 |
100% CR Reward LLC |
2005 |
31 Aug 2022 |
| RP 19 |
NMC915599 |
Unpatented lode |
35 |
20.66 |
100% CR Reward LLC |
2005 |
31 Aug 2022 |
| RP 20 |
NMC915600 |
Unpatented lode |
35 |
20.66 |
100% CR Reward LLC |
2005 |
31 Aug 2022 |
| RP 21 |
NMC915601 |
Unpatented lode |
3, 4 & 33 |
20.66 |
100% CR Reward LLC |
2005 |
31 Aug 2022 |
| RP 22 |
NMC915602 |
Unpatented lode |
3 & 4 |
20.66 |
100% CR Reward LLC |
2005 |
31 Aug 2022 |
| RP 23 |
NMC915603 |
Unpatented lode |
3, 33,34 |
20.66 |
100% CR Reward LLC |
2005 |
31 Aug 2022 |
| RP 24 |
NMC915604 |
Unpatented lode |
3 |
20.66 |
100% CR Reward LLC |
2005 |
31 Aug 2022 |
| RP 25 |
NMC915605 |
Unpatented lode |
3 & 34 |
20.66 |
100% CR Reward LLC |
2005 |
31 Aug 2022 |
| RP 26 |
NMC915606 |
Unpatented lode |
3 |
20.66 |
100% CR Reward LLC |
2005 |
31 Aug 2022 |
| RP 27 |
NMC915607 |
Unpatented lode |
3 & 34 |
20.66 |
100% CR Reward LLC |
2005 |
31 Aug 2022 |
| RP 28 |
NMC915608 |
Unpatented lode |
3 |
20.66 |
100% CR Reward LLC |
2005 |
31 Aug 2022 |
| RP 29 |
NMC915609 |
Unpatented lode |
3 & 34 |
20.66 |
100% CR Reward LLC |
2005 |
31 Aug 2022 |
| RP 30 |
NMC915610 |
Unpatented lode |
3 |
20.66 |
100% CR Reward LLC |
2005 |
31 Aug 2022 |
| RP 31 |
NMC915611 |
Unpatented lode |
3 & 34 |
20.66 |
100% CR Reward LLC |
2005 |
31 Aug 2022 |
| RP 32 |
NMC915612 |
Unpatented lode |
3 |
20.66 |
100% CR Reward LLC |
2005 |
31 Aug 2022 |
| RP 33 |
NMC915613 |
Unpatented lode |
3 & 34 |
20.66 |
100% CR Reward LLC |
2005 |
31 Aug 2022 |
| RP 34 |
NMC915614 |
Unpatented lode |
3 |
20.66 |
100% CR Reward LLC |
2005 |
31 Aug 2022 |
| RP 35 |
NMC915615 |
Unpatented lode |
3 & 34 |
20.66 |
100% CR Reward LLC |
2005 |
31 Aug 2022 |
| RP 36 |
NMC915616 |
Unpatented lode |
3 |
20.66 |
100% CR Reward LLC |
2005 |
31 Aug 2022 |
| RP 37 |
NMC915617 |
Unpatented lode |
3 & 34 |
20.66 |
100% CR Reward LLC |
2005 |
31 Aug 2022 |
| RP 38 |
NMC915618 |
Unpatented lode |
3 |
20.66 |
100% CR Reward LLC |
2005 |
31 Aug 2022 |
| RP 39 |
NMC915619 |
Unpatented lode |
2, 3 & 34 |
20.66 |
100% CR Reward LLC |
2005 |
31 Aug 2022 |
| RP 40 |
NMC915620 |
Unpatented lode |
2 & 3 |
20.66 |
100% CR Reward LLC |
2005 |
31 Aug 2022 |
| RP 41 |
NMC915621 |
Unpatented lode |
2, 34,35 |
20.66 |
100% CR Reward LLC |
2005 |
31 Aug 2022 |
| RP 42 |
NMC915622 |
Unpatented lode |
2 & 35 |
20.66 |
100% CR Reward LLC |
2005 |
31 Aug 2022 |
| RP 43 |
NMC915623 |
Unpatented lode |
3 & 4 |
20.66 |
100% CR Reward LLC |
2005 |
31 Aug 2022 |
| RP 44 |
NMC915624 |
Unpatented lode |
3 |
20.66 |
100% CR Reward LLC |
2005 |
31 Aug 2022 |
| RP 45 |
NMC915625 |
Unpatented lode |
3 |
20.66 |
100% CR Reward LLC |
2005 |
31 Aug 2022 |
| RP 46 |
NMC915626 |
Unpatented lode |
3 & 10 |
20.66 |
100% CR Reward LLC |
2005 |
31 Aug 2022 |
| RP 47 |
NMC915627 |
Unpatented lode |
3 |
20.66 |
100% CR Reward LLC |
2005 |
31 Aug 2022 |
| RP 48 |
NMC915628 |
Unpatented lode |
3 & 10 |
20.66 |
100% CR Reward LLC |
2005 |
31 Aug 2022 |
| RP 49 |
NMC915629 |
Unpatented lode |
3 |
20.66 |
100% CR Reward LLC |
2005 |
31 Aug 2022 |
| RP 50 |
NMC915630 |
Unpatented lode |
3 & 10 |
20.66 |
100% CR Reward LLC |
2005 |
31 Aug 2022 |
| RP 51 |
NMC915631 |
Unpatented lode |
3 |
20.66 |
100% CR Reward LLC |
2005 |
31 Aug 2022 |
| RP 52 |
NMC915632 |
Unpatented lode |
3 & 10 |
20.66 |
100% CR Reward LLC |
2005 |
31 Aug 2022 |
| RP 53 |
NMC915633 |
Unpatented lode |
3 |
20.66 |
100% CR Reward LLC |
2005 |
31 Aug 2022 |
| RP 54 |
NMC915634 |
Unpatented lode |
3 |
20.66 |
100% CR Reward LLC |
2005 |
31 Aug 2022 |
| RP 55 |
NMC915635 |
Unpatented lode |
2 & 3 |
20.66 |
100% CR Reward LLC |
2005 |
31 Aug 2022 |
| RP 56 |
NMC915636 |
Unpatented lode |
10 |
20.66 |
100% CR Reward LLC |
2005 |
31 Aug 2022 |
| RP 57 |
NMC915637 |
Unpatented lode |
3 & 10 |
20.66 |
100% CR Reward LLC |
2005 |
31 Aug 2022 |
| RP 58 |
NMC915638 |
Unpatented lode |
10 |
20.66 |
100% CR Reward LLC |
2005 |
31 Aug 2022 |
| Effective Date: May 31st, 2022 | | 21 |
| Technical Report - Mineral Resource Estimate Reward Project, Nye County, Nevada, USA |
| Claim Name |
BLM NMC#/
Parcel # |
Claim Type |
Location/
Section
Number |
Area,
Acres
(nominal
Number
Unless
patented) |
Control (% owned,
or name of lessor) |
Year
Staked or
Patented |
Taxes
or BLM
Rentals Paid
Until |
| RP 59 |
NMC915639 |
Unpatented lode |
3 & 10 |
20.66 |
100% CR Reward LLC |
2005 |
31 Aug 2022 |
| RP 60 |
NMC915640 |
Unpatented lode |
10 |
20.66 |
100% CR Reward LLC |
2005 |
31 Aug 2022 |
| RP 61 |
NMC915641 |
Unpatented lode |
2, 3, 10, 11 |
20.66 |
100% CR Reward LLC |
2005 |
31 Aug 2022 |
| RP 62 |
NMC915642 |
Unpatented lode |
10 & 11 |
20.66 |
100% CR Reward LLC |
2005 |
31 Aug 2022 |
| RP 63 |
NMC915643 |
Unpatented lode |
2 & 11 |
20.66 |
100% CR Reward LLC |
2005 |
31 Aug 2022 |
| RP 64 |
NMC915644 |
Unpatented lode |
11 |
20.66 |
100% CR Reward LLC |
2005 |
31 Aug 2022 |
| RP 65 |
NMC915645 |
Unpatented lode |
2 & 11 |
20.66 |
100% CR Reward LLC |
2005 |
31 Aug 2022 |
| RP 66 |
NMC915646 |
Unpatented lode |
11 |
20.66 |
100% CR Reward LLC |
2005 |
31 Aug 2022 |
| RP 67 |
NMC915647 |
Unpatented lode |
2 & 11 |
20.66 |
100% CR Reward LLC |
2005 |
31 Aug 2022 |
| RP 68 |
NMC915648 |
Unpatented lode |
11 |
20.66 |
100% CR Reward LLC |
2005 |
31 Aug 2022 |
| RP 69 |
NMC915649 |
Unpatented lode |
2 & 11 |
20.66 |
100% CR Reward LLC |
2005 |
31 Aug 2022 |
| RP 70 |
NMC915650 |
Unpatented lode |
11 |
20.66 |
100% CR Reward LLC |
2005 |
31 Aug 2022 |
| RP 71 |
NMC915651 |
Unpatented lode |
2 & 11 |
20.66 |
100% CR Reward LLC |
2005 |
31 Aug 2022 |
| RP 72 |
NMC915652 |
Unpatented lode |
11 |
20.66 |
100% CR Reward LLC |
2005 |
31 Aug 2022 |
| RP 73 |
NMC915653 |
Unpatented lode |
2 |
20.66 |
100% CR Reward LLC |
2005 |
31 Aug 2022 |
| RP 74 |
NMC915654 |
Unpatented lode |
2 |
20.66 |
100% CR Reward LLC |
2005 |
31 Aug 2022 |
| RP 75 |
NMC915655 |
Unpatented lode |
2 |
20.66 |
100% CR Reward LLC |
2005 |
31 Aug 2022 |
| RP 76 |
NMC915656 |
Unpatented lode |
3 |
5.17 |
100% CR Reward LLC |
2005 |
31 Aug 2022 |
| RP 77 |
NMC915657 |
Unpatented lode |
10 |
20.66 |
100% CR Reward LLC |
2005 |
31 Aug 2022 |
| RP 78 |
NMC915658 |
Unpatented lode |
10 |
20.66 |
100% CR Reward LLC |
2005 |
31 Aug 2022 |
| RP 79 |
NMC915659 |
Unpatented lode |
9 & 10 |
20.66 |
100% CR Reward LLC |
2005 |
31 Aug 2022 |
| RP 80 |
NMC915660 |
Unpatented lode |
10 |
20.66 |
100% CR Reward LLC |
2005 |
31 Aug 2022 |
| RP 81 |
NMC915661 |
Unpatented lode |
9 & 16 |
20.66 |
100% CR Reward LLC |
2005 |
31 Aug 2022 |
| RP 82 |
NMC915662 |
Unpatented lode |
9 |
20.66 |
100% CR Reward LLC |
2005 |
31 Aug 2022 |
| RP 83 |
NMC915663 |
Unpatented lode |
2 |
20.66 |
100% CR Reward LLC |
2005 |
31 Aug 2022 |
| RP 84 |
NMC915664 |
Unpatented lode |
2 |
20.66 |
100% CR Reward LLC |
2005 |
31 Aug 2022 |
| RP 85 |
NMC938644 |
Unpatented lode |
10 |
20.66 |
100% CR Reward LLC |
2006 |
31 Aug 2022 |
| RP 86 |
NMC938645 |
Unpatented lode |
10 |
20.66 |
100% CR Reward LLC |
2006 |
31 Aug 2022 |
| RP 87 |
NMC938646 |
Unpatented lode |
10 |
20.66 |
100% CR Reward LLC |
2006 |
31 Aug 2022 |
| RP 88 |
NMC938647 |
Unpatented lode |
10 & 11 |
20.66 |
100% CR Reward LLC |
2006 |
31 Aug 2022 |
| RP 89 |
NMC938648 |
Unpatented lode |
11 |
20.66 |
100% CR Reward LLC |
2006 |
31 Aug 2022 |
| RP 90 |
NMC938649 |
Unpatented lode |
11 |
20.66 |
100% CR Reward LLC |
2006 |
31 Aug 2022 |
| RP 91 |
NMC938650 |
Unpatented lode |
11 |
20.66 |
100% CR Reward LLC |
2006 |
31 Aug 2022 |
| RP 92 |
NMC938651 |
Unpatented lode |
11 |
20.66 |
100% CR Reward LLC |
2006 |
31 Aug 2022 |
| RP 93 |
NMC938652 |
Unpatented lode |
11 |
20.66 |
100% CR Reward LLC |
2006 |
31 Aug 2022 |
| RP 94 |
NMC938653 |
Unpatented lode |
35 |
20.66 |
100% CR Reward LLC |
2006 |
31 Aug 2022 |
| RP 95 |
NMC938654 |
Unpatented lode |
35 |
20.66 |
100% CR Reward LLC |
2006 |
31 Aug 2022 |
| RP 96 |
NMC938655 |
Unpatented lode |
2 & 35 |
20.66 |
100% CR Reward LLC |
2006 |
31 Aug 2022 |
| RP 97 |
NMC938656 |
Unpatented lode |
2 |
10.33 |
100% CR Reward LLC |
2006 |
31 Aug 2022 |
| RP 98 |
NMC938657 |
Unpatented lode |
2 |
2.58 |
100% CR Reward LLC |
2006 |
31 Aug 2022 |
| RP 99 |
NMC938658 |
Unpatented lode |
2 |
6.89 |
100% CR Reward LLC |
2006 |
31 Aug 2022 |
| Effective Date: May 31st, 2022 | | 22 |
| Technical Report - Mineral Resource Estimate Reward Project, Nye County, Nevada, USA |
Figure 4.2. CR Reward, LLC Controlled Mineral
Claims at Reward Project.
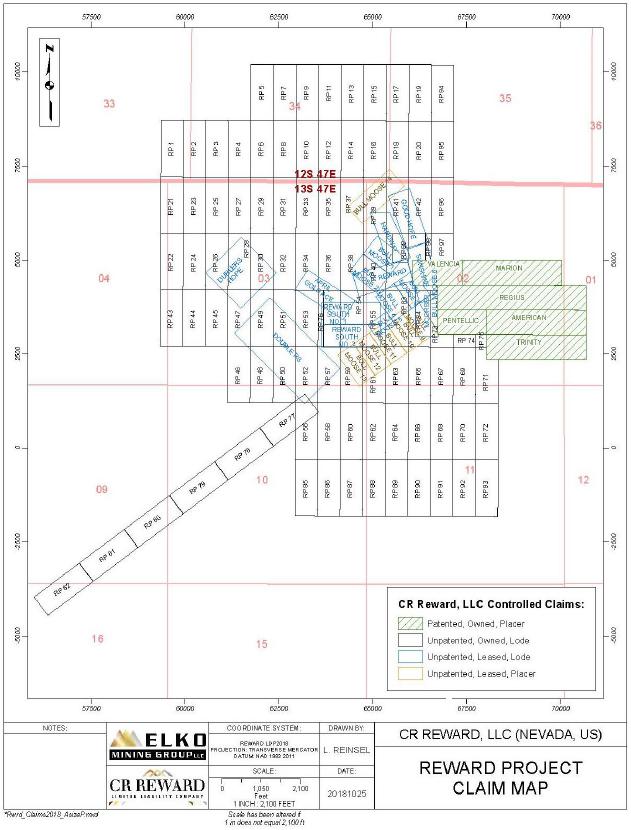
Note: Figure prepared
by Lycopodium, 2019.
| Effective Date: May 31st, 2022 | | 23 |
| Technical Report - Mineral Resource Estimate Reward Project, Nye County, Nevada, USA |
Figure 4.3. Detail of Reward Claims and Mineralized
Zones for the Core Area.

Note: Figure prepared
by Lycopodium, 2019.
| Effective Date: May 31st, 2022 | | 24 |
| Technical Report - Mineral Resource Estimate Reward Project, Nye County, Nevada, USA |
No companies or entities
are known that have back in or option rights on the mineral claims.
The claims listed in Table
4.1 have not been legally surveyed, except that the patented claims were legally surveyed prior to the date of patenting. The unpatented
lode claims are readily identifiable and locatable in the field, due to distinctive topographic features and the near absence of vegetation
(CAM, 2012).
| 4.5 | Mineral Lease Agreements |
Several blocks of unpatented
claims (22 in total) are leased by CR Reward from underlying owners (refer to Table 4.1).
This lease agreement (the
Connolly Lease), effective as of September 28th, 2004, covers a two-third interest in each of the Sunshine and Reward
unpatented lode claims (collectively, the Connolly Claims). The Connolly Lease is for an initial term of 20 years and continues so long
thereafter as the Project remains in commercial production. A 3% NSR royalty is payable on any minerals mined from the Connolly Claims,
but is reduced to 2% due to the fact that CR Reward only owns a two-third interest in the Connolly Claims. Annual advance minimum royalty
payments are payable under the Connolly Lease in an amount equal to $10,000 per year. These annual advance minimum royalty payments shall
be applied toward, credited against and fully deductible from earned mineral production royalty payments due from the Connolly Claims.
This lease agreement (the
Webster lease), effective as of November 9, 2004 (as amended on November 9th, 2004 and November 8th,
2006), covers a one-third interest in each of the Sunshine and Reward unpatented lode claims and a half interest in the Good Hope unpatented
lode claim (collectively, the Webster Claims). The Webster Lease is for an initial term of 20 years and continues so long thereafter as
the Project remains in commercial production. A 3% NSR royalty is payable on any minerals mined from the Webster Claims, but is (i) reduced
to 1% on the Sunshine and Reward claims due to the fact that the lessee only owns a one-third interest, and (ii) reduced to 1.5%
on the Good Hope claim due to the fact that CR Reward only owns a half interest in this claim. Annual advance minimum royalty payments
are payable under the Webster Lease in an amount equal to $7,500 per year. The annual advance minimum royalty payments paid in any given
year may be applied toward, credited against and fully deductible from any earned mineral production royalty payments due on the Webster
Claims during the calendar year in which such annual advance minimum royalty payments are due.
| Effective Date: May 31st, 2022 | | 25 |
| Technical Report - Mineral Resource Estimate Reward Project, Nye County, Nevada, USA |
This lease agreement (the
Orser–McFall Lease), effective as of February 5, 2005 (as amended on August 18th, 2005 and November 14th,
2006), applies to 12 unpatented lode and six unpatented placer mining claims (collectively, the Orser–McFall Claims). The Orser–McFall
Lease is for an initial term of 20 years and continues so long thereafter as the Project remains in commercial production. The lessors
under the Orser–McFall Lease own 100% of the Orser–McFall Claims, except for the Good Hope claim, in which they own a half
interest (the other half being owned by the Daniel D. Webster Living Trust and leased to CR Reward pursuant to the Webster Lease). A 3%
NSR royalty is payable on minerals mined from the Orser–McFall Claims, but is reduced to 1.5% on the Good Hope claim due to the
fact that the lessee only owns a half interest in that claim. Annual advance minimum royalty payments are payable under the Orser–McFall
Lease in an amount equal to $20,000 per year. These annual advance minimum royalty payments shall be applied toward, credited against
and fully deductible from earned mineral production royalty payments due from the Orser-McFall Claims.
| 4.5.4 | Van Meeteren et al Lease |
This lease agreement (the
Van Meeteren Lease), effect as of December 1st, 2011 (applies to the Double RS and the Durlers Hope unpatented placer
claims (the Van Meeteren Claims). The Van Meeteren Lease is for an initial term of 20 years and continues so long thereafter as the Project
remains in commercial production or CR Reward is actively conducting exploration, development, reclamation or remediation operations.
A 3% NSR royalty is payable on minerals mined from the Van Meeteren Claims. Annual advance minimum royalty payments are payable under
the Van Meeteren Lease in an amount equal to $15/acre from 2011 through 2020, for a total of $1,800 per year, and $20/acre from and after
2021, for a total of $2,400 per year. These annual advance minimum royal payments are recoupable from earned mineral production royalties.
All payments described above have been timely paid by CR Reward and its predecessor and the agreements are all in good standing.
The Project is not subject
to any other back-in rights payments, agreements or encumbrances.
The Project area mainly consists
of Federal public domain lands administered by the BLM. There are no State or private tracts within the Project area, except the six patented
claims owned by CR Reward, all of which carry surface and mineral rights ownership.
| Effective Date: May 31st, 2022 | | 26 |
| Technical Report - Mineral Resource Estimate Reward Project, Nye County, Nevada, USA |
CR Reward has the right to
use 391,494 m3 (317.39 acre-ft) of water annually under Application No. 61412, Certificate No. 16384 and Permit No. 76390.
The Amargosa River basin
is an enclosed basin, and the water rights are thus not affected by the Colorado River Compact or other agreements.
| 4.9 | Permitting Considerations |
The current Project area
includes public and private lands within Nye County, Nevada. The Project, therefore, falls under the jurisdiction and permitting requirements
of Nye County, the State of Nevada (primarily the BMRR) and the BLM.
The following permits and
authorizations were granted to CR Reward:
| · | Plan of Operations authorized
under N-82840. |
| · | Water Pollution Control Permit
(WPCP); WPCP NEV2007101. |
| · | Water rights permitted by Nevada
Division of Water Resources (NDWR) under Mining, Milling, & Domestic permit 76390 and permit 89658. |
| · | Mining reclamation permit granted
by the Bureau of Mining Regulation and Reclamation (BMRR) under mine site permit #0300. |
| · | Nevada Bureau of Air Pollution
Control (BAPC) authorized Class II Air Quality permit AP1041-2492. |
The reader is referred to
Evans et al. (2019) for additional information regarding permitting considerations for mining activities at the Project. Regarding exploration
activities, during early phases of exploration, when surface disturbance is generally limited, authorization from the BLM is conditionally
granted under a notice (40 CFR § 3890.21). There are currently no exploration notices associated with the Project and none are likely
to be granted given the Project has a mine plan of operations (MPO) that was granted in 2020.
| 4.10 | Environmental Considerations |
Environmental, social and
cultural studies were conducted by CR Reward as part of its permitting efforts.
Much of this information
was provided to the BLM as part of the Reward Project Updated Plan of Operations and Reclamation Plan (BLM Case File Serial Number N-82840)
and the accompanying Environmental Assessment (EA; DOI-BLM-NV-S030-2020-0006-EA).
| Effective Date: May 31st, 2022 | | 27 |
| Technical Report - Mineral Resource Estimate Reward Project, Nye County, Nevada, USA |
Additional information, especially
with respect to hydrogeology and geochemistry, was developed and submitted to the BMRR as part of the Nevada Water Pollution Control Permit
(WPCP) application. Both the EA and WPCP application include discussion of the potential impacts associated with project development,
none of which were found to be significant.
Studies completed have included
desktop reviews, and Project-specific data collection on the following: land status, soil surveys, air quality, cultural resources, Native
American religious concerns, water resources, vegetation, wildlife and special-status species.
Additional information regarding
environmental considerations at the Project is available in Evans et al. (2019).
| 4.11 | Comments on Property Description and Location |
CR Reward advised the QP
that the company is not aware of any existing environmental liabilities connected with the Project, except those relating to CR Reward’s
exploration and development activities, for which bonds have been posted.
There are currently no known
environmental issues that could materially impact CR Reward’s ability to extract the Mineral Resources or that would impact the
Mineral Resource estimates.
To the extent known, there
are no other significant factors and risks that may affect access, title, or the right or ability to perform work on the Project that
have not been discussed in this Report.
| 5 | Accessibility, Climate, Local Resources, Infrastructure and Physiography |
The Project lies 7 miles
southeast of Beatty, Nevada, about two miles east of US Highway 95 in Nye County. The Project can be accessed from Beatty by paved road
on Highway 95 followed by traveling two miles east on a gravel road. Several dirt roads diverge into various canyons of the Bare Mountains.
| 5.2 | Site Topography, Elevation and Vegetation |
The Project is situated in
the Amargosa Desert in southwestern Nevada on the southwestern flank of the Bare Mountains in the northern Amargosa Valley. It is located
on the western flank of the rugged north–south-trending Bare Mountains. The western flank drains into the Amargosa Desert, which
is drained by the ephemeral Amargosa River.
| Effective Date: May 31st, 2022 | | 28 |
| Technical Report - Mineral Resource Estimate Reward Project, Nye County, Nevada, USA |
Beatty, on the Amargosa River,
lies at 1,006 m (3,300 ft) elevation. Elevations in the Project area range from about 1,158 m (3,800 ft) to 1,311 m (4,300 ft).
Vegetation is sparse, consisting
mainly of creosote bush, (Larrea sp.), Mormon tea, (Ephedra sp.), and low shrubs, with occasional small barrel cacti (Ferocactus sp.).
A few mesquite trees (Prosopis sp.) occur within the overall Project boundary.
The climate is typical of
middle-elevation desert.
The area is highly arid,
with average annual precipitation of 10.4 cm (4.1 inches). During May to October, occasional thunderstorms may generate flash flooding
in the region. Trace snow falls in the winter months.
Temperatures range from winter
absolute lows of -12.2°C (10°F) to summer absolute highs of 43.3°C (110°F).
Operations are planned to
be conducted year-round.
| 5.4 | Local Resources and Infrastructure |
The Project is located seven
miles by road southeast of Beatty, a town of approximately 1,000 people that serves as a transit hub and service centre for travellers
between Las Vegas and Reno, and those going to Death Valley. Several motels and restaurants, gas stations, a post office, and several
small stores provide basic services.
The Project is currently
serviced by an existing 14.4/24.9 kV power line owned and operated by Valley Electric. A water well currently provides water for exploration
activities.
Project employees would likely
be recruited from the local area, including the communities of Beatty, Amargosa, and Pahrump, located within Nye County, and the regional
urban centre of Las Vegas, located within Clark County. There is available nearby accommodation to the Project site in Beatty and other
smaller communities
The Project has sufficient
land area, with adjacent public-domain lands also potentially available, to allow mine development, including space for the mining operations,
waste rock disposal facilities (WRDs), heap leach pads and processing plants.
| Effective Date: May 31st, 2022 | | 29 |
| Technical Report - Mineral Resource Estimate Reward Project, Nye County, Nevada, USA |
Table 6.1 summarizes the
Project history. A preliminary assessment was completed in 2005 (exact date is unknown), a prefeasibility study on January 26, 2006,
and a feasibility study on May 25, 2007. Subsequent to the 2007 feasibility study completion, CR Reward obtained the majority of
the required permits to support construction and operations. An updated feasibility study (the 2019 feasibility study; Lycopodium, 2019)
and a 2019 feasibility study technical report (Evans et al., 2019) were commissioned by CR Reward and are partly the basis for this Technical
Report. The authors are referring to these studies as historical; to be considered current, the studies completed in 2019 would need to
incorporate current pricing for major equipment, contract mining costs, construction costs, major consumables and labor costs.
The most extensive showing
within the Project is the 150 ft long Good Hope adit located near north end of the Hardway claim. A description of the Arista mine, credited
with shipping 1.25 st of ore grading over 1 oz/st Au just before World War II (Kral, 1951), appears to match the Good Hope adit where
a small glory hole and underlying raise were worked.
There are no formal production
records from the Project area, and there has been no modern production.
Table 6.1. Project Exploration History.
| Period |
Owner |
Operator |
Work
Performed |
| 1913 |
|
|
Gold discovered at Gold Ace property. |
| |
|
|
|
| pre-1942 |
|
|
Arista Mine (a.k.a. Good Hope?) Shipped 1.25 st of ore grading over 1 oz/st Au just before World War II. |
| |
|
|
|
| 1942–1957 |
|
|
District idle |
| |
|
|
|
| 1957–1962 |
|
|
Reward, Sunshine, Good Hope claims staked in 1957; Hardway claim staked 1962. |
| |
|
|
|
| c. 1970s |
Webster, Burt |
|
Acquired Reward claims |
| |
|
|
|
| 1976 |
Webster, Burt |
Galli Exploration Associates (Galli) |
Galli acquired an option on the Webster-Burt land.
Minor road construction and improvements. |
| |
|
|
|
| 1980 |
Teco Inc. (Teco) |
|
Teco acquired the Gold Ace property. |
| |
|
|
|
| mid-1980s |
Webster, Burt |
Optioned to St. Joe Minerals Corp. (St Joe) |
Carried out an extensive sampling program on the Gold Ace property in tandem with their exploration program in the Bullfrog mining district. |
| |
|
|
|
| 1985 |
Gexa Gold Corp. (Gexa) |
Gexa |
Gexa, successor company to Galli Exploration Associates, staked 10 claims next to Webster, Burt claim holdings. |
| Effective Date: May 31st, 2022 | | 30 |
| Technical Report - Mineral Resource Estimate Reward Project, Nye County, Nevada, USA |
| Period |
Owner |
Operator |
Work
Performed |
| 1987 |
Teco |
Homestake Mining Company (Homestake) |
Homestake leased the Teco land and drilled two vertical reverse circulation (RC) holes near the northwest and southwest edges of the Webster-Burt ground as part of a 4 RC hole, 1,210 ft rotary drill program (HMC 1 to 4), which probed pediment gravels for a large-tonnage conceptual target. No anomalous results were encountered in the from the four wide-spaced drill holes. |
| |
|
|
|
| 1987–1989 |
Teco (1987–1991)
Webster, Burt
(1991–1992) |
Gexa |
Drilling by Gexa included 16 RC holes for a total of 3,037 ft were completed along the north-south trending Good Hope vein/fault system, much of which is within the limits of the current Good Hope resource area. |
| |
|
|
|
| 1988–1990 |
Teco (1987–1991)
Webster, Burt
(1991–1992) |
Pathfinder Gold Corp. (Pathfinder) |
Pathfinder optioned the Teco ground, portions of which overlay the
southerly gravel-covered projection of the Reward fault, south of the Webster leased ground.
Pathfinder drill-tested these fault projections and added several holes
along drill fences between south Good Hope and south Gold Ace. A total of 33 RC and one partial core hole were drilled totaling 13,798
ft (excludes 43 ft due to an abandoned hole). |
| |
|
|
|
| 1990 |
Pathfinder |
Cloverleaf Gold Inc. (Cloverleaf) |
Pathfinder joint-ventured their interest in the TECO lease to Cloverleaf
in 1990.
Cloverleaf completed 49 shallow RC holes for 9,075 ft. All but five
Cloverleaf holes were targeted on historic mine workings at Gold Ace.
Cloverleaf surrendered their interest to Pathfinder in 1990. |
| |
|
|
|
| 1990 |
Pathfinder |
Bond Gold Exploration Inc. (Bond Gold) |
Airborne geophysics data collected over Gold Ace.
Bond Gold acquired by Lac Minerals Ltd. (Lac Minerals).
Property returned to Pathfinder. |
| |
|
|
|
| 1991 |
Teco |
Pathfinder |
In 1991, the availability of an option on the Reward property from
Gexa influenced Pathfinder's decision to re-evaluate Gold Ace in conjunction with a program at Good Hope. Pathfinder proceeded to acquire
the Reward property, stepped off south of the 1987-1989 Gexa drill pattern, and drilled into the present Reward gold resource south of
the saddle, on the Hardway, Reward, Bullmoose #3A and #4 claims.
Completed 17 holes (GA 91-1 to 91-17) for a total of 8,300 ft. Following
the 1991 drill program, Pathfinder surrendered all leases and withdrew from the district. |
| |
|
|
|
| 1992 |
Teco |
US Nevada Gold Search (USNGS) |
In 1992 a joint venture consisting of Siskon Corp., N.A. Degerstrom
Inc. and US Precious Metals (successor to GEXA), assumed GEXA's position at Reward.
USNGS drilled 7 RC holes (R-16 to R-22) for 2,119 ft, all of which
intersected mineralization along the Good Hope fault.
USNGS conducted no further work on the property. |
| |
|
|
|
| 1995 |
Teco
Webster, Burt |
USNGS |
USNGS sold the GEXA lode claims and assigned the Webster lease to Barrick. |
| Effective Date: May 31st, 2022 | | 31 |
| Technical Report - Mineral Resource Estimate Reward Project, Nye County, Nevada, USA |
| Period |
Owner |
Operator |
Work
Performed |
| 1995-1996 |
Barrick |
Barrick |
Negotiated a mining lease with Teco on the Gold Ace ground.
Staked 94 lode claims along extensions of the Reward and Gold Ace zones.
Completed a total of 88 RC holes and 3 core holes for 39,028 ft of
drilling across the property. |
| |
|
|
|
| 1998 |
Barrick |
Rayrock Mines Inc. (Rayrock) |
Rayrock acquired Barrick’s land package and began permitting of the Reward Mining property. |
| |
|
|
|
| 1999 |
Rayrock |
Glamis Gold Ltd. (Glamis Gold) |
Glamis Gold acquired Rayrock. |
| |
|
|
|
| 1998–2000 |
Glamis Gold |
Glamis Gold (Marigold Mining Company) |
Between 1998 and 2000, 79 RC holes (RE-001 to RE-79, including RE-026A) totalling 30,535 ft were completed by Marigold Mining, an affiliate of Rayrock and Glamis Gold. |
| |
|
|
|
| 2000 |
Glamis Gold |
Glamis |
Initiated the permitting process for eventual production but falling gold prices led to project suspension. |
| |
|
|
|
| 2004–2006 |
Canyon Resources Corp. (Canyon) |
Canyon |
Acquired the core of the current Project in 2004 through three mineral
leases with private owners for patented and unpatented mining claims.
Acquired six patented placer claims from Barrick in 2006.
Staked new unpatented lode and mill site claims between 2005 and 2007.
Completed a Pre-Feasibility study in January 2006.
Completed 21 RC drill holes for a total of 6,150 ft in 2006. |
| |
|
|
|
| 2007 |
Canyon |
Canyon |
Four core holes for 1,430 ft were completed.
Mineral resource and mineral reserve estimate were updated.
Plan of Operations authorized under N-82840.
Obtained Water Pollution Control Permit (WPCP); WPCP NEV2007101.
Obtained general construction permit; NVR100000 CSW-17415.
Water rights permitted by Nevada Division of Water Resources (NDWR)
under Mining, Milling, & Domestic permit 76390.
Mining reclamation permit granted by the Bureau of Mining Regulation
and Reclamation (BMRR) under mine site permit #0300.
Nevada Bureau of Air Pollution Control (BAPC) authorized Class II
Air Quality permit AP1041-2492 |
| |
|
|
|
| 2008–2010 |
Canyon |
Atna Resources Ltd. (Atna) |
Completed a Feasibility study in February 2008.
Assigned all properties to CR Reward Corporation after Canyon was acquired
by Atna in March 2008.
Mineral resource and mineral reserve updates were completed in 2009
and 2010.
Completed Environmental Assessment (EA) in 2009; prepared “Reward
Project Updated Plan of Operations and Reclamation Plan” (BLM Case File Serial Number N-82840). |
| Effective Date: May 31st, 2022 | | 32 |
| Technical Report - Mineral Resource Estimate Reward Project, Nye County, Nevada, USA |
| Period |
Owner |
Operator |
Work
Performed |
| 2011-2012 |
Atna |
Atna |
Completed 15 RC drill holes for a total of 15,880 ft.
Completed an updated study on the Reward project that included an economic
analysis. Report was published in June 2012. |
| |
|
|
|
| 2013 |
Atna |
Atna |
14 RC drill holes for 9,003 ft of drilling were completed.
Mineral resource and mineral reserve updates were completed. |
| |
|
|
|
| 2016 |
CR Reward |
CR Reward |
Two geophysical induced polarization (IP)/resistivity lines; acquired on both lines using a dipole-dipole array with a dipole length of 100 m for a total of 3.9 line-km of data coverage. |
| |
|
|
|
| 2017 |
CR Reward |
CR Reward |
Property-wide data compilation and validation program.
14 core holes for 4,989 ft were completed. |
| |
|
|
|
| 2018 |
CR Reward |
CR Reward |
14 core holes for 6,307 ft were completed.
Mineral Resource and Mineral Reserve updates. |
| |
|
|
|
| 2019 |
CR Reward |
CR Reward |
Completed updated Feasibility study. |
| 7 | Geological Setting and Mineralization |
The Project is hosted within
the Bare Mountain Complex, which lies within the Nevada Basin and Range Province. Information in this section is summarized from Rasmussen
and Keith (2015), Hoisch (1997), CAM (2006, 2012), Cornwall and Kleinhampl (1961, 1964), Eliopulos (1996), Golder (2007), Sawyer et al.
(1994), Monsen et al. (1992) and Noble et al. (1991).
The Bare Mountains consist
of up to 6,096 m (20,000 ft) of Late Proterozoic to Paleozoic marine sedimentary rocks in the lower plate that have been juxtaposed against
Miocene silicic volcanic sequences in the upper plate to the north (Figure 7.1 and Figure 7.2). The lower plate units have been deformed
through folding, thrust faulting, low- and high-angle normal faulting during Mesozoic compression (Monsen et al., 1992) and have been
metamorphosed from lower amphibolite to sub-greenschist grade (Hoisch, 1997). Two dominant normal fault sets have been mapped in the lower
plate. These include moderately east-dipping (Bare Mountain Fault and Gold Ace fault) and shallowly southeast-dipping faults that cut
or curve into east-dipping faults. A metamorphic grade discordance across the Gold Ace fault suggests displacement of >1,981 m (6,500
ft) (Hoisch, 1997).
To the north, the shallowly
north-dipping Fluorspar Canyon Fault separates the lower plate from the Miocene volcanic sequences that were deposited between 14.0 and
11.5 Ma (Sawyer et al., 1994).
| Effective Date: May 31st, 2022 | | 33 |
| Technical Report - Mineral Resource Estimate Reward Project, Nye County, Nevada, USA |
The Project is located on
the southwestern flank of the Bare Mountain Complex and is underlain by moderately deformed marine clastic and carbonate rocks of Late
Proterozoic and Late Cambrian age that have been metamorphosed to greenschist grade (refer to Figure 7.2). Tertiary and younger alluvium
cover the lower slopes and the adjacent Armagosa Valley to the south and west. The east dipping Gold Ace fault, that is locally termed
the Good Hope fault zone, separates northeast-dipping Late Proterozoic to Early Cambrian units in the footwall block from Middle to Late
Cambrian units in the hanging wall block (Figure 7.3 and Figure 7.4).
The gold mineralization in
the Good Hope Deposit is spatially associated with and along the Good Hope fault zone. Mineralization associated with the Morris Marble
lower contact in the footwall block is referred to as the Gold Ace mineralized zone. Although there are small historic prospects along
the Good Hope fault zone, most of the historic production came from the Gold Ace Zone.
Figure 7.1. Simplified Geology of the Bare
Mountain Area.
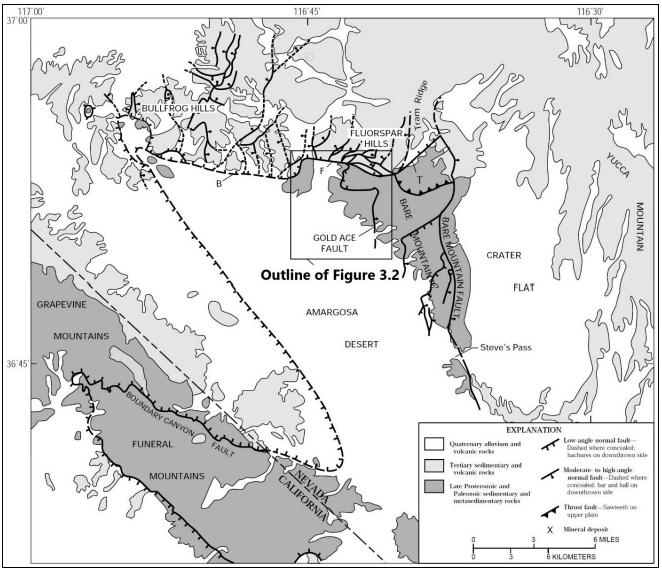
Note: B, Bullfrog detachment fault; F, Fluorspar Canyon
fault; T, Tates Wash fault. From Hoisch, 1997.
| Effective Date: May 31st, 2022 | | 34 |
| Technical Report - Mineral Resource Estimate Reward Project, Nye County, Nevada, USA |
Figure 7.2. Simplified Geologic Map of Project
Area.

Note: Gold Ace area modified after Monsen
et al., 1992.
| Effective Date: May 31st, 2022 | | 35 |
| Technical Report - Mineral Resource Estimate Reward Project, Nye County, Nevada, USA |
Figure 7.3. Local Geology Map.

Note: Figure prepared
by Lycopodium, 2019
| Effective Date: May 31st, 2022 | | 36 |
| Technical Report - Mineral Resource Estimate Reward Project, Nye County, Nevada, USA |
Figure 7.4. 3D Geological Schematic of the Main Rock Units and
Faults.

Note: Modified from Carisey, 1989.
The sedimentary sequence
of the lower portion of the Bare Mountain Complex consists of 2,911 m (9,555 ft) of moderately deformed, clastic and carbonate rocks
of Late Proterozoic and Middle Cambrian age (Table 7.1, Figure 7.5). Approximately 762 m (2,500 ft) of section is exposed in the Project
area. Beds dip to the northeast at moderate to high angles.
| ● | The
following stratigraphic descriptions at the Project are largely based on: |
| ● | Geologic
map of Bare Mountain, Nye County, Nevada (Monsen et al., 1992). |
| ● | Stratigraphic
descriptions from the 1989 Project Summary Report (Carisey, 1989). |
| ● | Drill
hole data. |
| ● | Observations
from the 2017–2018 drill program (Saunders, 2018). |
Table 7.1. Stratigraphy and Unit Thickness
of the Bare Mountains Complex.
| Age |
Formation |
Member |
Map
Code |
Thickness
ft |
| Cambrian |
Bonanza
King |
Papoose
Lake |
-Cbp |
1,900 |
| Carrara |
Upper
part |
-Ccu |
500 |
| Middle
part |
-Ccm |
325 |
| Lower
part |
-Ccl |
375 |
| Zabriskie
Quartzite |
|
-Cz |
1,125 |
| Proterozoic-Cambrian |
Wood
Canyon |
Upper
upper |
zwuu |
840 |
| Upper
lower |
zwul |
1,185 |
| Middle |
Zwm |
625 |
| Lower |
Zwl |
1,050 |
| Late
Proterozoic |
Stirling |
Juhl |
Zsj |
310 |
| Sutton |
Zss |
500 |
| Morris
Marble |
Zsm |
325 |
| Beatty
Schist |
Zbs |
470 |
| Effective Date: May 31st, 2022 | | 37 |
| Technical Report - Mineral Resource Estimate Reward Project, Nye County, Nevada, USA |
Stirling Formation
Beatty Schist Member (Zbs)
The Beatty Schist Member
consists of greenish, moderately foliated phyllites with minor interbedded thin shale and quartzite beds. The transition zone with the
overlying Morris Marble characterized by a few feet of alternating schists, limestone, and dolomite beds. Limestone lenses occur in grey
siliciclastic rocks, which occasionally display schistose textures. The unit is about 152 m (500 ft) thick.
Morris Marble Member (Zsm)
The Morris Marble Member
consists of massive, white to light tan-grey, weathered limestone and dolomite with dissolution textures and occasional grainy quartzite
lenses. This member conformably overlies the Beatty Schist Member, and may be correlated to the lower “D” member of the Stirling
Formation (Monsen et al., 1992). The Morris Marble Members hosts the gold mineralization at the Gold Ace deposit. The unit is approximately
76 m (250 ft) thick.
Sutton Member (Zss)
The Sutton Member consists
of medium to thick, light brownish-grey, interbedded, fine-grained quartzite, micaceous quartzite, pale-green phyllite, and yellowish-brown
dolomite. Laminations and cross-laminations are common. The Sutton Member may be correlated to the upper “D” member of the
Stirling Formation (Monsen et al., 1992). The Sutton Member conformably overlies the Morris Marble Member. The Sutton Member hosts gold
mineralization at the Gold Ace deposit near the lower contact with the Morris Marble Member and adjacent to vertical faults. The unit
is about 152 m (500 ft) thick.
Juhl Member (Zsj)
The Juhl Member consists
of white to pale yellowish-brown, medium to thickly bedded, fine-grained orthoquartzite. The orthoquartzite is silicified, brittle and
highly fractured adjacent to and within the footwall of the Good Hope fault. The basal contact is gradational with the underlying Sutton
Member. The Juhl Member conformably overlies the Sutton Member. Minor gold mineralization is found in the Juhl Member along the Good
Hope fault, and occasionally below the Wood Canyon Formation within the Good Hope fault zone. The unit is approximately 76 m (250 ft)
thick.
| Effective Date: May 31st, 2022 | | 38 |
| Technical Report - Mineral Resource Estimate Reward Project, Nye County, Nevada, USA |
Figure 7.5. Lower Portion of the Bare Mountains
Complex Stratigraphic Column Observed at the Project.

Note: Modified after Monsen et al., 1992.
| Effective Date: May 31st, 2022 | | 39 |
| Technical Report - Mineral Resource Estimate Reward Project, Nye County, Nevada, USA |
| 7.3.2 | Proterozoic-Cambrian |
Wood Canyon Formation (Zwc)
Only 750 ft of the basal
section of the Wood Canyon Formation is preserved in the Project area. The Wood Canyon Formation conformably overlies the Juhl Member
of the Stirling Formation. The upper member of the Wood Canyon Formation is Cambrian in age and the middle and lower members are Late
Proterozoic in age. The thicknesses of the upper, middle and lower members are around 610 m (2,000 ft), 110 m (360 ft), and 305 m (1,000
ft), respectively.
The Wood Canyon Formation
is the main host for gold mineralization within the Project area. Gold is hosted in quartz veins and silicic alteration, in association
with the Good Hope fault and, to a lesser extent, along the Good Fortune fault.
Three conspicuous orange
to grey dolomite beds with dissolution textures define the basal section. The lower members of the basal section of the Wood Canyon Formation
(Zwl) are listed below from oldest to youngest.
Zabriskie Quartzite (Cz)
The Zabriskie Quartzite
is a massive, thickly bedded, commonly laminated and cross-bedded, cliff-forming orthoquartzite. Trace fossils, primarily Scolithus,
are common in the lower beds of the unit (Monsen et al., 1992). The quartzite is conformable with the underlying Wood Canyon Formation.
The Zabriskie Quartzite is juxtaposed against the Wood Canyon Formation along the southern portion of the Good Fortune fault. The unit
is about 1, 343 m (1,125 ft) thick.
Carrara
Formation (Cc)
The Carrara Formation is
a heterogeneous unit of quartzite and phyllite with prominent intervals of limestone and silty limestone. The unit conformably overlies
the Zabriskie Quartzite and can be divided into three parts, lower, middle and upper, that have a combined thickness of 366 m (1,200
ft.) The formation is exposed to the east of the Good Hope fault zone.
| Effective Date: May 31st, 2022 | | 40 |
| Technical Report - Mineral Resource Estimate Reward Project, Nye County, Nevada, USA |
Bonanza King Formation (Cbp)
The Bonanza King Formation
consists of cliff-forming, thin to thick, dark grey and white alternating limestone and dolomite beds intercalated with minor, distinct,
yellowish-orange silty and sandy intervals.
The upper 20 m (65 ft) of
the sequence consists of silty and sandy dolomite and limestone. The uppermost portion grades downward into medium- to thickly bedded
dolomite and limestone with silty and sandy beds. The basal part typically consists of white dolomite and limestone with yellowish-orange,
silty layers. The basal contact is gradational and is defined as where white, silty limestone and dolomite grade into a dark grey limestone.
The unit is exposed to the
east of the Good Hope fault zone and is juxtaposed against the Wood Canyon Formation along the central to north portion of the Good Fortune
fault and the main area of gold mineralization. The average unit thickness is about 640 m (2,100 ft).
The oldest deformational
features include minor folds within sedimentary units that developed during the Mesozoic compressional event (Monsen et al., 1992). The
known major faults are shown on Figure 7.3. A series of north-trending faults cut and offset the folded units including the east-dipping
Good Hope fault zone. The Good Hope fault zone has been mapped and logged from the southern property boundary to three miles north of
the northern boundary. Several faults with similar trends are also observed in the footwall and hanging wall blocks. Figure 7.6 outlines
the structures visible at section 3500 N.
| 7.4.1 | Good Hope Fault Zone |
Within the Project area,
the east-dipping Good Hope fault zone ranges from 15 m (50 ft) to 192 m (630 ft) in width and has a 1,585 m (5,200 ft) strike extent.
The fault zone has an overall northerly trend but between 5100 N to 3000 N rotates to a north-northwest trend. The fault zone
juxtaposes Bonanza King Formation in the hanging wall block, Wood Canyon Formation in the central fault zone and Late Proterozoic units
in the footwall.
The fault zone comprises
the Good Fortune fault that is located on the eastern or hanging-wall side (Figure 7.) and has a moderate dip, while the Good Hope fault
defines the western (or footwall) extent and has a steep dip. The Good Hope fault controls the majority of the known alteration and gold
mineralization.
Textures observed within
the fault zone include breccias, quartz veins, elevated silicic alteration and localized clay-rich zones. Exposed quartz veins display
a dominant northerly trend and secondary sigmodal veins display an east-northeast trend (Figure 7.7). Veins measurements from oriented
drill core highlight two dominant vein sets with orientations that include a moderate dip to the southeast (45°→140°) and
a steep dip to the northeast (70°→050°; Brown, 2018). The line of intersection for these two vein sets is moderate dip to
the southeast (43°→120°).
| Effective Date: May 31st, 2022 | | 41 |
| Technical Report - Mineral Resource Estimate Reward Project, Nye County, Nevada, USA |
The Good Hope fault zone
is interpreted to have undergone right lateral, strike-slip/dip-slip movement based on regional observations, historical mapping combined
with structural field observations and slickensides along fault planes. Previous work has estimated at least 1,676 m (5,500 ft) of vertical
displacement (west side up) and 610 m (2,000 ft) of lateral movement (Turner, 1990).
Figure 7.6. 3500N Geology Cross-Section.
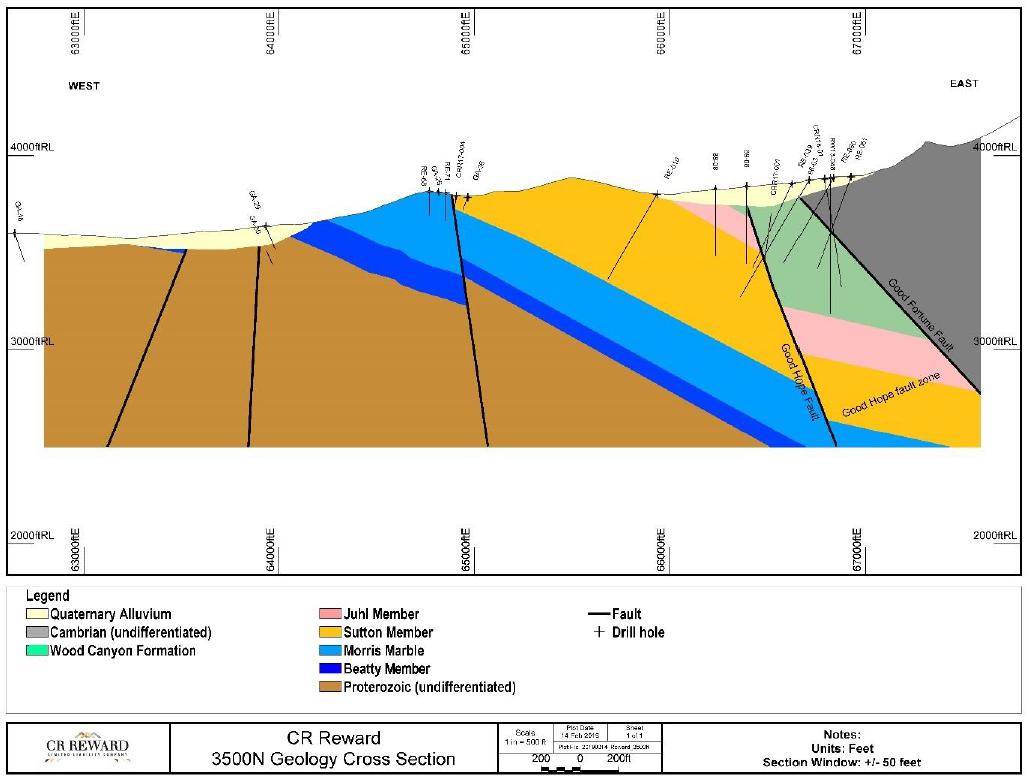
Note: Figure
prepared by Lycopodium, 2019
| Effective Date: May 31st, 2022 | | 42 |
| Technical Report - Mineral Resource Estimate Reward Project, Nye County, Nevada, USA |
Figure 7.7. Photo Highlighting Vein Orientation
in Outcrop.
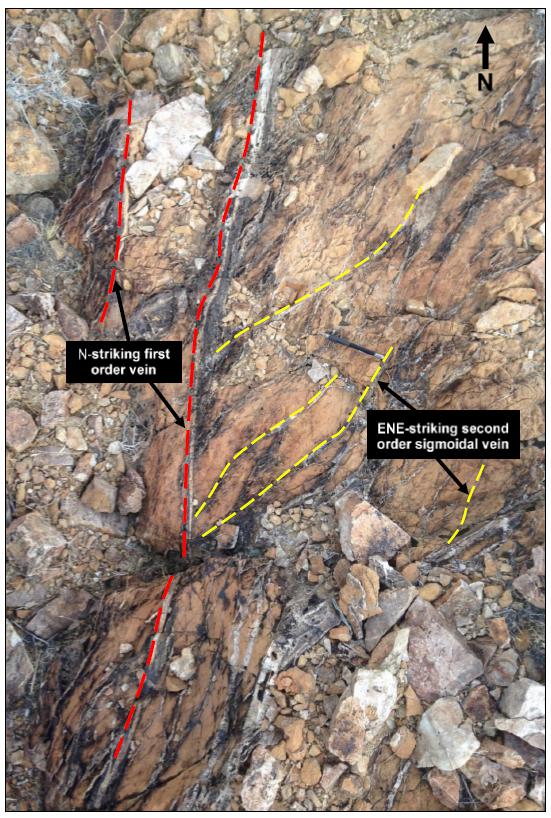
Note: From Barcia, 2017.
| Effective Date: May 31st, 2022 | | 43 |
| Technical Report - Mineral Resource Estimate Reward Project, Nye County, Nevada, USA |
Four main alteration assemblages
are observed across the Project: silicic, sericite, argillic, and propylitic, and these are spatially associated with the Good Hope fault
zone.
Silicic alteration along
the Good Hope fault laterally extends 15 m (50 ft) to 30 m (100 ft) toward the Good Fortune fault. Alteration within the central fault
zone appears to have preferentially developed along moderately dipping bedding planes within the Wood Canyon Formation. Alteration intensity
ranges from intense to weak and is typically associated with quartz ± adularia-calcite veins, goethite after pyrite, and local
coarse adularia. Quartz veining varies in thicknesses from millimetres to meters.
Exposed quartz veins are
commonly coated by manganese oxides and hematite. Massive white quartz veins are more abundant than banded veins. Prominent massive veins
are exposed in the footwall block at the northern extent of the Good Hope Deposit. Colloform vein textures are observed at Ollie’s
Follie target (Barcia, 2017).
The sericite assemblage
is preferentially developed within mica-bearing units and is locally overprinted by silicic alteration.
Argillic alteration is locally
restricted along portions of fault planes and characterized by the presence of kaolinite that was identified using quantitative evaluation
of materials by scanning electron microscopy (QEMSCAN) analysis.
Propylitic alteration consists
of calcite, chlorite, and ankerite. Calcite veinlets and stringers are observed throughout most units. Chlorite is preferentially developed
in finer-grained units and biotite has been partially to pervasively replaced by chlorite.
The redox zones within the
Project area include an upper oxide and a lower transition zone. The upper oxide zone is characterized by hematite, goethite, pyrolusite
and minor jarosite. Oxidation is strong within and adjacent to the Good Hope fault and decreases in intensity outward from the fault.
The depth of the oxide zone ranges from 30 m (100 ft) to 152 m (500 ft) below surface (between 1,183 m (3,880 ft) to 1,027 m (3,370 ft)
elevation ASL). Iron oxides comprise up to 5% of the rock mass.
The transition zone is located
below the base of the oxide horizon and consists of both goethite and pyrite. In the transition zone, sulphides comprise <1% of the
rock mass. The transition zone reaches the maximum depth of drilling on the Project at an elevation of 3,099 ft.
Drilling to date has not
intersected a primary sulphide zone.
| Effective Date: May 31st, 2022 | | 44 |
| Technical Report - Mineral Resource Estimate Reward Project, Nye County, Nevada, USA |
Mineralization that supports
Mineral Resource estimation is hosted in the Good Hope Deposit and the Gold Ace mineralized zone. Anomalous gold values are associated
with quartz veining and/or iron-oxide-bearing, silicic-altered rocks in both areas. Pyrite and iron oxides are the dominant minerals
associated with gold mineralization. Visible gold was identified on fractures in sericite-altered rocks, on quartz-adularia-coated fractures,
and in hematite-filled cavities, pervasively silicic-altered rocks, goethite pseudomorphs, thin quartz veinlets, and goethite-rich fractures
and cavities. Visible gold has been observed along the Gold Ace trend in surface samples and drill core, whilst it was observed only
in drill core from Good Hope. Figure 7.8 shows the tenor of the gold anomalism encountered in drilling along the two mineralized trends.
| 7.7.1 | Description of Mineralization:
Good Hope Deposit |
Gold mineralization at the
Good Hope Deposit is primarily hosted in altered and veined Wood Canyon Formation, and to a lesser extent, in the Juhl and Sutton Members
of the Stirling Formation. Gold mineralization is associated with:
| ● | Silicic
and/or sericite-altered rocks. |
| ● | Zones
of increased quartz vein density. |
| ● | Faults,
breccias, and/or highly fractured zones with abundant iron oxides. |
| ● | Units
with high concentrations of goethite pseudomorphs after pyrite. |
| ● | Quartz-adularia
veinlets. |
Mineralization at the Good
Hope Deposit varies in width from 15 m (50 ft) to 192 m (630 ft), has a strike length of 1,585 m (5,200 ft) and has been intersected
to a vertical depth of 213 m (700 ft) below surface.
North of 5100 N, mineralization
is spatially associated with the sub-vertical, north-trending Good Hope fault and is up to 149 m (190 ft) wide. Section 5600 N
outlines mineralization north of 5100 N (Figure 7.9).
In the central portion of
the deposit between 5100 N and 3000 N, mineralization is also associated with the Good Hope fault. Mineralization extends to
the east with a shallow to moderate dip towards the hanging wall of the Good Fortune fault. Mineralization has been intersected along
the Good Fortune fault and appears to be sub-parallel to the dip of the fault. In this central portion, mineralization is up to 192 m
(630 ft) thick and coincides with a change in fault zone strike from north to north-northwest. Sections 4200 N (Figure 7.10), and
Section 4800 N (Figure 7.11) outline mineralization in the central part of the deposit.
South of 3000 N, the
gold mineralization continues to be spatially associated with the sub-vertical, north-trending Good Hope fault, and is up to 55 m (180
ft) thick (Figure 7.12). However, limited drilling has occurred south of this section and therefore mineralization controls are less
well constrained.
| Effective Date: May 31st, 2022 | | 45 |
| Technical Report - Mineral Resource Estimate Reward Project, Nye County, Nevada, USA |
Figure 7.8. Gold Mineralization at Reward
Intersected by Drilling.
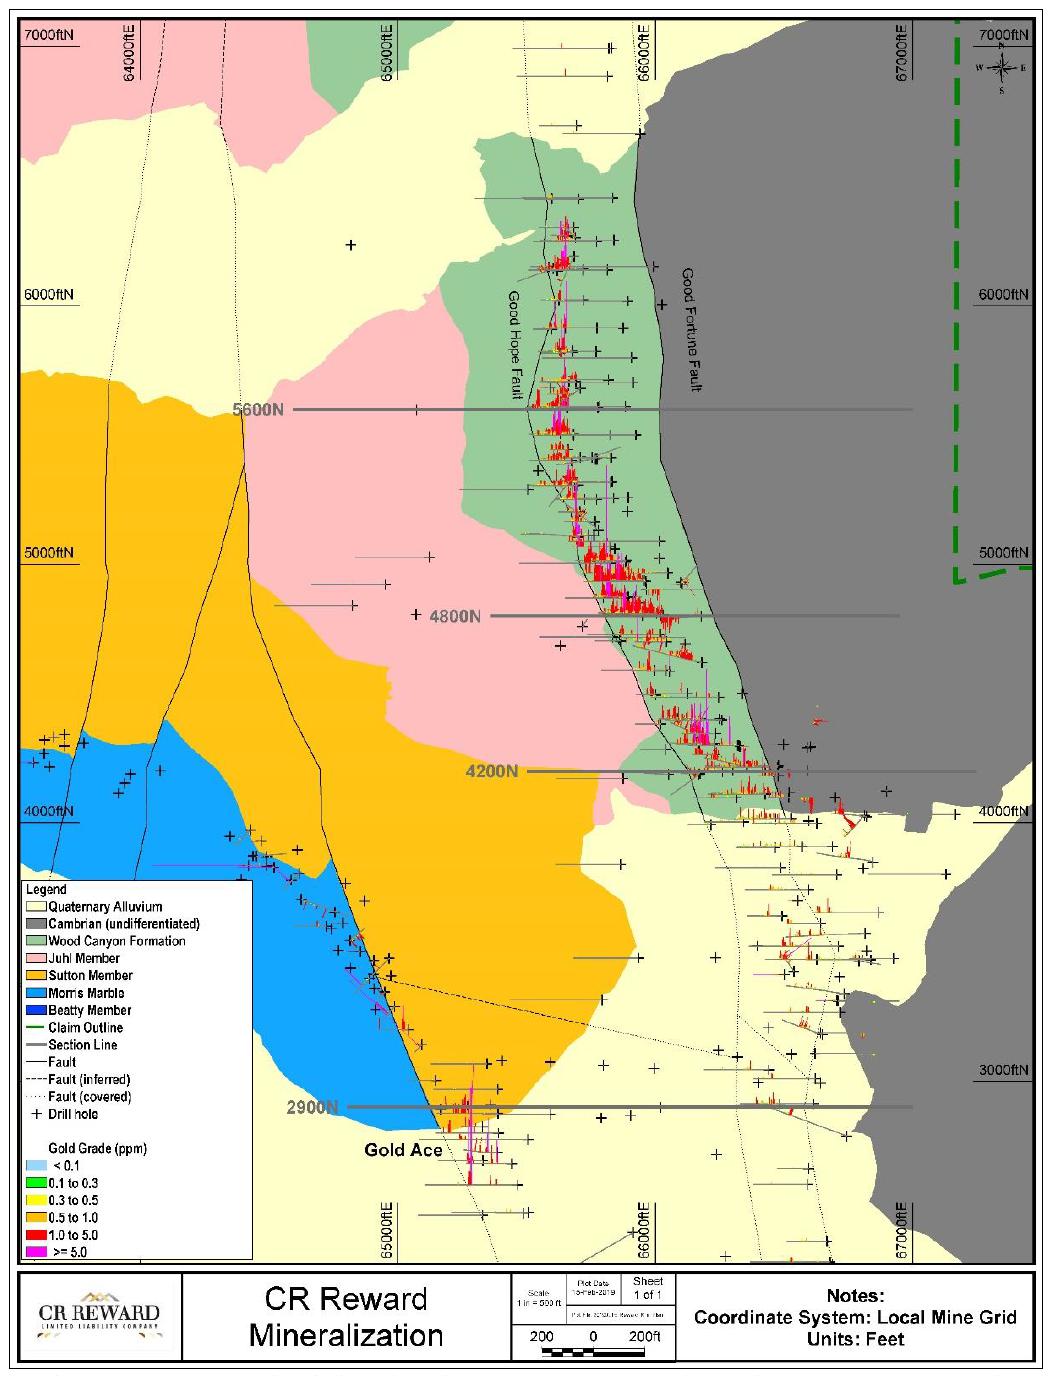
Note: The Good Hope Deposit is
situated between the Good Hope and Good Fortune faults. The Gold Ace Zone is located near 3000 ft N and 65000 ft E. Figure
prepared by Lycopodium, 2019.
| Effective Date: May 31st, 2022 | | 46 |
| Technical Report - Mineral Resource Estimate Reward Project, Nye County, Nevada, USA |
| 7.7.2 | Description of Mineralization:
Gold Ace Mineralized Zone |
Mineralization at Gold Ace
is dominantly located along the contact between the Sutton and Morris Marble Members (Figure 7.12). At the mineralized contact, the Morris
Marble Member is characterized by silicic alteration and hematite. Evidence for mineralization parallel to the contact between the Sutton
and Morris Marble Members is provided by low-angle, east-dipping stopes from historical underground mining. The northwest-trending Gold
Ace Zone consists of several discrete structures. The overall continuity of mineralization at Gold Ace is less well developed than at
the Good Hope Deposit.
Mineralization at the Gold
Ace varies in width from 1.5 m (5 ft) to 21 m (70 ft), has a strike length of 640 m (2,100 ft) and has been intersected to a vertical
depth of 91 m (300 ft) below surface.
Figure 7.9. Mineralization along Section 5600 N
Looking North.
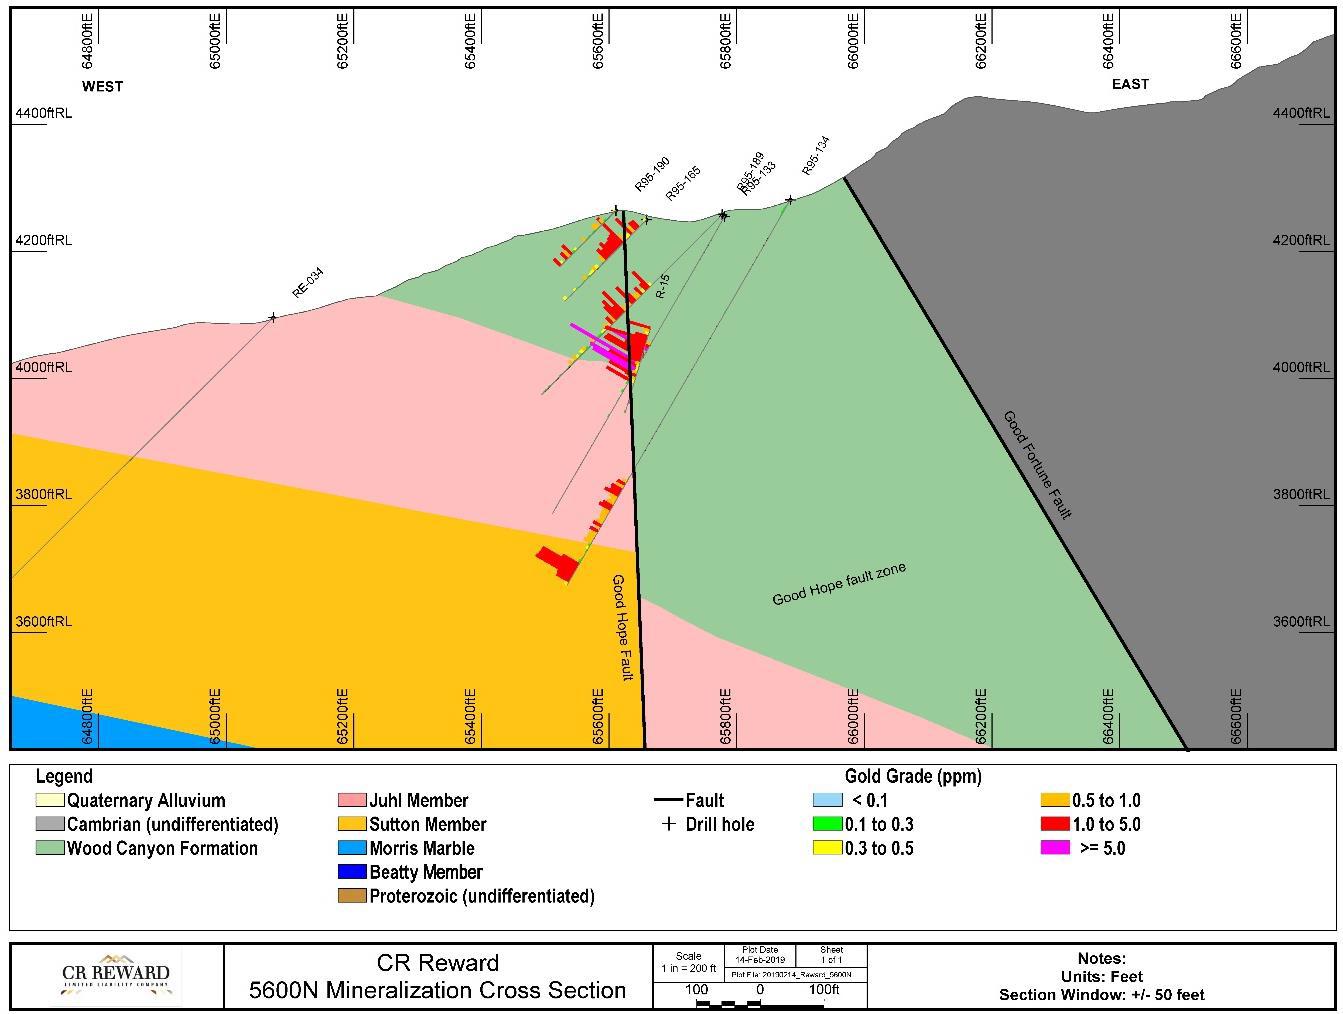
Note: Mineralization along the Good Hope fault on the west
side of the Good Hope fault zone. Figure prepared by Lycopodium, 2019.
| Effective Date: May 31st, 2022 | | 47 |
| Technical Report - Mineral Resource Estimate Reward Project, Nye County, Nevada, USA |
Figure 7.10. Mineralization along Section 4200 N
Looking North.

Figure 7.11. Mineralization along Section 4800 N,
Looking North.
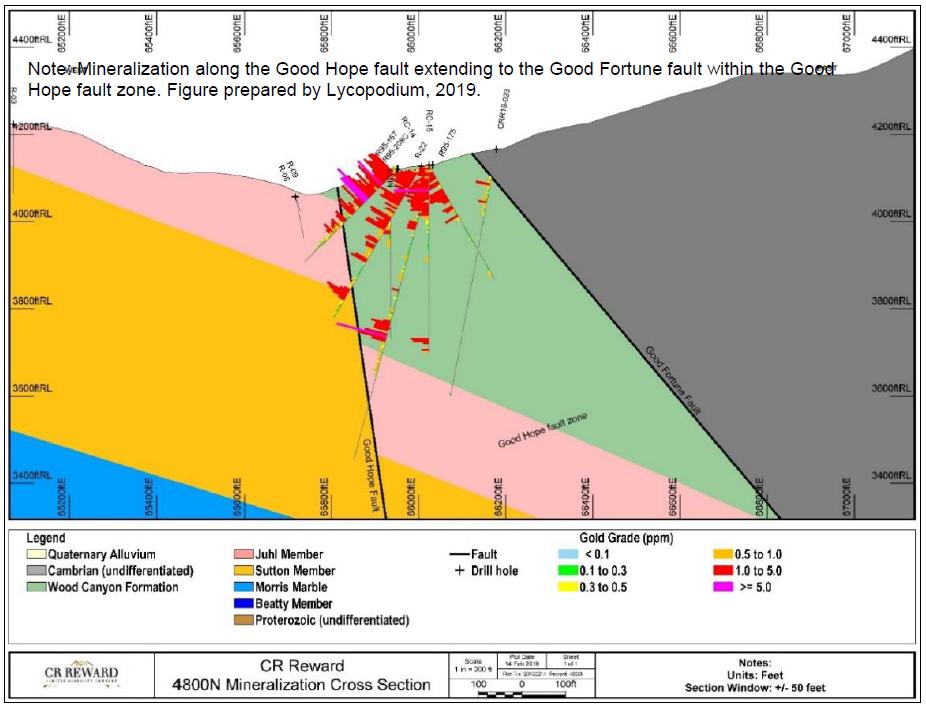
| Effective Date: May 31st, 2022 | | 48 |
| Technical Report - Mineral Resource Estimate Reward Project, Nye County, Nevada, USA |
Figure 7.12. Mineralization along Section 2900 N
Looking North.
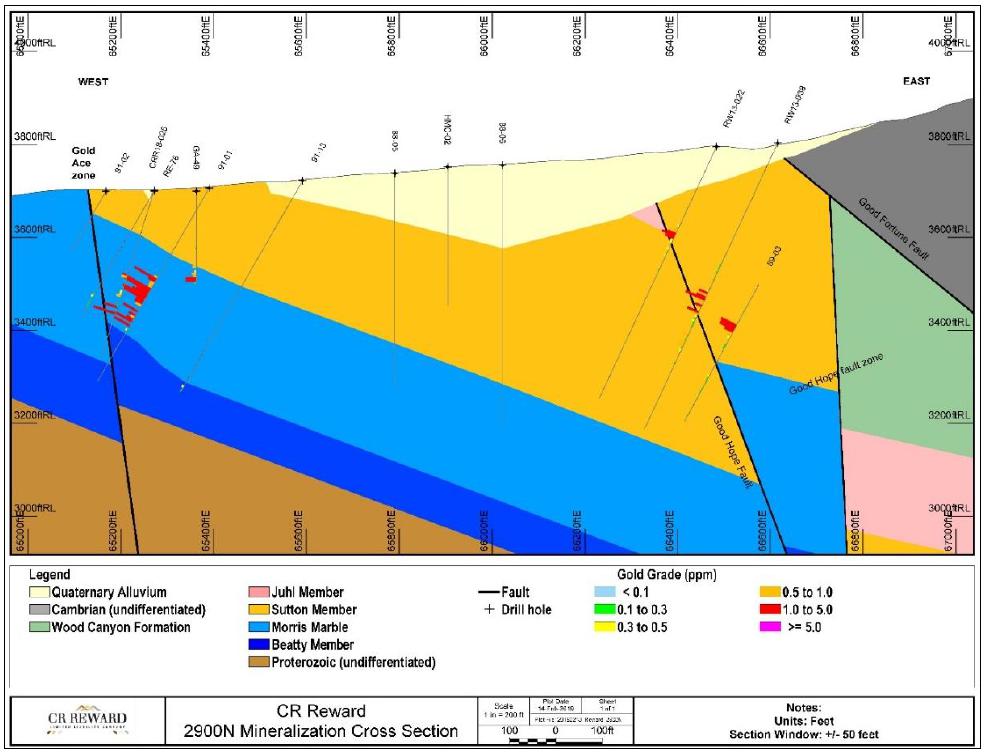
Note - Mineralization is narrow along the Good Hope
fault at the Gold Ace zone, mineralization is located along the contact of the Sutton and Morris Marble members to an unnamed fault.
Figure prepared by Lycopodium, 2019.
| 7.7.3 | Description of Mineralization:
Exploration Update |
At the Good Hope Deposit,
gold mineralization remains open to the east towards and along the Good Fortune fault and south of 3000 N. The eastern area of the
deposit, most notably along the Good Fortune fault, has had limited exploration drilling. To the south of Good Hope, wide-spaced exploration
drilling along the 914 m (3,000 ft) extension of the fault zone has returned several intercepts with narrow (<9.1 m (30 ft)) or low-grade
(<0.017 opt) gold mineralization. The projected intersection of the Good Hope fault zone and the Gold Ace trend is another area that
has had limited exploration drilling.
| Effective Date: May 31st, 2022 | | 49 |
| Technical Report - Mineral Resource Estimate Reward Project, Nye County, Nevada, USA |
The structural setting,
alteration mineralogy and mineralization characteristics of the Good Hope Deposit and Gold Ace Zone are consistent with orogenic gold
deposits as defined in Moritz (2000), Goldfarb et al., (2005), Groves et al. (1998; 2003), and Johnston et al. (2015).
Orogenic gold deposits occur
in variably deformed metamorphic terranes formed during Middle Archean to younger Precambrian, and continuously throughout the Phanerozoic.
The host geological environments are typically volcano–plutonic or clastic sedimentary terranes, but gold deposits can be hosted
by any rock type. There is a consistent spatial and temporal association with granitoids of a variety of compositions. Host rocks are
metamorphosed to greenschist facies, but locally can achieve amphibolite or granulite facies conditions.
Gold deposition occurs adjacent
to first-order, deep-crustal fault zones with interpreted long-lived structural controls. These first-order faults, which can be hundreds
of kilometres long and kilometres wide, show complex structural histories. Economic mineralization typically formed as vein fill of second-
and third-order shears and faults, particularly at jogs or changes in strike along the crustal fault zones. Mineralization styles vary
from stockworks and breccias in shallow, brittle regimes, through laminated crack-seal veins and sigmoidal vein arrays in brittle-ductile
crustal regions, to replacement- and disseminated-type orebodies in deeper, ductile environments. The specific style of mineralization
at the Good Hope and Gold Ace deposits can be classified as both structurally controlled and locally disseminated.
Orogenic gold deposits in
Nevada are situated along the Argentoro belt (Luning-Fencemaker Fold-and Thrust Belt of Wyld et al., 2000, 2001; DeCelles, 2004), a 700-km
long, north-south trending belt extending from south-eastern California to the Nevada-Oregon border. The belt formed between ~100 Ma
and 70 Ma synchronous with low-grade metamorphism and brittle-ductile deformation. District-scale controls consist of high-angle, N-striking
strike-slip faults, while deposit-scale controls consist of NW-, EW-, and NE-striking dip-slip fracture arrays.
Johnston et at. (2015) outline
that Nevada orogenic gold deposits are defined by: 1) widespread low to moderate-grade metamorphism in Mesozoic rocks, 2) low-sulphide
bearing, mesothermal “bull-quartz” veins emplaced in shear zones, 3) ubiquitous quartz-sericite-pyrite alteration of wall
rocks, 4) dilute CO2-rich ore fluids, 5) coarse gold in veins, 6) elevated concentrations of Ag, Sb, As, and Hg, and 7) abundant placer
gold deposits. Except for placer deposits, the Good Hope and Gold Ace deposits match the criteria listed above.
| Effective Date: May 31st, 2022 | | 50 |
| Technical Report - Mineral Resource Estimate Reward Project, Nye County, Nevada, USA |
Exploration on and around
the Project area has primarily consisted of surface geological mapping, rock-chip sampling, and drilling.
Exploration conducted by
parties other than CR Reward is discussed in Section 6.
| 9.2 | CR Reward Exploration (2015-Present) |
In 2016, seventeen rock
chip samples were collected consisting of veins and fault zones from Gold Ace (five samples), Good Hope (nine samples) and Ollie’s
Follie (three samples). Samples were submitted to ALS Global for fire assay gold (lab code Au-ICP22 and Au-GRA22) and multi-element geochemistry
analyses (lab code ME-MS61). Gold values from Gold Ace ranged from 0.008 to 17.85 ppm, Good Hope ranged from below detection up to 2.10
ppm Au, and Ollie’s Follie ranged from 0.001 up to 4.90 ppm Au. Gold Ace returned elevated Ag (up to 33 ppm), Cu (up to 476 ppm),
Hg (up to 5.7 ppm), Pb (up to 1,435 ppm), Sb (up to 185 ppm), and Zn (up to 3,490 ppm), whereas Good Hope and Ollie’s Follie returned
weakly anomalous values.
Two geophysical IP/resistivity
lines were completed by Zonge International, Inc. in August 2016. Data were acquired along two lines:
| • | Line
1, oriented 045° northeast. |
| • | Line
2, oriented 051° northeast. |
IP/resistivity data were
acquired on both lines using a dipole-dipole array with a dipole length of 100 m (328 ft) for a total of 3.9 line-km (3.9 line-mi) of
data coverage. Data were acquired in a non-reference, complex resistivity mode. Line locations are shown in Figure 9.1. The IP/survey
shows the strongest anomaly along the Gold Ace trend, with a weaker response along the Good Hope trend. Along the Gold Ace trend, line
1 indicates lithology controls mineralization while Line 2 indicates structure controls mineralization (resistivity high). These results
correlate well with the modelled location of the Gold Ace fault.
In 2017, an extensive, property-wide
data compilation and validation program was completed. Subsequent east-west, hand-interpreted, paper cross-sections were created and
used to generate a 3D geologic model highlighting major faults and formational contacts. The geologic model was used to support Mineral
Resource estimation.
In 2018, a 28-hole core
drilling program was completed and results included in an updated geological model. Cross-sectional interpretations were completed infill
the 2017 cross-sections.
| Effective Date: May 31st, 2022 | | 51 |
| Technical Report - Mineral Resource Estimate Reward Project, Nye County, Nevada, USA |
Figure 9.1. Plan View of the Project Area Showing
the Locations of the IP/Resistivity Survey Lines.
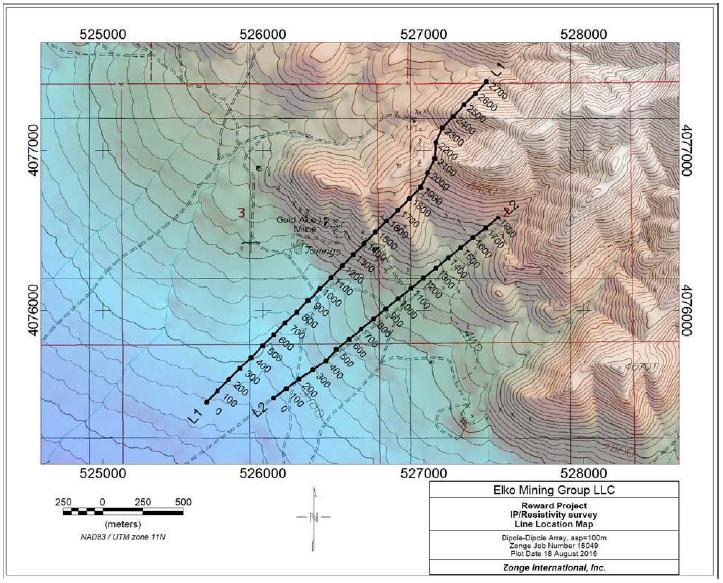
The Project exploration drill
hole database as of April 19th, 2018, contains 376 drill holes (totalling 43,687 m (143,330 ft)), seven road cuts (totalling
319 m (1,045 ft)) and three trenches (totalling 82 m (270 ft)). The road cuts and trenches were removed from the database for resource
estimation purposes. No records for two drill holes (GA-33 and GA-35) of the 49 holes completed by Cloverleaf were located and therefore
missing from the database. All drilling in the database is summarized in Table 10.1
Drill hole collar locations
for the entire property are shown on Figure 10.1.
| Effective Date: May 31st, 2022 | | 52 |
| Technical Report - Mineral Resource Estimate Reward Project, Nye County, Nevada, USA |
Table 10.1. Reward Drilling Summary.
| Operating
Company |
Year |
Core
Holes |
Reverse
Circulation |
Total |
| Number |
Footage |
Number |
Footage |
Number |
Footage |
| Homestake |
1987 |
|
|
4 |
1,210 |
4 |
1,210 |
| Gexa |
1987 |
|
|
16 |
3,037 |
16 |
3,037 |
| Pathfinder |
1988 |
|
|
22 |
9,273 |
22 |
9,273 |
| Pathfinder |
1989 |
|
|
11 |
4,525 |
11 |
4,525 |
| Cloverleaf |
1990 |
|
|
47 |
8,625 |
47 |
8,625 |
| Pathfinder |
1991 |
|
|
17 |
8,300 |
17 |
8,300 |
| USNGS |
1992 |
|
|
7 |
2,119 |
7 |
2,119 |
| Barrick |
1995 |
3 |
773 |
83 |
35,295 |
86 |
36,068 |
| Barrick |
1996 |
|
|
5 |
2,960 |
5 |
2,960 |
| Glamis Gold |
1998 |
|
|
42 |
16,590 |
42 |
16,590 |
| Glamis Gold |
1999 |
|
|
19 |
10,295 |
19 |
10,295 |
| Glamis Gold |
2000 |
|
|
18 |
3,640 |
18 |
3,640 |
| Canyon |
2006 |
|
|
21 |
6,145 |
21 |
6,145 |
| Canyon |
2007 |
4 |
1,364 |
|
|
4 |
1,364 |
| Atna |
2011 |
|
|
15 |
8,880 |
15 |
8,880 |
| Atna |
2013 |
|
|
14 |
9,003 |
14 |
9,003 |
| CR Reward |
2017 |
14 |
4,989 |
|
|
14 |
4,989 |
| CR Reward |
2018 |
14 |
6,307 |
|
|
14 |
6,307 |
| Total |
|
35 |
13,433 |
341 |
129,897 |
376 |
143,330 |
| Effective Date: May 31st, 2022 | | 53 |
| Technical Report - Mineral Resource Estimate Reward Project, Nye County, Nevada, USA |
Figure 10.1. Reward Drill Hole Locations.
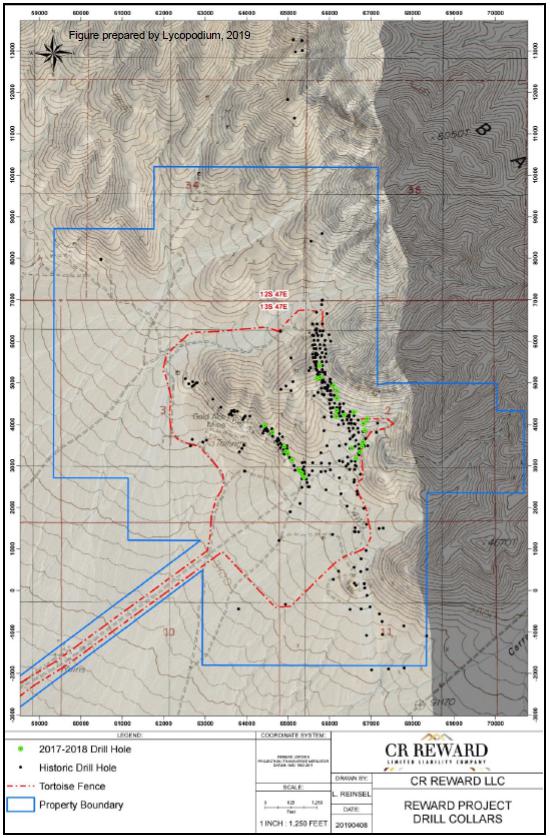
| Effective Date: May 31st, 2022 | | 54 |
| Technical Report - Mineral Resource Estimate Reward Project, Nye County, Nevada, USA |
| 10.1 | Drill Methods, Logging and Surveys |
Summaries of drill campaigns
by Gexa, Barrick, Glamis, Canyon, Atna and CR Reward are provided below. No drilling information exists for Homestake (4 holes), 1988-1989
Pathfinder (33 holes), Cloverleaf (47 holes) and USNGS (7 holes).
Reverse circulation drilling
across all campaigns was conducted using both dry (from 1987 to 2006) and wet (from 2006 onwards) drilling techniques. All drilling was
completed above the water table and no material down-hole contamination was noted in the RC drilling. RC drill holes were compared to
neighbouring core holes and other RC holes using an Excel Spreadsheets. A visual assessment of the length and magnitude of gold grades
indicated expected similarities for a structurally controlled, epithermal gold deposit. Statistical methods reviewed decay and cyclicity
of grades for the RC holes and found no significant indication for contamination.
Limited down hole surveys
exist for the pre-CR Reward holes. However, most mineralised intercepts from historical drill holes were within the first 500 ft and only
minor down hole deviation is expected over these short depths combined with observed minimal deviation (<2°) from the CR Reward
program.
Gexa RC drilling was mostly
carried out by Pollocks Drilling using an CP-650WS RC rig, hole diameters were 13.3 cm (5 ¼ inches) and logging captured drill
recovery, lithology, colour, vein/silica alteration, oxide intensity, sulphide percentage. Drill hole inclinations were vertical or -60°
towards the west (270°).
Pathfinder RC drilling was
carried out by Hawkworth Drilling using a Schramm truck mounted RC rig, hole diameters are unknown and logging captured drill recovery,
lithology, vein/silica alteration, oxide intensity, fragment shape and sulphide percentage. Drill hole inclinations were -60° towards
the west (270°).
| 10.1.3 | Barrick (1995-1996) and Glamis (1998-2000) |
Both Barrick and Glamis RC
drilling were carried out by Eklund Drilling using an MPD-1500 RC rig, hole diameters were 13.0 cm (5 ⅛ inches) and logging captured
lithology, vein abundance, oxide intensity, sulphide percentage. The three Barrick core holes were drilled with a DMW-65 core rig (operator
unknown) and logging captured core recovery, lithology, vein abundance, oxide and sulphide intensity plus percentage. Core recovery for
the three HQ (7.75 cm (3.05 inches) diameter) holes ranged from 85% to 96%. Majority of the holes from both companies were drilled towards
the west (270°) at inclinations ranging from -40° to -75°. In 1995, Barrick surveyed collar coordinates in the local grid,
as well as completed a review of all pre-Barrick holes and updated coordinates where necessary.
| Effective Date: May 31st, 2022 | | 55 |
| Technical Report - Mineral Resource Estimate Reward Project, Nye County, Nevada, USA |
Canyon RC drilling was carried
out by Boart-Longyear, hole diameters were 14.0 cm (5½ inches) and logging captured lithology, vein abundance, oxide intensity,
sulphide percentage. The four core holes were drilled with a CS1000PL and Hagby 1000 rigs (operator was Hansen Drilling) and logging captured
core recovery, lithology, vein abundance, oxide and sulphide intensity plus percentage. Core was photographed and average core recovery
for the holes was >95%. Majority of the holes from both companies were drilled vertically or towards the west (270°) at inclinations
ranging from -60° to -80°. Down-hole surveys for core holes were collected every 30 m (100 ft) using an Easy Shot tool. Collar
coordinates were surveyed by a licensed surveyor from Triangle Surveying.
Atna RC drilling was carried
out by National Drilling using a Schramm T65WS rig, hole diameters were 14.0 cm (5 ½ inches) and logging captured lithology, vein
abundance, oxide intensity, sulphide percentage. Majority of the holes from both companies were drilled vertically or towards the west
(270°) at inclinations ranging from -65° to -75°. Collar coordinates were surveyed by a licensed surveyor from Great West
Surveying using a differential GPS instrument.
| 10.2 | CR Reward Core Drilling Program (2017-2018) |
CR Reward’s drilling
in 2017 and 2018 was designed for the main purposes of collecting metallurgical samples (5 holes), obtaining geotechnical data and samples
(7 holes), increasing the number of core holes and specific gravity determinations on the project as well as resource delineation (16
holes).
The program was conducted
under the supervision of CR Reward geologists and by Major Drilling as the drilling contractor. All drilling was conducted using an LF
90D Surface Core rig with HQ diameter core. A total of 27 holes were planned but 28 holes were drilled due to the abandonment of hole
CRR17-002 at 148 ft due to ground conditions and was re-drilled as CRR17-002A. Drill hole collar co-ordinates are provided in Table 10.2
and shown on Figure 10.1
The CR Reward geologists
completed the following activities:
| ● | Geotechnical data was collected by CR Reward
geologists included rock quality designation (RQD), core recovery, rock hardness, and fracture density. |
| ● | A detailed geological log was completed on the
whole core by CR Reward geologists that included lithologic data, mineralization, hydrothermal alteration and structural features with
respect to the core axis. |
| ● | The whole core was digitally photographed and
high-resolution digital jpeg images were archived for future reference. |
| Effective Date: May 31st, 2022 | | 56 |
| Technical Report - Mineral Resource Estimate Reward Project, Nye County, Nevada, USA |
Down-hole surveys were completed
at regular intervals, usually 7.6 m (25 ft), using an Ezi-Shot system that records the magnetic heading, dip of the hole and magnetic
field in the hole. A total of 398 measurements were collected for the 28 holes drilled.
Core recovery during the
core drilling was very good, exceeding 95% on average, with losses mainly in highly shattered zones.
Table 10.2. CR Reward Drill Hole Collars (2017-2018).
| Hole ID |
Easting
(ft) |
Northing
(ft) |
Elevation
(ft) |
Azimuth
(º) |
Dip
(º) |
Drilled
Length
(ft) |
| CRR17-001 |
66538.0 |
3424.6 |
3844.4 |
325 |
-78 |
385 |
| CRR17-002 |
66175.4 |
4329.6 |
3990.8 |
300 |
-60 |
148 |
| CRR17-002A |
66171.8 |
4331.5 |
3990.7 |
300 |
-60 |
274 |
| CRR17-003 |
65779.0 |
5131.8 |
4180.4 |
310 |
-57 |
375 |
| CRR17-004 |
64907.6 |
3467.2 |
3792.1 |
225 |
-80 |
90 |
| CRR17-005 |
64429.3 |
3972.0 |
3920.4 |
225 |
-60 |
175 |
| CRR17-006 |
64616.7 |
3804.4 |
3884.6 |
225 |
-60 |
175 |
| CRR17-007 |
65755.2 |
5414.2 |
4288.0 |
74 |
-70 |
380 |
| CRR17-008 |
64950.3 |
3345.5 |
3770.1 |
225 |
-75 |
125 |
| CRR17-009 |
66819.8 |
4022.9 |
3953.9 |
275 |
-75 |
523 |
| CRR17-010 |
66169.4 |
4186.8 |
3946.3 |
240 |
-70 |
420 |
| CRR17-011 |
66592.0 |
4291.3 |
4008.4 |
16 |
-70 |
663 |
| CRR17-012 |
66845.4 |
3847.7 |
3908.8 |
289 |
-75 |
820 |
| CRR17-013 |
65699.2 |
4291.3 |
4191.9 |
275 |
-60 |
436 |
| CRR18-014 |
66647.7 |
3847.7 |
3831.6 |
290 |
-78 |
730 |
| CRR18-015 |
66099.0 |
5104.8 |
4207.5 |
55 |
-75 |
643 |
| CRR18-016 |
66733.1 |
3180.3 |
3858.3 |
280 |
-66 |
525 |
| CRR18-017 |
66897.5 |
4930.6 |
3984.5 |
30 |
-60 |
400 |
| CRR18-018 |
64987.6 |
3338.1 |
3758.6 |
225 |
-48 |
100 |
| CRR18-019 |
66790.2 |
4122.9 |
3879.8 |
104 |
-80 |
564 |
| CRR18-020 |
65093.8 |
3288.3 |
3736.0 |
225 |
-75 |
150 |
| CRR18-021 |
65328.5 |
3464.8 |
3695.9 |
270 |
-75 |
350 |
| CRR18-022 |
66814.7 |
3140.7 |
3892.6 |
270 |
-60 |
650 |
| CRR18-023 |
66178.2 |
4799.5 |
4165.7 |
270 |
-80 |
575 |
| CRR18-024 |
66181.1 |
4619.5 |
4088.1 |
284 |
-57 |
520 |
| CRR18-025 |
65270.8 |
2899.3 |
3700.3 |
270 |
-72 |
375 |
| CRR18-026 |
66354.7 |
4217.5 |
3961.8 |
285 |
-60 |
350 |
| CRR18-027 |
65386.9 |
2725.5 |
3694.3 |
270 |
-70 |
375 |
| Effective Date: May 31st, 2022 | | 57 |
| Technical Report - Mineral Resource Estimate Reward Project, Nye County, Nevada, USA |
The relationship between
intercept thickness and true thickness varies by hole dip and style of mineralization intercepted. Intercepts thicknesses typically represent
60% to 90% of the true mineralized thickness. The northern area of Good Hope (5200 N) has near vertical swath of mineralization approximately
18 m (60 feet) wide and 183 m (600 feet) tall. The central portion of Good Hope (4800 N) is 76 m (250 feet) thick and 131 m (430 feet)
wide.
Data was compiled in Maxwell
Geo Services’ Data Shed database software and exported as text files for import into a Vulcan database for resource estimation purposes.
Program results are summarized in Table 10.3.
Table 10.3. Results of CR Reward Drill Holes
(2017-2018).
| Hole
ID |
From
(ft) |
To
(ft) |
Drilled
Length
(ft) |
Au
(oz/st) |
| CRR17-001 |
255 |
263 |
8 |
0.040 |
| CRR17-001 |
273 |
288 |
15 |
0.111 |
| CRR17-001 |
338 |
355 |
17 |
0.043 |
| CRR17-002 |
55.5 |
72.8 |
17.3 |
0.155 |
| CRR17-002 |
80 |
106.1 |
26.1 |
0.049 |
| CRR17-002 |
135.5 |
148 |
12.5 |
0.053 |
| CRR17-002A |
53 |
103 |
50 |
0.071 |
| CRR17-002A |
131 |
140 |
9 |
0.055 |
| CRR17-002A |
176 |
237 |
61 |
0.033 |
| CRR17-003 |
144 |
185.5 |
41.5 |
0.031 |
| CRR17-004 |
No significant assays |
| CRR17-005 |
No significant assays |
| CRR17-006 |
No significant assays |
| CRR17-007 |
No significant assays |
| CRR17-008 |
53 |
63 |
10 |
0.075 |
| CRR17-009 |
338 |
440 |
102 |
0.050 |
| CRR17-009 |
455 |
467 |
12 |
0.028 |
| CRR17-010 |
3 |
15 |
12 |
0.019 |
| CRR17-010 |
40 |
60 |
20 |
0.071 |
| CRR17-010 |
69 |
93 |
24 |
0.015 |
| CRR17-011 |
297 |
315 |
18 |
0.034 |
| CRR17-011 |
328 |
376 |
48 |
0.046 |
| CRR17-011 |
537 |
546 |
9 |
0.027 |
| CRR17-012 |
350 |
418 |
68 |
0.048 |
| CRR17-012 |
464 |
474.5 |
10.5 |
0.023 |
| CRR17-013 |
No significant assays |
| CRR18-014 |
255 |
264 |
9 |
0.035 |
| CRR18-014 |
314 |
358 |
44 |
0.034 |
| Effective Date: May 31st, 2022 | | 58 |
| Technical Report - Mineral Resource Estimate Reward Project, Nye County, Nevada, USA |
| Hole ID |
From
(ft) |
To
(ft) |
Drilled Length
(ft) |
Au
(oz/st) |
| CRR18-014 |
379 |
433 |
54 |
0.034 |
| CRR18-015 |
16 |
45 |
29 |
0.044 |
| CRR18-015 |
84 |
98 |
14 |
0.030 |
| CRR18-015 |
106 |
121.5 |
15.5 |
0.020 |
| CRR18-016 |
301 |
346.5 |
45.5 |
0.022 |
| CRR18-016 |
441 |
452 |
11 |
0.028 |
| CRR18-017 |
No significant assays |
| CRR18-018 |
46.1 |
59 |
12.9 |
0.106 |
| CRR18-019 |
No significant assays |
| CRR18-020 |
No significant assays |
| CRR18-021 |
180 |
210 |
30 |
0.099 |
| Includes |
185 |
190 |
5 |
0.468 |
| CRR18-022 |
352 |
368.5 |
16.5 |
0.037 |
| CRR18-022 |
434 |
453 |
19 |
0.032 |
| CRR18-022 |
526 |
537 |
11 |
0.038 |
| CRR18-022 |
547 |
567 |
20 |
0.019 |
| CRR18-023 |
70 |
89 |
19 |
0.030 |
| CRR18-023 |
108 |
131 |
23 |
0.023 |
| CRR18-024 |
67.5 |
250 |
182.5 |
0.042 |
| CRR18-024 |
312 |
327 |
15 |
0.072 |
| CRR18-024 |
421 |
485 |
64 |
0.023 |
| CRR18-025 |
No significant assays |
| CRR18-026 |
64 |
117.6 |
53.6 |
0.029 |
| CRR18-026 |
173.1 |
184.5 |
11.4 |
0.025 |
| CRR18-026 |
225.2 |
305.4 |
80.2 |
0.044 |
| CRR18-027 |
100 |
113 |
13 |
0.135 |
| CRR18-027 |
132 |
150 |
18 |
0.067 |
| CRR18-027 |
244 |
264 |
20 |
0.052 |
| CRR18-027 |
274 |
284 |
10 |
0.017 |
Core twin holes of RC holes
were drilled by Barrick to collect metallurgical samples. The mineralised interval thickness between the original and twin hole are considered
excellent (Table 10.4) and correlation of Au grades are considered good for the style of deposit. The re-drill of core hole CRR17-002
with core hole CRR17-002A also shows an excellent correlation for grade and interval thickness.
Assessment of the core and
RC twin holes was conducted with Excel spreadsheets where the grade versus depth was plotted for the core hole and the RC twin on the
same plot. Differences, based on thickness of the mineralized zone and magnitude of the grade, were displayed allowing for visual detection
of variances in the grades. As the distance between sample pairs increased, variances in the grades were give less consideration.
| Effective Date: May 31st, 2022 | | 59 |
| Technical Report - Mineral Resource Estimate Reward Project, Nye County, Nevada, USA |
Table 10.4. Results of Reward Twin Holes.
| Original
Hole ID |
From
(ft) |
To
(ft) |
Interval
(ft) |
Au
(oz/st) |
Twin
Hole ID |
From
(ft) |
To
(ft) |
Interval
(ft) |
Au
(oz/st) |
| R95-127 |
80.0 |
195.0 |
115.0 |
0.046 |
R95-206C |
80.0 |
190.0 |
110.0 |
0.067 |
| R95-130 |
55.0 |
175.0 |
120.0 |
0.049 |
RC95-207C |
55.0 |
175.0 |
120.0 |
0.068 |
| R95-130 |
215.0 |
260.0 |
45.0 |
0.013 |
RC95-207C |
205.0 |
272.2 |
67.2 |
0.007 |
| R95-167 |
5.0 |
245.0 |
240.0 |
0.049 |
RC95-208C |
9.0 |
249.2 |
240.2 |
0.054 |
| CRR17-002 |
7.4 |
148.0 |
140.6 |
0.032 |
CRR17-002A |
7.0 |
144.0 |
137.0 |
0.031 |
In the opinion of the QP,
the quantity and quality of the lithological, alteration, mineralisation, collar and down hole survey data collected across all campaigns
are sufficient to support Mineral Resource estimation as follows:
| ● | RC drilling was completed above the water table
and no evidence of down-hole contamination has been identified. |
| ● | RC and core logging meets industry standards
for this type of deposit. |
| ● | Collar surveys have been performed using industry-standard
instrumentation. |
| ● | Down hole surveys were performed using industry-standard
instrumentation and minimal down hole deviations are observed. |
| ● | Recovery data from core drill programs are acceptable. |
| 11 | Sample Preparation, Analyses and Security |
| 11.1 | Pre-CR Reward Drill Sampling, Analysis and Security |
All RC drill campaigns sampled
cuttings on 1.5 m (5 ft intervals). For the core holes, Barrick sampled half core on 1.5 m (5 ft) intervals, Canyon sampled half core
on 3 m (10 ft) intervals and CR Reward sampled half core predominantly on 1.5 m (5 ft) intervals or shorter based on geological breaks.
No sampling and analytical
information is available for the campaigns completed by Homestake, Pathfinder, Cloverleaf or USNGS.
Gexa submitted Au and Ag
samples to an internal lab for analysis that included a cyanide digest with atomic absorption (AA) finish. Fire assay (FA) Au samples
were submitted to Bondar-Clegg and Company Ltd for analysis. No information is available for how the samples were prepared, size of the
analytical samples or QAQC protocols.
| Effective Date: May 31st, 2022 | | 60 |
| Technical Report - Mineral Resource Estimate Reward Project, Nye County, Nevada, USA |
| 11.1.2 | Barrick (1995-1996) |
Barrick samples from 1995
were prepared and analyzed by Chemex Labs, Inc., Nevada. Sample preparation included 4-7 kg (8.8-15 lb) of material was crushed (Chemex
code 294), followed by 200-250 g (7.1-8.8 oz) subsample was split and pulverized in a ring mill to approximately 150 mesh (Chemex code
205). Gold analytical methods included 30 g FA digest with atomic absorption finish (AA; Chemex code 99), 1 assay ton (29 g) FA with gravimetric
finish for all results >0.3 oz/st Au and most results >0.18 oz/st Au (Chemex code 997). Barrick ran 30 g (1.1 oz) cold cyanide leach
with AA finish (Chemex code 830) for select samples from five holes. Silver was analysed using an aqua-regia digest with AA finish (Chemex
code 6). Chemex reported internal standard, duplicate and blank results but no information is available for Barrick’s internal QAQC
protocols.
Barrick samples in 1996 were
analyzed by Barringer Laboratories Inc., Colorado. No information is available for how the samples were prepared. Analytical methods included
Au reported from a FA digest with AA and Ag reported from an aqua-regia digest with AA finish.
Glamis submitted samples
for fire assay Au and aqua-regia Ag analyses to Rocky Mountain Geochemical of Nevada (RMGN), and for cyanide Au analysis to Marigold Mine
(MMC). No information is available for how the samples were prepared, size of the analytical samples or QAQC protocols.
Canyon reverse circulation
sampling procedure included two samples collected (one for laboratory analysis and the second retained as a duplicate) over every 1.5
m (5 ft) interval using a wet rotary splitter. Samples were collected using two 19 L (five-gallon) plastic buckets. Drill core was saw
cut down the long axis of the core, sampling collected at regular 1.5 m (5 ft) intervals in a labelled sample bag. The remaining half
of the core was retained for reference. All RC and core samples were stored in a locked steel transport container on site until transportation
to the assay laboratory.
Sample preparation and analyses
for all RC and drill core samples were submitted to the ALS Global (ALS) in Reno Nevada. ALS is an independent, accredited laboratory
with ISO 9001:2000 certification. Upon receipt at the laboratory samples were dried, crushed to P70 <2 mm (0.08 inch) and
200 g (7.1 oz) sample was riffle split then pulverized to P85 <75 μm. Gold analysis was completed on a 30 g (1.1 oz)
split using a FA digest with an atomic absorption spectroscopy (AA) finish (ALS code Au-AA23). Select intervals for metallurgical purposes
from core holes MC-1, MC-3 and MC-5 were also analyzed for Au using ore grade 30 g (1.1 oz) FA with AA finish (ALS code Au-AA25) for an
original and duplicate sample, a 30g (1.1 oz) cyanide leach with AA finish for Au, and a 0.4 g (.01 oz) four acid with ICP-AES or AA finish
for Ag. Received sample weights were also reported on the certificate of analysis.
| Effective Date: May 31st, 2022 | | 61 |
| Technical Report - Mineral Resource Estimate Reward Project, Nye County, Nevada, USA |
Canyon QAQC protocols included
one certified standard inserted approximately every tenth sample. Two Rock Labs certified standards during the campaign included SK21
(0.118 oz/st Au) and SG14 (0.029 oz/st Au), and blank material used was silica sand. A total of 37 certified standards were inserted along
with 1,224 RC samples and 183 core samples during the 2006 and 2007 drilling campaigns. It is unknown if any blanks or duplicates were
inserted as part of the QAQC. Results from the Canyon campaigns included:
| ● | Majority of the standards returned low relative
standard deviations of less than 6% and a low bias range of -2.7% to 0.0%. Five of the 21 SK21 standards were below the minus three standard
deviations and therefore potentially represent a low bias for those intervals. All 11 results from standard SG14 were within three standard
deviations. |
Atna’s reverse circulation
sampling procedure included one sample collected over every 1.5 m (5 ft) interval using a wet rotary splitter and a field duplicate sample
was collected every 20th sample (or 30 m (100 ft) intervals) from a secondary rotary splitter. Samples were collected using
pre-numbered cloth sample bags (labelled without reference to the drill hole interval). Standard reference material and blanks were inserted
in the sample sequence by Atna prior to laboratory despatch.
The sample preparation and
analytical analyses for all RC chip samples from the 2011 program were completed at Inspectorate in Sparks, Nevada. Inspectorate is an
independent, accredited laboratory with ISO 9001:2000 certification. Samples submitted were dried and crushed to P80 <1.7
mm then split and pulverized to P85 <75 μm. Gold analysis was completed on a 1-assay ton (29 g (1 oz)) split with a FA
digest and AA finish. If samples assayed >0.3 oz/st Au. (Inspectorate code Au-1AT-AA). Inspectorate completed a second 1-assay ton
analysis with a fire assay digest and gravimetric finish (Inspectorate code Au-1AT-GV).
For the 2013 program, Atna
submitted samples to American Assay Laboratories (AAL) in Sparks, Nevada. AAL is an independent, accredited laboratory with ISO 17025:2005
accreditation. Samples submitted were dried and crushed to P70 <2mm (0.08 inch) then split and pulverized to P85
<75μm. Gold analysis was completed on a 1-assay ton (29g (1 oz)) split with a fire assay digest and AA finish. If samples assayed
>0.3 oz/st Au. (AAL code Au-FA30). Inspectorate completed a second 1-assay ton analysis with a FA digest and gravimetric finish (AAL
code Au-GRAV). Received sample weights were also reported on the certificate of analysis.
| Effective Date: May 31st, 2022 | | 62 |
| Technical Report - Mineral Resource Estimate Reward Project, Nye County, Nevada, USA |
Atna’s QAQC protocols
for both campaigns included a certified standard and blank that were inserted alternatingly every approximate tenth sample. Thirteen Rock
Labs standards (OxA71, OxA89, OxC102, OxE86, OxF65, OxF100, OxG99, OxH66, OxJ68, SF45, SI54, SJ53) were used with recommended values ranging
from 0.0025 oz/st Au to 0.0769 oz/st Au. Blank material used was red basaltic cinder.
Atna submitted a total of
198 standards, 216 blanks and 165 field duplicate samples along with a total of 3,570 RC samples during the 2011 and 2013 drilling campaigns.
QAQC results from the Atna campaigns included:
| ● | Five hundred and seventy-nine (579) QAQC samples
were inserted, representing one QA/QC samples for every 7.2 core samples, or 14.0% of the total samples submitted. |
| ● | A 99% pass rate for the blank material, with
only two of the 101 blanks from the 2011 program above the threshold. |
| ● | Majority of the standards returned low relative
standard deviations of less than 5% and a low bias range of -3.7% to 0.3%. A total of 13 of the 198 standards were outside of three standard
deviations with the nine of the failures associated with recommended standard values of <0.006 oz/st Au. |
| ● | Sixty-two of the 165 field duplicate samples
yielded mean values >0.003 oz/st and the overall variability was low (<30% coefficient of variation). |
| 11.2 | CR Reward Sampling, Analysis and Security (2017-2018) |
CR Reward drilling and sampling
was carried out under the supervision of CR Reward geologists. The chain custody involved from the field to the sample preparation facility
was continually monitored. Drill core was collected from the drill rig by CR Reward personnel and transported to a secure logging facility
in Beatty, Nevada for the first half of the drill program. For the second half of the program the drill core was shipped to the ALS laboratory
facility in Reno for logging.
Subsequent to completion
of core logging and photography, the sampling protocol involved:
| ● | The core and core box were marked for by CR Reward
personnel for sample collection and sample tags were stapled to the core box at the beginning of the interval. The dominant sample interval
length was 5ft with lengths adjusted based on lithological and alteration changes. The maximum sample length of 4.6 m (15 ft) and minimum
of 0.2 m (0.7 ft). |
| ● | Whole HQ-size core was cut in half (rock sawed)
by ALS staff at their Reno facility. Sawed core sample intervals were recorded on daily cut core sheets for review each day. |
| ● | Samples for geochemical analysis were collected
by laboratory personnel and placed into bags. The samples comprised one half of the HQ-size core, with the remaining core for each retained
in their original core boxes. Core split by ALS staff were retained in core boxes stored in secured ALS warehouses. |
| Effective Date: May 31st, 2022 | | 63 |
| Technical Report - Mineral Resource Estimate Reward Project, Nye County, Nevada, USA |
Standard reference material
blanks and field duplicates were inserted into the sample sequence at the rate of approximately one in every 10 samples.
| 11.2.1 | Diamond Drill Core Sample Preparation and Analysis |
The 2017–2018 drill
program totalled 3,443 m (11,296 ft), which included 28 core-holes, 2,330 samples, and 22 unsampled intervals due to poor or no core recovery.
A total of 2,760 samples, inclusive of QA/QC samples, were submitted to ALS and Florin Analytical (FLOR) for preparation and analyses.
All geochemical analyses were completed by ALS, with the exception of CRR17-004 that was analysed at FLOR. ALS is an independent, accredited
laboratory with ISO 9001:2000 certification. Figure 11.1 is a flowsheet summarizing the sample preparation and analysis protocols used
for the 2017–2018 drill program.
CR Reward personnel arranged
shipping to the ALS facility in Reno, Nevada, for sample preparation and geochemical analysis. Samples were logged into a computer-based
tracking system, weighed and dried. Samples were removed for bulk density measurements conducted using paraffin wax coated samples and
a water displacement method (ALS code OA-GRA09a). Bulk density determinations were carried out at ALS’ Vancouver laboratory and
these samples were not re-inserted for assaying. The entire assay sample was crushed so that +70% passes a 2 mm screen, then a 250 g (8.8
oz) split was selected and pulverized to better than P85 <75 µm (ALS code PREP-31Y). Two 30 g (1.1 oz) aliquots were
extracted from the pulp and one 30 g (1.1 oz) sample was analysed for gold using a fire assay fusion, digestion and with atomic absorption
spectroscopy followed up with an inductively-coupled plasma atomic emission spectroscopy (ICP-AES) finish (ALS code Au-AA23). The second
30 g (1.1 oz) sample was analysed using a cyanide leach digest followed by a AA finish (ALS code Au-AA13). Any fire assay samples that
returned >0.292 oz/st Au were re-assayed using a second fire assay fusion with a gravimetric finish (ALS code Au-GRAV21). A 0.25 g
(0.0089 oz) aliquot was split off for multi-element analysis using four acid digestion (ALS code ME-MS61m) with an inductively coupled
plasma mass spectrometry (ICP-MS) finish. All assay analyses were completed at the ALS’ Reno laboratory.
In the case of FLOR, CR Reward
arranged sample shipping to the FLOR laboratory in Reno, Nevada for sample preparation and geochemical analysis. Core submitted to FLOR
were intended for metallurgical test work. Upon arrival at the laboratory, the core was laid out and the marked sample intervals were
removed for physical testing (comminution test work) and bulk density test work. The remaining intervals (1.5 m (5 ft) intervals or as
marked by CR Reward personnel) were bagged, weighed and stage crushed to minus 25 mm (0.98 inch). From each interval a 1,000 g (35.3 oz)
portion was riffle split out, weighed and dried to a constant weight at 106°C. The dried material was then crushed to -1.7 mm (0.067
inch) and a 500 g (17.6 oz) portion was split out and ring and puck pulverized to -0.15 mm (0.0059 inch). The 500 g (17.6 oz) portions
were used for interval assays. Several sample intervals weighed <5 kg; for these samples only a 500 g (17.6 oz) portion was split out
from the 25 mm (0.98 inch) crushed material. The 500 g (17.6 oz) portion was dried and crushed to -1.7 mm (0.067 inch) and then ring and
puck pulverized to -0.15 mm (0.0059 inch). A 50 g aliquot was extracted from the pulp and was analyzed for gold using a FA fusion, digestion
and with AAS finish (FLOR code 4018). Silver was analyzed using four-acid digestion with an AAS finish (FLOR code 7048). Additionally,
select samples were assayed for gold, silver and copper by gold cyanidation with a 24-hour cyanide shake and AAS finish (FLOR code 6007).
| Effective Date: May 31st, 2022 | | 64 |
| Technical Report - Mineral Resource Estimate Reward Project, Nye County, Nevada, USA |
Figure 11.1. CR Reward Sample Flow Chart.
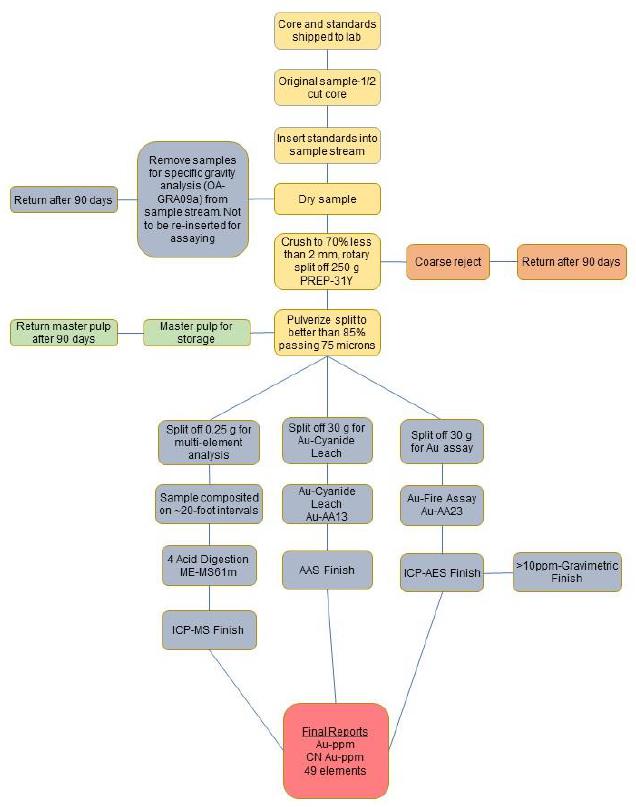
Source: Fowlow (2018a,b)
| Effective Date: May 31st, 2022 | | 65 |
| Technical Report - Mineral Resource Estimate Reward Project, Nye County, Nevada, USA |
The sample collection, security,
transportation, preparation, insertion of geochemical standards and blanks and analytical procedures are within industry norms and best
practices. The procedures used by CR Reward personnel are considered adequate to ensure that the results disclosed are accurate within
scientific limitations and are not misleading. The procedures and assay control protocols employed by CR Reward in the 2017 and 2018 drill
program are considered reasonable and acceptable for use in Mineral Resource Estimation.
| 11.3 | CR Reward QAQC Results (2017-2018) |
Of the 2,760 samples submitted
for analysis, 430 were QA/QC samples inserted by CR Reward personnel, representing one QA/QC samples for every 6.4 core samples, or 15.6%
of the total samples submitted. The QC samples consisted of a total of 111 CDN standards, 92 blanks, 68 core duplicates, 79 crush duplicates
and 80 pulp duplicates. APEX considers this adequate to ensure that each batch of assays included at least CR Reward-inserted blank and
standard sample.
A total of 92 blank samples
were inserted in the sample stream by CR Reward personnel during the 2017–2018 drill program (Table 11.1). Garden marble was sourced
from local hardware stores for blank material. A total of 14 of the samples returned values above the detection limit for gold (Figure
11.2); however, only one sample assayed greater than 0.0004 oz/st Au (maximum value of 0.0005 oz/st Au). The results for the blanks are
considered acceptable based on a 1% fail rate.
Figure 11.2. Blank Results from 2017-2018 Drilling
Sorted by Date Analyzed.

| Effective Date: May 31st, 2022 | | 66 |
| Technical Report - Mineral Resource Estimate Reward Project, Nye County, Nevada, USA |
Table 11.1. Summary Results of Blank Material
from the 2017-2018 Drill Program.
| Blanks |
ALS
Global |
Total |
| Count |
92 |
92 |
| Count >0.0004 oz/st |
1 |
1 |
| Percent Fail |
1.1% |
1.1% |
| 11.3.2 | Standard Reference Materials |
A total of 111 standard reference
materials (SRM) were inserted in the sample stream by CR Reward during the 2017–2018 drill program. Two standard types were sourced
from CDN Resource Laboratories Ltd and had recommended values of 0.018 oz/st Au (CDN-GS-P6B) and 0.068 oz/st Au (CDN-GS-2L).
The inserted CDN-GS-P6B
standard (0.018 oz/st Au) reported 14 out of 57 analyzes outside of two standard deviation, and 7 samples outside of three-standard deviation
(Figure 11.3). Most of the CDN-GS-P6B SRM failures are considered marginal failures, that is, just outside the two-standard deviations
boundaries and within three-standard deviations. The failures have likely resulted from a poorly homogenized standard and/or perhaps
due to minor laboratory preparation or analytical errors. Results outside of three standard deviations was accepted if the standard was
within a low-grade (<0.003 oz/st Au) interval. The relative standard deviation of the samples was low at 6.8% and the bias was extremely
low at 0.3% (Table 11.2).
The results for the CDN-GS-2L
standard returned only two of 56 samples outside of the two-standard deviation (Figure 11.4). Both failures were within the three-standard
deviation threshold and are considered marginal failures. The relative standard deviation of the samples was low at 4.0% and the bias
was low at 2.1% (Table 11.2).
In general, the standard
reference material results are considered acceptable based on high precision (or low relative standard deviation) and low bias.
Table 11.2. Summary Results of Standards from
the 2017-2018 Drill Program.
| SRM |
SRM Value
(oz/st Au) |
SRM 1 SD
(oz/st Au) |
Count |
RSD% |
Bias |
Within
2SD |
Within
3SD |
| CDN-GS-P6B |
0.018 |
0.0007 |
57 |
6.8% |
0.3% |
75% |
88% |
| CDN-GS-2L |
0.068 |
0.0035 |
54 |
4.0% |
2.1% |
98% |
100% |
| Effective Date: May 31st, 2022 | | 67 |
| Technical Report - Mineral Resource Estimate Reward Project, Nye County, Nevada, USA |
Figure 11.3. CDN-GS-P6B Results from 2017-2018
Program Sorted by Date Analyzed.
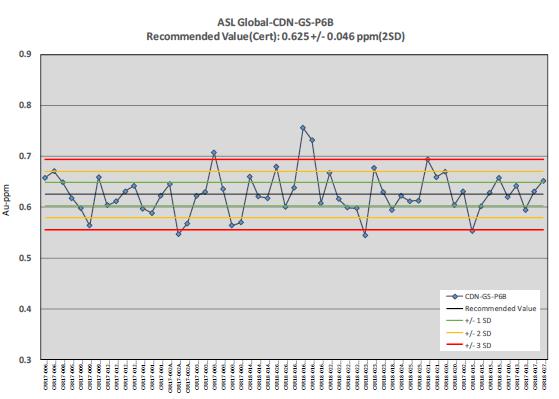
Figure 11.4. CDN-GS-2L Results from 2017-2018
Program Sorted by Date Analyzed.
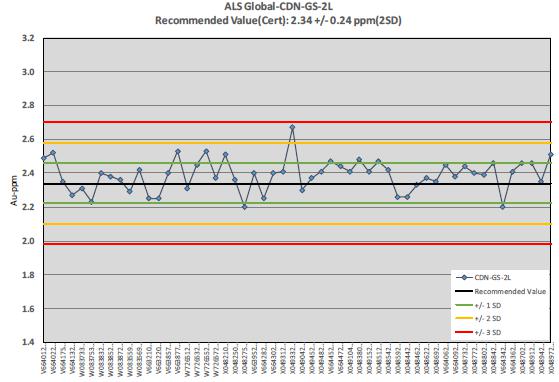
| Effective Date: May 31st, 2022 | | 68 |
| Technical Report - Mineral Resource Estimate Reward Project, Nye County, Nevada, USA |
A total of 68 core field
duplicates, 79 crush duplicates and 80 pulp duplicates were inserted in the sample stream by CR Reward personnel during the 2017–2018
drill program and analyzed by ALS (Figure 11.5). The core duplicates were assayed using FA with a 1 AT aliquot with an AA finish and an
1 AT aliquot cyanide leach with an AA finish. Nineteen of the field duplicates (or 28%) yielded values greater than 30% half relative
difference versus the mean in samples (or 22%), whereas 12 crush duplicates (or 15%) and 11 pulp duplicates (or 11%) generated values
greater than 30% half relative difference versus the mean. A similar reduction in variability from field to crush to pulp and lab duplicates
was calculated with the coefficient of variation. Minor differences are observed in the results from the cyanide leach analysis near the
lower detection limit, however, this is not uncharacteristic. Overall, the results from all duplicates are considered acceptable based
on low variability (<30% coefficient of variation) and progressively lower variability from field to crush to pulp to lab pulp duplicate.
Figure 11.5. Duplicate Results from the 2017-2018
Program.
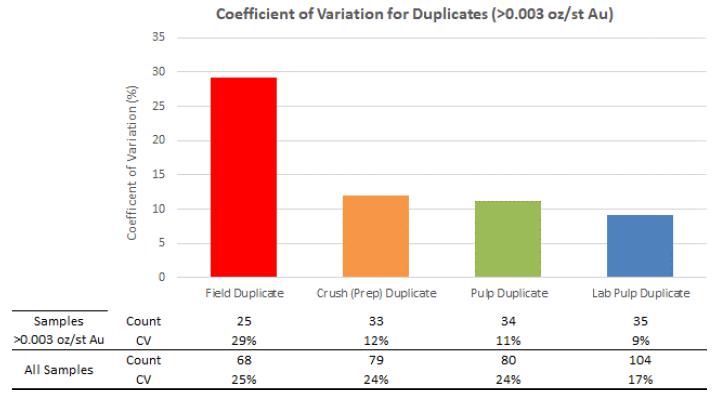
| 11.4 | Comments on Sample Preparation, Analyses and Security |
In the opinion of the QP,
the quantity and quality of the sample procedures and analytical results follow acceptable industry standards. The data are acceptable
to support Mineral Resource and Mineral Reserve estimation.
| Effective Date: May 31st, 2022 | | 69 |
| Technical Report - Mineral Resource Estimate Reward Project, Nye County, Nevada, USA |
The drill hole database was
exported and provided to APEX from CR Reward on April 19, 2018 and consisted of 386 collar entries. Upon review by APEX personnel,
it was determined that there are 376 drill hole collars and 10 road cut or trench locations/entries. The 10-road cut and trench entries
were removed from the database for resource estimation purposes. APEX thoroughly reviewed the drill hole database and the validation conducted
by CR Reward in 2015 to 2017.
The drill hole database used
by APEX personnel for resource estimation, including the recently-completed 2017–2018 drill holes, consists of 143,330 ft in 376
drill holes. The database includes 129,897 ft in 341 pre-CR Reward reverse circulation (RC) holes, 2,137 ft in seven pre-CR Reward core
holes and 11,296 ft in 28 core holes completed during late 2017 to early 2018 CR Reward. The pre-CR Reward drill holes were completed
between 1987 and 2013, with 276 holes completed between 1987 and 1999, and 72 holes between 2000 and 2013. The 2017–2018 core holes
combined with the pre- CR Reward core holes represent about 9.4% of the total drilling. The QP considers the proportion of core holes
to RC holes to be acceptable for Mineral Resource estimation.
The assay database consists
of 26,092 sample intervals, with 23,762 intervals for the historic drill holes and 2,330 intervals for the 2017–2018 core holes.
The sample database contains 336 entries of -9 and 80 blank entries, (less than 1.6% of the database). Most of these entries are attributed
to non-sampled intervals, especially the greater than 5 ft intervals (70 samples) and collar/overburden top of hole intervals. The remaining
dominantly 5 ft intervals without samples are attributed to poor recovery or lost samples.
The 2017 verification program
completed by CR Reward (2017), and reviewed by the QP, included the following:
| · | Verifying collar data versus geologic logs or
certificates from surveyors. |
| · | Verifying collar elevations versus recent or
available topography. |
| · | Verifying down-hole survey data versus geologic
logs and certificates. |
| · | Verifying assay values versus laboratory certificates
or geologic logs where certificates were not available. |
All collar, survey and assay
data for the 28 holes drilled by CR Reward in 2017 and 2018 were verified as part of the database management process and are excluded
from the following summary.
| 12.1.1 | Protocols and Error Tracking of Pre-CR Reward Drill Holes |
The database provided to
APEX consisted of 348 drill holes completed by previous operators. CR Reward (2017) reported that 100% of collar and down-hole survey
data were selected for verification against available geologic logs or certified surveyor reports, whereas 10% of assays were verified
against certified laboratory reports. All verified data and results were provided to APEX and are captured in the Excel spreadsheet 20170215_REW_DH_Verification.xlsx.
The QP reviewed the verification data and the available collar, assay, and survey data.
| Effective Date: May 31st, 2022 | | 70 |
| Technical Report - Mineral Resource Estimate Reward Project, Nye County, Nevada, USA |
| 12.2 | Collar Data Verification |
The Project has been explored
by multiple companies since 1987, including Homestake Mining Company, Galli Exploration Associates (GEXA), TECO, Cloverleaf Gold, Pathfinder
Gold, US Nevada Gold Search, Barrick Gold, Glamis Gold, Canyon Resources and Atna Resources. As with multiple companies and many years
of drilling, many original geologic logs could not be found, and in some instances, only copies of geologic logs were available.
Collar location and total
depth data was initially verified against 178 (or 51%) geologic logs by CR Reward (2017). One hundred and seventy holes (or 49%) lacked
logs and could not be verified. Eleven typographic errors were observed, investigated and corrected. CR Reward (2017) observed from the
geologic logs that at least two local grids were created. At least three local coordinate systems were used by previous operators, e.g.
Galli Exploration in 1987, Pathfinder in 1991 and Barrick in 1995. In 2018, CR Reward generated a low distortion local grid. An Excel
spreadsheet containing control points for the local coordinate grids and UTM NAD27 Z11 coordinates was generated by CR Reward. Collar
locations were plotted on satellite imagery and visually checked against existing pad locations, drill roads and disturbed areas. No major
errors were observed. All collar easting and northing locations were considered acceptable following the review.
CR Reward (2017) also observed
a consistent elevation difference on the R95/96 and RE series drill holes in the drill logs compared to the database values. The elevation
values in the logs were consistently 50 ft to 60 ft higher than the elevations in the database. This elevation discrepancy resulted in
125 quarantined collar elevation values. CR Reward (2017) completed further investigations of the quarantined values against a topographic
surface with 5 ft contour intervals that was generated from an aerial topographic survey performed by Kenney Aerial on December 20,
2006 for Canyon Resources. The database values correlate well against the 2006 aerial topographic survey and with nine holes returning
differences of greater than ±10 ft. The elevation value of these nine holes was corrected to the 2006 survey data. Holes with differences
of less than ±10 ft were considered acceptable. It is interpreted that collar elevations in the logs were registered to a historical
topographic surface. The database values superseded the log values and represent the most accurate data.
CR Reward in 2018 also completed
a field check and identified six collars exposed within the main deposit areas. The collar locations were within 5 ft for northing and
easting values, and within 2 ft of the elevation values.
A total of 20 errors (11
typographic and 9 elevation differences) were identified, investigated and corrected. Upon completion of these changes and the verification
review, the collar database was considered acceptable by the QP for use in the resource estimation process.
| Effective Date: May 31st, 2022 | | 71 |
| Technical Report - Mineral Resource Estimate Reward Project, Nye County, Nevada, USA |
| 12.3 | Down-Hole Survey Data Verification |
The pre-CR Reward database
contains 740 down-hole survey records that were verified using the geologic logs or survey sheets (CR Reward, 2017). Only five of the
drill holes (one RC and four core holes) had a contractor perform the down-hole survey and only two of those holes have survey records
in the geologic logs. The contractor for the four core holes was either the drillers or WellNav with an unknown gyro tool. The contractor
for the RC drill hole is unknown.
All azimuths and dips in
the database were compared to either the geologic logs or contractor field sheets. No certified surveyor reports were available.
A total of 416 down-hole
survey records (or 56%) passed verification, 290 down-hole survey records (or 39%) were not verified due to lack of geologic log or contractor
information, and 34 (or 5%) were quarantined for further investigation. Records that were quarantined were due to the following:
| · | A total of 23 (or 5%) of 450 records with corresponding
logs had typographic errors and were corrected. |
| · | The azimuth on two records (or <1%) could
not be determined from the geologic log but the hole (R95-206C) is a twin of hole R95-127. Geology and assay results from both holes correlate
well and data was accepted. |
| · | A total of nine surveys (or 2%) from two drill
holes (MC-3 and MC-4) were collected by a contractor but field sheets or certificates were not available. Both holes had vertical dips
at the collar, are less than 400 ft in depth and therefore the data was accepted. |
A total of 23 errors, were
investigated and corrected. Upon completion of these changes and the verification review, the survey data was considered acceptable by
the QP for use in the resource estimation process.
The combined historic drill
hole database consists of 23,922 intervals in 348 drill holes. A total of 40 historic drill holes were verified by CR Reward (2017) for
a total of 2,715 intervals (or 11.3%) of the database. Drill holes were selected using a random number generator in Excel. Mine Development
Associates (MDA) were engaged in 2018 to complete independent verification work that included an additional 16 historic holes containing
1,180 intervals (or 4.9%).
| Effective Date: May 31st, 2022 | | 72 |
| Technical Report - Mineral Resource Estimate Reward Project, Nye County, Nevada, USA |
Laboratories involved in
RC and core assay programs included ALS Chemex, American Assay, Barringer, Inspectorate, Bondar Clegg and Rocky Mountain Laboratories.
Certificates were only available for analyses completed at ALS Chemex, American Assay, Barringer and Inspectorate. Two mine laboratories
were used when Glamis Gold was the operator in 1998; these were the mine laboratory at the Daisy Mine, near Beatty and the mine laboratory
at the Marigold Mine, near Valmy. No assay certificates are available from these laboratories.
Results from the CR Reward
assay verification include:
| · | From a total of 2,715 assay intervals, 514 (19%)
of the intervals could not be verified due to either the lack of an assay certificate, geologic log or the interval was illegible on the
log. |
| · | 2,201 (81%) assay intervals contained corresponding
certificates or geologic logs. |
| · | 2,183 assay intervals (or 99%) had no errors
and were flagged as pass. |
| · | 18 assay intervals (or 1%) were quarantined for
further investigation due to data entry errors. Five intervals were corrected and the 13 intervals could not be fully investigated and
were considered immaterial differences. |
Results from the MDA assay
verification include:
| · | A total of 1,180 assay intervals were verified
against both assay certificates and geologic log. Four of the 1,180 intervals (or <0.5%) contained typographic errors that were subsequently
corrected. |
| · | A total of 179 sample depth intervals (depth_from
and depth_to) were verified and no errors were identified. |
A total of 9 (or 0.3%) out
of the 3,381 assay intervals verified during the CR Reward and MDA reviews contained errors that were subsequently corrected and 13 intervals
(or 0.4%) remained unresolved but had immaterial (low grade) values. Upon completion of these changes and the verification reviews, the
assay data was considered acceptable by the QP for use in the resource estimation process based on the low amount of errors.
| 12.5 | Author and QP Site Visits |
Mr. Michael Dufresne,
M.Sc., P.Geol., P.Geo. and QP of this Technical Report, conducted a site inspection of the Project on two separate occasions in 2017 and
2019. On August 2nd, 2017, Mr. Dufresne visited the Property and reviewed drill core at CR Reward’s office
in Reno, NV. On August 12th, 2019, Mr. Dufresne visited the Property and verified the location of a number of drill
collars and on August 15th, 2019, Mr. Dufresne performed an inspection of the Lovelock, NV, core facility and reviewed
Reward Project drill core from the 2017-2018 drill program.
A total of 24 drill holes,
including 18 CR Reward holes and 6 historical holes, were located by Mr. Dufresne and handheld GPS coordinates were recorded and
compared to the original coordinates. Table 12.1 summarizes the verification survey results.
| Effective Date: May 31st, 2022 | | 73 |
| Technical Report - Mineral Resource Estimate Reward Project, Nye County, Nevada, USA |
Table 12.1. Drill Hole Coordinate Comparison.
Coordinates are in UTM NAD 1983 Zone 11.

Appreciating the limited
precision of the handheld GPS, the check GPS coordinates were consistent with the original coordinates with an average variance of 1 m
and a maximum variance of 6 m. In the opinion of the QP Mr. Dufresne, the differences are not viewed as material.
During the inspection of
the core facility in Lovelock, NV, Mr. Dufresne reviewed mineralized intervals in CR Reward drill holes CRR17-09, CRR18-014 and CRR-024.
Significant intercepts of drill holes CRR17-09, CRR18-014 and CRR-024 are listed in Table 12.2. Photographs taken by Mr. Dufresne
of the drill core are presented in Figures 12.1 to 12.3.
| Effective Date: May 31st, 2022 | | 74 |
| Technical Report - Mineral Resource Estimate Reward Project, Nye County, Nevada, USA |
Table 12.2. Significant Intercepts of Drill
Holes Reviewed During Mr. Dufresne’s Inspection of the CR Reward Core Facility.
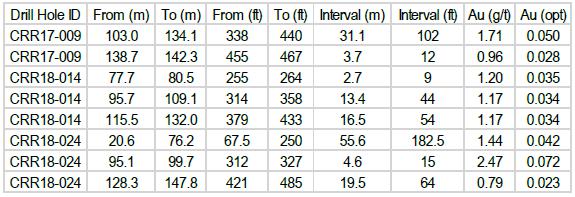
Figure 12.1. Drill hole CRR17-009, Wood Canyon
Formation Mineralized Interval of Phyllite and Oxidized Quartzite (approximately 389 to 401 ft depth).
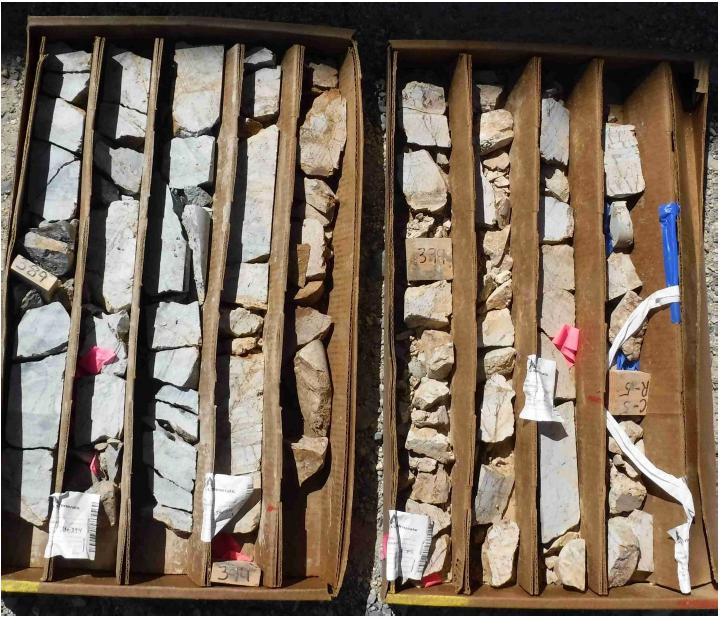
| Effective Date: May 31st, 2022 | | 75 |
| Technical Report - Mineral Resource Estimate Reward Project, Nye County, Nevada, USA |
Figure 12.2. Drill hole CRR18-014, Wood Canyon
Formation Mineralized Interval of Brecciated/Re-healed Quartzite and Sheared and Foliated Phyllite (approximately 399 to 414 ft depth).
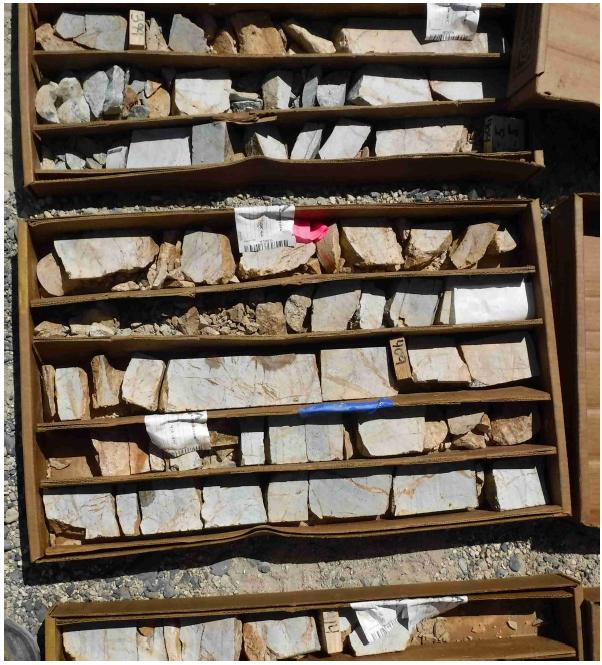
| Effective Date: May 31st, 2022 | | 76 |
| Technical Report - Mineral Resource Estimate Reward Project, Nye County, Nevada, USA |
Figure 12.3. Drill Hole CRR18-024, Wood Canyon
Formation Mineralized Interval of Quartzite (approximately 148 to 153 ft depth).
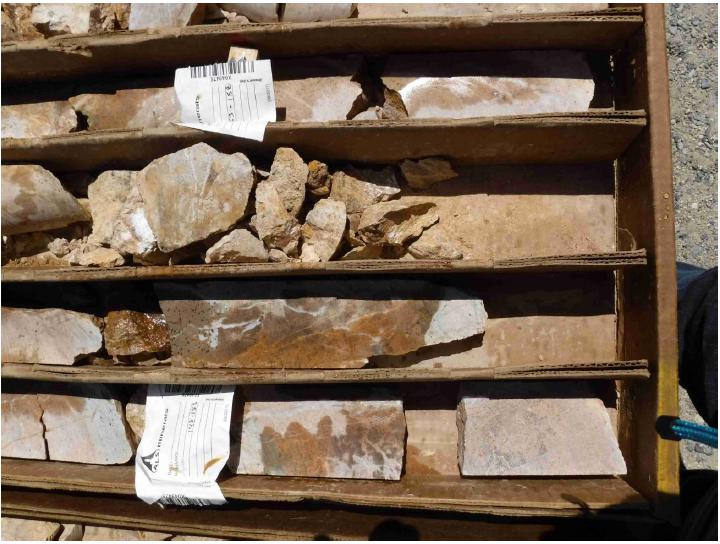
No material field based exploration
work has occurred at the Reward Project since the 2017-2018 drill program. Therefore, Mr. Dufresne considers the most recent site
visit as current. As a result of the site visits, Mr. Dufresne can verify the land position, the geological setting and the mineralization
that is the subject of this Technical Report.
In addition, Mr. Timothy
Scott, BA.Sc. Geological Engineering and QP of this Technical Report, visited the Project on September 22nd, 2018 and
on May 16th, 2022. He inspected the access and associated infrastructure for the Property. He found no evidence of any
changes or work since the CR Reward 2017-2018 drill program.
| Effective Date: May 31st, 2022 | | 77 |
| Technical Report - Mineral Resource Estimate Reward Project, Nye County, Nevada, USA |
| 13 | Mineral Processing and Metallurgical Testing |
Metallurgical test work includes
historical work completed by Rayrock Mines Inc. during 1998 and McClelland Laboratories (McClelland) in 2007 and 2008. Confirmatory test
work was performed by KCA in 2018. Metallurgical test work programs include 34 bottle roll tests and 27 column tests together with preliminary
agglomeration and compacted permeability testing. Results from these tests show that the Good Hope mineralization is amenable to cyanide
leaching with acceptable reagent consumptions.
| 13.1 | 1998 Rayrock Column Tests – Drill Core |
Core used in the 1998 test
program came from the three drill hole locations represents material from the north (drill hole R95-206C), centre (R95-207C) and south
(R95-208C) of the deposit.
Six column tests were leached
for 20 days on original broken core. After the initial 20 days of leaching, the columns were allowed to rest for three days. Following
the resting period, two of the columns were crushed to 1½ inch and all six columns were flood leached four times over a 60-day
period, allowed to drip irrigate for eight days, and then rest for 30 days. During the 30-day rest period, all of the columns were drained
and re-crushed to ¾ inch and restarted and allowed to leach for a further 60 days. Including rest periods, the elapsed test time
was 181 days. All work was conducted at the in-house Rayrock metallurgical laboratory. The extant documentation is a short inter-office
memorandum that does not provide detailed information on the tests. Available results are summarized in Table 13.1. The data suggested
that some higher-grade materials may not leach as well as lower-grade material, which indicated that coarse gold was present in some of
the high-grade core.
The QP notes that given the
somewhat erratic program of leach and rest periods, as well as the different crush sizes introduced mid-stream, the results can only be
considered as indicative. Observations from the program included (Laney, 1998a):
“That the northern most core
would show the lowest recovery was expected due to the more siliceous nature of the ore as it heads to the north…the material does
not produce many fines and is very competent and hard…the material was slow leaching before crushing and the leach kinetics increased
after crushing.”
| Effective Date: May 31st, 2022 | | 78 |
| Technical Report - Mineral Resource Estimate Reward Project, Nye County, Nevada, USA |
Table 13.1. 1998 Rayrock Drill Core Column
Tests Results.
| Drill Hole |
Column No. (Test No.) |
Calculated Head Grade
oz/st Au |
Recovery
% Au |
| R95-206-C-North |
1 (1333) |
0.067 |
50 |
| R95-206-C-North |
2(1334)** |
0.110 |
54 |
| R95-207-C-Central |
3(1335) |
0.030 |
83 |
| R95-207-C-Central |
4(1336) |
0.080 |
80 |
| R95-208-C-South |
5(1337) |
0.079 |
59 |
| R95-208-C-South |
6(1338)** |
0.069 |
69 |
| Note: | Columns initially crushed to minus 1½inch. All columns were later crushed to minus ¾ inch. |
| 13.2 | 1998 Rayrock Column Tests – Trench Samples |
A second Rayrock internal
memorandum reports results of column tests conducted on surface samples taken from backhoe trenches (Laney, 1998b). Trench locations and
the sample compositing methodology were not recorded.
Two sample composites and
four column tests were conducted, with two subsets of each composite conducted with different cyanide solution strengths (1/3 lb/st and
1 lb/st), and two material sizes (“as-is” and crushed to minus ¾ inch). Average head grades were reported to be
0.030 oz/st Au to 0.033 oz/st Au. The leach cycle had an elapsed time of 56 days which included two rest periods that totalled 21 days.
Campaign results are shown in Table 13.2.
| 13.3 | 2007 McClelland Bottle Roll Tests |
During 2007, 96 hr bottle
roll tests were conducted on RC drill cuttings (nominally 10 mesh) from nine different drill holes. Efforts were made to spatially select
the sample intervals across the deposit with respect to elevation (shallow, deep, etc.) as well as area (east, west, etc.).
However, the northern deposit area was not represented in the selected samples.
Results of this program are
shown in Table 13.3. The respective recovery curves are shown in Figure 13.1.
In the samples tested, the
average gold recovery was 70.3%, reagent consumptions were quite low, and it did not appear that there were any significant differences
in recovery by location or depth, or in terms of grade versus recovery.
A composite was generated
for physical characterization tests. Results showed that the crusher work index (CWi) is a very low at 3.7 kWh/st. The abrasion
index (Ai) of 0.4338 g is moderately high.
| Effective Date: May 31st, 2022 | | 79 |
| Technical Report - Mineral Resource Estimate Reward Project, Nye County, Nevada, USA |
| 13.4 | McClelland 2008 Column Test Campaign |
The 2008 program samples
were sourced from three drill holes. Four column tests were conducted at a crush size of P80 of ½ inch and one column
test (composite 5) was conducted at a crush size of P80 of ¼ inch. In addition, bottle rolls were run on column splits
and a separate bottle roll study of size versus recovery was conducted on composite 5. Drain-down data were also measured on the finished
column tests.
Sample composite data are
presented in Table 13.4 and the drill holes selected are shown in Figure 13.2.
Table 13.2. 1998 Rayrock Surface Trench Column
Test Gold Recovery.
| Head
Grade |
#1348
1/3 lb/st CN
“as-is”
% |
#1349
1/3 lb/st CN
Crushed to ¾ inch
% |
#1350
1 lb/st CN
“as-is”
% |
#1351
1 lb/st CN
Crushed to ¾ inch
% |
| 0.033 oz/st Au |
45.80 |
57.83 |
65.50 |
79.31 |
| 0.030 oz/st Au |
49.51 |
62.52 |
70.80 |
85.74 |
Table 13.3. 1998 10 Mesh Reverse Circulation
Drill Holes Bottle Roll Results.
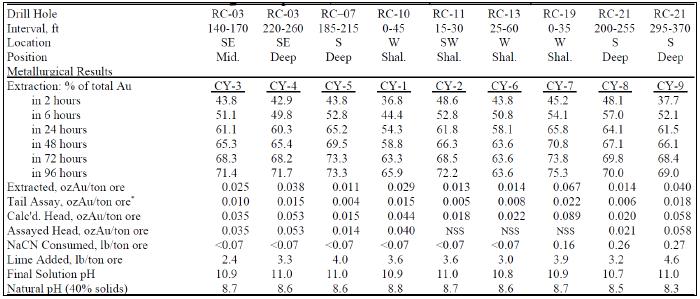
| Effective Date: May 31st, 2022 | | 80 |
| Technical Report - Mineral Resource Estimate Reward Project, Nye County, Nevada, USA |
Figure 13.1. 1998 10 Mesh Bottle Roll Recovery
Curves.
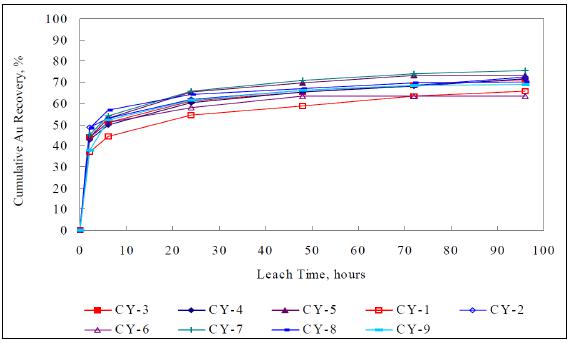
| Note: | Figure from Laney, (1998b). |
Table 13.4. 2008 McClelland Sample/Drill Hole
Composite Information.
| Composite
Sample |
Drill
hole |
Interval
(ft) |
| 1 |
MC 1 |
90-120 |
| 2 |
MC 1 |
150-210 |
| 3 |
MC 3 |
20-190 |
| 4 |
MC 5 |
140-190 |
| 5 |
MC 3
MC 5
MC 5
MC 5 |
20-190
200-210
220-230
340-360 |
| Effective Date: May 31st, 2022 | | 81 |
Technical Report
- Mineral Resource Estimate Reward Project, Nye County, Nevada, USA
Figure 13.2. 2008 McClelland Drill Hole Location
Map.

Note: Figure from McClelland (2008).
| 13.4.1 | 2008 Column Test Results |
A summary of five column
test results is provided in Table 13.5. The corresponding gold recovery curves are shown in Figure 13.3.
| 13.4.2 | 2008 Bottle Roll Test
Results at Crush Size and at 200 Mesh |
Figure 13.4 presents the
bottle roll results of sample splits from each of the column test materials.
Table 13.6 presents bottle
rolls results of column test sample splits ground to P80 of 200 mesh.
| Effective Date: May 31st, 2022 | | 82 |
Technical Report
- Mineral Resource Estimate Reward Project, Nye County, Nevada, USA
Table 13.5. 2008 McClelland Summary Column
Test Results.
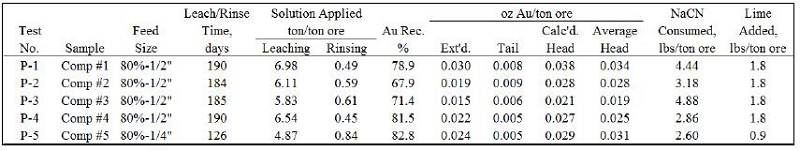
Figure 13.3. 2008 McClelland 10 Gold Recovery
Curves – Column Tests.

Note: Figure from McClelland (2008).
Figure 13.4. 2008 McClelland Bottle Roll Tests
Recovery Curves – Splits from Column Tests.
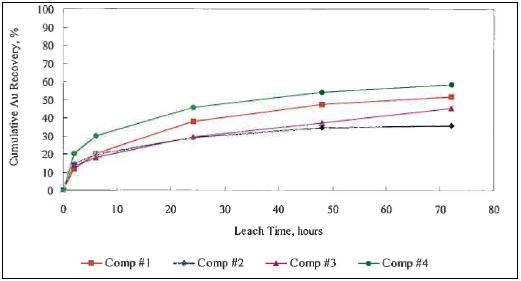
Note: Figure from McClelland (2008).
| Effective Date: May 31st, 2022 | | 83 |
Technical Report
- Mineral Resource Estimate Reward Project, Nye County, Nevada, USA
Table 13.6. 2008 McClelland Bottle Roll Tests
– Gold Recovery %.
| Sample |
P80
½ inch
72 hr |
P80
200 mesh
24 hr |
| Comp
1 |
51.6 |
87.5 |
| Comp
2 |
35.9 |
85.7 |
| Comp
3 |
45.0 |
88.9 |
| Comp
4 |
58.3 |
91.3 |
| 13.4.3 | 2008 Bottle Roll Size
versus Recovery on Composite 5 |
A separate exercise was
conducted to establish a size versus gold recovery relation with respect to bottle rolls. This was conducted only on sample composite
5. Results of the different sizes are shown in Table 13.7. Results are plotted in Figure 13.5.
Drain-down data for each
of the five column tests are presented in Table 13.8.
| 13.4.5 | Conclusions from 2008
McClelland Program |
The average gold recovery
for the four ½ inch crush columns is 74.9%. With an applied laboratory to field deduction of 2%, a field recovery of 72.9% could
be expected at that crush size.
Only one column test was
conducted at P80 of ¼ inch crush size, and that test has the highest laboratory recovery of 82.8%.
The McClelland program concluded
that the NaCN consumption would not exceed 1.6 lb/st and the hydrated lime consumption would not exceed 1.8 lb/st. The laboratory tests
used hydrated lime.
There does not appear to
be any obvious explanation for column test recovery differences with respect to spatial representation, grade, reagents or size distribution
of each sample.
| 13.5 | 2018 Kappes Cassidy Associates
Test Program |
The 2018 KCA program consisted
of eight column leach tests on four composite samples in duplicate. The program also included pulverized bottle roll tests on each sample,
agglomeration and permeability test work on each composite sample, and physical characterization test work. The primary purpose of this
program was to confirm the results from the 2008 McClelland test work for gold recovery and reagent requirements at a P80
of ¼ inch crush size.
| Effective Date: May 31st, 2022 | | 84 |
Technical Report
- Mineral Resource Estimate Reward Project, Nye County, Nevada, USA
Table 13.7. 2008 McClelland Bottle Roll Size
versus Gold Recovery – Composite 5.

Figure 13.5. 2008 McClelland Bottle Roll Size
versus Gold Recovery – Composite 5.

Note: Figure from McClelland (2008).
Table 13.8. 2008 McClelland Drain-Down Data
from Column Tests.

| Effective Date: May 31st, 2022 | | 85 |
Technical Report
- Mineral Resource Estimate Reward Project, Nye County, Nevada, USA
| 13.5.1 | 2018 KCA Composite
Generation |
Composites were generated
from core taken from four drill holes including one drill hole at the Gold Ace Zone. Each drill hole was used to make one composite sample
and samples were selected to be spatially and grade representative of the mineralization. Drill hole locations for the metallurgical
test work are shown in Figure 13.6.
A summary of the head analyses
for gold and silver for the composites is shown in Table 13.9. Head analyses for mercury and copper are presented in Table 13.10.
The head analyses for the
composites show grades within the expected range for the mineralization and negligible amounts of copper and mercury. Multi-element and
whole rock analyses were also completed, and do not show any deleterious elements in significant quantities.
| 13.5.2 | 2018 Physical Characterization |
Comminution tests, including
abrasion and Bond work index tests, were performed by Hazen Research Inc. (Hazen). Results of these tests are presented in Table 13.11.
Bond and abrasion index
results show average abrasiveness and hardness.
Bulk density tests were
completed on selected samples from each composite (approximately 30 ft intervals and through different rock types). Bulk densities ranged
from 144 lb/ft3 to 173 lb/ft3 with an average bulk density of 160 lb/ft3.
| Effective Date: May 31st, 2022 | | 86 |
Technical Report
- Mineral Resource Estimate Reward Project, Nye County, Nevada, USA
Figure 13.6. 2018 KCA Metallurgical Sample Drill Hole Location
Map.

Figure prepared
by Lycopodium, 2019.
| Effective Date: May 31st, 2022 | | 87 |
Technical Report
- Mineral Resource Estimate Reward Project, Nye County, Nevada, USA
Table 13.9. 2018 KCA Composite Head Screen
Analyses – Gold and Silver.
KCA
Sample No. |
Description |
Assay
1
(g/mt Au) |
Assay
2
(g/mt Au) |
Average
Assay
(g/mt Au) |
| 80607
A |
CRR17-001 |
0.639 |
0.648 |
0.644 |
| 80608
A |
CRR17-002A |
1.083 |
1.066 |
1.075 |
| 80609
A |
CRR17-003 |
0.682 |
0.669 |
0.675 |
| 80648
B |
CRR18-027 |
1.755 |
1.783 |
1.769 |
| 80607
A |
CRR17-001 |
0.62 |
0.62 |
0.62 |
| 80608
A |
CRR17-002A |
0.62 |
0.62 |
0.62 |
| 80609
A |
CRR17-003 |
0.62 |
0.62 |
0.62 |
| 80648
B |
CRR18-027 |
1.61 |
1.61 |
1.61 |
Table 13.10. 2018 KCA Composite Head Screen
Analyses – Mercury and Copper.
KCA
Sample No. |
Description |
Total
Mercury
(mg/kg) |
Total
Copper
(mg/kg) |
Cyanide
Soluble Copper1
(mg/kg) |
Cyanide
Soluble Copper
(%) |
| 80607
A |
CRR17-001 |
<0.02 |
37 |
3.92 |
11 |
| 80608
A |
CRR17-002A |
0.04 |
26 |
3.27 |
13 |
| 80609
A |
CRR17-003 |
0.02 |
21 |
2.50 |
12 |
| 80648
B |
CRR18-027 |
0.19 |
<2 |
1.22 |
<100 |
Table 13.11. 2018 Hazen Bond Impact Work and
Abrasion Index.
KCA
Sample No. |
Description |
Abrasion
Index
(g) |
Bond
Impact Work Index
(kWh/mt) |
| 80601 |
CRR17-001 &
CRR17-002A |
0.2307 |
9.5 |
| 80602 |
CRR17-003 |
0.2825 |
9.2 |
| 13.5.3 | 2018 KCA Pulverized
Bottle Roll Tests |
Pulverized bottle roll leach
tests were conducted on portions from each composite at a crush size P100 of 100 mesh (0.150 mm). Bottle roll tests were conducted
on four additional high-grade samples at crush sizes P100 of ⅜ inches and P100 of 100 mesh to evaluate the
effect of grade and overall recovery. The high-grade sample intervals are presented in Table 13.12. A summary of the bottle roll test
results is shown in Table 13.13 and shown graphically in Figure 13.7.
Gold recoveries ranged from
91% to 97% with an average recovery of 94% for pulverized bottle roll tests (P100 of 100 mesh) and 55% to 70% with an average
recovery of 60% for coarse bottle roll tests (P100 of ⅜ inch). The bottle roll test results show that higher recoveries
can be achieved at finer crush sizes; however, gold grade does not have an appreciable effect on overall recovery.
| Effective Date: May 31st, 2022 | | 88 |
Technical Report
- Mineral Resource Estimate Reward Project, Nye County, Nevada, USA
Agglomeration and compacted
permeability tests were conducted on crushed samples from each composite. For the agglomeration test work, 2 kg portions of each composite
were agglomerated with 0, 8, 16 and 20 lb of cement per dry ton of material and placed into a 75 mm diameter column with no compressive
load to evaluate the permeability of the material. Compacted permeability tests were conducted on each composite sample with no cement
addition with static loads applied to simulate different heap heights. Results for the agglomeration and compacted permeability tests
are shown in Table 13.14 and Table 13.15, respectively.
The results show that cement
agglomeration is not required for heap heights up to 262 ft.
Table 13.12. 2018 High-Grade Sample Intervals.
| Drill
Hole |
Description |
Interval
(ft) |
|
| |
| CRR17-001 |
W083565 |
283-288 |
|
| CRR17-002A |
V663939 |
58-63 |
|
| CR17-002A |
V663945 |
83-86 |
|
| CR17-002A |
V663221 |
179-183 |
|
| Effective Date: May 31st, 2022 | | 89 |
Technical Report
- Mineral Resource Estimate Reward Project, Nye County, Nevada, USA
Table 13.13. 2018 KCA Bottle Roll Test Results.
KCA
Sample No. |
Description |
Target
Crush Size
(mm) |
Calculated
Head
(g/mt Au) |
Avg.
Tails
(g/mt Au) |
Au
Extracted
(%) |
Leach
Time
(hr) |
Consumption
NaCN
(kg/mt) |
Additional
Ca(OH)2
(kg/mt) |
| 80607
A |
CRR17-001 |
0.150 |
0.572 |
0.043 |
93 |
96 |
0.24 |
1.50 |
| 80608
A |
CRR17-002A |
0.150 |
0.862 |
0.062 |
93 |
96 |
0.30 |
1.25 |
| 80609
A |
CRR17-003 |
0.150 |
0.655 |
0.053 |
92 |
96 |
0.19 |
1.00 |
| 80648
B |
CRR18-027 |
0.150 |
0.936 |
0.027 |
97 |
96 |
0.07 |
1.75 |
| 80614
A |
W083565 |
9.5 |
4.905 |
2.152 |
56 |
240 |
0.21 |
1.25 |
| 80614
A |
W083565 |
0.150 |
5.712 |
0.423 |
93 |
96 |
0.15 |
1.25 |
| 80615
A |
V663939 |
9.5 |
8.203 |
2.441 |
70 |
240 |
0.20 |
0.75 |
| 80615
A |
V663939 |
0.150 |
8.205 |
0.399 |
95 |
96 |
0.17 |
1.00 |
| 80616
A |
V663945 |
9.5 |
3.836 |
1.527 |
60 |
240 |
0.24 |
0.75 |
| 80616
A |
V663945 |
0.150 |
4.131 |
0.221 |
95 |
96 |
0.15 |
1.00 |
| 80617
A |
V663221 |
9.5 |
2.420 |
1.092 |
55 |
240 |
0.33 |
0.75 |
| 80617
A |
V663221 |
0.150 |
2.131 |
0.192 |
91 |
96 |
0.17 |
1.00 |
| 80607
A |
CRR17-001 |
0.150 |
0.63 |
0.41 |
34 |
96 |
0.24 |
1.50 |
| 80608
A |
CRR17-002A |
0.150 |
0.63 |
0.41 |
35 |
96 |
0.30 |
1.25 |
| 80609
A |
CRR17-003 |
0.150 |
0.58 |
0.41 |
29 |
96 |
0.19 |
1.00 |
| 80648
B |
CRR18-027 |
0.150 |
1.54 |
0.99 |
36 |
96 |
0.07 |
1.75 |
| 80614
A |
W083565 |
9.5 |
2.57 |
2.09 |
19 |
240 |
0.21 |
1.25 |
| 80614
A |
W083565 |
0.150 |
2.59 |
1.71 |
34 |
96 |
0.15 |
1.25 |
| 80615
A |
V663939 |
9.5 |
2.66 |
1.99 |
25 |
240 |
0.20 |
0.75 |
| 80615
A |
V663939 |
0.150 |
2.50 |
1.30 |
48 |
96 |
0.17 |
1.00 |
| 80616
A |
V663945 |
9.5 |
1.65 |
1.30 |
21 |
240 |
0.24 |
0.75 |
| 80616
A |
V663945 |
0.150 |
1.56 |
0.99 |
36 |
96 |
0.15 |
1.00 |
| 80617
A |
V663221 |
9.5 |
1.15 |
0.99 |
13 |
240 |
0.33 |
0.75 |
| 80617
A |
V663221 |
0.150 |
1.16 |
0.79 |
32 |
96 |
0.17 |
1.00 |
| Effective Date: May 31st, 2022 | | 90 |
Technical Report
- Mineral Resource Estimate Reward Project, Nye County, Nevada, USA
Figure 13.7. 2018 KCA Bottle Roll Test Results.

Note: Figure prepared by KCA, 2018.
| Effective Date: May 31st, 2022 | | 91 |
Technical Report
- Mineral Resource Estimate Reward Project, Nye County, Nevada, USA
Table 13.14. KCA 2018 Preliminary Agglomeration Test Work.
KCA
Sample No. |
Description |
Cement
(kg/mt)
dry ore |
Water
Added
(ml) |
Initial
Height
(cm) |
Final
Height
(cm) |
pH
on Day 3 |
pH
Comment |
%
Slump |
Apparent
Bulk Density
(mtdry/m3) |
Flow
Out
(l/h/m2) |
Visual
Estimate
of % Pellet
breakdown |
Pellet
Result |
Out
Flow Solution
Color and Clarity |
Overall
Test
Result |
| 80607
A |
CRR17-001 |
0 |
0.0 |
30.80 |
30.16 |
8.1 |
Low |
2% |
1.42 |
26,937 |
N/A |
N/A |
Brown &
Cloudy |
Pass |
| 80607
A |
CRR17-001 |
4 |
191.0 |
28.89 |
28.89 |
11.2 |
Good |
0% |
1.52 |
33,515 |
<3 |
Pass |
Light
Brown & Cloudy |
Pass |
| 80607
A |
CRR17-001 |
8 |
197.0 |
28.89 |
28.89 |
11.7 |
High |
0% |
1.52 |
25,588 |
<3 |
Pass |
Light
Brown & Cloudy |
Pass |
| 80607
A |
CRR17-001 |
10 |
202.0 |
28.89 |
28.89 |
11.8 |
High |
0% |
1.52 |
31,781 |
<3 |
Pass |
Milky &
Cloudy |
Pass |
| 80608
A |
CRR17-002A |
0 |
0.0 |
31.75 |
31.12 |
8.3 |
Low |
2% |
1.38 |
23,625 |
N/A |
N/A |
Brown &
Cloudy |
Pass |
| 80608
A |
CRR17-002A |
4 |
159.0 |
27.94 |
27.94 |
11.5 |
High |
0% |
1.57 |
23,883 |
3 |
Pass |
Light
Brown & Cloudy |
Pass |
| 80608
A |
CRR17-002A |
8 |
163.0 |
28.89 |
28.89 |
11.9 |
High |
0% |
1.52 |
26,627 |
3 |
Pass |
Light
Brown & Cloudy |
Pass |
| 80608
A |
CRR17-002A |
10 |
160.5 |
29.21 |
29.21 |
12.0 |
High |
0% |
1.50 |
26,376 |
3 |
Pass |
Milky &
Cloudy |
Pass |
| 80609
A |
CRR17-003 |
0 |
0.0 |
30.48 |
29.85 |
8.3 |
Low |
2% |
1.44 |
14,203 |
N/A |
N/A |
Brown &
Cloudy |
Pass |
| 80609
A |
CRR17-003 |
4 |
151.0 |
31.12 |
31.12 |
11.6 |
High |
0% |
1.41 |
25,976 |
3 |
Pass |
Milky &
Cloudy |
Pass |
| 80609
A |
CRR17-003 |
8 |
154.5 |
30.16 |
30.16 |
11.9 |
High |
0% |
1.45 |
25,538 |
<3 |
Pass |
Milky &
Cloudy |
Pass |
| 80609
A |
CRR17-003 |
10 |
161.5 |
31.43 |
31.43 |
12.0 |
High |
0% |
1.40 |
29,229 |
<3 |
Pass |
Colorless &
Clear |
Pass |
| 80648
B |
CRR17-027 |
0 |
0 |
23.18 |
23.18 |
8.9 |
Low |
0% |
1.89 |
19,454 |
N/A |
N/A |
Light
Brown & Cloudy |
Pass |
| 80648
B |
CRR17-027 |
4 |
83.0 |
25.40 |
25.08 |
12.3 |
High |
1% |
1.73 |
28,279 |
<3 |
Pass |
Colorless &
Clear |
Pass |
| 80648
B |
CRR17-027 |
8 |
87.5 |
25.40 |
25.40 |
12.5 |
High |
0% |
1.73 |
27,172 |
<3 |
Pass |
Colorless &
Clear |
Pass |
| 80648
B |
CRR17-027 |
10 |
91.0 |
25.72 |
25.72 |
12.6 |
High |
0% |
1.71 |
32,876 |
<3 |
Pass |
Colorless &
Clear |
Pass |
| Effective Date: May 31st, 2022 | | 92 |
Technical Report
- Mineral Resource Estimate Reward Project, Nye County, Nevada, USA
Table 13.15. KCA 2018 Compacted Permeability
Tests.
|
KCA
Sample
No. |
KCA
Test
No. |
Sample
Description |
Crush
Size
(mm) |
Material
Type |
Test
Phase |
Cement
Added,
(kg/mt) |
Effective
Height
(m) |
Flow
Rate,
(l/h/m2) |
Flow
Result
Pass/Fail |
Saturated
Permeability
(cm/sec) |
Incremental
Slump
(%) |
Cum.
Slump
% Slump |
Slump
Result
Pass/Fail |
Overall
Pass/Fail |
| 80607 A |
80623 A |
CRR17-001 |
9.5 |
Feed |
Primary |
0 |
20 |
2,126 |
Pass |
5.9E-02 |
3 |
3 |
Pass |
Pass |
| Stage Load |
40 |
1,528 |
Pass |
4.2E-02 |
3 |
6 |
Pass |
Pass |
| Stage Load |
80 |
875 |
Pass |
2.4E-02 |
4 |
10 |
Pass |
Pass |
| 80624 |
80672 A |
CRR17-001 |
9.5 |
Column
Tail |
Primary |
0 |
20 |
3,008 |
Pass |
8.4E-02 |
1 |
1 |
Pass |
Pass |
| Stage Load |
40 |
776 |
Pass |
2.2E-02 |
3 |
4 |
Pass |
Pass |
| Stage Load |
60 |
480 |
Pass |
1.3E-02 |
3 |
7 |
Pass |
Pass |
| Stage Load |
80 |
328 |
Pass |
9.1E-03 |
2 |
9 |
Pass |
Pass |
| Stage Load |
100 |
208 |
Pass |
5.8E-03 |
2 |
11 |
Fail |
Fail |
| Stage Load |
120 |
125 |
Pass |
3.5E-03 |
1 |
12 |
Fail |
Fail |
| Stage Load |
140 |
80 |
Fail |
2.2E-03 |
1 |
13 |
Fail |
Fail |
| 80627 |
80680 A |
CRR17-001 |
9.5 |
Column
Tail |
Primary |
0 |
20 |
6,779 |
Pass |
1.9E-01 |
0 |
0 |
Pass |
Pass |
| Stage Load |
40 |
4,244 |
Pass |
1.2E-01 |
2 |
2 |
Pass |
Pass |
| Stage Load |
60 |
2,447 |
Pass |
6.9E-02 |
3 |
5 |
Pass |
Pass |
| Stage Load |
80 |
2,063 |
Pass |
5.7E-02 |
1 |
6 |
Pass |
Pass |
| Stage Load |
100 |
1,290 |
Pass |
3.6E-02 |
2 |
8 |
Pass |
Pass |
| Stage Load |
120 |
1,136 |
Pass |
3.2E-02 |
2 |
10 |
Pass |
Pass |
| Stage Load |
140 |
958 |
Pass |
2.7E-02 |
1 |
11 |
Fail |
Fail |
| Stage Load |
160 |
714 |
Pass |
2.0E-02 |
1 |
12 |
Fail |
Fail |
| Stage Load |
180 |
535 |
Pass |
1.5E-02 |
1 |
13 |
Fail |
Fail |
| Stage Load |
200 |
367 |
Pass |
1.0E-02 |
0 |
13 |
Fail |
Fail |
| Stage Load |
220 |
263 |
Pass |
7.3E-02 |
2 |
15 |
Fail |
Fail |
| Stage Load |
240 |
186 |
Pass |
5.2E-02 |
0 |
15 |
Fail |
Fail |
| 80608 A |
80623 B |
CRR17-002 A |
9.5 |
Feed |
Primary |
0 |
20 |
2,763 |
Pass |
7.7E-02 |
2 |
2 |
Pass |
Pass |
| Stage Load |
40 |
2,128 |
Pass |
5.9E-02 |
3 |
5 |
Pass |
Pass |
| Stage Load |
80 |
1,288 |
Pass |
3.6E-02 |
3 |
8 |
Pass |
Pass |
| 80630 |
80673 A |
CRR17-002 A |
9.5 |
Column
Tail |
Primary |
0 |
20 |
7,515 |
Pass |
2.1E-01 |
0 |
0 |
Pass |
Pass |
| Stage Load |
40 |
6,748 |
Pass |
1.9E-01 |
2 |
2 |
Pass |
Pass |
| Stage Load |
60 |
6,028 |
Pass |
1.7E-01 |
3 |
5 |
Pass |
Pass |
| Effective Date: May 31st, 2022 | | 93 |
Technical Report
- Mineral Resource Estimate Reward Project, Nye County, Nevada, USA
|
KCA
Sample
No. |
KCA
Test
No. |
Sample
Description |
Crush
Size
(mm) |
Material
Type |
Test
Phase |
Cement
Added,
(kg/mt) |
Effective
Height
(m) |
Flow
Rate,
(l/h/m2) |
Flow
Result
Pass/Fail |
Saturated
Permeability
(cm/sec) |
Incremental
Slump
(%) |
Cum.
Slump
% Slump |
Slump
Result
Pass/Fail |
Overall
Pass/Fail |
| |
|
|
|
|
|
|
|
|
|
|
|
|
|
|
| Stage Load |
100 |
4,207 |
Pass |
1.2E-01 |
1 |
7 |
Pass |
Pass |
| Stage Load |
120 |
3,325 |
Pass |
9.2E-02 |
2 |
9 |
Pass |
Pass |
| Stage Load |
140 |
2,548 |
Pass |
7.1E-02 |
1 |
10 |
Pass |
Pass |
| Stage Load |
160 |
1,904 |
Pass |
5.3E-02 |
1 |
11 |
Fail |
Fail |
| Stage Load |
180 |
1,389 |
Pass |
3.9E-02 |
1 |
12 |
Fail |
Fail |
| Stage Load |
200 |
977 |
Pass |
2.7E-02 |
2 |
14 |
Fail |
Fail |
| Stage Load |
220 |
705 |
Pass |
2.0E-02 |
0 |
14 |
Fail |
Fail |
| Stage Load |
240 |
503 |
Pass |
1.4E-02 |
1 |
15 |
Fail |
Fail |
| 80633 |
80681A |
CRR17-002 A |
9.5 |
Column
Tail |
Primary |
|
20 |
6,868 |
Pass |
1.9E-01 |
1 |
1 |
Pass |
Pass |
| Stage Load |
|
40 |
6,291 |
Pass |
1.7E-01 |
3 |
4 |
Pass |
Pass |
| Stage Load |
|
60 |
5,269 |
Pass |
1.5E-01 |
1 |
5 |
Pass |
Pass |
| Stage Load |
|
80 |
4,111 |
Pass |
1.1E-01 |
2 |
7 |
Pass |
Pass |
| Stage Load |
|
100 |
3,158 |
Pass |
8.8E-02 |
1 |
8 |
Pass |
Pass |
| Stage Load |
|
120 |
2,331 |
Pass |
6.5E-02 |
2 |
10 |
Pass |
Pass |
| Stage Load |
|
140 |
1,732 |
Pass |
4.8E-02 |
1 |
11 |
Fail |
Fail |
| Stage Load |
|
160 |
1,299 |
Pass |
3.6E-02 |
0 |
11 |
Fail |
Fail |
| Stage Load |
|
180 |
906 |
Pass |
2.5E-02 |
2 |
13 |
Fail |
Fail |
| Stage Load |
|
200 |
675 |
Pass |
1.9E-02 |
1 |
14 |
Fail |
Fail |
| Stage Load |
|
220 |
509 |
Pass |
1.4E-02 |
0 |
14 |
Fail |
Fail |
| Stage Load |
|
240 |
359 |
Pass |
1.0E-02 |
1 |
15 |
Fail |
Fail |
| 80636 |
|
CRR17-003 |
9.5 |
Column
Tail |
Primary |
0 |
20 |
4,540 |
Pass |
1.3E-01 |
0 |
0 |
Pass |
Pass |
| Stage Load |
40 |
2,207 |
Pass |
6.1E-02 |
3 |
3 |
Pass |
Pass |
| Stage Load |
60 |
1,996 |
Pass |
5.5E-02 |
1 |
4 |
Pass |
Pass |
| Stage Load |
80 |
2,137 |
Pass |
5.9E-02 |
2 |
6 |
Pass |
Pass |
| Stage Load |
100 |
1,802 |
Pass |
5.0E-02 |
1 |
7 |
Pass |
Pass |
| Stage Load |
120 |
1,519 |
Pass |
4.2E-02 |
2 |
9 |
Pass |
Pass |
| Stage Load |
140 |
1,162 |
Pass |
3.2E-02 |
1 |
10 |
Pass |
Pass |
| Stage Load |
160 |
938 |
Pass |
2.6E-02 |
1 |
11 |
Fail |
Fail |
| Stage Load |
180 |
754 |
Pass |
2.1E-02 |
1 |
12 |
Fail |
Fail |
| Effective Date: May 31st, 2022 | | 94 |
Technical Report
- Mineral Resource Estimate Reward Project, Nye County, Nevada, USA
|
KCA
Sample
No. |
KCA
Test
No. |
Sample
Description |
Crush
Size
(mm) |
Material
Type |
Test
Phase |
Cement
Added,
(kg/mt) |
Effective
Height
(m) |
Flow
Rate,
(l/h/m2) |
Flow
Result
Pass/Fail |
Saturated
Permeability
(cm/sec) |
Incremental
Slump
(%) |
Cum.
Slump
% Slump |
Slump
Result
Pass/Fail |
Overall
Pass/Fail |
| |
|
|
|
|
Stage Load |
|
200 |
630 |
Pass |
1.8E-02 |
1 |
13 |
Fail |
Fail |
| Stage Load |
220 |
476 |
Pass |
1.3E-02 |
0 |
13 |
Fail |
Fail |
| Stage Load |
240 |
379 |
Pass |
1.1E-02 |
1 |
14 |
Fail |
Fail |
| 80674 A |
80682 A |
CRR17-003 |
9.5 |
Column Tail |
Primary |
0 |
20 |
5,885 |
Pass |
1.6E-01 |
0 |
0 |
Pass |
Pass |
| Stage Load |
40 |
3,393 |
Pass |
9.4E-02 |
2 |
2 |
Pass |
Pass |
| Stage Load |
60 |
3,132 |
Pass |
8.7E-02 |
2 |
4 |
Pass |
Pass |
| Stage Load |
80 |
3,275 |
Pass |
9.1E-02 |
1 |
5 |
Pass |
Pass |
| Stage Load |
100 |
3,105 |
Pass |
8.6E-02 |
1 |
6 |
Pass |
Pass |
| Stage Load |
120 |
2,614 |
Pass |
7.3E-02 |
2 |
8 |
Pass |
Pass |
| Stage Load |
140 |
2,235 |
Pass |
6.2E-02 |
1 |
9 |
Pass |
Pass |
| Stage Load |
160 |
1,787 |
Pass |
5.0E-02 |
1 |
10 |
Pass |
Pass |
| Stage Load |
180 |
1,550 |
Pass |
4.3E-02 |
1 |
11 |
Fail |
Fail |
| Stage Load |
200 |
1,293 |
Pass |
3.6E-02 |
0 |
11 |
Fail |
Fail |
| Stage Load |
220 |
1,051 |
Pass |
2.9E-02 |
1 |
12 |
Fail |
Fail |
| Stage Load |
240 |
856 |
Pass |
2.4E-02 |
1 |
13 |
Fail |
Fail |
| 80653 |
80683 A |
CRR18-027 |
9.5 |
Column Tail |
Primary |
0 |
20 |
6,742 |
Pass |
1.9E-01 |
0 |
0 |
Pass |
Pass |
| Stage Load |
40 |
6,006 |
Pass |
1.7E-01 |
2 |
2 |
Pass |
Pass |
| Stage Load |
60 |
5,042 |
Pass |
1.4E-01 |
2 |
4 |
Pass |
Pass |
| Stage Load |
80 |
4,337 |
Pass |
1.2E-01 |
1 |
5 |
Pass |
Pass |
| Stage Load |
100 |
3,547 |
Pass |
9.9E-02 |
2 |
7 |
Pass |
Pass |
| Stage Load |
120 |
3,056 |
Pass |
8.5E-02 |
1 |
8 |
Pass |
Pass |
| Stage Load |
140 |
2,525 |
Pass |
7.0E-02 |
1 |
9 |
Pass |
Pass |
| Stage Load |
160 |
2,126 |
Pass |
5.9E-02 |
1 |
10 |
Pass |
Pass |
| Stage Load |
180 |
1,730 |
Pass |
4.8E-02 |
1 |
11 |
Fail |
Fail |
| Stage Load |
200 |
1,421 |
Pass |
3.9E-02 |
1 |
12 |
Fail |
Fail |
| Stage Load |
220 |
1,173 |
Pass |
3.3E-02 |
0 |
12 |
Fail |
Fail |
| Stage Load |
240 |
985 |
Pass |
2.7E-02 |
1 |
13 |
Fail |
Fail |
| 80656 |
80684 A |
CRR18-027 |
9.5 |
Column Tail |
Primary |
0 |
20 |
7,608 |
Pass |
2.1E-01 |
0 |
0 |
Pass |
Pass |
| Stage Load |
40 |
7,312 |
Pass |
2.0E-01 |
2 |
2 |
Pass |
Pass |
| Stage Load |
60 |
7,030 |
Pass |
2.0E-01 |
2 |
4 |
Pass |
Pass |
| Effective Date: May 31st, 2022 | | 95 |
Technical Report
- Mineral Resource Estimate Reward Project, Nye County, Nevada, USA
|
KCA
Sample
No. |
KCA
Test
No. |
Sample
Description |
Crush
Size
(mm) |
Material
Type |
Test
Phase |
Cement
Added,
(kg/mt) |
Effective
Height
(m) |
Flow
Rate,
(l/h/m2) |
Flow
Result
Pass/Fail |
Saturated
Permeability
(cm/sec) |
Incremental
Slump
(%) |
Cum.
Slump
% Slump |
Slump
Result
Pass/Fail |
Overall
Pass/Fail |
| |
|
|
|
|
Stage Load |
|
80 |
6,711 |
Pass |
1.9E-01 |
1 |
5 |
Pass |
Pass |
| Stage Load |
100 |
6,181 |
Pass |
1.7E-01 |
1 |
6 |
Pass |
Pass |
| Stage Load |
120 |
5,847 |
Pass |
1.6E-01 |
1 |
7 |
Pass |
Pass |
| Stage Load |
140 |
5,415 |
Pass |
1.5E-01 |
1 |
8 |
Pass |
Pass |
| Stage Load |
160 |
4,920 |
Pass |
1.4E-01 |
2 |
10 |
Pass |
Pass |
| Stage Load |
180 |
4,446 |
Pass |
1.2E-01 |
0 |
10 |
Pass |
Pass |
| Stage Load |
200 |
3,969 |
Pass |
1.1E-01 |
1 |
11 |
Fail |
Fail |
| Stage Load |
220 |
3,573 |
Pass |
9.9E-02 |
1 |
12 |
Fail |
Fail |
| Stage Load |
240 |
3,221 |
Pass |
8.9E-02 |
0 |
12 |
Fail |
Fail |
| Note: | Primary Pass/Fail Criteria |
| 1. | In KCA’s compacted agglomeration tests, a slump of over 10%
is generally an indication of failure. One item also examined is the consistency of results
with regard to slump. If things worked perfectly, a lower slump with higher cement levels
could be expected. |
| 2. | A typical heap leach solution application rate of 10 to 12 liters
per hour per square meter is utilized when examining the agglomeration data. When examining
results from this type of agglomeration test a measured flow of ten times (10X) the heap
design rate is considered a “pass”. A measured flow less than 10X the heap design
flow is not necessarily a failure. If there are enough tests with enough consistency between
tests, and all other points indicate a “pass,” and then sometimes a test will
pass with less than the 10X flow. However, a test will not likely pass at 1X and probably
not at 4X. |
| 3. | In examining the pellet breakdown, about 10% is marginally acceptable
and anything higher is a failure. In general, a higher range is allowable in pellet breakdown
as this is a subjective value based on the visual observation of the pellets after the test
by the technicians performing the test. When the samples tested are not agglomerated using
cement, this test is not applicable. |
| 4. | Solution color and clarity typically is an indicator of agglomerate
failure and fines migration. This information is utilized in coordination with both slump
as well as pellet breakdown to determine if the test passes. |
| Effective Date: May 31st, 2022 | | 96 |
| Technical Report - Mineral Resource Estimate Reward Project, Nye County, Nevada, USA |
| 13.5.4 | KCA 2018 Column Leach Tests |
Duplicate column leach tests
were performed on each composite at a crush size of P100 of 9.5 mm. The columns were leached for 120 days. After 120 days,
one column from each duplicate set from the Good Hope Deposit was taken off-line and the other column was allowed to continue leaching
for an additional 34 days. Both duplicate Gold Ace Zone columns were leached for 121 days before being taken off-line. Results from the
column leach tests are presented in Table 13.16. Column leach recovery curves based on carbon assays are shown in Figure 13.8 and based
on tonnes of solution per tonne of ore in Figure 13.9.
Results of the column tests
for the Good Hope Deposit confirm the results from the 2008 McClelland program. Gold recoveries ranged from 78% to 83% with an average
recovery of 81%. Gold recoveries on the composite from the Gold Ace Zone were significantly lower, averaging 60.5%. Reagent consumptions
for the Good Hope Deposit were low to moderate averaging 3.06 lb/st for NaCN and 2.18 lbs/t for lime. Gold Ace Zone reagent consumptions
averaged 2.18 lb/st for NaCN and 3.52 lb/st for lime.
Based on the leach curves,
most of the columns were still leaching when the columns were terminated. Additional leaching may be realized during secondary leaching
from higher lifts or from heap rinsing.
Figure 13.8. KCA 2018 Column Leach Curves –
Carbon Assays.
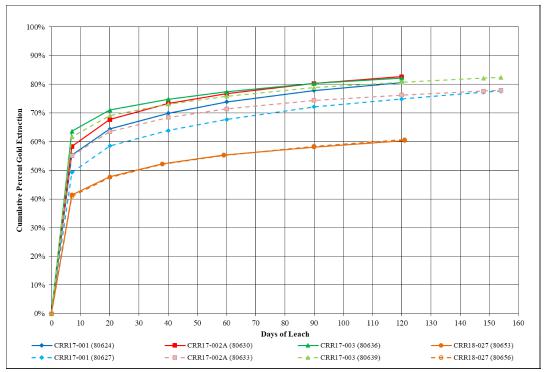
Note: Figure prepared by KCA, 2018.
| Effective Date: May 31st, 2022 | | 97 |
| Technical Report - Mineral Resource Estimate Reward Project, Nye County, Nevada, USA |
Table 13.16. KCA 2018 Column Leach Tests.
| Description |
Avg.
Head
Assay
(g/mt Au) |
Wt. Avg.
Screen Head
(g/mt Au) |
Calculated
Head
(g/mt Au) |
GAC
Extracted
(g/mt Au) |
Weighted
Avg. Tails,
(g/mt Au) |
Extracted
% Au |
Calculated Tail
p80 Size
(mm) |
Days of
Leach |
Consumption
NaCN
(kg/mt) |
Addition
Ca(OH)2
(kg/mt) |
| CRR17-001 |
0.644 |
0.632 |
0.656 |
0.529 |
0.127 |
81 |
6.24 |
120 |
1.53 |
1.29 |
| CRR17-001 |
0.644 |
0.632 |
0.653 |
0.507 |
0.146 |
78 |
6.69 |
154 |
1.98 |
1.26 |
| CRR17-002A |
1.075 |
1.070 |
0.992 |
0.820 |
0.172 |
83 |
6.23 |
120 |
1.44 |
1.00 |
| CRR17-002A |
1.075 |
1.070 |
1.072 |
0.835 |
0.237 |
78 |
6.24 |
154 |
1.54 |
1.00 |
| CRR17-003 |
0.675 |
0.668 |
0.677 |
0.556 |
0.121 |
82 |
6.13 |
120 |
1.14 |
1.01 |
| CRR17-003 |
0.675 |
0.668 |
0.654 |
0.539 |
0.115 |
82 |
6.60 |
154 |
1.53 |
0.99 |
| CRR18-027 |
1.769 |
1.578 |
1.134 |
0.685 |
0.449 |
60 |
6.52 |
121 |
1.10 |
1.76 |
| CRR18-027 |
1.769 |
1.578 |
1.113 |
0.676 |
0.437 |
61 |
6.36 |
121 |
1.07 |
1.76 |
| CRR17-001 |
0.62 |
0.51 |
0.54 |
0.16 |
0.38 |
30 |
6.24 |
120 |
1.53 |
1.29 |
| CRR17-001 |
0.62 |
0.51 |
0.56 |
0.19 |
0.37 |
34 |
6.69 |
154 |
1.98 |
1.26 |
| CRR17-002A |
0.62 |
0.55 |
0.62 |
0.22 |
0.40 |
36 |
6.23 |
120 |
1.44 |
1.00 |
| CRR17-002A |
0.62 |
0.55 |
0.62 |
0.24 |
0.38 |
39 |
6.24 |
154 |
1.54 |
1.00 |
| CRR17-003 |
0.62 |
0.53 |
0.56 |
0.20 |
0.36 |
35 |
6.13 |
120 |
1.14 |
1.01 |
| CRR17-003 |
0.62 |
0.53 |
0.57 |
0.21 |
0.36 |
37 |
6.60 |
154 |
1.53 |
0.99 |
| CRR18-027 |
1.61 |
1.61 |
1.66 |
0.46 |
1.20 |
28 |
6.52 |
121 |
1.10 |
1.76 |
| CRR18-027 |
1.61 |
1.61 |
1.70 |
0.44 |
1.26 |
26 |
6.36 |
121 |
1.07 |
1.76 |
| Effective Date: May 31st, 2022 | | 98 |
| Technical Report - Mineral Resource Estimate Reward Project, Nye County, Nevada, USA |
Figure 13.9. KCA 2018 Column Leach Curves –
Tonnes Solution per Tonne Ore.

Note: Figure prepared by KCA, 2018.
| 13.5.5 | 2018 KCA Program Conclusions |
Results from the KCA 2018
program were consistent with results observed during the 2008 McClelland program with gold recoveries for the main ore body at P80
of ¼ inch (P100 of ⅜ inch) averaging 81% without field deduction. Reagent consumptions were also low to moderate
with cyanide consumptions averaging 3.06 lb/st for NaCN and 2.18 lb/st for lime. Results from the program also show no significant variations
in recovery or reagent consumptions based on material grade or spatial representation for the Good Hope Deposit. Cement agglomeration
is not required for heap heights up to 262 ft.
Recoveries for the Gold Ace
Zone were significantly lower, averaging 60.5% for gold and reagent consumptions averaging 2.18 lb/st for NaCN and 3.52 lb/st for lime.
| 13.6 | Analysis and Discussion |
Metallurgical samples from
historical and recent KCA test programs appear to be spatially representative for the Good Hope Deposit.
Only limited data are available
for the Gold Ace Zone, which includes two column leach tests on duplicate samples and one pulverized bottle roll test.
| 13.6.1 | Crush Size and Grade versus Recovery |
A plot of size versus recovery
for all column and bottle roll tests completed by McClelland and KCA is presented in Figure 13.10.
| Effective Date: May 31st, 2022 | | 99 |
| Technical Report - Mineral Resource Estimate Reward Project, Nye County, Nevada, USA |
Figure 13.10. Size versus Recovery –
2018 KCA and 2008 McClelland Test Data.
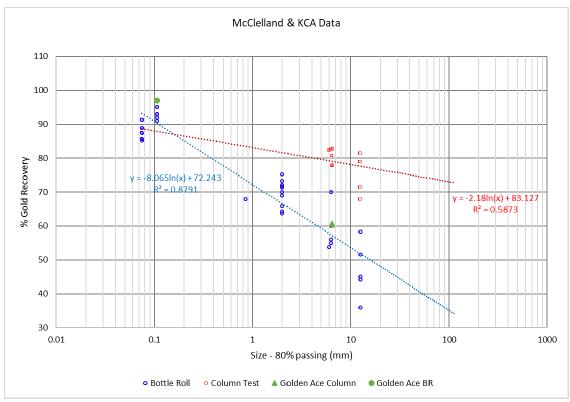
Note: Figure prepared by KCA, 2019.
Figure 13.10 shows a strong
correlation between crush size and recovery with recoveries generally decreasing with coarser crush sizes. Based on the graph of all crush
size data, the expected laboratory recovery for gold at a crush size of P80 of ¼ inch would be approximately 79%; however,
relying on the consistent results from the 2018 KCA and 2008 McClelland column leach tests, KCA believes the average laboratory recovery
of 81% is the best estimate of that crush size. Including a 2% field recovery deduction, KCA recommends a 79% field recovery for gold
for the Good Hope Deposit.
Only limited data is available
for the Gold Ace Zone, including one bottle roll and two duplicate column leach tests. Although the bottle roll results at P100
of 150 µm are consistent with the results of the Good Hope Deposit, column leach tests were significantly lower, averaging 60.5%.
It is unclear why the Gold Ace recoveries are at variance with the Good Hope Deposit, given the proximity and similar makeup of the material;
however, preliminary mineralogy results suggest the gold in the Gold Ace Zone is finely disseminated while the Good Hope mineralization
is coarser, allowing for more adequate liberation at coarser crush sizes. Although not confirmed, KCA suspects there may be some silica
encapsulation of the gold in the Gold Ace mineralization. Based on data available, KCA recommends a field recovery of 58.5% for the Gold
Ace mineralization, including field deduct.
As presented in Figure 13.7,
gold grade does not appear to have any appreciable impact on overall gold recoveries.
| Effective Date: May 31st, 2022 | | 100 |
| Technical Report - Mineral Resource Estimate Reward Project, Nye County, Nevada, USA |
The leach cycle has been
estimated based on column test work at P80 of ¼ inch, including six column tests by KCA in 2018, and one column test
from McClelland, completed in 2008. Columns for the Gold Ace Zone are not included in this evaluation.
The leach cycle considers
tonne of solution per tonne ore as well as the total time required to reach the ultimate recovery in the column leach tests. Based on
this data, the estimated leach cycle is 125 days.
| 13.6.3 | Reagent Consumptions |
Cyanide consumptions are
based on the column test data at P80 of ¼ inch. The average laboratory cyanide consumption is estimated at 2.92 lb/st.
KCA typically estimates field consumption of cyanide to be 25% to 33% of the laboratory cyanide consumption observed in column tests.
The higher end of the spectrum (33%) is used when silver and/or other metals are present in above average quantities or when the observed
laboratory consumption is unusually low. If the observed consumption is “average” and the ore is “clean”, i.e.,
a gold only ore, 25% is used. In the case of the Good Hope material, the observed laboratory cyanide consumption is quite low, so the
field cyanide consumption is estimated at 25% of laboratory consumption.
Lime is required for pH control
during leaching. Since hydrated lime was used for the laboratory leach tests, the laboratory lime consumptions are adjusted to accurately
predict the consumption of quick lime (CaO at 100% purity) in the field. Lime consumptions are based on the column test data at P80
of ¼ inch with an estimated field consumption of 1.53 lb/st. Lime consumption from the 2008 McClelland column at P80
of ¼ inch is not considered in this calculation as it is significantly lower than the other tests and does not appear to
be representative.
| 13.6.4 | Conclusions and Key Design Parameters |
Key design parameters from
the metallurgical test work for the Good Hope Deposit include:
| • | Crush size P80 of ¼ inch. |
| • | Estimated gold field recovery of 79% including
2% field deduction. Based on column tests it is possible additional ounces may be realized during secondary leaching from leaching upper
lifts and during heap rinsing, as it appears most columns were still slowly leaching at column termination. |
| • | Design leach cycle of 125 days. |
| • | Average field sodium cyanide consumption of 0.73
lb/st. |
| • | Average field lime consumption of 1.53 lb/st
based on 100% CaO purity. |
| Effective Date: May 31st, 2022 | | 101 |
| Technical Report - Mineral Resource Estimate Reward Project, Nye County, Nevada, USA |
| • | Cement agglomeration not required up to heap
heights of 262 ft. |
Key design parameters from
the metallurgical test work for the Gold Ace Zone are include:
| • | Crush size P80 of ¼ inch. |
| • | Estimated gold recovery of 58.5% including 2%
field deduction. Based on column tests, it is possible additional ounces may be realized during secondary leaching from leaching upper
lifts and during heap rinsing as it appears most columns were still slowly leaching at column termination. |
| • | Design leach cycle of 125 days. |
| • | Average field sodium cyanide consumption of 0.72
lb/st. |
| • | Average field lime consumption of 2.46 lb/st
based on 100% CaO purity. |
| • | Cement agglomeration not required up to heap
heights of 262 ft. |
| 13.6.5 | Qualified Person’s
Opinion |
The metallurgical test work and analytical methods used followed regular
mining industry accepted practice. The samples and composite samples used in the metallurgical evaluation were deemed representative for
the deposit as sampled for process development. Appropriate test work in sufficient quantity has been conducted to derive the metallurgical
conclusions presented.
| Effective Date: May 31st, 2022 | | 102 |
| Technical Report - Mineral Resource Estimate Reward Project, Nye County, Nevada, USA |
| 14 | Mineral
Resource Estimates |
Several prior NI 43-101 Mineral
Resource estimates for the Project are outlined by Barnard et al. (2012). The Mineral Resource Estimate (MRE) for this study is based
upon historic drilling and drilling conducted by CR Reward during 2017 and 2018 and this estimate supersedes all prior resource estimates.
The MRE was undertaken by
APEX personnel of Edmonton, Alberta, Canada. The Mineral Resource estimate was completed by Mr. Warren Black, M.Sc., P.Geo. and Mr. Steven
Nicholls, BA.Sc., MAIG under the direct supervision of Mr. Michael Dufresne, M.Sc., P.Geol., P.Geo., all of whom are independent
qualified persons employed by APEX. Mr. Dufresne takes responsibility for the for MRE herein.
Definitions used in this
section are consistent with those adopted by the Canadian Institute of Mining, Metallurgy and Petroleum ("CIM") Council in “Estimation
of Mineral Resources and Mineral Reserves Best Practice Guidelines” dated November 29th, 2019 and “Definition
Standards for Mineral Resources and Mineral Reserves” dated May 10th, 2014, and prescribed by the Canadian Securities
Administrators' NI 43-101 and Form 43-101F1, Standards of Disclosure for Mineral Projects and the standards of SK 1300. Mineral
Resources that are not Mineral Reserves do not have demonstrated economic viability.
Statistical analysis, three-dimensional
(3D) modelling and resource estimation were completed by Mr. Warren Black with assistance from Mr. Steven Nicholls. The workflow
implemented for the estimate was completed using the commercially available Micromine (v 18.0) software. The workflow implemented for
the evaluation of reasonable prospects for eventual economic extraction was completed using the Datamine Studio MaxiPit (v1.3.43.0) optimization
software. The Anaconda Python distribution (Continuum Analytics, 2017) and contributions made by Mr. Black to the Python package
pygeostat (CCG, 2016) were used for supplemental data analysis.
CR Reward provided APEX with
a drill hole database that consisted of analytical, geological, density, and collar survey information; initial estimation domains for
both the Good Hope Deposit and Gold Ace Zone; and a geological model for the mineralization that contains a stratigraphic and structural
3D interpretation. APEX thoroughly reviewed the provided data from late 2017 to 2018 data to ensure the database was in good shape and
considered suitable for resource estimation. However, APEX personnel did not conduct a detailed validation of the data provided. The initial
data and project review conducted in the fall of 2017 was, in part, the reason for additional drilling conducted by CR Reward. In the
opinion of the QP, the current Reward drill hole database is suitable for use in resource estimation.
| Effective Date: May 31st, 2022 | | 103 |
| Technical Report - Mineral Resource Estimate Reward Project, Nye County, Nevada, USA |
APEX personnel conducted
resource modelling in local grid coordinate space in feet relative to the North American Datum (NAD) of 1927 (Zone 11). The database comprises
376 drill holes completed in the period 1987 to 2018 of which 264 were used in the Good Hope and Gold Ace resource modelling. APEX and
CR Reward personnel constructed estimation domains using a combination of gold grade, silica alteration, and quartz veining (Figure 14.1).
The domains were used to subdivide the deposit into volumes of rock and the measured sample intervals within those volumes for geostatistical
analysis.
The MRE was prepared using
a block model size of 20 ft (X) by 20 ft (Y) by 20 ft (Z). APEX personnel estimated the gold grade for each block using ordinary
kriging (OK) with locally varying anisotropy to ensure grade continuity in various directions is reproduced in the block model. The block
model was diluted by estimating a waste grade for the outer blocks using composites within a transition zone along the outer edge of the
mineralized estimation domain that was then proportionately combined with the estimated grade for the portion of the block within the
mineralized domain.
Figure 14.1. Mineral Resource Estimate Mineralized
Domain Outlines.

Note: Figure prepared by APEX, 2019.
| Effective Date: May 31st, 2022 | | 104 |
| Technical Report - Mineral Resource Estimate Reward Project, Nye County, Nevada, USA |
The Reward drill hole database
utilized by APEX for resource estimation, including the recently completed 2017-2018 drill holes, consists of 143,465 ft (43,728 m) in
376 holes, including 348 historic drill holes. The database includes 130,032 ft (39,634 m) in 341 historic RC holes, 2,137 ft (651 m)
in 7 core holes, and 11,296 ft (3,443 m) in 28 core holes completed during late 2017 to early 2018. The 2017 – 2018 core holes combined
with the historic core holes represent 9.3% of the drill hole population by number of holes and footage. The historic drill holes were
completed between 1987 and 2013, with 276 holes completed between 1987 and 1999, 72 holes between 2000 and 2013.
The drill hole assay database
consists of 26,092 sample/interval entries with 336 intervals with a value of -9 and 80 blank assay intervals. The bulk of the blank and
-9 intervals are generally top of hole casing intervals that were not sampled, top of hole waste not sampled, or poor recovery intervals.
The 2017 – 2018 drill hole database is comprised of 2,356 sample intervals. The holes contain 28 blank assay intervals that are
mostly top of hole casing intervals with a few poor recovery intervals.
Within the provided DHDB,
a total of 264 drill holes intersect the Good Hope or the Gold Ace mineralized domains, including 33 core holes and 231 RC holes. A total
of 179 reverse circulation (RC) and 24 diamond drill holes (DDH) intercept the Good Hope estimation domains with 9 core and 52 RC holes
intercepting the Gold Ace estimation domain.
Within the Good Hope Zone
database, 34 samples have a value if -9 or have no value and are within the Good Hope estimation domains, of which, are indicated as “not
assayed” or “not sampled.” Therefore, the 34 samples are assigned a value of 0.0025 ppm Au (0.0001 oz/st).
Within the Gold Ace Zone
database, 14 samples have a value if -9 or have no value and are within the Gold Ace estimation domain, all of which have a “Sample_Au_Assay”
value of -99, NA or NS. Within the provided “2018_Reward_Code_Sheet.xlsx” spreadsheet, “-99” indicates “Not
samples, Not assayed, no log”; “NA” indicates “not assayed;” and “NS” indicated “not sampled.”
Therefore, the 14 samples are assigned a value of 0.0025 ppm Au (0.0001 oz/st).
Histograms, cumulative frequency
plots and summary statistics for the Reward project un-composited samples that are situated within the interpreted mineralized lodes are
presented in Figure 14.2 to Figure 14.4 and tabulated in Table 14.1. The Reward gold samples generally exhibit a single population of
assay data. Due to the single population present, linear estimation techniques are suitable for statistical estimation use for the Good
Hope and Gold Ace Deposits.
| Effective Date: May 31st, 2022 | | 105 |
| Technical Report - Mineral Resource Estimate Reward Project, Nye County, Nevada, USA |
Figure 14.2. Histogram of the Raw Gold Assay
Values of Sample Intervals Flagged within the Good Hope and Gold Ace Estimation Domains.

Figure 14.3. Cumulative Frequency Plot of Raw
Gold Assay Values of Sample Intervals Flagged within the Good Hope Zone Estimation Domains.

| Effective Date: May 31st, 2022 | | 106 |
| Technical Report - Mineral Resource Estimate Reward Project, Nye County, Nevada, USA |
Figure 14.4. Cumulative Frequency Plot of Raw
Gold Assay Values of Sample Intervals Flagged within the Gold Ace Estimation Domain.

Table 14.1. Summary Statistics of Raw Gold
Assays (in ppm) of Sample Intervals Flagged within the Good Hope and Gold Ace Estimation Domains.
| |
Global |
Good
Hope |
Gold
Ace |
| count |
7,340 |
6,747 |
593 |
| mean |
0.798 |
0.774 |
1.067 |
| std |
1.701 |
1.262 |
4.203 |
| var |
2.894 |
1.592 |
17.666 |
| CV |
2.133 |
1.630 |
3.939 |
| min |
0.002 |
0.003 |
0.002 |
| 25% |
0.137 |
0.140 |
0.103 |
| 50% |
0.375 |
0.377 |
0.309 |
| 75% |
0.891 |
0.891 |
0.823 |
| max |
83.300 |
37.890 |
83.300 |
| 14.2.2 | APEX Micromine Database Validation |
The Micromine software has
a set of verification tools to evaluate drill hole data. These tools were run on the data when initially received in 2017, and again when
the data for the 2017–2018 drill holes were added. The verification returned 260 warnings, all indicating that there were samples
in the assay database that were greater than 10 feet in length. It appeared that portions of, or all of, drill holes 88-01 to 88-09 used
15 ft as a standard sampling length protocol. With the 15 ft samples removed from the 88-01 to 88-09 drill holes, the warnings dropped
to a total of 139 samples which had sample lengths ranging from 15 ft to 300 ft. A total of 83 of these intervals start from the collar
and represent overburden or disturbed material at the top of the drill hole, or rock that was considered unmineralized at the top of the
drill holes. The remaining 55 sample intervals likely represent composite sampling of material that was initially considered to be unmineralized
in the older drill holes
| Effective Date: May 31st, 2022 | | 107 |
| Technical Report - Mineral Resource Estimate Reward Project, Nye County, Nevada, USA |
Based upon the validation
and review of the drill hole database performed by APEX, the drill hole database, Mr. Dufresne considers the drill hole database
acceptable for Mineral Resource estimation.
| 14.3 | Geological Model and Domains |
CR Reward provided APEX with
a structural and formation model that was created to support resource modelling. The area of the Good Hope fault zone has greatest density
of available drill data. A total of 171 geologic logs and four geotechnical logs were used to create the models using east–west-oriented,
hand-interpreted, paper cross-sections that were translated into a 3D geological model in Micromine including lithology/stratigraphy and
faults. APEX did not directly use the lithological model when creating estimation domains. However, it was, in addition to the structural
model, used to guide the orientation of structural controls on gold mineralization when modelling the estimation domains.
CR Reward also provided preliminary
solids for alteration zones at Good Hope and Gold Ace. The solids consisted of low silica and high silica shapes. These solids were initially
prepared and reviewed in late 2017. The shapes were modified and reviewed after the results of the 2017 and 2018 drilling campaigns were
available.
Gold mineralization at the
Good Hope Deposit and Gold Ace Zone are both geographically and geologically distinct and require separate treatment. Three estimation
domains were used. The estimation domains are 3D wireframes modelled using a sectional approach that considers all available subsurface
geological data pertinent to gold mineralization. CR Reward provided APEX with a low-grade (LG) gold mineralization estimation domain
for the Good Hope Deposit. APEX created a high-grade (HG) domain for the Good Hope Deposit and generated an estimation domain for the
Gold Ace Zone.
APEX interpreted two primary
mineralization orientations in the Good Hope Deposit:
| • | Fault-controlled mineralization generally striking north to north-northwest that dips steeply to the east. |
| • | Stratigraphic-controlled mineralization generally striking north-northeast that dips moderately to the
east. |
Two estimation domains were
created to ensure that the spatially restricted HG zone and the peripheral LG mineralization could not unreasonably influence each other
during estimation. The final estimation domains used during the calculation of the resource estimate for the Good Hope Zone are illustrated
in Figure 14.5.
| Effective Date: May 31st, 2022 | | 108 |
| Technical Report - Mineral Resource Estimate Reward Project, Nye County, Nevada, USA |
Figure 14.5. Orthogonal View of LG (Blue) and
HG (Orange) Estimation Domains, Good Hope Deposit.
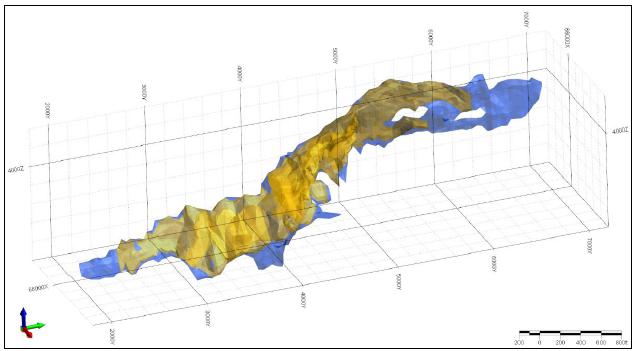
Note: Figure prepared by APEX,
2019.
| 14.3.1.1 | Low-Grade Alteration Domain (LG) |
CR Reward created the LG
domain for the Good Hope Deposit using the following criteria:
| • | Assay greater than or equal to 0.002 oz/st Au with logged quartz veining and/or any intensity of silica
alteration. |
| • | Assay values greater than or equal to 0.005 oz/st Au. |
The LG domain was interpreted
using east–west sections at 50 ft spacing. APEX edited the interpretations to ensure that the domain did not extend into areas with
no drill support or into zones of waste without silica alteration or veining.
| 14.3.1.2 | High Grade Gold Shell (HG) |
APEX modelled a HG gold grade
shell using an assay value of greater than 0.015 oz/st Au. While constructing the HG domain, the structural and lithological interpretation
provided by CR Reward were used as guides in addition to the trend of the Good Hope LG domain. The interpretation was completed using
east-west drill sections spaced at approximately 100 ft intervals and is restricted to the extents of the LG domain.
| Effective Date: May 31st, 2022 | | 109 |
| Technical Report - Mineral Resource Estimate Reward Project, Nye County, Nevada, USA |
APEX observed one primary
orientation of mineralization in the Good Ace zone, consisting of stratigraphically controlled mineralization generally striking north-northeast
that dips moderately to the east. The Gold Ace Zone was remodelled several times by CR Reward and APEX geologists and, in general, was
too thin and discontinuous to model a HG zone within the LG estimation domain. As a result, only a LG domain was used in estimation. The
final estimation domain used during the calculation of the resource estimate for the Good Hope Zone are illustrated in Figure 14.6.
Figure 14.6. Orthogonal View of the LG (Solid
Orange) Estimation Domain, Gold Ace Zone.

Note: Figure prepared by
APEX, 2019.
| 14.4 | Drill Hole Flagging and Compositing |
| 14.4.1 | Sample Width Analysis |
Downhole sample width analysis
shows that the drill hole samples ranged from 0.5 ft to 25 ft with the dominant sample length being 5 ft. A composite length of 10 ft
was selected as it provides adequate resolution for mining purposes and is equal to or larger in length than 99.9 % of the drill hole
samples (Figure 14.7). Length-weighted composites were calculated using all raw gold assays with interval centroids within the estimation
domains for both the Good Hope Deposit and Gold Ace Zone.
The compositing process started
from the drill hole collar and ended at the bottom of the hole. However, when the Good Hope HG estimation domain was intersected, composites
within the domain began at the first point of intersection between the drill hole and the estimation domain wireframe and stopped upon
exiting the wireframe. In this case, the composite before the first intersection of the HG estimation domain was truncated at the upper
contact and composites after exiting the HG estimation domain wireframe began at the lower contact. The centroids of the resulting composites
were flagged as lying within either the LG or HG estimation domain.
| Effective Date: May 31st, 2022 | | 110 |
| Technical Report - Mineral Resource Estimate Reward Project, Nye County, Nevada, USA |
Figure 14.7. Histogram of Sample Lengths within
Estimation Domains for both the Good Hope and Gold Ace Zones.

The distributions of the
composites with and without remnant intervals (composites with a length of less than 10 ft) were examined to determine if there is any
noticeable bias in gold grade during the compositing process. Composites equal to 10 ft, greater than or equal to 5 ft, and 10 ft composites
with all remnants were evaluated. Summary statistics for this analysis are provided in Table 14.2. While the decrease in mean is not favourable,
the exclusion of remnants greater than or equal to 5 ft decreases the number of composites by 11.4%. Their removal would significantly
increase the error in the estimated Mineral Resource as the amount of available conditioning data would be reduced; therefore, they are
included as conditioning data. The 31 samples that are less than 5 ft in length were excluded.
Remnant analysis for the
Good Hope composites showed a decrease in the mean of approximately 0.001 oz/st Au when remnants are included, compared to composites
that are equal to 10 ft as shown in Table 14.2. Figure 14.8 illustrates that there is little difference between the distributions of composited
gold grades with the various composite length scenarios.
Remnant analysis for the
Gold Ace Zone composites reveals an increase in the mean of approximately 0.002 oz/st Au when orphans are included, compared to composites
that are equal to 10 ft (refer to Table 14.2). Figure 14.9 illustrates little difference between the distribution of composited gold grade
with the various composite length scenarios. A significant drop in mean is observed when compositing raw samples at the Gold Ace Zone
as there are numerous large intervals (e.g., 150 ft) in the drill hole database that are not sampled and assigned a value of 0.0001 oz/st
Au. During the composite process, these samples are split into multiple composites, leading to a lower but more representative mean value.
The exclusion of remnants greater than or equal to 5 ft decreases the number of composites by 9.1%. As their removal would significantly
increase error in the estimated Mineral Resource, they are included as conditioning data. The six samples that are less than 5 ft in length
were excluded.
| Effective Date: May 31st, 2022 | | 111 |
Technical Report
- Mineral Resource Estimate Reward Project, Nye County, Nevada, USA
Table 14.2. Remnant Analysis comparing the
Gold Statistics (in ppm) of Raw Assays and Uncapped Composite Samples with and without Orphans.
| |
Good
Hope |
Gold
Ace |
Raw
Assays |
Comps with
Orphans |
Comps
10 ft Only |
Comps
≥ 5 ft |
Raw
Assays |
Comps with
Orphans |
Comps
10 ft Only |
Comps
≥ 5 ft |
| count |
6,747 |
3,577 |
3,164 |
3,546 |
593 |
327 |
293 |
321 |
| mean |
0.774 |
0.756 |
0.789 |
0.756 |
1.067 |
0.956 |
0.903 |
0.856 |
| std |
1.262 |
1.061 |
1.101 |
1.062 |
4.203 |
2.455 |
1.848 |
1.776 |
| var |
1.592 |
1.125 |
1.212 |
1.128 |
17.666 |
6.028 |
3.416 |
3.155 |
| CV |
1.630 |
1.403 |
1.396 |
1.404 |
3.939 |
2.568 |
2.047 |
2.075 |
| min |
0.003 |
0.003 |
0.003 |
0.003 |
0.002 |
0.003 |
0.003 |
0.003 |
| 25% |
0.140 |
0.171 |
0.178 |
0.171 |
0.103 |
0.120 |
0.120 |
0.120 |
| 50% |
0.377 |
0.397 |
0.411 |
0.397 |
0.309 |
0.334 |
0.360 |
0.343 |
| 75% |
0.891 |
0.925 |
0.983 |
0.926 |
0.823 |
0.913 |
1.011 |
0.909 |
| max |
37.890 |
19.107 |
19.107 |
19.107 |
83.300 |
31.346 |
22.834 |
22.834 |
Figure 14.8. Remnant Analysis Illustrating
the Gold Distribution of Calculated Composite within the Good Hope Deposit.

| Effective Date: May 31st, 2022 | | 112 |
Technical Report
- Mineral Resource Estimate Reward Project, Nye County, Nevada, USA
Figure 14.9. Orphan Analysis Illustrating
the Gold Distribution of Calculated Composite within the Gold Ace Zone.

To ensure gold grade is
not over-estimated by including outlier values during estimation, composites were capped to a specified maximum value. Probability plots
illustrating all values were used to identify outlier values that appear higher than expected relative to the estimation domain’s
gold composite population.
The probability plot of
composited gold grades within the Good Hope Deposit (Figure 14.10) suggests there are five outlier composites that have gold values greater
than 0.292 oz/st Au. Visual inspection of the potential outliers in Micromine revealed that they have no spatial continuity with each
other. Therefore, a capping level of 0.292 oz/st Au was applied. The resulting gold grade distribution of the capped composites is illustrated
in Figure 14.11 and summary statistics are detailed in Table 14.3.
| Effective Date: May 31st, 2022 | | 113 |
Technical Report
- Mineral Resource Estimate Reward Project, Nye County, Nevada, USA
Figure 14.10. Probability Plot of the Composited
Gold Grade at the Good Hope Zone before Capping

Figure 14.11. Cumulative Frequency Plots of
the Composited and Capped Gold Grade within the Good Hope Zone Estimation Domains
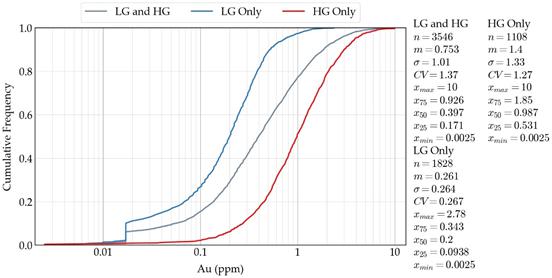
| Effective Date: May 31st, 2022 | | 114 |
Technical Report
- Mineral Resource Estimate Reward Project, Nye County, Nevada, USA
The probability plot of
composited gold grades within the Gold Ace Zone (Figure 14.12) suggests there are eight outlier composites that have gold values greater
than 0.146 oz/st Au. Visual inspection of the potential outliers reveal they have no spatial continuity with each other. Therefore, a
capping level of 0.146 oz/st Au was applied to composites used to calculate the Gold Ace Zone resource estimate. The resulting gold grade
distribution of the capped composites is illustrated in Figure 14.13 and summary statistics are detailed in Table 14.3.
Figure 14.12. Probability Plot of the Composited
Gold Grade at the Gold Ace Zone before Capping.

Figure 14.13. Cumulative Frequency Plot of
the Composited and Capped Gold Grade within Gold Ace Zone Estimation Domain.

| Effective Date: May 31st, 2022 | | 115 |
Technical Report
- Mineral Resource Estimate Reward Project, Nye County, Nevada, USA
Table 14.3. Summary Statistics of Gold Grade
(in ppm) of Capped Composite Intervals Flagged within the Good Hope and Gold Ace Estimation Domains.
| |
Global |
Good
Hope
Uncapped |
Good
Hope
Capped |
Gold
Ace
Uncapped |
Gold
Ace
Capped |
| count |
3,867 |
3546 |
3,546 |
321 |
321 |
| mean |
0.753 |
0.756 |
0.753 |
0.856 |
0.756 |
| std |
1.015 |
1.1062 |
1.014 |
1.776 |
1.021 |
| var |
1.030 |
1.212 |
1.029 |
3.155 |
1.042 |
| CV |
1.348 |
1.404 |
1.348 |
2.075 |
1.349 |
| min |
0.003 |
0.003 |
0.003 |
0.003 |
0.003 |
| 25% |
0.169 |
0.171 |
0.171 |
0.12 |
0.120 |
| 50% |
0.394 |
0.397 |
0.397 |
0.343 |
0.343 |
| 75% |
0.926 |
0.926 |
0.926 |
0.909 |
0.909 |
| max |
10.000 |
19.107 |
10.000 |
22.834 |
5.000 |
| 14.6 | Variography and Grade Continuity |
APEX calculated and modelled
semi-variograms for gold using the 10 ft composites flagged within the estimation domains. Experimental semi-variograms for each zone
were calculated along the major, minor, and vertical principle directions of continuity that are defined by three Euler angles. Euler
angles describe the orientation of anisotropy as a series of rotations (using a left-hand rule) that are as follows:
| 1. | A rotation about the Z-axis (azimuth)
with positive angles being clockwise rotation and negative representing counter-clockwise
rotation; |
| 2. | A rotation about the X-axis (dip) with
positive angles being counter-clockwise rotation and negative representing clockwise rotation;
and |
| 3. | A rotation about the Y-axis (tilt) with
positive angles being clockwise rotation and negative representing counter-clockwise rotation. |
Parameters of the modelled
semi-variograms are documented in Table 14.4 and the calculated experimental semi-variogram and models used for resource estimation are
illustrated in Figure 14.14and Figure 14.15 respectively.
| Effective Date: May 31st, 2022 | | 116 |
Technical Report
- Mineral Resource Estimate Reward Project, Nye County, Nevada, USA
Table 14.4. Gold Variogram Model Parameters.
| Zone |
C0 |
Sill |
Azm |
Dip |
Tilt |
Structure
1 |
|
Structure
2 |
| Type |
C1 |
Ranges
(ft) |
|
Type |
C2 |
Ranges
(ft) |
| Major |
Minor |
Vertical |
|
Major |
Minor |
Vertical |
| Good
Hope |
0.370 |
1.027 |
176 |
-16 |
-34 |
sph |
0.411 |
80 |
140 |
60 |
|
exp |
0.246 |
250 |
140 |
60 |
| Gold
Ace |
0.261 |
0.622 |
137 |
-10 |
-15 |
sph |
0.124 |
220 |
120 |
30 |
|
exp |
0.236 |
220 |
120 |
30 |
| Note: | azm: azimuth, sph: spherical, exp: exponential; C0: nugget effect;
C1: covariance contribution of structure 1; C2: covariance contribution of structure 2. |
Figure 14.14. Calculated and Modelled Semi-Variogram
of Gold within the Good Hope Zone. Dip Direction and Dip for each Principle Direction is in each Subplot Title.

| Effective Date: May 31st, 2022 | | 117 |
Technical Report
- Mineral Resource Estimate Reward Project, Nye County, Nevada, USA
Figure 14.15. Calculated and Modelled Semi-Variogram
of Gold within the Gold Ace Zone. Dip Direction and Dip for each Principle Direction is in each Subplot Title.
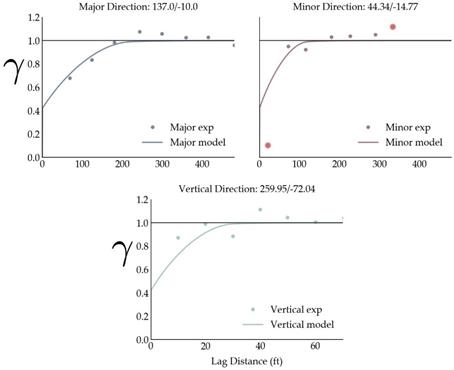
To determine what bulk densities
should be applied to the block model, APEX completed EDA on the available density data. The database contains 464 bulk density measurements,
of which 134 are from the Good Hope Deposit, 32 are from the Gold Ace Zone and 298 are from waste rock. The centroids of intervals that
were selected for bulk density measurements were flagged using the estimation domain and stratigraphic wireframes are discussed in Section 14.3.
All measurements were flagged with the stratigraphic unit they lie in and the estimation domain the sample is from, if it is not classed
as waste.
At the Good Hope Deposit,
little variation in the mean and median values were observed between bulk density measurements flagged within either the HG or LG estimation
domains or individually (Table 14.5).
| Effective Date: May 31st, 2022 | | 118 |
Technical Report
- Mineral Resource Estimate Reward Project, Nye County, Nevada, USA
Table 14.5. Bulk Density Measurements (g/cm3),
Good Hope Deposit and Gold Ace Zone.
| |
Good
Hope |
Gold
Ace |
Waste |
| HG+LG |
HG |
LG |
Zwc |
Zsj |
LG |
Zss |
Zsm |
Zsb |
Zsj |
Zsm |
Zss |
Zwc |
| count |
134 |
76 |
58 |
121 |
13 |
32 |
7 |
24 |
5 |
21 |
13 |
45 |
145 |
| mean |
2.58 |
2.58 |
2.59 |
2.59 |
2.55 |
2.69 |
2.61 |
2.71 |
2.59 |
2.58 |
2.65 |
2.59 |
2.62 |
| std |
0.14 |
0.16 |
0.11 |
0.14 |
0.05 |
0.16 |
0.18 |
0.16 |
0.11 |
0.04 |
0.12 |
0.11 |
0.12 |
| min |
1.62 |
1.62 |
2.35 |
1.62 |
2.46 |
2.31 |
2.31 |
2.32 |
2.48 |
2.48 |
2.29 |
2.40 |
2.23 |
| 25% |
2.53 |
2.54 |
2.52 |
2.54 |
2.51 |
2.58 |
2.53 |
2.60 |
2.49 |
2.56 |
2.63 |
2.51 |
2.56 |
| 50% |
2.59 |
2.59 |
2.59 |
2.60 |
2.54 |
2.70 |
2.61 |
2.72 |
2.59 |
2.58 |
2.69 |
2.57 |
2.63 |
| 75% |
2.64 |
2.64 |
2.66 |
2.66 |
2.59 |
2.80 |
2.71 |
2.82 |
2.69 |
2.60 |
2.72 |
2.68 |
2.71 |
| max |
2.97 |
2.97 |
2.79 |
2.97 |
2.66 |
3.04 |
2.86 |
3.04 |
2.70 |
2.64 |
2.76 |
2.84 |
2.89 |
| CV |
0.02 |
0.03 |
0.04 |
0.02 |
0.20 |
0.08 |
0.37 |
0.11 |
0.52 |
0.12 |
0.20 |
0.06 |
0.02 |
The blocks within the Good
Hope Deposit are predominantly classed as Wood Canyon Formation with nearly equal amounts of Juhl Member and Sutton Member of the Stirling
Formation (Table 14.6). There is a slight decrease in bulk density when comparing measurements within the Wood Canyon Formation lithologies
and the Juhl Member, both inside and outside of the Good Hope estimation domains (Table 14.5; Figure 14.6). It is hard to determine with
certainty if there is a relationship between gold grade and bulk density with the current dataset (Figure 14.17).
Figure 14.16. Bulk Density Box Plots, Good
Hope Deposit.
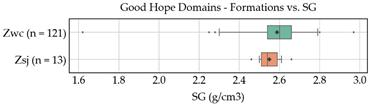
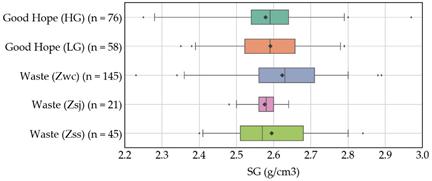
| Effective Date: May 31st, 2022 | | 119 |
Technical Report
- Mineral Resource Estimate Reward Project, Nye County, Nevada, USA
Figure 14.17. Bulk Density Scatter Plots Showing
3D Solids vs. Gold Grade, Good Hope Deposit.
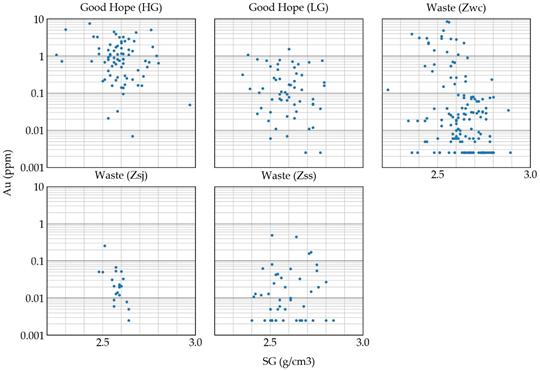
As there are no discrepancies
in the median (50th percentile) values of bulk density measurements within the Good Hope estimation domains, a bulk density value of
2.59 g/cm3 was applied to all blocks within the Good Hope mineralized zone.
At the Gold Ace Zone, there
is a change in bulk density between lithological units (Table 14.5). The blocks within the Gold Ace Zone are predominantly Morris Member
with most other blocks being within the Sutton Member (Table 14.6). There is a decrease in bulk density when comparing bulk density measurements
within the Morris Member and Sutton Member, both inside and outside of the Gold Ace estimation domain (Table 14.5, Figure 14.18). It
is hard to determine with certainty if there is a relationship between gold grade and bulk density with the current dataset (Figure 14.19).
As there is evidence for the need for a higher bulk density value for blocks flagged within the Morris Member, these blocks are assigned
a value of 2.70 g/cm3. However, as there is an insufficient number of bulk density measurements of the Sutton Member within
the Gold Ace estimation domain, all other blocks at the Gold Ace Zone were assigned a bulk density value of 2.59 g/cm3.
| Effective Date: May 31st, 2022 | | 120 |
Technical Report
- Mineral Resource Estimate Reward Project, Nye County, Nevada, USA
Table 14.6. Percentage of Blocks Flagged within
each Formation for the Good Hope and Gold Ace Zones.
| Formation |
Good
Hope
% |
Gold
Ace
% |
| Qal |
1 |
4 |
| Zwc |
75 |
0 |
| Zsj |
13 |
0 |
| Zss |
11 |
16 |
| Zsm |
0 |
79 |
| Zsb |
0 |
1 |
Figure 14.18. Bulk Density Box Plots, Gold
Ace Zone.
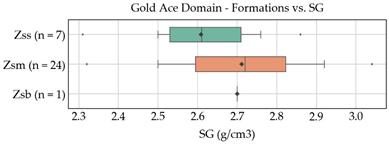
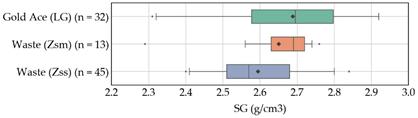
Figure 14.19. Bulk Density Scatter Plots Showing
3D Solids vs. Gold Grade, Gold Ace Zone.
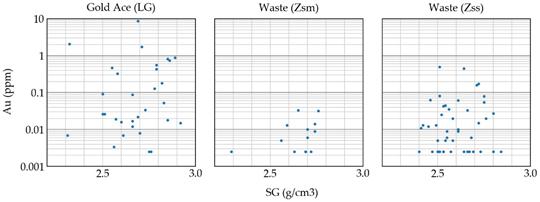
| Effective Date: May 31st, 2022 | | 121 |
Technical Report
- Mineral Resource Estimate Reward Project, Nye County, Nevada, USA
| 14.8.1 | Block Model Parameters |
The block model used fully
encapsulates the estimation domains. When determining block model parameters, data spacing is the primary consideration in addition to
ensuring the volume of the 3D estimation domain wireframes are adequately captured, and that potential mining equipment parameters are
considered.
The data spacing of irregularly
spaced drilling can be approximated by calculating the 90th percentile of a high-resolution block model of the distance from each block’s
centroid to the nearest sample. Estimation errors are introduced when kriging is used to estimate a grade for blocks with a size larger
than 25% of the data spacing. As illustrated in Figure 14.20 and Figure 14.21, the 90th percentile is 98 ft and 83 ft for the Good Hope
Deposit and Gold Ace Zone respectively.
Figure 14.20. Cumulative Frequency Plot Illustrating
the Distance from each Block Centroid to the nearest Composite Sample within the Good Hope Zone.

| Effective Date: May 31st, 2022 | | 122 |
Technical Report
- Mineral Resource Estimate Reward Project, Nye County, Nevada, USA
Figure 14.21. Cumulative Frequency Plot Illustrating
the Distance from each Block Centroid to the nearest Composite Sample within the Gold Ace Zone.
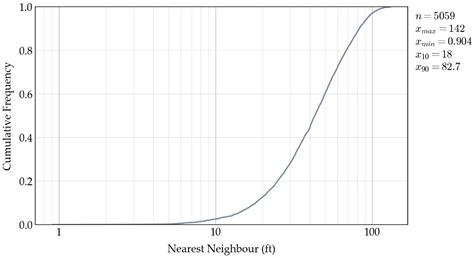
The previous resource estimate
completed for the Project (CR Reward, 2017) used a parent block size of 20 by 20 by 20 ft that is less than 25% of the approximated data
spacing for both the Good Hope Deposit and Gold Ace Zone. This size is a fairly standard mining unit size selected by many open pits
in Nevada and is considered acceptable for use in the current estimate. The final block model is 4,920 ft long in the east-west direction,
5,480 ft long in the north-south direction and 1,900 ft deep (Table 14.7).
Table 14.7. Project Block Model Size and Extents.
| Axis |
Number
of Blocks |
Block
Size
(ft) |
Minimum
Extent
(ft) |
Maximum
Extent
(ft) |
| X
(Easting) |
246 |
20 |
62,460 |
67,380 |
| Y
(Northing) |
274 |
20 |
1,690 |
7,170 |
| Z
(Elevation) |
95 |
20 |
3,040 |
4,940 |
A block factor that represents
the percentage of each blocks volume that lies within each estimation domain is calculated for all three domains. The block factor is
used to:
| • | Flag which estimation domain each
block belongs. |
| • | Calculate the percentage of mineralized
material and waste for each block. |
| • | Calculate the volume of mineralized
material of each block when undertaking the Mineral Resource estimate. |
| Effective Date: May 31st, 2022 | | 123 |
Technical Report
- Mineral Resource Estimate Reward Project, Nye County, Nevada, USA
A comparison of wireframe
volume versus block model volume was performed to ensure there is no considerable over or understating of tonnages (Table 14.8). The
calculated block factor for each block was used to scale its volume when calculating the total volume of the block model.
Table 14.8. Wireframe versus Block Model Volume
Comparison.
| Wireframe |
Wireframe
Volume
(ft3) |
Block
Model Volume
with Block Factor
(ft3) |
Volume
Difference
(%) |
| Good
Hope |
264,316,535 |
264,345,000 |
0.01 |
| Gold
Ace |
20,694,986 |
20,687,500 |
-0.04 |
| Total |
285,011,521 |
285,032,500 |
0.01 |
| 14.9.1 | Estimation Methodology |
Ordinary kriging was used
to estimate gold grade for the Good Hope and Gold Ace block models. Grade estimates are only calculated for blocks that contain more
than 1.56% mineralized material by volume. A block discretization of 2 (X) by 2 (Y) by 2 (Z) was applied to all blocks
during estimation.
A two-pass method was employed
that uses two different variogram model, search ellipsoid, and kriging parameter configurations (Table 14.9). A minimum of two drill
holes was required for the first pass to ensure there are sufficient data when calculating the mean value used by OK. Volume-variance
corrections were enforced by restricting the maximum number of conditioning data to 15 and the maximum number of composites from each
drill hole to three. These restrictions were implemented to ensure the estimated models were not over smoothed which would lead to inaccurate
estimation of global tonnage and grade. These corrections caused local conditional bias but ensured that the global estimate of grade
and tonnage is accurately estimated.
| Effective Date: May 31st, 2022 | | 124 |
Technical Report
- Mineral Resource Estimate Reward Project, Nye County, Nevada, USA
Table 14.9. Estimation Search and Kriging
Parameters (LV – locally varying).
| Pass |
Variogram and Search
Orientations (Dip Dir/Dip) |
Max Variogram and Search
Range |
Min No.
Holes |
Max Comps
Per Hole |
Min No.
Comps |
Max No.
Comps |
| Major |
Minor |
Vertical |
Major |
Minor |
Vertical |
| Good
Hope Zone |
|
|
|
|
| 1 |
LV |
LV |
LV |
250 |
140 |
60 |
2 |
3 |
2 |
15 |
| 2 |
LV |
LV |
LV |
500 |
280 |
120 |
1 |
3 |
1 |
15 |
| |
|
|
|
|
|
|
|
|
|
|
| Gold
Ace Zone |
|
|
|
|
| 1 |
137/-10 |
044/-15 |
260/-72 |
220 |
120 |
30 |
2 |
3 |
2 |
15 |
| 2 |
137/-10 |
044/-15 |
260/-72 |
440 |
240 |
60 |
1 |
3 |
1 |
15 |
Estimation of the Good Hope
block model was completed with locally varying anisotropy which uses different rotation angles to define the principal directions of
the variogram model and search ellipsoid on a per-block basis. Blocks within the estimation domains were assigned rotation angles using
a trend surface wireframe. This method allowed structural complexities to be reproduced in the estimated block model. Variogram and search
ranges were defined by the variogram model described in Section 0 and Table 14.4.
The Gold Ace Zone block
model was calculated using a single variogram and search orientation configuration as described in Section 0 and Table 14.4.
The Good Hope HG and LG
estimation domains were separately estimated. To ensure the nature of the boundary between the two estimation domains was reproduced,
the centroids of blocks within a specified window of the HG and LG contact were flagged as transitional. Contact analysis was performed
to understand the behaviour of gold grades at the boundary and to determine the window used to flag blocks as transitional. As illustrated
in Figure 14.22, gold behaves in a statistically semi-soft manner, where the grade of the composites flagged within the LG or HG estimation
domains transitions over a short window from a mean of 0.267 ppm Au (0.0078 oz/st Au) to a mean of 1.32 ppm Au (0.0385 oz/st Au). A window
of 1 ft into the LG estimation domain from the contact to 5 ft into the HG estimation domain from the contact was used to flag block
centroids as transition. Block centroids flagged within the LG or HG estimation domains are estimated using composites flagged within
each respective domain in addition to composites flagged within the transition window. Blocks flagged as transition were estimated using
only composites flagged within the transition window.
| Effective Date: May 31st, 2022 | | 125 |
Technical Report
- Mineral Resource Estimate Reward Project, Nye County, Nevada, USA
Figure 14.22. Gold Grade Contact Plot Analysis,
Good Hope LG and HG Grade Domain Contacts.

| Note: | The dashed line represents the mean of composites within each domain.
Samples within the LG estimation domain are assigned a negative distance value, and samples
within the HG estimation domain are assigned a positive distance value. |
Blocks that contain more
than or equal to 1.56% waste by volume were diluted by estimating a waste gold value that was volume-weight averaged with the estimated
gold grade. Similar to the transition methodology used along the HG and LG contact at the Good Hope Zone, the intention was to reproduce
the gold grade along the estimation domain/waste domain boundary. The nature of gold mineralization at the mineralized/waste contact
was evaluated and used to determine a window to flag composites that were used to condition a waste gold estimate for blocks containing
waste material. As illustrated in Figure 14.23, gold behaves in a statistically soft manner, where the grade of the composite centroids
flagged within the Good Hope estimation domain transitions from mineralization to waste over a window of approximately 5 ft into waste
and 20 ft into mineralized material. As illustrated in Figure 14.24, gold behaves in a statistically hard manner, where the grade of
the composite centroids flagged within the Gold Ace estimation domain abruptly transitions from mineralized material to waste at the
contact.
| Effective Date: May 31st, 2022 | | 126 |
| Technical Report - Mineral Resource Estimate Reward Project, Nye County, Nevada, USA |
Figure 14.23. Contact Plot Analysis, Good Hope
Grade and Waste Domain Contacts.
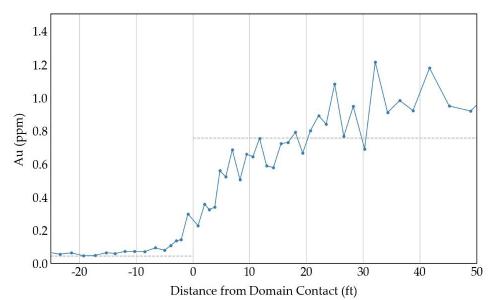
| Note: | The dashed line represents the mean of composites within each domain. Samples within the LG estimation domain are assigned a negative
distance value, and samples within the HG estimation domain are assigned a positive distance value. |
Figure 14.24. Contact Analysis, Gold Ace Grade
and Waste Domain Contacts.
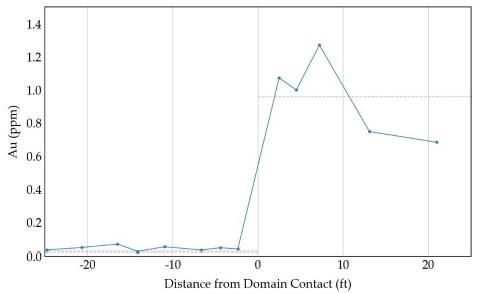
| Note: | The dashed line represents the mean of composites within each domain. Samples within the LG estimation domain are assigned a negative
distance value, and samples within the HG estimation domain are assigned a positive distance value. |
A sensitivity analysis was
performed to determine the parameters used to flag composite centroids within the mineralization/waste transition zone. The analysis evaluated
various window parameters to flag composites within the mineralization/waste transition zone that were then used to estimate a waste gold
value for each block containing waste. A diluted gold value was calculated and the parameters were evaluated by comparing the block models
contact analysis profile with the composites profile. Based on the results of the sensitivity analysis, a window of 20 ft into waste and
5 ft into the Good Hope Deposit and a window of 20 ft into waste and 4 ft into the Gold Ace Zone mineralized domains best reproduces the
gold profile observed at the mineralization/waste transition zone. Additional discussion regarding the validation of this approach is
found in Section 4.12.2.
| Effective Date: May 31st, 2022 | | 127 |
| Technical Report - Mineral Resource Estimate Reward Project, Nye County, Nevada, USA |
The block models for the
Good Hope Deposit and Gold Ace Zone were visually validated in plan view and in cross-section to compare the estimated gold grade versus
the conditioning composites (Figure 14.25 to Figure 14.28). APEX concluded that the model compared well with the composites on an overall
basis. There was some local over and under estimation observed, but due to the limited number of conditioning data available for the estimation
in those areas, this was an expected result.
Figure 14.25. Cross-Section 6000N, Showing
Block Gold Estimates at the Good Hope Deposit.
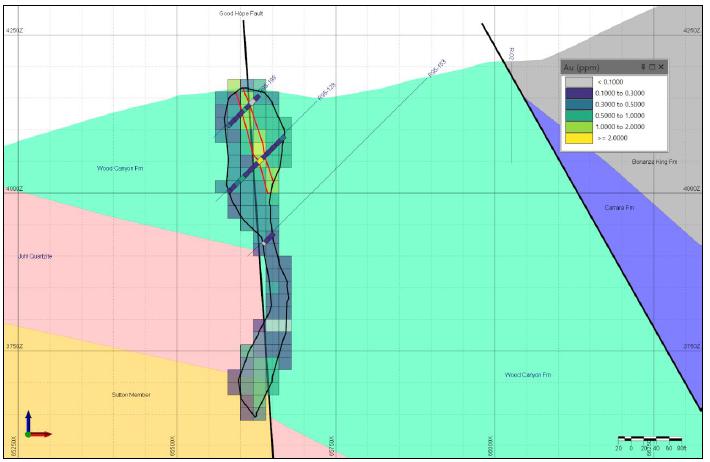
Note: Figure prepared by APEX, 2019.
The boundary of the HG estimation domain within the LG estimation domain is illustrated by the red polygons
| Effective Date: May 31st, 2022 | | 128 |
| Technical Report - Mineral Resource Estimate Reward Project, Nye County, Nevada, USA |
Figure 14.26. Cross-Section 4800N, Showing
Block Gold Estimates at the Good Hope Deposit.

| Note: | Figure prepared by APEX, 2019. The boundary of the HG estimation domain within the LG estimation domain is illustrated by the red
polygons |
Figure 14.27. Cross-Section 4100N, Showing
Block Gold Estimates at the Good Hope Deposit.

| Note: | Figure prepared by APEX, 2019. The boundary of the HG estimation domain within the LG estimation domain is illustrated by the red
polygons |
| Effective Date: May 31st, 2022 | | 129 |
| Technical Report - Mineral Resource Estimate Reward Project, Nye County, Nevada, USA |
Figure 14.28. Cross-Section 2700N, Showing
Block Gold Estimates at the Gold Ace deposit.

Note: Figure
prepared by APEX, 2019.
| 14.10.2 | Statistical Validation |
Swath plots were used to
verify that directional trends were honoured in the estimated block model and to identify potential areas of over or under estimation.
They were generated by calculating the average gold grade of composites and estimated block models within directional slices. A window
of 100 ft was used in east-west slices, 180 ft in north-south slices and 20 ft in vertical slices.
There are minor instances
of localized over estimation; however, APEX believes this is a product of a lack of conditioning data in those areas and the smoothing
effect of kriging. Overall, trends observed in the composites in all three directions were adequately reproduced in the block model.
Swath plots for the Good
Hope and Gold Ace Zones are illustrated in Figure 14.29 and Figure 14.30, respectively.
| Effective Date: May 31st, 2022 | | 130 |
| Technical Report - Mineral Resource Estimate Reward Project, Nye County, Nevada, USA |
Figure 14.29. Swath Plots Showing Composite
versus Estimated Gold Grade, Good Hope.
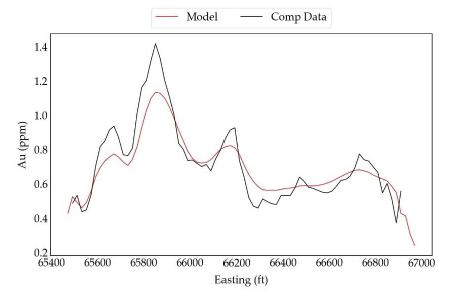

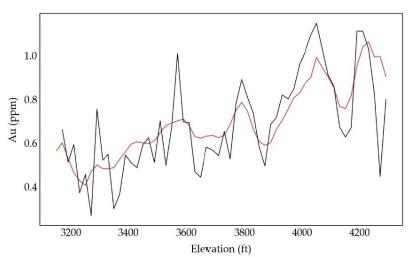
| Effective Date: May 31st, 2022 | | 131 |
| Technical Report - Mineral Resource Estimate Reward Project, Nye County, Nevada, USA |
Figure 14.30. Swath Plots Showing Composite
versus Estimated, Gold Grade Gold Ace.
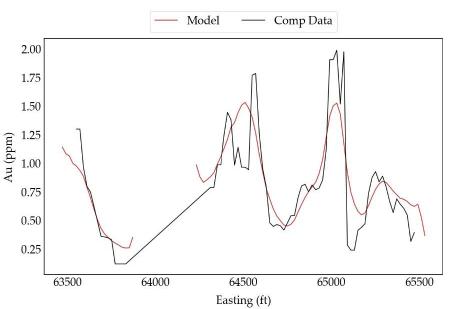
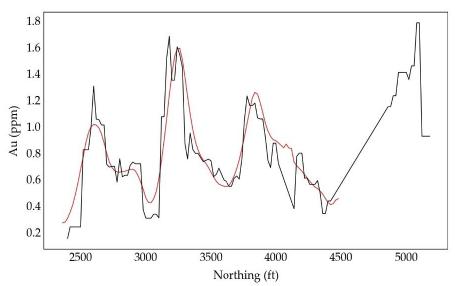
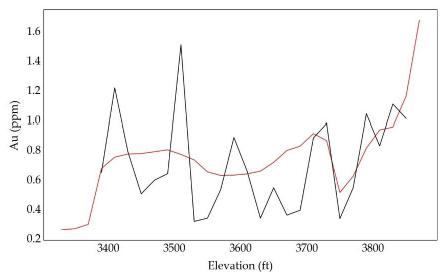
| Effective Date: May 31st, 2022 | | 132 |
| Technical Report - Mineral Resource Estimate Reward Project, Nye County, Nevada, USA |
Volume-variance corrections
were used to ensure the estimated models were not over-smoothed, which would lead to inaccurate estimation of global tonnage and grade.
To verify that the correct level of smoothing was achieved, theoretical histograms that indicated the anticipated variance and distribution
of gold grade at the selected block model size were calculated and plotted against estimated final block model for the Good Hope Deposit
and Gold Ace Zone. These are shown in Figure 14.31 and Figure 14.32 respectively. Some smoothing is observed; however, in APEX’s
opinion, further restrictions to the estimation search strategy would result in an unacceptable increase in estimation error.
Figure 14.31. Volume Variance Check, Good Hope.
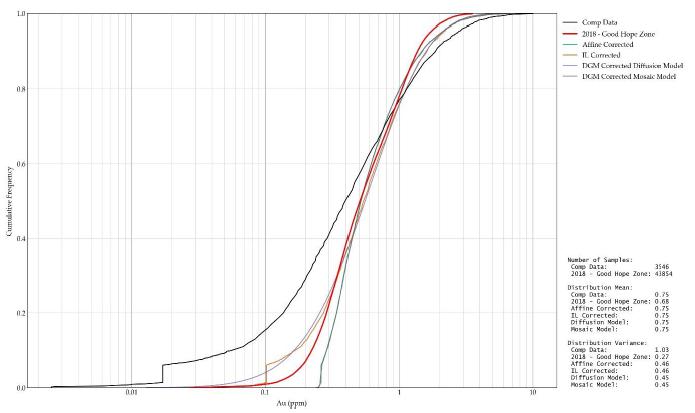
| Effective Date: May 31st, 2022 | | 133 |
| Technical Report - Mineral Resource Estimate Reward Project, Nye County, Nevada, USA |
Figure 14.32. Volume Variance Check, Gold Ace.
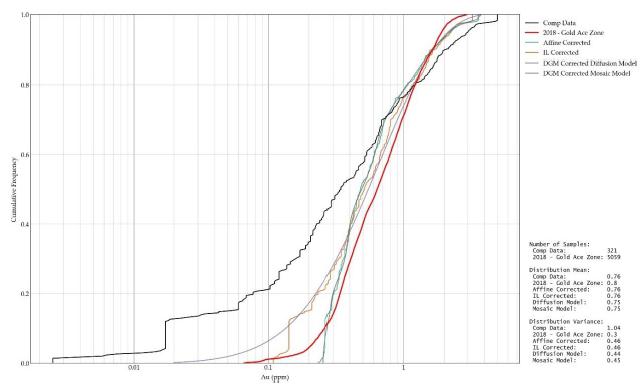
Blocks within the Good Hope
and Gold Ace block models that contained more than or equal to 1.56% waste by volume were diluted using the estimated waste gold and ore
gold values. Ideally, the nature of gold mineralization at the ore/waste contact observed in the composites is reproduced in the block
model. Contact analysis plots checking contact profile reproduction for the Good Hope Deposit and Gold Ace Zone are illustrated in Figure
14.33 and Figure 14.34, respectively. APEX personnel and the QP considers that the mineralization/waste contact profile at the Good Hope
Deposit is adequately reproduced with a slight over estimation into waste. The mineralization/waste contact profile at the Gold Ace Zone
is abrupt (hard) when evaluating composites; however, this cannot be perfectly reproduced with a block model, as each block can only have
a single value. Considering this, the contact profile observed in the Gold Ace block model is considered by APEX personnel and the QP
to be an adequate reproduction of the profile observed in the conditioning data.
| Effective Date: May 31st, 2022 | | 134 |
| Technical Report - Mineral Resource Estimate Reward Project, Nye County, Nevada, USA |
Figure 14.33. Contact Analysis, Good Hope Grade
and Waste Domain Boundary.
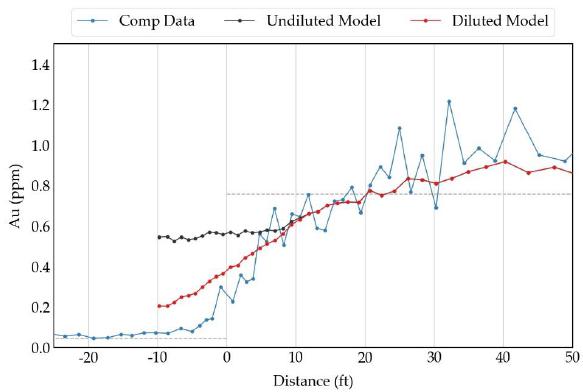
Figure 14.34. Contact Analysis, Gold Ace Grade
and Waste Domain Boundary.
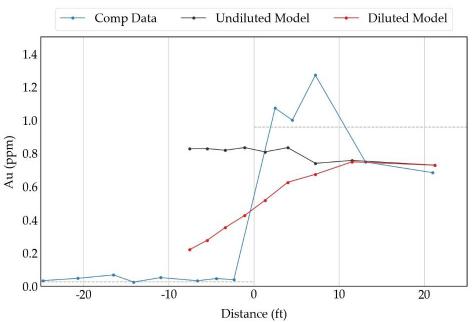
| Effective Date: May 31st, 2022 | | 135 |
| Technical Report - Mineral Resource Estimate Reward Project, Nye County, Nevada, USA |
| 14.11 | Mineral Resource Classification |
| 14.11.1 | 2019 CIM and SK 1300 Definitions |
The Reward Project MRE discussed
in this report has been classified in accordance with guidelines established by the CIM “Estimation of Mineral Resources and Mineral
Reserves Best Practice Guidelines” dated November 29th, 2019 and CIM “Definition Standards for Mineral Resources
and Mineral Reserves” dated May 14th, 2014 and the standards of SK 1300. Due to the substantial similarity in the
CIM and SK 1300 standards, application of both standards produced the same MRE classification.
CIM Definitions
A Measured Mineral Resource
is that part of a Mineral Resource for which quantity, grade or quality, densities, shape, and physical characteristics are estimated
with confidence sufficient to allow the application of Modifying Factors to support detailed mine planning and final evaluation of the
economic viability of the deposit. Geological evidence is derived from detailed and reliable exploration, sampling and testing and is
sufficient to confirm geological and grade or quality continuity between points of observation. A Measured Mineral Resource has a higher
level of confidence than that applying to either an Indicated Mineral Resource or an Inferred Mineral Resource. It may be converted to
a Proven Mineral Reserve or to a Probable Mineral Reserve.
An Indicated Mineral Resource
is that part of a Mineral Resource for which quantity, grade or quality, densities, shape and physical characteristics are estimated with
sufficient confidence to allow the application of Modifying Factors in sufficient detail to support mine planning and evaluation of the
economic viability of the deposit. Geological evidence is derived from adequately detailed and reliable exploration, sampling and testing
and is sufficient to assume geological and grade or quality continuity between points of observation. An Indicated Mineral Resource has
a lower level of confidence than that applying to a Measured Mineral Resource and may only be converted to a Probable Mineral Reserve.
An Inferred Mineral Resource
is that part of a Mineral Resource for which quantity and grade or quality are estimated on the basis of limited geological evidence and
sampling. Geological evidence is sufficient to imply but not verify geological and grade or quality continuity. An Inferred Mineral Resource
has a lower level of confidence than that applying to an Indicated Mineral Resource and must not be converted to a Mineral Reserve. It
is reasonably expected that the majority of Inferred Mineral Resources could be upgraded to Indicated Mineral Resources with continued
exploration.
SK 1300 Definitions
An Indicated Mineral Resource
is that part of a mineral resource for which quantity and grade or quality are estimated on the basis of adequate geological evidence
and sampling. The level of geological certainty associated with an indicated mineral resource is sufficient to allow a qualified person
to apply modifying factors in sufficient detail to support mine planning and evaluation of the economic viability of the deposit. Because
an indicated mineral resource has a lower level of confidence than the level of confidence of a measured mineral resource, an indicated
mineral resource may only be converted to a probable mineral reserve.
| Effective Date: May 31st, 2022 | | 136 |
| Technical Report - Mineral Resource Estimate Reward Project, Nye County, Nevada, USA |
An Inferred Mineral Resource
is that part of a mineral resource for which quantity and grade or quality are estimated on the basis of limited geological evidence and
sampling. The level of geological uncertainty associated with an inferred mineral resource is too high to apply relevant technical and
economic factors likely to influence the prospects of economic extraction in a manner useful for evaluation of economic viability. Because
an inferred mineral resource has the lowest level of geological confidence of all mineral resources, which prevents the application of
the modifying factors in a manner useful for evaluation of economic viability, an inferred mineral resource may not be considered when
assessing the economic viability of a mining project, and may not be converted to a mineral reserve.
A Measured Mineral Resource
is that part of a mineral resource for which quantity and grade or quality are estimated on the basis of conclusive geological evidence
and sampling. The level of geological certainty associated with a measured mineral resource is sufficient to allow a qualified person
to apply modifying factors, as defined in this section, in sufficient detail to support detailed mine planning and final evaluation of
the economic viability of the deposit. Because a measured mineral resource has a higher level of confidence than the level of confidence
of either an indicated mineral resource or an inferred mineral resource, a measured mineral resource may be converted to a proven mineral
reserve or to a probable mineral reserve.
| Effective Date: May 31st, 2022 | | 137 |
| Technical Report - Mineral Resource Estimate Reward Project, Nye County, Nevada, USA |
| 14.11.2 | Classification Criteria |
The classification of the
Measured, Indicated, and Inferred Mineral Resources was based on a combination of geological confidence, data quality, and grade
continuity. The most relevant factors used in the classification process were as follows:
| • | Density of conditioning data. |
| • | Level of confidence in the geological interpretation, which is a result of the extensive re-logging of
drill chips. The observed stratigraphic horizons are easily identifiable along strike and across the deposit, which provides confidence
in the geological and mineralization continuity. |
| • | Continuity of mineralization. |
Resource classification was
determined using a multiple-pass strategy that consisted of a sequence of runs that flagged each block, when a block first met the search
restrictions of that run. With each subsequent pass, the search restrictions were decreased, and therefore, represented a decrease in
confidence and classification from the previous run. During each run, a search ellipsoid centred and orientated as described in Section 4.8
had its ranges modified (Table 14.10) and the number of composites and drill holes found within the run were used to determine if the
restrictions described in Table 14.10 for that run were met. The runs were executed in sequence from Run 1 to Run 3. Classification was
then determined by relating the run number that each block is flagged to: Measured (Run 1), Indicated (Run 2) and Inferred (Run 3).
Table 14.10. Interpolation Search Restrictions.
| Zone |
Run
No. |
Classification |
Min No.
Holes |
Min No.
Comp |
Search Ellipsoid
Range Multiplier |
Major
Range |
Minor
Range |
Vertical
Range |
| Good Hope |
Run 1 |
Measured |
3 |
12 |
2/3 |
165 |
95 |
40 |
| Run 2 |
Indicated |
2 |
2 |
1 |
250 |
140 |
60 |
| Run 3 |
Inferred |
1 |
1 |
2 |
500 |
280 |
120 |
| Gold Ace |
Run 2 |
Indicated |
3 |
12 |
1 |
220 |
120 |
30 |
| Run 3 |
Inferred |
1 |
1 |
2 |
440 |
240 |
60 |
APEX personnel visually validated
the results and believe them to be reasonable given the drilling density. However, a small portion of blocks at the northern (greater
than 6500 N) and southern (less than 2750 N) extents of the Good Hope Deposit were manually adjusted to Inferred as there is insufficient
drilling density to justify higher confidence classifications.
| 14.12 | Evaluation of Reasonable Prospects for Eventual Economic Extraction |
Reasonable prospects for
eventual economic extraction assume open pit mining methods and heap leach processing. The unconstrained resource block model was subjected
to several pit optimization scenarios to look at the prospects for eventual economic extraction. The criteria in Table 14.11 and the Datamine
Studio MaxiPit optimization software were used in creating the conceptual open pit shell.
| Effective Date: May 31st, 2022 | | 138 |
| Technical Report - Mineral Resource Estimate Reward Project, Nye County, Nevada, USA |
Table 14.11. Parameters for Pit Optimization
for Mineral Resource Estimate.
| Parameter |
Unit
(Imperial) |
Cost
(Imperial) |
Unit
(Metric) |
Cost
(Metric) |
| Gold Price |
US$/oz |
1,700 |
US$/g |
54.656 |
| Gold Metallurgical Recovery |
% |
80 |
% |
80 |
| Pit Wall Angles |
° |
48-58 |
° |
48-58 |
| Mining Cost |
US$/st |
2.00 |
US$/tonne |
2.20 |
| Processing Rate |
Mst/a |
3 |
Mtonne/a |
2.7 |
| Processing Cost |
US$/st |
$5.50 |
US$/tonne |
$6.06 |
| G & A Cost |
US$/st |
0.75 |
US$/tonne |
0.80 |
| Cut-off Grade (break even) |
oz/st |
0.0047 |
g/tonne |
0.158 |
| Royalty |
% |
3 |
% |
3 |
The criteria used in the
pit optimizer were considered reasonable for Nevada heap leach deposits. The volume and tonnage for the reported resources within the
$1,700/oz optimized pit shell represents approximately 88% of the total volume and tonnage of the unconstrained block model which utilized
a lower gold cut-off of 0.2 ppm Au (0.006 oz/st Au) for the Mineral Resource statement.
The MRE was estimated within
three-dimensional (3D) solids representing the Low Grade and High Grade mineralized estimation domains. Grade was estimated into a percent
style block model with a block size of 20 ft (X) by 20 ft (Y) by 20 ft (Z). Block were assigned density samples for a given
formation for the ore and waste blocks. Grade estimation of gold was performed using OK. For the purposes of the pit shell optimization,
blocks along the estimation domain boundaries that partially contain waste were diluted by estimating a waste value using composites within
a transition zone along the outer boundary of the estimation domains. The final diluted gold grade for the diluted model assigned to each
block is a volume-weighted average of the estimated gold and waste grade values. The MRE is reported within that pit shell and using the
diluted gold grades.
| Effective Date: May 31st, 2022 | | 139 |
| Technical Report - Mineral Resource Estimate Reward Project, Nye County, Nevada, USA |
| 14.13 | Mineral Resource Statement |
The Reward Project MRE has
an effective date of May 31st, 2022 and is reported in accordance with the CSA’s NI 43-101 rules for disclosure
and has been estimated using the CIM “Estimation of Mineral Resources and Mineral Reserves Best Practice Guidelines” dated
November 29th, 2019 and CIM “Definition Standards for Mineral Resources and Mineral Reserves” dated May 10th,
2014 and in accordance with the requirements of SK 1300.
The MRE was estimated by
Mr. Warren Black, M.Sc., P.Geo. and audited by Mr. Steven Nicholls, BA.Sc., MAIG, both APEX employees. The Qualified Person
for the estimate is Mr. Michael Dufresne, M.Sc., P.Geol., P.Geo.
The Measured and Indicated
resources are reported in Table 14.12 using a base case cut-off of 0.2 ppm Au (0.006 oz/st Au). The Inferred resource base case is reported
in Table 14.13 using a base case cut-off of 0.2 ppm Au (0.006 oz/st Au). Sensitivity cases ranging from 0.1 ppm Au (0.003 oz/st Au) to
0.5 ppm Au (0.015 oz/st Au) are included in the Table 14.14 and Table 14.15 for Good Hope and in Table 14.16 and Table 14.17 for Gold
Ace. Table 14.18 and Table 14.19 provides the sensitivity case for the combined Good Hope and Gold Ace estimates. In each sensitivity
table, the 0.2 ppm Au (0.006 oz/st Au) base case is bolded.
Table 14.12. Measured and Indicated Mineral
Resource Statement.
| Classification |
Au
Cutoff Grade
(g/tonne) |
Tonnage
(metric tonnes) |
Average
Au Grade
(g/tonne) |
Contained Au
(troy ounces) |
| Good Hope Zone |
| Measured |
0.2 |
6,185,000 |
0.855 |
169,900 |
| Indicated |
0.2 |
10,757,000 |
0.694 |
240,000 |
| M & I Total |
0.2 |
16,942,000 |
0.753 |
409,900 |
| Gold Ace Zone |
| Indicated |
0.2 |
828,000 |
0.632 |
16,800 |
| Reward (Combined Good Hope and Gold Ace) |
| Measured |
0.2 |
6,185,000 |
0.855 |
169,900 |
| Indicated |
0.2 |
11,584,000 |
0.689 |
256,800 |
| M & I Total |
0.2 |
17,770,000 |
0.747 |
426,700 |
Notes:
| 1. | Oxide estimated Mineral Resources are reported within a pit shell using the Lerch Grossman algorithm, a gold price of US$1,700/oz
and a recovery of 80% for Au were utilized. |
| 2. | Gold Price used in the mineral resource estimate was based on a review
of the 3 year trailing average. |
| 3. | Mining costs for mineralized material and waste are US$2.20/tonne. |
| 4. | Processing and general and administration are US$6.06/tonne and US$0.83/tonne per tonne processed respectively. |
| 5. | Due to rounding, some columns or rows may not compute as shown. |
| 6. | Estimated Mineral Resources are stated as in situ dry metric tonnes and are partially diluted. |
| 7. | The estimate of Mineral Resources may be materially affected by legal, title, taxation, socio-political, marketing, or other relevant
issues. |
| 8. | The effective date of the Reward mineral resource estimate is May 31st, 2022. |
| Effective Date: May 31st, 2022 | | 140 |
| Technical Report - Mineral Resource Estimate Reward Project, Nye County, Nevada, USA |
Table 14.13. Inferred Mineral Resource Statement.
| Classification |
Au
Cutoff Grade
(ppm) |
Tonnage
(metric tonnes) |
Average
Au Grade
(ppm) |
Contained Au
(troy ounces) |
| Good Hope Zone |
| Inferred |
0.2 |
294,000 |
0.555 |
5,300 |
| Gold Ace Zone |
| Inferred |
0.2 |
931,000 |
0.729 |
21,800 |
| Reward (Combined Good Hope and Gold Ace) |
| Inferred |
0.2 |
1,225,000 |
0.687 |
27,100 |
Notes:
| 1. | Oxide estimated Mineral Resources are reported within a pit shell using the Lerch Grossman algorithm, a gold price of US$1,700/oz
and a recovery of 80% for Au were utilized. |
| 2. | Gold price used in mineral resource estimate was based on a review
of the 3 year trailing average. |
| 3. | Mining costs for mineralized material and waste are US$2.20/tonne. |
| 4. | Processing and general and administration are US$6.06/tonne and US$0.83/tonne per tonne processed respectively. |
| 5. | Due to rounding, some columns or rows may not compute as shown. |
| 6. | Estimated Mineral Resources are stated as in situ dry metric tonnes and are partially diluted. |
| 7. | The estimate of Mineral Resources may be materially affected by legal, title, taxation, socio-political, marketing, or other relevant
issues. |
| 8. | The effective date of the Reward mineral resource estimate is May 31st, 2022. |
Table 14.14. Sensitivity Table, Measured and
Indicated Mineral Resources, Good Hope (base case is bolded).
| Classification |
Au
Cutoff Grade
(ppm) |
Tonnage
(metric tonnes) |
Average
Au Grade
(ppm) |
Contained Au
(troy ounces) |
| Measured |
0.1 |
6,672,000 |
0.804 |
172,400 |
| 0.2 |
6,185,000 |
0.855 |
169,900 |
| 0.3 |
5,269,000 |
0.960 |
162,500 |
| 0.4 |
4,446,000 |
1.073 |
153,300 |
| 0.5 |
3,866,000 |
1.167 |
145,000 |
| Indicated |
0.1 |
12,063,000 |
0.636 |
246,600 |
| 0.2 |
10,757,000 |
0.694 |
240,000 |
| 0.3 |
8,805,000 |
0.792 |
224,300 |
| 0.4 |
6,988,000 |
0.907 |
203,900 |
| 0.5 |
5,706,000 |
1.011 |
185,400 |
|
Measured
and
Indicated |
0.1 |
18,735,000 |
0.696 |
419,000 |
| 0.2 |
16,942,000 |
0.753 |
409,900 |
| 0.3 |
14,074,000 |
0.855 |
386,800 |
| 0.4 |
11,434,000 |
0.972 |
357,200 |
| 0.5 |
9,573,000 |
1.074 |
330,500 |
| Effective Date: May 31st, 2022 | | 141 |
Technical
Report - Mineral Resource Estimate Reward Project, Nye County, Nevada, USA
Notes:
| 1. | Oxide
estimated Mineral Resources are reported within a pit shell using the Lerch Grossman algorithm,
a gold price of US$1,700/oz and a recovery of 80% for Au were utilized. |
| 2. | Gold price used in mineral resource estimate was based on a review
of the 3 year trailing average. |
| 3. | Mining
costs for mineralized material and waste are US$2.20/tonne. |
| 4. | Processing
and general and administration are US$6.06/tonne and US$0.83/tonne per tonne processed respectively. |
| 5. | Due
to rounding, some columns or rows may not compute as shown. |
| 6. | Estimated
Mineral Resources are stated as in situ dry metric tonnes and are partially diluted. |
| 7. | The
estimate of Mineral Resources may be materially affected by legal, title, taxation, socio-political,
marketing, or other relevant issues. |
| 8. | The
effective date of the Reward mineral resource estimate is May 31st, 2022. |
Table 14.15.
Sensitivity Table, Inferred Mineral Resources, Good Hope (base case is bolded).
| Classification |
Au
Cutoff Grade
(ppm) |
Tonnage
(metric tonnes) |
Average
Au Grade
(ppm) |
Contained
Au
(troy ounces) |
| Inferred |
0.1 |
331,000 |
0.510 |
5,400 |
| 0.2 |
294,000 |
0.555 |
5,300 |
| 0.3 |
255,000 |
0.602 |
4,900 |
| 0.4 |
205,000 |
0.663 |
4,400 |
| 0.5 |
141,000 |
0.755 |
3,400 |
Notes:
| 1. | Oxide
estimated Mineral Resources are reported within a pit shell using the Lerch Grossman algorithm,
a gold price of US$1,700/oz and a recovery of 80% for Au were utilized. |
| 2. | Gold price used in mineral resource estimate was based on a review
of the 3 year trailing average. |
| 3. | Mining
costs for mineralized material and waste are US$2.20/tonne. |
| 4. | Processing
and general and administration are US$6.06/tonne and US$0.83/tonne per tonne processed respectively. |
| 5. | Due
to rounding, some columns or rows may not compute as shown. |
| 6. | Estimated
Mineral Resources are stated as in situ dry metric tonnes and are partially diluted. |
| 7. | The
estimate of Mineral Resources may be materially affected by legal, title, taxation, socio-political,
marketing, or other relevant issues. |
| 8. | The
effective date of the Reward mineral resource estimate is May 31st, 2022. |
Table 14.16.
Sensitivity Table, Indicated Mineral Resources, Gold Ace (base case is bolded).
| Classification |
Au
Cutoff Grade
(ppm) |
Tonnage
(metric tonnes) |
Average
Au Grade
(ppm) |
Contained
Au
(troy ounces) |
| Indicated |
0.1 |
899,000 |
0.594 |
17,200 |
| 0.2 |
828,000 |
0.632 |
16,800 |
| 0.3 |
716,000 |
0.690 |
15,900 |
| 0.4 |
585,000 |
0.767 |
14,400 |
| 0.5 |
472,000 |
0.843 |
12,800 |
Notes:
| 1. | Oxide
estimated Mineral Resources are reported within a pit shell using the Lerch Grossman algorithm,
a gold price of US$1,700/oz and a recovery of 80% for Au were utilized. |
| 2. | Gold price used in mineral resource estimate was based on a review
of the 3 year trailing average. |
| 3. | Mining
costs for mineralized material and waste are US$2.20/tonne. |
| 4. | Processing
and general and administration are US$6.06/tonne and US$0.83/tonne per tonne processed respectively. |
| 5. | Due
to rounding, some columns or rows may not compute as shown. |
| 6. | Estimated
Mineral Resources are stated as in situ dry metric tonnes and are partially diluted. |
| 7. | The
estimate of Mineral Resources may be materially affected by legal, title, taxation, socio-political,
marketing, or other relevant issues. |
| 8. | The
effective date of the Reward mineral resource estimate is May 31st, 2022. |
| Effective Date: May 31st, 2022 | | 142 |
Technical
Report - Mineral Resource Estimate Reward Project, Nye County, Nevada, USA
Table 14.17.
Sensitivity Table, Inferred Mineral Resources, Gold Ace (base case is bolded).
| Classification |
Au
Cutoff Grade
(ppm) |
Tonnage
(metric tonnes) |
Average
Au Grade
(ppm) |
Contained
Au
(troy ounces) |
| Inferred |
0.1 |
1,031,000 |
0.673 |
22,300 |
| 0.2 |
931,000 |
0.729 |
21,800 |
| 0.3 |
802,000 |
0.806 |
20,800 |
| 0.4 |
671,000 |
0.896 |
19,300 |
| 0.5 |
537,000 |
1.009 |
17,400 |
Notes:
| 1. | Oxide
estimated Mineral Resources are reported within a pit shell using the Lerch Grossman algorithm,
a gold price of US$1,700/oz and a recovery of 80% for Au were utilized. |
| 2. | Gold price used in mineral resource estimate was based on a review
of the 3 year trailing average. |
| 3. | Mining
costs for mineralized material and waste are US$2.20/tonne. |
| 4. | Processing
and general and administration are US$6.06/tonne and US$0.83/tonne per tonne processed respectively. |
| 5. | Due
to rounding, some columns or rows may not compute as shown. |
| 6. | Estimated
Mineral Resources are stated as in situ dry metric tonnes and are partially diluted. |
| 7. | The
estimate of Mineral Resources may be materially affected by legal, title, taxation, socio-political,
marketing, or other relevant issues. |
| 8. | The
effective date of the Reward mineral resource estimate is May 31, 2022. |
Table 14.18.
Sensitivity Table, Measured and Indicated Mineral Resources, Good Hope and Gold Ace (base case is bolded).
| Classification |
Au
Cutoff Grade
(ppm) |
Tonnage
(metric tonnes) |
Average
Au Grade
(ppm) |
Contained
Au
(troy ounces) |
| Measured |
0.1 |
6,672,000 |
0.804 |
172,400 |
| 0.2 |
6,185,000 |
0.855 |
169,900 |
| 0.3 |
5,269,000 |
0.960 |
162,500 |
| 0.4 |
4,446,000 |
1.073 |
153,300 |
| 0.5 |
3,866,000 |
1.167 |
145,000 |
| Indicated |
0.1 |
12,962,000 |
0.633 |
263,700 |
| 0.2 |
11,584,000 |
0.689 |
256,800 |
| 0.3 |
9,521,000 |
0.785 |
240,200 |
| 0.4 |
7,573,000 |
0.897 |
218,300 |
| 0.5 |
6,178,000 |
0.998 |
198,200 |
Measured
and
Indicated |
0.1 |
19,634,000 |
0.691 |
436,200 |
| 0.2 |
17,770,000 |
0.747 |
426,700 |
| 0.3 |
14,790,000 |
0.847 |
402,700 |
| 0.4 |
12,019,000 |
0.962 |
371,700 |
| 0.5 |
10,044,000 |
1.063 |
343,300 |
Notes:
| 1. | Oxide
estimated Mineral Resources are reported within a pit shell using the Lerch Grossman algorithm,
a gold price of US$1,700/oz and a recovery of 80% for Au were utilized. |
| 2. | Gold price used in mineral resource estimate was based on a review
of the 3 year trailing average. |
| 3. | Mining
costs for mineralized material and waste are US$2.20/tonne. |
| 4. | Processing
and general and administration are US$6.06/tonne and US$0.83/tonne per tonne processed respectively. |
| 5. | Due
to rounding, some columns or rows may not compute as shown. |
| 6. | Estimated
Mineral Resources are stated as in situ dry metric tonnes and are partially diluted. |
| 7. | The
estimate of Mineral Resources may be materially affected by legal, title, taxation, socio-political,
marketing, or other relevant issues. |
| 8. | The
effective date of the Reward mineral resource estimate is May 31, 2022. |
| Effective Date: May 31st, 2022 | | 143 |
Technical
Report - Mineral Resource Estimate Reward Project, Nye County, Nevada, USA
Table 14.19.
Sensitivity Table, Inferred Mineral Resources, Good Hope and Gold Ace (base case is bolded).
| Classification |
Au
Cutoff Grade
(ppm) |
Tonnage
(metric tonnes) |
Average
Au Grade
(ppm) |
Contained
Au
(troy ounces) |
| Inferred |
0.1 |
1,362,000 |
0.633 |
27,700 |
| 0.2 |
1,225,000 |
0.687 |
27,100 |
| 0.3 |
1,057,000 |
0.757 |
25,700 |
| 0.4 |
876,000 |
0.841 |
23,700 |
| 0.5 |
678,000 |
0.956 |
20,800 |
Notes:
| 1. | Oxide
estimated Mineral Resources are reported within a pit shell using the Lerch Grossman algorithm,
a gold price of US$1,700/oz and a recovery of 80% for Au were utilized. |
| 2. | Gold price used in mineral resource estimate was based on a review
of the 3 year trailing average. |
| 3. | Mining
costs for mineralized material and waste are US$2.20/tonne. |
| 4. | Processing
and general and administration are US$6.06/tonne and US$0.83/tonne per tonne processed respectively. |
| 5. | Due
to rounding, some columns or rows may not compute as shown. |
| 6. | Estimated
Mineral Resources are stated as in situ dry metric tonnes and are partially diluted. |
| 7. | The
estimate of Mineral Resources may be materially affected by legal, title, taxation, socio-political,
marketing, or other relevant issues. |
| 8. | The
effective date of the Reward mineral resource estimate is May 31, 2022. |
14.14 Discussion
of Mineral Resources Modelling, Risks and Uncertainties
The
complete assay database comprises assays from 18 drilling programs from 1987 to 2018, utilizing six different analytical labs and two
mine labs. The uniformity of analytical data across these numerous generations of data collection is complex and difficult to interpret
in some instances because of the large number of drilling programs and laboratories used, which provides a source of risk. To date, data
verification of historical data has been completed to industry standards as described in Section 12, including a number of twin
drill holes. To help decrease this risk further, additional drilling in critical volumes of the deposit that contain large amounts of
contained metal dominated by historical RC drilling would allow for additional data analysis to help establish the quality and uniformity
of the various generations of analytical data.
At
the Good Hope Deposit, gold mineralization is predominantly associated with logged oxide and, to a lesser extent, with transition material
(sulphides comprise <1% of the rock mass). Gold solubility is consistently high (>70%) across the Good Hope Deposit, and total
sulphur values are predominantly low, with an average of 0.1 wt%. Logged redox correlates well with total sulphur. However, recoveries
from the Gold Ace Zone are lower than Good Hope. Gold solubility using Cyanide Ratio to Fire Assay ratios from lab assays does not appear
to correlate with either logged REDOX or total sulphur. Section 13.6.1 describes that silica encapsulation may explain the observed
lower gold recoveries; however, metallurgical testing has not determined this definitively. Silica encapsulation provides a source of
uncertainty when defining reasonable prospects for eventual economic extraction. Metallurgical testing at Gold Ace is limited, and future
work should aim to determine the expected heap leach recovery of material from the Gold Ace Zone.
| Effective Date: May 31st, 2022 | | 144 |
Technical
Report - Mineral Resource Estimate Reward Project, Nye County, Nevada, USA
The
authors are not aware of any other significant material risks to the MRE other than the risks that are inherent to mineral exploration
and development in general. The authors of this report are not aware of any specific environmental, permitting, legal, title, taxation,
socio-economic, marketing, political or other relevant factors that might materially affect the results of this resource estimate and
there appear to be no obvious impediments to developing the MRE at the Reward Gold Project.
------
Sections 15-22
are not included. This Technical Report for the Reward Project provides an initial Mineral Resource Estimate only.
------
23 Adjacent
Properties
23.1 Bullfrog
The
Bullfrog property, owned by Augusta, is located in the Walker Lane district, a prolific gold-producing region. The property is 11.27
km (7 miles) northwest of the Project, and the two properties are connected via paved highway (Figure 23.1). The Bullfrog property consists
of approximately 3,157 ha (7,800 acres) of mineral rights (Augusta Gold, 2021). Bullfrog contains three historical operating pits: Montgomery-Shoshone,
Bullfrog, and Bonanza Mountain (Augusta Gold, 2021).
The
Bullfrog property is located in brittle middle Miocene volcanic rocks, ranging from latite lavas to rhyolitic Ammonia Tanks Tuff (Downer
and House, 2022). These rocks were severely deformed from detachment faulting and associated dip-slip and strike-slip displacements (Downer
and House, 2022). Epithermal solutions permeated the broken host rocks, precipitating micron-sized, relatively high-grade gold within
major quartz-calcite veins and disseminated gold in associated stock-works (Downer and House, 2022).
Effective
December 31, 2021, the measured resource estimate for the Bullfrog property is 16,381,580 g (526,680 oz) gold grading 0.544 g/t
(0.016 oz/t) gold, an indicated mineral resource of 21,231,540 g (682,610 oz) gold grading 0.519 g/t (0.015 oz/t) and an inferred mineral
resource of 8,021,590 g (257,900 oz) gold grading 0.481 g/t (0.014 oz/t) (Augusta Gold, 2022).
The
Bullfrog property occurs outside of the Reward Project. The QPs have not visited this property and are unable to verify the information
pertaining to the mineralization at Bullfrog. The information presented in this section is not necessarily indicative of the mineralization
on the Property that is the subject of this Technical Report. The information provided in this section is
simply intended to describe examples of the type and tenor of mineralization that exists in the region and is being explored for at Reward.
| Effective Date: May 31st, 2022 | | 145 |
Technical
Report - Mineral Resource Estimate Reward Project, Nye County, Nevada, USA
Figure 23.1.
Adjacent Properties.
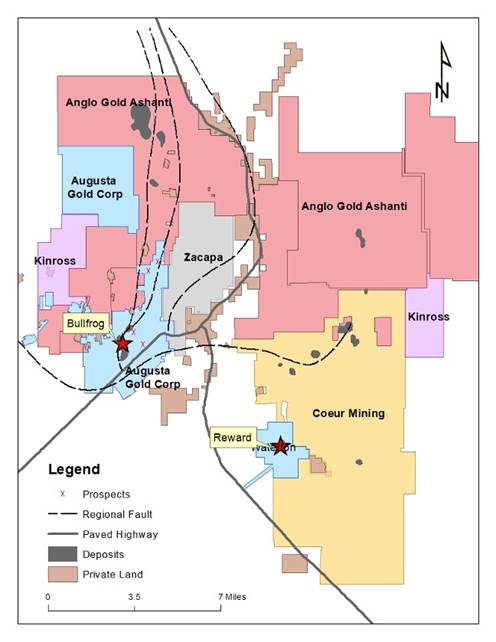
Note: Source is Augusta Gold,
2022.
23.2 Sterling
and Crown
The
Sterling and Crown properties are owned by Coeur Mining Inc. and are adjacent to the Property on its northern, eastern, and southern
edges (Figure 23.1). The Sterling and Crown properties consist of 5,710 hectares (14,109 acres) of mineral claims, including the Sterling,
Daisy, Secret Pass, and SNA gold deposits. The Sterling and Crown properties also include the Sterling open pit and underground heap
leach gold mine, which ceased gold production in 2000 (Ennis et al., 2017).
| Effective Date: May 31st, 2022 | | 146 |
Technical
Report - Mineral Resource Estimate Reward Project, Nye County, Nevada, USA
The
Sterling deposit occurred at and below the Sterling Thrust contact between the Wood Canyon and Bonanza King formations (Ennis et al.,
2017). Gold is hosted by argillaceous arkosic siltstones, arkosic sandstones, quartzites, dolomites, limestones, and breccias, occurring
as submicron to micron size particles (Ennis et al., 2017).
The
Daisy, Secret Pass, and SNA deposits are hosted by Tertiary volcanics and Paleozoic-aged rocks and are found in the Nopah Formation,
Crater Flat Tuff deposit, and Antelope Valley Formation, respectively (Ennis et al., 2017). North-striking normal faulting is the principal
control for mineralization, regardless of the deposit, and the highest gold grades are commonly associated with fault intersections (Ennis
et al., 2017).
Effective
December 31, 2021, the properties have an inferred mineral resource of 28,428,580 g (914,000 oz) gold grading 0.86 g/t (0.025 oz/t)
(Coeur Mining, 2022).
The
Sterling and Crown properties occur outside of the Reward Project. The QPs have not visited this property and are unable to verify the
information pertaining to the mineralization at Sterling and Crown. The information presented in this section is not necessarily indicative
of the mineralization on the Property that is the subject of this Technical Report. The information provided in this section is simply
intended to describe examples of the type and tenor of mineralization that exists in the region and is being explored for at Reward.
24 Other Relevant
Data and Information
This
section is not relevant to this Report.
25 Interpretation
and Conclusions
25.1 Introduction
The
QPs note the following interpretations and conclusions in their respective areas of expertise, based on the review of data available
for this Report.
25.2 Mineral
Tenure, Surface Rights, Water Rights, Royalties/Agreements
Information
obtained from CR Reward supports that the mineral tenure held is valid, and the granted exploitation licence is sufficient to support
a declaration of Mineral Resources and eventually Mineral Reserves.
CR
Reward, a wholly owned subsidiary of Augusta, holds a 100% interest in the mineral claims and mineral leases that form the Project.
| Effective Date: May 31st, 2022 | | 147 |
Technical
Report - Mineral Resource Estimate Reward Project, Nye County, Nevada, USA
A
3% NSR royalty is payable on any minerals mined from the Connolly Claims, but is reduced to 2% as CR Reward only owns a two-third interest
in the Connolly Claims. Annual advance minimum royalty payments are payable under the Connolly Lease in an amount equal to $10,000/year.
A
3% NSR royalty is payable on any minerals mined from the Webster Claims, but is (i) reduced to 1% on the Sunshine and Reward claims
as the lessee only owns a one-third interest, and (ii) reduced to 1.5% on the Good Hope claim as CR Reward only owns a half interest
in this claim. Annual advance minimum royalty payments are payable under the Webster Lease in an amount equal to $7,500/year.
A
3% NSR royalty is payable on minerals mined from the Orser–McFall Claims, but is reduced to 1.5% on the Good Hope claim as the
lessee only owns a half interest in that claim. Annual advance minimum royalty payments are payable under the Orser–McFall Lease
in an amount equal to $20,000/year.
A
3% NSR royalty is payable on minerals mined from the Van Meeteren Claims. Annual advance minimum royalty payments are payable under the
Van Meeteren Lease in an amount equal to $15/acre from 2011 through 2020, for a total of $1,800/year, and $20/acre from and after 2021,
for a total of $2,400/year.
The
Project area mainly consists of Federal public domain lands administered by the BLM. There are no State or private tracts within the
Project area, except the six patented claims owned by CR Reward, all of which carry surface and mineral rights ownership.
Water
rights are granted, and sufficient to support potential mining operations.
The
Project is not subject to any other back-in rights payments, agreements or encumbrances.
To
the extent known to the QPs, there are no other significant factors and risks that may affect access, title, or the right or ability
to perform work on the Project that have not been discussed in this Report.
25.3 Geology
Mineralization
the Good Hope Deposit and Golden Ace Zone can be classified as examples of a structurally-controlled, locally-disseminated, sediment-hosted,
mesothermal quartz vein gold deposit.
The
geological understanding of the settings, lithologies, and structural and alteration controls on mineralization in the different zones
is sufficient to support estimation of Mineral Resources and Mineral Reserves. The geological knowledge of the area is also considered
sufficiently acceptable to reliably inform mine planning.
| Effective Date: May 31st, 2022 | | 148 |
Technical
Report - Mineral Resource Estimate Reward Project, Nye County, Nevada, USA
The
mineralization style and setting are well understood and can support declaration of Mineral Resources and Mineral Reserves.
At
the Good Hope Deposit, gold mineralization remains open to the east towards the Good Fortune fault and south of 3000 N. The eastern
area of the deposit, most notably along the Good Fortune fault, has had limited drilling. Wide-spaced drilling along the southern extension
of the fault zone has intersected anomalous gold mineralization. The projected intersection of the Good Hope fault zone and the Gold
Ace trend also remains under drilled.
25.4 Exploration,
Drilling and Analytical Data Collection in Support of Mineral Resource Estimation
The
exploration programs completed to date are appropriate for the style of the deposits on the Project.
Sampling
methods are acceptable for Mineral Resource and Mineral Reserve estimation.
Sample
preparation, analysis and security are generally performed in accordance with exploration best practices and industry standards.
The
quantity and quality of the lithological, geotechnical, collar and down-hole survey data collected during the exploration and delineation
drilling programs are sufficient to support Mineral Resource and Mineral Reserve estimation. The collected sample data adequately reflect
deposit dimensions, true widths of mineralization, and the style of the deposits. Sampling is representative of the gold grades in the
deposits, reflecting areas of higher and lower grades.
The
QA/QC programs adequately address issues of precision, accuracy and contamination. Drilling programs typically included blanks, duplicates
and standard samples. QA/QC submission rates meet industry-accepted standards.
The
data verification programs concluded that the data collected from the Project adequately support the geological interpretations and constitute
a database of sufficient quality to support the use of the data in Mineral Resource and Mineral Reserve estimation.
25.5 Metallurgical
Test work
Metallurgical
test work and associated analytical procedures were appropriate to the mineralization type, appropriate to establish the optimal processing
routes, and were performed using samples that are typical of the mineralization styles found within the Good Hope Deposit area. Recovery
factors estimated are based on appropriate metallurgical test work.
Results
from the metallurgical test work show that Good Hope ore is amenable to cyanide leaching with an expected field recovery of 79% at the
nominated P80 minus ¼ inch crush size. Reagent consumption is low to moderate with expected cyanide consumption of
0.73 lb/st and a lime consumption of 1.53 lb/st. Cement agglomeration is not required for heap heights under 262 ft.
| Effective Date: May 31st, 2022 | | 149 |
Technical
Report - Mineral Resource Estimate Reward Project, Nye County, Nevada, USA
The
Gold Ace deposit is less amenable to cyanide leaching with an estimated field recovery of 58.5% and reagent consumptions of 0.72 lb/st
and 2.46 lb/st for cyanide and lime, respectively. At present, the Gold Ace deposit is not included in the Mineral Reserve estimate.
There
are no deleterious elements known that would affect process activities or metallurgical recoveries.
25.6 Mineral
Resource Estimate
Mineral
Resources are reported using the 2019 CIM Definition Standards and the standards of SK 1300 and assume open pit mining methods.
Factors
that may affect the Mineral Resource estimates include: metal price assumptions; changes to the assumptions used to generate the gold
cut-off grade; changes in local interpretations of mineralization geometry and continuity of mineralized zones; changes to geological
and mineralization shape and geological and grade continuity assumptions; density and domain assignments; changes to geotechnical, mining
and metallurgical recovery assumptions; change to the input and design parameter assumptions that pertain to the conceptual pit constraining
the estimates; and assumptions as to the continued ability to access the site, retain mineral and surface rights titles, maintain environment
and other regulatory permits, and maintain the social license to operate.
There
is upside potential for the estimates if mineralization that is currently classified as Inferred or exploration target can be upgraded
to higher-confidence Mineral Resource categories.
25.7 Risks
and Uncertainties
The
complete assay database comprises assays from 18 drilling programs from 1987 to 2018, utilizing six different analytical labs and two
mine labs. The uniformity of analytical data across these numerous generations of data collection is complex and difficult to interpret
in some instances because of the large number of drilling programs and laboratories used, which provides a source of risk. To date, data
verification of historical data has been completed to industry standards as described in Section 12, including a number of twin
drill holes. To help decrease this risk further, additional drilling in critical volumes of the deposit that contain large amounts of
contained metal dominated by historical RC drilling would allow for additional data analysis to help establish the quality and uniformity
of the various generations of analytical data.
| Effective Date: May 31st, 2022 | | 150 |
Technical
Report - Mineral Resource Estimate Reward Project, Nye County, Nevada, USA
At
the Good Hope Deposit, gold mineralization is predominantly associated with logged oxide and, to a lesser extent, with transition material
(sulphides comprise <1% of the rock mass). Gold solubility is consistently high (>70%) across the Good Hope zone, and total sulphur
values are predominantly low, with an average of 0.1 wt%. Logged redox correlates well with total sulphur. However, recoveries from the
Gold Ace Zone are lower than Good Hope. Au solubility using Cyanide Ratio to Fire Assay ratios from lab assays does not appear to correlate
with either logged REDOX or total sulphur. Section 13.6.1 describes that silica encapsulation may explain the observed lower gold
recoveries; however, metallurgical testing has not determined this definitively. Silica encapsulation provides a source of uncertainty
when defining reasonable prospects for eventual economic extraction. Metallurgical testing at Gold Ace is limited, and future work should
aim to determine the expected heap leach recovery of material from the Gold Ace. In the opinion of the authors, additional drilling and
metallurgical work could improve the metallurgical model at the Good Hope Deposit, which may lead to an increase in the amount of high
and moderate recovery material.
With
any intermediate stage exploration project there exists potential risks and uncertainties. The Company will attempt to reduce risk/uncertainty
through effective project management, engaging technical experts and developing contingency plans. Potential risks include changes in
the price of gold, availability of investment capital, changes in government regulations, community engagement and socio-economic community
relations, permitting and legal challenge risks and general environment concerns.
The
authors are not aware of any other significant material risks to the MRE other than the risks mentioned above. The authors of this report
are not aware of any specific environmental, permitting, legal, title, taxation, socio-economic, marketing, political or other relevant
factors that might materially affect the results of this resource estimate and there appear to be no obvious impediments to developing
the MRE at the Reward Gold Project. There is no guarantee that further exploration will result in the discovery of additional mineralization
at the Reward Project.
25.8 Conclusions
Based
upon a review of available information, historical and recent exploration data, the authors site visits and the current MRE for the Good
Hope Deposit and Gold Ace Zone of the Reward Project, the authors view the Project as an intermediate stage exploration property of merit
prospective for the additional discovery, and future development, of potentially economic structurally-controlled, locally-disseminated,
sediment-hosted, mesothermal quartz vein gold mineralization. This contention is supported by the following:
| • | The
favourable geological setting of the Reward Project and its position within the Walker Land
Trend, a prolifically mineralized belt that is host to numerous gold deposits and current
and past producing mines in south-central Nevada. |
| Effective Date: May 31st, 2022 | | 151 |
Technical
Report - Mineral Resource Estimate Reward Project, Nye County, Nevada, USA
| • | Historical
exploration and recent work by CR Reward has delineated a large zone of gold mineralization
at Good Hope and Gold Ace and led to the calculation of the current MRE. |
| • | Recent
metallurgical testwork indicates projected field gold recovery of 79% for the Good Hope Deposit
at the nominated P80 minus ¼ inch crush size. |
| • | A
current MRE has been estimated herein and is provided in Table 25.1 below: |
Table 25.1.
Reward Project Mineral Resource Estimate at May 31st, 2022 Based on USD$1,700/oz. Au.
| Classification |
Tonnage
(Mt) |
Average
Grade (g/t) |
Contained
Au (koz) |
| Good
Hope |
Measured
Indicated
M&I Total |
6.19
10.76
16.94 |
0.86
0.69
0.75 |
169.9
240.0
409.9 |
| Inferred |
0.29 |
0.56 |
5.3 |
| Gold
Ace |
Indicated
Inferred |
0.83
1.03 |
0.63
0.73 |
16.8
21.8 |
| Reward
(Combined Good Hope and Gold Ace) |
Measured
Indicated
M&I Total |
6.19
11.58
17.77 |
0.86
0.69
0.75 |
169.9
256.8
426.7 |
| Inferred |
1.23 |
0.68 |
27.1 |
Notes:
| 1. | Oxide
estimated Mineral Resources are reported within a pit shell using the Lerch Grossman algorithm,
a gold price of US$1,700/oz and a recovery of 80% for Au were utilized. |
| 2. | Gold
price used in mineral resource estimate was based on a review of the 3 year trailing average. |
| 3. | Mining
costs for mineralized material and waste are US$2.20/tonne. |
| 4. | Processing
and general and administration are US$6.06/tonne and US$0.83/tonne per tonne processed, respectively. |
| 5. | The
mineral resources are reported utilizing a 0.2 g/t Au incremental lower cut-off grade. |
| 6. | Due
to rounding, some columns or rows may not compute as shown. |
| 7. | Estimated
Mineral Resources are stated as in situ dry metric tonnes and are partially diluted. |
| 8. | The
estimate of Mineral Resources may be materially affected by legal, title, taxation, socio-political,
marketing, or other relevant issues. |
| 9. | The
effective date of the Reward mineral resource estimate is May 31st, 2022. |
26 Recommendations
Based
on the outcomes of this Technical Report and prior work conducted by CR Reward, it is recommended that CR Reward and Augusta proceed
to a Preliminary Feasibility Study (PFS) for the Reward Project in order to examine opportunities to develop the Project. The PFS will
be an update to a historical internal Feasibility Study (FS) prepared in 2019 on behalf of CR Reward and Waterton. The recommended PFS
will incorporate current pricing for major equipment, contract mining costs, construction costs, major consumables, and labor costs.
| Effective Date: May 31st, 2022 | | 152 |
Technical
Report - Mineral Resource Estimate Reward Project, Nye County, Nevada, USA
The
budget for completing a PFS is $US1,100,000, including contingency, as summarized in Table 26.1.
Table 26.1.
Estimated budget for the recommended PFS.
| Item |
Cost
USD$ |
| Primary
Engineer, includes Process and Infrastructure |
420,000 |
| Mineral
Resource Estimate |
20,000 |
| Mining
and Mineral Reserve |
40,000 |
| Geotechnical
and Earthworks |
110,000 |
| Power
and Other Consulting |
400,000 |
| Contingency |
110,000 |
| Total |
1,100,000 |
| Effective Date: May 31st, 2022 | | 153 |
Technical
Report - Mineral Resource Estimate Reward Project, Nye County, Nevada, USA
27 References
Albert,
Terry: Report of Metallurgical Testwork (Kappes, Cassiday and Associates Project 9147C, Report KCA 0180001_REW01_05, 2018).
ALS,
2017. Geochemistry schedule of services and fees 2017 USD, ALS Global, p42.
Armbrust,
George A., et al., Reward Project Pre-feasibility Study (CAM Report No. 057111, 2006), Section 7.0, p78-86.
ASTM
D4543 - 08 Standard Practices for Preparing Rock Core as Cylindrical Test Specimens and Verifying Conformance to Dimensional and Shape
Tolerances.
ASTM
D5607 - 08 Standard Test Method for Performing Laboratory Direct Shear Strength Tests of Rock Specimens Under Constant Normal Force.
ASTM
D5731 - 08 Standard Test Method for Determination of the Point Load Strength Index of Rock and Application to Rock Strength Classifications.
ASTM
D7012 - 14 Standard Test Methods for Compressive Strength and Elastic Moduli of Intact Rock Core Specimens under Varying States of Stress
and Temperatures.
Augusta
Gold Corp. (2021): Augusta Gold commences 2021 exploration program at its Bullfrog gold project; Augusta Gold Corp. News Release dated
February 11, 2021, < https://www.augustagold.com/_resources/news/nr_20210211.pdf >
Augusta
Gold Corp. (2022): Augusta Gold announces Reward mineral resource estimate; Augusta Gold Corp. News Release dated June 7, 2022,
< https://www.augustagold.com/news/augusta-gold-announces-reward-mineral-resource-estimate >
Barcia,
M., 2017. Reward – Structural & Formation Modeling; Elko Mining Group, unpublished internal memorandum dated May 9,
2017, p16
Bernard,
F., Chlumsky, G., Read, M.J., Reilly, M.P., and Sandefur, R.L., 2012. NI 43-101 Technical Report on the Reward Gold Project, Nye County,
Nevada USA. Unpublished Technical Report (NI 43-101 compliant) prepared for Atna Resources Ltd. dated June 29, 2012, p146.
Bernard,
Fred et al., Reward Project Feasibility Study (CAM Report No. 077111, 2008), Section 6.0, p.95-117.
BLM,
2009. Environmental Assessment DOI-BLM-NV-S030-2007-0295-EA: CR Reward Corporation Reward Project. Report prepared by U.S. Department
of the Interior, Bureau of Land Management (BLM) for the CR Reward Corporation. June 26, 2009.
Brown,
C., 2018. Reward Oriented Core Analysis; Unpublished consulting report prepared by Oriented Targeting Solutions on behalf of CR Reward,
dates June 2018, p44.
| Effective Date: May 31st, 2022 | | 154 |
Technical
Report - Mineral Resource Estimate Reward Project, Nye County, Nevada, USA
Bryan,
R., 2017. NI 43-101 Technical Report Mineral Estimate Bullfrog Gold Project, Nye County, Nevada. Unpublished Technical Report (NI 43-101
compliant) prepared for Bullfrog Gold Corp., dated August 9, 2017, p93.
Bryan,
R., 2017. NI 43-101 Technical Report Mineral Resource Estimate Bullfrog Gold Project Nye County, Nevada, Document: 910557-REP-R0001-01.
Call,
R.D. and Savely, J.P., 1990. Open Pit Rock Mechanics. Surface Mining, ed. B.A. Kennedy, 2nd ed., Chapter 6.8. Littleton, Colorado: SME.
CAM,
2006. Pre-Feasibility Study - Reward Project: consulting report dated 26 January 2006, prepared for Canyon Resources Corporation
by Chlumsky, Armbrust & Meyer, LLC (George A. Armbrust Ph.D., C.P.G; Gregory F. Chlumsky; Kenneth L. Meyer; Michael J. Read;
Robert L. Sandefur P.E.).
CAM,
2008b. Technical Report, Reward Project, Nye County, Nevada: consulting report dated December 15, 2008, prepared for Atna Resources
Ltd. by Chlumsky, Armbrust & Meyer, LLC (Fred Barnard, Ph.D., Gregory F. Chlumsky; Kenneth L. Meyer; Michael J. Read; Robert
L. Sandefur P.E.). In pdf format.
CAM,
2012. NI 43-101 Technical Report, Reward Project, Nye County, Nevada prepared for Atna Resources Ltd. by Barnard, F., Ph, D., Cpg-, A.C.M.,
Chlumsky, G., Read, M.J., Member, S.M.E.R., Sandefur, R.L., and Colorado, P.E. 140 pages in pdf format.
Canadian
Institute of Mining, Metallurgy and Petroleum (CIM), 2003: Estimation of Mineral Resources and Mineral Reserves – Best Practice
Guidelines, May 30, 2003: adopted by CIM Council on November 23, 2003.
Canadian
Institute of Mining, Metallurgy and Petroleum (CIM), 2014: CIM Definition Standards – for Mineral Resources and Mineral Reserves,
prepared by the CIM Standing Committee on Reserve Definitions: adopted by the CIM Council, May 2014.
Canadian
Securities Administrators (CSA), 2011: National Instrument 43-101, Standards of Disclosure for Mineral Projects, Canadian Securities
Administrators.
Carisey,
1989. Continuum Analytics, 2017. Anaconda Software Distribution. Retrieved from https://continuum.io
Centre
for Computational Geostatistics (CCG). 2016. Pygeostat. Edmonton AB: Centre for Computational Geostatistics. Retrieved from http://www.ccgalberta.com
Code
of Federal Regulations (CFR): Commodity and Securities Exchange Regulation S-K 1300, Title 17 subpart 229.1300, pp. 1300-1305.
Continuum
Analytics, 2017. Anaconda Software Distribution. Retrieved from https://continuum.io
Coeur
Mining Inc., 2022: Coeur reports year-end 2021 mineral reserves and resources; Coeur Mining Inc. News Release dated February 16,
2022, < https://www.coeur.com/_resources/news/nr_20220216.pdf >
| Effective Date: May 31st, 2022 | | 155 |
Technical
Report - Mineral Resource Estimate Reward Project, Nye County, Nevada, USA
Converse,
2007. Canyon Resources Reward Mine Biological Assessment, Nye County, Nevada: Desert Tortoise, Sensitive Species, Bats, Migratory Birds,
Noxious Weeds. Report prepared by Converse Consultants (Converse) for CR Briggs Corporation. September 27, 2007.
Cornwall,
H.R. and Kleinhampl, F.J., 1961, Preliminary Geologic Map and Sections of the Bullfrog Quadrangle, Nevada-California: U.S. Geological
Survey, Miscellaneous Field Studies Map MF-177.
Cornwall,
H.R. and Kleinhampl, F.J, 1964, Geology of Bullfrog Quadrangle and Ore Deposits related to Bullfrog Hills Caldera, Nye County, Nevada
and Inyo County, California,1964: U.S. Geological Survey Professional Paper 454-J
CR.,
2018. Application for Renewal Water Pollution Control Permit NEV2007101. Report prepared by CR Reward Corporation (CR) and submitted
to Nevada Division of Environmental Protection (NDEP). March 2018.
CRC.,
2007. Reward Project: Water Pollution Control Permit Application. Prepared by Canyon Resources Corporation (CRC) for a Water Pollution
Control Permit. March 2007.
CRRC.,
2009. Reward Project: Updated Plan of Operations and Reclamation Plan. BLM Case File Serial Number N-82840. Prepared by CR Reward Corporation
(CRRC) for the Bureau of Land Management (BLM) and the Bureau of Mining Regulation and Reclamation (BMRR). July 2009.
CRRC.,
2018. Application for Renewal Water Pollution Control Permit NEV2007101: CR Reward Corporation Reward Project. Volume 3: Meteorological
Report. Submitted by CR Reward Corporation (CRRC) to Nevada Division of Environmental Protection (NDEP). March 2018.
County,
Nevada: internal memo prepared for Barrick Bullfrog, Inc, dated February 9, 1996, p15Fowlow, Keith, 2017. Reward Database Verification;
Elko Mining Group, unpublished internal memorandum dated May 9, 2017, p6
Downer,
R., and House, A., 2022: NI 43-101 Technical Report and Mineral Resource Estimate on the Bullfrog Gold Project, Nye County, Nevada, Canada;
submitted by Augusta Gold Corp., 186 p., < Available at www.sedar.com >
Eliopulos,
G.J., 1996. Report on Exploration and Drilling during 1995 at the Reward Property, Nye
Ennis,
S., Loveday, D., Turner, W.A., DeLong, R.F., 2017: Technical Report on the Sterling Property, Nye County, Nevada, USA: A Property Under
Option to Purchase by Northern Empire., 165 p., < Available at www.sedar.com >
Evans,
D., Lincoln, N., Scott, T., Willow, M., Cremeens, J., Dufresne, M. and Dyer, T., 2019: Reward Project feasibility study NI 43-101 technical
report Nevada, USA, internal report prepared by Lycopodium Minerals Canada Ltd., dated September 6, 2019, p242.
Fowlow,
Keith, 2018a. Reward 2018 DataShed database and exports; CR Reward Corp., unpublished internal report dated March 28, 2018, p12.
Fowlow,
Keith, 2018b. February 2017 Reward database verification with 2018 addendum; Elko Mining Group, unpublished internal memorandum
p7.
| Effective Date: May 31st, 2022 | | 156 |
| Technical Report - Mineral Resource Estimate Reward Project, Nye County, Nevada, USA |
Geological Survey
(US), & Monsen, S. A., 1992. Geologic map of Bare Mountain, Nye County, Nevada. The Survey.
Gillstrom, G.,
2006. Technical Report on the Sterling Property 144 Zone: Resource Summary and Exploration Proposal, Nevada, U.S.A., p89.
Golder, 2007.
Golder Associates Inc., Draft Report on Slope Design Recommendations - Reward Project, Nye County, Nevada.
Golder Associates
Inc., Design Report for Reward Mine Heap Leach Facility. March 2007.
Golder Associates
Inc., Reward Leach Event Pond, J-629. January 2013.
Goldfarb, R.J.,
Baker, T., Dube, B., Groves, D.I., Hart, C.J R. and Gosselin, P., 2005: Distribution, Characters and Genesis of Gold Deposits in Metamorphic
Terranes: Economic Geology 100th Anniversary Volume, Society of Economic Geologists, Littleton, Colorado, USA, pp. 407–450.
Groves, D.I.,
Goldfarb, R.J., Gebre-Mariam, M., Hagemann, S.G., and Robert, F. 1998: Orogenic Gold Deposits: A Proposed Classification in the Context
of their Crustal Distribution and Relationship to Other Gold Deposit Types: Ore Geology Review, Special Issue, Vol. 13, pp. 7–27.
Groves, D.I.,
Goldfarb, R.J., Robert, F., and Hart, C.J.R., 2003: Gold Deposits in Metamorphic Belts: Overview of Current Understanding, Outstanding
Problems, Future Research, and Exploration Significance: Economic Geology, Vol. 98, pp. 1–29.
Greybeck, J.D.,
and Wallace, A.B., 1991. Gold Mineralization at Fluorspar Canyon Near Beatty, Nye Country, Nevada. Geology of Ore Deposits of the Great
Basin. Symposium Proceedings. Geological Society of Nevada, Reno, Nevada. pp935-946.
Hoisch, T.D.,
Heizler, M.T., and Zartman, R.E., 1997. Timing of detachment faulting in the Bullfrog Hills and Bare Mountain area, southwest Nevada—Inferences
from 40Ar/39Ar, K-Ar, U-Pb, and fission track thermochronology: Journal of Geophysical Research, v. 102, p. 2815–2833.HydroCAD, 2015
Hynes-Griffin,
M.E. and Franklin, A.G., 1984. Rationalizing the Seismic Coefficient Method; United States Army Corp of Engineers, Waterways Experiment
Station, CWIS Work Unit 31145.
Jensen, Daniel
A., 2022A. Title Report Update, Reward Property, 119 Unpatented Mining Claims, Nye County, Nevada, Unpublished Title Report on behalf
of CR Reward LLC dated April 9, 2022, 6 Pages and Exhibits.
Jensen, Daniel
A., 2022B. Title Report Update, Reward Property, 2 Unpatented Mining Claims, Nye County, Nevada, Unpublished Title Report on behalf of
CR Reward LLC dated April 10, 2022, 9 Pages and Exhibits.
| Effective Date: May 31st, 2022 | | 157 |
| Technical Report - Mineral Resource Estimate Reward Project, Nye County, Nevada, USA |
Jensen, Daniel
A., 2022C. Title Report Update, Reward Property, 2 Unpatented Mining Claims, Nye County, Nevada, Unpublished Title Report on behalf of
CR Reward LLC dated April 11, 2022, 10 Pages and Exhibits.
Jensen, Daniel
A., 2022D. Title Report Update, Reward Property, 6 Patented Mining Claims, Nye County, Nevada, Unpublished Title Report on behalf of CR
Reward LLC dated April 12, 2022, 5 Pages and Exhibits.
Kautz, 2007.
Reward Mining Project Historic Context, Nye County, Nevada: 2.0 Prehistoric, Ethnohistoric, and Historic Contexts and Research Themes.
Report prepared by Kautz Environmental Consultants, Inc. (Kautz) for the CR Briggs Corporation.
Laney, Debbie
Column Leach Tests on Barrick Core Samples from Reward Property (Rayrock Mines, Inc. Memorandum, 1998).
Laney, Debbie
Column Leach Tests on Rayrock Trench Samples from Reward Property (Rayrock Mines, Inc. Memorandum, 1998).
Lycopodium Minerals
Canada, 2019: Reward Project feasibility study report; internal report prepared for CR Reward Limited Liability Company; dated September 6,
2019, p402.
Marinos, P. and
Hoek, E., 2002. GSI: A Geologically Friendly Tool for Rock Mass Strength Estimation.
Marr, J., 2006.
Geological Report and Proposal for Exploration Fluorspar Canyon. Sterling Gold Mining Corporation. Beatty, Nevada. Internal Report. p23.
McPartland, Jack
S., Report on Bottle Roll Cyanidation Tests – Reward Cuttings Composites (McClelland Laboratories, Inc. Job No. 3175,
2007).
McPartland, Jack
S., Report on Metallurgical Testing – Reward Drill Core Composites (McClelland Laboratories, Inc. Job No. 3206, 2008).
Monsen, S.A.,
Carr, M.D., Reheis, M.C. and Orkild, P.P., 1992. Geologic Map of Bare Mountain, Nye County, Nevada (1:24,000); U.S. Geological Survey,
Miscellaneous Investigations Series Map 1-2201.
Moritz, R., 2000:
What Have We Learnt About Orogenic Lode Gold Deposits Over the Past 20 Years?: article posted to University of Geneva, Switzerland, website,
7 p. accessed 8 February 2010, http://www.unige.ch/sciences/terre/mineral/publications/onlinepub/moritz_gold_brgm_2000.doc.
Natural Resources
Conservation Service (NRCS), 2004. Soil Survey of Nye County, Nevada, Southwest Part: Part 1. United States Department of Agriculture.
In cooperation with United States Department of Interior, Bureau of Land Management; and University of Nevada Agricultural Experiment
Station.
Nevada Bureau
of Mines and Geology, 1997. The Nevada Mineral Industry – 1997. Special Publication MI-1997.
| Effective Date: May 31st, 2022 | | 158 |
| Technical Report - Mineral Resource Estimate Reward Project, Nye County, Nevada, USA |
Nevada Bureau
of Mines and Geology, 1999. The Nevada Mineral Industry – 1999. Special Publication MI-1999.
Nevada Bureau
of Mines and Geology, 2001. The Nevada Mineral Industry – 2001. Special Publication MI-2001.
Noble, D.C.,
Weiss, S.I., and McKee, E.H., 1991, Magmatic and hydro- thermal activity, caldera geology, and regional extension in the western part
of the southwestern Nevada volcanic field, in Raines, G.L., Lisle, R.E., Schaefer, R.W., and Wilkinson, W.H., eds., Geology and ore deposits
of the Great Basin: Geological Society of Nevada, symposium proceedings, Reno, p. 913-934.
Papke
K.G., and Davis, D.A., 2019: Mining Claim Procedures for Nevada Prospectors and Miners: Nevada Bureau of Mines and Geology, Sixth Edition,
accessed via the internet, https://pubs.nbmg.unr.edu/Mining-claim-procedures-for-NV-p/sp006.htm
Rasmussen, J.C.
and Keith, S.B., 2015. Magma-Metal Series Classification of Mineralization in the Vicinity of Yucca Mountain, Nevada; n book: In
New concepts and discoveries, volume II; Geological Society of Nevada, Editors: W.M. Pennell, L.J. Garside, P. 1131-1152.
Sawyer, D.A.,
Fleck,R.J., Lanphere, M.A., Warren, R.G., Broxton, D.E. and Hudson, M.R., 1994. Episodic caldera volcanism in the Miocene southwestern
Nevada volcanic field: revised stratigraphic framework, 4OAd39Ar geochronology, and implications for magmatism and extension. Geological
Society of America Bulletin 106, 304-1318.
Sloan, Robert,
Mineralogical Assessment of Good Hope and Gold Ace Samples (ALS Metallurgy Report KM5696 2018).
Teal, L. and
Jackson, M., 1997. Geological overview of the Carlin trend gold deposits and descriptions of recent discoveries; Society of Economic Geologists
Newsletter, Number 31, October 1997, pp13-25.
Weiss, S.I.,
1996. Hydrothermal Activity, Epithermal Mineralization and Regional Extension in the Southwestern Nevada Volcanic Field, University of
Nevada, Reno, Nevada, unpublished Ph.D. dissertation, p212.
| Effective Date: May 31st, 2022 | | 159 |
| Technical Report - Mineral Resource Estimate Reward Project, Nye County, Nevada, USA |
This Technical Report titled
“Mineral Resource Estimate for the Reward Project, Nye County, Nevada, USA” is current as of the effective date of May 31,
2022 and was prepared and signed by Mr. Michael Dufresne of APEX Geoscience Ltd. and Mr. Tim Scott of Kappes, Cassiday &
Associates.
Date: December 18, 2022
Location: Edmonton, Alberta, Canada
and Reno, Nevada, USA
In relation to Sections:
1.1 to 1.8, 1.10 to 12 and 14 to 25.4, 25.6, 25.8 to 27 and co-responsible for 25.7
“Signed & Sealed”
__________________
Michael B. Dufresne, M.Sc., P. Geol., P. Geo.
President
APEX Geoscience Ltd.
EGBC Permit to Practice # 1003016
APEGA Permit to Practice # P005824
In relation to Sections:
1.9, 13, 25.5 and co-responsible for 25.7
“Signed & Sealed”
__________________
Timothy D. Scott, BA.Sc., RM SME
Senior Engineer and Project Manager
Kappes, Cassiday & Associates
| Effective Date: May 31st, 2022 | | 160 |
| Technical Report - Mineral Resource Estimate Reward Project, Nye County, Nevada, USA |
I, Michael Dufresne, M.Sc., P. Geol., P.Geo.,
do hereby certify that:
| 1. | I am President and a Principal of APEX Geoscience Ltd., Suite 100, 11450 – 160th
Street NW, Edmonton, AB, Canada, T5M 3Y7. |
| 2. | I graduated with a B.Sc. in Geology from the University of North Carolina at Wilmington in 1983 and with
a M.Sc. in Economic Geology from the University of Alberta in 1987. |
| 3. | I am and have been registered as a Professional Geologist with the Association of Professional Engineers
and Geoscientists (“APEGA”) of Alberta since 1989. I have been registered as a Professional Geologist with the association
of Professional Engineers and Geoscientists of BC since 2012. |
| 4. | I have worked as a geologist for more than 35 years since my graduation from University and have extensive
experience with exploration for, and the evaluation of, gold deposits of various types, including structurally-controlled, locally-disseminated,
sediment-hosted, quartz vein mineralization including mineral resource estimates. |
| 5. | I have read the definition of “Qualified Person” set out in
National Instrument 43-101 (“NI 43-101”) and certify that by reason of my education, affiliation with a professional
association (as defined in NI 43-101) and past relevant work experience, I fulfill the requirements to be a “Qualified Person”
for the purposes of NI 43-101. |
| 6. | I am responsible for sections 1.1 to 1.8, 1.10 to 12 and 14 to 25.4, 25.6, 25.8 to 27 and co-responsible
for 25.7 of the technical report titled “Mineral Resource Estimate for the Reward Project, Nye County, Nevada, USA”, with
an effective date of May 31st, 2022 (the “Technical Report”). I visited the Reward Project on August 2nd,
2017 and August 12th and 15th, 2019. |
| 7. | To the best of my knowledge, information and belief, the Technical Report contains all relevant scientific
and technical information that is required to be disclosed, to make the Technical Report not misleading. |
| 8. | I have read National Instrument 43-101 and Form 43-101F1, and the Technical Report has been prepared
in compliance with that instrument and form. |
| 9. | I am independent of the issuer, the vendor and the Property applying all of the tests in section 1.5 of
both NI 43-101 and 43-101CP. |
| 10. | I have had prior involvement with the Property as a QP and co-author of a Feasibility Study and Technical
Report on behalf of CR Reward in September 2019. |
| 11. | I consent to the filing of the Technical Report with any stock exchange and other regulatory authority
and any publication by them for regulatory purposes, including electronic publication in the public company files or their websites. |
Signing date: June 29th, 2022
Edmonton, Alberta, Canada
“Signed & Sealed”
___________________
Michael Dufresne, M.Sc., P. Geol., P.Geo.
| Effective Date: May 31st, 2022 | | 161 |
| Technical Report - Mineral Resource Estimate Reward Project, Nye County, Nevada, USA |
 |
Kappes, Cassiday & Associates |
Certificate of Qualified Person
I, Timothy D. Scott, of Las Vegas Nevada, USA
do hereby certify that as an author of "Mineral Resource Estimate for the Reward Project, Nye County, Nevada, USA" prepared
for CR Reward LLC. and Augusta Gold Corp., Effective Date 31 May 2022, and dated 29 June 2022 that:
| 1. | I am an independent consultant affiliated as an Associate with the firm of Kappes, Cassiday and Associates,
7950 Security Circle, Reno, Nevada, USA 89506 since 2006 and my personal address is 140 S. Buteo Woods Ln., Las Vegas, Nevada USA 89144. |
| | | |
| 2. | I graduated from Montana College of Mineral Science and Technology in 1987 with a Bachelor of Science
in Geological Engineering degree. |
| | | |
| 3. | I am a Registered Member in good standing of the Society of Mining, Metallurgy and Exploration (4153680RM).
I have practiced my profession continuously since 1987 in all aspects of mineral processing, metallurgy, and gold extraction; heap leaching;
and design and construction of mineral processing and metals extraction facilities. I am a "Qualified Person" for the purposes
of NI 43-101 by reason of my education, affiliation with a professional association as defined by NI-43-101 and past relevant work experience. |
| | | |
| 4. | I have practiced my profession continuously for 35 years. |
| | | |
| 5. | I am responsible for sections 1.9, 13.0, 25.5 and co responsible for section 25.7. |
| | | |
| 6. | I have read the definition of "Qualified Person" set out in National Instrument 43-101 (NI 43-101)
and certify that, by reason of my education, affiliation with a professional association (as defined in NI 43-101) and past relevant work
experience, I am a "qualified person" for the purpose of NI 43-101. |
| | | |
| 7. | I visited the site on 22 September 2018, and May 16, 2022. |
| | | |
| 8. | I am independent of the issuer in accordance with the application of Section 1.5 of National Instrument
43-101. |
| | | |
| 9. | I have been involved with previous studies regarding the Property since June, 2017. |
| | | |
| 10. | I have read National Instrument 43-101 and Form 43-101F1 and the Technical Report has been prepared
in compliance with same. |
| | | |
| 11. | At the effective date of the Technical Report, to the best of my knowledge, information and belief, the
Technical Report contains all scientific and technical information that is required to be disclosed to make the Technical Report not misleading. |
Dated at Reno, Nevada, USA this 29' day of June 2022.
"Signed & Sealed"
____________________
Timothy D. Scitt, SME (4153680RM)
| Effective Date: May 31st, 2022 | | 162 |
v3.23.4
Cover - USD ($)
|
12 Months Ended |
|
|
Dec. 31, 2022 |
Mar. 15, 2023 |
Jun. 30, 2022 |
| Cover [Abstract] |
|
|
|
| Document Type |
10-K/A
|
|
|
| Amendment Flag |
false
|
|
|
| Document Annual Report |
true
|
|
|
| Document Transition Report |
false
|
|
|
| Document Period End Date |
Dec. 31, 2022
|
|
|
| Document Fiscal Period Focus |
FY
|
|
|
| Document Fiscal Year Focus |
2022
|
|
|
| Current Fiscal Year End Date |
--12-31
|
|
|
| Entity File Number |
000-54653
|
|
|
| Entity Registrant Name |
AUGUSTA GOLD CORP.
|
|
|
| Entity Central Index Key |
0001448597
|
|
|
| Entity Tax Identification Number |
41-2252162
|
|
|
| Entity Incorporation, State or Country Code |
NV
|
|
|
| Entity Address, Address Line One |
Suite
555 – 999 Canada Place
|
|
|
| Entity Address, City or Town |
Vancouver
|
|
|
| Entity Address, State or Province |
BC
|
|
|
| Entity Address, Country |
CA
|
|
|
| Entity Address, Postal Zip Code |
V6C
3E1
|
|
|
| City Area Code |
604
|
|
|
| Local Phone Number |
687-1717
|
|
|
| Title of 12(b) Security |
Common
Stock, $0.0001 par value per share
|
|
|
| Entity Well-known Seasoned Issuer |
No
|
|
|
| Entity Voluntary Filers |
No
|
|
|
| Entity Current Reporting Status |
Yes
|
|
|
| Entity Interactive Data Current |
Yes
|
|
|
| Entity Filer Category |
Non-accelerated Filer
|
|
|
| Entity Small Business |
true
|
|
|
| Entity Emerging Growth Company |
false
|
|
|
| Entity Shell Company |
false
|
|
|
| Entity Public Float |
|
|
$ 37,573,924
|
| Entity Common Stock, Shares Outstanding |
|
85,929,753
|
|
| ICFR Auditor Attestation Flag |
false
|
|
|
| Auditor Firm ID |
731
|
|
|
| Auditor Name |
DAVIDSON & COMPANY LLP
|
|
|
| Auditor Location |
Vancouver, Canada
|
|
|
| X |
- DefinitionBoolean flag that is true when the XBRL content amends previously-filed or accepted submission.
| Name: |
dei_AmendmentFlag |
| Namespace Prefix: |
dei_ |
| Data Type: |
xbrli:booleanItemType |
| Balance Type: |
na |
| Period Type: |
duration |
|
| X |
- DefinitionPCAOB issued Audit Firm Identifier Reference 1: http://www.xbrl.org/2003/role/presentationRef
-Publisher SEC
-Name Form 10-K
-Number 249
-Section 310
Reference 2: http://www.xbrl.org/2003/role/presentationRef
-Publisher SEC
-Name Form 20-F
-Number 249
-Section 220
-Subsection f
Reference 3: http://www.xbrl.org/2003/role/presentationRef
-Publisher SEC
-Name Form 40-F
-Number 249
-Section 240
-Subsection f
| Name: |
dei_AuditorFirmId |
| Namespace Prefix: |
dei_ |
| Data Type: |
dei:nonemptySequenceNumberItemType |
| Balance Type: |
na |
| Period Type: |
duration |
|
| X |
- ReferencesReference 1: http://www.xbrl.org/2003/role/presentationRef
-Publisher SEC
-Name Form 10-K
-Number 249
-Section 310
Reference 2: http://www.xbrl.org/2003/role/presentationRef
-Publisher SEC
-Name Form 20-F
-Number 249
-Section 220
-Subsection f
Reference 3: http://www.xbrl.org/2003/role/presentationRef
-Publisher SEC
-Name Form 40-F
-Number 249
-Section 240
-Subsection f
| Name: |
dei_AuditorLocation |
| Namespace Prefix: |
dei_ |
| Data Type: |
dei:internationalNameItemType |
| Balance Type: |
na |
| Period Type: |
duration |
|
| X |
- ReferencesReference 1: http://www.xbrl.org/2003/role/presentationRef
-Publisher SEC
-Name Form 10-K
-Number 249
-Section 310
Reference 2: http://www.xbrl.org/2003/role/presentationRef
-Publisher SEC
-Name Form 20-F
-Number 249
-Section 220
-Subsection f
Reference 3: http://www.xbrl.org/2003/role/presentationRef
-Publisher SEC
-Name Form 40-F
-Number 249
-Section 240
-Subsection f
| Name: |
dei_AuditorName |
| Namespace Prefix: |
dei_ |
| Data Type: |
dei:internationalNameItemType |
| Balance Type: |
na |
| Period Type: |
duration |
|
| X |
- DefinitionEnd date of current fiscal year in the format --MM-DD.
| Name: |
dei_CurrentFiscalYearEndDate |
| Namespace Prefix: |
dei_ |
| Data Type: |
xbrli:gMonthDayItemType |
| Balance Type: |
na |
| Period Type: |
duration |
|
| X |
- DefinitionBoolean flag that is true only for a form used as an annual report. Reference 1: http://www.xbrl.org/2003/role/presentationRef
-Publisher SEC
-Name Form 10-K
-Number 249
-Section 310
Reference 2: http://www.xbrl.org/2003/role/presentationRef
-Publisher SEC
-Name Form 20-F
-Number 249
-Section 220
-Subsection f
Reference 3: http://www.xbrl.org/2003/role/presentationRef
-Publisher SEC
-Name Form 40-F
-Number 249
-Section 240
-Subsection f
| Name: |
dei_DocumentAnnualReport |
| Namespace Prefix: |
dei_ |
| Data Type: |
xbrli:booleanItemType |
| Balance Type: |
na |
| Period Type: |
duration |
|
| X |
- DefinitionFiscal period values are FY, Q1, Q2, and Q3. 1st, 2nd and 3rd quarter 10-Q or 10-QT statements have value Q1, Q2, and Q3 respectively, with 10-K, 10-KT or other fiscal year statements having FY.
| Name: |
dei_DocumentFiscalPeriodFocus |
| Namespace Prefix: |
dei_ |
| Data Type: |
dei:fiscalPeriodItemType |
| Balance Type: |
na |
| Period Type: |
duration |
|
| X |
- DefinitionThis is focus fiscal year of the document report in YYYY format. For a 2006 annual report, which may also provide financial information from prior periods, fiscal 2006 should be given as the fiscal year focus. Example: 2006.
| Name: |
dei_DocumentFiscalYearFocus |
| Namespace Prefix: |
dei_ |
| Data Type: |
xbrli:gYearItemType |
| Balance Type: |
na |
| Period Type: |
duration |
|
| X |
- DefinitionFor the EDGAR submission types of Form 8-K: the date of the report, the date of the earliest event reported; for the EDGAR submission types of Form N-1A: the filing date; for all other submission types: the end of the reporting or transition period. The format of the date is YYYY-MM-DD.
| Name: |
dei_DocumentPeriodEndDate |
| Namespace Prefix: |
dei_ |
| Data Type: |
xbrli:dateItemType |
| Balance Type: |
na |
| Period Type: |
duration |
|
| X |
- DefinitionBoolean flag that is true only for a form used as a transition report. Reference 1: http://www.xbrl.org/2003/role/presentationRef
-Publisher SEC
-Name Forms 10-K, 10-Q, 20-F
-Number 240
-Section 13
-Subsection a-1
| Name: |
dei_DocumentTransitionReport |
| Namespace Prefix: |
dei_ |
| Data Type: |
xbrli:booleanItemType |
| Balance Type: |
na |
| Period Type: |
duration |
|
| X |
- DefinitionThe type of document being provided (such as 10-K, 10-Q, 485BPOS, etc). The document type is limited to the same value as the supporting SEC submission type, or the word 'Other'.
| Name: |
dei_DocumentType |
| Namespace Prefix: |
dei_ |
| Data Type: |
dei:submissionTypeItemType |
| Balance Type: |
na |
| Period Type: |
duration |
|
| X |
- DefinitionAddress Line 1 such as Attn, Building Name, Street Name
| Name: |
dei_EntityAddressAddressLine1 |
| Namespace Prefix: |
dei_ |
| Data Type: |
xbrli:normalizedStringItemType |
| Balance Type: |
na |
| Period Type: |
duration |
|
| X |
- Definition
+ References
+ Details
| Name: |
dei_EntityAddressCityOrTown |
| Namespace Prefix: |
dei_ |
| Data Type: |
xbrli:normalizedStringItemType |
| Balance Type: |
na |
| Period Type: |
duration |
|
| X |
- DefinitionISO 3166-1 alpha-2 country code.
| Name: |
dei_EntityAddressCountry |
| Namespace Prefix: |
dei_ |
| Data Type: |
dei:countryCodeItemType |
| Balance Type: |
na |
| Period Type: |
duration |
|
| X |
- DefinitionCode for the postal or zip code
| Name: |
dei_EntityAddressPostalZipCode |
| Namespace Prefix: |
dei_ |
| Data Type: |
xbrli:normalizedStringItemType |
| Balance Type: |
na |
| Period Type: |
duration |
|
| X |
- DefinitionName of the state or province.
| Name: |
dei_EntityAddressStateOrProvince |
| Namespace Prefix: |
dei_ |
| Data Type: |
dei:stateOrProvinceItemType |
| Balance Type: |
na |
| Period Type: |
duration |
|
| X |
- DefinitionA unique 10-digit SEC-issued value to identify entities that have filed disclosures with the SEC. It is commonly abbreviated as CIK. Reference 1: http://www.xbrl.org/2003/role/presentationRef
-Publisher SEC
-Name Exchange Act
-Number 240
-Section 12
-Subsection b-2
| Name: |
dei_EntityCentralIndexKey |
| Namespace Prefix: |
dei_ |
| Data Type: |
dei:centralIndexKeyItemType |
| Balance Type: |
na |
| Period Type: |
duration |
|
| X |
- DefinitionIndicate number of shares or other units outstanding of each of registrant's classes of capital or common stock or other ownership interests, if and as stated on cover of related periodic report. Where multiple classes or units exist define each class/interest by adding class of stock items such as Common Class A [Member], Common Class B [Member] or Partnership Interest [Member] onto the Instrument [Domain] of the Entity Listings, Instrument.
| Name: |
dei_EntityCommonStockSharesOutstanding |
| Namespace Prefix: |
dei_ |
| Data Type: |
xbrli:sharesItemType |
| Balance Type: |
na |
| Period Type: |
instant |
|
| X |
- DefinitionIndicate 'Yes' or 'No' whether registrants (1) have filed all reports required to be filed by Section 13 or 15(d) of the Securities Exchange Act of 1934 during the preceding 12 months (or for such shorter period that registrants were required to file such reports), and (2) have been subject to such filing requirements for the past 90 days. This information should be based on the registrant's current or most recent filing containing the related disclosure.
| Name: |
dei_EntityCurrentReportingStatus |
| Namespace Prefix: |
dei_ |
| Data Type: |
dei:yesNoItemType |
| Balance Type: |
na |
| Period Type: |
duration |
|
| X |
- DefinitionIndicate if registrant meets the emerging growth company criteria. Reference 1: http://www.xbrl.org/2003/role/presentationRef
-Publisher SEC
-Name Exchange Act
-Number 240
-Section 12
-Subsection b-2
| Name: |
dei_EntityEmergingGrowthCompany |
| Namespace Prefix: |
dei_ |
| Data Type: |
xbrli:booleanItemType |
| Balance Type: |
na |
| Period Type: |
duration |
|
| X |
- DefinitionCommission file number. The field allows up to 17 characters. The prefix may contain 1-3 digits, the sequence number may contain 1-8 digits, the optional suffix may contain 1-4 characters, and the fields are separated with a hyphen.
| Name: |
dei_EntityFileNumber |
| Namespace Prefix: |
dei_ |
| Data Type: |
dei:fileNumberItemType |
| Balance Type: |
na |
| Period Type: |
duration |
|
| X |
- DefinitionIndicate whether the registrant is one of the following: Large Accelerated Filer, Accelerated Filer, Non-accelerated Filer. Definitions of these categories are stated in Rule 12b-2 of the Exchange Act. This information should be based on the registrant's current or most recent filing containing the related disclosure. Reference 1: http://www.xbrl.org/2003/role/presentationRef
-Publisher SEC
-Name Exchange Act
-Number 240
-Section 12
-Subsection b-2
| Name: |
dei_EntityFilerCategory |
| Namespace Prefix: |
dei_ |
| Data Type: |
dei:filerCategoryItemType |
| Balance Type: |
na |
| Period Type: |
duration |
|
| X |
- DefinitionTwo-character EDGAR code representing the state or country of incorporation.
| Name: |
dei_EntityIncorporationStateCountryCode |
| Namespace Prefix: |
dei_ |
| Data Type: |
dei:edgarStateCountryItemType |
| Balance Type: |
na |
| Period Type: |
duration |
|
| X |
- DefinitionBoolean flag that is true when the registrant has submitted electronically every Interactive Data File required to be submitted pursuant to Rule 405 of Regulation S-T during the preceding 12 months (or for such shorter period that the registrant was required to submit such files). Reference 1: http://www.xbrl.org/2003/role/presentationRef
-Publisher SEC
-Name Regulation S-T
-Number 232
-Section 405
| Name: |
dei_EntityInteractiveDataCurrent |
| Namespace Prefix: |
dei_ |
| Data Type: |
dei:yesNoItemType |
| Balance Type: |
na |
| Period Type: |
duration |
|
| X |
- DefinitionThe aggregate market value of the voting and non-voting common equity held by non-affiliates computed by reference to the price at which the common equity was last sold, or the average bid and asked price of such common equity, as of the last business day of the registrant's most recently completed second fiscal quarter.
| Name: |
dei_EntityPublicFloat |
| Namespace Prefix: |
dei_ |
| Data Type: |
xbrli:monetaryItemType |
| Balance Type: |
credit |
| Period Type: |
instant |
|
| X |
- DefinitionThe exact name of the entity filing the report as specified in its charter, which is required by forms filed with the SEC. Reference 1: http://www.xbrl.org/2003/role/presentationRef
-Publisher SEC
-Name Exchange Act
-Number 240
-Section 12
-Subsection b-2
| Name: |
dei_EntityRegistrantName |
| Namespace Prefix: |
dei_ |
| Data Type: |
xbrli:normalizedStringItemType |
| Balance Type: |
na |
| Period Type: |
duration |
|
| X |
- DefinitionBoolean flag that is true when the registrant is a shell company as defined in Rule 12b-2 of the Exchange Act. Reference 1: http://www.xbrl.org/2003/role/presentationRef
-Publisher SEC
-Name Exchange Act
-Number 240
-Section 12
-Subsection b-2
| Name: |
dei_EntityShellCompany |
| Namespace Prefix: |
dei_ |
| Data Type: |
xbrli:booleanItemType |
| Balance Type: |
na |
| Period Type: |
duration |
|
| X |
- DefinitionIndicates that the company is a Smaller Reporting Company (SRC). Reference 1: http://www.xbrl.org/2003/role/presentationRef
-Publisher SEC
-Name Exchange Act
-Number 240
-Section 12
-Subsection b-2
| Name: |
dei_EntitySmallBusiness |
| Namespace Prefix: |
dei_ |
| Data Type: |
xbrli:booleanItemType |
| Balance Type: |
na |
| Period Type: |
duration |
|
| X |
- DefinitionThe Tax Identification Number (TIN), also known as an Employer Identification Number (EIN), is a unique 9-digit value assigned by the IRS. Reference 1: http://www.xbrl.org/2003/role/presentationRef
-Publisher SEC
-Name Exchange Act
-Number 240
-Section 12
-Subsection b-2
| Name: |
dei_EntityTaxIdentificationNumber |
| Namespace Prefix: |
dei_ |
| Data Type: |
dei:employerIdItemType |
| Balance Type: |
na |
| Period Type: |
duration |
|
| X |
- DefinitionIndicate 'Yes' or 'No' if the registrant is not required to file reports pursuant to Section 13 or Section 15(d) of the Act.
| Name: |
dei_EntityVoluntaryFilers |
| Namespace Prefix: |
dei_ |
| Data Type: |
dei:yesNoItemType |
| Balance Type: |
na |
| Period Type: |
duration |
|
| X |
- DefinitionIndicate 'Yes' or 'No' if the registrant is a well-known seasoned issuer, as defined in Rule 405 of the Securities Act. Is used on Form Type: 10-K, 10-Q, 8-K, 20-F, 6-K, 10-K/A, 10-Q/A, 20-F/A, 6-K/A, N-CSR, N-Q, N-1A. Reference 1: http://www.xbrl.org/2003/role/presentationRef
-Publisher SEC
-Name Securities Act
-Number 230
-Section 405
| Name: |
dei_EntityWellKnownSeasonedIssuer |
| Namespace Prefix: |
dei_ |
| Data Type: |
dei:yesNoItemType |
| Balance Type: |
na |
| Period Type: |
duration |
|
| X |
- ReferencesReference 1: http://www.xbrl.org/2003/role/presentationRef
-Publisher SEC
-Name Form 10-K
-Number 249
-Section 310
Reference 2: http://www.xbrl.org/2003/role/presentationRef
-Publisher SEC
-Name Form 20-F
-Number 249
-Section 220
-Subsection f
Reference 3: http://www.xbrl.org/2003/role/presentationRef
-Publisher SEC
-Name Form 40-F
-Number 249
-Section 240
-Subsection f
| Name: |
dei_IcfrAuditorAttestationFlag |
| Namespace Prefix: |
dei_ |
| Data Type: |
xbrli:booleanItemType |
| Balance Type: |
na |
| Period Type: |
duration |
|
| X |
- DefinitionLocal phone number for entity.
| Name: |
dei_LocalPhoneNumber |
| Namespace Prefix: |
dei_ |
| Data Type: |
xbrli:normalizedStringItemType |
| Balance Type: |
na |
| Period Type: |
duration |
|
| X |
- DefinitionTitle of a 12(b) registered security. Reference 1: http://www.xbrl.org/2003/role/presentationRef
-Publisher SEC
-Name Exchange Act
-Number 240
-Section 12
-Subsection b
| Name: |
dei_Security12bTitle |
| Namespace Prefix: |
dei_ |
| Data Type: |
dei:securityTitleItemType |
| Balance Type: |
na |
| Period Type: |
duration |
|
Augusta Gold (QB) (USOTC:AUGG)
Historical Stock Chart
From Mar 2024 to Apr 2024
 Charts.")
Augusta Gold (QB) (USOTC:AUGG)
Historical Stock Chart
From Apr 2023 to Apr 2024
 Charts.")