UNITED STATES
SECURITIES AND EXCHANGE COMMISSION
Washington, D.C. 20549
FORM 10-K
☒ ANNUAL REPORT UNDER SECTION 13 OR 15(D) OF THE SECURITIES EXCHANGE ACT OF 1934
FOR FISCAL YEAR ENDED: August 31, 2023
OR
☐ TRANSITION REPORT UNDER SECTION 13 OR 15(D) OF THE SECURITIES EXCHANGE ACT OF 1934
For the transition period from to
Commission file number: 000-52838
DBMM GROUP
DIGITAL BRAND MEDIA & MARKETING GROUP, INC.
WWW.DBMMGROUP.COM
(Name of small business issuer in its charter)
| Florida | 59-3666743 |
| (State or other jurisdiction of incorporation or organization) | (IRS Employer Identification No.) |
845 Third Avenue, 6th Floor, New York, NY 10022
(Address of principal executive offices)
(646) 722-2706
(Issuer’s telephone number)
Securities registered pursuant to Section 12(b) of the Act:
| Title of each class | Trading Symbol(s) | Name of each exchange on which registered |
| Common Stock, $0.001 par value | DBMM | OTC Markets |
Indicate by check mark if the Registrant is a well-known seasoned issuer, as defined in Rule 405 of the Securities Act. Yes ☐ No ☒
Indicate by check mark if the Registrant is not required to file reports pursuant to Section 13 or 15(d) of the Act. Yes ☐ No ☒
Indicate by check mark whether the Registrant (1) has filed all reports required to be filed by Section 13 or 15(d) of the Securities Exchange Act of 1934 during the preceding 12 months (or for such shorter period that the registrant was required to file such reports), and (2) has been subject to such filing requirements for the past 90 days. Yes ☒ No ☐
Indicate by check mark if disclosure of delinquent filers pursuant to Item 405 of Regulation S-K (§229.405 of this chapter) is not contained herein, and will not be contained, to the best of the Registrant’s knowledge, in definitive proxy or information statements incorporated by reference in Part III of this Form 10-K or any amendment to this Form 10-K. ☐
Indicate by check mark whether the registrant has submitted electronically every Interactive Data File required to be submitted pursuant to Rule 405 of Regulation S-T (§232.405 of this chapter) during the preceding 12 months (or for such shorter period that the registrant was required to submit such files). Yes ☒ No ☐
Indicate by check mark whether the Registrant is a large accelerated filer, an accelerated filer, a non-accelerated filer or a smaller reporting company. See definitions of “large accelerated filer,” “accelerated filer,” “smaller reporting company” and “emerging growth company” in Rule 12b-2 of the Exchange Act.
| Large accelerated filer | ☐ | | Accelerated filer | ☐ |
| Non-accelerated filer | ☐ | | Smaller reporting company | ☒ |
| Emerging growth company | ☐ | | | |
If an emerging growth company, indicate by check mark if the registrant has elected not to use the extended transition period for complying with any new or revised financial accounting standards provided pursuant to Section 13(a) of the Exchange Act. ☐
Indicate by check mark whether the registrant has filed a report on and attestation to its management’s assessment of the effectiveness of its internal control over financial reporting under Section 404(b) of the Sarbanes-Oxley Act (15 U.S.C. 7262(b)) by the registered public accounting firm that prepared or issued its audit report. ☐
If securities are registered pursuant to Section 12(b) of the Act, indicate by check mark whether the financial statements of the registrant included in the filing reflect the correction of an error to previously issued financial statements. ☐
Indicate by check mark whether any of those error corrections are restatements that required a recovery analysis of incentive-based compensation received by any of the registrant’s executive officers during the relevant recovery period pursuant to §240.10D-1(b). ☐
Indicate by check mark whether the Registrant is a shell company (as defined in Rule 12b-2 of the Exchange Act). Yes ☐ No ☒
State the aggregate market value of the voting and non-voting common equity held by non-affiliates computed by reference to the price at which the common equity was sold, or the average bid and asked prices of such common equity, as of the last business day of the registrants most recently completed fiscal quarter: on August 31, 2023: $4,126,093
State the number of shares outstanding of each of the issuer’s classes of common equity, as of the latest practicable date:
Common Stock, par value $.001 per share: 825,218,631 Outstanding as of November 29, 2023
DOCUMENTS INCORPORATED BY REFERENCE
If the following documents are incorporated by reference, briefly describe them and identify the part of the Form 10-K (e.g., Part I, Part II, etc.) into which the document is incorporated: (i) any annual report to security holders; (ii) any proxy or information statement; and (iii) any prospectus filed pursuant to Rule 424(b) or (c) of the Securities Act of 1933 (the “Securities Act”). The listed documents should be clearly described for identification purposes (e.g. annual reports to security holders for fiscal year ended December 24, 1980).
None
Transitional Small Business Disclosure Format (Check one): Yes ☐ No ☒
PART I
SPECIAL NOTE REGARDING FORWARD-LOOKING STATEMENTS
This Annual Report contains forward-looking statements. These forward-looking statements are based largely on our expectations and are subject to a number of risks and uncertainties, many of which are beyond our control. Actual results could differ materially from these forward-looking statements as a result of, among other factors, risks related to the large amount of our outstanding term loans; history of net losses and accumulated deficits; reliance on third parties to market, sell and distribute our products; future capital requirements; competition and technical advances; reliance on a small number of customers for a significant percentage of our revenues; and other risks. In light of these risks and uncertainties, there can be no assurance that the forward-looking information contained in this Annual Report will in fact occur.
ITEM 1. DESCRIPTION OF BUSINESS
ABOUT OUR BRAND DIGITAL CLARITY
Digital Clarity is the trading brand for Stylar Limited, a wholly owned subsidiary of Digital Brand Media & Marketing Group, Inc (DBMM), through its office in London, England. Digital Clarity is a leading provider of marketing consulting and advisory solutions, empowering businesses to achieve their marketing goals through strategic insights, innovative use of technologies, AI, and exceptional customer service. With a strong track record of success and a commitment to delivering tangible results, Digital Clarity is at the forefront of driving marketing change, driving growth, and creating lasting value for its clients.
DBMM Group can leverage its team’s experience in digital media and provide leading strategy, deployment and measurement to its core markets in many industry sectors, from creative to traditional corporate. The vertical B2B sectors encompass areas such as B2B eCommerce, SaaS, Blockchain, Fintech, Software Sales and Technology.
The Company continues to develop and roll out marketing consulting services offerings from its operating base in the UK with a plan to increase its presence into the larger markets in the US. namely Los Angeles and New York. The intent has always been a a strategy of a cash infusion to immediately correlate to build back demand and increase revenues. Growth has always been a function of available capital. Fiscal year 2023 following the challenges of Brexit, a Global Pandemic, and external factors beyond the Company’s control, the SEC Matter awaiting the Commission’s final affirmation of the dismissal, which occurred June 2, 2023. Digital Clarity is a leading provider of marketing consulting and advisory solutions, empowering businesses to achieve their marketing goals through strategic insights, innovative use of technologies, AI, and exceptional customer service. With a strong track record of success and a commitment to delivering tangible results, Digital Clarity is at the forefront of driving marketing change, driving growth, and creating lasting value for its clients.
EMPLOYEES
As of August 31, 2023, the Company had 8 full-time employees.
COMPETITION
There is strong competition in the digital marketing arena, though with the right level of investment and marketing, Digital Clarity has a confident outlook in using its experience to win new business in both local and international markets. DBMM has significant business relationships in place because it has a differentiating model.
ITEM 1A. RISK FACTORS
Smaller reporting companies are not required to provide the information required by this item.
ITEM 1B. UNRESOLVED STAFF COMMENTS
None.
ITEM 2. DESCRIPTION OF PROPERTY
DBMM's Corporate address is 845 Third Avenue, 6th Floor, New York, NY 10022. The operating headquarters is located in the UK as Stylar Ltd., trading as Digital Clarity. is on a month-to-month lease as it is evaluating larger quarters post-pandemic.
ITEM 3. LEGAL PROCEEDINGS
The U.S. Securities & Exchange Commission instituted an Administrative Proceeding, File No. 3-17990, on May 16, 2017 to revoke the Company's registration statement because of delinquent filings. A hearing was held on August 9, 2017 and the Initial Decision to revoke the registration was dated November 16, 2017. The order was subsequently remanded by order of the U.S. Supreme Court in December 2017. The Company responded to the Remand with evidence of mitigating circumstances under a Protective Order and filed all its delinquent filings: a Super 10-K for 2015-2016-2017 on May 31, 2018 and 10-Q's for 2018 1Q, 2Q on June 22, 2018 and 3Q on July 15, 2018, its due date.
The Hearing for January 15, 2019 was re-scheduled because of government shutdown. Digital Brand entered a Motion to Dismiss the Proceedings on March 19, 2019 based on being current as of July 2018, and all filings to date have been filed on time for the 2019 fiscal year. The facts were presented at the hearing. The Division did not support the dismissal in a response to which Digital Brand filed two Amendments to the Consolidated 10-K for 2015- 2016-2017 and the 10-K for 2018 on April 23 and 24, 2019 respectively, and Amendments No. 2 on October 1, 2019 to supersede language in Part II, Item 9A. On November 12, 2019, Carol Fox Foelak, Administrative Law Judge, Securities & Exchange Commission ordered an Initial Decision/Dismissal of the Proceeding. The Dismissal would have become effective under Rule 360 of the Commission's Rules of Practice, 17 C.F.R., Section 201.360, following the Commission’s Order of Finality. Unfortunately, on December 3, 2019 The Division of Enforcement Submitted a Petition for Review of Judge Carol Fox Foelak’s Initial Decision dismissing the Administrative Proceedings rendered on November 12, 2019. The Company filed a Motion for summary affirmance of the Initial Decision on December 20, 2019. The Motion for Summary Affirmance was not opposed by Enforcement, nevertheless the Petition for Review (“PFR”) was filed earlier.
On January 25, 2021, the Commission denied the Company’s Motion for Summary Affirmance of Judge Carol Fox-Foelak’s Dismissal of November 12, 2019 and granted the Division’s Petition for Review and set a briefing schedule beginning February 24, 2021. The Commission concluded that “briefing in the ordinary course would...assist the Commission. This appeal raises issues as to which we have an interest in articulating our views and important matters of public interest, including the proper application of the standard that governs determination of sanctions in a Section 12(j) proceeding.” Both parties have briefed and concluded April, 2021. The Company is disappointed that so much time has been lost and continues to vociferously support the original Dismissal three years ago.
The Commission notified the Company on December 9, 2021 that an extension of 90 days to issue a decision has been ordered. A sixth extension was ordered for an additional 90 days to conclude by June 5, 2023.
On June 2, 2023, the SEC issued an Order Dismissing Proceedings under Release 4413 advising us that that their pending administrative proceedings against us because of delinquent filings had been dismissed. A final Order of Dismissal closes the matter after previous unnecessary protracted delays.
Shareholders have been significantly damaged by the protracted SEC matter. The delays were further exacerbated by the unnecessary PFR requested by the Division of Enforcement while the Company continued to meet its reporting compliance since 2018 in good faith as committed to the court and contained in its cured SEC filings and thereafter.
From time to time, the Company has become or may become involved in certain lawsuits and legal proceedings which arise in the ordinary course of business. The Company intends to vigorously defend its positions. However, litigation is subject to inherent uncertainties and an adverse result in those or other matters may arise from time to time that may harm its financial position, or our business and the outcome of these matters cannot be ultimately predicted.
ITEM 4. MINE SAFETY DISCLOSURES
N/A
PART II
ITEM 5. MARKET FOR COMMON EQUITY, RELATED STOCKHOLDER MATTERS AND ISSUER PURCHASES OF EQUITY SECURITIES
MARKET INFORMATION
Our common stock is currently listed for quotation on the OTC under the symbol “DBMM”.
PER SHARE MARKET PRICE DATA
The following table sets forth, for the fiscal quarters indicated, the high and low closing bid prices per share for our common stock, as reported by on PinkSheets.com. Such quotations reflect inter-dealer prices, without retail markup, markdown or commission and may not represent actual transactions.
|
Year Ended August 31, 2023:
|
|
High
|
|
|
Low
|
|
|
First Quarter
|
|
$ |
0.0285 |
|
|
$ |
0.0005 |
|
|
Second Quarter
|
|
$ |
0.0394 |
|
|
$ |
0.0088 |
|
|
Third Quarter
|
|
$ |
0.015 |
|
|
$ |
0.0032 |
|
|
Fourth Quarter
|
|
$ |
0.0188 |
|
|
$ |
0.0087 |
|
| |
|
|
|
|
|
|
|
|
|
Year Ended August 31, 2022:
|
|
High
|
|
|
Low
|
|
|
First Quarter
|
|
$ |
0.01 |
|
|
$ |
0.002 |
|
|
Second Quarter
|
|
$ |
0.0074 |
|
|
$ |
0.0056 |
|
|
Third Quarter
|
|
$ |
0.0041 |
|
|
$ |
0.0005 |
|
|
Fourth Quarter
|
|
$ |
0.0015 |
|
|
$ |
0.0004 |
|
The last reported sale price of the common stock on the OTC Electronic Bulletin Board on August 31, 2023 and 2022 were $0.0054 and $0.0005 per share, respectively. As of August 31, 2023, and 2022, there were 121 and 119 holders of record of our common stock, respectively.
On October 26, 2022, FINRA processed a Form 211 relating to the initiation of priced quotations of our shares of common stock, which means that the submitting broker-dealer has demonstrated to FINRA compliance with FINRA Rule 6432 and therefore has met the requirements under that rule to initiate a quotation for our shares of common stock within four days of October 26, 2022. FINRA’s processing of a Form 211 in no way constitutes FINRA’s approval of the security, the issuer, or the issuer’s business and relates solely to the submitting broker-dealer’s obligation to comply with FINRA Rule 6432 and SEA Rule 15c2-11 when quoting a security. (FINRA TO Glendale Securities)
Glendale Securities, Inc. is the designated Market Maker.
DIVIDENDS
We have never declared any cash dividends with respect to our common stock. Future payment of dividends is within the discretion of our board of directors and will depend on our earnings, capital requirements, financial condition and other relevant factors. Although there are no material restrictions limiting, or that are likely to limit our ability to pay dividends on our common stock, we presently intend to retain future earnings, if any, for use in our business and have no present intention to pay cash dividends on our common stock.
ITEM 6. SELECTED FINANCIAL DATA
As a “smaller reporting company”, as defined by Rule 10(f)(1) of Regulation S-K, the Company is not required to provide this information.
ITEM 7. MANAGEMENT’S DISCUSSION AND ANALYSIS OF FINANCIAL CONDITION AND RESULTS OF OPERATIONS
Certain statements contained herein are forward-looking statements and should be read in conjunction with our disclosures under the heading "Forward-Looking Statements" above. These statements are based on current expectations and assumptions that are subject to risks and uncertainties. This discussion also should be read in conjunction with the notes to our consolidated financial statements contained in Item 8. "Financial Statements and Supplementary Data" of this Report.
The Company developed a document called the Creds Deck which provides a description to prospective clients of Digital Clarity’s value proposition http://www.dbmmgroup.com/wp-content/uploads/2023/07/DBMM_Creds_Deck_2023.pdf
The fiscal year 2023 has focused on a measured return to normalcy as businesses have faced enormous challenges over the past few years, and DBMM's operating business Digital Clarity, is no exception. However, for context, it is worth reminding investors and shareholders, that Digital Clarity was acquired by DBMM as a cash-flow positive business with a great reputation and industry network, winning industry awards.
As stated in the MD&A's for many years since the acquisition of Digital Clarity, the operating business has always been cash flow positive, but the costs of maintaining a public company far exceed the gross profit in the audited financial statements. That was expected, following the digital business model, though many digital companies do not have any operating revenues while they build the business. The business is developed to a 'to be determined level' (TBD), with all capital infusion riveand revenues (if any) remaining in the growth model.
As the economy recovers, and the Company's mitigating circumstances have all been positively concluded, there is also an opportunity for their clients, both new and prospective, to gain a competitive advantage in the post-pandemic commercial environment. The transformation of a company guided by Digital Clarity as its digital architect, demands a "seat at the table" of decision makers as the subject matter expert in the new digital landscape. Digital Clarity has earned that role. The industry as seen today and in the future is described below:
2023 REALITIES TEMPER 2024 BUDGETS AND OUTLOOK
One year ago, leaders were facing global unrest, supply chain instability, soaring inflation, the long shadow of the pandemic, and a projected economic slowdown. Yet most had overly optimistic expectations heading into budget season, with every function expecting to lock in modest budget increases for 2023.
Many of last year’s concerns didn’t materialize, and the outlook for the global economy in 2024 appears brighter as supply chain disruptions ease and inflation edges back toward targets. That said, businesses will have to deal with the after-effects of not only the global pandemic but new challenges. The backdrop as we enter 2024, it is clear that B2B leaders have concerns about inflation and higher interest rates, as they plan for 2024.
Though the general business sentiment is cautious, Digital Clarity has adapted its model to continually seek to focus on areas that will allow the business to thrive as we come out of the challenging economic backdrop.
Digital Clarity has been pivoting during these challenging headwinds and working to build upon its experience in the B2B space and engaging with prospects in the SaaS and Tech market.
Discretionary marketing budgets, sales headcount, and software costs will continue to be scrutinized closely in 2024, though the demand for maximum performance continues, even though inflation abates particularly in the US. This will only accelerate revenue-focused marketing leadership and reduce the money invested in non-hyper-targeted channels.
Expansion will become the new-new business, making the line between revenue marketing and demand generation very thin. More of an emphasis will be on preserving revenue through retention and expansion efforts over acquiring net new customers, this is an area where Digital Clarity excels.
This will also push leaders to critically evaluate the way in which they acquire customers, including increasing their focus on the technology that helps them prioritize the right accounts. B2B companies beware, It may feel like you have fewer “in-market” accounts than in prior years, so the risk of wasting resources on accounts that won’t buy is much higher. To avoid this, double down on the ‘95-5’ rule, there will be a shift. to get in front of the 5% of in-market accounts that are ready to buy now. If not, it's inevitable that your competitors will swipe them up first.
WHY B2B IS THE RIGHT PLACE AT THE RIGHT TIME
Just before and during the pandemic, DBMM’s operating business, Digital Clarity analyzed market data as found that there was a large market segment that was very badly served by the Digital marketing sector and in particular lacked a level of planning, strategy and general, good advice when it came to sales growth and brand positioning. This was the Business to Business (B2B) sector. In particular, the technology, software and software services sector (SaaS). This pivot was to prove pivotal to Digital Clarity’s return to a level of normal trading against a continued volatile economic backdrop.
B2B is undergoing a renaissance as business models, innovation drivers, and buyers evolve dramatically from decades prior. Now some of the most profitable companies across the globe are B2B companies.
As perceptions of the U.S. economy decline, concerns over inflation persist. More than half of small business owners continue to cite it as their top concern. However, B2B leaders are hopeful about the future, even in these uncertain times.
And while many in the business community cite serious concerns over economic turmoil and rising global uncertainty, B2B leaders are largely optimistic about the fate of their organizations and the role of marketing in helping them grow.
The B2B Marketing Benchmark uncovers the trends and practices fueling this optimism: Marketing budgets on the rise worldwide; Excitement among B2B leaders about emerging technologies like Generative AI;
Growth in the adoption of creative and technical skills that will help marketers meet the demands of these emerging technologies and trends.
Digital Clarity is well poised to enable B2B leaders to thrive in a rapidly changing environment and how to plan for the long term.
THE B2B BUYER JOURNEY IS COMPLEX. THIS IS WHY EXPERTS LIKE DIGITAL CLARITY NEED TO BE INVOLVED FROM THE START.
Savvy communication experts like Digital Clarity produce ideas that shape perceptions and grow markets. There has never been a better time to navigate into the B2B Marketplace as demand for an experienced, safe pair of hands is required. This sector is growing rapidly and the demand for expertise and skill to help businesses in marketing their services and products is sought after. B2B digital ad spending is projected to reach $18.47 billion by 2024, it will account for nearly 50% of total B2B ad spending that year according to Insider Intelligence.
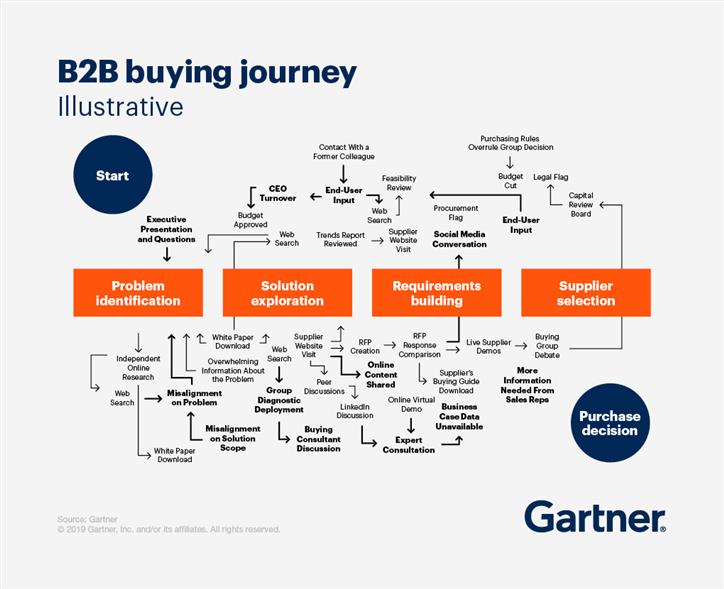
For a long time, tried and tested B2B marketing strategies have been based around a linear model, where activities aim to gather prospects at one end of a pipeline (or funnel) and gently nudge and nurture until they leave as newly won customers at the other end.
It’s been this way for quite a while. It’s given rise to language that any B2B marketer is familiar with such as “MQLs” (marketing qualified leads) and “SQLs” (sales qualified leads), it’s shaped how B2B marketing and sales should work together (where one hands the baton on to the other in the form of a well nurtured, warm lead) and KPIs that evaluate this linear performance (pipeline velocity, #MQLs and #SQLs, to name just three).
So established is the thinking that the world’s biggest CRM platforms are structured around this linear model of how B2B buying takes place.
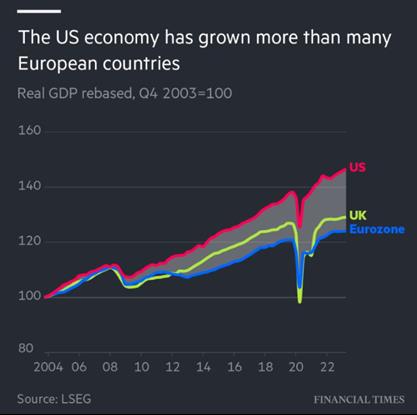
DEVELOPING A STRONGER US FOOTPRINT FOR DIGITAL CLARITY IN 2024-2035
The IMF last week became the latest economics organization to declare that the US economy would power ahead, forecasting an expansion of 1.5 percent next year. This compares with IMF forecasts of 1.2 percent for the eurozone and 0.6 percent for the UK.
A critical structural factor behind the US-European divergence is the difference in the industrial composition of the two economies.
2023 saw Digital Clarity have a stronger demand by prospective customers in the burgeoning B2B Tech sector and with this laser focus in the tech marketing market, Digital Clarity is well positioned to take advantage of applying it’s successful methodology ito the largest economy in the world.
The US has a booming tech sector, with successful and innovative companies such as Amazon, Alphabet, and Microsoft that have no European equivalents in Europe. With the US dominating artificial intelligence, that gap is likely to widen, economists warn.
By contrast, Europe specializes in industries that are increasingly facing the threat of Chinese competition, such as electric vehicles.
With stronger investment and better demographics, the gap between the US and Europe is likely to widen further in the coming years.
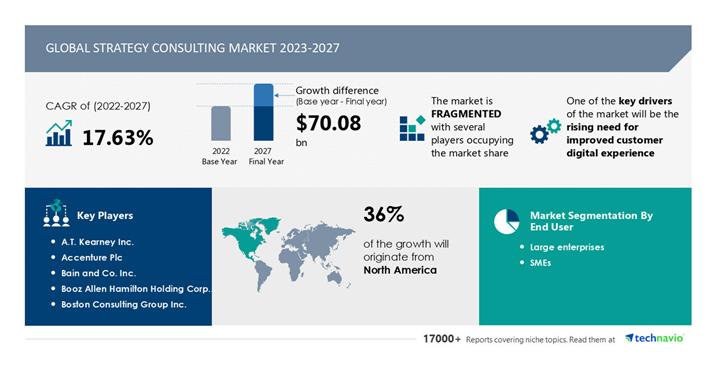
DEMAND FOR MARKETING CONSULTING IN NORTH AMERICA IS PREDICTED TO GROW BY 36%
The marketing consulting services segment is forecast to increase by USD 41.56 billion between now and 2027 with North America estimated to contribute 36% to the growth. Data from research company Technavio’s analysts have elaborately explained the regional trends, drivers, and challenges that are expected to shape the market during the forecast period. With the development of new research companies and the availability of various databases and business analytics tools, this North American region is a major contributor to the global marketing consulting market. This allows businesses to collect meaningful, useful data at a fraction of the cost that marketing consultants pay.
Additionally, the ease of scaling virtualization and automating administrative tasks dynamically will increase SaaS adoption. Due to digitalization, various businesses and organizations in this region are adopting SaaS solutions, which help improve a range of operations such as business planning, order fulfilment, and customer service. Hence, such factors are expected to drive market growth in this region during the forecast period.
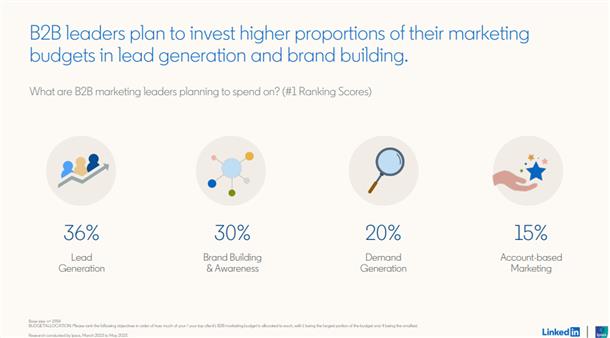
B2B BRAND INVESTMENT IS THE BIG FOCUS FOR 2024 AND BEYOND
THE SHIFT TO DIGITAL IS PERMANENT
Despite slower growth, digital will continue to command a greater overall share as more B2B marketers make the permanent shift from traditional advertising to online activities.
One of the most pronounced effects the pandemic had on B2B marketing was exponentially accelerating its transition into digital. As the business world begins recovering from the pandemic and returning to more traditional models, this transition has slowed down. The past year has affirmed, however, that it will not stop.
By 2025, Gartner expects 80% of B2B sales interactions between suppliers and buyers to occur in digital channels.
B2B buying behaviors have been shifting toward a buyer-centric digital model, a change that has been accelerated the past couple of years.
Digital Clarity sit at the intersection of marketing, analysis and sale growth for B2B Tech companies. Focus on digital-lead generation and qualification. The pandemic lockdown underscored how important it is to source and qualify new leads beyond the relationships you already have. It also accelerated digital-lead generation toward high-value customer segments. Traditional lead generation tactics like cold calling are being replaced or supplemented by lower-touch digital leads focused on meeting customers “where they are.” Sales should work closely with Marketing to source leads from typical digital sources (such as Google and LinkedIn), as well as from relevant third-party affiliates (such as LendingTree for mortgages, Trivago for travel, and Buyerzone for B2B services) that are becoming initial destinations for shoppers. Leaders in digital-lead generation can cost-effectively source and qualify leads as well as automate the lead-generation process to support their sales teams with higher propensity leads.
This can energize a sales force. For example, a private-equity owned B2B company was recently challenged with high turnover of entry-level salespeople who lost energy after months of cold calling. Focusing on a digital lead-generation strategy helped them to source more qualified leads with a higher propensity to purchase. This was a huge boost for newer salespeople and helped to supplement their other lead-generation activities, positioning them for greater sales success and reduced salesperson churn.
SALES ARE GOING DIGITAL
Gartner Says 80% of B2B Sales Interactions Between Suppliers and Buyers Will Occur in Digital Channels by 2025.
Over the next five years, an even greater rise in digital interactions between buyers and suppliers will break traditional sales models.
The Gartner Future of Sales 2025 report predicts that by 2025, 80% of B2B sales interactions between suppliers and buyers will occur in digital channels. Chief sales officers (CSOs) and other senior sales leaders must accept that buying preferences have permanently changed and, as a result, so too will the role of sellers.
Sales organizations must be able to sell to customers everywhere the customer expects to engage, interact and transact with suppliers. Gartner defines the future of sales as the permanent transformation of organizations’ sales strategies, processes and allocation of resources, moving from a seller-centric to a buyer-centric orientation and shifting from analogy sales processes to digital-first engagement with customers.
Disruptive buyer dynamics are rewriting the rulebook for B2B sales, demanding digital-first engagement with customers. The rise in digital sales will be driven by marketing that creates demand and trust in brands.
This doesn’t portend the eventual “death of the sales rep,” but it does signal drastic changes needed in the seller role. Sales leaders must deliver significant value through digital and omnichannel sales models, aided by sales professionals who can steer self-learning customers toward more confident decisions. Digital delivers this.
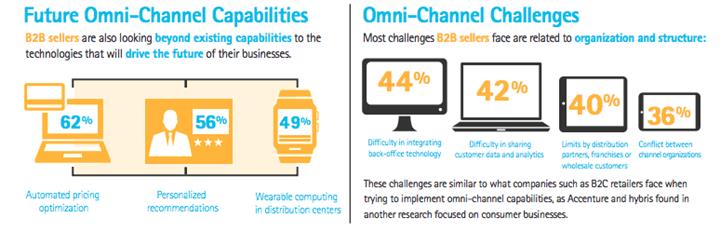
THE GROWTH OF THE DIGITAL OMNICHANNEL
Gartner research shows a steady shift of customer preferences from in-person sales interactions to digital channels. B2B buyers spend only 17% of the total purchase journey with sales reps.
Because the average deal involves multiple suppliers, a sales rep gets roughly 5% of a customer’s total purchase time. And 44% of millennials prefer no sales rep interaction at all in a B2B setting.
Sales leaders must deliver significant value through digital and omnichannel sales models, aided by sales professionals who can steer self-learning customers toward more confident decisions.
THE OMNICHANNELREMAINS KEY IN B2B BUYING
Digital Clarity can help organizations adopt the B2B Omnichannel. Eight in ten B2B leaders say that omnichannel is as or more effective than traditional methods, a sentiment that has grown sharply in the last 2 years. Even as in-person engagement re-emerged as an option, buyers made clear they prefer a cross-channel mix, choosing in-person, remote, and digital self-serve interactions in equal measure.
B2B e-commerce has taken the lead as the most effective sales channel. It is rated first by 35 percent of respondents, ahead of in-person sales (26 percent), video conference (12 percent), email (10 percent), and telephone (8 percent) according to a recent report from McKinsey. Companies winning market share have not only digital self-serve channels such as their own websites but also broader e-commerce offerings. For example, 48 percent of winners are on industry-specific marketplaces, compared with only 13 percent of companies losing share.
Digital Clarity helps companies deploy hybrid marketing models, both online and online, that then feed into sales teams. Hybrid sales models, which are comprised of roles with a mix of both in-person and remote time with customers, are deployed by 57 percent of market-leading companies.
Customers are increasingly willing to spend big on e-commerce transactions. Many B2B companies shun e-commerce over concern about channel conflict: 38 percent of respondents said it was the biggest reason they avoided selling online. However, the sales growth opportunity may now outweigh related potential costs. Similar to last year, about 70 percent of decision-makers are prepared to spend up to $500,000 on a single e-commerce transaction. At the highest end of the spectrum, however, we see meaningful movement: the number of decision-makers willing to spend as much as $10 million or more has increased by 83 percent. This trend holds true particularly in China, India, and the United States, and in global energy and materials (GEM); telecommunications, media, and technology (TMT); and advanced industries sectors.
McKinsey says that the equilibrium is no accident. As B2B buyers flexed to remote and digital ways of engaging, they found much to like. The use and preference for e-commerce—self-serve, for example—has continually grown year on year.
Omnichannel is more effective than traditional sales models alone. As more companies enable face-to-face, remote, and e-commerce interactions, satisfaction with the sales model has grown exponentially. More than 90 percent of B2B companies say their go-to-market model is just as or more effective than before the pandemic began.
Taking an omnichannel approach means strategy and ROI are built in from the start too, so as an approach, it helps measure what works - allowing accurate attribution of results and enabling marketers to move the budget from what doesn’t work to doing more of what does. According to the recent DMA Response Rate Report, 65% of marketers use two or more media channels in their marketing campaigns while 44% of marketers use three or more.
There might be data, software, automation, and analytics considerations but B2B marketing is chiefly about ROI and about creating a large top-of funnel that can be nurtured through to sales conversion. Omni-channel is also inherent in the design. Campaigns that are planned for all relevant channels are not bolted into them as an afterthought.
DIGITAL CLARITY PERFECTLY POSITIONED FOR GROWTH
Organizations will have to fight hard to retain loyalty if customer needs are not met: for example, eight in ten B2B decision makers say they will actively look for a new supplier if performance guarantees.
Buyers are more willing than ever before to spend big through remote or online sales channels, with 35 percent willing to spend $500,000 or more in a single transaction. Seventy-seven percent of B2B customers are also willing to spend $50,000 or more.
B2B customers now regularly use ten or more channels to interact with suppliers.
Digital Clarity is a specialist in many of these channels and has been for a number of years. This expertise, experience, and trust will put Digital Clarity front of mind for organizations as they seek professional advice.
THE B2B MILLENIAL BUYER IS CHANGING THE LANDSCAPE
Millennials and Gen Z, or those born between 1996 and 2012, constitute 64% of business buyers.
Younger buyers are more demanding, engaging in more buying activities, and more willing to express their dissatisfaction with the buying process.
Nearly half of millennial buyers prefer no engagement with a salesperson at all, with the average being a third. In 2025, digital channels will account for four-fifths of all B2B sales engagements. Ultimately, the breakdown of the traditional sales model is driven by the digital shift in industrial buying, dramatically speeded up by the social distancing of vendors and clients.
This is where Digital Clarity comes in. Part of the consulting strategy is to help B2B product sales by reshaping marketing strategies to focus on the millennial B2B e-commerce sector. Between 2024 - 2026, over $2 trillion in B2B product sales will be taking place over ecommerce websites. However, this will still represent only a small portion of overall US B2B product sales and just over a fifth of B2B electronic sales.
Millennial refers to people born between 1981 and 1996. Gen Z refers to those born between 1996 and 2012. According to a recent report from Forrester Research Inc. Millennial and Gen Z B2B buyers are now the chief purchasers of goods and services for their organization. And when it comes to ecommerce, the growing number of millennial and Gen Z professionals have very high expectations for B2B ecommerce,
Millennial and Gen Z B2B buyers also have high standards for engaging and purchasing online from sellers. Younger buyers carry new demands and expectations for B2B buying. Forrester predicts that in two years, more than a third of millennial and Gen Z business buyers will purchase through self-guided digital channels. Those include vendor websites, marketplaces, app stores, or directly from an existing product.
Furthermore, Millennials and Gen Z B2B buyers are active information seekers. Younger buyers go to more sources and find third-party resources more impactful than vendor resources. This group is quicker to express dissatisfaction with the buying experience. 90% of younger buyers cite dissatisfaction with their vendor in at least one area compared to 71% of older buyers.
CONTENT MARKETING
Content has become a critical tool in the marketing mix for almost every B2B brand. Nine out of ten B2B marketers are using content marketing strategies to pull in new customers. This year, the most successful marketers were already spending 40% or more of their budget on their content strategy.
At its simplest, B2B content marketing is when a brand uses stories, ideas, and insights to engage and influence a business audience.

There is a realization amongst B2B brands that rather than being faceless organizations, they need to tell their brand’s story and show a more human side to their business, endear and promote demand from other businesses and customers. The best content marketing campaigns back up these stories and ideas with robust insights: interesting data points, original research, and real-world examples that help their customers understand a new trend or challenge and equip them with the tools and best practices to respond and thrive.
These data points and research is utilized by Digital Clarity to support companies in shaping their content strategy. Typically, areas that Digital Clarity help clients are:
|
|
●
|
Blog posts – marketers who make blogging a priority are 13x more likely to see a positive ROI for their efforts.
|
| |
|
|
|
|
●
|
White papers – favored by 22% of business leaders, these longer research-based reports provide more in-depth information. Learn more about writing a compelling B2B marketing white paper here.
|
| |
|
|
|
|
●
|
Short-form articles – enjoyed by 37% of execs, these have to research-based if they are to stand out.
|
| |
|
|
|
|
●
|
Case studies – these provide buyers with reassurance further down the buying funnel and can be made sector-specific. Nearly half of all business leaders appreciate them.
|
| |
|
|
|
|
●
|
Infographics – these have become one of the most popular content marketing tools in recent years.
|
| |
|
|
|
|
●
|
Podcasts – increasingly popular lead generation tools with marketers looking to deliver thought leadership content to buyers on the move.
|
| |
|
|
|
|
●
|
Videos – companies using video, experience clickthrough rates that are 27% higher and web conversion rates 34% greater than those that don’t.
|
| |
|
|
|
|
●
|
Email – nearly eight out of 10 marketers report see g an increase in email engagement over the past 12 months of 2022.
|
| |
|
|
|
|
●
|
LinkedIn – generates more than 50% of all social traffic to B2B websites & blogs.
|
CONTENT IS INFORMATION, AND DISCOVERABLE INFORMATION DRIVES REVENUE
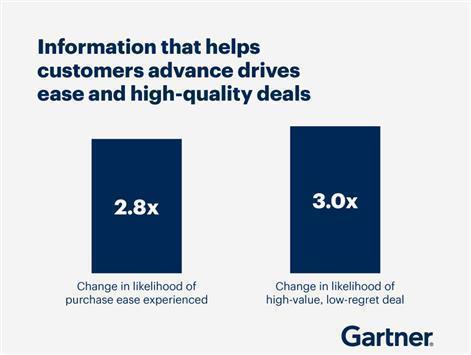
Information drives purchase ease and high-quality sales
All of this looping around and bouncing from one job to another means that buyers value suppliers that make it easier for them to navigate the purchase process.
In fact, Gartner research found that customers who perceived the information they received from suppliers to be helpful in advancing across their buying jobs were 2.8 times more likely to experience a high degree of purchase ease, and three times more likely to buy a bigger deal with less regret.
Digital Clarity has a process that helps shape their client’s content to become more discoverable information, and this increases revenues.
Buyer enablement, or the provisioning of information to customers in a way that enables them to complete information online, like gathering information or making a purchase, is an area that Digital Clarity are helping organizations.
KEY MILESTONES
As the market conditions in the consumer market cool slightly, the team at Digital Clarity has been busy pivoting their business model to address the need in the 2b2 business sector. This is a more strategic offering for prospective customers.
Digital Clarity has started offering a wider array of services to its fast-growing S company in the US. Services include, LinkedIn strategy, content positioning and SEO.
Digital Clarity has attended a major convergence summit with its client in the Unified Communication and Digital Transformation arena. This allowed the team to meet with the likes of SaaS CX providers, 8x8, Five9, and Mitel, amongst others. This will be an area of focus for the company into 2023.
In October, Digital Clarity was part of a select group that part of a panel that discussed the impact of NFTs, Blockchain and the growth of Web 3 and the Metaverse. The event was arranged by leading law firm Memery Crystal, part of Rosenblatt.
Digital Clarity has been on a large business development push and attended various networking events in London. The events include Enterprise Cyber Security hosted at the London Stock Exchange as well as diverse events in DeFi and InsureTech.
Other examples are representative of the diversity of client base. DBMM's approach using a client's analytics and executing an individualized model to increase ROI as the prime objective, spans a wide range of industries.
Core industry verticals for Digital Clarity include B2B, SaaS, Digital Transformation, FinTech, Unified Communication Companies and discretionary advice for professional service providers and consultants.
THE GROWTH OF DIGITAL MARKETING AND CONSULTANCY SERVICES
The marketing consulting market size is estimated to grow at a CAGR of 4.93% between now and 2027 according to reports from Technavio. As mentioned previously, there is a blurring of lines between traditional consultancy, marketing firms and advertising agencies. That said, firms like Accenture, Deloitte, IBM, KPMG, McKinsey and PwC rank among the most aggressive players in acquiring and partnering with agencies such as Digital Clarity. They still represent not only an opportunity for Digital Clarity but also a prospective exit and investment opportunity.
Digital Clarity have continued to develop their Digital Consulting and Strategy Planning offering. The forward-looking program is to be a recognized leader in this field and fulfill companies seeking Digital Transformation for their originations.
THE NEED FOR PROFESSIONAL CONSULTANCY AND THE OPPORTUNITY FOR MASSIVE GROWTH
Four consultancies lead Ad Age's ranking of the 10 largest agency companies in the world. With combined revenue of $13.2 billion, the marketing services units of Accenture, PwC, IBM and Deloitte sit just below WPP, Omnicom, Publicis Groupe, Interpublic and Dentsu. Last year, only two consultancies—Accenture Interactive and IBM iX—made the top 10. IBM iX was the first to break into the top 10.
Given the experience of the team, Digital Clarity’s advisory and consultancy is in demand. With the recent growth in these business areas, and the rise of consultancies, it is confirmation that Digital Clarity is headed in the right direction for growth.
THE GROWTH OF DIGITAL TRANSFORMATION WORLDWIDE
The Global Digital Transformation Market size is expected to reach $1.3 billion by 2027, rising at a market growth of 20.8% CAGR during the forecast period. Digital transformation is considered as the utilization of digital technology. Digitally transformed enterprises can be flexible to the changing technological landscape and can address abrupt shifts in the industry, particularly the one presently created by the COVID-19 pandemic; studies show that the efficiency and rate of adaptation of digitally transformed companies to a post-pandemic era are relatively larger than conventional businesses. Source
Digital Clarity can help various businesses that have been considerably affected by the global outbreak of the COVID-19 pandemic. One of the significant challenges for the global economy in 2020 was to facilitate business continuity in the midst of social distancing guidelines, lockdown norms, work-from-home culture, and other operational challenges. The lack of availability of digital strategies, infrastructure, or tools worsens the challenges for various companies that were needed to abruptly shift operations online or allow workers to work from their homes.
The situation, on the other hand, resulted in a considerable surge in awareness regarding the urgent requirement for digital transformation across a majority of the industries and created some lucrative opportunities for the global market. Companies are getting more aware of the advantages of digital transformation, particularly in the work-from-home culture that needs a business to allow the employees to easily learn, collaborate and perform organizational functions across remote locations.
THE IMPORTANCE OF STRATEGIC MARKETING CONSULTANCY
The fundamentals of marketing may not have changed, but everything else has: goals, roles, expectations, talent needs, and more. B2B marketing leaders need to navigate this new terrain and build the capabilities needed to win. Digital Clarity helps these organizations win.
Across industries, organizations are accelerating digital transformation processes for long-term growth and profitability. Yet: “53% of the organizations surveyed remain untested in the face of digital challenge and their digital transformation readiness therefore uncertain.” This report from Gartner highlights the need embrace change.
Businesses had no choice but to respond quickly to challenging conditions. Although not formally classed as ‘agile’, the twists and turns of the pandemic have required executives to innovate on the fly and collaborate to get things done. This has been compounded by working from home, which has cut out distractions and created more time for ‘deep thinking’. Regardless of headcount, a return to more stable trading conditions shouldn’t mean running back to the standard practices and silos that previously slowed marketers down.
Adobe says that Business-to-business (B2B) commerce will continue to undergo a major transformation as companies adopt the latest technologies to find new customers, improve their supply-chain efficiencies, and provide a more personalized user experience to their clientele.
Digital Clarity has created a unique Diagnosis Workshop that helps brands identify needs as well as assess the opportunities available. The core focus is to help reduce wastage and increase results.
Areas of focus include:
|
|
●
|
Cost analysis
|
| |
|
|
|
|
●
|
Audit current channels
|
| |
|
|
|
|
●
|
Digital strategy planning
|
| |
|
|
|
|
●
|
ROI projection planning
|
| |
|
|
|
|
●
|
Digital consulting and training
|
DIGITAL CLARITY HAS A COMPETITIVE ADVANTAGE
Digital Clarity operate in a highly commoditized market but have over the years build a stellar reputation that makes it different from its competitors. Some of these areas include:
|
|
1.
|
Our DNA is Strategically Driven
|
We believe the path to successful customer acquisition lies in understanding a client’s business – not just running a campaign. We seek to help clients understand that success has to be objective and measurable.
Digital marketing is not a cost but an asset. Not a line in a spreadsheet but an emotive force that if done right, will bring real business change and growth.
|
|
3.
|
We are Digital Thinkers
|
Marketing has to be at the heart of the business. Delivering real innovation in digital marketing requires not just knowledge but authority and bravery. We think digital. We drive results.
|
|
4.
|
Our goal is to deliver Digital Performance
|
We help our clients to understand their goals and objectives, using digital marketing to drive new business opportunities and retain their current customers.
DIGITAL CLARITY HAS DEVELOPED A WINNING STRATEGIC PROCESS

01 Discover - The first step - understand. Let's connect and see if we are the right fit.
Normally a phone call or Zoom to understand their challenges, and if there is scope for us working together.
02 Diagnose - Our diagnosis workshop helps define their goals and we discuss what’s needed to get there.
So again is either a face-to-face or a Zoom call. More in-depth. They fill in a detailed questionnaire and then we give them some exercises and get them to open up. We help them discuss their goals and objectives and what they feel the barriers are in stopping them from reaching them - .e.g. people, process, market, marketing, brand, etc.
03 Review - We take all the information, data, and objectives and build out a workable strategy. We then talk them through this game plan and how we will work with them to get there. We also can bring in people (our black book) who can get involved when there are gaps.
04 Delivery - We work with clients to implement our game plan and set clear next steps, goals, and milestones – as required.
COMPETITIVE LANDSCAPE
Digital advertising is the fastest-growing segment of the global market for advertising spending. The increasing use of smartphones and the availability of cheap internet services are the two major factors propelling the growth prospects for this market. More than 30% of the companies are planning to spend around 75% of their advertising expenditures on digital marketing within the next five years.
“U. S. Marketers are expected to spend $110.1 billion on digital ads this year, or 51% of the $214.6 billion total U.S. advertising spending forecast, excluding political ads. Newspapers, radio, magazines, and local television now account for just 21% of the U.S. ad market.” From The Wall Street Journal
THE GROWTH OF B2B SOCIAL MEDIA
2020 will go down as the year that marketing was pulled into the boardroom. 80% of senior executives said the role of marketing in setting strategy has expanded since the pandemic. Traditional consumers have moved online, making the digital environment even more important right now.
This priority has raised the profile of marketing as companies scramble to understand the digital-first consumer. The battleground for 2023 will be about speed and agility. Now that many companies have treasure troves of data, the difference is how fast they can personalize the experience and respond to consumer behaviors. Expect to see more investment and innovation in technology infrastructure alongside marketing.
|
|
●
|
76% of B2B organizations use social media analytics to measure content performance.
|
| |
|
|
|
|
●
|
By 2025, 80% of B2B sales interactions will occur on digital channels.
|
| |
|
|
|
|
●
|
U.S. B2B business will spend $2 billion in 2022, and $2.33 billion in 2023 approximately 2-5% – 4% growth in 2024
|
GROWTH IN LINKEDIN ADVERTISING SET TO SOAR BEYOND 2023
Almost all B2B content marketers (96%) use LinkedIn. They also rated it as the top-performing organic platform.
Digital Clarity helps business organizations make the most of LinkedIn. We help customers understand and build campaigns around the 95-5 rule. The 95-5 rule advises you market mostly to buyers who are not likely to buy from you today.

THE NEW NORMAL REMAINS DIGITAL
In just one year, since the pandemic. digital adoption has happened at five to ten times the projected rate.
Lockdown periods, economic uncertainty and loss of predictability have forced customers and businesses online in previously unseen numbers. This migration has upset the power balance, with customers now more in control of the relationship and less loyal to brands and products. On top of that, 60% of companies have seen new buying behaviors such as changes to average basket size and product interests.
Pandemic disruption caused many businesses to demand a similar level of convenience to consumers. After returning to normal, there’s no question that the new normal is digital.
GROWTH IN INVESTOR AWARENESS AND OUTREACH.
We expect that, in 2024, the strategic outreach will be directed at investors around the world who understand the digital marketplace and its expanding influence on consumer decisions. DBMM will target new investors through a global digital and traditional integrated investor outreach campaign which will be run by Digital Clarity, with third parties, as required, for distribution. In all areas, the Company will act in the interests of all stakeholders.
In the full industry context of dramatic expansion of digital footprints, there has been no direct correlation between DBMM's revenues and its share price. Economic and industry analysts have opined that the industry multiple continues to grow to, in some cases, 25-30 times revenues. DBMM will expand its client and geographic scale, thus increasing revenues. There were matters outside of DBMM's control which caused growth to be in neutral, and in 2020/21 the pandemic threw all planning into disarray. With capital infusion following the closure of the SEC review with a final order in June 2023 of the earlier dismissal, 2024 will follow the model of a growing client base and geographic reach until it achieves a TBD level of profitability. We anticipate the benchmark will replicate successful industry models in digital technology, marketing and company transformation.
On October 26, 2022, FINRA processed a Form 211 relating to the initiation of priced quotations of our shares of common stock, which means that the submitting broker-dealer has demonstrated to FINRA compliance with FINRA Rule 6432 and therefore has met the requirements under that rule to initiate a quotation for our shares of common stock within four days of October 26, 2022. FINRA’s processing of a Form 211 in no way constitutes FINRA’s approval of the security, the issuer, or the issuer’s business and relates solely to the submitting broker-dealer’s obligation to comply with FINRA Rule 6432 and SEA Rule 15c2-11 when quoting a security. (FINRA TO Glendale Securities)
After OTC Markets’ review of our activities following their process, our shares of common stock returned to normal market trading without restriction or caveat emptor. The caveat emptor was removed on December 20, 2022. Accordingly, plans to grow investor awareness and outreach are underway.
Glendale Securities, Inc. is the designated Market Maker.
The SEC matter remained open even after the November 12, 2019 ALJ Dismissal regarding the cured late filings, which should have closed the matter then. This has been damaging to our investors and us and impedes our progress. Nevertheless, our compliance continued with required timely filings. In June 2023, the SEC issued an Order Dismissing Proceedings as Release 4413 advising us that their administrative proceedings against us has been dismissed, and a Final Order issued.
FINANCIAL OVERVIEW/OUTLOOK
DBMM has been honing its commercial model since the acquisition of Digital Clarity (“DC”) in 2011, and has been cash flow-positive as an operating company since then. Unfortunately, external events outside of DBMM’s control have precluded the growth expected to this point; however, its margins of 35-50% are accurate. Aspirationally, when the Company reaches appropriate scale and profitability TBD, the business will meet all stakeholder expectations.
The growth trajectory anticipated during 2023 remained deferred until the Company returned to normal business and normal trading. However, the timeframe was only the last quarter of the 2023 fiscal year. Normal trading has resumed; however, the management has used the analogy of, “It’s like turning around a yacht.” Nevertheless, clients will benefit due to a wider range of resources, and the shareholders will benefit as the market cap grows. The media market multiple far exceeds the “old” manufacturing multiples, as digital technology and marketing has become one of fastest growing industries in the world today. The trading in our shares of common stock returned to normal on December 20, 2022 with no restrictions. The US retail marketplace of our shares of common stock was open finally to all investors. We began the process of restarting the growth infrastructure in the fourth quarter of fiscal 2023 following the Final Order of Dismissal issued on June 2, 2023.
The return to normal business is a step-by-step process now that the SEC matter is closed in our favor and all mitigating factors circumstances concluded to our benefit. DBMM’s place in the industry reputationally is strong, particularly for its size. The industry environment continues to grow exponentially, and digital marketing and company transformation is an essential strategy for any commercial activity, and thus has become embedded in planning.
Nevertheless, since 2020, revenues have slowed down temporarily due to a number of factors: 1) client uncertainty caused by Brexit trade issues, 2) COVID-19 global slowdown with some clients pausing as lockdowns stopped and started, 3) clients needing to extend or double down lacked the resources, and 4) DBMM addressing its mitigating circumstances brought about by the SEC Matter, all of which were external events through no fault of the Company, DBMM. To address the changing environment, the business development model has evolved and, as such, Digital Clarity has earned a “seat at the table,” client by client. With precision, the revenues are turning around.
Revenues have been increasing quarter to quarter following the pandemic slowdown.
Several years ago, the Company received a commitment for future working capital to grow the Company in key markets. Growth capital will be directed to support a client base rebalancing and leveraging of a very dynamic, transformational, digital landscape. DC’s mantra remains the same: “ROI is our DNA.” Going forward, there will be an emphasis on investor awareness now that normal business recommenced. DBMM intends to make significant strides in aggressively broadening its brand exposure. There are investors around the globe who understand the digital marketplace and its increasing influence on commercial decisions. DBMM will be targeting new shareholders in the public market through a global digital and traditional, integrated campaign run by DC, with third parties, as required for distribution.
The expectations for fiscal year 2023 were to return to normal trading first, which now has occurred, and then move ahead to a scaled growth plan in multiple geographies once normal business recommenced and the SEC matter is finally closed. The result will benefit all stakeholders. This process is step-by-step in order to assure all growth is sustainable and continuing.
Regarding capital infusion, the Company resolved in 2015 to eliminate any consideration of using convertible debentures as a financing vehicle. Accordingly, the Company has not issued convertible debentures since 2015 nor have any convertible debentures been executed since 2016.
Additionally, we have demonstrated our adherence to such a philosophy by renegotiating its aged debt with lenders, one at a time, at fixed settlement amounts with no conversion terms. Furthermore, such renegotiations lead to the derecognition of derivative liabilities overhanging our balance sheet. The Company intends to continue its debt negotiation and modification program.
This has been a successful strategy thus far:
During fiscal year 2021 and so far in 2023, and to a lesser extent in fiscal 2020, we successfully reached agreements with certain lenders resulting in a gain on extinguishment for loans payable which amounted to the difference between the carrying value and the revised amount of the obligations.
The gain on extinguishment of principal and accrued interest amounted to $169,837 and $57,802 during fiscal 2021 and 2020, respectively.
We also successfully reached an agreement with a holder of convertible debentures aggregating $249,800 to modify its terms. Such debentures are no longer convertible, are now non-interest bearing, and have been reclassified to loans payable. It also resulted in a decrease in derivative liabilities and an increase in additional paid-in capital of approximately $260,000 during fiscal 2021.
Furthermore, in March 2022, we reached an agreement with a holder of convertible debentures to satisfy obligations aggregating $85,000 in consideration of 30 million shares of the Company’s common stock.
In February 2023, we reached an agreement with a holder of convertible debentures to satisfy obligations aggregating $76,000 in consideration of 7.5 million shares of the Company’s common stock.
In May 2023, we reduced our liability to a lessor by $15,000.
Fiscal Year 2023
We had $45,000 in cash and our working capital deficiency amounted to approximately $6.5 million at August 31, 2023.
During fiscal 2023, we used cash in our operating activities amounting to $437,000. Our cash used in operating activities was comprised of our net loss of $713,000 adjusted primarily for the following:
Change in fair value of derivative liability of $42,070 and loss on extinguishment of debt of $73,000.
Additionally, the following variations in operating assets and liabilities during fiscal 2023 impacted our cash used in operating activity: - to
Increase in accounts payable, accrued expenses, accrued interest, and accrued compensation, of $245,000, resulting from a short fall in liquidity and capital resources.
We generated cash from financing activities of $471,000 which primarily consists of the proceeds from the issuance of loans payable.
Fiscal Year 2022
We had approximately $10,000 in cash and our working capital deficiency amounted to approximately $5.9 million at August 31, 2022.
During fiscal 2022, we used cash in our operating activities amounting to approximately $389,000. Our cash used in operating activities was comprised of our net loss of approximately $626,000 adjusted primarily for the following:
Change in fair value of derivative liability of $201,000 and loss on extinguishment of debt of $83,000.
Accounts payable, accrued expenses, accrued interest, and accrued compensation, of approximately $363,000, resulting from a short fall in liquidity and capital resources.
During fiscal 2022, we generated cash from financing activities of approximately $389,000 which primarily consists of the proceeds from demand notes payable of approximately $399,000.
Going Concern
The accompanying consolidated financial statements have been prepared on a going concern basis. The financial statements do not reflect any adjustments that might result if The Company is unable to continue as a going concern.
The Company has outstanding loans and convertible notes payable aggregating $3.0 million at August 31, 2023 and doesn’t have sufficient cash on hand to satisfy such obligations. The preceding raise substantial doubt about the ability of the Company to continue as a going concern. However, the Company generated proceeds of approximately $471,000 from financing activities during fiscal 2023. The Company also has a non-binding Commitment Letter from an investor of $250,000 which also includes a right of first refusal on additional capital raise up to $3 million which will contribute to satisfying such obligations and fund any potential cash flow deficiencies from operations for the foreseeable future.
Accordingly, the accompanying consolidated financial statements have been prepared in conformity with U.S. GAAP, which contemplates continuation of the Company as a going concern and the realization of assets and satisfaction of liabilities in the normal course of business. The carrying amounts of assets and liabilities presented in the financial statements do not necessarily purport to represent realizable or settlement values. The financial statements do not include any adjustment that might result from the outcome of this uncertainty.
RESULTS OF OPERATIONS
Comparison of Results for fiscal 2023 and 2022
| |
|
For the Years Ended
|
|
| |
|
|
|
|
|
|
|
|
|
Increase/
|
|
|
Increase/
|
|
| |
|
|
|
|
|
|
|
|
|
(Decrease)
|
|
|
(-)Decrease |
|
| |
|
August 31, 2023
|
|
|
August 31, 2022
|
|
|
$ |
|
|
%
|
|
| |
|
|
|
|
|
|
|
|
|
|
|
|
|
|
|
|
|
SALES
|
|
$ |
309,644 |
|
|
$ |
225,842 |
|
|
$ |
83,802 |
|
|
|
37 |
% |
| |
|
|
|
|
|
|
|
|
|
|
|
|
|
|
|
|
|
COST OF SALES
|
|
|
260,774 |
|
|
|
131,272 |
|
|
|
129,502 |
|
|
|
99 |
% |
| |
|
|
|
|
|
|
|
|
|
|
|
|
|
|
|
|
|
GROSS PROFIT
|
|
|
48,870 |
|
|
|
94,570 |
|
|
|
(45,700 |
)
|
|
|
-48 |
% |
| |
|
|
|
|
|
|
|
|
|
|
|
|
|
|
|
|
|
COSTS AND EXPENSES
|
|
|
|
|
|
|
|
|
|
|
|
|
|
|
|
|
|
Sales, general and administrative
|
|
|
463,694 |
|
|
|
553,042 |
|
|
|
(89,348 |
)
|
|
|
-16 |
% |
| |
|
|
|
|
|
|
|
|
|
|
|
|
|
|
|
|
|
TOTAL OPERATING (GAIN) EXPENSES
|
|
|
463,694 |
|
|
|
553,042 |
|
|
|
(89,348 |
)
|
|
|
-16 |
% |
| |
|
|
|
|
|
|
|
|
|
|
|
|
|
|
|
|
|
OPERATING GAIN (LOSS)
|
|
|
(414,824 |
)
|
|
|
(458,472 |
)
|
|
|
(43,648 |
)
|
|
|
-10 |
% |
| |
|
|
|
|
|
|
|
|
|
|
|
|
|
|
|
|
|
OTHER (INCOME) EXPENSE
|
|
|
|
|
|
|
|
|
|
|
|
|
|
|
|
|
|
Interest expense
|
|
|
313,235 |
|
|
|
384,615 |
|
|
|
(71,380 |
)
|
|
|
-19 |
% |
|
Other income
|
|
|
(46,255 |
)
|
|
|
(98,265 |
)
|
|
|
52,010 |
|
|
|
NM |
|
|
Loss (gain) on extinguishment of debt
|
|
|
73,349 |
|
|
|
82,845 |
|
|
|
(9,496 |
)
|
|
|
NM |
|
|
Change in fair value of derivative liability
|
|
|
(42,070 |
)
|
|
|
(201,239 |
)
|
|
|
159,169 |
|
|
|
NM |
|
|
TOTAL OTHER EXPENSE
|
|
|
298,259 |
|
|
|
167,956 |
|
|
|
130,303 |
|
|
|
NM |
|
| |
|
|
|
|
|
|
|
|
|
|
|
|
|
|
|
|
|
NET LOSS
|
|
$ |
(713,083 |
)
|
|
$ |
(626,428 |
)
|
|
$ |
86,655 |
|
|
|
14 |
%
|
NM: not meaningful
We currently generate revenue through our Pay-Per-Click Advertising, Search Engine Marketing, Search Engine Optimization Services, Web Design, Social Media, Digital analytics and Advisory Services.
Our primary sources of revenue are Advisory Services (including Web design) and Per-Click Advertising which amounted to 63% and 25% of our revenues, respectively, during fiscal 2023 and 54% and 38%, respectively, during fiscal 2022.
Revenue is recognized upon transfer of control of promised or services to customers in an amount that reflects the consideration the Company expects to receive in exchange for those services. The Company enter into contracts that can include various combinations of services, which are generally capable of being distinct and accounted for as separate performance obligations. Revenue is recognized net of any taxes collected from customers, which are subsequently remitted to governmental authorities.
Geopolitical conflicts and uncertainties as well as risks of recession, high inflation alongside energy costs, and interest rate rises and means global conditions remain challenging going into 2024.
Our revenues increased during fiscal 2023 when compared to the prior year, primarily as a result of increased advisory services revenues.
Cost of sales during fiscal 2023 increased when compared to the prior year, primarily from additional expenses to meet increased demand.
The general and administrative costs during fiscal 2023, when compared to the prior year, decreased primarily from reduced overhead.
The decrease in interest expense, which includes interest accrued on certain notes and loans, is primarily due to lesser inducements offered to noteholders in fiscal 2023.
Additionally, the Company’s loss or gain on extinguishment of debt is a function of the terms at which we can settle our obligations and the fair value of the stock price at the measurement date.
The decrease in change of fair value of derivative liability during fiscal 2023 when compared to the prior year is primarily a function of lower volatility during fiscal 2023, which is one of the primary assumptions in computing the fair value of such liability.
The other income reflects the recognition of tax credits related to expenses incurred in the UK.
Non-GAAP Financial Measures
Management considers earnings (loss) before interest, taxes, depreciation and amortization, or EBITDA, as adjusted, an important indicator in evaluating our business on a consistent basis across various periods. Due to the significance of non-recurring items, EBITDA, as adjusted, enables our management to monitor and evaluate our business on a consistent basis. We use EBITDA, as adjusted, as a primary measure, among others, to analyze and evaluate financial and strategic planning decisions regarding future operating investments and potential acquisitions. We believe that EBITDA, as adjusted, eliminates items that are not part of our core operations, such as interest expense, or items that do not involve a cash outlay, such as loss on extinguishment of debt and change in fair value of derivative liability. EBITDA, as adjusted, should be considered in addition to, rather than as a substitute for, pre-tax income (loss), net income (loss) and cash flows used in operating activities. This non-GAAP financial measure excludes significant expenses that are required by GAAP to be recorded in our financial statements and is subject to inherent limitations. Investors should review the reconciliation of this non-GAAP financial measure to the comparable GAAP financial measure included below. Investors should not rely on any single financial measure to evaluate our business.
| |
|
Fiscal
|
|
| |
|
2023
|
|
|
2022
|
|
|
Net loss
|
|
$ |
(713,083 |
)
|
|
$ |
(626,428 |
)
|
|
Interest
|
|
|
313,235 |
|
|
|
384,615 |
|
|
Loss on extinguishment of debt
|
|
|
73,349 |
|
|
|
82,845 |
|
|
Change in fair value of derivative liability
|
|
|
(42,070 |
) |
|
|
(201,239 |
) |
| |
|
|
|
|
|
|
|
|
|
EBITDA, as adjusted
|
|
$ |
(368,569 |
)
|
|
$ |
(360,207 |
)
|
ITEM 7A. QUANTITATIVE AND QUALITATIVE DISCLOSURES ABOUT MARKET RISK.
As a “smaller reporting company”, as defined by Rule 10(f)(1) of Regulation S-K, the Company is not required to provide this information.
ITEM 8. CONSOLIDATED FINANCIAL STATEMENTS

REPORT OF INDEPENDENT REGISTERED PUBLIC ACCOUNTING FIRM
To the Board of Directors and Stockholders of Digital Brand Media & Marketing Group, Inc.
Opinion on the Financial Statements
We have audited the accompanying consolidated balance sheets of Digital Brand Media & Marketing Group, Inc. (the Company) as of August 31, 2023 and 2022, and the related consolidated statements of operations and comprehensive income (loss), changes in stockholders’ deficit, and cash flows for each of the years in the two-year period ended August 31, 2023, and the related notes (collectively referred to as the financial statements). In our opinion, the financial statements present fairly, in all material respects, the financial position of the Company as of August 31, 2022 and 2022, and the results of its operations and its cash flows for each of the years in the two-year period ended August 31, 2023, in conformity with accounting principles generally accepted in the United States of America.
Going Concern
The accompanying financial statements have been prepared assuming that the Company will continue as a going concern. As discussed in Note 1 to the financial statements, the Company has suffered net losses from operations and has a net capital deficiency, which raises substantial doubt about its ability to continue as a going concern. Management’s plans regarding those matters are discussed in Note 1. The financial statements do not include any adjustments that might result from the outcome of this uncertainty.
Basis for Opinion
These financial statements are the responsibility of the Company’s management. Our responsibility is to express an opinion on the Company’s financial statements based on our audits. We are a public accounting firm registered with the Public Company Accounting Oversight Board (United States) (PCAOB) and are required to be independent with respect to the Company in accordance with the U.S. federal securities laws and the applicable rules and regulations of the Securities and Exchange Commission and the PCAOB.
We conducted our audits in accordance with the standards of the PCAOB. Those standards require that we plan and perform the audits to obtain reasonable assurance about whether the financial statements are free of material misstatement, whether due to error or fraud. The Company is not required to have, nor were we engaged to perform, an audit of its internal control over financial reporting. As part of our audits, we are required to obtain an understanding of internal control over financial reporting, but not for the purpose of expressing an opinion on the effectiveness of the Company’s internal control over financial reporting. Accordingly, we express no such opinion.
Our audits included performing procedures to assess the risks of material misstatement of the financial statements, whether due to error or fraud, and performing procedures that respond to those risks. Such procedures included examining, on a test basis, evidence regarding the amounts and disclosures in the financial statements. Our audits also included evaluating the accounting principles used and the significant estimates made by management, as well as evaluating the overall presentation of the financial statements. We believe our audits provide a reasonable basis for our opinion.
Critical Audit Matters
The critical audit matter communicated below is a matter arising from the current period audit of the financial statements that were communicated or required to be communicated to the audit committee and that: (1) relate to accounts or disclosures that are material to the financial statements and (2) involved our especially challenging, subjective, or complex judgments. The communication of critical audit matters does not alter in any way our opinion on the financial statements, taken as a whole, and we are not, by communicating the critical audit matters below, providing separate opinion on the critical audit matters or on the accounts or disclosures to which they relate.
As discussed in Note 7 to the financial statements, the company has a derivative liability due to a tainted equity environment.
To evaluate the appropriateness of the fair value determined by management, we examined and evaluated the inputs management used in calculating the fair value of the stock-based compensation. To evaluate the appropriateness of the estimates used by the derivative specialist, we examined and evaluated the inputs the specialist used in calculating the value of the derivatives.
/s/ M&K CPAS, PLLC
M&K CPAS, PLLC
We have served as the Company’s auditor since 2020
Houston, TX
November 29, 2023
DIGITAL BRAND MEDIA & MARKETING GROUP, INC. AND SUBSIDIARIES
CONSOLIDATED BALANCE SHEETS
| |
|
August 31,
|
|
|
August 31,
|
|
| |
|
2023
|
|
|
2022
|
|
|
|
|
|
|
|
|
(Restated) |
|
| ASSETS |
|
|
|
|
|
|
|
|
| |
|
|
|
|
|
|
|
|
|
CURRENT ASSETS
|
|
|
|
|
|
|
|
|
|
Cash
|
|
$ |
44,521 |
|
|
$ |
9,364 |
|
|
Accounts receivable, net
|
|
|
20,739 |
|
|
|
20,383 |
|
|
Prepaid expenses and other current assets
|
|
|
470 |
|
|
|
470 |
|
|
Total current assets
|
|
|
65,730 |
|
|
|
30,217 |
|
| |
|
|
|
|
|
|
|
|
|
Property and equipment - net
|
|
|
- |
|
|
|
1,420 |
|
| |
|
|
|
|
|
|
|
|
|
TOTAL ASSETS
|
|
$ |
65,730 |
|
|
$ |
31,637 |
|
| |
|
|
|
|
|
|
|
|
|
LIABILITIES AND STOCKHOLDERS' DEFICIT
|
|
|
|
|
|
|
|
|
| |
|
|
|
|
|
|
|
|
|
CURRENT LIABILITIES
|
|
|
|
|
|
|
|
|
|
Accounts payable and accrued expenses
|
|
$ |
724,272 |
|
|
$ |
750,220 |
|
|
Accrued interest
|
|
|
1,189,387 |
|
|
|
890,708 |
|
|
Accrued compensation
|
|
|
1,313,536 |
|
|
|
1,377,136 |
|
|
Derivative liability
|
|
|
206,476 |
|
|
|
281,932 |
|
|
Loans payable, net
|
|
|
2,478,291 |
|
|
|
1,945,071 |
|
|
Officers loans payable
|
|
|
53,893 |
|
|
|
79,169 |
|
|
Convertible debentures, net
|
|
|
517,242 |
|
|
|
546,571 |
|
| |
|
|
6,483,097 |
|
|
|
5,870,807 |
|
| |
|
|
|
|
|
|
|
|
|
Loan payable, net of short-term portion
|
|
|
27,297 |
|
|
|
34,360 |
|
| |
|
|
|
|
|
|
|
|
| |
|
|
|
|
|
|
|
|
|
TOTAL LIABILITIES
|
|
|
6,510,394 |
|
|
|
5,905,167 |
|
| |
|
|
|
|
|
|
|
|
|
STOCKHOLDERS' DEFICIT
|
|
|
|
|
|
|
|
|
| Preferred stock, Series 1, par value .001; authorized 2,000,000 shares; 1,995,185, and 1,995,185 shares issued and outstanding |
|
|
1,995 |
|
|
|
1,995 |
|
| Preferred stock, Series 2, par value .001; authorized 2,000,000 shares; 0 and 0 shares issued and outstanding |
|
|
- |
|
|
|
- |
|
| Common stock, par value .001; authorized 2,000,000,000 shares; 825,218,631, and 787,718,631, shares issued and outstanding |
|
|
825,218 |
|
|
|
787,718 |
|
|
Additional paid in capital
|
|
|
9,813,090 |
|
|
|
9,666,590 |
|
|
Other comprehensive loss
|
|
|
51,427 |
|
|
|
93,478 |
|
|
Accumulated deficit
|
|
|
(17,136,394 |
)
|
|
|
(16,423,311 |
)
|
| |
|
|
|
|
|
|
|
|
|
TOTAL STOCKHOLDERS' DEFICIT
|
|
$ |
(6,444,664 |
)
|
|
$ |
(5,873,530 |
)
|
| |
|
|
|
|
|
|
|
|
|
TOTAL LIABILITIES AND STOCKHOLDERS' DEFICIT
|
|
$ |
65,730 |
|
|
$ |
31,637 |
|
See Notes to Consolidated Financial Statements
DIGITAL BRAND MEDIA & MARKETING GROUP, INC. AND SUBSIDIARIES
CONSOLIDATED STATEMENTS OF OPERATIONS AND COMPREHENSIVE INCOME (LOSS)
| |
|
For the year ended
|
|
| |
|
August 31, 2023
|
|
|
August 31, 2022
|
|
| |
|
|
|
|
|
|
|
|
|
REVENUES
|
|
$ |
309,644 |
|
|
$ |
225,842 |
|
| |
|
|
|
|
|
|
|
|
|
COST OF REVENUES
|
|
|
260,774 |
|
|
|
131,272 |
|
| |
|
|
|
|
|
|
|
|
|
GROSS PROFIT
|
|
|
48,870 |
|
|
|
94,570 |
|
| |
|
|
|
|
|
|
|
|
|
COSTS AND EXPENSES
|
|
|
|
|
|
|
|
|
|
Sales, general and administrative
|
|
|
463,694 |
|
|
|
553,042 |
|
|
TOTAL OPERATING EXPENSES
|
|
|
463,694 |
|
|
|
553,042 |
|
| |
|
|
|
|
|
|
|
|
|
OPERATING LOSS
|
|
|
(414,824 |
)
|
|
|
(458,472 |
)
|
| |
|
|
|
|
|
|
|
|
|
OTHER (INCOME) EXPENSE
|
|
|
|
|
|
|
|
|
|
Interest expense
|
|
|
313,235 |
|
|
|
384,615 |
|
|
Other income
|
|
|
(46,255 |
)
|
|
|
(98,265 |
)
|
|
Loss (gain) on extinguishment of debt
|
|
|
73,349 |
|
|
|
82,845 |
|
|
Change in fair value of derivative liability
|
|
|
(42,070 |
)
|
|
|
(201,239 |
)
|
|
TOTAL OTHER (INCOME) EXPENSES
|
|
|
298,259 |
|
|
|
167,956 |
|
| |
|
|
|
|
|
|
|
|
|
NET LOSS
|
|
$ |
(713,083 |
)
|
|
$ |
(626,428 |
)
|
| |
|
|
|
|
|
|
|
|
|
OTHER COMPREHENSIVE INCOME (LOSS)
|
|
|
|
|
|
|
|
|
|
Foreign exchange translation
|
|
|
(42,051 |
) |
|
|
129,462 |
|
|
COMPREHENSIVE LOSS
|
|
|
(755,134 |
)
|
|
|
(496,966 |
)
|
| |
|
|
|
|
|
|
|
|
|
NET LOSS PER SHARE
|
|
|
|
|
|
|
|
|
|
Basic and diluted
|
|
$ |
(0.00 |
)
|
|
$ |
(0.00 |
)
|
| |
|
|
|
|
|
|
|
|
|
WEIGHTED AVERAGE NUMBER OF SHARES
|
|
|
|
|
|
|
|
|
|
Basic and diluted
|
|
|
797,252,878 |
|
|
|
771,280,275 |
|
See Notes to Consolidated Financial Statements
DIGITAL BRAND MEDIA & MARKETING GROUP, INC. AND SUBSIDIARIES
CONSOLIDATED STATEMENTS OF CHANGES IN STOCKHOLDERS' DEFICIT
| |
|
For the Year Ended August 31,
|
|
| |
|
2023
|
|
|
2022
|
|
|
|
|
|
|
|
|
(Restated) |
|
| Series 1 |
|
|
|
|
|
|
|
|
Preferred Stock
|
|
|
|
|
|
|
|
|
|
Shares, beginning and end of period
|
|
|
1,995,185 |
|
|
|
1,995,185 |
|
| |
|
|
|
|
|
|
|
|
|
Preferred Stock
|
|
|
|
|
|
|
|
|
|
Balance, beginning and end of period
|
|
$ |
1,995 |
|
|
$ |
1,995 |
|
| |
|
|
|
|
|
|
|
|
|
Series 2
|
|
|
|
|
|
|
|
|
|
Preferred Stock
|
|
|
|
|
|
|
|
|
|
Shares, beginning and end of period
|
|
|
- |
|
|
|
- |
|
| |
|
|
|
|
|
|
|
|
|
Preferred Stock
|
|
|
|
|
|
|
|
|
|
Balance, beginning and end of period
|
|
$ |
- |
|
|
$ |
- |
|
| |
|
|
|
|
|
|
|
|
|
Common Stock
|
|
|
|
|
|
|
|
|
|
Shares, beginning of period
|
|
|
787,718,631 |
|
|
|
757,718,631 |
|
|
Issuance of shares pursuant to satisfaction of convertible debt obligations
|
|
|
37,500,000 |
|
|
|
30,000,000 |
|
|
Shares, end of period
|
|
$ |
825,218,631 |
|
|
$ |
787,718,631 |
|
| |
|
|
|
|
|
|
|
|
| |
|
|
|
|
|
|
|
|
|
Balance, beginning of period
|
|
$ |
787,718 |
|
|
$ |
757,718 |
|
|
Issuance of shares pursuant to satisfaction of convertible debt obligations
|
|
|
37,500 |
|
|
|
30,000 |
|
|
Balance, end of period
|
|
$ |
825,218 |
|
|
$ |
787,718 |
|
| |
|
|
|
|
|
|
|
|
|
Additional paid-in capital
|
|
|
|
|
|
|
|
|
|
Balance, beginning of period
|
|
$ |
9,666,590 |
|
|
$ |
9,528,590 |
|
|
Issuance of shares pursuant to satisfaction of convertible debt obligations
|
|
|
146,500 |
|
|
|
138,000 |
|
|
Balance, end of period
|
|
$ |
9,813,090 |
|
|
$ |
9,666,590 |
|
| |
|
|
|
|
|
|
|
|
|
Other Comprehensive Income (Loss)
|
|
|
|
|
|
|
|
|
|
Balance, beginning of period
|
|
$ |
93,478 |
|
|
$ |
(35,984 |
)
|
|
Other comprehensive income (loss)
|
|
|
(42,051 |
)
|
|
|
129,462 |
|
|
Balance, end of period
|
|
$ |
51,427 |
|
|
$ |
93,478 |
|
| |
|
|
|
|
|
|
|
|
|
Accumulated Deficit
|
|
|
|
|
|
|
|
|
|
Balance, beginning of period
|
|
$ |
(16,423,311 |
)
|
|
$ |
(15,796,883 |
)
|
|
Net loss
|
|
|
(713,083 |
)
|
|
|
(626,428 |
)
|
|
Balance, end of period
|
|
$ |
(17,136,394 |
)
|
|
$ |
(16,423,311 |
)
|
| |
|
|
|
|
|
|
|
|
|
Total Stockholders' Deficit
|
|
$ |
(6,444,664 |
)
|
|
$ |
(5,873,530 |
)
|
See Notes to Consolidated Financial Statements
DIGITAL BRAND MEDIA & MARKETING GROUP, INC. AND SUBSIDIARIES
CONSOLIDATED STATEMENTS OF CASH FLOWS
| |
|
For the Year Ended
|
|
| |
|
August 31,
|
|
|
August 31,
|
|
| |
|
2023
|
|
|
2022
|
|
|
CASH FLOWS FROM OPERATING ACTIVITIES
|
|
|
|
|
|
|
|
|
|
Net loss
|
|
$ |
(713,083 |
)
|
|
$ |
(626,428 |
)
|
| |
|
|
|
|
|
|
|
|
|
Adjustments to reconcile net loss to net cash used in operating activities:
|
|
|
|
|
|
|
|
|
|
Depreciation
|
|
|
1,420 |
|
|
|
- |
|
|
Change in fair value of derivative liability
|
|
|
(42,070 |
)
|
|
|
(201,239 |
)
|
|
Loss (gain) on extinguishment of debt
|
|
|
73,349 |
|
|
|
82,845 |
|
| |
|
|
|
|
|
|
|
|
|
Changes in operating assets and liabilities:
|
|
|
|
|
|
|
|
|
|
Accounts receivable
|
|
|
505 |
|
|
|
(7,198 |
)
|
|
Accounts payable and accrued expenses
|
|
|
(5,485 |
)
|
|
|
160,626 |
|
|
Accrued interest
|
|
|
312,179 |
|
|
|
264,924 |
|
|
Accrued compensation
|
|
|
(63,600 |
)
|
|
|
(62,750 |
)
|
| |
|
|
|
|
|
|
|
|
|
NET CASH USED IN OPERATING ACTIVITIES
|
|
|
(436,785 |
)
|
|
|
(389,220 |
)
|
| |
|
|
|
|
|
|
|
|
|
CASH FLOWS FROM INVESTING ACTIVITIES
|
|
|
|
|
|
|
|
|
|
Purchase of equipment
|
|
|
- |
|
|
|
- |
|
| |
|
|
|
|
|
|
|
|
|
NET CASH USED IN INVESTING ACTIVITIES
|
|
|
- |
|
|
|
- |
|
| |
|
|
|
|
|
|
|
|
|
CASH FLOWS FROM FINANCING ACTIVITIES
|
|
|
|
|
|
|
|
|
|
Proceeds from loans payable
|
|
|
508,113 |
|
|
|
399,202 |
|
|
Officer loans payable
|
|
|
(11,669 |
)
|
|
|
(7,601 |
)
|
|
Principal repayments loans payable
|
|
|
(25,276 |
)
|
|
|
(2,712 |
)
|
| |
|
|
|
|
|
|
|
|
|
NET CASH PROVIDED BY FINANCING ACTIVITIES
|
|
|
471,168 |
|
|
|
388,889 |
|
| |
|
|
|
|
|
|
|
|
|
EFFECT OF VARIATION OF EXCHANGE RATE OF CASH HELD IN FOREIGN CURRENCY
|
|
|
774 |
|
|
|
(92 |
)
|
| |
|
|
|
|
|
|
|
|
|
NET INCREASE/(DECREASE) IN CASH
|
|
|
35,157 |
|
|
|
(423 |
)
|
| |
|
|
|
|
|
|
|
|
|
CASH - BEGINNING OF PERIOD
|
|
|
9,364 |
|
|
|
9,787 |
|
| |
|
|
|
|
|
|
|
|
|
CASH - END OF PERIOD
|
|
|
44,421 |
|
|
|
9,364 |
|
| |
|
|
|
|
|
|
|
|
|
Supplemental disclosures of cash flow information:
|
|
|
|
|
|
|
|
|
|
Cash paid for interest
|
|
$ |
1,056 |
|
|
$ |
- |
|
|
Cash paid for taxes
|
|
$ |
- |
|
|
$ |
- |
|
| |
|
|
|
|
|
|
|
|
|
Non-cash investing and financing activities:
|
|
|
|
|
|
|
|
|
|
Issuance of shares of common stock pursuant to debt inducement
|
|
$ |
19,000 |
|
|
$ |
- |
|
|
Issuance of shares of common stock to settled certain aged convertible debt
|
|
|
76,215 |
|
|
|
64,137 |
|
See Notes to Consolidated Financial Statements
DIGITAL BRAND MEDIA & MARKETING GROUP, INC.
NOTES TO CONSOLIDATED FINANCIAL STATEMENTS
NOTE 1 – ORGANIZATION, BASIS OF PRESENTATION AND GOING CONCERN
Nature of Business and History of the Company
Digital Brand Media & Marketing Group, Inc. (“The Company”) is an OTC:PK listed company. The Company was organized under the laws of the State of Florida on September 29, 1998.
The Company strategically focuses on developing the business of its wholly owned and revenue generating online marketing services company, Digital Clarity. With deep DNA in its operating market, blending the services of an experienced professional workforce leveraging a technology offering positions the Company in a strong, forward looking structure. Digital Clarity operates in the growing area of digital marketing that helps companies make the most of the digital economy focusing on areas such as Search Engine Marketing (Google, Yahoo! & Bing), Social Media (Twitter, Facebook & LinkedIn) and Internet Strategy Planning including Design, Analytics and Mobile Marketing.
Following the acquisition of Digital Clarity in 2011 the Company has been honing its business model to be the differentiating service provider in digital marketing space to its clients and prospective business as DBMM grows into one of the leaders in the industry going forward.
Today, DBMM Group crafts, designs and executes digital marketing strategies across multiple ad platforms and social media networks for a broad array of clients to help each of them establish a uniform brand identity across the digital universe. The product offering is a unique value proposition of intelligent analytics provided by an experienced digital marketing and technology team. Therefore, DBMM Group is a blend of data, strategy and creative execution.
Going Concern
The accompanying consolidated financial statements have been prepared on a going concern basis. The financial statements do not reflect any adjustments that might result if the Company is unable to continue as a going concern.
The Company has outstanding loans and convertible notes payable aggregating $3.0 million at August 31, 2023 and doesn’t have sufficient cash on hand to satisfy such obligations. The preceding raise substantial doubt about the ability of the Company to continue as a going concern. However, the Company generated proceeds of approximately $471,000 from financing activities during fiscal 2023. The Company also has a non-binding Commitment Letter from an investor of $250,000 which also includes a right of first refusal on additional capital raise up to $3 million which will contribute to satisfying such obligations and fund any potential cash flow deficiencies from operations for the foreseeable future.
Accordingly, the accompanying consolidated financial statements have been prepared in conformity with U.S. GAAP, which contemplates continuation of the Company as a going concern and the realization of assets and satisfaction of liabilities in the normal course of business. The carrying amounts of assets and liabilities presented in the financial statements do not necessarily purport to represent realizable or settlement values. The financial statements do not include any adjustment that might result from the outcome of this uncertainty.
NOTE 2 – CORRECTION OF AN ERROR
The Company had recognized $49,500 of accrued expenses as a general reserve for legal fees with no identifiable law firm or vendors in fiscal 2011. No law firms or similar vendors have made a claim regarding this accrual or other legal expenses since fiscal 2011, and accordingly, the Company believes that this accrued expense was recorded in error. The error resulted in an overstatement of accounts payable and accrued expenses as of August 31, 2022 and accumulated deficit as of August 31, 2021. This error did not impact the Company’s consolidated statement of operations and comprehensive income and consolidated statement of cash flows. The accounts payable and accrued expenses and accumulated deficit in the accompanying consolidated balance sheets and consolidated statements of changes in stockholders’ deficit have been restated as of August 31, 2022 and August 31, 2021, respectively, to reflect the correction of the error.
NOTE 3 – SIGNIFICANT ACCOUNTING POLICIES
Basis of Consolidation
The consolidated financial statements include the accounts of the Company and its wholly owned subsidiary Stylar Ltd (DBA Digital Clarity). All significant inter-company transactions are eliminated.
Cash and Cash Equivalents
Cash and cash equivalents consist primarily of cash in banks. The Company considers cash equivalents to include all highly liquid investments with original maturities of three months or less to be cash equivalents. The Company had no cash equivalents as of August 31, 2023 or 2022.
Accounts Receivable and Allowance for Doubtful Accounts
Accounts receivable are recorded at the invoiced amount and do not bear interest. Accounts receivable are presented net of allowance for doubtful accounts.
The Company has a policy of reserving for uncollectible accounts based on its best estimate of the amount of probable credit losses in its existing accounts receivable. The Company periodically reviews its accounts receivable to determine whether an allowance is necessary based on an analysis of past due accounts and other factors that may indicate that the realization of an account may be in doubt. Account balances deemed to be uncollectible are charged to the bad debt expense after all means of collection have been exhausted and the potential for recovery is considered remote. At August 31, 2023 and 2022, the Company recognized $0 as the allowance for doubtful accounts.
Property and Equipment
Property and equipment are stated at cost, less accumulated depreciation. Depreciation is provided using the straight-line method over the estimated useful lives of the related assets (primarily three to five years).
Revenue Recognition
Revenue is recognized upon transfer of control of promised or services to customers in an amount that reflects the consideration the Company expect to receive in exchange for those services. The Company enter into contracts that can include various combinations of services, which are generally capable of being distinct and accounted for as separate performance obligations. Revenue is recognized net of any taxes collected from customers, which are subsequently remitted to governmental authorities.
Nature of Services
The Company generally provides its services to companies with international exposure, primarily located in Europe but with international exposure. The Company generally provides its services ratably over the terms of the contract and bills such services at a monthly fixed rate. Some of the services are billed quarterly. The Company’s services are sold without guarantees.
Significant Judgments
Our contracts with customers sometimes often include promises to provide multiple services to a customer. Determining whether services are considered distinct performance obligations that should be accounted for separately versus together may require significant judgment.
Judgment is required to determine Standalone Selling Price (SSP) for each distinct performance obligation. The Company uses a single amount to estimate SSP for items that are not sold separately, including set-up services, monthly search advertising services, and monthly optimization and management.
Contract Balances
Timing of revenue recognition may differ from the timing of invoicing to customers. The Company records a receivable when revenue is recognized prior to invoicing, or unearned revenue when revenue is recognized subsequent to invoicing.
The allowance for doubtful accounts reflects our best estimate of probable losses inherent in the accounts receivable balance. We determine the allowance based on known troubled accounts, historical experience, and other currently available evidence.
Advertising Costs
Advertising costs, which are included in cost of sales and general and administrative expenses in the accompanying statements of operations, are expensed when incurred. Total advertising expenses amounted to $13,729 and $0, during fiscal 2023 and 2022, respectively.
Use of Estimates
The preparation of financial statements in conformity with accounting principles generally accepted in the United States of America requires management to make estimates and assumptions that affect the reported amounts of assets and liabilities, and disclosure of contingent assets and liabilities, at the date of the financial statements and the reported amounts of revenues and expenses during the reporting period. Included in these estimates are assumptions about the collection of its accounts receivable, converted amount of cash denominated in a foreign currency, and estimated amounts of cash, the derivative liability could settle, if not in common shares. Actual results could differ from those estimates.
Income Taxes
The Company follows the provisions of the ASC 740 -10 related to, Accounting for Uncertain Income Tax Positions. When tax returns are filed, it is highly certain that some positions taken would be sustained upon examination by the taxing authorities, while others are subject to uncertainty about the merits of the position taken or the amount of the position that would be ultimately sustained. In accordance with the guidance of ASC 740-10, the benefit of a tax position is recognized in the financial statements in the period during which, based on all available evidence, management believes it is more likely than not that the position will be sustained upon examination, including the resolution of appeals or litigation processes, if any. Tax positions taken are not offset or aggregated with other positions. Tax positions that meet the more-likely-than-not recognition threshold are measured as the largest amount of tax benefit that is more than 50 percent likely of being realized upon settlement with the applicable taxing authority. The portion of the benefits associated with tax positions taken that exceeds the amount measured as described above should be reflected as a liability for uncertain tax benefits in the accompanying balance sheet along with any associated interest and penalties that would be payable to the taxing authorities upon examination. The Company believes its tax positions are all highly certain of being upheld upon examination. As such, the Company has not recorded a liability for uncertain tax benefits.
The Company has adopted ASC 740-10-25 Definition of Settlement, which provides guidance on how an entity should determine whether a tax position is effectively settled for the purpose of recognizing previously unrecognized tax benefits and provides that a tax position can be effectively settled upon the completion of an examination by a taxing authority without being legally extinguished. For tax positions considered effectively settled, an entity would recognize the full amount of tax benefit, even if the tax position is not considered more likely than not to be sustained based solely on the basis of its technical merits and the statute of limitations remains open.
Earnings (loss) per common share
The Company utilizes the guidance per FASB Codification “ASC 260 "Earnings Per Share". Basic earnings per share is calculated on the weighted effect of all common shares issued and outstanding and is calculated by dividing net income available to common stockholders by the weighted average shares outstanding during the period. Diluted earnings per share, which is calculated by dividing net income available to common stockholders by the weighted average number of common shares used in the basic earnings per share calculation, plus the number of common shares that would be issued assuming conversion of all potentially dilutive securities outstanding, is not presented separately as it is anti- dilutive. Such securities have been excluded from the per share computations as of August 31, 2023 and 2022.
Derivative Liabilities
The Company assessed the classification of its derivative financial instruments as of August 31, 2023, which consist of convertible instruments and rights to shares of the Company’s common stock and determined that such derivatives meet the criteria for liability classification under ASC 815.
ASC 815 generally provides three criteria that, if met, require companies to bifurcate conversion options from their host instruments and account for them as free-standing derivative financial instruments. These three criteria include circumstances in which (a) the economic characteristics and risks of the embedded derivative instrument are not clearly and closely related to the economic characteristics and risks of the host contract, (b) the hybrid instrument that embodies both the embedded derivative instrument and the host contract is not re-measured at fair value under otherwise applicable generally accepted accounting principles with changes in fair value reported in earnings as they occur and (c) a separate instrument with the same terms as the embedded derivative instrument would be considered a derivative instrument subject to the requirements of ASC 815. ASC 815 also provides an exception to this rule when the host instrument is deemed to be conventional, as described.
During fiscal 2023 and 2022, the Company had notes payable outstanding in which the conversion rate was variable and undeterminable. Accordingly, the Company has recognized a derivative liability in connection with such instruments. The Company uses judgment in determining the fair value of derivative liabilities at the date of issuance at every balance sheet thereafter and in determining which valuation is most appropriate for the instrument (e.g., Binomial method), the expected volatility, the implied risk-free interest rate, as well as the expected dividend rate.
Fair Value of Financial Instruments
Effective January 1, 2008, the Company adopted FASB ASC 820-Fair Value Measurements and Disclosures, or ASC 820, for assets and liabilities measured at fair value on a recurring basis. ASC 820 establishes a common definition for fair value to be applied to existing generally accepted accounting principles that require the use of fair value measurements establishes a framework for measuring fair value and expands disclosure about such fair value measurements. The adoption of ASC 820 did not have an impact on the Company’s financial position or operating results but did expand certain disclosures.
ASC 820 defines fair value as the price that would be received to sell an asset or paid to transfer a liability in an orderly transaction between market participants at the measurement date. Additionally, ASC 820 requires the use of valuation techniques that maximize the use of observable inputs and minimize the use of unobservable inputs. These inputs are prioritized below.
|
Level 1
|
Observable inputs such as quoted market prices in active markets for identical assets or liabilities.
|
|
Level 2
|
Observable market-based inputs or unobservable inputs that are corroborated by market data.
|
|
Level 3
|
Unobservable inputs for which there is little or no market data, which require the use of the reporting entity’s own assumptions.
|
The Company did not have any Level 2 or Level 3 assets or liabilities as of August 31, 2023, and 2022, with the exception of its derivative liability which are valued based on Level 3 inputs.
Cash is considered to be highly liquid and easily tradable as of August 31, 2023 and 2022 and therefore classified as Level 1 within our fair value hierarchy.
In addition, FASB ASC 825-10-25 Fair Value Option, or ASC 825-10-25, was effective January 1, 2008. ASC 825-10-25 expands opportunities to use fair value measurements in financial reporting and permits entities to choose to measure many financial instruments and certain other items at fair value. The Company did not elect the fair value options for any of its qualifying financial instruments.
Convertible Instruments
The Company evaluates and accounts for conversion options embedded in its convertible instruments in accordance with professional standards for “Accounting for Derivative Instruments and Hedging Activities”.
Professional standards generally provide three criteria that, if met, require companies to bifurcate conversion options from their host instruments and account for them as free-standing derivative financial instruments. These three criteria include circumstances in which (a) the economic characteristics and risks of the embedded derivative instrument are not clearly and closely related to the economic characteristics and risks of the host contract, (b) the hybrid instrument that embodies both the embedded derivative instrument and the host contract is not re-measured at fair value under otherwise applicable generally accepted accounting principles with changes in fair value reported in earnings as they occur and (c) a separate instrument with the same terms as the embedded derivative instrument would be considered a derivative instrument. Professional standards also provide an exception to this rule when the host instrument is deemed to be conventional as defined under professional standards as “The Meaning of “Conventional Convertible Debt Instrument”.
The Company accounts for convertible instruments (when it has determined that the embedded conversion options should not be bifurcated from their host instruments) in accordance with professional standards when “Accounting for Convertible Securities with Beneficial Conversion Features,” as those professional standards pertain to “Certain Convertible Instruments.” Accordingly, the Company records, when necessary, discounts to convertible notes for the intrinsic value of conversion options embedded in debt instruments based upon the differences between the fair value of the underlying common stock at the commitment date of the note transaction and the effective conversion price embedded in the note. Debt discounts under these arrangements are amortized over the term of the related debt to their earliest date of redemption. The Company also records when necessary deemed dividends for the intrinsic value of conversion options embedded in preferred shares based upon the differences between the fair value of the underlying common stock at the commitment date of the note transaction and the effective conversion price embedded in the note.
ASC 815-40 provides that, among other things, generally, if an event is not within the entity’s control could or require net cash settlement, then the contract shall be classified as an asset or a liability.
Stock Based Compensation
We account for the grant of stock options and restricted stock awards in accordance with ASC 718, “Compensation-Stock Compensation.” ASC 718 requires companies to recognize in the statement of operations the grant-date fair value of stock options and other equity-based compensation.
Foreign Currency Translation
Assets and liabilities of subsidiaries operating in foreign countries are translated into U.S. dollars using either the exchange rate in effect at the balance sheet date or historical rate, as applicable. Results of operations are translated using the average exchange rates prevailing throughout the year. The effects of exchange rate fluctuations on translating foreign currency assets and liabilities into U.S. dollars are included in a separate component of stockholders’ equity (accumulated other comprehensive loss), while gains and losses resulting from foreign currency transactions are included in operations.
Business Combinations
In accordance with Accounting Standards Codification 805, "Business Combinations" ("ASC 805") the Company records acquisitions under the purchase method of accounting, under which the acquisition purchase price is allocated to the assets acquired and liabilities assumed based upon their respective fair values. The Company utilizes management estimates and, in some instances, may require an independent third-party valuation firm to assist in determining the fair values of assets acquired, liabilities assumed, and contingent consideration granted. Such estimates and valuations require us to make significant assumptions, including projections of future events and operating performance.
Customer Concentration
Four and three of the Company's customers accounted for approximately 94% and 94% of its revenues during fiscal 2023 and 2022, respectively.
Recently Issued Accounting Pronouncements
Management does not believe that any other recently issued, but not yet effective, accounting standards if currently adopted would have a material effect on the accompanying consolidated financial statements.
NOTE 4 – PROPERTY AND EQUIPMENT
Property and equipment consisted of the following:
| |
|
Estimated Life
|
|
2023
|
|
|
2022
|
|
|
Computer and office equipment
|
|
3 to 5 years |
|
$ |
23,920 |
|
|
$ |
23,920 |
|
|
Less: Accumulated depreciation
|
|
|
|
|
(23,920 |
)
|
|
|
(22,500 |
)
|
| |
|
|
|
$ |
- |
|
|
$ |
1,420 |
|
Depreciation expense amounted to $1,420 and $0 during fiscal 2023 and 2022, respectively.
NOTE 5 – LOANS PAYABLE
| |
|
August 31,
|
|
| |
|
2023
|
|
|
2022
|
|
|
Loans payable
|
|
$ |
2,505,588 |
|
|
$ |
1,979,431 |
|
The loans payables are generally due on demand and have not been called, are unsecured, and are bearing interest at a range of 0-12%., with the exception of one loan payable to a financial institution. Such loan, which amounted to $34,302 at August 31, 2023 bears interest at 2.5%, is unsecured, matures in November 2027 with principal and interest payable monthly starting in November 2022. This loan is part of a Bounce Back Loan Scheme from the UK Government.
The company may have to provide alternative consideration (which may be in cash, fixed number of shares or other financial instruments) up to amounts accrued to satisfy its fixed obligations under certain unsecured loans payable. The consideration hasn’t been issued yet and is included in accrued expenses and interest expense and was valued based on the fair value of the consideration at issuance.
The aggregate schedule maturities of the Company’s loans payable outstanding as of August 31, 2023 are as follows:
|
Year ended August 31,
|
|
|
|
|
|
2024
|
|
$ |
2,478,291 |
|
|
2025
|
|
|
11,948 |
|
|
2026
|
|
|
12,708 |
|
|
2027
|
|
|
2,641 |
|
| |
|
$ |
2,505,588 |
|
NOTE 6 – CONVERTIBLE DEBENTURES
At August 31, 2023, and August 31, 2022 convertible debentures consisted of the following:
| |
|
August 31,
|
|
| |
|
2023
|
|
|
2022
|
|
|
Convertible notes payable
|
|
$ |
517,242 |
|
|
$ |
546,571 |
|
The convertible debentures matured in 2015, and bear interest at ranges between 6% and 15%. The convertible debentures are convertible at ratios varying between 45% and 50% of the closing price at the date of conversion through, at its most favorable terms for the holders, the average of the three lowest closing bids for a period of 5-30 days prior to conversion.
The Company successfully reached an agreement with a holder of convertible debentures aggregating $76,216 in principal and interest and derivative liabilities in consideration of 7,500,000 shares of the Company’s common stock, which generated a loss on extinguishment of debt of $88,784 during February 2023.
The Company successfully reached an agreement with a holder of convertible debentures aggregating $85,515 in principal and interest and derivative liabilities in consideration of 30,000,000 shares of the Company’s common stock, which generated a loss on extinguishment of debt of $82,545 during March 2022.
No convertible debentures have been issued since 2015 and none executed since 2016. Certain settlements with holders of convertible debentures have been agreed since 2018 to the Company’s benefit.
NOTE 7 – OFFICERS LOANS PAYABLE
| |
|
August 31,
|
|
| |
|
2023
|
|
|
2022
|
|
|
Officers loans payable
|
|
$ |
53,893 |
|
|
$ |
79,169 |
|
The loans payables are due on demand, are unsecured, and are non-interest bearing.
NOTE 8 – DERIVATIVE LIABILITIES
The Company accounts for the embedded conversion features included in its convertible instruments as derivative liabilities. At each measurement date, the fair value of the embedded conversion features was based on the lattice binomial method using the following assumptions:
| |
|
Years Ended August 31
|
|
| |
|
2023
|
|
|
2022
|
|
|
Effective Exercise price
|
|
|
0.0045-0.01 |
|
|
|
0.0016-0.0025 |
|
|
Effective Market price
|
|
|
0.009-0.013 |
|
|
|
0.0031 |
|
|
Volatility
|
|
|
41-77 |
% |
|
|
139 |
% |
|
Risk-free interest
|
|
|
4.74-5.18 |
% |
|
|
3.5 |
% |
|
Terms
|
|
365 days |
|
|
365 days |
|
|
Expected dividend rate
|
|
|
0 |
% |
|
|
0 |
% |
Changes in the derivative liabilities during fiscal 2023 and 2022 are as follows:
|
Balance at September 1, 2021
|
|
$ |
506,360 |
|
|
Reclassification of liability contracts
|
|
|
(23,189 |
)
|
|
Changes in fair value of derivative liabilities
|
|
|
(201,239 |
) |
|
Balance, August 31, 2022
|
|
$ |
281,932 |
|
| |
|
|
|
|
|
Reclassification of liability contracts
|
|
|
(33,386 |
)
|
|
Changes in fair value of derivative liabilities
|
|
|
(42,070 |
) |
|
Balance, August 31, 2023
|
|
$ |
206,476 |
|
NOTE 9 – ACCRUED COMPENSATION
The Company owes $1,313,536 and $1,377,136 as of August 31, 2023 and 2022, respectively, in accrued compensation and expenses to certain directors and consultants. The amounts are non-interest bearing.
NOTE 10 – COMMON STOCK AND PREFERRED STOCK
Preferred Stock- Series 1 and 2
The designation of the Preferred Stock- Series 1 is as follows: Authorized 2,000,000 shares, par value of $0.001. One share of the Company’s Preferred Stock- Series is convertible into 53.04 shares of the Company’s common stock, at the holder’s option and with the Company’s acquiescence, and has three votes per share.
The designation of the Preferred Stock- Series 2 is as follows: Authorized 2,000,000 shares, par value of $0.001. One share of the Company’s Preferred Stock- Series is convertible into one share of the Company’s common stock, at the holder’s option and with the Company’s acquiescence, and has no voting rights.
Common Stock
The Authorized Shares increased to 2,000,000,000 in April 4, 2016.
The Company successfully reached an agreement with a holder of convertible debentures aggregating $76,216 in principal and interest and derivative liabilities in consideration of 7,500,000 shares of the Company’s common stock, which generated a loss on extinguishment of debt of $88,784 during February 2023.
The Company successfully reached an agreement with a holder of convertible debentures aggregating $85,515 in principal and interest and derivative liabilities in consideration of 30,000,000 shares of the Company’s common stock, which generated a loss on extinguishment of debt of $82,545 during March 2022.
The Company issued 30,000,000 shares of its common stock at a carrying value of $19,000 as a consideration to commitment initially granted to a lender in fiscal 2019. No gains or losses were recognized upon issuance of the shares.
NOTE 11 – OTHER INCOME
The Company received tax credits of $46,255 and $98,265 related to expenses incurred in the United Kingdom local governmental entity during fiscal 2023 and 2022, respectively.
NOTE 12 – COMMITMENTS AND CONTINGENCIES
Leases
The Company leases its facilities under non-cancellable operating leases which are renewable monthly as it is evaluating larger quarters. The leases have monthly base rents. The latest monthly base rent for the Company’s facilities ranges is less than $1,000.
Total rental expense amounted to $26,781, and $7,063 during fiscal 2023 and 2022, respectively.
The Company successfully reached an agreement with one its lessors to reduce its liability by $15,435 in April 2023 which was recorded net of its loss on extinguishment of debt during fiscal, 2023.
Consulting Agreement
The annual compensation of Linda Perry is $150,000 for her role as a consultant and as Executive Director for US ( as well as Principal Executive and Financial Officer) interfaces to provide oversight regarding external regulatory reporting requirements. In addition, Ms. Perry is the lead executive for capital funding requirements and business development. The agreement has a rolling three-year term through September 2025.
Legal Matters
From time to time, the Company has become or may become involved in certain lawsuits and legal proceedings which arise in the ordinary course of business. The Company intends to vigorously defend its positions. However, litigation is subject to inherent uncertainties and an adverse result in those or other matters may arise from time to time that may harm its financial position, or our business and the outcome of these matters cannot be ultimately predicted.
NOTE 13 – INCOME TAXES
For the years ended August 31, 2023, and 2022, the benefit for income taxes differed from the amounts computed by applying the statutory federal income tax rate at which rate the tax benefits is expected to occur. The reconciliation is as follows:
| |
|
Years Ended August 31
|
|
| |
|
2023
|
|
|
2022
|
|
|
Benefit computed at statutory rate
|
|
$ |
150,000 |
|
|
$ |
132,000 |
|
|
State tax (benefit), net of federal affect
|
|
|
31,000 |
|
|
|
27,000 |
|
|
Permanent differences (primarily change in fair value of derivative liability)
|
|
|
11,000 |
|
|
|
(51,000 |
)
|
|
Increase in valuation allowance
|
|
|
(192,000 |
)
|
|
|
(108,000 |
)
|
|
Net income tax benefit
|
|
$ |
- |
|
|
$ |
- |
|
The Company has net operating loss carry-forward for income tax totaling purposes approximately $6.4 million at August 31, 2022. A significant portion of these carryforwards is subject to annual limitations due to “equity structure shifts” or “owner shifts” involving “five percent shareholders” (as defined in the Internal Revenue Code) which results in a more than fifty percent change in ownership.
The net deferral tax asset is as follows:
| |
|
Years Ended August 31
|
|
| |
|
2023
|
|
|
2022
|
|
|
Net operating loss carry-forward
|
|
$ |
1,845,000 |
|
|
$ |
1,638,000 |
|
|
Accrued compensation
|
|
|
333,000 |
|
|
|
349,000 |
|
|
Valuation allowance
|
|
|
(2,178,000 |
)
|
|
|
(1,987,000 |
)
|
|
Net deferred tax asset
|
|
$ |
- |
|
|
$ |
- |
|
NOTE 14 – FOREIGN OPERATIONS
As of August 31, 2023, all of our revenues and a majority of our assets are associated with subsidiaries located in the United Kingdom. Assets and revenues as of and for the respective periods were as follows:
| |
|
United States
|
|
|
Great Britain
|
|
|
Total
|
|
|
Revenues
|
|
$ |
- |
|
|
$ |
309,644 |
|
|
$ |
309,644 |
|
|
Total revenues
|
|
|
- |
|
|
|
309,644 |
|
|
|
309,644 |
|
|
Identifiable assets at August 31, 2023
|
|
|
7,289 |
|
|
|
58,186 |
|
|
|
65,730 |
|
As of August 31, 2019, a majority of revenues and assets are associated with subsidiaries located in the United Kingdom. Assets and revenues for the year ended August 31, 2022, were as follows:
| |
|
United States
|
|
|
Great Britain
|
|
|
Total
|
|
|
Revenues
|
|
$ |
- |
|
|
$ |
225,842 |
|
|
$ |
225,842 |
|
|
Total revenues
|
|
|
- |
|
|
|
225,842 |
|
|
|
225,842 |
|
|
Identifiable assets at August 31, 2022
|
|
|
9,170 |
|
|
|
22,467 |
|
|
|
31,637 |
|
NOTE 15 – SUBSEQUENT EVENTS
The Company has analyzed its operations subsequent to August 31, 2023, through the date these financial statements were issued, and has determined that it does not have any material subsequent events requiring disclosure or accrual.
ITEM 9. CHANGES IN AND DISAGREEMENTS WITH ACCOUNTANTS ON ACCOUNTING AND FINANCIAL DISCLOSURE.
There are not currently and have not been any disagreements between us and our accountants on any matter of accounting principles, practices or financial statement disclosure.
ITEM 9A. CONTROLS AND PROCEDURES
Our management is responsible for establishing and maintaining a system of disclosure controls and procedures (as defined in Rule 13a-15(e) and 15d-15(e) under the Exchange Act) that is designed to ensure that information required to be disclosed by us in the reports that we file or submit under the Exchange Act is recorded, processed, summarized and reported, within the time periods specified in the Commission’s rules and forms. Disclosure controls and procedures include, without limitation, controls and procedures designed to ensure that information required to be disclosed by an issuer in the reports that it files or submits under the Exchange Act is accumulated and communicated to the issuer’s management, including its principal executive officer or officers and principal financial officer or officers, or persons performing similar functions, as appropriate to allow timely decisions regarding required disclosure.
As of the end of the period covered by this report, management, including our Principal Executive Officer and Principal Financial Officer, evaluated the effectiveness of our disclosure controls and procedures pursuant to Rules 13a-15(e) and 15d-15(e) under the Act.
Based upon the evaluation, our Principal Executive Officer and Principal Financial Officer concluded that our disclosure controls and procedures were effective as of August 31, 2023. Our management concluded that the consolidated financial statements included in this report fairly present, in all material respects, our financial position, results of operations and cash flows for the periods presented in accordance with GAAP.
Management’s Annual Report on Internal Control Over Financial Reporting:
Our management is responsible for establishing and maintaining adequate internal controls over financial reporting as defined in Rules 13 a-15(f) of the Exchange Act.
Our management conducted an evaluation of the effectiveness of its internal controls over financial reporting, as of August 31, 2023, based on the framework and criteria established in “Internal Control - Integrated Framework”, issued by the Committee of Sponsoring Organizations of the Treadway Commission (“COSO”) in the Internal Control-Integrated Framework (2013). This evaluation included review of the documentation of controls, evaluation of the design effectiveness of controls, testing of the operating effectiveness of controls and a conclusion on this evaluation. Based on this evaluation, management concluded that our internal control over financial reporting as required under item 308(a) of Regulations S-K in our Annual Report on Form 10-K, filed with the commission for the year ended August 31, 2023 was effective.
Management believes that a controls system, no matter how well designed and operated, cannot provide absolute assurance that the objectives of the controls system are met, and no evaluation of controls can provide absolute assurance that all control issues and instances of fraud, if any, within a company have been detected.
This Annual Report on Form 10-K does not include an attestation report from our registered public accounting firm regarding internal control over financial reporting. Management’s report was not subject to attestation by our registered public accounting firm pursuant to SEC rules that permit us to provide only management’s report in this Annual Report on Form 10-K.
Changes in Internal Controls Over Financial Reporting:
There were no changes in our internal control over financial reporting during the quarter ended August 31, 2023 identified in connection with the evaluation thereof by our management, including our Principal Executive Officer and Principal Financial Officer, that have materially affected, or are reasonably likely to materially affect, our internal control over financial reporting.
PART III MANAGEMENT
ITEM 10. DIRECTORS, EXECUTIVE OFFICERS AND CORPORATE GOVERNANCE
Executive Officers and Directors
The following table sets forth certain information, as of August 31, 2023, with respect to our directors and executive officers.
Directors serve until the next annual meeting of the stockholders; until their successors are elected or appointed and qualified, or until their prior resignation or removal. Officers serve for such terms as determined by our board of directors. Each officer holds office until such officer’s successor is elected or appointed and qualified or until such officer’s earlier resignation or removal. No family relationships exist between any of our present directors and officers.
|
Name
|
Position
|
|
Reggie James
|
Chief Operating Officer, Senior Vice President and Executive Director
|
|
Linda Perry
|
Principal Executive Officer, Principal Financial Officer and Executive Director
|
The following is a brief account of the business experience of each of our Directors and Executive Officers:
Reggie James, As of April 1, 2011, Mr. Reggie James has served as Senior Vice President of Marketing and Communications and Executive Director. Mr. James also is the Managing Director of Digital Clarity. In 2013, he was appointed Co-Chief Operating Officer, and in August 2022, Chief Operating Officer. Mr. James has been involved in the commercial element of the internet since its inception and has been instrumental in driving forward business models that are common place today.
Mr. James is the founder of Digital Clarity, a leading Digital Advertising Agency and a wholly owned business of DBMM. The Company helps major brands and medium sized companies take advantage of the digital economy focusing on areas such as Search Engine Marketing (Google, Yahoo! & Bing), Social Media (Twitter, Facebook & LinkedIn) and Internet Strategy Planning including Design, Analytics and Mobile Marketing. Mr. James launched the European division of a later VoIP technology company that became the first dot com to list on the Singapore Stock Exchange later acquired by Spice Communications. Subsequently, Spice was acquired by Idea Cellular, the 3rd largest mobile services operator in India. Mr. James is also the co-founder of an internet analytics technology software house as well as shareholder in an AIM listed marketing services company. AIM is the London Stock Exchange’s international market for smaller growing companies. Previously, Mr. James was involved with the publishing groups VNU & Ziff-Davis where he launched titles such as Management Consultancy and IT Week. Prior to launching Digital Clarity, Mr. James was part of the global sales team at leading search company AltaVista where he managed global brands such as Compaq and Hewlett Packard (HP). AltaVista was acquired by Yahoo! Inc.
Linda Perry, Ms. Perry is currently Principal Executive Officer, Principal Financial Officer and an Executive Director. She has had an extensive career in global and entrepreneurial businesses. Ms. Perry consults to several companies globally and is industry agnostic. While living in Europe, she was the senior advisor to the Board of Directors of The Balli Group, where her role was to integrate the acquisition of Klockner & Co. The acquisition resulted in the creation of the world’s largest steel, multi-metal, distribution, and trading company. Prior to that, she was appointed a director and a member of the Executive Committee of Churchill Insurance Group, Plc., a division of the Credit Suisse Group. The Company was re-organized and sold within the industry for £2.3 billion GBP. She was a senior executive at ExxonMobil Corporation holding senior management positions with global responsibility in finance, marketing, and organization (described as corporate governance, management succession and executive compensation.) The latter role was under the aegis of the Board of Directors, entitled Compensation, Organization and Executive Development Committee/COED, of which she was a member. Ms. Perry holds an MBA from Harvard University. She has been a visiting lecturer/professor at IMD, Lausanne, Switzerland, INSEAD, Fontainebleau, France and the Stern School of Business at New York University throughout her career.
We believe that all our directors are qualified to serve on our board of directors based on their experience and the diversity of background.
Board Committees
We currently have standing committees on our Board of Directors. The audit committee and nomination /compensation committee are listed below.
Audit Committee
We have established an Audit Committee of the Board of Directors. The Audit Committee duties include a recommendation to our Board of Directors the engagement of independent auditors to audit our financial statements and to review our accounting and auditing principles. The audit committee will review the scope, timing and fees for the annual audit and the results of audit examinations performed by the internal auditors and independent public accountants, including their recommendations to improve the system of accounting and internal controls.
Nomination/Compensation Committee
We have established a Nomination/Compensation Committee of the Board of Directors. The Nomination/Compensation Committee reviews and approves our total remuneration, including compensation of executive officers. The Nomination/Compensation Committee will also administer our stock option plans and recommend and approve grants of stock options under such plans.
Compensation of Directors
All directors are officers and their compensation are included on the summary compensation table (Item 11).
Compliance with Section 16(A) of the Exchange Act
Our common stock was registered pursuant to Section 12 of the Exchange Act during the fiscal years ended August 31, 2023 and 2022. Accordingly, our officers, directors and principal shareholders were subject to the beneficial ownership reporting requirements of Section 16(a) of the Exchange Act during each year.
Code of Ethics
On December 1, 2004 we adopted a Code of Ethics that applies to our Principal Executive Officer, Principal Financial Officer, Principal Accounting Officer and Controller and to persons performing similar functions. A copy of our Code of Ethics was previously filed as an Exhibit to our annual report on Form 10-KSB for the year ended August 31, 2004. A copy of our Code of Ethics will be provided to any person requesting same without charge. To request a copy of our Code of Ethics please make written request to DBMM.
ITEM 11. EXECUTIVE COMPENSATION
SUMMARY COMPENSATION TABLE
None of our executive officers or employees received compensation in excess of $100,000 during the years ended August 31, 2023 or 2022, except as follows:
|
Name Principal Position
|
|
Fiscal Year Ended
August 31,
|
|
($)
Salary
|
|
|
($)
Bonus
|
|
|
($)
Stock awards
|
|
|
($)
Option awards
|
|
|
($)
Nonequity incentive
plan compensation
|
|
|
($)
Nonqualified deferred compensation earnings
|
|
|
($)
All other
Compensation
|
|
|
($)
Total
|
|
|
Reggie James
|
|
2023
|
|
$
|
192,101
|
(1)
|
|
|
-
|
|
|
|
-
|
|
|
|
-
|
|
|
|
-
|
|
|
|
-
|
|
|
|
-
|
|
|
$
|
192,101
|
|
|
Executive Director
|
|
2022
|
|
$
|
208,572
|
(2)
|
|
|
-
|
|
|
|
-
|
|
|
|
-
|
|
|
|
-
|
|
|
|
-
|
|
|
|
-
|
|
|
$
|
208,572
|
|
|
|
|
|
|
|
|
|
|
|
|
|
|
|
|
|
|
|
|
|
|
|
|
|
|
|
|
|
|
|
|
|
|
|
|
|
|
Linda Perry
|
|
2023
|
|
$
|
150,000
|
(3)
|
|
|
-
|
|
|
|
-
|
|
|
|
-
|
|
|
|
-
|
|
|
|
-
|
|
|
|
-
|
|
|
$
|
150,000
|
|
|
Executive Director
|
|
2022
|
|
$
|
150,000
|
(3)
|
|
|
-
|
|
|
|
-
|
|
|
|
-
|
|
|
|
-
|
|
|
|
-
|
|
|
|
-
|
|
|
$
|
150,000
|
|
|
(1)
|
For the fiscal year ending August 31, 2023, Mr. James earned $ 208,572 of which $150,941 has been paid to Reggie James. $54,000 remains unpaid.
|
|
|
|
|
(2)
|
For the fiscal year ending August 31, 2022, Mr. James earned $ 208,572 of which $154,573 has been paid to Reggie James. $54,000 remains unpaid.
|
|
|
|
|
(3)
|
For the fiscal years ended August 31, 2023, and 2022, Ms. Perry earned $150,000 each year of which $0 has been paid, $300,000 remains unpaid.
|
OPTION/SAR GRANTS IN LAST FISCAL YEAR
No stock appreciation rights were granted to the named executives during the fiscal years ended August 31, 2023 and 2022.
LONG TERM INCENTIVE PLAN AWARDS
No long-term incentive plan awards to the named executive officers during the fiscal years ended August 31, 2023 and 2022.
EMPLOYMENT CONTRACTS, TERMINATION OF EMPLOYMENT, AND CHANGE-IN-CONTROL ARRANGEMENTS
In April 2011 the Company agreed to compensate a Company Officer, Reggie James, for monthly remuneration of $4,500 for his duties as Senior Vice President and Executive Director of DBMM and Digital Clarity. Mr. James was appointed Co-Chief Operating Officer during fiscal year 2013, and in August, 2021 Chief Operating Officer.
In September 2010 the Company agreed to compensate a Company Officer, Linda Perry, for annual remuneration of $150,000 for her role as a consultant and as Executive Director. She also was appointed Principal Executive Officer and Principal Financial Officer, in October 2011, for US interface to provide oversight for external regulatory reporting requirements. In addition, Ms. Perry is lead executive for capital funding requirements and business development.
REPORT ON REPRICING OF OPTIONS/SARS
During the fiscal years ended August 31, 2023, and 2022 we did not adjust or amend the exercise price of any stock options or SARs.
ITEM 12. SECURITY OWNERSHIP OF CERTAIN BENEFICIAL OWNERS AND MANAGEMENT AND RELATED STOCKHOLDER MATTERS.
The following table sets forth information with respect to the beneficial ownership of our common stock known by us as of August 31, 2023 by, (i) each of our directors, (ii) each of our executive officers, and (iii) all of our directors and executive officers as a group. The percentages in the table have been calculated on the basis of treating as outstanding for a particular person, all shares of our common stock outstanding on such date and all shares of our common stock issuable to such holder in the event of exercise of outstanding options, warrants, rights or conversion privileges owned by such person at said date which are exercisable within 60 days of such date. Except as otherwise indicated, the persons listed below have sole voting and investment power with respect to all shares of our common stock owned by them, except to the extent such power may be shared with a spouse.
Name of Beneficial Owner and/or Beneficially Own Shares of Restricted Common Stock percentage owned:
|
(1) Reggie James*
|
|
|
7,982,328
|
|
|
|
0.96
|
%
|
|
|
|
|
|
|
|
|
|
|
|
(2) Linda Perry*
|
|
|
7,972,579
|
|
|
|
0.96
|
%
|
|
|
|
|
|
|
|
|
|
|
|
All Directors and Executive Officers as a Group (2 persons)
|
|
|
15,954,907
|
|
|
|
|
|
The officers as a group hold 1,200,000 Restricted Preferred Shares, under the designation terms of Preferred Stock-Series 1.
ITEM 13. CERTAIN RELATIONSHIPS AND RELATED TRANSACTIONS
None.
ITEM 14. PRINCIPAL ACCOUNTANT FEES AND SERVICES.
Audit Fees
The aggregate fees billed to us by our principal accountants for services rendered during fiscal 2023 and 2022 are set forth in the table below:
| |
|
2023
|
|
|
2022
|
|
|
Audit Fees (1)
|
|
$ |
35,375 |
|
|
$ |
34,500 |
|
|
|
(1)
|
Audit fees represent fees for professional services provided in connection with the audit of our annual financial statements and review of our quarterly financial statements and audit services provided in connection with other statutory or regulatory filings.
|
Audit Related Fees. We incurred fees to our independent auditors of $-0- for audit related fees during fiscal years ended August 31, 2023, and 2022.
Tax and Other Fees. We incurred fees to our independent auditors of $-0- for tax and other fees during the fiscal years ended August 31, 2023, and 2022.
Audit Committee’s Pre-Approval Practice.
For fiscal years ended August 31, 2023 and 2022, the Audit Committee pre-approved all audit and permissible non-audit services provided by our independent auditors.
PART IV
ITEM 15. EXHIBITS
The following Exhibits are being filed with this Annual Report on Form 10-K:
|
Exhibit Number
|
Description
|
|
3.1(1)
|
Articles of Incorporation of the Registrant, as amended.
|
|
3.2(8)
|
By-laws of the Registrant, as amended.
|
|
10.3(4)
|
Share Exchange Agreement, dated March 20, 2007, by and among the Company, Atlantic Network Holdings Limited, New Media Television (Europe) Limited and the Outside Stockholders Listed on Exhibit A Thereto.
|
|
10.1(5)
|
Share Exchange Agreement, dated March 30, 2010, between Digital Brand Media & Marketing Group, Inc., and Cloud Channel Limited.
|
|
10.2(5)
|
Rescission Resolution of Share Exchange Agreement, dated March 20, 2007, by and among Digital Brand Media & Marketing Group, Inc., Atlantic Network Holdings Limited, the Outside Stockholders Listed on Exhibit A thereto and New Media Television (Europe) Limited.
|
|
10.3(5)
|
Share purchase Agreement between Cloud Channel Limited and Bitemark MC Limited.
|
|
10.4(5)
|
Share purchase Agreement between Cloud Channel Limited and Stylar Limited.
|
|
10.4(6)
|
Amendment to Share Exchange Agreement, dated March 31, 2010, between Digital Brand Media & Marketing Group, Inc., and Cloud Channel Limited.
|
|
10.5(6)
|
Amendment to Share Purchase Agreement between Cloud Channel Limited and Bitemark MC Limited.
|
|
10.6(6)
|
Amendment to Share Purchase Agreement between Cloud Channel Limited and Stylar Limited.
|
|
10.7(8)
|
Rescission Resolution of Share Exchange Agreement, dated March 31, 2010, between Digital Brand Media & Marketing Group, Inc. and Bitemark MC Limited
|
|
10.8(9)
|
Agreement to purchase LLC interests
|
|
10.9(10)
|
Amendment to agreement to purchase LLC interests
|
|
10.10(11)
|
Mutual Rescission and Release
|
|
14.1(3)
|
Code of Ethics
|
|
31.1*
|
Section 302 Certification of Executive Director
|
|
32.1*
|
Section 906 Certification of Executive Director
|
|
101.INS*
|
Inline XBRL Instance Document
|
|
101.SCH*
|
Inline XBRL Taxonomy Extension Schema Document
|
|
101.CAL*
|
Inline XBRL Taxonomy Extension Calculation Linkbase Document
|
|
101.DEF*
|
Inline XBRL Taxonomy Extension Definition Linkbase Document
|
|
101.LAB*
|
Inline XBRL Taxonomy Extension Label Linkbase Document
|
|
101.PRE*
|
Inline XBRL Taxonomy Extension Presentation Linkbase Document
|
|
104
|
Cover Page Interactive Data File (formatted as Inline XBRL and contained in Exhibit 101)
|
(1) Previously filed as an exhibit to the Company’s Registration Statement on Form SB-2 filed with the Commission on March 27, 2002.
(3) Previously filed as an exhibit to the Company’s Annual Report on Form 10-KSB for the year ended August 31, 2004.
(4) Previously filed as an exhibit to the Company’s Current Report on Form 8-K filed with the Commission on March 21, 2007.
(5) Previously filed as an exhibit to the Company’s Current Report on Form 8-KA filed with the Commission on April 9, 2010.
(6) Previously filed as an exhibit to the Company’s Current Report on Form 8-KA filed with the Commission on July 15, 2010.
(8) Previously filed as an exhibit to the Company’s Annual Report on Form 10-K for the year ended August 31, 2011.
(9) Previously filed as an exhibit to the Company’s Current Report on Form 8-K Filed with the Commission on June 12, 2012.
(10) Previously filed as an exhibit to the Company’s Annual Report on Form 10-K for the year ended August 31, 2012.
(11) Previously filed as an exhibit to the Company’s Quarterly Report on Form 10-Q for the quarter ended May 31, 2013.
* Filed herewith
Signatures
Pursuant to the requirements of Section 13 or 15(d) of the Securities Exchange Act of 1934, as amended, the registrant has duly caused this report to be signed on its behalf by the undersigned, thereunto duly authorized.
|
|
DIGITAL BRAND MEDIA & MARKETING GROUP, INC.
|
|
|
|
|
|
|
Date: November 29, 2023
|
By:
|
/s/ Linda Perry
|
|
|
|
|
Principal Executive Officer
Principal Financial Officer
Executive Director
|
|
In accordance with the Exchange Act, this report has been signed below by the following persons on behalf of the registrant and in the capacities and on the dates indicated.
|
|
|
|
|
|
Date: November 29, 2023
|
By:
|
/s/ Linda Perry
|
|
|
|
|
Principal Executive Officer
Principal Financial Officer
Executive Director
|
|
NONE
http://fasb.org/us-gaap/2023#DerivativeGainLossOnDerivativeNet
http://fasb.org/us-gaap/2023#DerivativeGainLossOnDerivativeNet
false
FY
0001127475
0001127475
2022-09-01
2023-08-31
0001127475
2023-08-31
0001127475
2023-11-29
0001127475
2022-08-31
0001127475
dbmm:PreferredStockSeries1Member
2023-08-31
0001127475
dbmm:PreferredStockSeries1Member
2022-08-31
0001127475
dbmm:PreferredStockSeries2Member
2023-08-31
0001127475
dbmm:PreferredStockSeries2Member
2022-08-31
0001127475
2021-09-01
2022-08-31
0001127475
dbmm:PreferredStockSeries1Member
us-gaap:PreferredStockMember
2023-08-31
0001127475
dbmm:PreferredStockSeries1Member
us-gaap:PreferredStockMember
2022-08-31
0001127475
dbmm:PreferredStockSeries2Member
us-gaap:PreferredStockMember
2023-08-31
0001127475
dbmm:PreferredStockSeries2Member
us-gaap:PreferredStockMember
2022-08-31
0001127475
us-gaap:CommonStockMember
2022-08-31
0001127475
us-gaap:CommonStockMember
2021-08-31
0001127475
us-gaap:CommonStockMember
2022-09-01
2023-08-31
0001127475
us-gaap:CommonStockMember
2021-09-01
2022-08-31
0001127475
us-gaap:CommonStockMember
2023-08-31
0001127475
us-gaap:AdditionalPaidInCapitalMember
2022-08-31
0001127475
us-gaap:AdditionalPaidInCapitalMember
2021-08-31
0001127475
us-gaap:AdditionalPaidInCapitalMember
2022-09-01
2023-08-31
0001127475
us-gaap:AdditionalPaidInCapitalMember
2021-09-01
2022-08-31
0001127475
us-gaap:AdditionalPaidInCapitalMember
2023-08-31
0001127475
us-gaap:AccumulatedOtherComprehensiveIncomeMember
2022-08-31
0001127475
us-gaap:AccumulatedOtherComprehensiveIncomeMember
2021-08-31
0001127475
us-gaap:AccumulatedOtherComprehensiveIncomeMember
2022-09-01
2023-08-31
0001127475
us-gaap:AccumulatedOtherComprehensiveIncomeMember
2021-09-01
2022-08-31
0001127475
us-gaap:AccumulatedOtherComprehensiveIncomeMember
2023-08-31
0001127475
us-gaap:RetainedEarningsMember
2022-08-31
0001127475
us-gaap:RetainedEarningsMember
2021-08-31
0001127475
us-gaap:RetainedEarningsMember
2022-09-01
2023-08-31
0001127475
us-gaap:RetainedEarningsMember
2021-09-01
2022-08-31
0001127475
us-gaap:RetainedEarningsMember
2023-08-31
0001127475
2021-08-31
0001127475
2011-08-31
0001127475
srt:MinimumMember
2023-08-31
0001127475
srt:MaximumMember
2023-08-31
0001127475
dbmm:FourCustomersMember
us-gaap:SalesRevenueNetMember
us-gaap:CustomerConcentrationRiskMember
2022-09-01
2023-08-31
0001127475
dbmm:ThreeCustomersMember
us-gaap:SalesRevenueNetMember
us-gaap:CustomerConcentrationRiskMember
2021-09-01
2022-08-31
0001127475
2023-02-01
2023-02-28
0001127475
2022-03-01
2022-03-31
0001127475
srt:MinimumMember
2022-08-31
0001127475
srt:MaximumMember
2022-08-31
0001127475
srt:MinimumMember
us-gaap:MeasurementInputPriceVolatilityMember
2023-08-31
0001127475
srt:MaximumMember
us-gaap:MeasurementInputPriceVolatilityMember
2023-08-31
0001127475
us-gaap:MeasurementInputPriceVolatilityMember
2022-08-31
0001127475
srt:MinimumMember
us-gaap:MeasurementInputRiskFreeInterestRateMember
2023-08-31
0001127475
srt:MaximumMember
us-gaap:MeasurementInputRiskFreeInterestRateMember
2023-08-31
0001127475
us-gaap:MeasurementInputRiskFreeInterestRateMember
2022-08-31
0001127475
us-gaap:MeasurementInputExpectedTermMember
2023-08-31
0001127475
us-gaap:MeasurementInputExpectedTermMember
2022-08-31
0001127475
us-gaap:MeasurementInputExpectedDividendRateMember
2023-08-31
0001127475
us-gaap:MeasurementInputExpectedDividendRateMember
2022-08-31
0001127475
dbmm:PreferredStockSeries1Member
2022-09-01
2023-08-31
0001127475
dbmm:PreferredStockSeries2Member
2022-09-01
2023-08-31
0001127475
2016-04-04
0001127475
srt:MinimumMember
2022-09-01
2023-08-31
0001127475
2023-04-01
2023-04-30
0001127475
country:US
2022-09-01
2023-08-31
0001127475
country:GB
2022-09-01
2023-08-31
0001127475
country:US
2023-08-31
0001127475
country:GB
2023-08-31
0001127475
country:US
2021-09-01
2022-08-31
0001127475
country:GB
2021-09-01
2022-08-31
0001127475
country:US
2022-08-31
0001127475
country:GB
2022-08-31
iso4217:USD
xbrli:shares
iso4217:USD
xbrli:shares
xbrli:pure
dbmm:Percentage
I, Linda Perry, Executive Director, Principal Executive Officer, Principal Financial Officer, of Digital Brands Media and Marketing Group, Inc., certify that:
1. I have reviewed this Annual Report on Form 10-K of Digital Brands Media and Marketing Group, Inc.
2. Based on my knowledge, this report does not contain any untrue statement of a material fact or omit to state a material fact necessary to make the statements made, in light of the circumstances under which such statements were made, not misleading with respect to the period covered by this report.
3. Based on my knowledge, the financial statements, and other financial information included in this report, fairly present in all material respects the financial condition, results of operations and cash flows of the registrant as of, and for, the periods presented in this report.
4. The registrant’s other certifying officer and I are responsible for establishing and maintaining disclosure controls and procedures (as defined in Exchange Act Rules 13a-15(e) and 15d-15(e)) and internal control over financial reporting (as defined in Exchange Act Rules 13a-15(f) and 15d-15(f)) for the registrant and have:
5. The registrant’s other certifying officer and I have disclosed, based on our most recent evaluation of internal control over financial reporting, to the registrant’s auditors and the audit committee of the registrant’s board of directors (or persons performing the equivalent functions):
In connection with the Annual Report of Digital Brands Media and Marketing Group, Inc. (the “Company”) on Form 10-K for the period ending August 31, 2023, as filed with the Securities and Exchange Commission on the date hereof (the “Report”), I, Linda Perry, Executive Director, Principal Executive Officer, Principal Financial Officer, of the Company, certify, pursuant to 18 U.S.C. Section 1350, as adopted pursuant to Section 906 of the Sarbanes-Oxley Act of 2002, that:
1. The Report fully complies with the requirements of Section 13(a) or 15(d) of the Securities Exchange Act of 1934; and
2. The information contained in the Report fairly presents, in all material respects, the financial condition and results of operations of the Company.