UNITED STATES
SECURITIES AND EXCHANGE COMMISSION
Washington, D.C. 20549
FORM
6-K
REPORT
OF FOREIGN PRIVATE ISSUER
PURSUANT
TO RULE 13a-16 OR 15d-16
UNDER
THE SECURITIES EXCHANGE ACT OF 1934
For
the Month of: November, 2023
Commission
File Number: 001-39557
Siyata
Mobile Inc.
(Translation
of registrant’s name into English)
7404
King George Blvd., Suite 200, King’s Cross
Surrey,
British Columbia V3W 1N6, Canada
(Address
of principal executive office)
Indicate
by check mark whether the registrant files or will file annual reports under cover of Form 20-F or Form 40-F:
☒ Form
20-F ☐ Form 40-F
On
November 15, 2023, Siyata Mobile Inc., a British Columbia (Canada) company that is a global vendor of Push-to-Talk over Cellular (“PoC”)
devices and of cellular signal booster systems, issued its unaudited interim condensed consolidated financial statements as at September
30, 2023 and December 31, 2022, and for the three and nine months ended September 30, 2023 and 2022, a copy of which is attached hereto
as Exhibit 99.1 and its Management’s Discussion and Analysis For the Three Month and Nine Months Ended September 30, 2023 as at
November 15, 2023, a copy of which is attached hereto as Exhibit 99.2.
The Company issued a press release regarding the
financial statements, a copy of which is attached as Exhibit 99.3 to this Form 6-K.
EXHIBIT
INDEX
Pursuant
to the requirements of the Securities Exchange Act of 1934, the Registrant has duly caused this report to be signed on its behalf by
the undersigned hereunto duly authorized.
| Date:
November 15, 2023 |
SIYATA
MOBILE INC. |
| |
|
|
| |
By: |
/s/
Marc Seelenfreund |
| |
Name: |
Marc
Seelenfreund |
| |
Title: |
Chief
Executive Officer |
2
Exhibit 99.1
Notice
of No Auditor review of condensed interim consolidated financial statements
The Management of the Company is responsible for
the preparation of the accompanying unaudited condensed interim consolidated financial statements. The unaudited condensed interim consolidated
financial statements have been prepared using accounting policies in compliance with International Financial Reporting Standards (“IFRS”)
for the preparation of consolidated interim financial statements and are in accordance with International Accounting Standards (“IAS”)
34 – Interim Financial Reporting.
The Company’s independent auditor has not
performed a review of these condensed interim consolidated financial statements in accordance with the standards established by the Chartered
Professional Accountants of Canada for a review of interim financial statements by an entity’s auditor.
Siyata Mobile Inc.
Unaudited Condensed Interim Consolidated Statements of Financial Position
(Expressed in US dollars)
| | |
September 30,
2023 | | |
December 31,
2022 | |
| ASSETS | |
| | |
| |
| Current | |
| | |
| |
| Cash | |
$ | 366,155 | | |
$ | 1,913,742 | |
| Trade and other receivables (Note 3) | |
| 2,179,246 | | |
| 1,574,628 | |
| Prepaid expenses | |
| 228,478 | | |
| 173,504 | |
| Inventory (Note 4) | |
| 2,901,914 | | |
| 4,092,550 | |
| Advance to suppliers | |
| 1,541,809 | | |
| 155,852 | |
| | |
| 7,217,602 | | |
| 7,910,276 | |
| Long term receivable | |
| 136,749 | | |
| 150,185 | |
| Right of use assets | |
| 666,274 | | |
| 887,137 | |
| Equipment | |
| 180,432 | | |
| 207,402 | |
| Intangible assets | |
| 7,996,315 | | |
| 6,987,531 | |
| Total assets | |
$ | 16,197,372 | | |
$ | 16,142,531 | |
| | |
| | | |
| | |
| LIABILITIES AND SHAREHOLDERS’ EQUITY | |
| | | |
| | |
| Current | |
| | | |
| | |
| Bank loan (Note 5) | |
$ | 531,521 | | |
$ | - | |
| Accounts payable and accrued liabilities | |
| 2,589,219 | | |
| 3,078,650 | |
| Deferred revenue | |
| - | | |
| 149,600 | |
| Lease obligations | |
| 329,433 | | |
| 303,788 | |
| Warrant liability (Note 7) | |
| 13,923 | | |
| 2,734,804 | |
| | |
| 3,464,096 | | |
| 6,266,842 | |
| Lease obligations | |
| 396,242 | | |
| 635,217 | |
| Total liabilities | |
| 3,860,338 | | |
| 6,902,059 | |
| Shareholders’ equity | |
| | | |
| | |
| Share capital (Note 8) | |
| 84,702,612 | | |
| 73,312,866 | |
| Reserves (Note 8) | |
| 14,421,004 | | |
| 13,647,399 | |
| Accumulated other comprehensive loss | |
| 98,870 | | |
| 98,870 | |
| Deficit | |
| (86,885,452 | ) | |
| (77,818,663 | ) |
| | |
| 12,337,034 | | |
| 9,240,472 | |
| Total liabilities and shareholders’ equity | |
$ | 16,197,372 | | |
$ | 16,142,531 | |
| Nature of operations and going concern (Note 1) |
|
|
| Subsequent events (Note 17) |
|
|
| |
|
|
| Approved on November 15, 2023 on behalf of the Board: |
|
|
| “Lourdes Felix” |
|
“Marc Seelenfreund” |
| Lourdes Felix - Director |
|
Marc Seelenfreund - Director |
The accompanying notes are an integral part
of these unaudited condensed interim consolidated financial statements.
Siyata Mobile Inc.
Unaudited Condensed Interim Consolidated Statements of Loss and Comprehensive
Loss
(Expressed in US dollars)
For the three and nine months ended
September 30
| | |
2023 | | |
2022 | | |
2023 | | |
2022 | |
| | |
| | |
| | |
| | |
| |
| Revenue | |
$ | 6,355,744 | | |
$ | 4,370,387 | | |
$ | 1,842,390 | | |
$ | 2,567,885 | |
| Cost of sales (Note 9) | |
| (4,564,640 | ) | |
| (3,150,560 | ) | |
| (1,352,293 | ) | |
| (1,711,782 | ) |
| Gross profit | |
| 1,791,104 | | |
| 1,219,827 | | |
| 490,097 | | |
| 856,103 | |
| EXPENSES | |
| | | |
| | | |
| | | |
| | |
| Amortization and depreciation | |
| 1,308,639 | | |
| 811,234 | | |
| 453,500 | | |
| 351,310 | |
| Development expenses | |
| 173,102 | | |
| 299,937 | | |
| 87,652 | | |
| 36,567 | |
| Selling and marketing (Note 10) | |
| 3,464,928 | | |
| 3,434,201 | | |
| 1,423,760 | | |
| 1,225,475 | |
| General and administrative (Note 11) | |
| 4,414,096 | | |
| 4,684,702 | | |
| 1,318,284 | | |
| 1,174,041 | |
| Inventory impairment (Note 4) | |
| - | | |
| 303,316 | | |
| - | | |
| - | |
| Inventory loss (income) from water damage | |
| (405,364 | ) | |
| - | | |
| (405,364 | ) | |
| - | |
| Bad debts (recovered) (Note 3) | |
| 26,660 | | |
| 63,285 | | |
| 16,512 | | |
| - | |
| Insurance proceeds from water damage | |
| (380,077 | ) | |
| - | | |
| (380,077 | ) | |
| - | |
| Share-based payments (Note 8) | |
| 773,605 | | |
| 2,478,695 | | |
| 202,072 | | |
| 539,660 | |
| Total operating expenses | |
| 9,375,589 | | |
| 12,075,370 | | |
| 2,716,339 | | |
| 3,327,053 | |
| Net operating loss | |
| (7,584,485 | ) | |
| (10,855,543 | ) | |
| (2,226,242 | ) | |
| (2,470,950 | ) |
| | |
| | | |
| | | |
| | | |
| | |
| OTHER EXPENSES | |
| | | |
| | | |
| | | |
| | |
| Finance expense | |
| 109,033 | | |
| 128,446 | | |
| 33,684 | | |
| 82,720 | |
| Foreign exchange | |
| (188,494 | ) | |
| 199,535 | | |
| (109,895 | ) | |
| 180,367 | |
| Change in fair value of convertible promissory note (Note 6) | |
| - | | |
| 3,725,362 | | |
| - | | |
| 474,514 | |
| Change in fair value of opening warrant liability (Note 7) | |
| - | | |
| 962,350 | | |
| - | | |
| - | |
| Change in fair value of warrant liability (Note 7) | |
| 1,561,765 | | |
| (8,125,538 | ) | |
| (294,858 | ) | |
| (2,680,603 | ) |
| Transaction costs (Note 12) | |
| - | | |
| 965,247 | | |
| - | | |
| - | |
| Total other expenses | |
| 1,482,304 | | |
| (2,144,598 | ) | |
| (371,069 | ) | |
| (1,943,002 | ) |
| Net loss for the period | |
| (9,066,789 | ) | |
| (8,710,945 | ) | |
| (1,855,173 | ) | |
| (527,948 | ) |
| Other comprehensive income | |
| | | |
| | | |
| | | |
| | |
| Translation adjustment | |
| - | | |
| 138,628 | | |
| - | | |
| 137,110 | |
| Comprehensive loss for the period | |
$ | (9,066,789 | ) | |
$ | (8,572,317 | ) | |
$ | (1,855,173 | ) | |
$ | (390,838 | ) |
| | |
| | | |
| | | |
| | | |
| | |
| Weighted average shares (after the 100-1 reverse stock split) | |
| 1,052,526 | | |
| 147,155 | | |
| 1,792,431 | | |
| 165,351 | |
Basic and diluted loss per share after the 100-1 reverse stock split | |
$ | (8.61 | ) | |
$ | (59.20 | ) | |
$ | (1.04 | ) | |
$ | (3.19 | ) |
The accompanying notes are an integral part
of these unaudited condensed interim consolidated financial statements.
Siyata Mobile Inc.
Unaudited Condensed Interim Consolidated Statement of Changes in Shareholders’
Equity
(Expressed in US dollars)
For nine month periods ending September
30, 2023 and 2022
| | |
Share
capital | | |
Share
Capital | | |
Reserves | | |
Accumulated other comprehensive income (loss) | | |
Deficit | | |
Total
shareholders’
equity | |
| | |
# | | |
$ | | |
$ | | |
$ | | |
$ | | |
$ | |
| Balance, December 31, 2021 | |
| 52,767 | | |
| 54,655,244 | | |
| 10,389,555 | | |
| (38,739 | ) | |
| (62,519,412 | ) | |
| 2,486,648 | |
| Shares issued on acquisition of ClearRF | |
| 1,390 | | |
| 190,095 | | |
| | | |
| | | |
| | | |
| 190,095 | |
| Share issued on capital raise | |
| 72,157 | | |
| 10,936,974 | | |
| 307,189 | | |
| | | |
| | | |
| 11,244,163 | |
| Share issuance costs on capital raise | |
| | | |
| (1,051,647 | ) | |
| | | |
| | | |
| | | |
| (1,051,647 | ) |
| Pre-funded warrants exercised | |
| 14,800 | | |
| 2,575,200 | | |
| | | |
| | | |
| | | |
| 2,575,200 | |
| Shares issued for debt | |
| 29,297 | | |
| 2,669,227 | | |
| | | |
| | | |
| | | |
| 2,669,227 | |
| Issuance of shares in conversion of RSU | |
| 300 | | |
| 22,200 | | |
| | | |
| | | |
| | | |
| 22,200 | |
| Share based payments | |
| | | |
| | | |
| 2,478,695 | | |
| | | |
| | | |
| 2,478,695 | |
| Translation adjustment | |
| | | |
| | | |
| | | |
| (138,628 | ) | |
| | | |
| (138,628 | ) |
| Net loss | |
| | | |
| | | |
| | | |
| | | |
| (8,710,945 | ) | |
| (8,710,945 | ) |
| Balance, September 30, 2022 | |
| 170,711 | | |
$ | 69,997,293 | | |
$ | 13,175,439 | | |
$ | (177,367 | ) | |
$ | (71,230,357 | ) | |
$ | 11,765,008 | |
| | |
Share
capital | | |
Share
Capital | | |
Reserves | | |
Accumulated other comprehensive income (loss) | | |
Deficit | | |
Total
shareholders’
equity | |
| | |
# | | |
$ | | |
$ | | |
$ | | |
$ | | |
$ | |
| Balance, December 31, 2022 | |
| 448,686 | | |
| 73,312,866 | | |
| 13,647,399 | | |
| 98,870 | | |
| (77,818,663 | ) | |
| 9,240,472 | |
| Warrants exercised | |
| 390,748 | | |
| 7,583,617 | | |
| (3,975,046 | ) | |
| | | |
| | | |
| 3,608,571 | |
| Warrants transferred from liability | |
| | | |
| | | |
| 3,975,046 | | |
| | | |
| | | |
| 3,975,046 | |
| Share issued on capital raise | |
| 1,014,500 | | |
| 4,565,250 | | |
| | | |
| | | |
| | | |
| 4,565,250 | |
| Share issuance costs on capital raise | |
| | | |
| (759,121 | ) | |
| | | |
| | | |
| | | |
| (759,121 | ) |
| Pre-funded warrants exercised | |
| | | |
| | | |
| | | |
| | | |
| | | |
| - | |
| Shares issued for debt | |
| | | |
| | | |
| | | |
| | | |
| | | |
| - | |
| Share based payments | |
| | | |
| | | |
| 773,605 | | |
| | | |
| | | |
| 773,605 | |
| Translation adjustment | |
| | | |
| | | |
| | | |
| | | |
| | | |
| - | |
| Net loss | |
| | | |
| | | |
| | | |
| | | |
| (9,066,789 | ) | |
| (9,066,789 | ) |
| Balance, September 30, 2023 | |
| 1,853,955 | | |
$ | 84,702,612 | | |
$ | 14,421,004 | | |
$ | 98,870 | | |
$ | (86,885,452 | ) | |
$ | 12,337,034 | |
The accompanying notes are an integral part
of these unaudited condensed interim consolidated financial statements.
Siyata Mobile Inc.
Unaudited Condensed Interim Consolidated Statements of Cash Flows
(Expressed in US dollars)
For the nine month period ended September
30
| | |
September 30, | | |
September 30, | |
| | |
2023 | | |
2022 | |
| Operating activities | |
| | |
| |
| Net loss for the year | |
$ | (9,066,789 | ) | |
$ | (8,710,945 | ) |
| Items not affecting cash: | |
| | | |
| | |
| Amortization and depreciation | |
| 1,308,639 | | |
| 811,234 | |
| Bad debt expense | |
| 26,660 | | |
| 63,285 | |
| Impairment of inventory | |
| - | | |
| 303,316 | |
| Fair value changes on convertible debenture | |
| | | |
| 3,725,362 | |
| Fair value changes on opening warrant liability | |
| - | | |
| 962,350 | |
| Fair value changes on warrant liability | |
| 1,561,765 | | |
| (8,125,538 | ) |
| Interest expense, net of repayments | |
| - | | |
| - | |
| Foreign exchange | |
| 13,436 | | |
| - | |
| Income on inventory due to water damage | |
| (405,364 | ) | |
| - | |
| Share based payments | |
| 773,605 | | |
| 2,478,695 | |
| Net Change in non-cash working capital | |
| | | |
| | |
| Trade receivables | |
| (631,278 | ) | |
| (326,749 | ) |
| Prepaids | |
| (54,974 | ) | |
| (390,022 | ) |
| Inventory | |
| 1,596,000 | | |
| (2,903,506 | ) |
| Advances to suppliers | |
| (1,385,957 | ) | |
| (638,831 | ) |
| Accounts payable and accrued liabilities | |
| (489,431 | ) | |
| (528,817 | ) |
| Deferred revenues | |
| (149,600 | ) | |
| - | |
| Net cash used in operating activities | |
| (6,903,288 | ) | |
| (13,280,167 | ) |
| Investing activities | |
| | | |
| | |
| Intangible asset additions | |
| (2,051,354 | ) | |
| (2,295,839 | ) |
| Equipment additions | |
| (3,737 | ) | |
| (12,159 | ) |
| Proceeds of long term deposit | |
| - | | |
| 18,999 | |
| Acquisition of ClearRF | |
| - | | |
| (155,014 | ) |
| Net cash used in investing activities | |
| (2,055,091 | ) | |
| (2,444,013 | ) |
| Financing activities | |
| | | |
| | |
| Lease payments | |
| (227,829 | ) | |
| (150,831 | ) |
| Bank loan | |
| 531,521 | | |
| (27,159 | ) |
| Convertible debt issued, net of repayments | |
| - | | |
| (4,000,000 | ) |
| Proceeds on share issuance, net of share issuance cost | |
| 4,565,250 | | |
| 19,268,584 | |
| Transaction costs | |
| (1,068,121 | ) | |
| - | |
| Exercise of warrants | |
| 3,608,571 | | |
| 14,800 | |
| Net cash from financing activities | |
| 7,409,392 | | |
| 15,105,394 | |
| Effect of foreign exchange on cash | |
| 1,440 | | |
| (12,330 | ) |
| Change in cash and restricted cash for the period | |
| (1,547,587 | ) | |
| (631,116 | ) |
| Cash and restricted cash, beginning of the period | |
| 1,913,742 | | |
| 1,619,742 | |
| Cash and restricted cash, end of period | |
$ | 366,155 | | |
$ | 988,626 | |
The accompanying notes are an integral
part of these unaudited condensed interim consolidated financial statements.
Siyata Mobile Inc.
Notes to the Unaudited Condensed Interim Consolidated Financial Statements
(Expressed in US dollars)
As at September 30, 2023 and December
31, 2022 and for the three and nine month period ended September 30, 2023 and 2022
| 1. | NATURE
OF OPERATIONS AND GOING CONCERN |
Siyata Mobile Inc. (“Siyata”
or the “Company”) was incorporated under the Business Corporations Act, British Columbia on October 15, 1986. The Company’s
shares are listed on NASDAQ under the symbol SYTA and warrants issued on September 29, 2020, are traded under the symbol SYTAW. The Company’s
principal activity is the sale of vehicle-mounted, cellular-based communications platforms over advanced mobile networks and cellular
booster systems. The registered and records office is located at 7404 King George Blvd, Suite- 200, Surrey, BC, V3W-1N6.
These unaudited condensed interim consolidated
financial statements have been prepared in accordance with International Financial Reporting Standards (“IFRS”) IAS 34 Interim
Financial Reporting, with the assumption that the Company will be able to realize its assets and discharge its liabilities in the
normal course of business rather than a process of forced liquidation. These unaudited condensed interim consolidated financial statements
do not include any adjustments relating to the recoverability and classification of recorded asset amounts and classification of liabilities
that might be necessary should the Company be unable to continue as a going concern.
The Company incurred a net loss of
$9,466,789 during the nine month period ended September 30, 2023 $9,066,788 (September 30, 2022- nine month period net loss of $8,710,945),
and, as of that date, the Company’s total deficit was $86,885,452 (December 31, 2022 - $77,818,663). The Company’s continuation
as a going concern is dependent upon the success of the Company’s sale of inventory, the existing cash flows, and the ability of
the Company to obtain additional debt or equity financing, all of which are uncertain. These material uncertainties raise substantial
doubt on the Company’s ability to continue as a going concern.
Statement of compliance
These unaudited condensed interim consolidated
financial statements, including comparatives, have been prepared in accordance with International Accounting Standards (IAS) 34 Interim
Financial Reporting. Omitted from these financial statements are certain information and note disclosures normally included in the
annual financial statements. These financial statements and notes presented should be read in conjunction with the annual financial statements
for the year ended December 31, 2022.
The accounting methods and principles
of computation adopted in these financial statements are the same as those in annual consolidated financial statements for the year ended
December 31, 2022.
The preparation of these unaudited
condensed interim consolidated financial statements requires management to make estimates, judgments and assumptions that affect the application
of accounting policies and the reported amounts of assets, liabilities, income and expenses. The significant judgements made by management
when applying the Company’s accounting policies and the key sources of estimation uncertainty were the same as those that applied
to the Company’s December 31, 2022 annual consolidated financial statements.
Siyata Mobile Inc.
Notes to the Unaudited Condensed Interim Consolidated Financial Statements
(Expressed in US dollars)
As at September 30, 2023 and December 31, 2022 and for the three and
nine month period ended September 30, 2023 and 2022
| 2. | BASIS
OF PREPARATION (cont’d) |
Basis of consolidation and presentation
These unaudited condensed interim consolidated
financial statements of the Company have been prepared on a historical cost basis, except for financial instruments classified as financial
instruments at fair value through profit and loss, which are stated at their fair value. In addition, the condensed interim consolidated
financial statements have been prepared using the accrual basis of accounting, except for the statement of cash flows.
These unaudited condensed interim consolidated
financial statements incorporate the financial statements of the Company and its wholly controlled subsidiaries. Control exists when the
Company has the power, directly or indirectly, to govern the financial and operating policies of an entity so as to obtain benefits from
its activities. These condensed interim consolidated financial statements include the accounts of the Company and its direct wholly-owned
subsidiaries. All intercompany transactions and balances have been eliminated.
The unaudited condensed interim consolidated
financial statements include the accounts of the Company and its wholly-owned subsidiaries:
| Name of Subsidiary |
|
Place of Incorporation |
|
Ownership |
|
| Queensgate Resources Corp. |
|
British Columbia, Canada |
|
|
100 |
% |
| Queensgate Resources US Corp. |
|
Nevada, USA |
|
|
100 |
% |
| Siyata Mobile (Canada) Inc. |
|
British Columbia, Canada |
|
|
100 |
% |
| Siyata Mobile Israel Ltd. |
|
Israel |
|
|
100 |
% |
| Signifi Mobile Inc. |
|
Quebec, Canada |
|
|
100 |
% |
| ClearRF Nevada Ltd. |
|
Nevada, USA |
|
|
100 |
% |
Recent adoptions
of accounting pronouncements
The following amendments became effective
on January 1, 2023, and did not have a material impact on the Company’s condensed interim consolidated financial statements:
| ● | In
February 2021, the IASB issued Definition of Accounting Estimates (Amendments to IAS 8). The amendments define accounting estimates and
clarify the distinction between changes in accounting estimates and changes in accounting policies. |
| ● | In
February 2021, the IASB issued Disclosure of Accounting Policies (Amendments to IAS 1 and IFRS Practice Statement 2). The amendments
provide guidance to help entities disclose their material (previously “significant”) accounting policies. |
| ● | In
May 2021, the IASB issued Deferred Tax related to Assets and Liabilities arising from a Single Transaction (Amendments to IAS 12). The
amendments narrow the scope of the recognition exemption so that companies would be required to recognize deferred tax for transactions
that give rise to equal amounts of taxable and deductible temporary differences, such as leases. |
Siyata Mobile Inc.
Notes to the Unaudited Condensed Interim Consolidated Financial Statements
(Expressed in US dollars)
As at September 30, 2023 and December
31, 2022 and for the three and nine month period ended September 30, 2023 and 2022
| 2. | BASIS
OF PREPARATION (cont’d) |
Future accounting pronouncements
The standards, amendments, and interpretations
issued before 2023 but not yet adopted by the Company have been disclosed in Note 3 of the Company’s December 31, 2022 annual consolidated
financial statements. The Company is currently considering the impact of adopting these standards, amendments and interpretations on its
consolidated financial statement.
| 3. | TRADE
AND OTHER RECEIVABLES |
| | |
September 30,
2023 | | |
December 31,
2022 | |
| Trade receivables | |
$ | 2,752,951 | | |
$ | 2,015,291 | |
| Allowance for doubtful accounts | |
| (1,047,802 | ) | |
| (1,056,393 | ) |
| Taxes receivable | |
| 474,097 | | |
| 615,730 | |
| Total | |
$ | 2,179,246 | | |
$ | 1,574,628 | |
| | |
September 30,
2023 | | |
December 31,
2022 | |
| Finished products | |
$ | 2,601,980 | | |
$ | 7,392,002 | |
| Impairment of finished products | |
| - | | |
| (3,555,683 | ) |
| Accessories and spare parts | |
| 299,934 | | |
| 675,001 | |
| Impairment of accessories and spare parts | |
| - | | |
| (418,770 | ) |
| Total | |
$ | 2,901,914 | | |
$ | 4,092,550 | |
The Company has obtained in April 2023, a $2,000,0000 line of credit
factoring for its North American receivables with an 85% advance rate with interest of 1.8% for the first 30 days, then 0.5% every 10
days thereafter of the face value.
This loan is collateralized by the North American receivables, inventory
and equipment. As at September 30, 2023 the bank loan balance is $531,521.
On November 3, 2021, the Company issued
a US$7,200,000 convertible promissory note (the “Promissory Note”) and 2,142,857 warrants for gross proceeds of US$6,000,000.
The Company elected to measure the promissory note (hybrid contract) at fair value through profit or loss (“FVTPL”) on initial
recognition and, as such, the embedded conversion feature was not separated. The warrants were recorded as a liability.
During the three months ended March
31, 2022, the Company completed a secondary offering of its common shares, and as a result of the terms of the convertible promissory
note, the Company was required to direct 20% of the gross proceed of the offering to the lender. A total of US$4,000,000 was repaid to
the lender on January 13, 2022. Commencing in May 2022, the Company made monthly payments of $400,000 through issuance of common shares
towards the principal balance of the promissory note, resulting the promissory note being fully repaid by December 31, 2022. The Company
issued 13,112,255 common shares, with a total market value of $4,138,002. The difference between the fair value of the shares issued,
and the value of the principal repaid of $938,002 was included in profit and loss in the change in fair value of convertible promissory
note.
For the three months ended March 31,
2022 the Company recorded a fair value loss of $2,023,751 on the Convertible debenture.
Siyata Mobile Inc.
Notes to the Unaudited Condensed Interim Consolidated Financial Statements
(Expressed in US dollars)
As at September 30, 2023 and December
31, 2022 and for the three and nine month period ended September 30, 2023 and 2022
The balance of the warrant liability
is as follows:
| | |
November 3,
2021 | | |
January 11,
2022 | | |
October 12,
2022 | | |
January 19,
2023 | | |
Total | |
| Balance December 31, 2022 | |
$ | 197,733 | | |
$ | 501,330 | | |
$ | 2,035,741 | | |
$ | - | | |
$ | 2,734,804 | |
| Exercise of warrants | |
| (197,733 | ) | |
| - | | |
| (1,717,801 | ) | |
| - | | |
| (1,915,534 | ) |
| Warrants issued | |
| - | | |
| - | | |
| - | | |
| 2,875,580 | | |
| 2,875,580 | |
| Transfer to equity | |
| - | | |
| - | | |
| (564,946 | ) | |
| (3,410,100 | ) | |
| (3,975,046 | ) |
| Change in fair value | |
| - | | |
| (487,407 | ) | |
| 247,006 | | |
| 534,520 | | |
| 294,119 | |
| Balance September 30, 2023 | |
$ | - | | |
$ | 13,923 | | |
$ | - | | |
$ | - | | |
$ | 13,923 | |
January 19, 2023 warrants
On January 19, 2023, the Company entered
into warrant exercise agreements with fourteen existing accredited investors to exercise certain outstanding warrants to purchase up to
an aggregate of 180,429 of the Company’s common shares. In consideration for the immediate exercise of the outstanding warrants
for cash, the Company agreed to reduce the exercise price from $23.00 to $20.00 per share and issue new unregistered warrants to purchase
up to an aggregate of 180,429 common shares with an exercise price of $20.00 per share. The gross proceeds to the Company from the exercise
totaled approximately $3,608,571, prior to deducting warrant inducement agent fees and offering expenses.
The new warrants are exercisable immediately
upon issuance at an exercise price of $20.00 per share and have a term of exercise equal to five years. In connection with the exercise,
the Company will be required pursuant to the terms of 29,891 of its remaining unexercised common share purchase warrants, to reduce the
exercise price of such warrants from $23.00 per common share to an exercise price of $20.00 per common share.
On March 30, 2023, the SEC accepted
the registration statement of the Company to the effect that all of the 210,320 outstanding $20.00 warrants become immediately a cashless
exercise and their underlying shares become immediately tradeable. Subsequent to the quarter ended March 31, 2023, 210,320 warrants were
exercised cashless in exchange for 210,320 common shares of the Company. All of the warrants that became cashless exercise were transferred
to equity at March 30, 2023, as they no longer met the definition of a liability.
The fair value of the warrants issued
at January 19, 2023 was $2,875,580 and was determined using the stock price at the date of issue, with a 15% discount for lack of marketability.
This method was used as the warrants contained an alternative cashless exercise feature.
The fair value of the warrants on March
30, 2023 was $3,410,100 and was determined using the stock price on the date, as the warrants were cashless exercise at that date.
Siyata Mobile Inc.
Notes to the Unaudited Condensed Interim Consolidated Financial Statements
(Expressed in US dollars)
As at September 30, 2023 and December
31, 2022 and for the three and nine month period ended September 30, 2023 and 2022
| 7. | WARRANT
LIABILITY (cont’d) |
November 3, 2021 warrants
The warrants allowed for the purchase
of 18,929 common shares of the Company at an exercise price of US $400.00 per common share and expired 5 years from the issue date of
the related promissory note. Under the terms of these warrants, the exercise price of the warrant was adjusted to $230.00 when an offering
was closed on January 3, 2022 that issued shares at a price lower than the exercise price. On January 19, 2023 the warrant holders entered
into the agreement noted above to exercise the warrants, and receive new warrants in exchange.
At December 31, 2022 the fair value
of the warrants was $197,733 and was determined using a Black-Scholes option pricing model with the following assumptions: initial stock
price $15.00, strike rate $23.00 dividend yield 0%, term 3.84 years, volatility 110% and risk-free rate 4.08%.
At January 19, 2023 prior to exercise,
the fair value of the warrants was $NIL and was determined using a Black-Scholes option pricing model with the following assumptions:
initial stock price $19.00, strike rate $20.00 dividend yield 0%, term 0.0 years, volatility 130% and risk-free rate 3.62%.
January 11, 2022 warrants
The Company assessed that the 85,200
warrants, and 14,800 pre-funded warrants issued in the January 2022 equity offering did not meet the “fixed for fixed” test
and are therefore recorded as liabilities at fair value through profit and loss, and revalued at the end of each period.
At December 31, 2022 the fair value
of the warrants was $501,330 and was determined using a Black-Scholes option pricing model with the following assumptions: initial stock
price $15.00, strike rate $230.00, dividend yield 0%, term 4.03 years, volatility 110% and risk-free rate 4.08%.
At September 30, 2023 the fair value
of the warrants was $13,923 and was determined using a Black-Scholes option pricing model with the following assumptions: initial stock
price $282.00, strike rate $230.00, dividend yield 0%, term 3.28 years, volatility 105% and risk-free rate 4.72%.
October 12, 2022 warrants
The Company assessed that the 174,000
warrants and 15,900 pre-funded warrants issued as part of the October 2022 equity offering did not meet the “fixed for fixed”
test and are therefore reported as liabilities at fair value through profit and loss, and revalued at the end of each period. On January
19, 2023 the warrant holders entered into the agreement noted above to exercise 161,500 of the 174,000 warrants, and receive new warrants
in exchange. The remaining 12,500 warrants that were outstanding at January 19, 2023 were converted to cashless exercise warrants on March
30, 2023 as described above.
Siyata Mobile Inc.
Notes to the Unaudited Condensed Interim Consolidated Financial Statements
(Expressed in US dollars)
As at September 30, 2023 and December
31, 2022 and for the three and nine month period ended September 30, 2023 and 2022
| 7. | WARRANT
LIABILITY (cont’d) |
The fair value of the warrants as at
December 31, 2022 was $1,850,758 and was determined using the Black-Scholes Option Pricing Model with the following assumptions: share
price: $15.00; exercise price $23.00; expected volatility: 100%; dividend yield 0%; risk free rate: 3.98%.
The fair value of the 12,500 unexercised
warrants on January 19, 2023 was $132,957 and was determined using the Black-Scholes Option Pricing Model with the following assumptions:
share price: $19.00; exercise price $20.00; term 4.73 years; expected volatility: 115%; dividend yield 0%; risk free rate: 3.49%.
The fair value of the 161,500 exercised
warrants immediately prior to exercise on January 19, 2023 was $NIL and was determined using the Black-Scholes Option Pricing Model with
the following assumptions: share price: $19.00; exercise price $20.00; term 0 years; expected volatility: 115%; dividend yield 0%; risk
free rate: 3.49%.
The fair value of the 29,891 (17,391
waiver warrants plus 12,500 unexercised warrants) outstanding warrants on March 30, 2023 prior to the transfer to equity was $564,946
and was determined using the stock price on the date, as the warrants were cashless exercise at that date.
In connection with the October 2022
equity offering, the Company issued 17,391 waiver warrants exercisable at $23.00 per share which expire, if unexercised, on October 12,
2027, to entice the holder of the convertible promissory note to waive their right to block the equity offering. The waiver warrants did
not meet the “fixed for fixed” test and are therefore reported as liabilities at fair value through profit and loss and revalued
at the end of each period. On March 30, 2023, the waiver warrants were modified to cashless exercise as described above, and therefore
met the “fixed for fixed” test and were reclassified to equity.
The fair value of the waiver warrants
as at December 31, 2022 was $184,983 and was determined using the Black-Scholes Option Pricing Model with the following assumptions: share
price: $15.00; exercise price $23.00; expected volatility: 100%; dividend yield 0%; risk free rate: 3.10%.
The fair value of the waiver warrants
as at March 30, 2023 prior to transfer to equity was $328,696 and was determined using the stock price on the date, as the warrants were
cashless exercise at that date.
| |
(a) |
Authorized Unlimited number of common shares without par value |
As at September 30, 2023, the Company
had 1,853,955 common shares issued and outstanding (December 31, 2022 – 448,686) after taking into account the 100-to-1 reverse
stock split that took place on August 10, 2023.
As of the date of issuance of these
financial statements total outstanding common shares is 3,902,168 (post 100-to-1 reverse split that was effective as of August 10, 2023),
due to the issuance of 1,870,000 shares from a capital raise on October 31, 2023 and the exercise of 180,000 prefunded warrants also issued
on October 31, 2023 that were exercised into 177,313 additional common shares on November 1, 2023, as well as the conversion of 900 RSU’s
into 900 common shares on October 3, 2023.
Siyata Mobile Inc.
Notes to the Unaudited Condensed Interim Consolidated Financial Statements
(Expressed in US dollars)
As at September 30, 2023 and December
31, 2022 and for the three and nine month period ended September 30, 2023 and 2022
| (b) | Common
share transactions |
Transactions for the nine months
ended September 30, 2023 are as follows:
| | ● | The Company issued 180,429 common shares on the exercise of various warrants for gross proceeds of $3,608,571. Additionally, the Company issued 180,429 warrants to replace those warrants that were exercised. As an incentive to investors to exercise the 180,429 warrants, the Company issued cashless warrants to those investors that were exercisable as of March 30, 2023. As well, any holders of the $23.00 warrants that had a ratchet provision also became cashless. As a result, 210,319 common shares were issued for cashless warrants in Q2 2023. On June 28, 2023 the Company issued 500,000 at $4.50 per share for gross proceeds of $2,250,000 before offering expenses and other expenses included in share issuance costs. On July 13, 2023, the Company issued 514,500
shares at $4.50 per share for gross proceeds of $2,315,250 before offering expenses and other expenses included in share issuance costs. |
Subsequent to September 30, 2023 the Company
issued 1,870,000 common shares at $0.65 per share and also issued 530,000 prefunded warrants with an exercise price of $0.01 and a purchase
price of $0.64 per warrant for total gross proceeds of $1,554,700 before offering expenses and other expenses included in share issuance
costs.
Transactions for the nine months
ended September 30, 2022 are as follows:
On January 11, 2022, the Company completed
an underwritten public offering in the United States, raising a total of $20,013,043 in gross proceeds. The Company allocated the gross
proceeds firstly to the warrant liabilities, with the remainder to the common shares. Direct costs have been allocated based on the percentage
allocation of the proceeds. The underwritten public offering resulted in the sale to the public of 72,157 Units at $230.00 per Unit, with
each Unit being comprised of one common share and one warrant (the “Unit Warrants”) exercisable at $230.00 per share. The
Unit warrants are exercisable immediately and have a term of 5 years. Gross proceeds of $10,936,974 were allocated to the common shares,
and $5,395,878 to the unit warrants liability
In addition, the
Company issued 14,800 pre-funded units (“Pre-Funded Units”) at $229.00 per Pre-Funded Unit. Each Pre-Funded Unit is comprised
of a one-pre-funded warrant (a “Pre-Funded Warrant”) to purchase one common share, and one warrant to purchase one common
share. The Pre-Funded Warrant allows the holder to acquire one common share of the Company at an exercise price of $1.00 per common share,
and a warrant to purchase a common share at an exercise price of $230.00 per share. The warrants are exercisable immediately and have
a term of 5 years. Each Pre-Funded Warrant is exercisable immediately and is exercisable until all Pre-Funded Warrants are exercised.
Proceeds of $2,560,400 were allocated to the pre-funded warrants and $1,106,747 to the unit warrants in the warrant liability.
Siyata Mobile Inc.
Notes to the Unaudited Condensed Interim Consolidated Financial Statements
(Expressed in US dollars)
As at September 30, 2023 and December
31, 2022 and for the three and nine month period ended September 30, 2023 and 2022
| |
(b) |
Common share transactions (cont’d) |
The Company determined that the pre-funded
warrants within the Pre-funded Units are common shares in substance, as they require only a minimal exercise price of $1.00. In addition,
the underwriting agreement includes both the Units and Pe-funded Units and were negotiated together in the equity raise. Given that the
purpose of the Prefunded Unit is in substance the same as that of the Unit (i.e., resulting in the ownership of both common shares and
common share warrants) and that the terms of the warrants in both the Units and Prefunded Units are the same (i.e., the obligations of
the Company for the units are the same), the Company determined that the Units and Pre-funded Units are closely related and should be
combined into one unit of account for the purposes of allocating proceeds.
Therefore, the
proceeds from the sale of the Units and Pre-funded Units are combined and allocated among the common shares, pre-funded warrants, and
the common share warrants using the residual method, with the warrant liability being initially recognized at fair value as of the registration
date and the residual amount being allocated to the common shares (i.e., equity).
The Company concurrently sold an additional
13,043 warrants to purchase 13,043 common shares exercisable at $230.00 per share (the “Option Warrants”) pursuant to an over-allotment
option exercised by the underwriter. The exercise price of the warrants issued in connection with the exercise of the over-allotment option
was $0.97 per warrant. Each Option Warrant is exercisable immediately and has a term of five years from the issue date. Proceeds of $975,393
were allocated to the option warrant liability. As the fair value of the warrant liability exceeded the proceeds received on the warrants
of $13,043, a fair value loss of $962,350 was recognized in the statement of profit and loss as a fair value change in the opening warrant
liability.
The fair value of the common shares
and pre-funded units was determined by reference to the market price on the day of the offering, which was $173.00 per share. The Unit
Warrants, Warrants, and Option Warrants were valued using the Black-Scholes model using the following assumptions: initial stock price
$173.00, strike rate $230.00, dividend yield 0%, term 5 years, volatility 60.0% and risk-free rate 0.50%.
The Company also issued warrants to
the placement agents to purchase 4,348 common shares at an exercise price of $253.00 per share (the “Placement Agent Warrants”),
which are exercisable 180 days from January 11, 2022, with a term of five years. The fair value of the Placement Agent Warrants was determined
to be $307,189 using the Black-Scholes model with the following assumptions: initial stock price $173.00, strike rate $253.00, dividend
yield 0%, term 5 years, volatility 60.0% and risk-free rate 0.50%.
The Company assessed that the warrants
issued under the public offering, excluding the Placement Agent Warrants did not meet the “fixed for fixed” test and are therefore
reported as liabilities at fair value through profit and loss, and revalued at the end of each period. The Placement Agent Warrants were
assessed under IFRS 2 Share Based Payments, as equity-settled share-based payments and have been recorded in equity.
Siyata Mobile Inc.
Notes to the Unaudited Condensed Interim Consolidated Financial Statements
(Expressed in US dollars)
As at September 30, 2023 and December
31, 2022 and for the three and nine month period ended September 30, 2023 and 2022
| |
(b) |
Common share transactions (cont’d) |
The direct costs related to the issuance
of the common shares and warrants issued in the January 2022 underwritten public offering were $2,016,895, including the value of the
Placement Agent Warrants. Direct costs of $965,248 were allocated to the warrant liability and expensed immediately in profit and loss.
During the period, 14,800 Pre-Funded Warrants were exercised for gross proceeds of $14,800, converting into 14,800 common shares that
were fully issued.
On March 31, 2022, as part of the ClearRF
acquisition (Note 3), the Company issued 1,390 shares to the vendor with a fair value of $190,094.
The Company issued 1,550 common shares, with a fair value
of $170,500 ($110.00 per share) to consultants as part of their compensation for services rendered.
The Company issued 8,542 common shares with a fair value
of $1,002,461 as combined payments of the monthly principal repayment of $400,000 for the months of May and June 2022 payable in shares
per the terms of the promissory note.
The Company issued 15,500 common shares, with a fair value
of $170,500 ($110.00 per share) to consultants as part of their compensation for services rendered.
The Company issued 300 shares with a fair value of $22,200
($74.00 per share) resulting from a supplier converting RSU’s into common shares. The Company issued 600 shares, with a
fair value of $61,800 ($103.00 per share), to a supplier as partial compensation according to their contractual agreements.
The Company issued 4,049 shares, with a fair value of $441,296
($109.00 per share),as payment for the monthly principal repayment of $400,000 on the promissory note. ·
The Company issued 6,849 shares, with a fair value of $520,548 ($76.00
per share), as payment for the monthly principal repayment of $400,000 on the promissory note.
The Company issued 600 shares, with a fair value of $61,800
($103.00 per share), to a supplier as partial compensation according to their contractual agreements.
Siyata Mobile Inc.
Notes to the Unaudited Condensed Interim Consolidated Financial Statements
(Expressed in US dollars)
As at September 30, 2023 and December
31, 2022 and for the three and nine month period ended September 30, 2023 and 2022
The Company has a shareholder-approved
“rolling” stock option plan (the “Plan”) in compliance with Nasdaq policies. Under the Plan the maximum number
of shares reserved for issuance may not exceed 15% of the total number of issued and outstanding common shares at the time of granting.
The exercise price of each stock option shall not be less than the market price of the Company’s stock at the date of grant, less
a discount of up to 25%. Options can have a maximum term of ten years and typically terminate 90 days following the termination of the
optionee’s employment or engagement, except in the case of retirement or death. Vesting of options is at the discretion of the Board
of Directors at the time the options are granted.
A summary of the Company’s
stock option activity is as follows:
| | |
| | |
Weighted | |
| | |
Number of | | |
Average | |
| | |
Stock | | |
Exercise | |
| | |
Options | | |
Price | |
| Outstanding options, December 31, 2021 | |
| 4,146 | | |
$ | 1,388.00 | |
| Granted | |
| 11,450 | | |
| 115.00 | |
| Expired/Cancelled | |
| (534 | ) | |
| (3,090.00 | ) |
| Outstanding options, December 31, 2022 | |
| 15,062 | | |
$ | 352.91 | |
| Granted | |
| - | | |
| - | |
| Expired/Cancelled | |
| - | | |
| - | |
| Outstanding options, September 30, 2023 | |
| 15,062 | | |
$ | 352.91 | |
Siyata Mobile Inc.
Notes to the Unaudited Condensed Interim Consolidated Financial Statements
(Expressed in US dollars)
As at September 30, 2023 and December
31, 2022 and for the three and nine month period ended September 30, 2023 and 2022
| |
(c) |
Stock options (cont’d) |
As at September 30, 2023 stock
options outstanding are as follows:
| Grant Date |
|
Number of
options
outstanding |
|
|
Number of
options
exercisable |
|
|
Weighted
Average
Exercise
Price |
|
|
Expiry date |
|
Remaining
contractual
life (years) |
|
| 24-Dec-18 |
|
|
129 |
|
|
|
129 |
|
|
|
5,400.00
|
|
|
24-Dec-23 |
|
|
0.23 |
|
| 15-Jan-19 |
|
|
8 |
|
|
|
8 |
|
|
|
5,400.00 |
|
|
15-Jan-24 |
|
|
0.29 |
|
| 21-Mar-19 |
|
|
123 |
|
|
|
123 |
|
|
|
5,900.00 |
|
|
21-Mar-24 |
|
|
0.47 |
|
| 1-Jan-20 |
|
|
21 |
|
|
|
21 |
|
|
|
5,400.00 |
|
|
1-Jan-24 |
|
|
0.25 |
|
| 15-Nov-20 |
|
|
950 |
|
|
|
950 |
|
|
|
600.00 |
|
|
15-Nov-30 |
|
|
7.13 |
|
| 15-Nov-20 |
|
|
1,615 |
|
|
|
1,615 |
|
|
|
600.00 |
|
|
15-Nov-25 |
|
|
2.13 |
|
| 2-Jan-21 |
|
|
570 |
|
|
|
570 |
|
|
|
1,150.00 |
|
|
2-Jan-26 |
|
|
2.26 |
|
| 2-Jan-21 |
|
|
50 |
|
|
|
50 |
|
|
|
1,150.00 |
|
|
2-Jan-31 |
|
|
7.26 |
|
| 18-Jan-21 |
|
|
145 |
|
|
|
145 |
|
|
|
1,150.00 |
|
|
18-Jan-26 |
|
|
2.30 |
|
| 1-Jan-22 |
|
|
200 |
|
|
|
200 |
|
|
|
400.00 |
|
|
29-Oct-26 |
|
|
3.08 |
|
| 13-Apr-22 |
|
|
7,950 |
|
|
|
3,975 |
|
|
|
110.00 |
|
|
13-Apr-27 |
|
|
3.54 |
|
| 12-Jul-22 |
|
|
3,300 |
|
|
|
1,375 |
|
|
|
110.00 |
|
|
12-Jul-25 |
|
|
1.78 |
|
| Total |
|
|
15,061 |
|
|
|
9,161 |
|
|
$ |
352.91 |
|
|
|
|
|
3.12 |
|
Transactions for the nine months
ended September 30, 2023 are as follows:
| | ● | On January 1, 2022, the Company granted 200
stock options at $400.00 per share that vest in 8 equal quarterly periods with the first vesting occurring on the grant date. The fair
value on the date of the grant was $54,480 ($272.40 per option). |
| | | |
| | ● | On April 13, 2022, the Company granted 7,950 stock options to executives and employees at an exercise price of $110.00 per share. These options vest quarterly over three years period with the first vesting taking place at the date of the grant. The fair value of these options on the date of the grant is $678,520 ($85.35 per share). |
Siyata Mobile Inc.
Notes to the Unaudited Condensed Interim Consolidated Financial Statements
(Expressed in US dollars)
As at September 30, 2023 and December
31, 2022 and for the three and nine month period ended September 30, 2023 and 2022
| 8. |
SHARE CAPITAL (cont’d) |
| |
(d) |
Restricted share units |
The Company approved on February 14,
2022, the addition of the issuance of restricted share units to the existing executive stock option plan.
A summary of the Company’s restricted share unit activity
is as follows:
| | |
Number of
RSU’s | | |
Weighted
Average
Issue Price | |
| Outstanding RSU, December 31, 2021 | |
| 0 | | |
$ | - | |
| Granted | |
| 31,950 | | |
| 105.08 | |
| Exercised | |
| (300 | ) | |
| (103.00 | ) |
| Outstanding RSU, December 31, 2022 | |
| 31,650 | | |
$ | 105.02 | |
| Granted | |
| - | | |
| - | |
| Exercised | |
| - | | |
| - | |
| Outstanding RSU, September 30, 2023 | |
| 31,650 | | |
$ | 105.02 | |
As at September 30,
2023 restricted share units outstanding are as follows:
| Grant Date | |
Number of
RSU’s
outstanding | | |
Weighted Average
Issue Price | |
| 9-Mar-22 | |
| 2,250,000 | | |
| 1.03 | |
| 13-Apr-22 | |
| 825,000 | | |
| 1.10 | |
| 12-Jul-22 | |
| 90,000 | | |
| 1.10 | |
| Total | |
| 3,165,000 | | |
$ | 1.05 | |
Transactions for the nine month period
ended September 30, 2022, are as follows:
| | ● | On March 9, 2022, the Company granted 4,500 RSU’s to Directors that vest immediately. On the date of granting, the fair value and stock price was $103.00/share. |
| |
● |
On March 9, 2022, the Company granted 18,000
RSU’s to a Director that vest quarterly over 12 periods with the first vesting of 1,500 RSU’s occurring on the date of the
granted and another 1,500 vest every three months until all of the granted RSU’s have vested. On the date of granting, the fair
value and the stock price was $103.00/share.
|
| |
|
|
| |
● |
On April 13, 2022, the Company granted 2,400 RSU’s to consultants
that vest immediately. On the date of granting, the fair value and the stock price was $110.00/share. |
| |
|
|
| |
● |
On April 13, 2022, the Company granted 5,850 RSU’s to employees
of the Company that vest quarterly over 12 periods with the first vesting of 488 RSU’s occurring on the date of the granted and
another 488 RSU’s vest every three months until all of the granted RSU’s have vested. On the date of granting, the fair value
and the stock price was $110.00/share. |
Transactions subsequent to the period end where 900 RSU’s
were converted into 900 common shares on October 3, 2023.
Siyata Mobile Inc.
Notes to the Unaudited Condensed Interim Consolidated Financial Statements
(Expressed in US dollars)
As at September 30, 2023 and December
31, 2022 and for the three and nine month period ended September 30, 2023 and 2022
| 8. |
SHARE CAPITAL (cont’d) |
A summary of the Company’s
agent options activity is as follows:
| | |
Number of
options | | |
Weighted
average
exercise
price | |
| Outstanding agent options, December 31, 2021 | |
| 4,459 | | |
$ | 751.00 | |
| Granted | |
| 4,873 | | |
| 251.00 | |
| Expired | |
| (17 | ) | |
| 2,049.00 | |
| Outstanding agent options, December 31, 2022 | |
| 9,315 | | |
$ | 487.06 | |
| Granted | |
| - | | |
| - | |
| Expired | |
| - | | |
| - | |
| Outstanding agent options, September 30, 2023 | |
| 9,315 | | |
$ | 487.06 | |
As at September 30, 2023 agent
options outstanding are as follows:
| Grant Date | |
Number of
options
outstanding | | |
Number of
options
exercisable | | |
Weighted
Average
Exercise
Price | | |
Expiry date | |
Remaining
contractual
life (years) | |
| 29-Sep-20 | |
| 1,135 | | |
| 1,135 | | |
$ | 660.00 | | |
28-Sep-25 | |
| 2.00 | |
| 29-Sep-20 | |
| 2,660 | | |
| 2,660 | | |
$ | 685.00 | | |
28-Sep-25 | |
| 2.00 | |
| 31-Dec-20 | |
| 647 | | |
| 647 | | |
$ | 1,150.00 | | |
30-Jun-24 | |
| 0.75 | |
| 11-Jan-22 | |
| 4,348 | | |
| 4,348 | | |
$ | 253.00 | | |
11-Jan-27 | |
| 3.28 | |
| 1-Apr-22 | |
| 525 | | |
| 525 | | |
$ | 230.00 | | |
8-Mar-27 | |
| 3.44 | |
| Total | |
| 9,315 | | |
| 9,315 | | |
| 487.06 | | |
| |
| 2.59 | |
Transactions for the nine month period
ended September 30, 2022 are as follows:
| | ● | The Company issued warrants to the placement agents to purchase 4,348 common shares at an exercise price of $253.00 per share (the “Placement Agent Warrants”), which are exercisable 180 days from January 11, 2022, with a term of five years. The fair value of the Placement Agent Warrants was determined to be $307,189 using the Black-Scholes model with the following assumptions: initial stock price $173.00, strike rate $253.00, dividend yield 0%, term 5 years, volatility 60.0% and risk-free rate 0.50%. The Company also issued 525 agent’s options with a fair value of $61,950 with an exercise price of $230.00. |
Siyata Mobile Inc.
Notes to the Unaudited Condensed Interim Consolidated Financial Statements
(Expressed in US dollars)
As at September 30, 2023 and December
31, 2022 and for the three and nine month period ended September 30, 2023 and 2022
| 8. |
SHARE CAPITAL (cont’d) |
| |
(e) |
Agents’ options (cont’d)
|
As part of the capital raise that occurred on
October 31, 2023 as more fully described in the Subsequent Events Note 17, the Company issued 120,000 warrants to the underwriter exerciseable
at the lower of: $0.715 per warrant or a cashless exercise with a five year term.
Agent’s options outstanding as of the date
of the MD&A are as follows:
| Grant Date | |
Number of
options
outstanding | | |
Number of
options
exercisable | | |
Weighted
Average
Exercise
Price | | |
Expiry date | |
Remaining
contractual
life (years) | |
| 29-Sep-20 | |
| 1,135 | | |
| 1,135 | | |
$ | 660.00 | | |
28-Sep-25 | |
| 1.87 | |
| 29-Sep-20 | |
| 2,660 | | |
| 2,660 | | |
$ | 685.00 | | |
28-Sep-25 | |
| 1.87 | |
| 31-Dec-20 | |
| 647 | | |
| 647 | | |
$ | 1,150.00 | | |
30-Jun-24 | |
| 0.63 | |
| 11-Jan-22 | |
| 4,348 | | |
| 4,348 | | |
$ | 253.00 | | |
11-Jan-27 | |
| 3.16 | |
| 1-Apr-22 | |
| 525 | | |
| 525 | | |
$ | 230.00 | | |
8-Mar-27 | |
| 3.32 | |
| 31-Oct-23 | |
| 120,000 | | |
| 0 | | |
$ | 0.72 | | |
31-Oct-28 | |
| 4.97 | |
| Total | |
| 129,315 | | |
| 9,315 | | |
| 35.75 | | |
| |
| 4.79 | |
Siyata Mobile Inc.
Notes to the Unaudited Condensed Interim Consolidated Financial Statements
(Expressed in US dollars)
As at September 30, 2023 and December
31, 2022 and for the three and nine month period ended September 30, 2023 and 2022
| 8. |
SHARE CAPITAL (cont’d) |
| |
(f) |
Share purchase warrants |
A summary of the Company’s
share purchase warrant activity is as follows:
| | |
Number of
Warrants | | |
average
exercise price | |
| | |
| | |
| |
| Outstanding, December 31, 2021 | |
| 51,213 | | |
$ | 989.00 | |
| Granted | |
| 291,391 | | |
$ | 94.00 | |
| Expired | |
| (1,284 | ) | |
$ | 3,347.00 | |
| Outstanding, December 31, 2022 | |
| 341,320 | | |
$ | 176.00 | |
| Granted | |
| 180,429 | | |
$ | 20.00 | |
| Exercised | |
| (390,748 | ) | |
$ | 9.00 | |
| Outstanding, September 30, 2023 | |
| 131,001 | | |
$ | 383.62 | |
As at September 30, 2023 the
share purchase warrants outstanding are as follows:
| Grant Date | |
Number of
Warrants
outstanding
and
exercisable | | |
Exercise
Price | | |
Expiry date |
| 29-Sep-20 | |
| 18,056 | | |
| 685.00 | | |
28-Sep-25 |
| 31-Dec-20 | |
| 12,945 | | |
| 1,150.00 | | |
30-Jun-24 |
| 11-Jan-22 | |
| 100,000 | | |
| 230.00 | | |
10-Jan-27 |
| Total | |
| 131,001 | | |
$ | 383.62 | | |
|
Transactions for the nine
months ended September 30, 2023 are as follows:
| | ● | 180,429 warrants were exercised on January 12, 2023. The Company issued 180,429 warrants to replace those warrants that were exercised. As an incentive to investors to exercise the 180,429 warrants, the Company issued cashless warrants to those investors that were exercisable as of March 31, 2023. As well, any holders of the $23.00 warrants that had a ratchet provision also became cashless. As a result, 210,318 cashless warrants were exercised in Q2 2023. |
Transactions for the nine
month period ended September 30, 2022 are as follows:
| ● | On January 11, 2022 as part of an underwritten public offering,
the Company issued a total of 100,000 share purchase warrants, exercisable at $230.00 per warrant and with a term of five years. |
Siyata Mobile Inc.
Notes to the Unaudited Condensed Interim Consolidated Financial Statements
(Expressed in US dollars)
As at September 30, 2023 and December
31, 2022 and for the three and nine month period ended September 30, 2023 and 2022
| (in thousands) | |
Nine months
ended
30-Sep-23 | | |
Nine months
ended
30-Sep-22 | | |
Three months
ended
30-Sep-23 | | |
Three months
ended
30-Sep-22 | |
| Inventory expensed | |
$ | 3,627 | | |
$ | 2,167 | | |
$ | 1,035 | | |
$ | 1,328 | |
| Royalties | |
| 300 | | |
| 178 | | |
| 103 | | |
| 84 | |
| Other expenses | |
| 638 | | |
| 806 | | |
| 214 | | |
| 300 | |
| Total | |
$ | 4,565 | | |
$ | 3,151 | | |
$ | 1,352 | | |
$ | 1,712 | |
| 10. | SELLING
AND MARKETING EXPENSES |
| (in thousands) | |
Nine months
ended
30-Sep-23 | | |
Nine months
ended
30-Sep-22 | | |
Three months
ended
30-Sep-23 | | |
Three months
ended
30-Sep-22 | |
| Salaries and related expenses | |
$ | 2,007 | | |
$ | 1,981 | | |
$ | 691 | | |
$ | 720 | |
| Advertising and marketing | |
$ | 1,321 | | |
| 1,334 | | |
| 697 | | |
| 472 | |
| Travel and conferences | |
$ | 137 | | |
| 119 | | |
| 36 | | |
| 33 | |
| Total | |
$ | 3,465 | | |
$ | 3,434 | | |
$ | 1,424 | | |
$ | 1,225 | |
| 11. | GENERAL
AND ADMINISTRATIVE EXPENSES |
| (in thousands) | |
Nine months
ended
30-Sep-23 | | |
Nine months
ended
30-Sep-22 | | |
Three months
ended
30-Sep-23 | | |
Three months
ended
30-Sep-22 | |
| Salaries and related expenses | |
$ | 725 | | |
| 438 | | |
$ | 284 | | |
$ | 144 | |
| Professional services | |
| 1,622 | | |
| 1,349 | | |
| 296 | | |
| 408 | |
| Consulting and director fees | |
| 782 | | |
| 949 | | |
| 296 | | |
| 251 | |
| Travel | |
| 63 | | |
| 107 | | |
| 16 | | |
| 9 | |
| Office and general | |
| 906 | | |
| 1,244 | | |
| 296 | | |
| 260 | |
| Regulatory and filing fees | |
| 143 | | |
| 109 | | |
| 59 | | |
| 44 | |
| Shareholder relations | |
| 173 | | |
| 489 | | |
| 71 | | |
| 58 | |
| Total | |
$ | 4,414 | | |
| 4,685 | | |
$ | 1,318 | | |
$ | 1,174 | |
Siyata Mobile Inc.
Notes to the Unaudited Condensed Interim Consolidated Financial Statements
(Expressed in US dollars)
As at September 30, 2023 and December
31, 2022 and for the three and nine month period ended September 30, 2023 and 2022
Transaction costs incurred in relation
to the January 2023 warrant raise and issuance described in Note 8 were $439,600 and were included in the change in fair value of warrant
liability on the statement of operations.
Transaction costs incurred in the nine
months ended September 30, 2022 were $965,247, which are costs incurred for the January 11, 2022 capital raise that were allocated to
the warrant liability and expensed through the statement of operations.
The fair values of the Company’s
cash, trade and other receivables, accounts payable and accrued liabilities and long-term debt, approximate carrying value, which is the
amount recorded on the consolidated statement of financial position.
Credit risk
Credit risk is the risk of an unexpected
loss if a customer or third party to a financial instrument fails to meet its contractual obligations. The Company places its cash with
institutions of high creditworthiness. Management has assessed there to be a low level of credit risk associated with its cash balances.
The Company’s exposure to credit
risk is influenced mainly by the individual characteristics of each customer. However, management also considers the demographics of the
Company’s customer base, including the default risk of the industry and country in which customers operate, as these factors may
have an influence on credit risk. Approximately 19% of the Company’s revenue for the nine months ended September 30, 2023 (September
30, 2022 -26%) is attributable to sales transactions with a single customer.
The Company has established a credit
policy under which each new customer is analyzed individually for creditworthiness before28 the Company’s standard payment and delivery
terms and conditions are offered. The Company’s review includes external ratings, when available, and in some cases bank references.
Purchase limits are established for each customer, which represents the maximum open amount without requiring approval from the Risk Management
Committee; these limits are reviewed quarterly. In prior years, certain key customers were offered extended payment terms on their purchases
due to slow down from Covid-19 and budget approvals for government tenders.
As a result, the Company had customers
with overdue receivables on their books which resulted in the Company taking a bad debt provision on these overdue receivables which amounted
to $1,047,802 at September 30, 2023 (September 30, 2022 - $1,028,000).
Siyata Mobile Inc.
Notes to the Unaudited Condensed Interim Consolidated Financial Statements
(Expressed in US dollars)
As at September 30, 2023 and December
31, 2022 and for the three and nine month period ended September 30, 2023 and 2022
| 13. | FINANCIAL
INSTRUMENTS (cont’d) |
More than 60% (2022 – 22%) of
the Company’s customers have been active with the Company for over four years, and the allowance for doubtful accounts of $1,047,802
(2022 - $1,028,000) has been recognized against these customers. In monitoring customer credit risk, customers are grouped according to
their credit characteristics, including whether they are an individual or legal entity, whether they are a wholesale, retail or end-user
customer, geographic location, industry, aging profile, maturity, and the existence of previous financial difficulties. Trade and other
receivables relate mainly to the Company’s wholesale customers. Customers that are graded as “high risk” are placed
on a restricted customer list and monitored by the Company.
The carrying amount of financial assets
represents the maximum credit exposure, notwithstanding the carrying amount of security or any other credit enhancements.
Liquidity risk
Liquidity risk is the risk that the
Company will encounter difficulty in meeting the obligations associated with its financial liabilities that are settled by delivering
cash or another financial asset. The Company’s approach to managing liquidity is to ensure, as far as possible, that it will always
have sufficient liquidity to meet its liabilities when due, under both normal and stressed conditions, without incurring unacceptable
losses or risking damage to the Company’s reputation.
The Company examines current forecasts
of its liquidity requirements so as to make certain that there is sufficient cash for its operating needs, and it is careful at all times
to have enough unused credit facilities so that the Company does not exceed its credit limits and is in compliance with its financial
covenants (if any). These forecasts take into consideration matters such as the Company’s plan to use debt for financing its activity,
compliance with required financial covenants, compliance with certain liquidity ratios, and compliance with external requirements such
as laws or regulation.
The Company uses activity-based costing
to cost its products and services, which assists it in monitoring cash flow requirements and optimizing its cash return on investments.
Typically, the Company ensures that it has sufficient cash on demand to meet expected operational expenses for a period of 90 days, including
the servicing of financial obligations; this excludes the potential impact of extreme circumstances that cannot reasonably be predicted,
such as natural disasters.
With the exception of employee benefits,
the Company’s accounts payable and accrued liabilities have contractual terms of 90 days. The employment benefits included in accrued
liabilities have variable maturities within the coming year.
Siyata Mobile Inc.
Notes to the Unaudited Condensed Interim Consolidated Financial Statements
(Expressed in US dollars)
As at September 30, 2023 and December
31, 2022 and for the three and nine month period ended September 30, 2023 and 2022
| 13. | FINANCIAL
INSTRUMENTS (cont’d) |
Market risk
Currency risk is the risk that the fair
value or future cash flows of a financial instrument will fluctuate because of changes in foreign exchange rates.
Interest rate risk is the risk that
the fair value of future cash flows will fluctuate as a result of changes in interest rates. The Company’s sensitivity to interest
rates is inherently involved in the calculation of the fair value of the warranty liability which are revalued based on changes parameters
which include the prevailing interest rate.
The Company is exposed to price risk
with respect to equity prices. Equity price risk is defined as the potential adverse impact on the Company’s earnings due to movements
in individual equity prices or general movements in the level of the stock market. The Company closely monitors individual equity movements,
and the stock market to determine the appropriate course of action to be taken by the Company.
| 14. | RELATED
PARTY TRANSACTIONS |
Key Personnel Compensation
Key management personnel includes those
persons having authority and responsibility for planning, directing, and controlling the activities of the Company as a whole. The Company
has determined that key management personnel consists of executive and non-executive members of the Company’s Board of Directors
and corporate officers. The remuneration of directors and key management personnel for the three and six month period ended June 30, 2023
and 2022 are as follows:
| | |
2023 | | |
2022 | |
| Payments to key management personnel: | |
| | |
| |
| Salaries, consulting and directors’ fees | |
$ | 1,007,410 | | |
$ | 1,162,885 | |
| Share-based payments | |
| 593,146 | | |
| 1,824,713 | |
| Total | |
$ | 1,600,556 | | |
$ | 2,987,598 | |
Siyata Mobile Inc.
Notes to the Unaudited Condensed Interim Consolidated Financial Statements
(Expressed in US dollars)
As at September 30, 2023 and December
31, 2022 and for the three and nine month period ended September 30, 2023 and 2022
| 14. | RELATED
PARTY TRANSACTIONS (cont’d) |
Salaries, consulting and
directors’ fees shown above are classified within profit and loss as shown below:
| | |
| |
(in thousands) | |
| Type of Service | |
Nature of Relationship | |
2023 | | |
2022 | |
| Selling and marketing expenses | |
VP Technology/VP Sales International | |
$ | 225 | | |
$ | 234 | |
| General and administrative expense | |
Companies controlled by the CEO, CFO and Directors | |
$ | 782 | | |
$ | 929 | |
| 15. |
SEGMENTED INFORMATION |
The Company is domiciled in Canada,
and it operates and produces its income primarily in Israel, Europe and North America. The Company operates as a single segment being
the sale of cellular-based communications products.
The Company’s entity-wide disclosures
include disaggregated information about product sales, geographical areas, and major customers.
Geographical area information is shown
below:
| External revenues by Geography for the three and nine month period ended | |
9 months ended Sep 30 | | |
3 months ended Sep 30 | |
| (in thousands) | |
2023 | | |
2022 | | |
2023 | | |
2022 | |
| USA | |
$ | 4,478 | | |
$ | 2,368 | | |
$ | 1,276 | | |
$ | 1,648 | |
| Canada | |
| 1,036 | | |
| 1,114 | | |
| 304 | | |
| 495 | |
| EMEA | |
| 842 | | |
| 841 | | |
| 262 | | |
| 391 | |
| Australia | |
| - | | |
| 47 | | |
| - | | |
| 34 | |
| Total | |
$ | 6,356 | | |
$ | 4,370 | | |
$ | 1,842 | | |
$ | 2,568 | |
Siyata Mobile Inc.
Notes to the Unaudited Condensed Interim Consolidated Financial Statements
(Expressed in US dollars)
As at September 30, 2023 and December
31, 2022 and for the three and nine month period ended September 30, 2023 and 2022
| 15. | SEGMENTED
INFORMATION (cont’d) |
Non-current asset geographic area information
is shown below:
| (in thousands) | |
Sept 30,
2023 | | |
December 31,
2022 | |
| Long-term receivable total | |
$ | 137 | | |
$ | 150 | |
| Canada | |
| - | | |
| - | |
| EMEA | |
| 137 | | |
| 150 | |
| | |
| | | |
| | |
| Right of use asset total | |
$ | 666 | | |
$ | 887 | |
| Canada | |
| 100 | | |
| 177 | |
| EMEA | |
| 566 | | |
| 710 | |
| | |
| | | |
| | |
| Equipment total | |
$ | 180 | | |
$ | 207 | |
| Canada | |
| - | | |
| - | |
| EMEA | |
| 180 | | |
| 207 | |
| | |
| | | |
| | |
| Intangibles total | |
$ | 7,997 | | |
$ | 6,988 | |
| Canada | |
| 36 | | |
| - | |
| EMEA | |
| 7,961 | | |
| 6,988 | |
Product information is shown below:
| Revenue by product line | |
9 months ended Sep 30 | | |
3 months ended Sep 30 | |
| (in thousands) | |
2023 | | |
2022 | | |
2023 | | |
2022 | |
| Cellular boosters and related accessories | |
$ | 1,800 | | |
| 1,882 | | |
$ | 778 | | |
| 717 | |
| Rugged devices and related accessories | |
$ | 4,556 | | |
| 2,488 | | |
$ | 1,064 | | |
| 1,851 | |
| Total | |
$ | 6,356 | | |
$ | 4,370 | | |
$ | 1,842 | | |
$ | 2,568 | |
Siyata Mobile Inc.
Notes to the Unaudited Condensed Interim Consolidated Financial Statements
(Expressed in US dollars)
As at September 30, 2023 and December
31, 2022 and for the three and nine month period ended September 30, 2023 and 2022
| 16. | SUPPLEMENTAL
INFORMATION WITH RESPECT TO CASH FLOWS |
| | |
Nine months ended
September 30 | |
| | |
2023 | | |
2022 | |
| Change in non-cash working capital: | |
| | |
| |
| Trade and other receivables | |
$ | (631,278 | ) | |
$ | (326,749 | ) |
| Prepaids | |
| (54,974 | ) | |
| (390,022 | ) |
| Inventory | |
| 1,596,000 | | |
| (2,903,506 | ) |
| Advances to suppliers | |
| (1,385,957 | ) | |
| (638,831 | ) |
| Accounts payable and accrued liabilities | |
| (489,431 | ) | |
| (528,817 | ) |
| Deferred revenue | |
| (149,600 | ) | |
| - | |
| | |
$ | (1,115,240 | ) | |
$ | (4,787,926 | ) |
For the nine months ended September
30, 2023, the Company paid $42,783 (September 30, 2022 - $39,869) in interest and $Nil (September 30, 2022 - $nil) in income taxes.
Subsequent to the period end, the Company’s
registered offering of common shares on October 31, 2023, resulted in the Company issuing both 1,870.000 common shares at $0.65 per share
plus 530,000 prefunded warrants at $0.64 per warrant, with a prefunded warrant exercise price of $0.01 per share, for total gross proceeds
of $1,554,700 before offering and underwriting expenses. On November 1, 2023, 180,000 of the prefunded warrants were exercised and converted
into 177,313 common shares of the Company.
On October 3, 2023, an investor exercised
their right to convert 900 RSU’s into 900 common shares of the Company.
27
59.20
1.04
3.19
8.61
20000000
false
--12-31
Q3
2023-09-30
0001649009
0001649009
2023-01-01
2023-09-30
0001649009
2023-09-30
0001649009
2022-12-31
0001649009
2022-01-01
2022-09-30
0001649009
2023-07-01
2023-09-30
0001649009
2022-07-01
2022-09-30
0001649009
ifrs-full:ClassesOfShareCapitalMember
2021-12-31
0001649009
syta:ReservesMember
2021-12-31
0001649009
ifrs-full:AccumulatedOtherComprehensiveIncomeMember
2021-12-31
0001649009
ifrs-full:RetainedEarningsMember
2021-12-31
0001649009
2021-12-31
0001649009
ifrs-full:ClassesOfShareCapitalMember
2022-01-01
2022-09-30
0001649009
syta:ReservesMember
2022-01-01
2022-09-30
0001649009
ifrs-full:AccumulatedOtherComprehensiveIncomeMember
2022-01-01
2022-09-30
0001649009
ifrs-full:RetainedEarningsMember
2022-01-01
2022-09-30
0001649009
ifrs-full:ClassesOfShareCapitalMember
2022-09-30
0001649009
syta:ReservesMember
2022-09-30
0001649009
ifrs-full:AccumulatedOtherComprehensiveIncomeMember
2022-09-30
0001649009
ifrs-full:RetainedEarningsMember
2022-09-30
0001649009
2022-09-30
0001649009
ifrs-full:ClassesOfShareCapitalMember
2022-12-31
0001649009
syta:ReservesMember
2022-12-31
0001649009
ifrs-full:AccumulatedOtherComprehensiveIncomeMember
2022-12-31
0001649009
ifrs-full:RetainedEarningsMember
2022-12-31
0001649009
ifrs-full:ClassesOfShareCapitalMember
2023-01-01
2023-09-30
0001649009
syta:ReservesMember
2023-01-01
2023-09-30
0001649009
ifrs-full:AccumulatedOtherComprehensiveIncomeMember
2023-01-01
2023-09-30
0001649009
ifrs-full:RetainedEarningsMember
2023-01-01
2023-09-30
0001649009
ifrs-full:ClassesOfShareCapitalMember
2023-09-30
0001649009
syta:ReservesMember
2023-09-30
0001649009
ifrs-full:AccumulatedOtherComprehensiveIncomeMember
2023-09-30
0001649009
ifrs-full:RetainedEarningsMember
2023-09-30
0001649009
syta:SiyataMobileCanadaIncMember
2023-01-01
2023-09-30
0001649009
syta:QueensgateResourcesCorpMember
2023-01-01
2023-09-30
0001649009
syta:QueensgateResourcesCorpMember
2023-09-30
0001649009
syta:QueensgateResourcesUSCorpMember
2023-01-01
2023-09-30
0001649009
syta:QueensgateResourcesUSCorpMember
2023-09-30
0001649009
syta:SiyataMobileCanadaIncMember
2023-01-01
2023-09-30
0001649009
syta:SiyataMobileCanadaIncMember
2023-09-30
0001649009
syta:SiyataMobileIsraelLtdMember
2023-01-01
2023-09-30
0001649009
syta:SiyataMobileIsraelLtdMember
2023-09-30
0001649009
syta:SignifiMobileIncMember
2023-01-01
2023-09-30
0001649009
syta:SignifiMobileIncMember
2023-09-30
0001649009
syta:ClearRFNevadaLtdMember
2023-01-01
2023-09-30
0001649009
syta:ClearRFNevadaLtdMember
2023-09-30
0001649009
syta:NorthAmericanReceivablesMember
2023-04-01
2023-04-30
0001649009
syta:NorthAmericanReceivablesMember
2023-04-30
0001649009
2023-04-30
0001649009
2021-11-03
2021-11-03
0001649009
2022-01-01
2022-03-31
0001649009
2022-01-01
2022-01-13
0001649009
2022-05-01
2022-05-31
0001649009
2022-03-31
0001649009
2023-01-01
2023-01-19
0001649009
ifrs-full:TopOfRangeMember
2023-01-01
2023-01-19
0001649009
ifrs-full:BottomOfRangeMember
2023-01-01
2023-01-19
0001649009
syta:CommonSharesMember
2023-01-01
2023-01-19
0001649009
ifrs-full:WarrantsMember
2023-01-01
2023-01-19
0001649009
ifrs-full:WarrantsMember
2023-01-19
0001649009
syta:CommonSharesMember
2023-01-19
0001649009
2023-01-01
2023-03-30
0001649009
syta:January192023WarrantsMember
2023-01-01
2023-01-19
0001649009
2021-11-01
2021-11-03
0001649009
ifrs-full:WarrantsMember
2021-11-01
2021-11-03
0001649009
2022-01-03
2022-01-03
0001649009
syta:November32021WarrantsMember
2022-01-01
2022-12-31
0001649009
2022-01-01
2022-01-11
0001649009
syta:BlackScholesOptionPricingModelMember
2022-01-01
2022-12-31
0001649009
2022-10-01
2022-10-12
0001649009
syta:October122022WarrantsMember
2022-01-01
2022-12-31
0001649009
syta:October122022WarrantsMember
2022-12-31
0001649009
syta:October122022WarrantsMember
2023-01-01
2023-01-19
0001649009
syta:BlackScholesOptionPricingModelMember
2023-01-01
2023-01-19
0001649009
syta:October122022WarrantsMember
2023-01-19
0001649009
syta:October122022WarrantsMember
syta:PriorToExerciseMember
2023-01-01
2023-01-19
0001649009
syta:BlackScholesOptionPricingModelMember
syta:PriorToExerciseMember
2023-01-01
2023-01-19
0001649009
syta:October122022WarrantsMember
syta:PriorToExerciseMember
2023-01-19
0001649009
syta:October122022WarrantsMember
2023-01-01
2023-09-30
0001649009
syta:October122022WarrantsMember
2023-01-01
2023-03-30
0001649009
2022-01-01
2022-12-31
0001649009
syta:November32021Member
2022-12-31
0001649009
syta:January112022Member
2022-12-31
0001649009
syta:October122022Member
2022-12-31
0001649009
syta:January192023Member
2022-12-31
0001649009
syta:November32021Member
2023-01-01
2023-09-30
0001649009
syta:January112022Member
2023-01-01
2023-09-30
0001649009
syta:October122022Member
2023-01-01
2023-09-30
0001649009
syta:January192023Member
2023-01-01
2023-09-30
0001649009
syta:November32021Member
2023-09-30
0001649009
syta:January112022Member
2023-09-30
0001649009
syta:October122022Member
2023-09-30
0001649009
syta:January192023Member
2023-09-30
0001649009
ifrs-full:OrdinarySharesMember
2023-09-30
0001649009
ifrs-full:OrdinarySharesMember
2022-12-31
0001649009
syta:CommonShareTransactionsMember
ifrs-full:OrdinarySharesMember
2023-09-30
0001649009
ifrs-full:WarrantsMember
2023-01-01
2023-09-30
0001649009
ifrs-full:WarrantsMember
2023-09-30
0001649009
ifrs-full:WarrantsMember
2023-01-01
2023-09-30
0001649009
2023-06-30
0001649009
2023-06-28
0001649009
2023-06-01
2023-06-28
0001649009
syta:NonAdjustingEventMember
2023-07-13
0001649009
syta:NonAdjustingEventMember
2023-07-13
2023-07-13
0001649009
2022-01-11
0001649009
syta:PreFundedUnitsMember
2023-01-01
2023-09-30
0001649009
syta:OptionWarrantsMember
2023-01-01
2023-09-30
0001649009
syta:OptionWarrantsMember
2023-09-30
0001649009
syta:PlacementAgentWarrantsMember
2023-01-01
2023-09-30
0001649009
syta:PlacementAgentWarrantsMember
2023-09-30
0001649009
syta:PlacementAgentWarrantsMember
2022-01-11
2022-01-11
0001649009
2022-01-11
2022-01-11
0001649009
syta:ClearRFAcquisitionMember
2022-03-01
2022-03-31
0001649009
syta:ClearRFAcquisitionMember
2022-03-31
0001649009
syta:StockOptionsMember
2023-01-01
2023-09-30
0001649009
2022-01-01
2022-01-01
0001649009
2022-01-01
0001649009
2022-04-13
2022-04-13
0001649009
2022-04-13
0001649009
2023-01-12
2023-01-12
0001649009
syta:StockOptionsMember
2021-12-31
0001649009
syta:StockOptionsMember
2022-01-01
2022-12-31
0001649009
syta:StockOptionsMember
2022-12-31
0001649009
syta:StockOptionsMember
2023-01-01
2023-09-30
0001649009
syta:StockOptionsMember
2023-09-30
0001649009
ifrs-full:RestrictedShareUnitsMember
2021-12-31
0001649009
ifrs-full:RestrictedShareUnitsMember
2022-01-01
2022-12-31
0001649009
ifrs-full:RestrictedShareUnitsMember
2022-12-31
0001649009
ifrs-full:RestrictedShareUnitsMember
2023-01-01
2023-09-30
0001649009
ifrs-full:RestrictedShareUnitsMember
2023-09-30
0001649009
syta:AgentsOptionsMember
2021-12-31
0001649009
syta:AgentsOptionsMember
2022-01-01
2022-12-31
0001649009
syta:AgentsOptionsMember
2022-12-31
0001649009
syta:AgentsOptionsMember
2023-01-01
2023-09-30
0001649009
syta:AgentsOptionsMember
2023-09-30
0001649009
syta:SharePurchaseWarrantsMember
2021-12-31
0001649009
syta:SharePurchaseWarrantsMember
2022-01-01
2022-12-31
0001649009
syta:SharePurchaseWarrantsMember
2022-12-31
0001649009
syta:SharePurchaseWarrantsMember
2023-01-01
2023-09-30
0001649009
syta:SharePurchaseWarrantsMember
2023-09-30
0001649009
syta:TwentyFourDecemberTwoThousandEighteenMember
syta:StockOptionsMember
2023-09-30
0001649009
syta:TwentyFourDecemberTwoThousandEighteenMember
syta:StockOptionsMember
2023-01-01
2023-09-30
0001649009
syta:FifteenJanuaryTwoThousandNineteenMember
syta:StockOptionsMember
2023-09-30
0001649009
syta:FifteenJanuaryTwoThousandNineteenMember
syta:StockOptionsMember
2023-01-01
2023-09-30
0001649009
syta:TwentyOneMarchNineteenMember
syta:StockOptionsMember
2023-09-30
0001649009
syta:TwentyOneMarchNineteenMember
syta:StockOptionsMember
2023-01-01
2023-09-30
0001649009
syta:OneJanTwentyMember
syta:StockOptionsMember
2023-09-30
0001649009
syta:OneJanTwentyMember
syta:StockOptionsMember
2023-01-01
2023-09-30
0001649009
syta:FifteenNovemberTwoThousandTwentyMember
syta:StockOptionsMember
2023-09-30
0001649009
syta:FifteenNovemberTwoThousandTwentyMember
syta:StockOptionsMember
2023-01-01
2023-09-30
0001649009
syta:FifteenNovemberThousandTwentyOneMember
syta:StockOptionsMember
2023-09-30
0001649009
syta:FifteenNovemberThousandTwentyOneMember
syta:StockOptionsMember
2023-01-01
2023-09-30
0001649009
syta:TwoJanTwentyOneMember
syta:StockOptionsMember
2023-09-30
0001649009
syta:TwoJanTwentyOneMember
syta:StockOptionsMember
2023-01-01
2023-09-30
0001649009
syta:TwoJanTwentyOne1Member
syta:StockOptionsMember
2023-09-30
0001649009
syta:TwoJanTwentyOne1Member
syta:StockOptionsMember
2023-01-01
2023-09-30
0001649009
syta:EighteenthJanuaryTwoThousandAndTwentyOneMember
syta:StockOptionsMember
2023-09-30
0001649009
syta:EighteenthJanuaryTwoThousandAndTwentyOneMember
syta:StockOptionsMember
2023-01-01
2023-09-30
0001649009
syta:OneJanuaryTwoThousandAndTwentyTwoMember
syta:StockOptionsMember
2023-09-30
0001649009
syta:OneJanuaryTwoThousandAndTwentyTwoMember
syta:StockOptionsMember
2023-01-01
2023-09-30
0001649009
syta:ThirteenthAprilTwoThousandAndTwentyTwoMember
syta:StockOptionsMember
2023-09-30
0001649009
syta:ThirteenthAprilTwoThousandAndTwentyTwoMember
syta:StockOptionsMember
2023-01-01
2023-09-30
0001649009
syta:twelveJulyTwoThousandAndTwentyTwoMember
syta:StockOptionsMember
2023-09-30
0001649009
syta:twelveJulyTwoThousandAndTwentyTwoMember
syta:StockOptionsMember
2023-01-01
2023-09-30
0001649009
syta:NineMarchTwoThousandTwnetyTwoMember
ifrs-full:RestrictedShareUnitsMember
2023-09-30
0001649009
syta:ThirteenAprilTwoThousandTwentyTwoMember
ifrs-full:RestrictedShareUnitsMember
2023-09-30
0001649009
syta:TwevleJulyTwoThousandTwentyTwoMember
ifrs-full:RestrictedShareUnitsMember
2023-09-30
0001649009
syta:TwentyNineSeptemberTwentyMember
syta:AgentOptionOutstandingMember
2023-09-30
0001649009
syta:TwentyNineSeptemberTwentyMember
syta:AgentOptionOutstandingMember
2023-01-01
2023-09-30
0001649009
syta:TwentyNineSeptemberTwoThousandTwentyOneMember
syta:AgentOptionOutstandingMember
2023-09-30
0001649009
syta:TwentyNineSeptemberTwoThousandTwentyOneMember
syta:AgentOptionOutstandingMember
2023-01-01
2023-09-30
0001649009
syta:ThirtyDecemberTwentyMember
syta:AgentOptionOutstandingMember
2023-09-30
0001649009
syta:ThirtyDecemberTwentyMember
syta:AgentOptionOutstandingMember
2023-01-01
2023-09-30
0001649009
syta:ElevenDecemberTwentyTwoMember
syta:AgentOptionOutstandingMember
2023-09-30
0001649009
syta:ElevenDecemberTwentyTwoMember
syta:AgentOptionOutstandingMember
2023-01-01
2023-09-30
0001649009
syta:OneAprilTwentyTwoMember
syta:AgentOptionOutstandingMember
2023-09-30
0001649009
syta:OneAprilTwentyTwoMember
syta:AgentOptionOutstandingMember
2023-01-01
2023-09-30
0001649009
syta:AgentOptionOutstandingMember
2023-09-30
0001649009
syta:AgentOptionOutstandingMember
2023-01-01
2023-09-30
0001649009
syta:TwentyNineSeptemberTwenty2Member
syta:AgentOptionOutstandingMDAMember
2023-09-30
0001649009
syta:TwentyNineSeptemberTwenty2Member
syta:AgentOptionOutstandingMDAMember
2023-01-01
2023-09-30
0001649009
syta:TwentyNineSeptemberTwenty3Member
syta:AgentOptionOutstandingMDAMember
2023-09-30
0001649009
syta:TwentyNineSeptemberTwenty3Member
syta:AgentOptionOutstandingMDAMember
2023-01-01
2023-09-30
0001649009
syta:ThirtyfirstDecemberTwoThousandTwentyMember
syta:AgentOptionOutstandingMDAMember
2023-09-30
0001649009
syta:ThirtyfirstDecemberTwoThousandTwentyMember
syta:AgentOptionOutstandingMDAMember
2023-01-01
2023-09-30
0001649009
syta:ElevenDecemberTwentyTwo1Member
syta:AgentOptionOutstandingMDAMember
2023-09-30
0001649009
syta:ElevenDecemberTwentyTwo1Member
syta:AgentOptionOutstandingMDAMember
2023-01-01
2023-09-30
0001649009
syta:OneAprilTwentyTwoMember
syta:AgentOptionOutstandingMDAMember
2023-09-30
0001649009
syta:OneAprilTwentyTwoMember
syta:AgentOptionOutstandingMDAMember
2023-01-01
2023-09-30
0001649009
syta:ThirtyFirstOctoberTwentyThreeMember
syta:AgentOptionOutstandingMDAMember
2023-09-30
0001649009
syta:ThirtyFirstOctoberTwentyThreeMember
syta:AgentOptionOutstandingMDAMember
2023-01-01
2023-09-30
0001649009
syta:AgentOptionOutstandingMDAMember
2023-09-30
0001649009
syta:AgentOptionOutstandingMDAMember
2023-01-01
2023-09-30
0001649009
syta:TwentyNineSeptemberTwentyMember
syta:SharePurchaseWarrantsMember
2023-09-30
0001649009
syta:TwentyNineSeptemberTwentyMember
syta:SharePurchaseWarrantsMember
2023-01-01
2023-09-30
0001649009
syta:ThirtyOneDecemberTwenty3Member
syta:SharePurchaseWarrantsMember
2023-09-30
0001649009
syta:ThirtyOneDecemberTwenty3Member
syta:SharePurchaseWarrantsMember
2023-01-01
2023-09-30
0001649009
syta:ElevenDecemberTwentyTwo2Member
syta:SharePurchaseWarrantsMember
2023-09-30
0001649009
syta:ElevenDecemberTwentyTwo2Member
syta:SharePurchaseWarrantsMember
2023-01-01
2023-09-30
0001649009
2023-01-31
0001649009
syta:CustomerOneMember
2023-01-01
2023-09-30
0001649009
syta:CustomerOneMember
2022-01-01
2022-09-30
0001649009
syta:VPTechnologyMember
2023-01-01
2023-09-30
0001649009
syta:VPTechnologyMember
2022-01-01
2022-09-30
0001649009
syta:CEOCFOAndDirectorsMember
2023-01-01
2023-09-30
0001649009
syta:CEOCFOAndDirectorsMember
2022-01-01
2022-09-30
0001649009
country:US
2023-01-01
2023-09-30
0001649009
country:US
2022-01-01
2022-09-30
0001649009
country:US
2023-07-01
2023-09-30
0001649009
country:US
2022-07-01
2022-09-30
0001649009
country:CA
2023-01-01
2023-09-30
0001649009
country:CA
2022-01-01
2022-09-30
0001649009
country:CA
2023-07-01
2023-09-30
0001649009
country:CA
2022-07-01
2022-09-30
0001649009
syta:EMEAOneMember
2023-01-01
2023-09-30
0001649009
syta:EMEAOneMember
2022-01-01
2022-09-30
0001649009
syta:EMEAOneMember
2023-07-01
2023-09-30
0001649009
syta:EMEAOneMember
2022-07-01
2022-09-30
0001649009
country:AU
2023-01-01
2023-09-30
0001649009
country:AU
2022-01-01
2022-09-30
0001649009
country:AU
2023-07-01
2023-09-30
0001649009
country:AU
2022-07-01
2022-09-30
0001649009
country:CA
2023-09-30
0001649009
country:CA
2022-12-31
0001649009
syta:EuropeTheMiddleEastAndAfricaMember
2023-09-30
0001649009
syta:EuropeTheMiddleEastAndAfricaMember
2022-12-31
0001649009
syta:CellularBoostersAndRelatedAccessoriesMember
2023-01-01
2023-09-30
0001649009
syta:CellularBoostersAndRelatedAccessoriesMember
2022-01-01
2022-09-30
0001649009
syta:CellularBoostersAndRelatedAccessoriesMember
2023-07-01
2023-09-30
0001649009
syta:CellularBoostersAndRelatedAccessoriesMember
2022-07-01
2022-09-30
0001649009
syta:RuggedDevicesAndRelatedAccessoriesMember
2023-01-01
2023-09-30
0001649009
syta:RuggedDevicesAndRelatedAccessoriesMember
2022-01-01
2022-09-30
0001649009
syta:RuggedDevicesAndRelatedAccessoriesMember
2023-07-01
2023-09-30
0001649009
syta:RuggedDevicesAndRelatedAccessoriesMember
2022-07-01
2022-09-30
0001649009
syta:NonAdjustingEventMember
2023-11-01
2023-11-01
0001649009
ifrs-full:RestrictedShareUnitsMember
syta:NonAdjustingEventMember
2023-10-03
0001649009
ifrs-full:RightofuseAssetsMember
syta:NonAdjustingEventMember
2023-10-03
iso4217:USD
xbrli:shares
iso4217:USD
xbrli:shares
xbrli:pure
Exhibit 99.2

Management Discussion and Analysis
(Expressed in U.S. Dollars)
As at and for the three and nine month period ended
September 30, 2023 and September 30, 2022
Prepared on November 15, 2023
CAUTIONARY NOTE REGARDING FORWARD-LOOKING STATEMENTS
This
MD&A contains “forward-looking statements,” which includes information relating to future events, future financial performance,
financial projections, strategies, expectations, competitive environment and regulation. Words such as “may,” “should,”
“could,” “would,” “predicts,” “potential,” “continue,” “expects,”
“anticipates,” “future,” “intends,” “plans,” “believes,” “estimates,”
and similar expressions, as well as statements in future tense, identify forward-looking statements. Forward-looking statements should
not be read as a guarantee of future performance or results and may not be accurate indications of when such performance or results will
be achieved. Forward-looking statements are based on information we have when those statements are made or management’s good faith
belief as of that time with respect to future events, and are subject to significant risks and uncertainties that could cause actual performance
or results to differ materially from those expressed in or suggested by the forward-looking statements. Important factors that could cause
such differences include, but are not limited to:
| |
● |
the size and growth potential of the markets for our products, and our ability to serve those markets; |
| |
● |
the rate and degree of market acceptance of our products; |
| |
● |
our ability to expand our sales organization to address effectively existing and new markets that we intend to target; |
| |
● |
impact from future regulatory, judicial, and legislative changes or developments in the U.S. and foreign countries; |
| |
● |
our ability to compete effectively in a competitive industry; |
| |
● |
our ability to obtain funding for our operations and effectively utilize the capital raised therefrom; |
| |
● |
our ability to attract collaborators and strategic partnerships; |
| |
● |
our ability to meet the continued listing requirements and standards of the Nasdaq Capital Market, or Nasdaq; |
| |
● |
our ability to meet our financial operating objectives; |
| |
● |
the availability of, and our ability to attract, qualified employees for our business operations; |
| |
● |
general business and economic conditions; |
| |
● |
our ability to meet our financial obligations as they become due; |
| |
● |
positive cash flows and financial viability of our operations and any new business opportunities; |
| |
● |
our ability to secure intellectual property rights over our proprietary products or enter into license agreements to secure the legal use of certain patents and intellectual property; |
| |
● |
our ability to be successful in new markets; |
| |
● |
our ability to avoid infringement of intellectual property rights; and |
| |
● |
the effects of the wars in both Ukraine and the Middle East. |
The
foregoing does not represent an exhaustive list of matters that may be covered by the forward-looking statements contained herein or risk
factors that we are faced with that may cause our actual results to differ from those anticipated in our forward-looking statements. Please
see “Item 3. Key Information – D. Risk Factors,” “Item 4. Information on the Company,” and “Item 5.
Operating and Financial Review and Prospects” for additional factors that could adversely impact our business and financial performance.
Moreover,
new risks regularly emerge and it is not possible for our management to predict or articulate all the risks we face, nor can we assess
the impact of all risks on our business or the extent to which any risk, or combination of risks, may cause actual results to differ from
those contained in any forward-looking statements. All forward-looking statements included in this Annual Report are based on information
available to us on the date of this Annual Report. Except to the extent required by applicable laws or rules, we undertake no obligation
to publicly update or revise any forward-looking statement, whether as a result of new information, future events or otherwise. All subsequent
written and oral forward-looking statements attributable to us or persons acting on our behalf are expressly qualified in their entirety
by the cautionary statements contained above and throughout this Annual Report.
Readers are urged to carefully
review and consider the various disclosures made throughout this MD&A which are designed to advise interested parties of the risks
and factors that may affect our business, financial condition, results of operations and prospects.
You should not put undue reliance
on any forward-looking statements. Any forward-looking statements in this MD&A Report are made as of the date hereof, and we undertake
no obligation to publicly update or revise any forward-looking statements, whether as a result of new information, future events or otherwise,
except as required by law.
ITEM 1. IDENTITY OF DIRECTORS, SENIOR MANAGEMENT
AND ADVISERS
Not applicable.
ITEM 2. OFFER STATISTICS AND EXPECTED TIMETABLE
Not applicable.
ITEM 3. KEY INFORMATION
| B. |
Capitalization and Indebtedness |
Not applicable.
| C. |
Reasons for the Offer and Use of Proceeds |
Not applicable.
You should carefully consider
the risks described below, together with all of the other information in this Annual Report. The risks described below are not the only
risks facing us. Additional risks and uncertainties not currently known to us or that we currently deem to be immaterial may also materially
and adversely affect our business operations. If any of these risks actually occurs, our business and financial condition could suffer
and the price of our Common Shares and warrants to purchase Common Shares, or the Warrants, could decline.
Summary of Risk Factors
Risks Related to Our Financial Condition
and Capital Requirements
| |
● |
We have a history of operating losses and we may never achieve or maintain profitability. |
| |
● |
Our consolidated audited
financial statements for the fiscal year ended December 31, 2022 and our unaudited condensed interim consolidated financial
statements for the three and nine month period ended September 30, 2023, both include a “going concern”
explanatory paragraph expressing substantial doubt about our ability to continue as an ongoing business for the next twelve months.
Our consolidated financial statements do not include any adjustments that may result from the outcome of this uncertainty. If we
cannot secure the financing needed to continue as a viable business, our shareholders may lose some or all of their investment in
us. |
| |
● |
In 2022, our independent registered public accountants identified three material weaknesses in our internal controls over financial reporting. If we are unable to remediate these material weaknesses, we may not be able to report our financial results accurately, prevent fraud or file our periodic reports as a public company in a timely manner. In 2021, our independent registered public accountants identified five material weaknesses in our internal controls over financial reporting, which have only been partially remediated. |
Risks Related to Our Business and Industry
| |
● |
We rely on our channel partners to generate a substantial majority of our revenues. If these channel partners fail to perform or if we cannot enter into agreements with channel partners on favorable terms, our operating results could be significantly harmed. |
| |
● |
We are materially dependent on the adoption of our solutions by both the industrial enterprise and public sector markets, and if end customers in those markets do not purchase our solutions, our revenues will be adversely impacted, and we may not be able to expand into other markets. |
| |
● |
We participate in a competitive industry, which may become more competitive. Competitors with greater resources and significant experience in high-volume product manufacturing may be able to respond more quickly and cost-effectively than we can to new or emerging technologies and changes in customer requirements. |
| |
● |
Defects in our products could reduce demand for our products and result in a loss of sales, delay in market acceptance and injury to our reputation, which would adversely impact our business. |
| |
● |
If our business does not grow as we expect, or if we fail to manage our growth effectively, our operating results and business would suffer. |
| |
● |
We may not be able to continue to develop solutions to address user needs effectively in an industry characterized by ongoing change and rapid technological advances. |
| |
● |
The markets for our devices and related accessories may not develop as quickly as we expect, or may not develop at all. Our dependence on our cellular carrier channel partners and their success in promoting Push to Talk over Cellular to their client base is key for the success of the business. |
| |
● |
Our future success is dependent on our ability to create independent brand awareness for our company and products with end customers, and our inability to achieve such brand awareness could limit our prospects. |
| |
● |
We are dependent on the continued services and performance of a concentrated group of senior management and other key personnel, the loss of any of whom could adversely impact our business. |
| |
● |
We compete in a rapidly evolving market, and the failure to respond quickly and effectively to changing market requirements could cause our business and operating results to decline. |
| |
● |
If we are unable to sell our solutions into new markets, our revenues may not grow. |
| |
● |
If we are unable to attract, integrate and retain additional qualified personnel, including top technical talent, our business could be adversely impacted. |
| |
● |
A security breach or other significant disruption of our information technology (“IT”) systems or those of our partners, suppliers or manufacturers, caused by cyberattacks or other means, could have a negative impact on our operations, sales, and operating results. |
| |
● |
We experience lengthy sales cycles for our products and the delay of an expected large order could result in a significant unexpected revenue shortfall. |
| |
● |
We have a limited history of contracting with third party manufacturers in Asia for the high-volume commercial production of our devices, and we may face manufacturing capacity constraints. |
| |
● |
Our financial condition and results of operations as well as those of potential customers could be adversely affected by the Russian invasion of Ukraine, which has caused a material adverse effect on the level of economic activity around the world, including in the markets we serve. |
| |
● |
We rely on industry data and projections which may prove to be inaccurate. |
Risks Related to our Reliance on Third
Parties
| |
● |
As we work with multiple vendors for our components, if we fail to adequately forecast demand for our inventory and supply needs, we could incur additional costs or experience manufacturing delays, which could reduce our gross margin or cause us to delay or even lose sales. |
| |
● |
Our dependence on third-party suppliers for key components of our products could delay shipment of our products and reduce our sales. |
| |
● |
Because we rely on a small number of channel partners/customers for a large portion of our revenue, the loss of any of these customers would have a material adverse effect on our operating results and cash flows. |
| |
|
|
| |
● |
The application development ecosystem supporting our devices and related accessories is new and evolving. |
| |
● |
Failure of our suppliers, subcontractors, distributors, resellers, and representatives to use acceptable legal or ethical business practices, or to fail for any other reason, could negatively impact our business. |
| |
● |
Our products are subject to risks associated with sourcing and manufacturing. |
| |
● |
The nature of our business may result in undesirable press coverage or other negative publicity, which would adversely impact our brand identity, future sales and results of operations. |
| |
● |
Changes in the availability of federal funding to support local public safety or other public sector efforts could impact our opportunities with public sector end customers. |
| |
● |
Economic uncertainties or downturns, or political changes, could limit the availability of funds available to our customers and potential customers, which could significantly adversely impact our business. |
| |
● |
Natural or man-made disasters and other similar events may significantly disrupt our business, and negatively impact our operating results and financial condition. |
| |
● |
We are exposed to risks associated with strategic acquisitions and investments. |
| |
● |
We could be adversely impacted by changes in accounting standards and subjective assumptions, estimates and judgments by management related to complex accounting matters. |
Risks Related to Government Regulation
| |
● |
We are subject to anti-corruption, anti-bribery, anti-money laundering, economic sanctions, export control, and similar laws. Non- compliance with such laws can subject us to criminal or civil liability and harm our business, revenues, financial condition and results of operations. |
| |
● |
We are subject to a wide range of product regulatory and safety, consumer, worker safety and environmental laws and regulations. |
| |
● |
Changes in laws and regulations concerning the use of telecommunication bandwidth could increase our costs and adversely impact our business. |
| |
● |
We are subject to a wide range of privacy and data security laws, regulations and other legal obligations. |
Risks Related to Our Intellectual Property
| |
● |
If we are unable to successfully protect our intellectual property, our competitive position may be harmed. |
| |
● |
Others may claim that we infringe on their intellectual property rights, which may result in costly and time-consuming litigation and could delay or otherwise impair the development and commercialization of our products. |
| |
● |
Our use of open source software could subject us to possible litigation or otherwise impair the development of our products. |
| |
● |
Our inability to obtain and maintain any third-party license required to develop new products and product enhancements could seriously harm our business, financial condition and results of operations. |
Risks Related to our Locations in Israel
and Canada and Our International Operations
| |
● |
Conditions in Israel could materially and adversely affect our business. |
| |
● |
It may be difficult to enforce a U.S. judgment against us, our officers and directors named herein in Israel or the United States, or to assert U.S. securities laws claims in Israel or serve process on our officers and directors. |
| |
● |
Because we are a corporation incorporated in British Columbia and some of our directors and officers are resident in Canada, it may be difficult for investors in the United States to enforce civil liabilities against us based solely upon the federal securities laws of the United States. Similarly, it may be difficult for Canadian investors to enforce civil liabilities against our directors and officers residing outside of Canada. |
| |
● |
We have operations in China, which exposes us to risks inherent in doing business there. |
| |
● |
The impact of potential changes in customs, tariffs, and trade policies in the United States and the potential corresponding actions by other countries, in which we do business could adversely impact our financial performance. |
| |
● |
Operating outside of the United States presents specific risks to our business, and we have substantial operations outside of the United States. |
| |
● |
Foreign currency fluctuations may reduce our competitiveness and sales in foreign markets. |
Risks Related to Ownership of Our Securities
| |
● |
We may require additional capital to fund our business and support our growth, and our inability to generate and obtain such capital on acceptable terms, or at all, could harm our business, operating results, financial condition and prospects. In addition, such funding may dilute our existing shareholders. |
| |
● |
We expect that our stock price will fluctuate significantly, and you may not be able to resell your shares at or above the public offering price you paid for your shares. |
| |
● |
If our Common Shares become subject to the penny stock rules, it may be more difficult to sell our Common Shares. |
| |
● |
If we fail to maintain proper and effective internal controls, our ability to produce accurate financial statements on a timely basis could be impaired. |
| |
● |
We will continue to incur significant increased costs as a result of operating as a public company in the United States, and our management will be required to devote substantial time to new compliance initiatives. |
| |
● |
Because we are a foreign private issuer and are exempt from certain Nasdaq corporate governance standards applicable to U.S. issuers, you will have less protection than you would have if we were a domestic issuer. |
| |
● |
We may lose our foreign private issuer status in the future, which could result in significant additional costs and expenses. |
| |
● |
We will continue to incur significant increased costs as a result of operating as a public company in the United States, and our management will be required to devote substantial time to new compliance initiatives. |
| |
● |
Our executive officers and directors, and their affiliated entities, along with our two other largest stockholders, own a significant percentage of our stock and will be able to exert significant control over matters subject to stockholder approval. |
| |
● |
The exercise of the outstanding warrants may further dilute the Common Shares and adversely impact the price of our Common Shares. |
| |
● |
The market for our Common Shares may not provide investors with adequate liquidity. |
| |
● |
Since we do not expect to pay any cash dividends for the foreseeable future, investors in our common shares may be forced to sell their stock in order to obtain a return on their investment. |
| |
● |
If securities or industry analysts do not publish research or publish inaccurate or unfavorable research about our business, our stock price and trading volume could decline. |
| |
● |
A possible “short squeeze” due to a sudden increase in demand of our Common Shares that largely exceeds supply may lead to price volatility in our Common Shares. |
| |
● |
The Company was under a cease trading order with the British Columbia Securities Commission, for late filing of the Company’s three month ended March 31, 2023 financial statements which was rectified on May 24, 2023. |
| |
● |
The Company has received a
notice from NASDAQ that the Company is in default of maintaining a minimum bid price of $1.00 per share. In the event this is not
rectified by August 21, 2023, the Company will be de-listed from NASDAQ exchange. The Company has affected a 100-to-1 reverse stock
split on August 10, 2023 and since the price remained above $1.00 for ten consecutive days, NASDAQ rescinded the default
notice. |
Risks Related to Our Financial Position and
Capital Requirements
We have a history of operating losses
and we may never achieve or maintain profitability.
We
have a limited operating history and a history of losses from operations. As of September 30, 2023 accumulated deficit of $86,885,452.
Our existing cash and cash equivalents will be insufficient to fully fund our business plan. Our ability to achieve profitability will
depend on whether we can obtain additional capital when we need it, complete the development of our technology, obtain required regulatory
approvals and continue to develop arrangements with channel partners. There can be no assurance that we will ever achieve profitability.
Our
independent registered public accounting firm, in its report on our financial statements for the year ended December 31, 2022, concurs
with management representation that raises substantial doubt about our ability to continue as a going concern.
We may require
additional capital to fund our business and support our growth, and our inability to generate and obtain such capital on acceptable terms,
or at all, could harm our business, operating results, financial condition and prospects.
We
intend to continue to make substantial investments to fund our business and support our growth. In addition, we may require additional
funds to respond to business challenges, including the need to develop new features or enhance our solutions, improve our operating infrastructure
or acquire or develop complementary businesses and technologies. As a result, in addition to the revenues we generate from our business,
we may need to engage in additional equity or debt financings to provide the funds required for these and other business endeavors. If
we raise additional funds through future issuances of equity or convertible debt securities, our existing stockholders could suffer significant
dilution, and any new equity securities we issue could have rights, preferences and privileges superior to those of holders of our Common
Shares. Any debt financing that we may secure in the future could involve restrictive covenants relating to our capital raising activities
and other financial and operational matters, which may make it more difficult for us to obtain additional capital and to pursue business
opportunities, including potential acquisitions. We may not be able to obtain such additional financing on terms favorable to us, if at
all. If we are unable to obtain adequate financing or financing on terms satisfactory to us when we require it, our ability to continue
to support our business growth and to respond to business challenges could be significantly impaired, and our business may be adversely
impacted. In addition, our inability to generate or obtain the financial resources needed may require us to delay, scale back, or eliminate
some or all of our operations, which may have a significant adverse impact on our business, operating results and financial condition.
Our independent
registered public accountants have noted that we may not survive as a going concern.
Our independent registered
public accountants have included a “going concern” explanatory paragraph in its report on our consolidated financial statements
for the fiscal year ended December 31, 2022, concurring with management representation of expressing substantial doubt about our
ability to continue as an ongoing business for the next twelve months. Our consolidated financial statements do not include any adjustments
that may result from the outcome of this uncertainty. If we cannot secure the financing needed to continue as a viable business, our shareholders
may lose some or all of their investment in us.
Our independent
registered public accountants have identified material weaknesses in our internal controls over financial reporting in both 2022 and 2021.
If we are unable to remediate these material weaknesses, we may not be able to report our financial results accurately, prevent fraud
or file our periodic reports as a public company in a timely manner.
In
connection with the audit of our consolidated financial statements for the years ended December 31, 2022 and 2021, our independent registered
public accountants identified several material weaknesses in our internal control over financial reporting. A “material weakness”
is a deficiency, or a combination of deficiencies, in internal control over financial reporting such that there is a reasonable possibility
that a material misstatement of our annual or interim financial statements will not be prevented or detected on a timely basis.
In
2022, our independent registered public accountants identified the following material weaknesses in our internal control over financial
reporting. The first material weakness related to our revenue recognition practices where we do not sufficiently review (i) product returns
in relation to product sales and (ii) for title transfer terms to determine when revenue should be recorded. The second material weakness
related to insufficient documentation of inventory controls relating to our inventory balances, advances to suppliers, and off-site inventory
tracking is limited. The third material weakness related to internal control weaknesses in the capitalization and coordination of development
costs to prevent excess payments and erroneously recorded invoices.
For
the material weaknesses identified in our 2022 audit, we have taken steps to remediate these material weaknesses, and to further strengthen
our accounting staff and internal controls, as detailed below:
| |
● |
With respect to the revenue recognition practices, management will consistently apply of IFRS15 with respect to the five criterion for revenue recognition, In addition, management will institute peer review of North American sales by the Israeli subsidiary’s chief financial officer and peer review by Company’s Chief Financial Officer of Israeli sales recognition policy on a quarterly basis and engage in dialogue on new customers to ensure the revenue recognition policy and the customer contracts are consistently applied. |
| |
● |
With respect to the inventory control weaknesses, management will institute the following remediation procedures: |
| |
● |
Monthly comparison of inventory first and last cost in USD$ between periods to note any changes and to investigate the reason for these discrepancies to provide a more accurate quantum of write downs and consistent costing. |
| |
● |
The implementation of an IT system to track the inventory movements in North America; |
| |
● |
Monthly comparison of inventory units between periods to note any changes and to investigate the reason for any inconsistencies. |
| |
● |
Obtain confirmation of goods in transit with external vendors and consignment customers on a more timely basis. |
| |
● |
With respect to the development cost weaknesses, the research and development team will be required to approve all invoices from the R&D sub-contractor and ensure they fall within the budget to ensure the amounts capitalized are not in excess of the original budget with its discounted cash flows. Once the R&D team has approved the invoice based on the above criteria, the Company’s Chief Executive Officer will review the documentation and once approved, will forward said documentation to the Company’s Chief Financial Officer in Canada for wire initiation. |
In
2021, our independent registered public accountants identified the following material weaknesses in our internal control over financial
reporting. The first material weakness related to the insufficient review of inventory balances for products which are slow-moving. The
second material weakness related to the insufficient review of advances to suppliers on products that are no longer selling, the third
material weakness relates to insufficient controls surrounding off-site inventory tracking. The fourth material weakness related to insufficient
review whether product returns relate to sales recorded in the fiscal year. The fifth material weakness relates to insufficient review
of title transfer terms to determine the period in which revenue should be recorded.
For
the material weaknesses identified in our 2021 audit, we have taken steps to remediate these material weaknesses, and to further strengthen
our accounting staff and internal controls, as detailed below:
| |
● |
On a quarterly basis, the Company now reviews inventory on hand for slow moving merchandise and reviews inventory on hand regularly. |
| |
● |
The Company now reviews quantities on hand before approving purchase orders. |
| |
● |
As of April 1, 2022, the Company signed a lease for their own exclusive warehouse space so that outside contract warehouses will not be required. |
| |
● |
The Company now reviews product returns to compare and ensure that they occur in the same fiscal year. |
| |
● |
The Company’s controller scrutinizes all revenues earned in the period to ensure compliance with IFRS15. |
| |
● |
The Company’s controller and CFO in Canada coordinates full scheduling of the year end process to ensure timely close off of accounting periods. |
To date, we have only partially
remediated the material weaknesses identified in 2022 and 2021 above. We cannot be certain that other material weaknesses and control
deficiencies will not be discovered in the future. If our efforts are not successful or other material weaknesses or control deficiencies
occur in the future, we may be unable to report our financial results accurately on a timely basis or help prevent fraud, which could
cause our reported financial results to be materially misstated and result in the loss of investor confidence or delisting and cause the
market price of our Common Shares to decline.
We began to take steps to
remediate these material weaknesses and strengthen our internal control over financial reporting, including the following:
| |
(i) |
documenting and formally assessing our accounting and financial reporting policies and procedures; and |
| |
(ii) |
increasing the use of third-party consultants in assessing significant accounting transactions and other technical accounting and financial reporting issues, preparing accounting memoranda addressing these issues and maintaining these memoranda in our corporate records. |
While we believe that
these efforts will improve our internal control over financial reporting, the implementation of these measures is ongoing and will require
validation and testing of the design and operating effectiveness of internal controls over a sustained period of financial reporting cycles.
We cannot assure you that the measures we have taken to date, and are continuing to implement, will be sufficient to maintain effective
internal control over financial reporting. Accordingly, there could continue to be a reasonable possibility that a misstatement of our
accounts or disclosures that would result in a material misstatement of our financial statements that would not be prevented or detected
on a timely basis.
Risks Related to Our Business and Industry
We rely on our
channel partners to generate a substantial majority of our revenues. If these channel partners fail to perform or if we cannot enter into
agreements with channel partners on favorable terms, our operating results could be significantly harmed.
More
than 65% of our revenues for the nine months ended September 30, 2023 (38% of our revenues for the nine month period ended September 30,
2022), were generated through sales by our channel partners, which are primarily wireless carriers who sell our devices through their
sales channels. To the extent our channel partners are unsuccessful in selling or do not promote our products, or we are unable to obtain
and retain a sufficient number of high-quality channel partners, our business and operating results could be significantly harmed. Our
channel partners are wireless carriers who have direct and indirect sales channels which we are leveraging to get to their customers.
Our wireless carrier channel partners currently include:
| |
● |
AT&T, in the United States; |
| |
● |
FirstNet, in the United States; |
| |
● |
Verizon, in the United States; |
| |
● |
T-Mobile, in the United States; |
| |
● |
Bell Mobility, in Canada; |
| |
● |
a leading global land mobile radio, or LMR, vendor and distributor in North America and international markets. |
While
these arrangements are typically long term, they generally do not contain any firm purchase volume commitments. As a result, our channel
partners are not contractually obligated to purchase from us any minimum number of products. We are generally required to satisfy any
and all purchase orders delivered to us within specified delivery windows, with limited exceptions (such as orders significantly in excess
of forecasts). If we are unable to efficiently manage our supply and satisfy purchase orders on a timely basis to our channel partners,
we may be in breach of our sales arrangements and lose potential sales. If a technical issue with any of our covered products exceeds
certain present failure thresholds for the relevant performance standard or standards, the channel partner typically has the right to
cease selling the product, cancel open purchase orders and levy certain monetary penalties. If our products suffer technical issues or
failures following sales to our channel partners, we may be subject to significant monetary penalties and our channel partners may cease
making purchase orders, which would significantly harm our business and results of operations. In addition, our channel partners retain
sole discretion in which of their stocked products to offer their customers. While we may offer limited customer incentives, we generally
have limited to no control over which products our channel partners decide to offer or promote, which directly impacts the number of products
that our partners will purchase from us.
In
addition, our channel partners may be unsuccessful in marketing, selling and supporting our solutions. They may also market, sell and
support solutions that are somewhat competitive with ours, and may devote more resources to the marketing, sales and support of such products.
They may have incentives to promote our competitors’ products in lieu of our products, particularly for our bigger competitors with
larger volumes of orders, more diverse product offerings and a longer relationship with our generally large-scale channel partners. As
a result, our channel partners may stop selling our products completely. While we employ a small direct sales force, our channel partners
have significantly larger sales teams who are not contractually obligated to promote any of our devices and often have multiple competing
devices in stock to offer their customers. In addition, downstream sales by our channel partners often succeed due to attractive device
prices and monthly rate plans, which we do not control. In certain cases, we may promote our own devices through customer incentives,
however, there can be no assurance that any such incentives would contribute to increased purchases of our products. Further, given the
impact of attractive pricing on ultimate sales, we generally must offer increased promotional funding or price reductions for our more
expensive products. This promotional funding or price reductions operate to reduce our margins and significantly impact our profitability.
New
sales channel partners may take several months or more to achieve significant sales. Our channel partner sales structure could subject
us to lawsuits, potential liability and reputational harm if, for example, any of our channel partners misrepresents the functionality
of our products or services to their customers, or violate laws or our corporate policies.
If
we fail to effectively manage our existing or future sales channel partners, our channel partners fail to promote our products effectively,
we are unable to meet our obligations under our sales arrangements or future agreements that we may enter into with wireless carrier customers
have terms that are more favorable to the customer, our business and results of operations would be harmed.
We are materially
dependent on the adoption of our solutions by both the industrial enterprise and public sector markets, and if end customers in those
markets do not purchase our solutions, our revenues will be adversely impacted, and we may not be able to expand into other markets.
Our
revenues have been primarily in the industrial enterprise market, and we are materially dependent on the adoption of our solutions by
both the industrial enterprise and public sector markets. End customers in the public sector market may remain, for reasons outside our
control, tied to LMR solutions or other competitive alternatives to our devices. Sales of our products to these buyers may also be delayed
or limited by these competitive conditions. If our products are not widely accepted by buyers in those markets, we may not be able to
expand sales of our products into new markets, and our business, results of operations and financial condition may be adversely impacted.
We participate
in a competitive industry, which may become more competitive. Competitors with greater resources and significant experience in high-volume
product manufacturing may be able to respond more quickly and cost-effectively than we can to new or emerging technologies and changes
in customer requirements.
We face significant competition in developing and selling our solutions.
Our primary competitors in the non-rugged mobile device market include Apple Inc. and Samsung Electronics Co. Ltd. Our primary competitors
in the rugged mobile device market include Sonim Technologies Inc., Bullitt Mobile Ltd., and Kyocera Corporation. We also face competition
from large system integrators and manufacturers of private and public wireless network equipment and devices. Competitors in this space
include Harris Corporation, JVC KENWOOD Corporation, Motorola, and Tait International Limited. Within the Cellular Booster category, we
have several direct competitors, including Wilson Electronics, LLC, or Wilson Electronics, Nextivity, Inc. and SureCall Company.
We
cannot assure you that we will be able to compete successfully against current or future competitors. Increased competition in mobile
computing platforms, data capture products, or related accessories and software developments may result in price reductions, lower gross
profit margins, and loss of market share, and could require increased spending on research and development, sales and marketing, and customer
support. Some competitors may make strategic acquisitions or establish cooperative relationships with suppliers or companies that produce
complementary products, which may create additional pressures on our competitive position in the marketplace.
Most
of our competitors have longer operating histories, greater name recognition, larger customer bases and significantly greater financial,
technical, sales, marketing and other resources and experience than we do. In addition, because of the higher volume of components that
many of our competitors purchase from their suppliers, they are able to keep their supply costs relatively low and, as a result, may
be able to recognize higher margins on their product sales than we do. Many of our competitors may also have existing relationships with
the channel partners who we use to sell our products, or with our potential customers. This competition may result in reduced prices,
reduced margins and longer sales cycles for our products. Our competitors may also be able to more quickly and cost-effectively respond
to new or emerging technologies and changes in customer requirements. The combination of brand strength, extensive distribution channels
and financial resources of the larger vendors could cause us to lose market share and could reduce our margins on our products. If any
of our larger competitors were to commit greater technical, sales, marketing and other resources to our markets, our ability to compete
would be adversely impacted. If we are unable to successfully compete with our competitors, our sales would suffer and as a result our
financial condition will be adversely impacted.
Defects in our
products could reduce demand for our products and result in a loss of sales, delay in market acceptance and injury to our reputation,
which would adversely impact our business.
Complex
software, as well as multiple components, displays, plastics and assemblies used in our products may contain undetected defects that are
subsequently discovered at any point in the life of the product. Defects in our products may result in a loss of sales, product malfunction,
delay in market acceptance and potential injuries to our customers which can bring to injury in our reputation and increased warranty
costs.
Additionally,
our software may contain undetected errors, defects or bugs. Although we have not suffered significant harm from any errors, defects or
bugs to date, we may discover significant errors, defects, or bugs in the future that we may not be able to correct or correct in a timely
manner. It is possible that errors, defects or bugs will be found in our existing or future software and/or hardware products and related
services with the potential for delays in, or loss of market acceptance of, our products and services, diversion of our resources, injury
to our reputation, increased service and warranty expenses, and payment of damages.
Further,
errors, defects or bugs in our solutions could be exploited by hackers or could otherwise result in an actual or perceived breach of our
information systems. Alleviating any of these problems could require significant expense and could cause interruptions, delays or cessation
of our product licensing, which would reduce demand for our products and result in a loss of sales, delay in market acceptance and injure
our reputation and could adversely impact our business, results of operations and financial condition.
If our business
does not grow as we expect, or if we fail to manage our growth effectively, our operating results and business would suffer.
Our ability to successfully
grow our business depends on a number of factors including our ability to:
| |
● |
accelerate the adoption of our solutions by new end customers; |
| |
● |
expand into new vertical markets; |
| |
● |
develop and deliver new products and services; |
| |
● |
increase awareness of the benefits that our solutions offer; and |
| |
● |
expand our domestic and international footprint. |
As
usage of our solutions grows, we will need to continue to make investments to develop and implement new or updated solutions, software,
technologies, security features and cloud-based infrastructure operations. In addition, we will need to appropriately scale our internal
business systems and our services organization, including the suppliers of our products and customer support services, to serve our growing
customer base. Any failure of, or delay in, these efforts could impair the performance of our solutions and reduce customer satisfaction.
Further,
our growth could increase quickly and place a strain on our managerial, operational, financial and other resources, and our future operating
results depend to a large extent on our ability to successfully manage our anticipated expansion and growth. To manage our growth successfully,
we will need to continue to invest in sales and marketing, research and development, and general and administrative functions and other
areas. We are likely to recognize the costs associated with these investments earlier than receiving some of the anticipated benefits,
and the return on these investments may be lower, or may develop more slowly, than we expect, which could adversely impact our operating
results.
If
we are unable to manage our growth effectively, we may not be able to take advantage of market opportunities or develop new solutions
or upgrades to our existing solutions, satisfy customer requirements, maintain the quality and security of our solutions or execute on
our business plan, any of which could harm our business, operating results and financial condition.
We may not be able
to continue to develop solutions to address user needs effectively in an industry characterized by ongoing change and rapid technological
advances.
To
be successful, we must adapt to rapidly changing technological and application needs by continually improving our products, as well as
introducing new products and services, to address user demands.
Our industry is characterized
by:
| |
● |
evolving industry standards; |
| |
● |
frequent new product and service introductions; |
| |
● |
increasing demand for customized product and software solutions; |
| |
● |
rapid competitive developments; |
| |
● |
changing customer demands; and |
| |
● |
evolving distribution channels. |
Future
success will depend on our ability to effectively and economically adapt in this evolving environment. We could incur substantial costs
if we must modify our business to adapt to these changes, and may even be unable to adapt to these changes.
The markets for
our devices and related accessories may not develop as quickly as we expect, or may not develop at all. Our dependence on our cellular
carrier channel partners and their success in promoting Push to Talk over Cellular to their client base is key for the success of the
business.
Our
future success is substantially dependent upon continued adoption of devices and related accessories in the industrial enterprise and
public sector markets, including the transition from LMR to Push to Talk over Cellular and LTE networks. These market developments and
transitions may take longer than we expect or may not occur at all, and may not be as widespread as we expect. If the market does not
develop as we expect, our business, operating results and financial condition would be significantly harmed.
Our future success
is dependent on our ability to create independent brand awareness for our company and products with end customers, and our inability to
achieve such brand awareness could limit our prospects.
We
depend on wireless carriers to promote and distribute our products. While we intend to ramp up direct marketing and end-customer brand
awareness initiatives in the future, our sales and marketing efforts have historically been predominantly focused on channel partners.
To increase end-customer brand awareness, we intend to develop sales tools for key verticals within our target markets, increase usage
of social media and expand product training efforts, among other things. As a result, we expect our sales and marketing expenses to increase
in the future, primarily from increased sales personnel expenses, which will require us to cost-efficiently ramp up our sales and marketing
capabilities and effectively target end customers. However, there can be no assurance that we will successfully increase our brand awareness
or do so in a cost-efficient manner while maintaining market share within our existing sales channels. Our failure to establish stand-alone
brand awareness with end customers of our products will leave us vulnerable to the marketing and selling success of others, including
our channel partners, and these developments could have an adverse impact on our prospects. If we are unable to significantly increase
the awareness of our brand and solutions with end customers in a cost-efficient manner, we will remain significantly dependent on our
channel partners for sales of our products, and our business, financial condition and results of operations could be adversely impacted.
We are dependent
on the continued services and performance of a concentrated group of senior management and other key personnel, the loss of any of whom
could adversely impact our business.
Our
future success depends in large part on the continued contributions of a concentrated group of senior management and other key personnel.
In particular, the leadership of key management personnel is critical to the successful management of our company, the development of
our solutions and our strategic direction. We also depend on the contributions of key technical personnel. Our senior management and key
personnel are all employed on an at-will basis, which means that they could terminate their employment with us at any time, for any reason
and without notice. The loss of any of our key personnel could significantly delay or prevent the achievement of our development and strategic
objectives and harm our business.
We compete in a
rapidly evolving market, and the failure to respond quickly and effectively to changing market requirements could cause our business and
operating results to decline.
The
mobile device market is characterized by rapidly changing technology, changing customer needs, evolving industry standards and frequent
introductions of new products and services. In order to deliver a competitive mobile device, our solutions must be capable of operating
in an increasingly complex network environment. As new wireless phones are introduced and standards in the mobile device market evolve,
we may be required to modify our phones and services to make them compatible with these new products and standards. Likewise, if our competitors
introduce new devices and services that compete with ours, we may be required to reposition our solutions or introduce new phones and
solutions in response to such competitive pressure. We may not be successful in modifying our current devices or introducing new ones
in a timely or appropriately responsive manner, or at all. If we fail to address these changes successfully, our business and operating
results could be significantly harmed.
If we are unable
to sell our solutions into new markets, our revenues may not grow.
Any
new market into which we attempt to sell our solutions may not be receptive. Our ability to penetrate new markets depends on the quality
of our solutions, the continued adoption of our public safety solution by first responders, the perceived value of our solutions as a
risk management tool and our ability to design our solutions to meet the demands of our customers. If the markets for our solutions do
not develop as we expect, our revenues may not grow.
Our
ability to successfully face these challenges depends on several factors, including increasing the awareness of our solutions and their
benefits, the effectiveness of our marketing programs, the costs of our solutions, our ability to attract, retain and effectively train
sales and marketing personnel, and our ability to develop relationships with wireless carriers and other partners. If we are unsuccessful
in developing and marketing our solutions into new markets, new markets for our solutions might not develop or might develop more slowly
than we expect, either of which would harm our revenues and growth prospects.
If we are unable
to attract, integrate and retain additional qualified personnel, including top technical talent, our business could be adversely impacted.
Our
future success depends in part on our ability to identify, attract, integrate and retain highly skilled technical, managerial, sales and
other personnel. We face intense competition for qualified individuals from numerous other companies, including other software and technology
companies, many of whom have greater financial and other resources than we do. Some of these characteristics may be more appealing to
high-quality candidates than those we have to offer. In addition, new hires often require significant training and, in many cases, take
significant time before they achieve full productivity. We may incur significant costs to attract and retain qualified personnel, including
significant expenditures related to salaries and benefits and compensation expenses related to equity awards, and we may lose new employees
to our competitors or other companies before we realize the benefit of our investment in recruiting and training them. Moreover, new employees
may not be or become as productive as we expect, as we may face challenges in adequately or appropriately integrating them into our workforce
and culture. If we are unable to attract, integrate and retain suitably qualified individuals who are capable of meeting our growing technical,
operational and managerial requirements on a timely basis or at all, our business will be adversely impacted.
Volatility
or lack of positive performance in our stock price may also affect our ability to attract and retain our key employees. Many of our senior
management personnel and other key employees have become, or will soon become, vested in a substantial amount of stock or stock options.
Employees may be more likely to leave us if the shares they own or the shares underlying their vested options have significantly appreciated
in value relative to the original purchase prices of the shares or the exercise prices of the options, or, conversely, if the exercise
prices of the options that they hold are significantly above the market price of our Common Shares. If we are unable to appropriately
incentivize and retain our employees through equity compensation, or if we need to increase our compensation expenses in order to appropriately
incentivize and retain our employees, our business, operating results and financial condition would be adversely impacted.
A security breach
or other significant disruption of our IT systems or those of our partners, suppliers or manufacturers, caused by cyberattacks or other
means, could have a negative impact on our operations, sales, and operating results.
All
IT systems are potentially vulnerable to damage, unauthorized access or interruption from a variety of sources, including but not limited
to, cyberattacks, cyber intrusions, computer viruses, security breaches, energy blackouts, natural disasters, terrorism, sabotage, war,
insider trading and telecommunication failures. A cyberattack or other significant disruption involving our IT systems or those of our
outsource partners, suppliers or manufacturers could result in the unauthorized release of proprietary, confidential or sensitive information
of ours or result in virus and malware installation on our devices. Such unauthorized access to, or release of, this information or other
security breaches could: (i) allow others to unfairly compete with us, (ii) compromise safety or security, (iii) subject us to claims
for breach of contract, tort, and other civil claims, and (iv) damage our reputation. Any or all of the foregoing could have a negative
impact on our business, financial condition and results of operations.
We experience
lengthy sales cycles for our products and the delay of an expected large order could result in a significant unexpected revenue shortfall.
The
purchase of our products is often an enterprise-wide decision for prospective customers, which requires us to engage in sales efforts
over an extended period of time and provide a significant level of education to prospective customers regarding the uses and benefits
of such devices. Prospective customers, especially the wireless carriers that sell our products, often undertake a prolonged evaluation
process that may take from several months to several years in certain cases. Consequently, if our forecasted sales from a specific customer
are not realized, we may not be able to generate revenues from alternative sources in time to compensate for the shortfall. The loss or
delay of an expected large order could also result in a significant unexpected revenue shortfall. Moreover, to the extent we enter into
and deliver our products pursuant to significant contracts earlier than we expected, our operating results for subsequent periods may
fall below expectations. We may spend substantial time, effort and money on our sales and marketing efforts without any assurance that
our efforts will produce any sales. If we are unable to succeed in closing sales with new and existing customers, our business, operating
results and financial condition will be harmed.
We have a limited
history of contracting with third party manufacturers in Asia for the high-volume commercial production of our devices, and we may face
manufacturing capacity constraints.
We
have limited history and experience in contracting with third party manufacturers in Asia for the high-volume commercial production of
our devices. Because of this limited production history, we face challenges in predicting our business and evaluating its prospects, which
may result in breakdowns of our ability to timely supply our devices to our customers. Moreover, we face manufacturing capacity constraints
that present further risks to our business. If overall demand of our devices increases in the future, we will need to expand our third
party manufacturing capacity in a cost-efficient manner. Failing to meet customer demand due to our failure to successfully address these
risks and challenges could adversely impact our reputation and future sales, which would significantly harm our business, results of operations
and financial condition.
Our financial condition and results
of operations as well as those of potential customers could be adversely affected by the Middle East War, which may cause a material adverse
effect on the level of economic activity around the world, including in the markets we serve.
In October 2023, war broke
out in the Middle Easr between Israel and Hamas and possibly with other regional powers. As a result of this war, various nations, including
the United States, have been monitoring the situation closely. While we currently have customers, assets, liabilities, employees and suppliers
in the region we have not experienced any supply disruptions directly related to this war. As this war continues or possibly escalates,
this may lead to further disruption, instability and volatility in global markets and industries that could negatively impact our customers,
operations and our supply chain. The impact of the conflict and related sanctions on the world economy are subject to rapid change and
are difficult to predict. The war could create disruptions in the supply chain for certain of our products which, to date, has not had
a substantive impact on our operations. None of our critical raw materials are sourced from, and none of our finished products are manufactured
in, the Middle East region. We have no operations or other projects in that region.
We are monitoring any broader
economic impact from the Middle East war, including heightened risk of cyberattacks, property damage, employee inaccessibility to the
workplace, increased prices of fuel and other commodities, and potential impacts to our partners’ supply chains. Our financial condition,
results of operations, and cash flows may be materially adversely affected, but the specific impact on our financial condition, results
of operations, and cash flows is currently difficult to determine.
Our financial condition and results
of operations as well as those of potential customers could be adversely affected by the Russian invasion of Ukraine, which has caused
a material adverse effect on the level of economic activity around the world, including in the markets we serve.
In February 2022, the
Russian Federation invaded Ukraine. As a result of the invasion, various nations, including the United States, have instituted economic
sanctions against the Russian Federation and Belarus and certain of their citizens. While we currently have no customers or suppliers
located in Belarus, the Russian Federation or Ukraine, nor have we experienced any supply disruptions directly related to the Russian
invasion of Ukraine as we do not knowingly source any materials originating from Belarus, the Russian Federation or Ukraine, as the war
in Ukraine continues or possibly escalates, this may lead to further disruption, instability and volatility in global markets and industries
that could negatively impact our customers, operations and our supply chain. The impact of the conflict and related sanctions on the world
economy are subject to rapid change and are difficult to predict. The war has created disruptions in the supply chain for certain of our
products which, to date, has not had a substantive impact on our operations. None of our critical raw materials are sourced from, and
none of our finished products are manufactured in, the sanctioned regions. We have no operations or other projects in that region.
We are monitoring any broader
economic impact from Russia’s invasion of Ukraine and the ongoing war between the two nations, including heightened risk of cyberattacks,
increased prices of fuel and other commodities, and potential impacts to our partners’ supply chains. Our financial condition, results
of operations, and cash flows may be materially adversely affected, but the specific impact on our financial condition, results of operations,
and cash flows is currently difficult to determine.
We rely on industry data and projections
which may prove to be inaccurate.
We obtained statistical data,
market data and other industry data and forecasts used in this prospectus from market research, publicly available information and industry
publications. These industry data, including the vehicle communications industry, include projections that are based on a number of assumptions
which have been derived from industry and government sources which we believe to be reasonable. The vehicle communications industry may
not grow at the rate projected by industry data, or at all. The failure of the industry to grow as anticipated is likely to have a material
adverse effect on our business and the market price of our Common Shares. In addition, the rapidly changing nature of the vehicle communications
industry subjects any projections or estimates relating to the growth prospects or future condition of our industries to significant uncertainties.
Furthermore, if any one or more of the assumptions underlying the industry data turns out to be incorrect, actual results may, and are
likely to, differ from the projections based on these assumptions. While we believe that the statistical data, industry data and forecasts
and market research are reliable, we have not independently verified the data.
Risks Related to our
Reliance on Third Parties
As we work with
multiple vendors for our components, if we fail to adequately forecast demand for our inventory and supply needs, we could incur additional
costs or experience manufacturing delays, which could reduce our gross margin or cause us to delay or even lose sales.
Because
our production volumes are based on a forecast of channel partner demand rather than purchase commitments from our major customers, there
is a risk that our forecasts could be inaccurate and that we will be unable to sell our products at the volumes and prices we expect,
which may result in excess inventory. We provide, and will continue to provide, forecasts of our demand to our third-party suppliers prior
to the scheduled delivery of products to our channel partners. If we overestimate our requirements, our contract manufacturers may have
excess component inventory, which could increase our costs. If we underestimate our requirements, our contract manufacturers may have
inadequate component inventory, which could interrupt the manufacturing of our products and result in delays in shipments and revenues
or even lost sales, or could incur unplanned overtime costs to meet our requirements, resulting in significant cost increases. For example,
certain materials and components used to manufacture our products may reach end of life during any of our product’s life cycles,
following which suppliers no longer provide such expired materials and components. This would require us to either source and qualify
an alternative component, which could require a re-certification of the device by the wireless carriers and/or regulatory agencies, or
forecast product demand for a final purchase of such materials and components that may reach end of life to ensure that we have sufficient
product inventory through a product’s life cycle. If we overestimate forecasted demand, we would hold excess end-of-life materials
and components resulting in increased costs. If we underestimate forecasted demand, we could experience delays in shipments and loss of
revenues.
In
addition, if we underestimate our requirements and the applicable supplier becomes insolvent or is no longer able to timely supply our
needs in a cost-efficient manner or at all, we may be required to acquire components, which may need to be customized for our products,
from alternative suppliers, including at significantly higher costs. If we cannot source alternative suppliers and/or alternative components,
we may suffer delays in shipments or lost sales. Similarly, credit constraints at our suppliers could require us to accelerate payment
of our accounts payable, impacting our cash flow. Further, lead times for materials and components that we order vary significantly and
depend on factors such as the specific supplier, contract terms, customization needed for any particular component and demand for each
component at a given time. Any such failure to accurately forecast demand and manufacturing and supply requirements, and any need to obtain
alternative supply sources, could materially harm our business, results of operations and financial condition.
Our dependence
on third-party suppliers, mainly based in China, for key components of our products could delay shipment of our products and reduce our
sales.
We
depend on certain suppliers for the delivery of components used in the assembly of our products. Our reliance on third-party suppliers
creates risks related to our potential inability to obtain an adequate supply of components and reduced control over pricing and timing
of delivery of components. In particular, we have little to no control over the prices at which our suppliers sell materials and components
to us. Certain supplies of our components are available only from a single source or limited sources and we may not be able to diversify
sources in a timely manner. We have experienced shortages in the past that have negatively impacted our results of operations and may
experience such shortages in the future.
We
also do not have long-term supply agreements with any of our suppliers. Our current contracts with certain suppliers may be cancelled
or not extended by such suppliers and, therefore, do not afford us with sufficient protection against a reduction or interruption in supplies.
Moreover, in the event any of these suppliers breach their contracts with us, our legal remedies associated with such a breach may be
insufficient to compensate us for any damages we may suffer.
Any
interruption of supply for any material components of our products, or inability to obtain required components from our third-party suppliers,
could significantly delay the production and shipment of our products and harm our revenues, profitability and financial condition.
If China could potentially enter into trade wars with certain tariffs
and product bans with the US and Europe, which are our main markets, this could negatively impact the Company.
Because we rely on a small number
of channel partners/customers for a large portion of our revenue, the loss of any of these customers would have a material adverse effect
on our operating results and cash flows.
For the nine month period ended September 30, 2023, we derived 67%
of our revenue from five customers/channel partners. Any termination of a business relationship with, or a significant sustained reduction
in business from, one or more of these channel partners/customers could have a material adverse effect on our operating results and cash
flows.
If dedicated public
safety LTE networks are not deployed at the rate we anticipate or at all, demand for our solutions may not grow as expected.
A
key part of our strategy is to further expand the use of our solutions over dedicated LTE networks in the public safety market. If the
deployment of dedicated LTE networks is delayed or such networks are not adopted at the rate we anticipate, demand for our solutions may
not develop as we anticipate, which would have a negative effect on our revenues.
The application
development ecosystem supporting our devices and related accessories is new and evolving.
The
application development ecosystem supporting our devices and related accessories is new and evolving. Specifically, the number of application
developers in the ecosystem supporting our devices and accessories is small. If the market or the application development ecosystem does
not develop, timely or at all, demand for our products may be limited, and our business and results of operations will be significantly
harmed.
Failure of our
suppliers, subcontractors, distributors, resellers, and representatives to use acceptable legal or ethical business practices, or to fail
for any other reason, could negatively impact our business.
We
do not control the labor and other business practices of our suppliers, subcontractors, distributors, resellers and third-party sales
representatives, or TPSRs, and cannot provide assurance that they will operate in compliance with applicable rules, and regulations regarding
working conditions, employment practices, environmental compliance, anti-corruption, and trademark a copyright and patent licensing. If
one of our suppliers, subcontractors, distributors, resellers, or TPSRs violates labor or other laws or implements labor or other business
practices that are regarded as unethical, the shipment of finished products to us could be interrupted, orders could be cancelled, relationships
could be terminated, and our reputation could be damaged. If one of our suppliers or subcontractors fails to procure the necessary license
rights to trademarks, copyrights or patents, legal action could be taken against us that could impact the saleability of our products
and expose us to financial obligations to a third party. Any of these events could have a negative impact on our sales and results of
operations.
Moreover,
any failure of our suppliers, subcontractors, distributors, resellers and TPSRs, for any reason, including bankruptcy or other business
disruption, could disrupt our supply or distribution efforts and could have a negative impact on our sales and results of operations.
Our products are
subject to risks associated with sourcing and manufacturing.
We
do not own or operate any of the manufacturing facilities for our products and rely on a concentrated number of independent suppliers
to manufacture all of the products we sell. For our business to be successful, our suppliers must provide us with quality products in
substantial quantities, in compliance with regulatory requirements, at acceptable costs and on a timely basis. Our ability to obtain a
sufficient selection or volume of merchandise on a timely basis at competitive prices could suffer as a result of any deterioration or
change in our supplier relationships or events that adversely affect our suppliers.
There
can be no assurance we will be able to detect, prevent or fix all defects that may affect our products manufactured by our suppliers.
Failure to detect, prevent or fix defects, or the occurrence of real or perceived quality or safety problems or material defects in our
current and future products, could result in a variety of consequences, including a greater number of product returns than expected from
customers and our wholesale partners, litigation, product recalls and credit, warranty or other claims, among others, which could harm
our brand, results of operations and financial condition. Such problems could hurt our brand image, which is critical to maintaining and
expanding our business. Any negative publicity or lawsuits filed against us related to the perceived quality and safety of our products
could harm our brand and decrease demand for our products.
If
one or more of our significant suppliers were to sever their relationship with us or significantly alter the terms of our relationship,
including due to changes in applicable trade policies, we may not be able to obtain replacement products in a timely manner, which could
have a material adverse effect on our business, results of operations and financial condition.
In
addition, if any of our primary suppliers fail to make timely shipments, do not meet our quality standards or otherwise fail to deliver
us product in accordance with our plans, there could be a material adverse effect on our results of operations.
Our
contractors and suppliers buy raw materials and are subject to wage rates that are oftentimes regulated by the governments of the countries
in which our products are manufactured. The raw materials used to manufacture our products are subject to availability constraints and
price volatility. There could be a significant disruption in the supply of raw materials from current sources or, in the event of a disruption,
our suppliers might not be able to locate alternative suppliers of materials of comparable quality at an acceptable price or at all. Our
business is dependent upon the ability of our unaffiliated suppliers to locate, train, employ and retain adequate personnel. Our unaffiliated
suppliers have experienced, and may continue to experience in the future, unexpected increases in work wages, whether government-mandated
or otherwise. Our suppliers may increase their pricing if their raw materials became more expensive. Our suppliers may pass the increase
in sourcing costs to us through price increases, thereby impacting our margins. Material changes in the pricing practices of our suppliers
could negatively impact our profitability.
In
addition, we cannot be certain that our unaffiliated suppliers will be able to fill our orders in a timely manner. If we experience significant
increases in demand, or reductions in the availability of materials, or need to replace an existing supplier, there can be no assurance
additional supplies of raw materials or additional manufacturing capacity will be available when required on terms acceptable to us, or
at all, or that any supplier would allocate sufficient capacity to us in order to meet our requirements. In addition, even if we are able
to expand existing or find new manufacturing or sources of materials, we may encounter delays in production and added costs as a result
of the time it takes to train suppliers in our methods, products, quality control standards and labor, health and safety standards. Any
delays, interruption or increased costs in labor or wages, or the supply of materials or manufacture of our products, could have an adverse
effect on our ability to meet wholesale partner and customer and consumer demand for our products and result in lower revenue and net
income both in the short and long term.
Events
that adversely impact our suppliers could impair our ability to obtain adequate and timely supplies. Such events include, among others,
difficulties or problems associated with our suppliers’ business, the financial instability and labor problems of suppliers, merchandise
quality and safety issues, natural or man-made disasters, inclement weather conditions, war, acts of terrorism and other political instability,
economic conditions, transportation delays and shipment issues. Our suppliers may be forced to reduce their production, shut down their
operations or file for bankruptcy. Our suppliers may consolidate, increasing their market power. The occurrence of one or more of these
events could impact our ability to get products to our customers and/or wholesale partners, result in disruptions to our operations, increase
our costs and decrease our profitability.
Global
sourcing and foreign trade involve numerous factors and uncertainties beyond our control, including:
| |
● |
increased shipping costs; |
| |
● |
the imposition of additional import or trade restrictions; |
| |
● |
legal or economic restrictions on overseas suppliers’ ability to produce and deliver products; |
| |
● |
increased custom duties and tariffs; |
| |
● |
unforeseen delays in customs clearance of goods; |
| |
● |
more restrictive quotas; |
| |
● |
loss of a most favored nation trading status; |
| |
● |
currency exchange rates; |
| |
● |
port of entry issues; and |
| |
● |
foreign government regulations, political instability and economic uncertainties in the countries from which we or our suppliers source our products. |
Negative press or reports about internationally manufactured products
may sway public opinion, and thus customer confidence, away from our products. Furthermore, changes in U.S. trade policies, including
new restrictions, tariffs or other changes could lead to additional costs, delays in shipments, embargos and other uncertainties that
could negatively impact our relationships with our international suppliers and materially adversely affect our business. These and other
issues affecting our international suppliers or internationally manufactured merchandise could have a material adverse effect on our business,
results of operations and financial condition.
In
addition, some of our suppliers may not have the capacity to supply us with sufficient merchandise to keep pace with our growth plans,
especially if we need significantly greater amounts of inventory. In such cases, our ability to pursue our growth strategy will depend
in part upon our ability to develop new supplier relationships.
The nature of our
business may result in undesirable press coverage or other negative publicity, which would adversely impact our brand identity, future
sales and results of operations.
Our
solutions are used to assist law enforcement and other public safety personnel in situations involving public safety. The incidents in
which our solutions are deployed may involve injury, loss of life and other negative outcomes, and such events are likely to receive negative
publicity. Such negative publicity could have an adverse impact on new sales or renewals or expansions of coverage areas by existing customers,
which would adversely impact our financial results and business.
Changes in the
availability of federal funding to support local public safety or other public sector efforts could impact our opportunities with public
sector end customers.
Many
of our public sector end customers rely to some extent on funds from the U.S. federal government in order to purchase and pay for our
solutions. Any reduction in federal funding for local public safety or other public sector efforts could result in our end customers having
less access to funds required to continue, renew, expand or pay for our solutions. For example, changes in policies with respect to “sanctuary
cities” may result in a reduction in federal funds available to our current or potential end customers. Additionally, any future
U.S. government shutdowns could result in delayed public safety spending or re-allocation of funding into other areas of public safety.
If federal funding is reduced or eliminated and our end customers cannot find alternative sources of funding to purchase our solutions,
our business will be harmed.
Economic uncertainties
or downturns, or political changes, could limit the availability of funds available to our customers and potential customers, which could
significantly adversely impact our business.
Current
or future economic uncertainties or downturns could adversely impact our business and operating results. Negative conditions in the general
economy both in the United States and abroad, including conditions resulting from changes in gross domestic product growth, inflation,
changes in general interest rates, decisions of central banks, financial and credit market fluctuations, political deadlock, natural catastrophes,
warfare and terrorist attacks in North America, Europe, the Asia Pacific region or elsewhere, could cause a decrease in funds available
to our customers and potential customers and negatively affect the growth rate of our business.
These
economic conditions may make it extremely difficult for our customers and us to forecast and plan future budgetary decisions or business
activities accurately, and they could cause our customers to re-evaluate their decisions to purchase our solutions, which could delay
and lengthen our sales cycles or result in cancellations of planned purchases. Furthermore, during challenging economic times or as a
result of political changes, our customers may tighten their budgets and face constraints in gaining timely access to sufficient funding
or other credit, which could result in an impairment of their ability to make timely payments to us. In turn, we may be required to increase
our allowance for doubtful accounts, which would adversely impact our financial results.
We
cannot predict the timing, strength or duration of any economic slowdown, instability or recovery, generally or within any particular
industry, or the impact of political changes. If the economic conditions of the general economy or industries in which we operate worsen
from present levels, or if recent political changes result in less funding being available to purchase our solutions, our business, operating
results and financial condition could be adversely impacted.
Natural or man-made
disasters and other similar events may significantly disrupt our business, and negatively impact our operating results and financial condition.
Any
of our facilities may be harmed or rendered inoperable by natural or man-made disasters, including earthquakes, tornadoes, hurricanes,
wildfires, floods, nuclear disasters, acts of terrorism or other criminal activities, infectious disease outbreaks, and power outages,
which may render it difficult or impossible for us to operate our business for some period of time. Our facilities would likely be costly
to repair or replace, and any such efforts would likely require substantial time. Any disruptions in our operations could negatively impact
our business and operating results, and harm our reputation. In addition, we may not carry business insurance or may not carry sufficient
business insurance to compensate for losses that may occur. Any such losses or damages could have a significant adverse impact on our
business, operating results and financial condition. In addition, the facilities of significant vendors may be harmed or rendered inoperable
by such natural or man-made disasters, which may cause disruptions, difficulties or significant adverse impact on our business.
We are exposed
to risks associated with strategic acquisitions and investments.
We
may consider strategic acquisitions of companies with complementary technologies or intellectual property in the future. Acquisitions
hold special challenges in terms of successful integration of technologies, products, services and employees. We may not realize the anticipated
benefits of these acquisitions or the benefits of any other acquisitions we have completed or may complete in the future, and we may not
be able to incorporate any acquired services, products or technologies with our existing operations, or integrate personnel from the acquired
businesses, in which case our business could be harmed.
Acquisitions
and other strategic decisions involve numerous risks, including:
| |
● |
problems integrating and divesting the operations, technologies, personnel, services or products over geographically disparate locations; |
| |
● |
unanticipated costs, taxes, litigation and other contingent liabilities; |
| |
● |
continued liability for discontinued businesses and pre-closing activities of divested businesses or certain post-closing liabilities which we may agree to assume as part of the transaction in which a particular business is divested; |
| |
● |
adverse impacts on existing business relationships with suppliers and customers; |
| |
● |
cannibalization of revenues as customers may seek multi-product discounts; |
| |
● |
risks associated with entering into markets in which we have no, or limited, prior experience; |
| |
● |
incurrence of significant restructuring charges if acquired products or technologies are unsuccessful; |
| |
● |
significant diversion of management’s attention from our core business and diversion of key employees’ time and resources; |
| |
● |
licensing, indemnity or other conflicts between existing businesses and acquired businesses; |
| |
● |
inability to retain key customers, distributors, suppliers, vendors and other business relations of the acquired business; and |
| |
● |
potential loss of our key employees or the key employees of an acquired organization or as a result of discontinued businesses. |
Financing
for future acquisitions may not be available on favorable terms, or at all. If we identify an appropriate acquisition candidate for any
of our businesses, we may not be able to negotiate the terms of the acquisition successfully, finance the acquisition or integrate the
acquired business, products, service offerings, technologies or employees into our existing business and operations. Future acquisitions
and divestitures may not be well-received by the investment community, which may cause the value of our stock to fall. We cannot ensure
that we will be able to identify or complete any acquisition, divestiture or discontinued business in the future. Further, the terms of
our indebtedness constrain our ability to make and finance additional acquisitions or divestitures.
If
we acquire businesses, new products, service offerings or technologies in the future, we may incur significant acquisition-related costs.
In addition, we may be required to amortize significant amounts of finite-lived intangible assets and we may record significant amounts
of goodwill or indefinite-lived intangible assets that would be subject to testing for impairment. We have in the past and may in the
future be required to write off all or part of the intangible assets or goodwill associated with these investments that could harm our
operating results. If we consummate one or more significant future acquisitions in which the consideration consists of stock or other
securities, our existing stockholders’ ownership could be significantly diluted. If we were to proceed with one or more significant
future acquisitions in which the consideration included cash, we could be required to use a substantial portion of our cash and investments.
Acquisitions could also cause operating margins to fall depending on the businesses acquired.
Our
strategic investments may involve joint development, joint marketing, or entry into new business ventures, or new technology licensing.
Any joint development efforts may not result in the successful introduction of any new products or services by us or a third party, and
any joint marketing efforts may not result in increased demand for our products or services. Further, any current or future strategic
acquisitions and investments by us may not allow us to enter and compete effectively in new markets or enhance our business in our existing
markets and we may have to impair the carrying amount of our investments.
We could be adversely impacted by changes
in accounting standards and subjective assumptions, estimates and judgments by management related to complex accounting matters.
International
Financial Reporting Standards and related accounting pronouncements, implementation guidelines, and interpretations with regard to a wide
range of matters that are relevant to our businesses, including, but not limited to, revenue recognition, asset impairment, inventories,
customer rebates and other customer consideration, tax matters, and litigation and other contingent liabilities are highly complex and
involve many subjective assumptions, estimates and judgments. Changes in these rules or their interpretation or changes in underlying
assumptions, estimates or judgments could significantly change our reported or expected financial performance or financial condition.
New accounting guidance may also require systems and other changes that could increase our operating costs and/or change our financial
statements. For example, implementing future accounting guidance related to revenue, accounting for leases and other areas could require
us to make significant changes to our accounting systems, impact existing debt agreements and result in adverse changes to our financial
statements.
Risks Related to Government
Regulation
The impact of potential
changes in customs, tariffs, and trade policies in the United States and the potential corresponding actions by other countries, including
recent trade initiatives announced by the U.S. presidential administration against China, in which we do business could adversely impact
our financial performance.
The
U.S. government has made proposals that are intended to address trade imbalances, which include encouraging increased production in the
United States. These proposals could result in increased customs duties and tariffs, and the renegotiation of some U.S. trade agreements.
We import a significant percentage of our products into the United States, and an increase in customs duties and tariffs with respect
to these imports could negatively impact our financial performance. If such customs duties and tariffs are implemented, it also may cause
U.S. trading partners to take actions with respect to U.S. imports or U.S. investment activities in their respective countries. Any potential
changes in trade policies in the United States and the potential corresponding actions by other countries in which we do business could
adversely impact our financial performance. Given the level of uncertainty over which provisions will be enacted, we cannot predict with
certainty the impact of the proposals.
For
example, in 2018, the U.S. presidential administration and Chinese government imposed significant tariffs on exports between the two countries.
This evolving policy dispute between China and the United States is likely to have significant impact on the industries in which we participate,
directly and indirectly, and no assurance can be given that any individual customer or significant groups of companies or a particular
industry, will not be adversely impacted by any governmental actions taken by either China or the United States. In addition, we manufacture
our mobile phones at our facility in Shenzhen, China, which could result in significant additional costs to us when shipping our products
to various customers in the United States. It is not possible to predict with any certainty the outcome of the trade dispute between the
United States and China, and prolonged or increased tariffs on imports from China to the United States would adversely impact our business,
results of operations and financial condition.
In
2020, a Phase One trade agreement was signed imposing specific targets for Chinese purchases of various exports from the United States.
These ambitious commitments specified numerical targets in U.S. goods and services exports to China for increases of $77 billion in 2020
and $123 billion in 2021 from the 2017 baseline. The Phase One agreement also imposed numerous tariffs on a variety of goods including
but not limited to imports from China along with steel and aluminum imports from across the world, creating an upward pressure on prices
in the United States. These tariffs currently impact over $350 billion of imports and exports and increase consumer costs by roughly $51
billion annually based on 2021 import levels. The uncertainty of the Phase One deal, unilaterally imposed in 2020 and substantially still
in effect today, lie in their conditions. For instance, Section 301 enables the president to impose tariffs or quotas wherever the United
States Trade Representative (USTR) finds that other nations are engaging in unfair trade practices and Section 232 allows the president
to impose trade barriers if the Department of Commerce finds that imports threaten U.S. national security. The Company will be unable
to pre-empt decisions of this nature, and as such, the risks and consequences which accompany them.
In
2021, the U.S. presidential administration signed Executive Order 14017 into order, assessing vulnerabilities in four priority product
areas: semiconductors, large capacity batteries, critical minerals and materials, and pharmaceuticals and active pharmaceutical ingredients.
Executive Order 14017 established an interagency Supply Chain Trade Task Force led by USTR. This task force was directed to identify foreign
trade practices that the U.S. deemed unfair or otherwise determined to cause erosion to U.S. critical supply chains. The impact and decisions
of this task force may cause consequential action from other trading partners, potentially impacting the Company’s financial performance.
Later
in 2021 and into 2022, the U.S. Administration replaced the Section 232 tariffs on steel and aluminum imports from the EU with a tariff
rate quota system (TRQ), replaced the Section 232 tariffs on steel imports from Japan with a TRQ (the Section 232 aluminum imports from
Japan are still in effect) and, as of March 2022, replaced the Section 232 tariffs on steel and aluminum imports from the UK with a TRQ. To
date, the US Administration has kept in place all of the Section 301 tariffs on Chinese imports, which might influence importers to shift
away from China and reorganize supply chains or otherwise cause decreased trade altogether – both imports and exports – raising
prices and reducing options for consumers and businesses in the U.S. While a number of exclusions and extensions to these tariffs exist
and evolve within the current administration, retaliatory actions by other nations remain a possibility.
In
2022, five nations had levied retaliatory tariffs up to 70 percent on approximately $73.2 billion of U.S. exports. These tariffs do not
include retaliation by Canada and Mexico; following the reversal of U.S. steel and aluminum tariffs, both Canada and Mexico withdrew their
retaliatory tariffs of 7 percent to 25 percent on approximately $20 billion of U.S. exports. These tariffs also no longer include retaliation
by the EU, as it cancelled its retaliatory tariffs in exchange for the United States replacing the aluminum and steel tariffs with a TRQ
for EU imports.
The
invasion of Ukraine by Russia has resulted increased sanctions on trade with Russia which could reverberate to other countries, other
economies and other markets. On February 24, 2023, the United States, in coordination with allies and G7 partners, announced a new set
of sanctions, export controls and tariffs targeting key, revenue-generating sectors of the Russian economy and restricting trade with
over 200 persons, including both Russian and third-country actors across Europe, Asia and the Middle East. These new measures, taken by
the U.S. Department of the Treasury’s Office of Foreign Assets Control, or OFAC, US Department of Commerce’s Bureau of Industry
and Security, or BIS, Office of the US Trade Representative, or USTR and U.S. Department of State, mark the one-year anniversary of Russia’s
war against Ukraine. These measures include the following:
| |
● |
OFAC: (i) announced a new determination targeting the metals and mining sector of the Russian Federation economy under Executive Order 14024; (ii) added 83 entities and 22 individuals to the Specially Designated Nationals and Blocked Persons List, including over 30 third-country individuals and entities, resulting in the freezing of their assets within U.S. jurisdiction and prohibitions on transactions by U,S, persons or within the U.S. that involve such persons and their 50 percent or more owned entities; and (iii) made additions and revisions to several existing general licenses. |
| |
● |
BIS: (i) announced four new rules targeting Russia’s defense-industrial base and military and third countries supporting Russia; (ii) expanded export controls under the Export Administration Regulations, including licensing requirements on several commercial and industrial items; and (iii) added 86 entities to the Entity List determined to have engaged in sanctions evasion and backfill activities in support of Russia’s defense-industrial sector, prohibiting the targeted companies from purchasing items, such as semiconductors, whether made in the US or with certain US technology or software abroad. |
| |
● |
USTR announced additional tariff increases, primarily targeting metals, minerals and chemical products. |
These sanctions, export controls
and tariffs are part of the U.S.’s ongoing to impose economic costs on Russia in response to its actions in Ukraine.
We are subject
to anti-corruption, anti-bribery, anti-money laundering, economic sanctions, export control, and similar laws. Non-compliance with such
laws can subject us to criminal or civil liability and harm our business, revenues, financial condition and results of operations.
We
are subject to the U.S. Foreign Corrupt Practices Act of 1977, as amended, the U.S. domestic bribery statute contained in 18 U.S.C. Section
201, the U.S. Travel Act, and other anti-bribery and anti-money laundering laws in the countries in which we conduct activities. Anti-corruption
and anti-bribery laws have been enforced aggressively in recent years and are interpreted broadly to generally prohibit companies and
their employees and third-party intermediaries from authorizing, offering, or providing, directly or indirectly, improper payments or
benefits to recipients in the public or private sector. As we increase our international presence, we may engage with distributors and
third-party intermediaries to market our solutions and to obtain necessary permits, licenses, and other regulatory approvals. In addition,
we or our third-party intermediaries may have direct or indirect interactions with officials and employees of government agencies or state-owned
or affiliated entities. We can be held liable for the corrupt or other illegal activities of these third-party intermediaries, our employees,
representatives, contractors, partners and agents, even if we do not explicitly authorize such activities.
The
United States has imposed economic sanctions that affect transactions with designated foreign countries, nationals and others. In particular,
the United States prohibits U.S. persons from engaging with individuals and entities identified as “Specially Designated Nationals,”
such as terrorists and narcotics traffickers. These prohibitions are administered by the U.S. Department of the Treasury’s Office
of Foreign Assets Control. OFAC rules prohibit U.S. persons from engaging in, or facilitating a foreign person’s engagement in,
transactions with or relating to the prohibited individual, entity or country, and require the blocking of assets in which the individual,
entity or country has an interest. Blocked assets (e.g., property or bank deposits) cannot be paid out, withdrawn, set off or transferred
in any manner without a license from OFAC. Other countries in which we operate, including Canada and the United Kingdom, also maintain
economic and financial sanctions regimes.
Some
of our solutions, including software updates and third-party accessories, may be subject to U.S. export control laws, including the Export
Administration Regulations; however, the vast majority of our products are non-U.S.-origin items, developed and manufactured outside of
the United States, and therefore not subject to these laws. For third-party accessories, we rely on manufactures to supply the appropriate
export control classification numbers that determine our obligations under these laws.
We
cannot assure you that our employees and agents will not take actions in violation of our policies and applicable law, for which we may
be ultimately held responsible. As we increase our international presence, our risks under these laws, rules, and regulations may increase.
Further, any change in the applicability or enforcement of these laws, rules, and regulations could adversely impact our business operations
and financial results.
Detecting,
investigating and resolving actual or alleged violations can require a significant diversion of time, resources, and attention from senior
management. In addition, noncompliance with anti-corruption, anti-bribery, anti-money laundering, or economic sanctions laws, rules, and
regulations could subject us to whistleblower complaints, investigations, sanctions, settlements, prosecution, other enforcement actions,
disgorgement of profits, significant fines, damages, other civil and criminal penalties or injunctions, suspension and/or debarment from
contracting with certain persons, the loss of export privileges, reputational harm, adverse media coverage, and other collateral consequences.
If any subpoenas or investigations are launched, or governmental or other sanctions are imposed, or if we do not prevail in any possible
civil or criminal litigation, our business, revenues, financial condition, and results of operations would be significantly harmed. In
addition, responding to any action will likely result in a significant diversion of management’s attention and resources and significant
defense costs and other professional fees. Enforcement actions and sanctions could further harm our business, financial condition and
results of operations.
We are subject
to a wide range of product regulatory and safety, consumer, worker safety and environmental laws and regulations.
Our
operations and the products we manufacture and/or sell are subject to a wide range of product regulatory and safety, consumer, worker
safety and environmental laws and regulations. Compliance with such existing or future laws and regulations could subject us to future
costs or liabilities, impact our production capabilities, constrict our ability to sell, expand or acquire facilities, restrict what solutions
we can offer and generally impact our financial performance. Our products are designed for use in potentially explosive or hazardous environments.
If our product design fails for any reason in such environments, we may be subject to product liabilities and future costs. In addition,
some of these laws are environmental and relate to the use, disposal, remediation, emission and discharge of, and exposure to hazardous
substances. These laws often impose liability and can require parties to fund remedial studies or actions regardless of fault. Environmental
laws have tended to become more stringent over time and any new obligations under these laws could have a negative impact on our operations
or financial performance.
Laws
focused on the energy efficiency of electronic products and accessories, recycling of both electronic products and packaging, reducing
or eliminating certain hazardous substances in electronic products, and the transportation of batteries continue to expand significantly.
Laws pertaining to accessibility features of electronic products, standardization of connectors and power supplies, the transportation
of lithium-ion batteries, and other aspects are also proliferating. There are also demanding and rapidly changing laws around the globe
related to issues such as product safety, radio interference, radio frequency radiation exposure, medical related functionality, and consumer
and social mandates pertaining to use of wireless or electronic equipment. These laws, and changes to these laws, could have a substantial
impact on whether we can offer certain products, solutions, and services, and on what capabilities and characteristics our products or
services can or must include.
These
laws and regulations impact our products and could negatively impact our ability to manufacture and sell products competitively. In addition,
we anticipate that we will see increased demand to meet voluntary criteria related to reduction or elimination of certain constituents
from products, increasing energy efficiency and providing additional accessibility.
Changes in laws
and regulations concerning the use of telecommunication bandwidth could increase our costs and adversely impact our business.
Our
business depends on our ability to sell devices that use telecommunication bandwidth allocated to licensed and unlicensed wireless services,
and that use of that bandwidth is subject to laws and regulations that are subject to change over time. Changes in the permitted uses
of telecommunication bandwidth, reallocation of such bandwidth to different uses, and new or increased regulation of the capabilities,
manufacture, importation, and use of devices that depend on such bandwidth could increase our costs, require costly modifications to our
products before they are sold, or limit our ability to sell those products into our target markets. In addition, we are subject to regulatory
requirements for certification and testing of our products before they can be marketed or sold. Those requirements may be onerous and
expensive. Changes to those requirements could result in significant additional costs and could adversely impact our ability to bring
new products to market in a timely fashion.
We are subject
to a wide range of privacy and data security laws, regulations and other legal obligations.
Personal
privacy and information security are significant issues in the United States and the other jurisdictions in which we operate or make our
products and applications available. The legislative and regulatory framework for privacy and security issues worldwide is rapidly evolving
and is likely to remain uncertain for the foreseeable future. Our handling of data is subject to a variety of laws and regulations, including
regulation by various government agencies, including the U.S. Federal Trade Commission, or FTC, and various state, local and foreign agencies.
We may collect personally identifiable information, or PII, and other data from our customers. We use this information to provide services
to our customers and to support, expand and improve our business. We may also share customers’ PII with third parties as allowed
by applicable law and agreements and authorized by the customer or as described in our privacy policy.
The
U.S. federal and various state and foreign governments have adopted or proposed limitations on the collection, distribution, transfer,
use and storage of PII. In the United States, the FTC and many state attorneys general are applying federal and state consumer protection
laws as imposing standards for the online collection, use and dissemination of data. Many foreign countries and governmental bodies, including
Canada, the European Union and other relevant jurisdictions, have laws and regulations concerning the collection and use of PII obtained
from their residents or by businesses operating within their jurisdiction. These laws and regulations often are more restrictive than
those in the United States. Laws and regulations in these jurisdictions apply broadly to the collection, use, storage, disclosure and
security of data that identifies or may be used to identify or locate an individual, such as names, email addresses and, in some jurisdictions,
Internet Protocol, or IP, addresses. Within the European Union, legislators have adopted the General Data Protection Regulation, or GDPR,
effective May 2018 which may impose additional obligations and risk upon our business, and which may increase substantially the penalties
to which we could be subject in the event of any non-compliance. We may incur substantial expense in complying with the obligations imposed
by the governments of the foreign jurisdictions in which we do business or seek to do business and we may be required to make significant
changes in our business operations, all of which may adversely impact our revenues and our business overall.
Although
we are working to comply with those federal, state, and foreign laws and regulations, industry standards, contractual obligations and
other legal obligations that apply to us, those laws, regulations, standards and obligations are evolving and may be modified, interpreted
and applied in an inconsistent manner from one jurisdiction to another, and may conflict with one another, other requirements or legal
obligations, our practices or the features of our products or applications. At state level, lawmakers continue to pass new laws concerning
privacy and data security. Particularly notable in this regard is the California Consumer Privacy Act, or CCPA, which became effective
on January 1, 2020. The CCPA will introduce significant new disclosure obligations and provide California consumers with significant new
privacy rights. Any failure or perceived failure by us to comply with federal, state or foreign laws or regulations, industry standards,
contractual obligations or other legal obligations, or any actual or suspected security incident, whether or not resulting in unauthorized
access to, or acquisition, release or transfer of PII or other data, may result in governmental enforcement actions and prosecutions,
private litigation, fines and penalties or adverse publicity and could cause our customers to lose trust in us, which could have an adverse
impact on our reputation and business. Any inability to adequately address privacy and security concerns, even if unfounded, or comply
with applicable laws, regulations, policies, industry standards, contractual obligations, or other legal obligations could result in additional
cost and liability to us, damage our reputation, inhibit sales and adversely impact our business.
We
also expect that there will continue to be new proposed laws, regulations and industry standards concerning privacy, data protection and
information security in the United States, the European Union and other jurisdictions, and we cannot yet determine the impact such future
laws, regulations and standards may have on our business. New laws, amendments to or re-interpretations of existing laws and regulations,
industry standards, contractual obligations and other obligations may require us to incur additional costs and restrict our business operations.
Such laws and regulations may require companies to implement privacy and security policies, permit users to access, correct and delete
personal information stored or maintained by such companies, inform individuals of security breaches that affect their personal information,
and, in some cases, obtain individuals’ consent to use PII for certain purposes. In addition, a foreign government could require
that any PII collected in a country not be disseminated outside of that country, and we are not currently equipped to comply with such
a requirement.
Risks Related to Our
Intellectual Property
If we are unable to successfully protect
our intellectual property, our competitive position may be harmed.
Our
ability to compete is heavily affected by our ability to protect our intellectual property. We rely on a combination of patent licenses,
confidentiality procedures and contractual provisions to protect our proprietary rights. We also enter, and plan to continue to enter,
into confidentiality, invention assignment or license agreements with our employees, consultants and other parties with whom we contract,
and control access to and distribution of our software, documentation and other proprietary information. The steps we take to protect
our intellectual property may be inadequate, and it is possible that some or all of our confidentiality agreements will not be honored
and certain contractual provisions may not be enforceable. Existing trade secret, trademark and copyright laws offer only limited protection.
Unauthorized parties may attempt to copy aspects of our products or obtain and use information which we regard as proprietary. Policing
unauthorized use of our products is difficult, time consuming and costly, particularly in foreign countries where the laws may not protect
our proprietary rights as fully as in the United States. We cannot assure you that our means of protecting our proprietary rights will
be adequate or that our competitors will not independently develop similar technology, the effect of either of which would harm our competitive
position in the market. Furthermore, disputes can arise with our strategic partners, customers or others concerning the ownership of intellectual
property.
Others may claim
that we infringe on their intellectual property rights, which may result in costly and time-consuming litigation and could delay or otherwise
impair the development and commercialization of our products.
In
recent years, there has been a significant increase in litigation in the United States involving patents and other intellectual property
rights, and because our products are comprised of complex technology, we are often involved in or impacted by assertions, including both
requests to take licenses and litigation, regarding infringement of patent and other intellectual property rights of third parties. Third
parties have asserted, and in the future may assert, intellectual property infringement claims against us and against our channel partners,
end customers and suppliers. For example, we had been approached by Wilson Electronics about potential infringement of several of their
patents involving cellphone boosters. As a result, the Company entered into a product technology licensing agreement with Wilson Electronics
that resolved their claim whereby Wilson is entitled to a 4.5% licensing fee on the revenues earned by the Company for every booster product
sold Many of these assertions are brought by non-practicing entities whose principal business model is to secure patent licensing revenues
from product manufacturing companies. Claims for alleged infringement and any resulting lawsuit, if successful, could subject us to significant
liability for damages and invalidation of our intellectual property rights. Defending any such claims, with or without merit, including
pursuant to indemnity obligations, could be time consuming, expensive, cause product shipment delays or require us to enter into a royalty
or licensing agreement, any of which could delay the development and commercialization of our products or reduce our margins. If we are
unable to obtain a required license, our ability to sell or use certain products may be impaired. In addition, if we fail to obtain a
license, or if the terms of the license are burdensome to us, our operations could be significantly harmed.
Our use of open
source software could subject us to possible litigation or otherwise impair the development of our products.
A
portion of our technologies incorporates open source software, including open source operating systems such as Android, and we expect
to continue to incorporate open source software into our platform in the future. Few of the licenses applicable to open source software
have been interpreted by courts, and their application to the open source software integrated into our proprietary technology platform
may be uncertain. If we fail to comply with these licenses, then pursuant to the terms of these licenses, we may be subject to certain
requirements, including requirements that we make available the source code for our software that incorporates the open source software.
We cannot assure you that we have not incorporated open source software in our software in a manner that is inconsistent with the terms
of the applicable licenses or our current policies and procedures. If an author or other third party that distributes such open source
software were to allege that we had not complied with the conditions of one or more of these licenses, we could incur significant legal
expenses defending against such allegations. Litigation could be costly for us to defend, have a negative effect on our operating results
and financial condition or require us to devote additional research and development resources to change our technology platform.
With
respect to open source operating systems, if third parties cease continued development of such operating systems or restrict our access
to such operating system, our business and financial results could be adversely impacted. We are dependent on third parties’ continued
development of operating systems, software application ecosystem infrastructures, and such third parties’ approval of our implementations
of their operating and system and associated applications. If such parties cease to continue development or support of such operating
systems or restrict our access to such operating systems, we would be required to change our strategy for our devices. As a result, our
financial results could be negatively impacted because a resulting shift away from the operating systems we currently use, and the associated
applications ecosystem could be costly and difficult.
Our inability to
obtain and maintain any third-party license required to develop new products and product enhancements could seriously harm our business,
financial condition and results of operations.
From
time to time, we are required to license technology from third parties to develop new products or product enhancements. Third-party licenses
may not be available to us on commercially reasonable terms, or at all. If we fail to renew any intellectual property license agreements
on commercially reasonable terms, or any such license agreements otherwise expire or terminate, we may not be able to use the patents
and technologies of these third parties in our products, which are critical to our success. We cannot assure you that we will be able
to effectively control the level of licensing and royalty fees paid to third parties, and significant increase in such fees could have
a significant and adverse impact on our future profitability. Seeking alternative patents and technologies may be difficult and time-consuming,
and we may not be successful in finding alternative technologies or incorporating them into our products. Our inability to obtain any
third-party license necessary to develop new products or product enhancements could require us to obtain substitute technology of lower
quality or performance standards, or at greater cost, which could seriously harm our business, financial condition and results of operations.
Risks relating to our locations in Israel and
Canada and our international operations
Conditions in Israel could materially and
adversely affect our business.
A number of our officers and
directors are residents of Israel. Accordingly, political, economic and military conditions in Israel and the surrounding region may directly
affect our business and operations. Since the establishment of the State of Israel in 1948, a number of armed conflicts have taken place
between Israel and its neighboring countries, as well as terrorist acts committed within Israel by hostile elements. Any hostilities involving
Israel or the interruption or curtailment of trade between Israel and its trading partners could adversely affect our operations and results
of operations. During the summer of 2006, Israel was engaged in an armed conflict with Hezbollah, a Lebanese Islamist Shiite militia group
and political party. In December 2008 and January 2009 there was an escalation in violence among Israel, Hamas, the Palestinian Authority
and other groups, as well as extensive hostilities along Israel’s border with the Gaza Strip, which resulted in missiles being fired
from the Gaza Strip into Southern Israel. During November 2012 and from July through August 2014, Israel was engaged in an armed conflict
with a militia group and political party who controls the Gaza Strip, which resulted in missiles being fired from the Gaza Strip into
Southern Israel, as well as at areas more centrally located near Tel Aviv and at areas surrounding Jerusalem. These conflicts involved
missile strikes against civilian targets in various parts of Israel, including areas in which our employees and some of our consultants
are located, and negatively affected business conditions in Israel. This pattern of activity erupts from time to time with varying degrees
of intensity and for varying periods of time and typically ends with a cease fire until hostilities flare up again.
Since February 2011, Egypt
has experienced political turbulence and an increase in terrorist activity in the Sinai Peninsula. Such political turbulence and violence
may damage peaceful and diplomatic relations between Israel and Egypt, and could affect the region as a whole. Similar civil unrest and
political turbulence has occurred in other countries in the region, including Syria, which shares a common border with Israel, and is
affecting the political stability of those countries. Since April 2011, internal conflict in Syria has escalated and chemical weapons
have been used in the region. Foreign actors have intervened and may continue to intervene in Syria. This instability and any intervention
may lead to deterioration of the political and economic relationships that exist between the State of Israel and some of these countries
and may lead to additional conflicts in the region. In addition, Iran has threatened to attack Israel and may be developing nuclear weapons.
Iran also has a strong influence among extremist groups in the region, including Hamas in Gaza, Hezbollah in Lebanon and various rebel
militia groups in Syria. These situations have escalated at various points in recent years and may escalate in the future to more violent
events, which may affect Israel and us. Any armed conflicts, terrorist activities or political instability in the region could adversely
affect business conditions and could harm our results of operations and could make it more difficult for us to raise capital. Parties
with whom we do business have sometimes declined to travel to Israel during periods of heightened unrest or tension, forcing us to make
alternative arrangements when necessary in order to meet our business partners face to face. In addition, the political and security situation
in Israel may result in parties with whom we have agreements involving performance in Israel claiming that they are not obligated to perform
their commitments under those agreements pursuant to force majeure provisions in such agreements.
Further, in the past, the
State of Israel and Israeli companies have been subjected to economic boycotts. Several countries still restrict business with the State
of Israel and with Israeli companies. These restrictive laws and policies may have an adverse impact on our operating results, financial
condition or the expansion of our business. A campaign of boycotts, divestment and sanctions has been undertaken against Israel, which
could also adversely impact our business.
In addition, many Israeli
citizens are obligated to perform several days, and in some cases more, of annual military reserve duty each year until they reach the
age of 40 (or older, for reservists who are military officers or who have certain occupations) and, in the event of a military conflict,
may be called to active duty. In response to increases in terrorist activity, there have been periods of significant call-ups of military
reservists. It is possible that there will be military reserve duty call-ups in the future. Our operations could be disrupted by such
call-ups, which may include the call-up of members of our management. Such disruption could materially adversely affect our business,
prospects, financial condition and results of operations.
It may be difficult to enforce a U.S. judgment
against us, our officers and directors named in this annual report on Form 20-F in Israel or the United States, or to assert U.S. securities
laws claims in Israel or serve process on our officers and directors.
Not all of our directors or
officers are residents of the United States and most of their and our assets are located outside the United States. Service of process
upon us or our non-U.S. resident directors and officers may be difficult to obtain within the United States. We have been informed by
our legal counsel in Israel that it may be difficult to assert claims under U.S. securities laws in original actions instituted in Israel
or obtain a judgment based on the civil liability provisions of U.S. federal securities laws. Israeli courts may refuse to hear a claim
based on a violation of U.S. securities laws against us or our non-U.S. officers and directors because Israel may not be the most appropriate
forum to bring such a claim. In addition, even if an Israeli court agrees to hear a claim, it may determine that Israeli law and not U.S.
law is applicable to the claim. If U.S. law is found to be applicable, the content of applicable U.S. law must be proved as a fact, which
can be a time-consuming and costly process. Certain matters of procedure will also be governed by Israeli law. There is little binding
case law in Israel addressing the matters described above. Additionally, Israeli courts might not enforce judgments obtained in the United
States against us or our non-U.S. our directors and executive officers, which may make it difficult to collect on judgments rendered against
us or our non-U.S. officers and directors.
Moreover, an Israeli court
will not enforce a non-Israeli judgment if it was given in a state whose laws do not provide for the enforcement of judgments of Israeli
courts (subject to exceptional cases), if its enforcement is likely to prejudice the sovereignty or security of the State of Israel, if
it was obtained by fraud or in the absence of due process, if it is at variance with another valid judgment that was given in the same
matter between the same parties, or if a suit in the same matter between the same parties was pending before a court or tribunal in Israel
at the time the foreign action was brought. For more information, see “Enforceability of Civil Liabilities.”
Because we are a corporation incorporated
in British Columbia and some of our directors and officers are resident in Canada, it may be difficult for investors in the United States
to enforce civil liabilities against us based solely upon the federal securities laws of the United States. Similarly, it may be difficult
for Canadian investors to enforce civil liabilities against our directors and officers residing outside of Canada.
We are a corporation incorporated
under the laws of British Columbia with our principal place of business in Montreal, Canada. Some of our directors and officers and the
auditors or other experts named herein are residents of Canada and all or a substantial portion of our assets and those of such persons
are located outside the United States. Consequently, it may be difficult for U.S. investors to effect service of process within the United
States upon us or our directors or officers or such auditors who are not residents of the United States, or to realize in the United States
upon judgments of courts of the United States predicated upon civil liabilities under the Securities Act. Investors should not assume
that Canadian courts: (i) would enforce judgments of U.S. courts obtained in actions against us or such persons predicated upon the civil
liability provisions of the U.S. federal securities laws or the securities or blue-sky laws of any state within the United States or (ii)
would enforce, in original actions, liabilities against us or such persons predicated upon the U.S. federal securities laws or any such
state securities or blue-sky laws.
Similarly, some of our directors
and officers are residents of countries other than Canada and all or a substantial portion of the assets of such persons are located outside
Canada. As a result, it may be difficult for Canadian investors to initiate a lawsuit within Canada against these non-Canadian residents.
In addition, it may not be possible for Canadian investors to collect from these non-Canadian residents’ judgments obtained in courts
in Canada predicated on the civil liability provisions of securities legislation of certain of the provinces and territories of Canada.
It may also be difficult for Canadian investors to succeed in a lawsuit in the United States, based solely on violations of Canadian securities
laws.
We have operations in China, which exposes
us to risks inherent in doing business there.
We use multiple third-party
suppliers and manufacturers based primarily in China. With the rapid development of the Chinese economy, the cost of labor has increased
and may continue to increase in the future. Furthermore, pursuant to Chinese labor laws, employers in China are subject to various requirements
when signing labor contracts, paying remuneration, determining the term of employees’ probation and unilaterally terminating labor
contracts. Our results of operations will be materially and adversely affected if the labor costs of our third-party suppliers and manufacturers
increase significantly. In addition, we and our manufacturers and suppliers may not be able to find a sufficient number of qualified workers
due to the intensely competitive and fluid market for skilled labor in China.
Operating in China exposes
us to political, legal and economic risks. In particular, the political, legal and economic climate in China, both nationally and regionally,
is fluid and unpredictable. Our ability to utilize parties that operate in China may be adversely affected by changes in U.S. and Chinese
laws and regulations such as those related to, among other things, taxation, import and export tariffs, environmental regulations, land
use rights, intellectual property, currency controls, network security, employee benefits, hygiene supervision and other matters. In addition,
we may not obtain or retain the requisite legal permits to continue utilizing third-parties that operate in China, and costs or operational
limitations may be imposed in connection with obtaining and complying with such permits. In addition, Chinese trade regulations are in
a state of flux, and we may potentially become subject to other forms of taxation, tariffs and duties in China. Furthermore, the third
parties we rely on in China may disclose our confidential information or intellectual property to competitors or third parties, which
could result in the illegal distribution and sale of counterfeit versions of our products. If any of these events occur, our business,
financial condition and results of operations could be materially and adversely affected.
Operating outside of the United States presents
specific risks to our business, and we have substantial operations outside of the United States.
Most of our employee base
and operations are located outside the United States, primarily in Canada and Israel. Most of our software development, third-party contract
manufacturing, and product assembly operations are conducted outside the United States.
Risks associated with operations
outside the United States include:
| |
● |
effectively managing and overseeing operations that are distant and remote from corporate headquarters may be difficult and may impose increased operating costs; |
| |
● |
fluctuating foreign currency rates could restrict sales, increase costs of purchasing, and impact collection of receivables outside of the United States; |
| |
● |
volatility in foreign credit markets may affect the financial well-being of our customers and suppliers; |
| |
● |
violations of anti-corruption laws, including the Foreign Corrupt Practices Act and the U.K. Bribery Act could result in large fines and penalties; |
| |
● |
violations of privacy and data security laws could result in large fines and penalties; and |
| |
● |
tax disputes with foreign taxing authorities, and any resultant taxation in foreign jurisdictions associated with operations in such jurisdictions, including with respect to transfer pricing practices associated with such operations. |
Foreign currency fluctuations may reduce
our competitiveness and sales in foreign markets.
The relative change in currency
values creates fluctuations in product pricing for international customers. These changes in foreign end-customer costs may result in
lost orders and reduce the competitiveness of our products in certain foreign markets. These changes may also negatively impact the financial
condition of some foreign customers and reduce or eliminate their future orders of our products. We also face adverse changes in, or uncertainty
of, local business laws or practices, including the following:
| |
● |
foreign governments may impose burdensome tariffs, quotas, taxes, trade barriers, or capital flow restrictions; |
| |
● |
restrictions on the export or import of technology may reduce or eliminate the ability to sell in or purchase from certain markets; |
| |
● |
political and economic instability, including deterioration of political relations between the United States and other countries, may reduce demand for our solutions or put our non-U.S. assets at risk; |
| |
● |
potentially limited intellectual property protection in certain countries may limit recourse against infringing on our solutions or cause us to refrain from selling in certain geographic territories; |
| |
● |
staffing may be difficult along with higher turnover at international operations; |
| |
● |
a government-controlled exchange rate and limitations on the convertibility of currencies, including the Chinese yuan; |
| |
● |
transportation delays and customs related delays that may affect production and distribution of our products; and |
| |
● |
integration and enforcement of laws vary significantly among jurisdictions and may change significantly over time. |
Our failure to manage any
of these risks successfully could harm our international operations and adversely impact our business, operating results and financial
condition.
Risks Related to Ownership of Our Securities
We do not know whether an active, liquid
and orderly trading market will develop for our Common Shares or Warrants or what the market price of our Common Shares or Warrants will
be and as a result it may be difficult for you to sell your Common Shares.
You may not be able to sell
your shares or Warrants quickly or at the market price if trading in our Common Shares or Warrants is not active. The initial public offering
price for our Common Shares and Warrants was determined through negotiations with the underwriters, and the negotiated price may not have
been indicative of the market price of the Common Shares and Warrants after the offering. As a result of these and other factors, an investor
may be unable to resell its Common Shares or Warrants at or above the initial public offering price. Further, an inactive market may also
impair our ability to raise capital by selling our securities and may impair our ability to enter into strategic partnerships or acquire
companies or products by using our Common Shares as consideration.
We expect that our stock price will fluctuate
significantly, and you may not be able to resell your shares at or above the price at which you purchased our Common Shares.
The trading price of our Common
Shares is likely to be volatile and subject to wide price fluctuations in response to various factors, including:
| |
● |
market conditions in the broader stock market in general, or in our industry in particular; |
| |
● |
actual or anticipated fluctuations in our quarterly financial and operating results; |
| |
● |
introduction of new products and services by us or our competitors; |
| |
● |
sales, or anticipated sales, of large blocks of our stock; |
| |
● |
issuance of new or changed securities analysts’ reports or recommendations; |
| |
● |
failure of industry or securities analysts to maintain coverage of our company, changes in financial estimates by any industry or securities analysts that follow our company, or our failure to meet such estimates; |
| |
● |
additions or departures of key personnel; |
| |
● |
regulatory or political developments; |
| |
● |
changes in accounting principles or methodologies; |
| |
● |
acquisitions by us or by our competitors; |
| |
● |
litigation and governmental investigations; and |
| |
● |
economic, political and geopolitical conditions or events. |
These
and other factors may cause the market price and demand for our Common Shares to fluctuate substantially, which may limit or prevent investors
from readily selling their Common Shares and may otherwise negatively affect the liquidity of our Common Shares. In addition, in the past,
when the market price of a stock has been volatile, holders of that stock have often instituted securities class action litigation against
the company that issued the stock. If any of our stockholders brought a lawsuit against us, we could incur substantial costs defending
the lawsuit. Such a lawsuit could also divert the time and attention of our management from our business.
The market for our Common Shares may not
provide investors with adequate liquidity.
Liquidity of the market for
our Common Shares depends on a number of factors, including our financial condition and operating results, the number of holders of our
Common Shares, the market for similar securities and the interest of securities dealers in making a market in the securities. We cannot
predict the extent to which investor interest in the Company will maintain a trading market in our Common Shares, or how liquid that market
will be. If an active market is not maintained, investors may have difficulty selling Common Shares that they hold.
Since we do not expect to pay any cash dividends
for the foreseeable future, investors may be forced to sell their stock in order to obtain a return on their investment.
We do not anticipate declaring
or paying in the foreseeable future any cash dividends on our capital stock. Instead, we plan to retain any earnings to finance our operations
and growth plans discussed elsewhere or incorporated by reference in this prospectus. Accordingly, investors must rely on sales of their
Common Shares after price appreciation, which may never occur, as the only way to realize any return on their investment. As a result,
investors seeking cash dividends should not purchase our Common Shares.
Outstanding warrants
and future sales of our Common Shares may further dilute the Common Shares and adversely impact the price of our Common Shares.
As of September 30, 2023, we had 1,853,955
Common Shares issued and outstanding As of the date of issuance of these financial statements total outstanding common shares is 3,902,168
(post 100-to-1 reverse split that was effective as of August 10, 2023), due to the issuance of 1,870,000 shares from a capital raise on
October 31, 2023 and the exercise of 180,000 prefunded warrants also issued on October 31, 2023 that were exercised into 177,313 additional
common shares on November 1, 2023, as well as the conversion of 900 RSU’s into 900 common shares on October 3, 2023.
On August 10,
2023 the Company affected a 100-to-1 reverse stock split which resulted in the stock trading above $1.00.
A
total of 131,001 Common Shares underlying outstanding warrants (pre-split) that have been registered with the SEC for resale are unrestricted
and freely tradeable. We also have other outstanding unexercised agents’ options to purchase 129,315 Common Shares as of November
15, 2023 that expire between June 30, 2024 and October 31, 2028. If the holder of our free trading shares wanted to sell these shares,
there might not be enough purchasers to maintain the market price of our Common Shares on the date of such sales. Any such sales, or the
fear of such sales, could substantially decrease the market price of our Common Shares and the value of your investment.
If a substantial
number of shares become available for sale and are sold in a short period of time, the market price of our Common Shares could decline.
We cannot predict whether
future issuances of our Common Shares or the availability of shares for resale in the open market will decrease the market price per Common
Share. We are not restricted from issuing additional Common Shares of, including any securities that are convertible into or exchangeable
for, or that represent the right to receive Common Shares. Sales of a substantial number of our Common Shares in the public market or
the perception that such sales might occur could materially adversely affect the market price of our Common Shares. Because our decision
to issue securities in any future offering will depend on market conditions and other factors beyond our control, we cannot predict or
estimate the amount, timing or nature of our future offerings. Thus, our shareholders bear the risk of any future stock issuances reducing
the market price of our Common Shares and diluting their stock holdings in us.
If we are not able
to comply with the applicable continued listing requirements or standards of Nasdaq, Nasdaq could delist our Common Shares
In
order to maintain the listing of our Common Shares and Warrants on the Nasdaq Capital Market, we must satisfy minimum financial and other
continued listing requirements and standards, including those regarding director independence and independent committee requirements,
minimum stockholders’ equity, minimum share price, and certain corporate governance requirements. There can be no assurances that
we will be able to comply with such applicable listing standards.
On
August 26, 2022 we received a letter from the Listing Qualifications Department of The Nasdaq Stock Market LLC (“Nasdaq”),
notifying us that we were not in compliance with the minimum bid price requirement set forth under Nasdaq Listing Rule 5550(a)(2) (the
“Bid Price Rule”), resulting from the fact that the closing bid price of the Company’s Common Shares was below $1.00
per share for a period of 30 consecutive business days. Pursuant to Nasdaq Listing Rule 5810(c)(3)(A), we were given a period of 180 calendar
days, or until February 22, 2023 (the “Compliance Period”), to regain compliance with Nasdaq’s minimum bid price requirement.
We did not regain compliance by such date and submitted a written request to the Nasdaq to afford us an additional 180-day compliance
period to cure the deficiency. On February 23, 2023, we received written notification from the Listing Qualifications Department of Nasdaq
our request for a 180-day extension to regain compliance with Nasdaq’s minimum bid price requirement until August 21, 2023. If at
any time prior to August 21, 2023, the bid price of the Common Shares closes at $1.00 per share or more for a minimum of 10 consecutive
business days, we will regain compliance with the Bid Price Rule. As of August 4, 2023, the Company has affected a 100-to-1 reverse stock
split in order to regain compliance with the share price trading above $1.00 and NASDAQ has rescinded the non compliance order.
If we do not regain compliance
with the Bid Price Rule during the additional 180-day extension, Nasdaq will notify us that our Common Shares will be delisted. At that
time, we may appeal the delisting determination to a hearings panel pursuant to the procedures set forth in the applicable Nasdaq Listing
Rules. However, there can be no assurance that, if we do appeal the delisting determination by Nasdaq to the hearings panel, that such
appeal would be successful. We intend to actively monitor the closing bid price of our Common Shares and may, if appropriate, consider
implementing available options to regain compliance with the Bid Price Rule under the Nasdaq Listing Rules.
Nasdaq’s
extension notice has no immediate effect on the listing or trading of the Common Shares, which will continue to trade on the Nasdaq Capital
Market under the symbol “SYTA.”
If
the Common Shares are not listed on Nasdaq at any time after this offering, we could face significant material adverse consequences, including:
| ● | a
limited availability of market quotations for our securities; |
| ● | a
determination that the Common Shares are a “penny stock” which will require brokers trading in our shares to adhere to more
stringent rules, possibly resulting in a reduced level of trading activity in the secondary trading market for the Common Shares; |
| ● | a
limited amount of news and analyst coverage for our Company; and |
| ● | a
decreased ability to issue additional securities or obtain additional financing in the future. |
Upon delisting from the Nasdaq
Capital Market, our Common Shares would be traded over-the-counter inter-dealer quotation system, more commonly known as the OTC. OTC
transactions involve risks in addition to those associated with transactions in securities traded on the securities exchanges, such as
the Nasdaq Capital Market, or Exchange-listed Stocks. Many OTC stocks trade less frequently and in smaller volumes than Exchange-listed
Stocks. Accordingly, our stock would be less liquid than it would be otherwise. Also, the values of OTC stocks are often more volatile
than Exchange-listed Stocks. Additionally, institutional investors are usually prohibited from investing in OTC stocks, and it might be
more challenging to raise capital when needed.
In addition, if our Common
Shares are delisted, your ability to transfer or sell your Common Shares may be limited and the value of those securities will be materially
adversely affected.
If our Common Shares become subject to the
penny stock rules, it may be more difficult to sell our Common Shares.
The SEC has adopted rules
that regulate broker-dealer practices in connection with transactions in penny stocks. Penny stocks are generally equity securities with
a price of less than $5.00 (other than securities registered on certain national securities exchanges or authorized for quotation on certain
automated quotation systems, provided that current price and volume information with respect to transactions in such securities is provided
by the exchange or system). The OTC Bulletin Board does not meet such requirements and if the price of our Common Shares is less than
$5.00 and our Common Shares are no longer listed on a national securities exchange such as Nasdaq, our stock may be deemed a penny stock.
The penny stock rules require a broker-dealer, at least two business days prior to a transaction in a penny stock not otherwise exempt
from those rules, to deliver to the customer a standardized risk disclosure document containing specified information and to obtain from
the customer a signed and dated acknowledgment of receipt of that document. In addition, the penny stock rules require that prior to effecting
any transaction in a penny stock not otherwise exempt from those rules, a broker-dealer must make a special written determination that
the penny stock is a suitable investment for the purchaser and receive: (i) the purchaser’s written acknowledgment of the receipt
of a risk disclosure statement; (ii) a written agreement to transactions involving penny stocks; and (iii) a signed and dated copy of
a written suitability statement. These disclosure requirements may have the effect of reducing the trading activity in the secondary market
for our Common Shares, and therefore shareholders may have difficulty selling their shares.
Warrants are speculative
in nature.
The
Warrants do not confer any rights of Common Share ownership on their holders, such as voting rights or the right to receive dividends,
but rather merely represent the right to acquire Common Shares at a fixed price for a limited period of time. Specifically, commencing
on the date of issuance, holders of the Warrants may exercise their right to acquire the Common Shares and pay the Warrant exercise price
per share, prior to five years from the date of issuance, after which date any unexercised Warrants will expire and have no further value.
Because we are
a foreign private issuer and are exempt from certain Nasdaq corporate governance standards applicable to U.S. issuers, you will have
less protection than you would have if we were a domestic issuer.
Nasdaq
Listing Rules require listed companies to have, among other things, a majority of its board members be independent. As a foreign private
issuer, however, we are permitted to, and we may follow home country practice in lieu of the above requirements, or we may choose to comply
with the above requirement within one year of listing. The corporate governance practice in our home country does not require a majority
of our board to consist of independent directors. Thus, although a director must act in the best interests of the Company, it is possible
that fewer board members will be exercising independent judgment and the level of board oversight on the management of our company may
decrease as a result. In addition, Nasdaq Listing Rules also require foreign private issuers to have a compensation committee, a nominating/corporate
governance committee composed entirely of independent directors, and an audit committee with a minimum of three members. We, as a foreign
private issuer, are not subject to these requirements. Nasdaq Listing Rules may require shareholder approval for certain corporate matters,
such as requiring that shareholders be given the opportunity to vote on all equity compensation plans and material revisions to those
plans, and certain Common Share issuances. We intend to comply with the requirements of Nasdaq Listing Rules in determining whether shareholder
approval is required on such matters and to appoint a nominating and corporate governance committee. We may, however, consider following
home country practice in lieu of the requirements under Nasdaq Listing Rules with respect to certain corporate governance standards which
may afford less protection to investors.
Our executive officers
and directors, and their affiliated entities, along with our two other largest stockholders, own a significant percentage of our stock
and will be able to exert significant control over matters subject to stockholder approval.
Based
on shares outstanding as of November 15, 2023, our executive officers and directors, together with entities affiliated with such
individuals, along with our largest shareholder, will beneficially own approximately 10.8% of our Common Shares based on 3,902,168 Common
Shares issued and outstanding on such date.
As
of September 30, 2023, the Company had 1,853,955 (post 100 to-1 reverse split that occurred on August 10, 2023) Common Shares issued and
outstanding.
General Risk Factors
The unfavorable
outcome of any future litigation, arbitration or administrative action could have a significant adverse impact on our financial condition
or results of operations.
From
time to time, we are a party to litigation, arbitration, or administrative actions. Our financial results and reputation could be negatively
impacted by unfavorable outcomes to any future litigation or administrative actions, including those related to the Foreign Corrupt Practices
Act, the U.K. Bribery Act, or other anti-corruption laws. There can be no assurances as to the favorable outcome of any litigation or
administrative proceedings. In addition, it can be very costly to defend litigation or administrative proceedings and these costs could
negatively impact our financial results.
If securities or
industry analysts do not publish research or publish inaccurate or unfavorable research about our business, our stock price and trading
volume could decline.
The
trading market for our securities will depend in part on the research and reports that securities or industry analysts publish about us
or our business. Securities and industry analysts do not currently, and may never, publish research on our company. If no securities or
industry analysts commence coverage of our company, the trading price for our securities would likely be negatively impacted. In the event
securities or industry analysts initiate coverage, if one or more of the analysts who covers us downgrades our stock or publishes inaccurate
or unfavorable research about our business, our stock price may decline. If one or more of these analysts ceases coverage of our company
or fails to publish reports on us regularly, demand for our securities could decrease, which might cause our stock price and trading volume
to decline.
We may lose our
foreign private issuer status in the future, which could result in significant additional costs and expenses.
As
discussed above, we are a foreign private issuer, and therefore, we are not required to comply with all of the periodic disclosure and
current reporting requirements of the Securities Exchange Act of 1934, as amended, or the Exchange Act. In the future, we would lose our
foreign private issuer status if (i) more than 50% of our outstanding voting securities are owned by U.S. residents and (ii) a majority
of our directors or executive officers are U.S. citizens or residents, or we fail to meet additional requirements necessary to avoid loss
of foreign private issuer status. If we lose our foreign private issuer status, we will be required to file with the SEC periodic reports
and registration statements on U.S. domestic issuer forms, which are more detailed and extensive than the forms available to a foreign
private issuer. We will also have to mandatorily comply with U.S. federal proxy requirements, and our officers, directors and principal
shareholders will become subject to the short-swing profit disclosure and recovery provisions of Section 16 of the Exchange Act. In addition,
we will lose our ability to rely upon exemptions from certain corporate governance requirements under the listing rules of the Nasdaq
Capital Market. As a U.S. listed public company that is not a foreign private issuer, we will incur significant additional legal, accounting
and other expenses that we will not incur as a foreign private issuer.
We incur significant increased costs as
a result of operating as a public company in the United States, and our management is required to devote substantial time to new compliance
initiatives.
As a public company in the
United States, we incur significant legal, accounting and other expenses that we did not incur previously. We are subject to the reporting
requirements of the Securities Exchange Act of 1934, as amended, which requires, among other things, that we file with the SEC annual,
quarterly and current reports with respect to our business and financial condition. In addition, the Sarbanes-Oxley Act, as well as rules
subsequently adopted by the SEC and Nasdaq to implement provisions of the Sarbanes-Oxley Act, impose significant requirements on public
companies, including requiring establishment and maintenance of effective disclosure and financial controls and changes in corporate governance
practices. Further, in July 2010, the Dodd-Frank Wall Street Reform and Consumer Protection Act, or the Dodd-Frank Act, was enacted. There
are significant corporate governance and executive-compensation-related provisions in the Dodd-Frank Act that require the SEC to adopt
additional rules and regulations in these areas. Recent legislation permits emerging growth companies to implement many of these requirements
over a longer period and up to five years from the pricing of their initial public offering. We intend to take advantage of this new legislation,
but cannot assure you that we will not be required to implement these requirements sooner than planned and thereby incur unexpected expenses.
Stockholder activism, the current political environment and the current high level of government intervention and regulatory reform may
lead to substantial new regulations and disclosure obligations, which may lead to additional compliance costs and impact the manner in
which we operate our business in ways we cannot currently anticipate.
We expect the rules and regulations
applicable to public companies to substantially increase our legal and financial compliance costs and to make some activities more time-consuming
and costly. If these requirements divert the attention of our management and personnel from other business concerns, they could have a
material adverse effect on our business, financial condition and results of operations. The increased costs will decrease our net income
or increase our consolidated net loss, and may require us to reduce costs in other areas of our business or increase the prices of our
products or services. For example, we expect these rules and regulations to make it more difficult and more expensive for us to obtain
director and officer liability insurance and we may be required to incur substantial costs to maintain the same or similar coverage. We
cannot predict or estimate the amount or timing of additional costs we may incur to respond to these requirements. The impact of these
requirements could also make it more difficult for us to attract and retain qualified persons to serve on our board of directors, our
board committees or as executive officers.
Although as a Foreign Private Issuer we
are exempt from certain corporate governance standards applicable to US issuers, if we cannot satisfy, or continue to satisfy, the initial
listing requirements and other rules of the Nasdaq Capital Market, our securities may not be listed or may be delisted, which could negatively
impact the price of our securities and your ability to sell them.
In order to maintain our listing
on the Nasdaq Capital Market, we will be required to comply with certain rules of the Nasdaq Capital Market, including those regarding
minimum shareholders’ equity, minimum share price, minimum market value of publicly held shares, and various additional requirements.
Even if we initially meet the listing requirements and other applicable rules of the Nasdaq Capital Market, we may not be able to continue
to satisfy these requirements and applicable rules. If we are unable to satisfy the Nasdaq Capital Market criteria for maintaining our
listing, our securities could be subject to delisting. In that regard, on May 18, 2021, we received a notice from Nasdaq indicating that,
as a result of not having timely filed our Annual Report on Form 20-F for the fiscal year ended December 31, 2020, we were not in compliance
with Nasdaq Listing Rule 5250(c)(1), which requires timely filing of all required periodic financial reports with the Securities and Exchange
Commission. Nasdaq required that we submit a plan no later than July 16, 2021 to regain compliance and we have in fact regained compliance
with Nasdaq’s listing requirements since then.
If we fail to maintain proper and effective
internal controls, our ability to produce accurate financial statements on a timely basis could be impaired.
We
are subject to the reporting requirements of the Securities Exchange Act of 1934, as amended, the Sarbanes-Oxley Act and the rules and
regulations of Nasdaq. The Sarbanes-Oxley Act requires, among other things, that we maintain effective disclosure controls and procedures
and internal controls over financial reporting. Internal control over financial reporting is a process designed to provide reasonable
assurance regarding the reliability of financial reporting and the preparation of financial statements in accordance with International
Financial Reporting Standards.
In
connection with the audit of our consolidated financial statements for the years ended December 31, 2022, 2021 and 2020, our independent
registered public accountants identified three, six and two material weaknesses, respectively, in our internal control over financial
reporting.
We
have taken steps to remediate these material weaknesses, and to further strengthen our accounting staff and internal controls, as described
above. These measures have only partially remediated the material weaknesses identified in 2022 and 2021 as discussed above. We cannot
be certain that other material weaknesses and control deficiencies will not be discovered in the future. Any failure to maintain internal
control over financial reporting could severely inhibit our ability to accurately report our financial condition or results of operations.
If our efforts are not successful or other material weaknesses or control deficiencies occur in the future, we may be unable to report
our financial results accurately on a timely basis or help prevent fraud, which could cause our reported financial results to be materially
misstated and result in the loss of investor confidence or delisting, cause the market price of our Common Shares to decline, and we could
be subject to sanctions or investigations by Nasdaq, the Securities and Exchange Commission, or other regulatory authorities. Failure
to remedy any material weakness in our internal control over financial reporting, or to implement or maintain other effective control
systems required of public companies, could also restrict our future access to the capital markets.
ITEM 4. INFORMATION
ON THE COMPANY
| A. |
History and Development of the Company |
We were incorporated on October
15, 1986 as Big Rock Gold Ltd. as a corporation under the Company Act of British Columbia incorporation number BC 0316008. On April 5,
1988, we changed our name to International Cruiseshipcenters Corp. On June 24, 1991, we changed our name to Riley Resources Ltd. Effective
January 23, 1998, we changed our name to International Riley Resources Ltd. Effective November 22, 2001, we changed our name to Wind River
Resources Ltd. On January 3, 2008, we changed our name to Teslin River Resources Corp. In 1998, in connection with the name change to
International Riley Resources Ltd., we consolidated our share capital on an eight to one basis and in 2001, in connection with the name
change to Wind River Resources Ltd., we further consolidated our share capital on a five to one basis.
On July 24, 2015, Teslin River
Resources Corp. completed a reverse acquisition by way of a three-cornered amalgamation, pursuant to which we acquired certain telecom
operations of an Israel-based cellular technology company and changed our name to Siyata Mobile Inc.
On June 7, 2016, we acquired
all of the issued and outstanding shares of Signifi Mobile Inc., or Signifi. In consideration for such acquisition, we paid cash in the
amount of CAD$200,000 and issued 1,000,000 (6,897 shares after the 145/1 stock split) Common Shares at a value of CAD$360,000.
The Company’s common
shares were previously listed on the TSX Venture Exchange (the “TSXV”) under the symbol “SIM” and the Company
voluntarily delisted from the TSXV at the end of trading on October 19, 2020. Our shares traded on the OTCQX under the symbol “SYATF”
from May 11, 2017 until September 25, 2020, at which time our shares were listed on the Nasdaq Capital Market.
On January 2, 2021, we announced
the closing of a previously announced private placement led by Phoenix Fund of 129,450 units of the Company at a price of $100 per unit
for aggregate gross proceeds of $12,945,000 USD. Each Unit consisted of ten Common Shares of the Company and ten Common Share purchase
warrants. Each warrant entitles the holder thereof to acquire an additional Common Share of the Company at a price of $11.50 for a period
of 42 months from the date of issuance.
On February 9, 2021, we announced
that Peter Goldstein was appointed to serve as the Chairman of the Board of Directors, or the Board, of the Company. The Company further
announced that Luisa Ingargiola was appointed as a director and a member of the Audit Committee, which took effect following the Company’s
annual shareholders meeting held on February 23, 2021. Ms. Ingargiola replaced Brian Budd on the Board due to Mr. Budd not being re-nominated
to serve on the Board at the upcoming shareholder’s meeting. Ms. Ingargiola resigned from the Board on October 29, 2021.
In March 2021, we acquired,
through a wholly owned subsidiary formed by Signifi, all of the outstanding units of Clear RF LLC, or Clear RF. In exchange for 100% of
the units of Clear RF, we agreed to pay a total of $700,000, comprised of approximately $389,970 in our Common Shares and $310,030 in
cash. At closing we issued 23,949 Common Shares valued at $194,985 as the share consideration as well as $155,015 in cash and are required
to pay an additional $155,015 in cash and an additional $194,985 of our Common Shares, subject to adjustment on March 31, 2022.
On April 8, 2021, we were
informed by the British Columbia Securities Commission that it had issued a cease trading order due to the Company’s failure to
timely file its annual audited financial statements for the year ended December 31, 2020, its annual management’s discussion and
analysis for the year ended December 31, 2020, its annual information form for the year ended December 31, 2020 and its certification
of annual filings for the year ended December 31, 2020. The Order did not impact the trading of our Common Shares and Warrants, trading
under the symbols SYTA and SYTAW, respectively, on the Nasdaq Capital Market. The Order was revoked as of July 8, 2021.
On May 18, 2021, we received
a notice from the Nasdaq indicating that, as a result of not having timely filed its Annual Report on Form 20-F for the fiscal year ended
December 31, 2020, the Company is not in compliance with Nasdaq Listing Rule 5250(c)(1), which requires timely filing of all required
periodic financial reports with the Securities and Exchange Commission. We filed the Form 20-F on June 30, 2021 and believe that we regained
compliance with the applicable Nasdaq rule.
On August 20, 2021, we were
informed by the British Columbia Securities Commission that it had issued a cease trading order due to our failure to timely file its
interim financial report for the period ended June 30, 2021, interim management’s discussion and analysis for the period ended June
30, 2021 and certification of interim filings for the period ended June 30, 2021. We filed our financial statements and other outstanding
materials on October 14, 2021 and the cease trading order was revoked on October 15, 2021.
On October 27, 2021, we entered
into a securities purchase agreement relating to the purchase and sale of a senior secured convertible note (the “Lind Note”)
for gross proceeds of $6,000,000 with Lind Global Partners II, LP, or Lind, an investment fund managed by The Lind Partners, a New York
based institutional fund manager (together “Lind”) which closed on November 3, 2021. The purchase agreement provided for,
among other things, the issuance of a $7,200,000 Note with a 24-month maturity, 0% annual interest rate, and a fixed conversion price
of $10.00 per share of the Company’s Common Shares. The Company is required to make principal payments in 18 equal monthly installments
commencing 180 days after funding. At the discretion of the Company, the repayments can be made in: (i) cash; (ii) Common Shares (after
Common Shares are registered) (the “Repayment Shares”); or a combination of both. Repayment Shares will be priced at 90% of
the average of the five lowest daily VWAPs during the 20 trading days before the issuance of the Common Shares (the “Repayment Price”).
The Company has the right to buy-back the outstanding face value of the Note at any time with no penalty (“Buy-Back Right”).
Should the Company exercise its Buy-Back Right, Lind will have the option to convert up to 25% of the face value of the Note at the lesser
of the conversion price of the Notes or the Repayment Price. Additionally, the Note ranks senior to other Company debt, excluding certain
debt facilities, and is secured over Company assets, as more fully detailed in the Purchase Agreement and Note. Further, the purchase
agreement provided that Lind will also receive a Common Shares purchase warrant to purchase up to 21,429 shares of the Company’s
Common Shares (“Lind Warrant”). The Lind Warrant may be exercisable with cash payment for 60 months with an exercise price
of $400.00 per Common Share (as later adjusted) and may be exercised on a cashless basis in the event that a registration statement covering
the underlying Common Shares is not deemed effective. Both the Lind Note and the Lind Warrant contain certain anti-dilution protection
in certain circumstances. The Company’s registration statement covering the Common Shares underlying the Note and Warrant was declared
effective on December 3, 2021.
The Lind Note was repaid in
full on November 14, 2022. Of the total repayment of principal and interest, the Company paid Lind $8,137,702 in cash and issued Lind
131,123 Common Shares. The Securities Purchase Agreement pursuant to which Lind Partners acquired the Lind Notes prohibits the Company
from entering into any Prohibited Transactions without Lind’s prior written consent, until thirty days after such time as the Lind
Note has been repaid in full and/or has been converted into Common Shares. That agreement also provides to Lind a 10 day right of first
purchase if the Company makes a public offer of its Common Shares. On October 9, 2022, Lind entered into an agreement pursuant to which
they waived such provisions in consideration of participating in the Company’s offering that closed on October 12, 2022 and receiving
without payment therefor Common Share purchase warrants in the private placement to acquire up to 17,391 Common Shares at an exercise
price of $23.00 per Common Share (the “Lind Waiver Warrants”). Lind did not exercise any of said Lind Waiver Warrants and
did not participate in the Warrant Exercise Agreement discussed below.
Effective on October 29, 2021,
the Board appointed Lourdes Felix as a director of the Board to fill the vacancy created by the resignation of Ms. Ingargiola. Ms. Felix
will serve as a director until the Company’s next annual general meeting of shareholders and until her successor shall have been
elected and qualified, subject to her earlier death, resignation, retirement, disqualification or removal. Ms. Felix was also appointed
to serve as a member of the Company’s Audit Committee and Nominating and Corporate Governance Committee.
On November 15, 2021, Siyata
announced the closing of a previously announced funding agreement for gross proceeds of $6,000,000 by Lind Global Partners II, LP, an
investment fund managed by The Lind Partners. The proceeds were used to repay and terminate certain existing convertible notes.
On January 11, 2022, the Company
closed its underwritten public offering of 86,957 Common Shares (or pre-funded warrants to purchase Common Shares in lieu thereof) and
accompanying Warrants to purchase up to 86,957 Common Shares resulting in gross proceeds of approximately $20,000,000 and net proceeds
of $18,358,028.
On May 24, 2022, we received
a letter from Davidson & Company LLP (“Davidson”) that stated that Davidson did not wish to be reappointed as the Company’s
independent registered public accounting firm for the fiscal year ending December 31, 2022. Davidson ceased to serve as the Company’s
independent registered accounting firm as of May 24, 2022. The Company requested that Davidson respond fully to the inquiries of Friedman,
LLP, the Company’s successor independent registered public accounting firm, and Davidson agreed to cooperate with the Company and
Friedman with respect to the transition. During the Company’s fiscal years ended December 31, 2021 and 2020 and the subsequent interim
period through the filing of the Company’s Report of Foreign Private Issuer on Form 6-K on May 31, 2022, there were no “disagreements”
(as defined in Item 304(a)(1)(iv) of Regulation S-K and the related instructions to Item 304 of Regulation S-K) with
Davidson on any matter of accounting principles or practices, financial statement disclosure, or auditing scope or procedure, which disagreements,
if not resolved to the satisfaction of Davidson, would have caused Davidson to make reference to the subject matter of such disagreements
in connection with its report. Davidson’s report on the consolidated financial statements for the Company’s fiscal years ended
December 31, 2021 and 2020 did not contain any adverse opinion or disclaimer of opinion and were not qualified or modified as to uncertainty,
audit scope or accounting principles, except that Davidson’s report for the years ended December 31, 2021 and 2020 contained
an explanatory paragraph indicating that there was substantial doubt about the ability of the Company to continue as a going concern.
In a separate correspondence, Davidson identified five material weaknesses in our internal controls over financial reporting. During the
Company’s fiscal years ended December 31, 2021 and 2020 and the subsequent interim period through May 31, 2022, there had been no
“reportable events” (as defined in Item 304(a)(1)(v) of Regulation S-K), except for certain material weaknesses in the Company’s
internal control over financial reporting.
On May 24, 2022, management
of the Company notified Friedman LLP, or Friedman, that Friedman had been approved by the Company’s audit committee of the board
of directors and the board of directors as the Company’s independent registered public accounting firm for the fiscal year ended
December 31, 2022. Friedman LLP combined with Marcum LLP, or Marcum, effective September 1, 2022. During the fiscal years ended December
31, 2021 and 2020 and the subsequent interim period through May 31, 2022, the Company did not consult with Friedman or Marcum with respect
to: (i) the application of accounting principles to a specified transaction, either completed or proposed, or the type of audit opinion
that might be rendered with respect to the Company’s financial statements, and no written report or oral advice was provided to
the Company by Friedman or Marcum that was an important factor considered by the Company in reaching a decision as to any accounting,
auditing or financial reporting issue, or (ii) any matter that was subject to any disagreement, as defined in the United States Securities
and Exchange Commission’s Regulation SK, Item 304(a)(1)(iv) and the related instructions thereto, or a reportable event within the
meaning set forth in Item 304(a)(1)(v) of Regulation S-K.
As part of the Company’s
normal quarterly reporting process for the six months ended June 30, 2022, management and the Audit Committee concluded that a material
error was made related to the accounting for the warrants entered into on January 11, 2022 (the “January Warrants”)
and therefore were misstated in the Company’s March 31, 2022 prior period financial statements, or Prior Period Financial Statements.
There was no impact on any of the year end financial statements previously filed. On August 15, 2022, management and the Audit Committee
determined that the Company’s condensed consolidated unaudited interim financial statements for the three month period ended March
31, 2022, filed with the SEC on Form 6-K on May 17, 2022 should no longer be relied upon due to an error in the accounting treatment for
the classification of the Company’s January Warrants as equity rather than as a derivative liability. In addition, investors were
advised that they should no longer rely upon any communications relating to these condensed consolidated unaudited interim financial statements.
The Company determined that the January Warrants should be accounted for as a derivative liability in accordance with International Accounting
Standards No. 32.6 and International Financial Reporting Standards No. 9 that deal with the measurement of financial assets and financial
liabilities. As a result of this change, the January Warrants for 100,000 Common shares have been classified as liabilities rather than
equity, the fair value of the January Warrants decreased by $2.9 million, transaction costs increased by $0.96 million and the fair value
loss increased by $0.96 million for the three months ended March 31, 2022. The Company filed its restated condensed consolidated unaudited
interim financial statements for the three month period ended March 31, 2022 as Exhibit 99.1 to its Form 6-K with the SEC on August 18,
2022 together with its restated Management’s Discussion and Analysis of Results of Operations and Financial Condition for the three months
ended March 31, 2022.On July 1, 2022, the Company filed a “shelf” registration statement with the SEC covering $100 million
aggregate amount of Common Shares, warrants to purchase Common Shares or debt securities, or any combination thereof, subscription rights
evidencing the right to purchase Common Shares or debt securities, or any combination thererof, purchase contracts to purchase Common
Shares, warrants, rights, debt securities, or any combination thererof, as well as units that include any of these securities. That registration
statement was declared effective by the SEC on July 18, 2022.
On October 10, 2022, we entered
into a Securities Purchase Agreement or the Purchase Agreement with certain institutional investors named therein (the “Purchasers”),
pursuant to which we agreed to issue and sell, in a registered direct offering from the shelf: (i) 158,100 Common Shares, (ii)
15,900 pre-funded warrants, or the Pre-Funded Warrants and, (iii) in a private placement under Rule 506 of Regulation D, 174,000
warrants, or the Purchase Warrants at a combined purchase price of $0.23 per Common Share and Purchase Warrant if purchasing the
Common Shares, or $22.00 per Pre-Funded Warrant and Purchase Warrant if purchasing the Pre-Funded Warrants. Each Purchase Warrant entitles
the Purchaser to purchase one Common Share for a period of five years from the date of issuance for an exercise price of $0.23 per share.
The Purchase Agreement contained customary representations and warranties and agreements of the Company and the Purchasers and customary
indemnification rights and obligations of the parties. The offering closed on October 13, 2022 resulting in gross proceeds of approximately
$4.0 million.
On November 22, 2022, the
Company filed a registration statement with the SEC registering the resale, from time to time, by the selling shareholders named therein
of up to 174,000 of our Common Shares issuable upon the exercise of the Common Share purchase warrants issued to the Selling Shareholders
in a private placement pursuant to the Securities Purchase Agreements dated October 10, 2022 by and between the Selling Shareholders and
the Company. That registration statement went effective on December 15, 2022.
On December 26, 2022, we
were notified that there had occurred a significant infiltration of water into our warehouse premises located at 1751 Richardson,
Suite 2207, Montreal, Quebec, Canada, due to a leaking water pipe in the floor above (which floor is not leased by the Company).
Upon inspection of the premises, we believed that there could be substantial damage to our warehoused inventory of communication
devices and signal boosters, the dollar value of which was presently not determinable. We are continuing to assess the potential
damages, which will require a special inspection to determine the condition of the merchandise. Management believes that any damage
is covered by its current property insurance policy and has filed a claim with our commercial property insurer whose policy covers
the selling price of damaged inventory. Because we store similar inventory in another location, we did not believe that this event
would result in any interruption of our sales activities, and thus future revenues should not be impacted by the water damage to the
subject inventory. Only new, non-damaged, quality products will be shipped to our customers. From a balance sheet and income
statement perspective, any damaged inventory will be considered impaired and written off (expensed) on the Company’s income
statement as an impairment due to the water damage, and the inventory values will be reduced on the balance sheet by the amount of
the damages in the fourth quarter of 2022. Any insurance proceeds receivable will be recorded as income in the quarter (likely in
2023) when it is at least virtually certain that the proceeds to be paid by the Company’s insurer have been agreed by both
parties. Under international accounting standards, insurance proceeds are accounted for as “reimbursements” and would be
recognized as a separate asset (with related income) when the recovery is virtually certain.
On January 18, 2023, we entered
into warrant exercise agreements with fourteen existing accredited investors to exercise certain outstanding warrants, or Existing Warrants,
to purchase up to an aggregate of 180,429 of the Company’s Common Shares. The gross proceeds to the Company from the exercise of
the Existing Warrants totaled approximately $3,608,571, prior to deducting warrant inducement agent fees and estimated offering expenses.
In consideration for the immediate exercise of the Existing Warrants for cash, the exercising holders received new unregistered warrants,
or New Warrants, to purchase up to an aggregate of 180,429 Common Shares (equal to 100% of the Common Shares issued in connection with
the exercise) in a private placement pursuant to Section 4(a)(2) of the Securities Act. In connection with the warrant exercise, the Company
also agreed to reduce the exercise price of the Existing Warrants from $23.00 to $20.00 per share. The warrant exercise agreements and
the New Warrants each include a beneficial ownership limitation that prevents the warrant holder from owning more than 4.99% (which may
be increased to 9.99% in accordance with the terms of the New Warrants) of the Company’s outstanding Common Shares at any time.
The New Warrants are exercisable immediately upon issuance at a cash exercise price of $0.20 per share and have a term of exercise equal
to five years. However, the holder of the New Warrant may also effect an “alternative cashless exercise” on or after the earlier
of: (i) one hundred and eighty (180) day anniversary of the initial exercise date (January 19, 2023) or (ii) the day after effectiveness
of the registration statement of which this prospectus is a part. In such event, the aggregate number of Common Shares issuable in such
alternative cashless exercise pursuant to any given notice of exercise electing to effect an alternative cashless exercise will equal
the product of (x) the aggregate number of Common Shares that would be issuable upon exercise of the New Warrant in accordance with the
terms of the New Warrant if such exercise were by means of a cash exercise rather than a cashless exercise and (y) 1.0, which would result
in an effective exercise price of $0 at such time. In connection with the exercise of the Existing Warrants, the Company reduced the exercise
price of 29,891 of certain of its remaining unexercised Common Share purchase warrants from $23.00 per Common Share to an exercise price
of $00.00 per Common Share, which warrants may subsequently be repriced to $0 if the cashless exercise price of the New Warrants is triggered.
However, previously issued warrants: (i) for 18,056 Common Shares that currently trade on the Nasdaq Capital Market under the symbol “SYTAW”
that have an exercise price of $685.00 per share; (ii) for 12,945 Common Shares that were issued in a private transaction that have an
exercise price of $1,150.00 per share; and (iii) for 100,000 Common Shares that were issued in a private transaction that have an exercise
price of $230.00 per share are not required by their terms to be repriced.
On February 15, 2023, we filed
a registration statement with the SEC registering for resale, from time to time, by the selling shareholders named therein up to 197,820
of our Common Shares issuable upon the exercise of: (i) the Common Share purchase warrants for 180,430 Common Shares (the “New Warrants”)
issued to certain of the selling shareholders in a private placement pursuant to Warrant Exercise Agreements dated January 18, 2023 by
and between those selling shareholders and the Company and (ii) upon the exercise of the Lind Waiver Warrants (defined therein) for 17,391
Common Shares issued to Lind under the securities purchase agreement dated October 27, 2021. That registration statement went effective
on March 30, 2023.
Our
auditor has agreed with management’s decision to include a “going concern” explanatory paragraph in its report on our
consolidated financial statements for the fiscal year ended December 31, 2022, expressing substantial doubt about our ability to continue
as an ongoing business for the next twelve months. Our consolidated financial statements do not include any adjustments that may result
from the outcome of this uncertainty. If we cannot secure the financing needed to continue as a viable business, our shareholders may
lose some or all of their investment in us. The Canadian registered office of the Company is located at 885 West Georgia Suite 2200, Vancouver,
British Columbia V6C-3E8 and our warehouse and Canadian sales headquarters is located at 1751 Richardson Street, Suite #2207, Montreal,
Quebec H3K-1G6, Canada. Our agent for U.S. federal securities law purposes is c/o Cogency Global Inc., 122 East 42nd Street,
18th Floor, New York, NY 10168.
The following diagram illustrates our corporate
structure as of the date of this MD&A:

Our website address is https://www.siyatamobile.com/.
The information contained on our website or available through our website is not incorporated by reference into and should not be considered
a part of this Annual Report, and the reference to our website in this Annual Report is an inactive textual reference only. The SEC also
maintains an Internet website that contains reports, proxy and information statements, and other information regarding issuers that file
electronically with the SEC. Our filings with the SEC are also available to the public through the SEC’s website at www.sec.gov.
Siyata Mobile Inc. is a leading
global developer of innovative cellular-based communications solutions over advanced mobile networks under the Uniden®
Cellular and Siyata brands to global first responders and enterprise customers. Siyata’s three complementary product categories
include rugged handheld mobile devices and in-vehicle communications solutions which are sold to first responders, enterprise customers,
commercial fleet vehicles and industrial workers, and cellular amplifiers to boost the cellular signal inside homes, and buildings and
vehicles.
Our customer base includes
cellular network operators and their dealers, as well as commercial vehicle technology distributors for fleets of all sizes in the United
States, Canada, Europe, Australia and the Middle East.
Products
The
Company develops, markets and sells a portfolio of rugged handheld Push-to-Talk over Cellular (“PoC”) smartphone devices.
These rugged business-to-business (“B2B”) environments are focused on enterprise customers, first responders, construction
workers, security guards, government agencies, utilities, transportation and waste management, amusement parks, and mobile workers in
multiple industries.
Prior to 2021, Siyata sold
rugged handsets, such as the Uniden UR5 and Uniden UR7 only in international markets. In Q2 2022, Siyata unveiled its next generation
rugged device, the SD7. The SD7 is Siyata’s first mission critical push-to-talk device (“MCPTT”) and is also the first
rugged handset that Siyata announced in North America in the fourth quarter of 2021, and is now shipping in North America, Europe, The
Middle East and Australia. The wireless carriers who have certified and are selling SD7 Handset include AT&T, FirstNet, Verizon, T-Mobile,
US Cellular, Bell Mobility, Telstra, and KPN. The SD7 Rugged PTT Handset is targeting first responders and enterprise customers who have
previously used traditional legacy two-way Land Mobile Radios (“LMR”) but who would prefer a solution that provides wide-area
coverage like a cellular device, and also one that provides the same core functionality of Push-to-Talk that they used with their previous
older technology.

SD7 Handset
Siyata has also announced the SD7+ with Body Camera,
which is similar to the SD7 Handset, but it incorporates body camera functionality. The SD7+ can replace both an LMR two-way radio and
a dedicated body camera device for police, security, or any customer who requires PTT and body camera functionality. The SD7+ is expected
to begin shipping in the coming months.

SD7+ Body Cam
Our
second product category is purpose built In-Vehicle communication devices. In Q4 2021, Siyata launched the VK7, a first-of-its-kind, patent-pending
vehicle kit with an integrated 10-watt speaker, a simple slide-in connection sleeve for the SD7 Handset, and an external antenna connection
for connecting an antenna to allow for an in-vehicle experience for the user that is similar to that from a traditional land mobile radio
(“LMR”) device. The VK7 has been uniquely designed to be used with the SD7 Handset, while connecting directly into the vehicle’s
power and can also connect to a Uniden cellular amplifier for better cellular connectivity. The pending patent for the VK7 Vehicle Kit
provides temperature control by heating the VK7 in cold environments, and cooling the VK7 in hot environments. The VK7 can also be equipped
with an external remote speaker microphone (“RSM”) to ensure compliance with hands-free communication legislation.
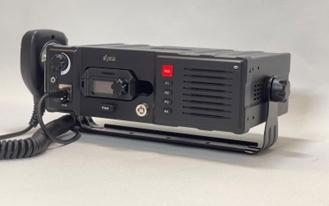
VK7 Vehicle Kit
The Uniden®
UV350 4G/LTE, is a purpose built In-Vehicle communication device designed specifically for professional vehicles such as trucks, vans,
buses, emergency service vehicles and other enterprise vehicles. This platform is designed to facilitate replacement of the current in-vehicle,
multi-device status-quo with a single device that incorporates voice, PoC, data, fleet management solutions and other Android based professional
applications. The UV350 also supports Band 14 for the First Responder Network Authority, or FirstNet®, compatibility which
is the U.S. First Responders 4G/LTE network with PoC capabilities that aims to replace aging two-way radio systems currently in use.

UV350 In-Vehicle Device
Prior to the third quarter of 2023, we launched commercially a new
In-Vehicle solution called Siyata Real Time View, which is a mobile DVR (Digital Video Recording) solution for monitoring first
responder vehicles. As the name suggests, video streaming from forward-facing, rear-facing, side-facing, and in-cab cameras are all possible
with Siyata Real Team View. We announced our first sale in June 2023 and in the third quarter of 2023 we began installing the solution
into ambulances and first responder vehicles of a large first responder organization. This solution has proven to be a key tool for this
organization to monitor its fleet of vehicles.
The
aforementioned portfolio of solutions offers the benefits of PoC without any of the difficulties managing the current generation of rugged
smart/feature phones and is ideally suited as a perfect upgrade from Land Mobile Radios (“LMR”). Used for generations, LMR
has a significant number of limitations, including network incompatibility, limited coverage areas, and restricted functionality that
leave a huge need for a unified network and platform. Siyata’s innovative PoC product lines are helping to service the generational
shift from LMR to PoC. According to VDC Research, the LMR market is growing at a 5.9% compound annual growth rate, while the PoC market
is growing at 13.6% CAGR and annual PoC shipments are expected to grow to 2.7 million in 2023.
Siyata’s customer base
includes cellular network operators and their dealers, as well as commercial vehicle technology distributors for fleets of all sizes in
the U.S., Canada, Europe, Australia, The Middle East and other international markets.
Cellular boosters are our
third product category with approximately 30 million of these devices sold globally every year. Siyata manufactures and sells Uniden®
Cellular boosters and accessories for enterprise, first responder and consumer customers with a focus on the North America markets.
Cellular communication provides a robust, secure environment not just for remote workers, in-home and in-vehicles; but also for restaurant
patrons who wish to download menus; for patients at pharmacies who need to verify identity and download scripts; for remote workers who
require strong clear cellular signals; and for first responders where connectivity literally means the difference between life and death
- just to name a few examples. The vehicle vertical in this portfolio complements Siyata’s in-vehicle and rugged handheld smartphones
as these sales can be bundled through the Company’s existing sales channels.
 |
 |
 |
| Uniden U70P In-Building Booster |
Uniden UM50 In-Vehicle Booster |
Uniden UM2M In-Vehicle Booster |
We offer a full line of cellular
boosters, to boost cellular reception, under the brand name Uniden®. We have entered into a partnership whereby Uniden
America Corporation, the North American subsidiary of Japan-based Uniden Corporation, has granted the exclusive license to us to market
cellular signal boosters under the Uniden® brand name within the U.S. and Canada, on a rolling three year contract term,
with the current extension expiring December 31, 2031 unless sooner terminated pursuant to the terms of this Agreement. As a world-wide
leader in wireless communications, Uniden America Corporation manufactures and markets wireless consumer electronic products. Based in
Fort Worth, Texas, Uniden sells its products through dealers and distributors throughout North, Central and South America. Uniden Cellular
booster kits solve issues of poor reception, dropped calls, lost data and transmission quality issues that users routinely experience
on every cellular network. These easy-to-install cellular booster kits are designed for homes, cabins, offices, and buildings to improve
the cellular signal reception indoors, allowing people to use their cellular phones indoors where they previously could not do so. We
also offer models designed for vehicles, both wired and wireless boosters, to improve the cellular reception inside a vehicle that is
driving in a weak cellular signal area. Uniden cellular signal boosters offer kits designed to offer cellphone coverage for difference
distances, including kits for a small area of 1 or 2 rooms, and more expansive solutions that will cover over 100,000 sq. ft. Our cellular
signal boosters are carrier agnostic to ensure the best signal integrity, supporting 2G, 3G, 4G and soon 5G (in development) technologies
on all carriers operating in North America.
Customers and Channels
Certifications for the SD7
Handset with North American carriers include Bell Mobility, AT&T (as well as at its first responder cellular network FirstNet®),
Verizon Wireless, T-Mobile, US Cellular, and internationally with Telstra and KPN. These wireless carriers also sell the innovative VK7
Vehicle Kit that works with the SD7 Handset. These are major milestones for the Company following Siyata’s years of experience perfecting
in-vehicle cellular based technology, vehicle installations, software integration with various Push-to-Talk (“PTT”) solutions
and intensive carrier certifications.
Siyata’s customer base
includes cellular network operators and their dealers, as well as commercial vehicle technology distributors for fleets of all sizes in
the U.S., Canada, Europe, Australia, the Middle East and other international markets.
Our rugged handsets are targeted
to approximately 47 million enterprise task and public sector workers across North America including construction, transport& logistics,
manufacturing, energy & utility, public safety and federal government. As of December 31, 2022, Siyata had secured North American
wireless carrier approvals of the SD7 Handset for use on their networks from AT&T, FirstNet, Verizon, and Bell Mobility. During 2023,
Siyata has since added T-Mobile and US Cellular to its list of North American wireless carriers who have approved SD7 for use on their
networks. Internationally, Telstra from Australia and KPN from the Netherlands has also approved SD7 for use on their network during 2023.
The North American Tier 1
cellular carriers that Siyata is working with have large scale distribution and sales channels. With an estimated 25 million commercial
vehicles including 7.0 million first responder vehicles, the Company sees the North American market as its largest opportunity with a
total addressable market over $19 billion. These Tier 1 cellular carriers have a keen interest in selling the VK7 Vehicle Kit with the
SD7 Handset and the UV350 In-Vehicle Device as they allow for new SIM card activations in commercial vehicles and increased ARPU from
existing customers with corporate and first responder fleets while targeting new customers with a unique, dedicated PTT solution.
Our Pricing
For wireless carriers, they
are free to price the device how they choose. In most cases for significant sales opportunities the carriers are willing to subsidize
the cost of the device in order to secure the new activations with the associated monthly Average Revenue Per User, or ARPU.
Even our unsubsidized full
price are competitive compared to other hardware solutions, but when our device is subsidized, the capital and operational expense benefits
to customers compared to other solutions are even greater.
Competition
Rugged Handsets Category
Our direct competitors include
Sonim Technologies, Kyocera, and one ruggedized model from Samsung. These competitors also target sales of Push-to-Talk over Cellular
(PoC) solutions through wireless carriers in North America and internationally. None of these competitors offer a unique solution like
our SD7 Handset which focuses on a simple upgrade from two-way radios, nor do they offer an equivalent to our VK7 Vehicle Kit. These direct
competitors focus on more expensive ruggedized Smartphones.
Indirectly, we compete with
low-cost Push-to-Talk over Cellular devices designed and developed by various Chinese companies including Telo, Inrico, and others. These
products are not approved for sale by North America wireless carriers due to lower overall device specifications which do not meet requirements
of North American wireless carriers. These devices are mostly sold in international markets to highly price sensitive customers.
Indirectly, we also compete
with traditional two-way LMR radios, also known as “portables” that are carried or worn on a belt and used for PTT communications.
These are sold by a small number of large LMR vendors who sell directly to large first responder organizations and to large enterprise
customers. They also sell through dealers and distributors to small and medium-sized commercial customers. These products are generally
not sold through wireless carriers in North America or internationally. The government and enterprise customers that they target are now
often considering the alternative of Push-to-Talk over Cellular since customers do not need to purchase repeaters and towers nor any government
licensing for the frequencies that they use. Also, Push-to-Talk over Cellular provides much wider-area coverage, and these PoC solutions
tend to be less expensive than traditional LMR radios both to purchase the PoC hardware such as the Siyata SD7 Handset, as well as to
subscribe to monthly PoC service from a wireless carrier.
In-Vehicle Category
We do not believe that we
have any direct competitors within the in-vehicle market category in North America that provide a dedicated cellular based device for
commercial and first responder vehicles, and we believe that no other company offers an In-Vehicle IoT device that is approved for sale
in North America by wireless carriers.
We have several indirect competitors.
Firstly, customers could choose a handheld phone along with a professionally installed third party car kit. There are car kit providers
who attempt to make their car kits compatible with popular handheld phone models. By comparison, the UV350 device offers enhanced audio
quality, safety, and reception. Furthermore, the UV350 is always active and can be used in temperature extremes. Furthermore, the UV350
kit is one complete solution from one supplier, as opposed to buying separately from two different companies and assembling a phone and
a car kit that offers no proven compatibility.
Our second group of indirect
competitors are rugged tablets that can be placed in a mount. The UV350 device offers better audio quality, better safety, better cellular
reception, and it is always on and ready to be used. Also, compared to a tablet, the UV350 can also make cellular calls including emergency
911 calls whereas the tablet cannot as it is a data only device.
Our third group of indirect
competitors are In-Vehicle Two-way LMR Radios also knows as “mobiles”. Not only can the UV350 make phone calls which the LMR
radio cannot, but the UV350 offers much better coverage due to using the cellular network as opposed to a limited two-way radio network.
And the UV350 can support downloadable Android apps and can serve as a modem for IoT devices and as a Wi-Fi hotspot for further connectivity
options and more.
Our fourth group of indirect
competition is a leading global LMR vendor who offers an In-Vehicle device which is a Push to Talk over Cellular device, compatible only
with its own OEM’s PTT application, and as it is not a smartphone based device so it does not offer any downloadable apps (fleet
management, GPS tracking, live video feed, etc.) nor the ability to make a phone call over the wireless network. This LMR vendor sells
the In-Vehicle device directly to customers and through its dealer channel, but not through wireless carriers.
Cellular Boosters Category
Within the Cellular Booster
category, we have several direct competitors, including Wilson Electronics, LLC, Nextivity Inc., and SureCall Company.
Intellectual Property
We own two patents that we
acquired from ClearRF, as discussed below, and we have entered into several licensing agreements for the use of a trademark and certain
patents.
Uniden America Corporation
In December 2012, Signifi
Mobile, the Company’s wholly-owned subsidiary entered into a license agreement with Uniden America Corporation, as amended (the
“Uniden Agreement”). The Uniden Agreement provides for the Company to use the trademark “Uniden®”,
along with associated designs and trade dress to distribute, market and sell its In-Vehicle device, cellular signal booster and accessories
during its term in North America. The agreement includes renewal options up to December 31, 2031 and is subject to certain minimum royalties.
Wilson Electronics LLC
Effective January 1, 2018,
Signifi Mobile Inc., the Company’s wholly-owned subsidiary, entered into an agreement with Wilson Electronics, LLC to permit the
Company to utilize several of Wilson Electronics’ patents related to cellphone boosters (the “Wilson Agreement”). The
Wilson Agreement grants the Company an indefinite right to utilize its cellphone booster-related patents in exchange for paying Wilson
Electronics, LLC a royalty fee for boosters sold by the Company. The Wilson Agreement remains in force until the Wilson patents on the
Booster products expire.
Via Licensing Corporation
Effective June 8, 2018, the
Company entered into two separate licensing agreements with Via Licensing Corporation to utilize worldwide patents related to the coding
and decoding of “android” software as well as access and download within the “LTE/ 4G” network. This patent is
for an initial period of 5 years and can be extended for a further 5-year term. The Company has the right at any time during the term
on any extension hereof, to terminate these agreements upon providing 60 days advanced notice of termination. The quarterly royalty fees
are based solely on product sales and is a percentage formula based upon the number of units sold, the country manufactured and the country
location of the end customer. There are no minimum royalty fees payable according to the agreement.
eWave Mobile Ltd.
Effective October 1, 2017,
we entered into an Asset Purchase Agreement with eWave Mobile Ltd., or eWave, for the purchase of certain distribution rights and contracts
in connection with the right to sell and distribute in Israel certain cellular devices for the push to talk market, or the eWave Supplies,
in exchange for $700,000 in cash and issued shares of common stock of the Company equal to $700,000. Additionally, we shall pay eWave
50% of up to $1,500,000 in net profit that we earn from sales related to the eWave Suppliers, and 25% thereafter of the net profit exceeding
$1,500,000.
Clear RF, LLC
On March 31, 2021, the Company’s
indirectly and wholly-owned subsidiary ClearRF Nevada Inc. acquired all of the issued and outstanding interests of Clear RF, LLC, or ClearRF,
a Washington State limited liability company, for a total purchase price of US$700,000 in a combination of cash and Common Shares. ClearRF
produces M2M (machine-to-machine) cellular amplifiers for commercial and industrial M2M applications and offers patented direct connect
cellular amplifiers and patented auto gain & oscillation control designed for M2M and “internet-of-things.” Or IoT, applications.
Two patents (described below) held by ClearRF were subsequently transferred and assigned to ClearRF Nevada following the closing of this
acquisition.
| |
i. |
RF Passive Bypass technology enables tethered devices to communicate through the amplifier network, even if the amplifier loses power, or when the signal is not required, a key differentiator amongst competitors, in particular for mission-critical applications and first responder vehicles that require constant clear cellular coverage and connectivity. |
| |
ii. |
Auto Gain & Oscillation Control detects the level of incoming signal strength and self-adjusts output power to ensure maximum signal strength. This feature is vital for telematics (mobile) M2M applications because the amplifier will be in constant motion and will require periodic self-adjustment based on changing incoming signal environment. |
Seasonality
We do not experience any effects
of seasonality it our business. Our products are designed to function at full capacity under all weather conditions and therefore, we
do not experience any shifts in our sales patterns.
| C. |
Organizational Structure |
Our subsidiaries as of September
30, 2022 are as follows:
| Name of Subsidiary |
|
Principal Activities |
|
Place of Incorporation |
|
Ownership |
|
| Queensgate Resources Corp. |
|
Inactive |
|
British Columbia, Canada |
|
|
100 |
% |
| Queensgate Resources US Corp. |
|
Inactive |
|
Nevada, USA |
|
|
100 |
% |
| Siyata Mobile (Canada) Inc. |
|
Inactive |
|
British Columbia, Canada |
|
|
100 |
% |
| Siyata Mobile Israel Ltd. |
|
R&D and wholesale distribution |
|
Israel |
|
|
100 |
% |
| Signifi Mobile Inc. |
|
Wholesale distribution |
|
Quebec, Canada |
|
|
100 |
% |
| ClearRF Nevada Ltd. |
|
Inactive |
|
Nevada, USA |
|
|
100 |
% |
| ClearRF LLC |
|
Inactive holding patents |
|
Washington, USA |
|
|
100 |
% |
| D. |
Property, Plant and Equipment |
Our warehouse and Canadian
sales headquarters are located at 1751 Richardson Street, Suite #2207, Montreal, Quebec H3K-1G6, Canada, with approximately 5,616 square
feet of space. We entered into a lease agreement for its property for a 20-month term, beginning on October 1, 2022, and expiring on May
31, 2024. Under this Lease, we pay net rent of $2.00 per square foot per annum, approximately $11,232 annum, payable in monthly equal
installments. Additional warehouse space was leased at 250 Ford Boulevard, town of Chateauguay, Quebec, J6J-4Z2 with approximately 2,837
square feet of space. We entered into a lease agreement for its property for a 26 month term, beginning on April 1, 2022 and expiring
on May 31, 2024. Under this Lease, we pay net rent of $11.50 per square foot per annum, approximately $32,625 annum, payable in monthly
equal installments.
We
believe that our existing facilities are adequate to meet current requirements and that suitable additional or substitute space will be
available as needed to accommodate any further physical expansion of operations and for any additional offices.
ITEM 4A. UNRESOLVED STAFF COMMENTS
None.
ITEM 5. OPERATING AND FINANCIAL REVIEW AND
PROSPECTS
The following discussion
and analysis of our financial condition and results of operations should be read in conjunction with our consolidated financial statements
and the related notes included elsewhere in this Annual Report. The discussion below contains forward-looking statements that are based
upon our current expectations and are subject to uncertainty and changes in circumstances. Actual results may differ materially from these
expectations due to inaccurate assumptions and known or unknown risks and uncertainties, including those identified in “Cautionary
Note Regarding Forward-Looking Statements” and under “Risk Factors” elsewhere in this Annual Report.
Overview
Siyata Mobile Inc. is a leading
global developer of innovative cellular-based communications solutions over advanced mobile networks under the Uniden®
Cellular and Siyata brands to global first responders and enterprise customers. Siyata’s three complementary product categories
include rugged handheld mobile devices and in-vehicle communications solutions which are sold to first responders, enterprise customers,
commercial fleet vehicles and industrial workers, and cellular amplifiers which are sold to boost the cellular signal inside homes, buildings
and vehicles.
On September 25, 2020 the
Company listed on the Nasdaq Capital Markets (“Nasdaq”) under the symbol SYTA for its Common Shares, and the Company’s
warrants issued on September 29, 2020 at $6.85 are traded under the symbol SYTAW, and expire in five (5) years from the date of issue.
The registered and records office is located at 7404 King George Blvd,
Suite- 200, Surrey, BC, V3W1N6, Canada.
Significant Highlights
The following highlights and
developments until the date of this MD&A are as follows:
On May 16, 2023, Siyata announced
its Q4 2022 and full year 2022 financial results.
On May 17, 2023, Siyata announced
that KPN Royal Dutch Telecom (“KPN”) in the Netherlands are now selling the Siyata SD7 Handset.
On May 22, 2023, Siyata announced
its participation in Critical Communications World tradeshow, held in Helsinki, Finland on May 23 to 25, 2023.
On May 24, 2023, Siyata announced
its Q1, 2023 financial results.
On May 31, 2023, Siyata announced
that it is presenting at the 13th annual LD Micro Invitational conference in Los Angeles, California from June 6 to 8, 2023.
On June 1, 2023, Siyata announced
it had received an order from an Emergency Medical Services (“EMS”) organization for $1.2 million for In-Vehicle devices and
for a new product called Siyata Real Time View, an in-fleet video monitoring solution.
On June 5, 2023, Siyata announced
aggregate orders of $400,000 for its SD7 Handset and VK7 Vehicle Kit from the verticals of healthcare, education, and construction.
On June 12, 2023, Siyata announced
that Minnesota Coaches, Inc, a privately held motor coach and school bus transportation company, has taken delivery of its first order
of SD7 Handsets and VK7 Vehicle Kits.
On June 14, 2023, Siyata announced
a new product called the Siyata Mobile Command Center for in-field communications for EMS organizations.
On June 15, 2023, Siyata announced
its participation to showcase its SD7 Handset and VK7 Vehicle Kit in the Minnesota School Bus Operators Association’s Annual Summer
Conference in Alexandria, Minnesota on June 19 to 21, 2023.
On June 20, 2023, Siyata announced
that Mobile Tornado Group Plc will offer its robust PTT application on the Siyata SD7 Handset.
On June 21, 2023, Siyata announced
its participation with CrisisGo to show its Mission Critical PTT and Emergency Response Management capabilities at NASRO 2023, a National
School Safety Conference in Indianapolis, Indiana on June 28 to 29, 2023.
On June 22, 2023, Siyata announced
new aggregate orders of approximately $600,000 for its Siyata SD7 Handset and VK7 Vehicle Kit in the vertical markets of education, construction,
and logistics.
On June 27, 2023, Siyata announced
the pricing of a new public offering of 50 million common shares at $0.045 per share. The gross proceeds to Siyata before fees, commissions,
and expenses are expected to be $2.25 million, closing on or about June 28, 2023.
On July 6, 2023, Siyata announced
the receipt of its single largest order for SD7 Handsets of $1.4 million, to be delivered in the second half of 2023.
On July 11, 2023, Siyata announced
that it had entered into a securities purchase agreement with certain institutional investors to purchase 51.45 million common shares
at a price of $0.045 per share. The gross proceeds to Siyata before fees, commissions, and expenses are expected to be $2.3 million, closing
on or about July 13, 2023.
On July 12, 2023, Siyata announced
that its 2023 Annual General Meeting of its stockholders will be held on Thursday August 3, 2023 at 1 pm ET.
On July 18, 2023, Siyata announced
it had received orders from two large North American waste management companies for its SD7 Handset and VK7 Vehicle Kit, and for its UV350
In-Vehicle Device.
On July 20, 2023, Siyata announced
its participation in APCO 2023, which is APCO’s International Annual Conference and Expo for public safety communications officials
to be held on August 6 to 9, 2023, in Nashville, Tennessee.
On July 25, 2023, Siyata names
public safety advocate and Business Development executive Doug Clark, formerly from AT&T FirstNet, as its new Assistant Vice President,
Sales and Marketing.
On August 10,
2023, the Company affected a 100-to-1 reverse stock split resulting in 185,393,404 shares converted with rounding into 1,853,955 shares.
On August 10,
2023, the Company announced the appointment of Gary Herman to its Board of Directors.
On August 14,
2023, the Company announced its financial results for the second quarter of 2023.
On August 24,
2023, the Company announced that it regained compliance with Nasdaq minimum bid price requirements.
On August 30,
2023, the Company announced it would present at H. C. Wainwright’s 25th Annual Global Investment Conference.
On September 6,
2023, the Company announced it had received an order from a global provider of healthcare and emergency services for its SD7 PTT Handset
and its VK7 Vehicle Kit.
On September 18,
2023, the Company announced it had received a follow-on order for its SD7 Handset and VK7 Vehicle Kits from a large North American waste
management provider.
On October 2,
2023, the Company announced that Consort Digital from India, a leading provider of mission critical communications, will sell SD7 Handsets
with its MCX ONE Push-to-Talk application.
On October 4,
2023, the Company announced it had received an order for its Hero Series Cellular Boosters from the U.S. Federal Government.
On October 9,
2023, the Company announced its participation in the Virtual Tech Conference Series: Exploring All Corners of the Tech Sector, presented
by Maxim Group LLC on Tuesday, October 10th & Wednesday, October 11th.
On October 24,
2023, the Company announced it is partnering with Synch Communication to provide essential communication solutions for first responders
in Israel. Siyata’s handsets are being equipped with Synch’s application for Push-to-Talk communication, and for command and
control capabilities.
On October 27,
2023, the Company announced pricing of $1.6 million public offering of 2.4 million common shares or pre-funded warrants to purchase common
shares at $0.65 per share. The Company intends to use the net proceeds for working capital and general corporate purposes.
On October 31,
2023, the Company announced the closing of $1.6 million public offering of 1,870,000 common shares and 530,000 pre-funded warrants at
a public price of $0.65 per share and $0.64 per pre-funded warrant.
On November 1,
2023, the Company announced it had received an order for $750,000 for the Company’s Push-to-Talk handsets combined with Synch Communication
command and control solutions, for first responders in Israel.
On November 13,
2024, the Company announced that it would host a call to discuss its third quarter 2023 financial results on Thursday November 16, 2023.
Outlook
Siyata has laid the foundation
for greater distribution with expanded partnerships, key new sale hires, and expanded product offerings into North America. Management
is hopeful that this momentum will continue throughout 2023, in particular, as it leverages its key sales channels, and with its expanded
and refreshed product offerings.
Rugged Handsets | Siyata’s
rugged handsets are targeted to the approximately 47 million enterprise task and public sector workers across North America including
construction, transport and logistics, manufacturing, energy and utility, public safety, and federal government. Prior to launching SD7
Handset in North America, Siyata sold its rugged handsets only in international markets. Siyata expanded its footprint in this product
category with the launch of the SD7 device, in the fourth quarter of 2021 in North America. The SD7 is a next-generation device and Siyata’s
first mission-critical push-to-talk handset. [Source: U.S. Department of Transportation, VDC Research.]
During October of 2023,
Siyata obtained “Stocked Status” with a large U.S. wireless carrier on its SD7 Handset. Previously we were categorized
as “Non Stocked Status”. This is a significant step for a relatively small device supplier like Siyata Mobile, which
very few other device suppliers have achieved. This allows a large U.S. wireless carrier to market and subsidize the SD7 handset
such that customers will be able to acquire the SD7 much more affordably now. For example, a construction company who wanted to
purchase SD7 Handsets when it was non-stocked would have been quoted by a large U.S. wireless carrier at full MSRP, which is $395
USD. Now that it is stocked, the same customer will see a price from a large U.S. wireless carrier such as $0.99 for the handset, or
a blended monthly payment for the handset and the PTT service.
Cellular Boosters |
The pandemic has helped fuel strong demand for Siyata’s boosters in 2020 and 2021. This momentum slowed in 2022 and 2023 but we
anticipate consistent sales in 2024.
Summary Of Quarterly Results
The following unaudited table
sets out selected financial information for the Company on a consolidated basis for the last eight most recently completed quarters based
on a post 100-1 common shares reverse stock split that occurred on August 10, 2023.
| | |
September 30, | | |
June 30, | | |
Mar 31, | | |
Dec 31, | | |
Sep 30, | | |
Jun 30, | | |
Mar 31, | | |
Dec 31, | |
| | |
2023 | | |
2023 | | |
2023 | | |
2022 | | |
2022 | | |
2022 | | |
2022 | | |
2021 | |
| | |
| | |
(restated) | | |
| | |
| | |
| | |
(restated) | | |
| |
| Net loss for the period | |
$ | (1,855,173 | ) | |
$ | (2,333,617 | ) | |
$ | (4,877,999 | ) | |
$ | (6,595,456 | ) | |
$ | (520,798 | ) | |
$ | (4,304,088 | ) | |
$ | (3,878,909 | ) | |
$ | (4,979,661 | ) |
| Comprehensive loss for the period | |
$ | (1,855,173 | ) | |
$ | (2,333,617 | ) | |
$ | (4,877,999 | ) | |
$ | (6,589,329 | ) | |
$ | (390,838 | ) | |
$ | (4,278,102 | ) | |
$ | (3,903,377 | ) | |
$ | (4,833,795 | ) |
| Loss per share | |
$ | (1.04 | ) | |
$ | (3.02 | ) | |
$ | (8.25 | ) | |
$ | (31.44 | ) | |
$ | (3.19 | ) | |
$ | (29.41 | ) | |
$ | (29.89 | ) | |
$ | (98.92 | ) |
RESULTS OF OPERATIONS FOR THE THREE MONTHS
ENDED SEPTEMBER 30, 2023
The following is an analysis
of the Company’s operating results for the three months ended September 30, 2023, and includes a comparison against the three months
ended September 30, 2022.
Operations:
Revenues for the three
months ended September 30, 2023, were $1,842,390 compared to $2,567,885 for the three months ended September 30, 2022. This decrease of
$725,495 (-28%) is due mainly to the decrease in the sale of rugged devices for the period of approximately $787,000 offset by a $61,000
increase (+ 9%) in sales of boosters in the same period.
Cost of sales for the
three months ended September 30, 2023, were $1,352,293 compared to $1,711,782 for the three months ended September 30, 2022. The gross
margin dollars for the three months ended September 30, 2023 $490,097 (26.6% of revenues) and September 30, 2022 was $856,1030,097 (26.6%
of sales) and $856,103 (33.3% of sales), respectively, a negative variance in gross margin by $366,006 (6.7% decrease in gross margin
percentage). This relates to the decrease in sales of our new suite of rugged and in-vehicle cellular devices at higher margins compared
to the margins sold on the legacy rugged devices.
Amortization and depreciation
costs for the three months ended September 30, 2023, were $453,500 compared to $351,310 for the three months ended September 30, 2022,
respectively, a negative variance of $102,190. This negative variance is due to the increased intangible asset amortization that began
for the VK7 in 2023 and an increase in the amortization of the SD7.
Development expenses
for the three months ended September 30, 2023, were $87,652 compared to $35,567 for the three months ended September 30, 2022, respectively.
This negative variance of $51,085 is due to the increase of the development costs incurred on the company’s rugged device development
program that did not meet the criteria for capitalization was higher than in 2022 due to more focused development activities on capitalizable
products.
Selling and marketing costs
for the three months ended September 30, 2023, were $1,423,760 compared to $1,225,475 for the three months ended September 30, 2022 respectively.
This negative variance of $198,285 is due mainly to the increase in promotional costs of $225,000 to promote our new product line and
to build brand awareness in the marketplace, increased travel expense of $3,000 offset by a decrease in our U.S. sales team headcount
of $29,715.
General and administrative
costs for the three months ended September 30, 2023, were $1,318,284 compared to $144,243,041 for the three months ended September
30, 2022, respectively. This negative variance of $198,174,041 (12%) relates mainly to the increase in general and administrative salaries
of $140,000, the $45,000 increase in consulting and directors’ fees of $45,000, the increase in travel expenses of $7,000, in office
and general of $36,000, a $15,000 increase in regulatory and filing fees, and an increase in shareholder relations costs of $13,000, offset
by a decrease in professional fees of $112,000.
Inventory income from water
damage for the three months ended September 30, 2023, was $405,364 compared to $NIL for the three months ended September 30, 2022,
respectively. This positive variance relates to previously written off inventory from the December 2022 flood that was determined to be
salvageable and reinstated into income for the period.
Bad debts for the three
months ended September 30, 2023, were $16,512 compared to $NIL for the three months ended September 30, 2022, respectively.
Insurance proceeds from
the water damage of $380,077 was received during the three month period ended September 30, 2023 and is included as income in the
period received as required by IFRS.
Share-based compensation
costs for the three months ended September 30, 2023, were $202,072 compared to $539.660 for the three months ended September 30, 2022,
respectively. The decrease in share-based compensation of $337,588 relates to the valuation of stock options vested during the prior
year period due to the issuance in Q1 2022 of 600,000 RSU’s to directors and officers that vested immediately.
Finance expenses for
the three months ended September 30, 2023, were $33,684 compared to $82,720 for the three months ended September 30, 2022, respectively.
This positive variance of $49,036 consists of negative variance in the interest expense accrued for the period.
Foreign exchange loss
(income) for the three months ended September 30, 2023, was income of $109,895 compared to an expense of $180,367 for the three
months ended September 30, 2022, respectively This variance resulted from foreign currency fluctuations in the period.
Change in fair value of
the convertible promissory note for the three months ended September 30, 2023, were $NIL compared to $474,514 for the three months
ended September 30, 2022, respectively. In 2022, this resulted from both the repricing of the convertible feature of the promissory note
when other capital raises reduced the convertible price and due to the full repayment of the promissory note via the issuance of share
capital whose formula in the agreement between the parties required between 80%-90% of the lowest 5 day VWAP in a thirty day period which
resulted in a significant fair value loss in the year.
Change in fair value of
the warrant liability for the three months ended September 30, 2023, was a gain of $294,858 compared to a gain of $12,680,603 for
the three months ended September 30, 2022, respectively. The three months ended September 2023 amount relates only to the revaluation
of the 100,000 warrants issued January 2022 in both periods.
Net loss for the period
The Company experienced a
net loss for the three months ended September 30, 2023, were $1,855,173 compared to a net loss of $527,948 for the three months ended
September 30, 2022, respectively, a negative variance of, ($1,327,225). This negative variance was due mainly to a decrease in the fair
value gain on financial derivatives of $1,911,231, a decrease in gross margin of $366,006, an increase in amortization and depreciation
of $102,190, increase in development expenses of $51,085, an increase in selling and marketing expenses of $198,285, an increase in general
and administrative expenses of $144,24, increase in bad debts of $16,512, offset by a decrease in share-based payments of $337.588, decrease
in development expense of $51,085, decrease in foreign exchange expense of $290,262, inventory income from water damage of $405,364, insurance
proceeds received in the period form the flood of $380,077, a decrease in finance expenses of $49,036, an increase in amortization of
$118,080.
Loss and comprehensive
loss for the period
As a result of the activities
discussed above, the Company experienced a comprehensive loss for the three months ended September 30, 2023, were $1,855,173 versus $390,838
for the three months ended September 30, 2022, respectively, representing a negative variance of $1,464,335.
Adjusted EBITDA
For the three months ended
September 30, 2023, the adjusted EBITDA is negative ($1,570,670) versus negative ($1,579,980) in the prior year period, a positive variance
of $9,310. Adjusted EBITDA is defined as the net operating loss excluding depreciation and amortization, intangible impairment, goodwill
impairment and share-based compensation expense. It is a non-IFRS calculation that should be compared to our audited financial information
included elsewhere in this Annual Report.
RESULTS OF OPERATIONS FOR THE NINE MONTHS ENDED
SEPTEMBER 30, 2023
The following is an analysis
of the Company’s operating results for the nine months ended September 30, 2023, and includes a comparison against the nine months
ended September 30, 2022.
Operations:
Revenues for the nine
months ended September 30, 2023, were $6,355,744 compared to $4,370,387 for the nine months ended September 30, 2022. This increase of
$1,985,357 (45%) is due mainly to the increase in the sale of rugged devices as a result of the launching of the SD7 in 2022 of $2,068,000
or 83% increase, offset by a $82,000 decrease in sales of boosters in the same period.
Cost of sales for the
nine months ended September 30, 2023, were $4,564,640 compared to $3,150,560 for the nine months ended September 30, 2022. The gross margin
dollars for the nine months ended September 30, 2023 and September 30, 2022 was $1,791,104 (28.2% of sales) and $1,219,827 (27.9% of sales),
respectively, a positive variance in gross margin by $571,277 (0.3% increase in gross margin percentage). This relates to the increase
in sales of our new suite of rugged and in-vehicle cellular devices at higher margins compared to the margins sold on the legacy rugged
devices.
Amortization and depreciation
costs for the nine months ended September 30, 2023, were $1,308,639 compared to $811,234 for the nine months ended September 30, 2022,
respectively, a negative variance of $497,405. This negative variance is due to the increased intangible asset amortization that began
for the VK7 in 2023, the increase in amortization of the SD7 in 2023, due to the 2022 amortization only beginning in Q2 2022.
Development expenses
for the nine months ended September 30, 2023, were $173,102 compared to $299,937 for the nine months ended September 30, 2022, respectively.
This positive variance of $126,835 is due to the decrease of the development costs incurred on the company’s rugged device development
program that did not meet the criteria for capitalization was lower in 2022 due to more focused development activities on capitalizable
products.
Selling and marketing costs
for the nine months ended September 30, 2023, were $3,464,928 compared to $3,434,201 for the nine months ended September 30, 2022 respectively.
This negative variance of $30,727 is due mainly to both an increase in our U.S. sales team headcount of $26,000 and increased travel expense
of $18,000 and a decrease in promotional costs of $13,000.
General and administrative
costs for the nine months ended September 30, 2023, were $4,414,096 compared to $4,684,702 for the nine months ended September 30,
2022, respectively. This positive variance of $270,606 (6%) relates mainly to the decrease consulting and director’s fees of $167,000
due to no bonuses paid in 2023, decreases in insurance included in office and general of $388,000, decrease in shareholder relations costs
of $316,000, the decrease of $44,000 in travel costs, offset by an increase in professional services costs of $273,000 related to both
the increase in fees for U.S. securities attorney and the additional costs for the annual PCAOB audit, increase of $287,000 in salaries
expense related to additional employees, in 2023, an $34,000 increase in regulatory and filing fees.
Inventory Impairment costs
for the nine months ended September 30, 2023, were $NIL compared to $303,316 for the nine months ended September 30, 2022, respectively.
Inventory income from water
damage for the nine months ended September 30, 2023, was $405,364 compared to $NIL for the nine months ended September 30, 2022, respectively.
This positive variance relates to previously written off inventory from the December 2022 flood that was determined in the period to be
salvageable and reinstated into income for the period.
Bad debts for the
nine months ended September 30, 2023, were $26,660 compared to $63,285 for the nine months ended September 30, 2022, respectively.
Insurance proceeds from
the water damage of $380,077 was received during the three month period ended September 30, 2023 and is included as income in the
period received as required by IFRS.
Share-based compensation
costs for the nine months ended September 30, 2023, were $773,605 compared to $2,478,695 for the nine months ended September 30, 2022,
respectively. The decrease in share-based compensation relates to the valuation of stock options vested during the prior year period due
to the issuance in Q1 2022 of 6,000 RSU’s to directors and officers that vested immediately and the issuance of other stock options
in 2022.
Finance expenses for
the nine months ended September 30, 2023, were $109,033 compared to $128,446 for the nine months ended September 30, 2022, respectively.
This positive variance of $19,413 consists of negative variance in interest on the factoring of the North American receivables of $19,622.
Foreign exchange loss for
the nine months ended September 30, 2023, was a gain of $188,494 compared to a loss of $199,535 for the nine months ended September 30,
2022, respectively This variance resulted from foreign currency fluctuations in the period.
Transaction costs for
the nine months ended September 30, 2023, were $NIL compared to $965,247 for the nine months ended September 30, 2022, respectively. In
2022, transaction cost related to share issuance costs incurred on the two equity raises undertaken in the year, which were allocated
to the warrant liability and expensed when incurred.
Change in fair value of
the convertible promissory note for the nine months ended September 30, 2023, were $NIL compared to $3,725,362 for the nine months
ended September 30, 2022, respectively. In 2022, this resulted from both the repricing of the convertible feature of the promissory note
when other capital raises reduced the convertible price and due to the full repayment of the promissory note via the issuance of share
capital whose formula in the agreement between the parties required between 80%-90% of the lowest 5 day VWAP in a thirty day period which
resulted in a significant fair value loss in the year.
Change in fair
value of the opening warrant liability for the nine months ended September 30, 2023, was $NIL compared to a gain of $962.350 for the
nine months ended September 30, 2022, respectively. The nine months ended 2022 relates to the adjustment of fair value of the opening
balance of a warrant liability due to a capital raise.
Change in fair value of
the warrant liability for the nine months ended September 30, 2023, was a loss of $1,561,765 compared to a gain of $8,125,538 for
the nine months ended September 30, 2022, respectively. The nine months ended 2023 amount relates to the inducement warrant fair value
loss of $2,875,580 plus the transaction costs for the warrant exercise and re-issuance of $309,000 included in change in fair value plus
the actual change in fair value gain for the period of $9,687,303. As well, resulting of certain warrants becoming cashless, their was
a significant reduction in the number of warrants outstanding that required fair value valuation as of September 30, 2023.
Net loss for the period
The Company experienced a net loss for the nine months ended September
30, 2023, were $9,066,789 compared to a net loss of $8,710,945 for the nine months ended September 30, 2022 respectively, a negative variance
of, $355,844. This variance was due mainly to an increase in the fair value loss on financial derivatives of $4,999,591, and an increase
in amortization of $497,405, an increase in selling expenses of $30,727, a decrease in foreign exchange of $97,767, a decrease in bad
debt expense by $53,137 and a decrease in transaction costs of $965,247. Offset by a decrease in finance expenses of $19,413, a decrease
in inventory impairment of $303,316, decrease in development expense of $126,835, increase in gross margin of $571,277, a decrease in
G&A expenses of $270,606, decrease in foreign exchange expense of $388,029, inventory income from water damage of $405,364, insurance
proceeds received in the period form the flood of $380,077, and a decrease in share-based payments of $1,705,090.
Loss and comprehensive
loss for the period
As a result of the activities
discussed above, the Company experienced a comprehensive loss for the nine months ended September 30, 2023, were $9,066,789 versus $8,572,317
for the nine months ended September 30, 2022, respectively, representing a negative variance of $494,472.
Adjusted EBITDA
For the nine months ended
September 30, 2023, the adjusted EBITDA is negative ($5,502,241) versus negative ($7,565,614) in the prior year period, a positive variance
of $2,063,373. Adjusted EBITDA is defined as the net operating loss excluding depreciation and amortization, intangible impairment, goodwill
impairment and share-based compensation expense. It is a non-IFRS calculation that should be compared to our audited financial information
included elsewhere in this Annual Report.
| B. |
Liquidity and Capital Resources |
The Company’s objective
in managing liquidity risk is to maintain sufficient liquidity in order to meet operational and investing requirements at any point in
time. The Company has historically financed its operations primarily through a combination of demand loans and the sale of share capital
by way of private placements.
As at September 30, 2023,
the Company had a cash balance $366,155 (Dec 31, 2022-$1,913,742). The Company had an accumulated deficit of $86,885,452 (Dec 31, 2022-$77,818,663)
and working capital of $3,753,506 (December 31, 2022-$1,643,434).
Net cash flows related to operating activities used in the nine month
period ended September 30, 2023 and nine months ended September 30, 2022 were negative ($6,903,288) and negative ($13,280,167), respectively.
The decrease in cash used for operating activities of $6,376,879 was primarily due to the decrease in the change in non-cash working capital
items of $3,672,686, and a decrease of net loss including addbacks of $2,704,193.
The non-cash working capital
variances consisting of increase in trade and other receivables of $304,529, decrease in prepaids of $335,048, decrease in inventory of
$4,499,506, an increase in advances to suppliers of $747,126, an increase in accounts payable and accrued liabilities of $39,3386 and
a decrease in deferred revenue of $149,600.
Net cash flows used in investing
activities in nine month period ended September 30, 2023 and nine months ended September 30, 2022 were negative ($2,055,091) and negative
($2,444,013), respectively. A positive variance of $388,922. This positive variance relates primarily to the acquisition in q1 2022 of
ClearRF of $155,014 that did not recur in 2023, offset by an increase in intangible asset additions of $244,485, and the increase in fixed
asset additions of $8,422.
Net cash flows used in financing
activities in the nine month period ended September 30, 2023 and nine months ended September 30, 2022 were $7,409,392 and $15,105,394,
respectively. A negative variance of $7,696,002 relates to increase in 2022 net proceeds of share capital raises after share issuance
costs of $11,109,563, a $76,998 increase in the lease payments and an increase in cash transaction costs of $1,068,121, offset by both
the $4,000,000 reduction in the convertible promissory note, and a $558,680 increase in bank loan.
The future success of the
Company is dependent on the continued success of its vehicle mounted communications products, its mobile rugged phones and its booster
products together with the ability to finance the necessary working capital, at agreeable terms, to support the growth of the business.
The Company’s unaudited
condensed interim consolidated financial statements have been prepared in accordance with IFRS under the assumption that the Company
will be able to realize its assets and discharge its liabilities in the normal course of business rather than a process of forced liquidation.
The consolidated audited financial statements do not include any adjustments relating to the recoverability and classification of recorded
asset amounts and classification of liabilities that might be necessary should the Company be unable to continue in existence.
SHARE CAPITAL
| (a) | Authorized
Unlimited number of Common Shares without par value |
Issued and Outstanding:
As at September 30, 2023, the
Company had 1,853,951 common shares issued and outstanding (December 31, 2022 – 448,686) after taking into account the
100-to-1 reverse stock split that took place on August 10, 2023.
As of the date of issuance of these financial statements total outstanding
common shares is 3,902,168 (post 100-to-1 reverse split that was effective as of August 10, 2023), due to the issuance of 1,870,000 shares
from a capital raise on October 31, 2023 and the exercise of 180,000 prefunded warrants also issued on October 31, 2023 that were exercised
into 177,313 additional common shares on November 1, 2023, as well as the conversion of 900 RSU’s into 900 common shares on October
3, 2023.
Transactions for the nine months ended September 30,
2023 are as follows:
| |
|
● |
The Company issued 180,429 common shares on the
exercise of various warrants for gross proceeds of $3,608,571. Additionally, the Company issued 180,429 warrants to replace those warrants
that were exercised. As an incentive to investors to exercise the 180,429 warrants, the Company issued cashless warrants to those investors
that were exercisable as of March 30, 2023. As well, any holders of the $23.00 warrants that had a ratchet provision also became cashless.
As a result, 210,319 common shares were issued for cashless warrants in Q2 2023.
On June 28, 2023 the Company issued 500,000 at
$4.50 per share for gross proceeds of $2,250,000 before offering expenses and other expenses included in share issuance costs.
On July 13, 2023, the Company issued 514,500
shares at $4.50 per share for gross proceeds of $2,315,250 before offering expenses and other expenses included in share issuance costs. |
Subsequent to September 30, 2023 the Company
issued 1,870,000 common shares at $0.65 per share and also issued 530,000 prefunded warrants with an exercise price of $0.01 and a purchase
price of $0.64 per warrant for total gross proceeds of $1,554,700 before offering expenses and other expenses included in share issuance
costs.
SHARE CAPITAL (cont’d)
| |
(b) |
Common share transactions (cont’d) |
Transactions for the nine months
ended September 30, 2022 are as follows:
| |
● |
On January 11, 2022, the Company completed an underwritten public offering in the United States, raising a total of $20,013,043 in gross proceeds. The Company allocated the gross proceeds firstly to the warrant liabilities, with the remainder to the common shares. Direct costs have been allocated based on the percentage allocation of the proceeds. The underwritten public offering resulted in the sale to the public of 72,157 Units at $230.00 per Unit, with each Unit being comprised of one common share and one warrant (the “Unit Warrants”) exercisable at $230.00 per share. The Unit warrants are exercisable immediately and have a term of 5 years. Gross proceeds of $10,936,974 were allocated to the common shares, and $5,395,878 to the unit warrants liability. |
In addition, the
Company issued 14,800 pre-funded units (“Pre-Funded Units”) at $229.00 per Pre-Funded Unit. Each Pre-Funded Unit is comprised
of a one-pre-funded warrant (a “Pre-Funded Warrant”) to purchase one common share, and one warrant to purchase one common
share. The Pre-Funded Warrant allows the holder to acquire one common share of the Company at an exercise price of $1.00 per common share,
and a warrant to purchase a common share at an exercise price of $230.00 per share. The warrants are exercisable immediately and have
a term of 5 years. Each Pre-Funded Warrant is exercisable immediately and is exercisable until all Pre-Funded Warrants are exercised.
Proceeds of $2,560,400 were allocated to the pre-funded warrants and $1,106,747 to the unit warrants in the warrant liability.
The Company determined that the pre-funded
warrants within the Pre-funded Units are common shares in substance, as they require only a minimal exercise price of $1.00. In addition,
the underwriting agreement includes both the Units and Pe-funded Units and were negotiated together in the equity raise. Given that the
purpose of the Prefunded Unit is in substance the same as that of the Unit (i.e., resulting in the ownership of both common shares and
common share warrants) and that the terms of the warrants in both the Units and Prefunded Units are the same (i.e., the obligations of
the Company for the units are the same), the Company determined that the Units and Pre-funded Units are closely related and should be
combined into one unit of account for the purposes of allocating proceeds.
Therefore, the
proceeds from the sale of the Units and Pre-funded Units are combined and allocated among the common shares, pre-funded warrants, and
the common share warrants using the residual method, with the warrant liability being initially recognized at fair value as of the registration
date and the residual amount being allocated to the common shares (i.e., equity).
| (b) | Common
share transactions (cont’d) |
The Company concurrently sold an additional
13,043 warrants to purchase 13,043 common shares exercisable at $230.00 per share (the “Option Warrants”) pursuant to an over-allotment
option exercised by the underwriter. The exercise price of the warrants issued in connection with the exercise of the over-allotment option
was $0.97 per warrant. Each Option Warrant is exercisable immediately and has a term of five years from the issue date. Proceeds of $975,393
were allocated to the option warrant liability. As the fair value of the warrant liability exceeded the proceeds received on the warrants
of $13,043, a fair value loss of $962,350 was recognized in the statement of profit and loss as a fair value change in the opening warrant
liability.
The fair value of the common shares
and pre-funded units was determined by reference to the market price on the day of the offering, which was $173.00 per share. The Unit
Warrants, Warrants, and Option Warrants were valued using the Black-Scholes model using the following assumptions: initial stock price
$173.00, strike rate $230.00, dividend yield 0%, term 5 years, volatility 60.0% and risk-free rate 0.50%.
The Company also issued warrants to
the placement agents to purchase 4,348 common shares at an exercise price of $253.00 per share (the “Placement Agent Warrants”),
which are exercisable 180 days from January 11, 2022, with a term of five years. The fair value of the Placement Agent Warrants was determined
to be $307,189 using the Black-Scholes model with the following assumptions: initial stock price $173.00, strike rate $253.00, dividend
yield 0%, term 5 years, volatility 60.0% and risk-free rate 0.50%.
The Company assessed that the warrants
issued under the public offering, excluding the Placement Agent Warrants did not meet the “fixed for fixed” test and are therefore
reported as liabilities at fair value through profit and loss, and revalued at the end of each period. The Placement Agent Warrants were
assessed under IFRS 2 Share Based Payments, as equity-settled share-based payments and have been recorded in equity.
The direct costs related to the issuance
of the common shares and warrants issued in the January 2022 underwritten public offering were $2,016,895, including the value of the
Placement Agent Warrants. Direct costs of $965,248 were allocated to the warrant liability and expensed immediately in profit and loss.
During the period, 14,800 Pre-Funded Warrants were exercised for gross proceeds of $14,800, converting into 14,800 common shares that
were fully issued.
On March 31, 2022, as part of the ClearRF acquisition (Note 3), the Company issued 1,390 shares to the vendor with a fair value of $190,094.
The Company issued 1,550 common shares, with a fair value of $170,500 ($110.00 per share) to consultants as part of their compensation for services rendered.
The Company issued 8,542 common shares with a fair value of $1,002,461 as combined payments of the monthly principal repayment of $400,000 for the months of May and June 2022 payable in shares per the terms of the promissory note.
| (b) | Common
share transactions (cont’d) |
The Company issued 300 shares with a fair value of $22,200
($74.00 per share) resulting from a supplier converting RSU’s into common shares. The Company issued 600 shares, with a
fair value of $61,800 ($103.00 per share), to a supplier as partial compensation according to their contractual agreements.
The Company issued 4,049 shares, with a fair value of $441,296
($109.00 per share),as payment for the monthly principal repayment of $400,000 on the promissory note.
The Company issued 6.849 shares, with a fair value of $520,548
($76.00 per share), as payment for the monthly principal repayment of $400,000 on the promissory note.
The Company issued 600 shares, with a fair value of $61,800
($103.00 per share), to a supplier as partial compensation according to their contractual agreements.
Stock Options:
The Company has a shareholder-approved
“rolling” stock option plan (the “Plan”) in compliance with Nasdaq policies. Under the Plan the maximum number
of shares reserved for issuance may not exceed 15% of the total number of issued and outstanding Common Shares on a fully diluted basis
at the time of granting. The exercise price of each stock option shall not be less than the market price of the Company’s stock
at the date of grant, less a discount of up to 25%. Options can have a maximum term of ten years and typically terminate 90 days following
the termination of the optionee’s employment or engagement, except in the case of retirement or death. Vesting of options is at
the discretion of the Board of Directors at the time the options are granted.
A summary of the Company’s
stock option activity at September 30, 2023 and the date of the MD&A are as follows:
| | |
| | |
Weighted | |
| | |
Number of | | |
Average | |
| | |
Stock Options | | |
Exercise Price | |
| Outstanding stock options, December 31, 2021 | |
| 4,146 | | |
$ | 1,388.00 | |
| Granted | |
| 11,450 | | |
| 115.00 | |
| Expired/Cancelled | |
| (534 | ) | |
| (3,090.00 | ) |
| Outstanding stock options, December 31, 2022 | |
| 15,062 | | |
$ | 352.91 | |
| Granted | |
| - | | |
| - | |
| Expired/Cancelled | |
| - | | |
| - | |
| Outstanding stock options, September 30, 2023 | |
| 15,062 | | |
$ | 352.91 | |
Transactions for the nine months
ended September 30, 2022 are as follows:
On January 1, 2022, the Company granted
200 stock options at $400.00 per share that vest in 8 equal quarterly periods with the first vesting occurring on the grant date. The
fair value on the date of the grant was $54,480 ($272.40 per option).
On April 13, 2022, the Company granted
7,950 stock options to executives and employees at an exercise price of $110.00 per share. These options vest quarterly over three years
period with the first vesting taking place at the date of the grant. The fair value of these options on the date of the grant is $678,520
($85.35 per share).
As of September 30, 2023 stock options
outstanding are as follows:
| Grant Date | |
Number of options outstanding | | |
Number of options exercisable | | |
Weighted Average Exercise Price | | |
Expiry date | |
Remaining contractual
life (years) | |
| 24-Dec-18 | |
| 129 | | |
| 129 | | |
| 5,400.00 | | |
24-Dec-23 | |
| 0.23 | |
| 15-Jan-19 | |
| 8 | | |
| 8 | | |
| 5,400.00 | | |
15-Jan-24 | |
| 0.29 | |
| 21-Mar-19 | |
| 123 | | |
| 123 | | |
| 5,900.00 | | |
21-Mar-24 | |
| 0.47 | |
| 1-Jan-20 | |
| 21 | | |
| 21 | | |
| 5,400.00 | | |
1-Jan-24 | |
| 0.25 | |
| 15-Nov-20 | |
| 950 | | |
| 950 | | |
| 600.00 | | |
15-Nov-30 | |
| 7.13 | |
| 15-Nov-20 | |
| 1,615 | | |
| 1,615 | | |
| 600.00 | | |
15-Nov-25 | |
| 2.13 | |
| 2-Jan-21 | |
| 570 | | |
| 570 | | |
| 1,150.00 | | |
2-Jan-26 | |
| 2.26 | |
| 2-Jan-21 | |
| 50 | | |
| 50 | | |
| 1,150.00 | | |
2-Jan-31 | |
| 7.26 | |
| 18-Jan-21 | |
| 145 | | |
| 145 | | |
| 1,150.00 | | |
18-Jan-26 | |
| 2.30 | |
| 1-Jan-22 | |
| 200 | | |
| 200 | | |
| 400.00 | | |
29-Oct-26 | |
| 3.08 | |
| 13-Apr-22 | |
| 7,950 | | |
| 3,975 | | |
| 110.00 | | |
13-Apr-27 | |
| 3.54 | |
| 12-Jul-22 | |
| 3,300 | | |
| 1,375 | | |
| 110.00 | | |
12-Jul-25 | |
| 1.78 | |
| Total | |
| 15,061 | | |
| 9,161 | | |
$ | 352.91 | | |
| |
| 3.12 | |
Restricted Share Units
(“RSUs”)
The Company approved on February 14,
2022, an amended and restated equity incentive plan which permits the issuance of restricted share units in addition to stock options.
A summary of the Company’s restricted
share unit activity during the year ended December 31, 2022 and for the interim period of September 30, 2023 and the date of this MD&A
are as follows:
| | |
Number of | | |
Weighted Average | |
| | |
RSU's | | |
Issue Price | |
| Outstanding RSU, December 31, 2021 | |
| 0 | | |
$ | - | |
| Granted | |
| 31,950 | | |
| 105.08 | |
| Exercised | |
| (300 | ) | |
| (103.00 | ) |
| Outstanding RSU, December 31, 2022 | |
| 31,650 | | |
$ | 105.02 | |
| Granted | |
| - | | |
| - | |
| Exercised | |
| - | | |
| - | |
| Outstanding RSU, September 30, 2023 | |
| 31,650 | | |
$ | 105.02 | |
As at September 30, 2023 restricted
share units outstanding are as follows:
| Grant Date | |
Number of
RSU’s
outstanding | | |
Number of
RSU’s
exercisable | | |
Weighted
Average Issue
Price | |
| 9-Mar-22 | |
| 22,500 | | |
| 15,000 | | |
| 103.00 | |
| 13-Apr-22 | |
| 8,250 | | |
| 5,213 | | |
| 110.00 | |
| 12-Jul-22 | |
| 900 | | |
| 375 | | |
| 110.00 | |
| Outstanding RSU, September 30, 2023 | |
| 31,650 | | |
| 20,588 | | |
$ | 105.02 | |
Transactions for the nine months
ended September 30, 2022, are as follows:
| |
● |
On March 9, 2022, the Company granted 4,500 RSU’s to Directors that vest immediately. On the date of granting, the fair value and stock price was $103.00/share. |
| |
● |
On March 9, 2022, the Company granted 18,000 RSU’s to a Director that vest quarterly over 12 periods with the first vesting of 1,500 RSU’s occurring on the date of the granted and another 1,500 vest every three months until all of the granted RSU’s have vested. On the date of granting, the fair value and the stock price was $103.00/share. |
| |
|
|
| |
● |
On April 13, 2022, the Company granted 2,400 RSU’s to consultants that vest immediately. On the date of granting, the fair value and the stock price was $110.00/share. |
| |
|
|
| |
● |
On April 13, 2022, the Company granted 5,850 RSU’s to employees of the Company that vest quarterly over 12 periods with the first vesting of 488 RSU’s occurring on the date of the granted and another 488 RSU’s vest every three months until all of the granted RSU’s have vested. On the date of granting, the fair value and the stock price was $110.00/share. |
Transactions subsequent to the
period end where 900 RSU’s were converted into 900 common shares on October 3, 2023.
As at the date of this
MD&A, restricted share units outstanding are as follows:
| Grant Date | |
Number of
RSU’s
outstanding | | |
Number of
RSU’s
exercisable | | |
Weighted
Average Issue
Price | |
| 9-Mar-22 | |
| 21,600 | | |
| 12,600 | | |
| 103.00 | |
| 13-Apr-22 | |
| 8,250 | | |
| 6,188 | | |
| 110.00 | |
| 12-Jul-22 | |
| 900 | | |
| 375 | | |
| 110.00 | |
| Total | |
| 30,750 | | |
| 19,163 | | |
$ | 105.08 | |
Agent’s options
A summary of the Company’s
agents’ options activity for the nine month period ended September 30, 2023 is as follows:
| | |
| | |
Weighted average | |
| | |
Number of | | |
exercise | |
| | |
options | | |
price | |
| Outstanding
agent options, December 31, 2021 | |
| 4,459 | | |
$ | 751.00 | |
| Granted | |
| 4,873 | | |
| 251.00 | |
| Expired | |
| (17 | ) | |
| 2,049.00 | |
| Outstanding agent options,
December 31, 2022 | |
| 9,315 | | |
$ | 487.06 | |
| Granted | |
| - | | |
| - | |
| Expired | |
| - | | |
| - | |
| Outstanding agent options,
September 30, 2023 | |
| 9,315 | | |
$ | 487.06 | |
As at September 30, 2023,
agent’s options outstanding and exercisable are as follows:
| Grant Date | |
Number of options outstanding | | |
Number of options exercisable | | |
Weighted Average Exercise Price | | |
Expiry date | |
Remaining contractual life (years) | |
| | |
| | |
| | |
| | |
| |
| |
| 29-Sep-20 | |
| 1,135 | | |
| 1,135 | | |
$ | 660.00 | | |
28-Sep-25 | |
| 125.83 | |
| 29-Sep-20 | |
| 2,660 | | |
| 2,660 | | |
$ | 685.00 | | |
28-Sep-25 | |
| 125.83 | |
| 31-Dec-20 | |
| 647 | | |
| 647 | | |
$ | 1,150.00 | | |
30-Jun-24 | |
| 124.58 | |
| 11-Jan-22 | |
| 4,348 | | |
| 4,348 | | |
$ | 253.00 | | |
11-Jan-27 | |
| 127.12 | |
| 1-Apr-22 | |
| 525 | | |
| 525 | | |
$ | 230.00 | | |
8-Mar-27 | |
| 127.27 | |
| Total | |
| 9,315 | | |
| 9,315 | | |
| 487.06 | | |
| |
| 2.59 | |
Transactions for the nine months
ended September 30, 2022 are as follows:
The Company issued warrants to the placement
agents to purchase 4,348 common shares at an exercise price of $253.00 per share (the “Placement Agent Warrants”), which are
exercisable 180 days from January 11, 2022, with a term of five years. The fair value of the Placement Agent Warrants was determined to
be $307,189 using the Black-Scholes model with the following assumptions: initial stock price $173.00, strike rate $253.00, dividend yield
0%, term 5 years, volatility 60.0% and risk-free rate 0.50%. The Company also issued 525 agent’s options with a fair value of $61,950
with an exercise price of $230.00.
Agent’s options (cont’d)
Subsequent to the period end, the Company issued
120,000 agent’s options to the underwriter as part of the registered offering that took place on October 31, 2023.
Agent’s options outstanding as of the
date of this MD&A are as follows:
| Grant Date | |
Number of options outstanding | | |
Number of options exercisable | | |
Weighted Average Exercise Price | | |
Expiry date | |
Remaining contractual life (years) | |
| | |
| | |
| | |
| | |
| |
| |
| 29-Sep-20 | |
| 1,135 | | |
| 1,135 | | |
$ | 660.00 | | |
28-Sep-25 | |
| 1.87 | |
| 29-Sep-20 | |
| 2,660 | | |
| 2,660 | | |
$ | 685.00 | | |
28-Sep-25 | |
| 1.87 | |
| 31-Dec-20 | |
| 647 | | |
| 647 | | |
$ | 1,150.00 | | |
30-Jun-24 | |
| 0.63 | |
| 11-Jan-22 | |
| 4,348 | | |
| 4,348 | | |
$ | 253.00 | | |
11-Jan-27 | |
| 3.16 | |
| 1-Apr-22 | |
| 525 | | |
| 525 | | |
$ | 230.00 | | |
8-Mar-27 | |
| 3.32 | |
| 31-Oct-23 | |
| 120,000 | | |
| 0 | | |
$ | 0.72 | | |
31-Oct-28 | |
| 4.97 | |
| Total | |
| 129,315 | | |
| 9,315 | | |
| 35.75 | | |
| |
| 4.79 | |
Share Purchase Warrants:
A summary of the Company’s warrant activity for the period ended
at September 30, 2023 and date of this MD&A are as follows:
| | |
Number of Warrants | | |
Weighted average exercise price | |
| Outstanding, December 31, 2021 | |
| 51,213 | | |
$ | 989.00 | |
| Granted | |
| 291,391 | | |
$ | 94.00 | |
| Expired | |
| (1,284 | ) | |
$ | 3,347.00 | |
| Outstanding, December 31, 2022 | |
| 341,320 | | |
$ | 176.00 | |
| Granted | |
| 180,429 | | |
$ | 20.00 | |
| Exercised | |
| (390,748 | ) | |
$ | 9.00 | |
| Outstanding, September 30, 2023 | |
| 131,001 | | |
$ | 383.62 | |
As of September 30, 2023 and date of this MD&A, share purchase
warrants outstanding and exercisable are as follows:
| Grant Date | |
Number of Warrants outstanding and exercisable | | |
Exercise Price | | |
Expiry date |
| 29-Sep-20 | |
| 18,056 | | |
| 685.00 | | |
28-Sep-25 |
| 31-Dec-20 | |
| 12,945 | | |
| 1,150.00 | | |
30-Jun-24 |
| 11-Jan-22 | |
| 100,000 | | |
| 230.00 | | |
10-Jan-27 |
| Total | |
| 131,001 | | |
$ | 383.62 | | |
|
Transactions for the nine
months ended September 30, 2023 are as follows:
| |
● |
180,429 warrants were exercised on January 12, 2023. The Company issued 180,429 warrants to replace those warrants that were exercised. As an incentive to investors to exercise the 180,429 warrants, the Company issued cashless warrants to those investors that were exercisable as of March 31, 2023. As well, any holders of the $23.00 warrants that had a ratchet provision also became cashless. As a result, 210,318 cashless warrants were exercised in Q2 2023. |
Transactions for the nine
month period ended September 30, 2022 are as follows:
On January
11, 2022 as part of an underwritten public offering, the Company issued a total of 100,000 share purchase warrants, exercisable at $230.00
per warrant and with a term of five years.
FINANCIAL INSTRUMENTS
The fair values of the Company’s
cash, trade and other receivables, accounts payable and accrued liabilities and long-term debt, approximate carrying value, which is the
amount recorded on the consolidated statement of financial position.
Credit risk
Credit risk is the risk of an unexpected
loss if a customer or third party to a financial instrument fails to meet its contractual obligations. The Company places its cash with
institutions of high creditworthiness. Management has assessed there to be a low level of credit risk associated with its cash balances.
The Company's exposure to credit risk
is influenced mainly by the individual characteristics of each customer. However, management also considers the demographics of the Company's
customer base, including the default risk of the industry and country in which customers operate, as these factors may have an influence
on credit risk. Approximately 19% of the Company's revenue for the nine months ended September 30, 2023 (September 30, 2022 -26%) is attributable
to sales transactions with a single customer.
The Company has established a credit
policy under which each new customer is analyzed individually for creditworthiness before the Company's standard payment and delivery
terms and conditions are offered. The Company's review includes external ratings, when available, and in some cases bank references.
Purchase limits are established for each customer, which represents the maximum open amount without requiring approval from the Risk
Management Committee; these limits are reviewed quarterly. In prior years, certain key customers were offered extended payment terms
on their purchases due to slow down from Covid-19 and budget approvals for government tenders.
More than 60% (2022 – 22%) of
the Company's customers have been active with the Company for over four years, and the allowance for doubtful accounts of $1,091,026 (2022
- $1,056,393) has been recognized against these customers. In monitoring customer credit risk, customers are grouped according to their
credit characteristics, including whether they are an individual or legal entity, whether they are a wholesale, retail or end-user customer,
geographic location, industry, aging profile, maturity, and the existence of previous financial difficulties. Trade and other receivables
relate mainly to the Company's wholesale customers. Customers that are graded as “high risk” are placed on a restricted customer
list and monitored by the Company.
The carrying amount of financial assets
represents the maximum credit exposure, notwithstanding the carrying amount of security or any other credit enhancements.
Liquidity risk
Liquidity risk is the risk
that the Company will encounter difficulty in meeting the obligations associated with its financial liabilities that are settled by delivering
cash or another financial asset. The Company’s approach to managing liquidity is to ensure, as far as possible, that it will always
have sufficient liquidity to meet its liabilities when due, under both normal and stressed conditions, without incurring unacceptable
losses or risking damage to the Company’s reputation.
The Company examines current
forecasts of its liquidity requirements so as to make certain that there is sufficient cash for its operating needs, and it is careful
at all times to have enough unused credit facilities so that the Company does not exceed its credit limits and is in compliance with its
financial covenants (if any). These forecasts take into consideration matters such as the Company’s plan to use debt for financing
its activity, compliance with required financial covenants, compliance with certain liquidity ratios, and compliance with external requirements
such as laws or regulation.
The Company uses activity-based
costing to cost its products and services, which assists it in monitoring cash flow requirements and optimizing its cash return on investments.
Typically, the Company ensures that it has sufficient cash on demand to meet expected operational expenses for a period of 90 days, including
the servicing of financial obligations; this excludes the potential impact of extreme circumstances that cannot reasonably be predicted,
such as natural disasters.
With the exception of employee
benefits, the Company’s accounts payable and accrued liabilities have contractual terms of 90 days. The employment benefits
included in accrued liabilities have variable maturities within the coming year.
Market risk
Currency risk is the risk
that the fair value or future cash flows of a financial instrument will fluctuate because of changes in foreign exchange rates.
Interest rate risk is the
risk that the fair value of future cash flows will fluctuate as a result of changes in interest rates. The Company’s sensitively
to interest rates is currently immaterial as the Company’s debt bears interest at fixed rates.
The Company is exposed to
price risk with respect to equity prices. Equity price risk is defined as the potential adverse impact on the Company’s earnings
due to movements in individual equity prices or general movements in the level of the stock market. The Company closely monitors individual
equity movements, and the stock market to determine the appropriate course of action to be taken by the Company.
| C. |
Research and development, patents and licenses, etc. |
Research and development
The Company undertakes research
activities that present the prospect of gaining new scientific or technical knowledge and understanding, and the Company’s development
activities involve a plan or design for the production of new or substantially improved products and processes. The Company conducts its
own research and development with its internal engineering teams in Israel and complements that effort with subcontractors for both its
hardware and software development. The Company analyzes market trends, evaluates emerging wireless technologies, and innovates to address
anticipated customer needs.
Patents
The Company owns two patents
that it acquired from Clear RF and the Corporation has entered into several licensing agreements for the use of a trademark and certain
patents.
In March 2021, the Corporation,
through a wholly-owned subsidiary of Signifi Mobile Inc., the Corporation’s wholly-owned subsidiary, also acquired all of the outstanding
units of Clear RF LLC (“ClearRF”), a Washington State limited liability company, for a total purchase price of $700,000. The
purchase price which was satisfied by the issuance of approximately $389,970 in Common Shares and a payment of $310,030 in cash. ClearRF
produces M2M (machine-to-machine) cellular amplifiers for commercial and industrial M2M applications, and offers patented direct connect
cellular amplifiers and patented auto gain & oscillation control designed for M2M and “internet-of-things” (“IoT”)
applications. ClearRF’s flagship product is a 4G LTE direct connect cellular amplifier designed specifically for fixed and mobile
M2M and IoT applications, used to connect directly to any cellular router, modem, embedded module, or alarm panel.
Licensing Agreements
Licensing Agreement with Uniden® America
Corp
In December 2012, Signifi
Mobile Inc., the Corporation’s wholly-owned subsidiary, entered into a license agreement (as amended, the “Uniden Agreement”)
with Uniden America Corporation (“Uniden”). The Uniden Agreement includes renewal options up to December 31,2022, and
has been successively renewed to date.
The Uniden Agreement, as in
effect currently, provides the Corporation with the exclusive right to use the trademark “Uniden®” (along with associated
designs and trade dress) and distribute, market, and sell its in-vehicle device, cellular signal booster and accessories under the Uniden®
brand in the categories of cellular amplifiers, connected vehicle cellular devices, and rugged cellular products, during its term in North
America. The Uniden® brand brings strong brand recognition for the Corporation’s devices and introduces a more unified brand
to the current dealers, operators, and future customers in North America.
The current Uniden Agreement
which commenced on January 1, 2020, and expires on December 31, 2031. Minimum annual payments under the Uniden Agreement are $200,000
in 2023-2025 and $250,000 in each of 2026-2028 and $300,000 from 2029-2031 (collectively, the “Minimum Royalty Payments”).
At the end of each fiscal year, Siyata has agreed to pay Uniden 3% of any sales from the licensed products under the Uniden Agreement
that exceeds the Minimum Royalty Payments for such fiscal year.
Licensing Agreement with Via Licensing Corporation
Effective June 8, 2018, the
Corporation entered into two separate patent licensing agreements (together, the “Via Licensing Agreements”) with Via
Licensing Corporation to utilize worldwide patents related to the coding and decoding of Android software as well as access and download
within the LTE/ 4G network. This patent license is for an initial period of five years and can be extended for a further five-year term.
Management is completing the extension prior to the expiry date. Under the Via Licensing Agreements, the Corporation has the right, at
any time during the term or any extension thereof, to terminate the agreements upon providing 60 days advanced notice of termination.
The Via Licensing Agreements provide for the payment, to Via Licensing Corporation, of quarterly royalty fees that are based solely on
product sales and is expressed as a percentage formula based upon the number of units sold, the country in which the units were manufactured,
and the country location of the end customer. There are no minimum royalty fees payable under the Via Licensing Agreements.
Licensing Agreement with Wilson Electronics,
LLC
Siyata, through its wholly-owned
subsidiary, Signifi Mobile Inc., entered into a royalty agreement (the “Wilson Agreement”) with Wilson Electronics,
LLC on November 30, 2017, with an effective date of January 1, 2018. The Wilson Agreement permits the Corporation to utilize several of
Wilson Electronics’ LLC’s patents related to cellphone boosters. Specifically, under the Wilson Agreement, the Corporation
has licensed a patent for its cellular booster portfolio of products, for the rights to the stand-alone cell phone radio signal booster
on a worldwide basis. The Wilson Agreement is expected to remain in force until the expiration of all of the patents licensed under the
Wilson Agreement expire, which is estimated to occur in December 2027. The Wilson Agreement requires Siyata to pay a royalty to Wilson
Electronics, LLC of 4.5% of the sales of booster products, payable quarterly.
See Item 5. OPERATING AND
FINANCIAL REVIEW AND PROSPECTS, Subsection A. “Outlook” for trend information.
| E. |
Critical Accounting Estimates |
The preparation of the consolidated
financial statements in conformity with IFRS requires management to make estimates, judgments and assumptions that affect the application
of accounting policies and the reported amounts of assets, liabilities, income and expenses. Actual results may differ from these estimates:
| |
i) |
Critical accounting estimates |
Estimates and underlying
assumptions are reviewed on an ongoing basis. Revisions to accounting estimates are recognized in the period in which the estimates are
revised and in any future periods affected. Information about critical estimates in applying accounting policies that have the most
significant effect on the amounts recognized in the consolidated financial statements are, but not limited to the following:
| |
☐ |
Income taxes - Tax provisions are based on enacted or substantively enacted laws. Changes in those laws could affect amounts recognized in profit or loss both in the period of change, which would include any impact on cumulative provisions, and future periods. Deferred tax assets, if any, are recognized to the extent it is considered probable that those assets will be recoverable. This involves an assessment of when those deferred tax assets are likely to reverse. |
| |
☐ |
Fair value of stock options and warrants - Determining the fair value of warrants and stock options requires judgments related to the choice of a pricing model, the estimation of stock price volatility, the expected forfeiture rate and the expected term of the underlying instruments. Any changes in the estimates or inputs utilized to determine fair value could have a significant impact on the Company’s future operating results or on other components of shareholders’ equity. |
| |
☐ |
Capitalization of development costs and their amortization rate – Development costs are capitalized in accordance with the accounting policy. To determine the amounts earmarked for capitalization, management estimates the cash flows which are expected to be derived from the asset for which the development is carried out and the expected benefit period. |
| |
☐ |
Inventory - Inventory is valued at the lower of cost and net realizable value. Cost of inventory includes cost of purchase (purchase price, import duties, transport, handling, and other costs directly attributable to the acquisition of inventories), cost of conversion, and other costs incurred in bringing the inventories to their present location and condition. Net realizable value for inventories is the estimated selling price in the ordinary course of business less the estimated costs of completion and the estimated costs necessary to make the sale. Provisions are made in profit or loss of the current period on any difference between book value and net realizable value. |
| |
☐ |
Estimated product returns - Revenue from product sales is recognized net of estimated sales discounts, credits, returns, rebates and allowances. The return allowance is determined based on an analysis of the historical rate of returns, industry return data, and current market conditions, which is applied directly against sales. |
| |
☐ |
Impairment of non-financial assets - The Company assesses impairment at each reporting date by evaluating conditions specific to the Company that may lead to asset impairment. The recoverable amount of an asset or a cash-generating unit (“CGU”) is determined using the greater of fair value less costs to sell and value in use which requires the use of various judgments, estimates, and assumptions. |
| |
☐ |
Useful life of intangible assets – The Company estimates the useful life used to amortize intangible assets which relates to the expected future performance of the assets acquired based on management estimate of the sales forecast. |
| |
☐ |
Future purchase consideration - In a business combination, the Company recognizes a contingent consideration at fair value at the acquisition date. Contingent consideration classified as an asset or liability that is a financial instrument and within the scope of IAS 39 Financial Instruments: Recognition and Measurement, is measured at fair value with changes in fair value recognized either in profit or loss, or as a change to other comprehensive income (“OCI”). If the contingent consideration is not within the scope of IAS 39, it is measured at fair value in accordance with the appropriate IFRS. Contingent consideration that is classified as equity is not re-measured and subsequent settlement is accounted for within equity. |
| |
☐ |
Contingent consideration from an asset acquisition is recognized when: the conditions associated with the contingency are met; the Company has a present legal or constructive obligation that can be estimated reliably; and it is probably that an outflow of economic benefits will be required to settle the obligation. |
| |
ii) |
Critical accounting judgments |
Information about critical
judgments in applying accounting policies that have the most significant effect on the amounts recognized in the consolidated financial
statements are, but are not limited to, the following:
| |
☐ |
Deferred income taxes – judgments are made by management to determine the likelihood of whether deferred income tax assets at the end of the reporting period will be realized from future taxable earnings. To the extent that assumptions regarding future profitability change, there can be an increase or decrease in the amounts recognized in respect of deferred tax assets as well as the amounts recognized in profit or loss in the period in which the change occurs. |
| |
☐ |
Functional currency - The functional currency for the Company and each of the Company’s subsidiaries is the currency of the primary economic environment in which the respective entity operates. The Company has determined the functional currency of each entity to be the Canadian dollar with the exception of Siyata Israel which has the functional currency of the US dollar. Such determination involves certain judgments to identify the primary economic environment. The Company reconsiders the functional currency of its subsidiaries if there is a change in events and/or conditions that determine the primary economic environment. |
| |
☐ |
Going concern – As disclosed in Note 1 to the consolidated financial statements. |
RECENT ACCOUNTING PRONOUNCEMENTS
None than specifically apply
to the Company as evaluated by management.
RELATED PARTY TRANSACTIONS
Key Personnel Compensation
Key Personnel Compensation
Key management personnel includes
those persons having authority and responsibility for planning, directing, and controlling the activities of the Company as a whole. The
Company has determined that key management personnel consists of executive and non-executive members of the Company’s Board of Directors
and corporate officers. The remuneration of directors and key management personnel for the nine months ended September 30, 2023 and 2022
are as follows:
| | |
2023 | | |
2022 | |
| Payments to key management personnel: | |
| | |
| |
| Salaries, consulting and directors’ fees | |
$ | 1,007.410 | | |
$ | 1,162,885 | |
| Share-based payments | |
| 593,146 | | |
| 1,824,713 | |
| Total | |
$ | 1,600,556 | | |
$ | 2,987,598 | |
Other related party transactions
are as follows:
| | |
| |
(in thousands) | |
| Type of Service | |
Nature of Relationship | |
2023 | | |
2022 | |
| Selling and marketing expenses | |
VP Technology/VP Sales International | |
$ | 225 | | |
$ | 234 | |
| General and administrative expense | |
Companies controlled by the CEO, CFO and Directors | |
$ | 782 | | |
$ | 929 | |
| C. |
Off-Balance Sheet Arrangements |
The Company currently has
no off-balance sheet arrangements.
Additional Information
Additional information relating
to the Company can be found on SEDAR at www.sedar.com.
77
Exhibit
99.3

N E W S R E L
E A S E
Siyata
Mobile Announces Financial Results for Third Quarter 2023
Company
to host conference call at 8:30 a.m. ET on Thursday November 16
Vancouver,
BC – November 15, 2023 -- Siyata Mobile Inc. (Nasdaq: SYTA, SYTAW) (“Siyata”
or the “Company”), a global vendor of Push-to-Talk over Cellular (PoC) devices and cellular signal booster systems,
announced its financial results for the three months ended September 30, 2023.
“Year-to-date,
we have grown our revenue by 45% compared to the same period last year on increasing sales of our mission-critical, Push-to-Talk Over
Cellular (PoC) solution,” said Marc Seelenfreund, CEO of Siyata. “Demand for reliable, high-quality communication solutions
is strong, and we are well positioned with an expanding reseller network and partnerships with Tier-1 cellular providers to capture additional
market share. During the third quarter, we experienced slight order delays as we transitioned from non-stocked to stocked status with
a large U.S. wireless carrier, which resulted in lower sales. Importantly, we believe this was a temporary decline isolated to the third
quarter as recent orders indicate fourth quarter sales are off to a solid start. Looking ahead, the size and quality of our new business
pipeline reinforces our optimism for future growth.”
Key
financial highlights for the three months ended September 30, 2023:
| ● | Revenues
were $1.8 million compared to $2.6 million for the three months ended September 30, 2022.
This decrease of $726,000, or 28.3%, was due mainly to the decrease in the sale of rugged
devices partially offset by an increase in sales of boosters. |
| ● | Gross
profit of $490,000, or 26.6% of revenues, compared to $856,000, or 33.3% of revenues for
the three months ended September 30, 2022. The decrease in gross profit dollars and margin
was mainly due to the decrease in sales of rugged and in-vehicle cellular devices at higher
margins compared to the margins sold on legacy rugged devices. |
| ● | Adjusted
EBITDA was ($1.57) million compared to ($1.58) million in the same period in the prior year.
(See reconciliation with IFRS below). |
Liquidity
and Capital Resources
As
of September 30, 2023, the Company had a cash balance of $366,000 and working capital of $3.8 million compared to $1.9 million and $1.6
million, respectively, as of December 31, 2022.
Subsequent
to quarter end, the Company issued 1.87 million common shares and 530,000 pre-funded warrants at a public price of $0.65 per share and
$0.64 per pre-funded warrant for gross proceeds of $1.6 million.
Conference
Call Details
The
Company will host a conference call at 8:30 a.m. ET on Thursday, November 16, 2023 to discuss its third quarter 2023 financial results.
Following management’s formal remarks there will be a question-and-answer session.
Date:
Thursday, November 16, 2023
Time:
8:30 a.m. Eastern Time/5:30 a.m. Pacific Time
North
America dial-in number: +1 (877) 545-0523
International
toll-free dial-in number: +1 (973) 528-0016
Access
Code: 503806
A
replay will be available until November 30, 2023. To access the replay, dial +1 (877) 481-4010 or +1 (919) 882-2331. When prompted, enter
Passcode 49473.
The
call will also be available over the Internet and accessible at: https://www.webcaster4.com/Webcast/Page/2988/49473.
About
Siyata Mobile
Siyata
Mobile Inc. is a B2B global vendor of next generation Push-To-Talk over Cellular devices and cellular booster systems. Its portfolio
of in-vehicle and rugged devices enable first responders and enterprise workers to instantly communicate, over a nationwide cellular
network of choice, to increase situational awareness and save lives.
Its
portfolio of enterprise grade and consumer cellular booster systems enables first responders and enterprise workers to amplify cellular
signal in remote areas, inside structural buildings where signals are weak and within vehicles for the maximum cellular signal strength
possible.
Siyata’s
common shares trade on the Nasdaq under the symbol “SYTA” and its previously issued warrants trade on the Nasdaq under the
symbol “SYTAW.”
Visit
siyatamobile.com and unidencellular.com to learn more.
Investor
Relations (Canada):
Kin
Communications
1-866-684-6730
SYTA@kincommunications.com
Investor
Relations (United States):
Brett
Maas
Hayden
IR
SYTA@Haydenir.com
646-536-7331
Siyata
Mobile Corporate:
Glenn
Kennedy, VP of International Sales
Siyata
Mobile Inc.
glenn@siyata.net
Forward
Looking Statements
This
press release contains forward-looking statements within the meaning of the “safe harbor” provisions of the Private Securities
Litigation Reform Act of 1995 and other Federal securities laws. Words such as “expects,” “anticipates,” “intends,”
“plans,” “believes,” “seeks,” “estimates” and similar expressions or variations of such words
are intended to identify forward-looking statements. Because such statements deal with future events and are based on Siyata’s current
expectations, they are subject to various risks and uncertainties and actual results, performance or achievements of Siyata could differ
materially from those described in or implied by the statements in this press release. The forward-looking statements contained or implied
in this press release are subject to other risks and uncertainties, including those discussed under the heading “Risk Factors”
in Siyata’s filings with the Securities and Exchange Commission (“SEC”), and in any subsequent filings with the SEC. Except
as otherwise required by law, Siyata undertakes no obligation to publicly release any revisions to these forward-looking statements to
reflect events or circumstances after the date hereof or to reflect the occurrence of unanticipated events. References and links to websites
and social media have been provided as a convenience, and the information contained on such websites or social media is not incorporated
by reference into this press release.
--
Tables Follow --
Siyata
Mobile Inc.
Unaudited
Condensed Interim Consolidated Statements of Financial Position
(Expressed
in US dollars)
| | |
September 30,
2023 | | |
December 31,
2022 | |
| ASSETS | |
| | |
| |
| Current | |
| | |
| |
| Cash | |
$ | 366,155 | | |
$ | 1,913,742 | |
| Trade and other receivables (Note 3) | |
| 2,179,246 | | |
| 1,574,628 | |
| Prepaid expenses | |
| 228,478 | | |
| 173,504 | |
| Inventory (Note 4) | |
| 2,901,914 | | |
| 4,092,550 | |
| Advance to suppliers | |
| 1,541,809 | | |
| 155,852 | |
| | |
| 7,217,602 | | |
| 7,910,276 | |
| Long term receivable | |
| 136,749 | | |
| 150,185 | |
| Right of use assets | |
| 666,274 | | |
| 887,137 | |
| Equipment | |
| 180,432 | | |
| 207,402 | |
| Intangible assets | |
| 7,996,315 | | |
| 6,987,531 | |
| Total assets | |
$ | 16,197,372 | | |
$ | 16,142,531 | |
| | |
| | | |
| | |
| LIABILITIES AND SHAREHOLDERS’ EQUITY | |
| | | |
| | |
| Current | |
| | | |
| | |
| Bank loan (Note 5) | |
$ | 531,521 | | |
$ | - | |
| Accounts payable and accrued liabilities | |
| 2,589,219 | | |
| 3,078,650 | |
| Deferred revenue | |
| - | | |
| 149,600 | |
| Lease obligations | |
| 329,433 | | |
| 303,788 | |
| Warrant liability (Note 7) | |
| 13,923 | | |
| 2,734,804 | |
| | |
| 3,464,096 | | |
| 6,266,842 | |
| Lease obligation | |
| 396,242 | | |
| 635,217 | |
| | |
| 396,242 | | |
| 635,217 | |
| Total liabilities | |
| 3,860,338 | | |
| 6,902,059 | |
| Shareholders’ equity | |
| | | |
| | |
| Share capital (Note 8) | |
| 84,702,612 | | |
| 73,312,866 | |
| Reserves (Note 8) | |
| 14,421,004 | | |
| 13,647,399 | |
| Accumulated other comprehensive loss | |
| 98,870 | | |
| 98,870 | |
| Deficit | |
| (86,885,452 | ) | |
| (77,818,663 | ) |
| | |
| 12,337,034 | | |
| 9,240,472 | |
| Total liabilities and shareholders’ equity | |
$ | 16,197,372 | | |
$ | 16,142,531 | |
Siyata
Mobile Inc.
Unaudited
Condensed Interim Consolidated Statements of Loss and Comprehensive Loss
(Expressed
in US dollars)
For
the three and nine months ended September 30
| |
|
9 months ended
September 30 |
|
|
3 months ended
September 30 |
|
| |
|
USD |
|
|
USD |
|
|
USD |
|
|
USD |
|
| |
|
2023 |
|
|
2022 |
|
|
2023 |
|
|
2022 |
|
| |
|
|
|
|
|
|
|
|
|
|
|
|
| Revenue |
|
$ |
6,355,744 |
|
|
$ |
4,370,387 |
|
|
$ |
1,842,390 |
|
|
$ |
2,567,885 |
|
| Cost of sales (Note 9) |
|
|
(4,564,640 |
) |
|
|
(3,150,560 |
) |
|
|
(1,352,293 |
) |
|
|
(1,711,782 |
) |
| Gross profit |
|
|
1,791,104 |
|
|
|
1,219,827 |
|
|
|
490,097 |
|
|
|
856,103 |
|
| |
|
|
|
|
|
|
|
|
|
|
|
|
|
|
|
|
| EXPENSES |
|
|
|
|
|
|
|
|
|
|
|
|
|
|
|
|
| Amortization and depreciation |
|
|
1,308,639 |
|
|
|
811,234 |
|
|
|
453,500 |
|
|
|
351,310 |
|
| Development expenses |
|
|
173,102 |
|
|
|
299,937 |
|
|
|
87,652 |
|
|
|
36,567 |
|
| Selling and marketing (Note 10) |
|
|
3,464,928 |
|
|
|
3,434,201 |
|
|
|
1,423,760 |
|
|
|
1,225,475 |
|
| General and administrative (Note 11) |
|
|
4,414,096 |
|
|
|
4,684,702 |
|
|
|
1,318,284 |
|
|
|
1,174,041 |
|
| Inventory impairment (Note 4) |
|
|
- |
|
|
|
303,316 |
|
|
|
- |
|
|
|
- |
|
| Inventory loss (income) from water damage |
|
|
(405,364 |
) |
|
|
- |
|
|
|
(405,364 |
) |
|
|
- |
|
| Bad debts (recovered) (Note 3) |
|
|
26,660 |
|
|
|
63,285 |
|
|
|
16,512 |
|
|
|
- |
|
| Insurance proceeds from water damage |
|
|
(380,077 |
) |
|
|
- |
|
|
|
(380,077 |
) |
|
|
- |
|
| Share-based payments (Note 8) |
|
|
773,605 |
|
|
|
2,478,695 |
|
|
|
202,072 |
|
|
|
539,660 |
|
| Total operating expenses |
|
|
9,375,589 |
|
|
|
12,075,370 |
|
|
|
2,716,339 |
|
|
|
3,327,053 |
|
| |
|
|
|
|
|
|
|
|
|
|
|
|
|
|
|
|
| Net operating loss |
|
|
(7,584,485 |
) |
|
|
(10,855,543 |
) |
|
|
(2,226,242 |
) |
|
|
(2,470,950 |
) |
| |
|
|
|
|
|
|
|
|
|
|
|
|
|
|
|
|
| OTHER EXPENSES |
|
|
|
|
|
|
|
|
|
|
|
|
|
|
|
|
| Finance expense) |
|
|
109,033 |
|
|
|
128,446 |
|
|
|
33,684 |
|
|
|
82,720 |
|
| Foreign exchange |
|
|
(188,494 |
) |
|
|
199,535 |
|
|
|
(109,895 |
) |
|
|
180,367 |
|
| Change in fair value of convertible promissory note (Note 6) |
|
|
- |
|
|
|
3,725,362 |
|
|
|
- |
|
|
|
474,514 |
|
| Change in fair value of opening warrant liability (Note 7) |
|
|
- |
|
|
|
962,350 |
|
|
|
- |
|
|
|
- |
|
| Change in fair value of warrant liability (Note 7) |
|
|
1,561,765 |
|
|
|
(8,125,538 |
) |
|
|
(294,858 |
) |
|
|
(2,680,603 |
) |
| Transaction costs (Note 1) |
|
|
- |
|
|
|
965,247 |
|
|
|
- |
|
|
|
- |
|
| Total other expenses |
|
|
1,482,304 |
|
|
|
(2,144,598 |
) |
|
|
(371,069 |
) |
|
|
(1,943,002 |
) |
| Net loss for the year |
|
|
(9,066,789 |
) |
|
|
(8,710,945 |
) |
|
|
(1,855,173 |
) |
|
|
(527,948 |
) |
| |
|
|
|
|
|
|
|
|
|
|
|
|
|
|
|
|
| Other comprehensive income |
|
|
|
|
|
|
|
|
|
|
|
|
|
|
|
|
| Translation adjustment |
|
|
- |
|
|
|
138,628 |
|
|
|
- |
|
|
|
137,110 |
|
| |
|
|
|
|
|
|
|
|
|
|
|
|
|
|
|
|
| Comprehensive loss for the year |
|
$ |
(9,066,789 |
) |
|
$ |
(8,572,317 |
) |
|
$ |
(1,855,173 |
) |
|
$ |
(390,838 |
) |
| |
|
|
|
|
|
|
|
|
|
|
|
|
|
|
|
|
| Weighted average shares (after the 100-1 reverse stock split) |
|
|
1,052,526 |
|
|
|
147,155 |
|
|
|
1,792,431 |
|
|
|
165,351 |
|
| Basic and diluted loss per share after the 100-1 reverse stock split |
|
$ |
(8.61 |
) |
|
$ |
(59.20 |
) |
|
$ |
(1.04 |
) |
|
$ |
(3.19 |
) |
Reconciliation
to Adjusted EBITDA
(Expressed
in US dollars)
For
the three months ended June 30, 2023 and 2022
| | |
9 months ended
September 30,
2023 | | |
3 months ended
September 30,
2023 | |
| | |
USD | | |
USD | | |
USD | | |
USD | |
| EBITDA | |
2023 | | |
2022 | | |
2023 | | |
2022 | |
| Net operating loss | |
| (7,584,485 | ) | |
| (10,855,543 | ) | |
| (2,226,242 | ) | |
| (2,470,950 | ) |
| addback | |
| | | |
| | | |
| | | |
| | |
| amortization and depreciation | |
| 1,308,639 | | |
| 811,234 | | |
| 453,500 | | |
| 351,310 | |
| share based payments | |
| 773,605 | | |
| 2,478,695 | | |
| 202,072 | | |
| 539,660 | |
| | |
| | | |
| | | |
| | | |
| | |
| Adjusted EBITDA | |
| (5,502,241 | ) | |
| (7,565,614 | ) | |
| (1,570,670 | ) | |
| (1,579,980 | ) |
-
END -
6
v3.23.3
| X |
- DefinitionBoolean flag that is true when the XBRL content amends previously-filed or accepted submission.
| Name: |
dei_AmendmentFlag |
| Namespace Prefix: |
dei_ |
| Data Type: |
xbrli:booleanItemType |
| Balance Type: |
na |
| Period Type: |
duration |
|
| X |
- DefinitionEnd date of current fiscal year in the format --MM-DD.
| Name: |
dei_CurrentFiscalYearEndDate |
| Namespace Prefix: |
dei_ |
| Data Type: |
xbrli:gMonthDayItemType |
| Balance Type: |
na |
| Period Type: |
duration |
|
| X |
- DefinitionFiscal period values are FY, Q1, Q2, and Q3. 1st, 2nd and 3rd quarter 10-Q or 10-QT statements have value Q1, Q2, and Q3 respectively, with 10-K, 10-KT or other fiscal year statements having FY.
| Name: |
dei_DocumentFiscalPeriodFocus |
| Namespace Prefix: |
dei_ |
| Data Type: |
dei:fiscalPeriodItemType |
| Balance Type: |
na |
| Period Type: |
duration |
|
| X |
- DefinitionThis is focus fiscal year of the document report in YYYY format. For a 2006 annual report, which may also provide financial information from prior periods, fiscal 2006 should be given as the fiscal year focus. Example: 2006.
| Name: |
dei_DocumentFiscalYearFocus |
| Namespace Prefix: |
dei_ |
| Data Type: |
xbrli:gYearItemType |
| Balance Type: |
na |
| Period Type: |
duration |
|
| X |
- DefinitionFor the EDGAR submission types of Form 8-K: the date of the report, the date of the earliest event reported; for the EDGAR submission types of Form N-1A: the filing date; for all other submission types: the end of the reporting or transition period. The format of the date is YYYY-MM-DD.
| Name: |
dei_DocumentPeriodEndDate |
| Namespace Prefix: |
dei_ |
| Data Type: |
xbrli:dateItemType |
| Balance Type: |
na |
| Period Type: |
duration |
|
| X |
- DefinitionThe type of document being provided (such as 10-K, 10-Q, 485BPOS, etc). The document type is limited to the same value as the supporting SEC submission type, or the word 'Other'.
| Name: |
dei_DocumentType |
| Namespace Prefix: |
dei_ |
| Data Type: |
dei:submissionTypeItemType |
| Balance Type: |
na |
| Period Type: |
duration |
|
| X |
- DefinitionA unique 10-digit SEC-issued value to identify entities that have filed disclosures with the SEC. It is commonly abbreviated as CIK. Reference 1: http://www.xbrl.org/2003/role/presentationRef
-Publisher SEC
-Name Exchange Act
-Number 240
-Section 12
-Subsection b-2
| Name: |
dei_EntityCentralIndexKey |
| Namespace Prefix: |
dei_ |
| Data Type: |
dei:centralIndexKeyItemType |
| Balance Type: |
na |
| Period Type: |
duration |
|
| X |
- DefinitionCommission file number. The field allows up to 17 characters. The prefix may contain 1-3 digits, the sequence number may contain 1-8 digits, the optional suffix may contain 1-4 characters, and the fields are separated with a hyphen.
| Name: |
dei_EntityFileNumber |
| Namespace Prefix: |
dei_ |
| Data Type: |
dei:fileNumberItemType |
| Balance Type: |
na |
| Period Type: |
duration |
|
| X |
- DefinitionThe exact name of the entity filing the report as specified in its charter, which is required by forms filed with the SEC. Reference 1: http://www.xbrl.org/2003/role/presentationRef
-Publisher SEC
-Name Exchange Act
-Number 240
-Section 12
-Subsection b-2
| Name: |
dei_EntityRegistrantName |
| Namespace Prefix: |
dei_ |
| Data Type: |
xbrli:normalizedStringItemType |
| Balance Type: |
na |
| Period Type: |
duration |
|
v3.23.3
Unaudited Condensed Interim Consolidated Statements of Financial Position - USD ($)
|
Sep. 30, 2023 |
Dec. 31, 2022 |
| Current |
|
|
| Cash |
$ 366,155
|
$ 1,913,742
|
| Trade and other receivables (Note 3) |
2,179,246
|
1,574,628
|
| Prepaid expenses |
228,478
|
173,504
|
| Inventory (Note 4) |
2,901,914
|
4,092,550
|
| Advance to suppliers |
1,541,809
|
155,852
|
| Total current assets |
7,217,602
|
7,910,276
|
| Long term receivable |
136,749
|
150,185
|
| Right of use assets |
666,274
|
887,137
|
| Equipment |
180,432
|
207,402
|
| Intangible assets |
7,996,315
|
6,987,531
|
| Total assets |
16,197,372
|
16,142,531
|
| Current |
|
|
| Bank loan (Note 5) |
531,521
|
|
| Accounts payable and accrued liabilities |
2,589,219
|
3,078,650
|
| Deferred revenue |
|
149,600
|
| Lease obligations |
329,433
|
303,788
|
| Warrant liability (Note 7) |
13,923
|
2,734,804
|
| Total current liabilities |
3,464,096
|
6,266,842
|
| Lease obligations |
396,242
|
635,217
|
| Total liabilities |
3,860,338
|
6,902,059
|
| Shareholders’ equity |
|
|
| Share capital (Note 8) |
84,702,612
|
73,312,866
|
| Reserves (Note 8) |
14,421,004
|
13,647,399
|
| Accumulated other comprehensive loss |
98,870
|
98,870
|
| Deficit |
(86,885,452)
|
(77,818,663)
|
| Shareholders’ equity |
12,337,034
|
9,240,472
|
| Total liabilities and shareholders’ equity |
$ 16,197,372
|
$ 16,142,531
|
| X |
- DefinitionThe amount of accumulated items of income and expense (including reclassification adjustments) that are not recognised in profit or loss as required or permitted by other IFRSs. [Refer: IFRSs [member]; Other comprehensive income] Reference 1: http://www.xbrl.org/2009/role/commonPracticeRef
-Name IAS
-Number 1
-IssueDate 2023-01-01
-Paragraph 55
-URI https://taxonomy.ifrs.org/xifrs-link?type=IAS&num=1&code=ifrs-tx-2023-en-r&anchor=para_55&doctype=Standard
-URIDate 2023-03-23
| Name: |
ifrs-full_AccumulatedOtherComprehensiveIncome |
| Namespace Prefix: |
ifrs-full_ |
| Data Type: |
xbrli:monetaryItemType |
| Balance Type: |
credit |
| Period Type: |
instant |
|
| X |
- DefinitionThe amount of a present economic resource controlled by the entity as a result of past events. Economic resource is a right that has the potential to produce economic benefits. Reference 1: http://www.xbrl.org/2003/role/disclosureRef
-Name IFRS
-Number 13
-IssueDate 2023-01-01
-Paragraph 93
-Subparagraph a
-URI https://taxonomy.ifrs.org/xifrs-link?type=IFRS&num=13&code=ifrs-tx-2023-en-r&anchor=para_93_a&doctype=Standard
-URIDate 2023-03-23
Reference 2: http://www.xbrl.org/2003/role/disclosureRef
-Name IFRS
-Number 8
-IssueDate 2023-01-01
-Paragraph 28
-Subparagraph c
-URI https://taxonomy.ifrs.org/xifrs-link?type=IFRS&num=8&code=ifrs-tx-2023-en-r&anchor=para_28_c&doctype=Standard
-URIDate 2023-03-23
Reference 3: http://www.xbrl.org/2003/role/disclosureRef
-Name IFRS
-Number 13
-IssueDate 2023-01-01
-Paragraph 93
-Subparagraph b
-URI https://taxonomy.ifrs.org/xifrs-link?type=IFRS&num=13&code=ifrs-tx-2023-en-r&anchor=para_93_b&doctype=Standard
-URIDate 2023-03-23
Reference 4: http://www.xbrl.org/2003/role/disclosureRef
-Name IFRS
-Number 13
-IssueDate 2023-01-01
-Paragraph 93
-Subparagraph e
-URI https://taxonomy.ifrs.org/xifrs-link?type=IFRS&num=13&code=ifrs-tx-2023-en-r&anchor=para_93_e&doctype=Standard
-URIDate 2023-03-23
Reference 5: http://www.xbrl.org/2003/role/disclosureRef
-Name IFRS
-Number 8
-IssueDate 2023-01-01
-Paragraph 23
-URI https://taxonomy.ifrs.org/xifrs-link?type=IFRS&num=8&code=ifrs-tx-2023-en-r&anchor=para_23&doctype=Standard
-URIDate 2023-03-23
Reference 6: http://www.xbrl.org/2003/role/disclosureRef
-Name IAS
-Number 1
-IssueDate 2023-01-01
-Paragraph 55
-URI https://taxonomy.ifrs.org/xifrs-link?type=IAS&num=1&code=ifrs-tx-2023-en-r&anchor=para_55&doctype=Standard
-URIDate 2023-03-23
| Name: |
ifrs-full_Assets |
| Namespace Prefix: |
ifrs-full_ |
| Data Type: |
xbrli:monetaryItemType |
| Balance Type: |
debit |
| Period Type: |
instant |
|
| X |
- DefinitionThe amount of cash on hand and demand deposits. [Refer: Cash on hand] Reference 1: http://www.xbrl.org/2009/role/commonPracticeRef
-Name IAS
-Number 7
-IssueDate 2023-01-01
-Paragraph 45
-URI https://taxonomy.ifrs.org/xifrs-link?type=IAS&num=7&code=ifrs-tx-2023-en-r&anchor=para_45&doctype=Standard
-URIDate 2023-03-23
| Name: |
ifrs-full_Cash |
| Namespace Prefix: |
ifrs-full_ |
| Data Type: |
xbrli:monetaryItemType |
| Balance Type: |
debit |
| Period Type: |
instant |
|
| X |
- DefinitionThe amount of current advances made to suppliers before goods or services are received. Reference 1: http://www.xbrl.org/2009/role/commonPracticeRef
-Name IAS
-Number 1
-IssueDate 2023-01-01
-Paragraph 112
-Subparagraph c
-URI https://taxonomy.ifrs.org/xifrs-link?type=IAS&num=1&code=ifrs-tx-2023-en-r&anchor=para_112_c&doctype=Standard
-URIDate 2023-03-23
| Name: |
ifrs-full_CurrentAdvancesToSuppliers |
| Namespace Prefix: |
ifrs-full_ |
| Data Type: |
xbrli:monetaryItemType |
| Balance Type: |
debit |
| Period Type: |
instant |
|
| X |
- DefinitionThe amount of assets that the entity (a) expects to realise or intends to sell or consume in its normal operating cycle; (b) holds primarily for the purpose of trading; (c) expects to realise within twelve months after the reporting period; or (d) classifies as cash or cash equivalents (as defined in IAS 7) unless the asset is restricted from being exchanged or used to settle a liability for at least twelve months after the reporting period. [Refer: Assets] Reference 1: http://www.xbrl.org/2003/role/exampleRef
-Name IFRS
-Number 12
-IssueDate 2023-01-01
-Paragraph B10
-Subparagraph b
-URI https://taxonomy.ifrs.org/xifrs-link?type=IFRS&num=12&code=ifrs-tx-2023-en-r&anchor=para_B10_b&doctype=Appendix&subtype=B
-URIDate 2023-03-23
Reference 2: http://www.xbrl.org/2003/role/disclosureRef
-Name IFRS
-Number 12
-IssueDate 2023-01-01
-Paragraph B12
-Subparagraph b
-Clause i
-URI https://taxonomy.ifrs.org/xifrs-link?type=IFRS&num=12&code=ifrs-tx-2023-en-r&anchor=para_B12_b_i&doctype=Appendix&subtype=B
-URIDate 2023-03-23
Reference 3: http://www.xbrl.org/2003/role/disclosureRef
-Name IAS
-Number 1
-IssueDate 2023-01-01
-Paragraph 66
-URI https://taxonomy.ifrs.org/xifrs-link?type=IAS&num=1&code=ifrs-tx-2023-en-r&anchor=para_66&doctype=Standard
-URIDate 2023-03-23
| Name: |
ifrs-full_CurrentAssets |
| Namespace Prefix: |
ifrs-full_ |
| Data Type: |
xbrli:monetaryItemType |
| Balance Type: |
debit |
| Period Type: |
instant |
|
| X |
- References
+ Details
| Name: |
ifrs-full_CurrentAssetsAbstract |
| Namespace Prefix: |
ifrs-full_ |
| Data Type: |
xbrli:stringItemType |
| Balance Type: |
na |
| Period Type: |
duration |
|
| X |
- DefinitionThe amount of current lease liabilities. [Refer: Lease liabilities] Reference 1: http://www.xbrl.org/2003/role/disclosureRef
-Name IFRS
-Number 16
-IssueDate 2023-01-01
-Paragraph 47
-Subparagraph b
-URI https://taxonomy.ifrs.org/xifrs-link?type=IFRS&num=16&code=ifrs-tx-2023-en-r&anchor=para_47_b&doctype=Standard
-URIDate 2023-03-23
| Name: |
ifrs-full_CurrentLeaseLiabilities |
| Namespace Prefix: |
ifrs-full_ |
| Data Type: |
xbrli:monetaryItemType |
| Balance Type: |
credit |
| Period Type: |
instant |
|
| X |
- DefinitionThe amount of liabilities that: (a) the entity expects to settle in its normal operating cycle; (b) the entity holds primarily for the purpose of trading; (c) are due to be settled within twelve months after the reporting period; or (d) the entity does not have the right at the end of the reporting period to defer settlement for at least twelve months after the reporting period. Reference 1: http://www.xbrl.org/2003/role/exampleRef
-Name IFRS
-Number 12
-IssueDate 2023-01-01
-Paragraph B10
-Subparagraph b
-URI https://taxonomy.ifrs.org/xifrs-link?type=IFRS&num=12&code=ifrs-tx-2023-en-r&anchor=para_B10_b&doctype=Appendix&subtype=B
-URIDate 2023-03-23
Reference 2: http://www.xbrl.org/2003/role/disclosureRef
-Name IFRS
-Number 12
-IssueDate 2023-01-01
-Paragraph B12
-Subparagraph b
-Clause iii
-URI https://taxonomy.ifrs.org/xifrs-link?type=IFRS&num=12&code=ifrs-tx-2023-en-r&anchor=para_B12_b_iii&doctype=Appendix&subtype=B
-URIDate 2023-03-23
Reference 3: http://www.xbrl.org/2003/role/disclosureRef
-Name IAS
-Number 1
-IssueDate 2023-01-01
-Paragraph 69
-URI https://taxonomy.ifrs.org/xifrs-link?type=IAS&num=1&code=ifrs-tx-2023-en-r&anchor=para_69&doctype=Standard
-URIDate 2023-03-23
| Name: |
ifrs-full_CurrentLiabilities |
| Namespace Prefix: |
ifrs-full_ |
| Data Type: |
xbrli:monetaryItemType |
| Balance Type: |
credit |
| Period Type: |
instant |
|
| X |
- References
+ Details
| Name: |
ifrs-full_CurrentLiabilitiesAbstract |
| Namespace Prefix: |
ifrs-full_ |
| Data Type: |
xbrli:stringItemType |
| Balance Type: |
na |
| Period Type: |
duration |
|
| X |
- DefinitionThe amount recognised as a current asset for expenditures made prior to the period when the economic benefit will be realised. Reference 1: http://www.xbrl.org/2009/role/commonPracticeRef
-Name IAS
-Number 1
-IssueDate 2023-01-01
-Paragraph 112
-Subparagraph c
-URI https://taxonomy.ifrs.org/xifrs-link?type=IAS&num=1&code=ifrs-tx-2023-en-r&anchor=para_112_c&doctype=Standard
-URIDate 2023-03-23
| Name: |
ifrs-full_CurrentPrepaidExpenses |
| Namespace Prefix: |
ifrs-full_ |
| Data Type: |
xbrli:monetaryItemType |
| Balance Type: |
debit |
| Period Type: |
instant |
|
| X |
- DefinitionThe amount of current warrant liabilities. [Refer: Warrant liability] Reference 1: http://www.xbrl.org/2009/role/commonPracticeRef
-Name IAS
-Number 1
-IssueDate 2023-01-01
-Paragraph 55
-URI https://taxonomy.ifrs.org/xifrs-link?type=IAS&num=1&code=ifrs-tx-2023-en-r&anchor=para_55&doctype=Standard
-URIDate 2023-03-23
| Name: |
ifrs-full_CurrentWarrantLiability |
| Namespace Prefix: |
ifrs-full_ |
| Data Type: |
xbrli:monetaryItemType |
| Balance Type: |
credit |
| Period Type: |
instant |
|
| X |
- DefinitionThe amount of residual interest in the assets of the entity after deducting all its liabilities. Reference 1: http://www.xbrl.org/2003/role/disclosureRef
-Name IFRS
-Number 1
-IssueDate 2023-01-01
-Paragraph 24
-Subparagraph a
-URI https://taxonomy.ifrs.org/xifrs-link?type=IFRS&num=1&code=ifrs-tx-2023-en-r&anchor=para_24_a&doctype=Standard
-URIDate 2023-03-23
Reference 2: http://www.xbrl.org/2003/role/disclosureRef
-Name IFRS
-Number 1
-IssueDate 2023-01-01
-Paragraph 32
-Subparagraph a
-Clause i
-URI https://taxonomy.ifrs.org/xifrs-link?type=IFRS&num=1&code=ifrs-tx-2023-en-r&anchor=para_32_a_i&doctype=Standard
-URIDate 2023-03-23
Reference 3: http://www.xbrl.org/2003/role/disclosureRef
-Name IFRS
-Number 13
-IssueDate 2023-01-01
-Paragraph 93
-Subparagraph a
-URI https://taxonomy.ifrs.org/xifrs-link?type=IFRS&num=13&code=ifrs-tx-2023-en-r&anchor=para_93_a&doctype=Standard
-URIDate 2023-03-23
Reference 4: http://www.xbrl.org/2003/role/disclosureRef
-Name IFRS
-Number 13
-IssueDate 2023-01-01
-Paragraph 93
-Subparagraph b
-URI https://taxonomy.ifrs.org/xifrs-link?type=IFRS&num=13&code=ifrs-tx-2023-en-r&anchor=para_93_b&doctype=Standard
-URIDate 2023-03-23
Reference 5: http://www.xbrl.org/2003/role/disclosureRef
-Name IFRS
-Number 13
-IssueDate 2023-01-01
-Paragraph 93
-Subparagraph e
-URI https://taxonomy.ifrs.org/xifrs-link?type=IFRS&num=13&code=ifrs-tx-2023-en-r&anchor=para_93_e&doctype=Standard
-URIDate 2023-03-23
Reference 6: http://www.xbrl.org/2003/role/disclosureRef
-Name IAS
-Number 1
-IssueDate 2023-01-01
-Paragraph 55
-URI https://taxonomy.ifrs.org/xifrs-link?type=IAS&num=1&code=ifrs-tx-2023-en-r&anchor=para_55&doctype=Standard
-URIDate 2023-03-23
Reference 7: http://www.xbrl.org/2003/role/disclosureRef
-Name IAS
-Number 1
-IssueDate 2023-01-01
-Paragraph 78
-Subparagraph e
-URI https://taxonomy.ifrs.org/xifrs-link?type=IAS&num=1&code=ifrs-tx-2023-en-r&anchor=para_78_e&doctype=Standard
-URIDate 2023-03-23
| Name: |
ifrs-full_Equity |
| Namespace Prefix: |
ifrs-full_ |
| Data Type: |
xbrli:monetaryItemType |
| Balance Type: |
credit |
| Period Type: |
instant |
|
| X |
- References
+ Details
| Name: |
ifrs-full_EquityAbstract |
| Namespace Prefix: |
ifrs-full_ |
| Data Type: |
xbrli:stringItemType |
| Balance Type: |
na |
| Period Type: |
duration |
|
| X |
- DefinitionThe amount of the entity's equity and liabilities. [Refer: Equity; Liabilities] Reference 1: http://www.xbrl.org/2003/role/disclosureRef
-Name IAS
-Number 1
-IssueDate 2023-01-01
-Paragraph 55
-URI https://taxonomy.ifrs.org/xifrs-link?type=IAS&num=1&code=ifrs-tx-2023-en-r&anchor=para_55&doctype=Standard
-URIDate 2023-03-23
| Name: |
ifrs-full_EquityAndLiabilities |
| Namespace Prefix: |
ifrs-full_ |
| Data Type: |
xbrli:monetaryItemType |
| Balance Type: |
credit |
| Period Type: |
instant |
|
| X |
- DefinitionThe amount of identifiable non-monetary assets without physical substance. This amount does not include goodwill. [Refer: Goodwill] Reference 1: http://www.xbrl.org/2003/role/disclosureRef
-Name IAS
-Number 38
-IssueDate 2023-01-01
-Paragraph 118
-Subparagraph e
-URI https://taxonomy.ifrs.org/xifrs-link?type=IAS&num=38&code=ifrs-tx-2023-en-r&anchor=para_118_e&doctype=Standard
-URIDate 2023-03-23
Reference 2: http://www.xbrl.org/2003/role/disclosureRef
-Name IAS
-Number 1
-IssueDate 2023-01-01
-Paragraph 54
-Subparagraph c
-URI https://taxonomy.ifrs.org/xifrs-link?type=IAS&num=1&code=ifrs-tx-2023-en-r&anchor=para_54_c&doctype=Standard
-URIDate 2023-03-23
| Name: |
ifrs-full_IntangibleAssetsOtherThanGoodwill |
| Namespace Prefix: |
ifrs-full_ |
| Data Type: |
xbrli:monetaryItemType |
| Balance Type: |
debit |
| Period Type: |
instant |
|
| X |
- DefinitionThe amount of current inventories. [Refer: Inventories] Reference 1: http://www.xbrl.org/2003/role/disclosureRef
-Name IAS
-Number 2
-IssueDate 2023-01-01
-Paragraph 36
-Subparagraph b
-URI https://taxonomy.ifrs.org/xifrs-link?type=IAS&num=2&code=ifrs-tx-2023-en-r&anchor=para_36_b&doctype=Standard
-URIDate 2023-03-23
Reference 2: http://www.xbrl.org/2003/role/disclosureRef
-Name IAS
-Number 1
-IssueDate 2023-01-01
-Paragraph 54
-Subparagraph g
-URI https://taxonomy.ifrs.org/xifrs-link?type=IAS&num=1&code=ifrs-tx-2023-en-r&anchor=para_54_g&doctype=Standard
-URIDate 2023-03-23
Reference 3: http://www.xbrl.org/2003/role/exampleRef
-Name IAS
-Number 1
-IssueDate 2023-01-01
-Paragraph 68
-URI https://taxonomy.ifrs.org/xifrs-link?type=IAS&num=1&code=ifrs-tx-2023-en-r&anchor=para_68&doctype=Standard
-URIDate 2023-03-23
| Name: |
ifrs-full_Inventories |
| Namespace Prefix: |
ifrs-full_ |
| Data Type: |
xbrli:monetaryItemType |
| Balance Type: |
debit |
| Period Type: |
instant |
|
| X |
- DefinitionThe nominal value of capital issued. Reference 1: http://www.xbrl.org/2003/role/exampleRef
-Name IAS
-Number 1
-IssueDate 2023-01-01
-Paragraph 78
-Subparagraph e
-URI https://taxonomy.ifrs.org/xifrs-link?type=IAS&num=1&code=ifrs-tx-2023-en-r&anchor=para_78_e&doctype=Standard
-URIDate 2023-03-23
| Name: |
ifrs-full_IssuedCapital |
| Namespace Prefix: |
ifrs-full_ |
| Data Type: |
xbrli:monetaryItemType |
| Balance Type: |
credit |
| Period Type: |
instant |
|
| X |
- DefinitionThe amount of a present obligation of the entity to transfer an economic resource as a result of past events. Economic resource is a right that has the potential to produce economic benefits. Reference 1: http://www.xbrl.org/2003/role/disclosureRef
-Name IFRS
-Number 13
-IssueDate 2023-01-01
-Paragraph 93
-Subparagraph a
-URI https://taxonomy.ifrs.org/xifrs-link?type=IFRS&num=13&code=ifrs-tx-2023-en-r&anchor=para_93_a&doctype=Standard
-URIDate 2023-03-23
Reference 2: http://www.xbrl.org/2003/role/disclosureRef
-Name IFRS
-Number 13
-IssueDate 2023-01-01
-Paragraph 93
-Subparagraph b
-URI https://taxonomy.ifrs.org/xifrs-link?type=IFRS&num=13&code=ifrs-tx-2023-en-r&anchor=para_93_b&doctype=Standard
-URIDate 2023-03-23
Reference 3: http://www.xbrl.org/2003/role/disclosureRef
-Name IFRS
-Number 13
-IssueDate 2023-01-01
-Paragraph 93
-Subparagraph e
-URI https://taxonomy.ifrs.org/xifrs-link?type=IFRS&num=13&code=ifrs-tx-2023-en-r&anchor=para_93_e&doctype=Standard
-URIDate 2023-03-23
Reference 4: http://www.xbrl.org/2003/role/disclosureRef
-Name IFRS
-Number 8
-IssueDate 2023-01-01
-Paragraph 28
-Subparagraph d
-URI https://taxonomy.ifrs.org/xifrs-link?type=IFRS&num=8&code=ifrs-tx-2023-en-r&anchor=para_28_d&doctype=Standard
-URIDate 2023-03-23
Reference 5: http://www.xbrl.org/2003/role/disclosureRef
-Name IFRS
-Number 8
-IssueDate 2023-01-01
-Paragraph 23
-URI https://taxonomy.ifrs.org/xifrs-link?type=IFRS&num=8&code=ifrs-tx-2023-en-r&anchor=para_23&doctype=Standard
-URIDate 2023-03-23
Reference 6: http://www.xbrl.org/2003/role/disclosureRef
-Name IAS
-Number 1
-IssueDate 2023-01-01
-Paragraph 55
-URI https://taxonomy.ifrs.org/xifrs-link?type=IAS&num=1&code=ifrs-tx-2023-en-r&anchor=para_55&doctype=Standard
-URIDate 2023-03-23
| Name: |
ifrs-full_Liabilities |
| Namespace Prefix: |
ifrs-full_ |
| Data Type: |
xbrli:monetaryItemType |
| Balance Type: |
credit |
| Period Type: |
instant |
|
| X |
- DefinitionThe amount of non-current lease liabilities. [Refer: Lease liabilities] Reference 1: http://www.xbrl.org/2003/role/disclosureRef
-Name IFRS
-Number 16
-IssueDate 2023-01-01
-Paragraph 47
-Subparagraph b
-URI https://taxonomy.ifrs.org/xifrs-link?type=IFRS&num=16&code=ifrs-tx-2023-en-r&anchor=para_47_b&doctype=Standard
-URIDate 2023-03-23
| Name: |
ifrs-full_NoncurrentLeaseLiabilities |
| Namespace Prefix: |
ifrs-full_ |
| Data Type: |
xbrli:monetaryItemType |
| Balance Type: |
credit |
| Period Type: |
instant |
|
| X |
- DefinitionA component of equity representing reserves within equity, not including retained earnings. [Refer: Retained earnings] Reference 1: http://www.xbrl.org/2003/role/exampleRef
-Name IAS
-Number 1
-IssueDate 2023-01-01
-Paragraph 78
-Subparagraph e
-URI https://taxonomy.ifrs.org/xifrs-link?type=IAS&num=1&code=ifrs-tx-2023-en-r&anchor=para_78_e&doctype=Standard
-URIDate 2023-03-23
| Name: |
ifrs-full_OtherReserves |
| Namespace Prefix: |
ifrs-full_ |
| Data Type: |
xbrli:monetaryItemType |
| Balance Type: |
credit |
| Period Type: |
instant |
|
| X |
- DefinitionThe amount of tangible assets that: (a) are held for use in the production or supply of goods or services, for rental to others, or for administrative purposes; and (b) are expected to be used during more than one period. Note that right-of-use assets are not included. [Contrast: Property, plant and equipment including right-of-use assets] Reference 1: http://www.xbrl.org/2003/role/disclosureRef
-Name IAS
-Number 16
-IssueDate 2023-01-01
-Paragraph 73
-Subparagraph e
-URI https://taxonomy.ifrs.org/xifrs-link?type=IAS&num=16&code=ifrs-tx-2023-en-r&anchor=para_73_e&doctype=Standard
-URIDate 2023-03-23
Reference 2: http://www.xbrl.org/2003/role/disclosureRef
-Name IAS
-Number 1
-IssueDate 2023-01-01
-Paragraph 54
-Subparagraph a
-URI https://taxonomy.ifrs.org/xifrs-link?type=IAS&num=1&code=ifrs-tx-2023-en-r&anchor=para_54_a&doctype=Standard
-URIDate 2023-03-23
| Name: |
ifrs-full_PropertyPlantAndEquipment |
| Namespace Prefix: |
ifrs-full_ |
| Data Type: |
xbrli:monetaryItemType |
| Balance Type: |
debit |
| Period Type: |
instant |
|
| X |
- DefinitionA component of equity representing the entity's cumulative undistributed earnings or deficit. Reference 1: http://www.xbrl.org/2003/role/exampleRef
-Name IAS
-Number 1
-IssueDate 2023-01-01
-Paragraph IG6
-URI https://taxonomy.ifrs.org/xifrs-link?type=IAS&num=1&code=ifrs-tx-2023-en-r&anchor=para_IG6&doctype=Implementation%20Guidance
-URIDate 2023-03-23
Reference 2: http://www.xbrl.org/2003/role/exampleRef
-Name IAS
-Number 1
-IssueDate 2023-01-01
-Paragraph 78
-Subparagraph e
-URI https://taxonomy.ifrs.org/xifrs-link?type=IAS&num=1&code=ifrs-tx-2023-en-r&anchor=para_78_e&doctype=Standard
-URIDate 2023-03-23
| Name: |
ifrs-full_RetainedEarnings |
| Namespace Prefix: |
ifrs-full_ |
| Data Type: |
xbrli:monetaryItemType |
| Balance Type: |
credit |
| Period Type: |
instant |
|
| X |
- DefinitionThe amount of assets that represent a lessee's right to use an underlying asset for the lease term that do not meet the definition of investment property. Underlying asset is an asset that is the subject of a lease, for which the right to use that asset has been provided by a lessor to a lessee. Reference 1: http://www.xbrl.org/2003/role/disclosureRef
-Name IFRS
-Number 16
-IssueDate 2023-01-01
-Paragraph 53
-Subparagraph j
-URI https://taxonomy.ifrs.org/xifrs-link?type=IFRS&num=16&code=ifrs-tx-2023-en-r&anchor=para_53_j&doctype=Standard
-URIDate 2023-03-23
Reference 2: http://www.xbrl.org/2003/role/disclosureRef
-Name IFRS
-Number 16
-IssueDate 2023-01-01
-Paragraph 47
-Subparagraph a
-URI https://taxonomy.ifrs.org/xifrs-link?type=IFRS&num=16&code=ifrs-tx-2023-en-r&anchor=para_47_a&doctype=Standard
-URIDate 2023-03-23
| Name: |
ifrs-full_RightofuseAssets |
| Namespace Prefix: |
ifrs-full_ |
| Data Type: |
xbrli:monetaryItemType |
| Balance Type: |
debit |
| Period Type: |
instant |
|
| X |
- DefinitionThe amount of current borrowings. [Refer: Borrowings] Reference 1: http://www.xbrl.org/2009/role/commonPracticeRef
-Name IAS
-Number 1
-IssueDate 2023-01-01
-Paragraph 55
-URI https://taxonomy.ifrs.org/xifrs-link?type=IAS&num=1&code=ifrs-tx-2023-en-r&anchor=para_55&doctype=Standard
-URIDate 2023-03-23
| Name: |
ifrs-full_ShorttermBorrowings |
| Namespace Prefix: |
ifrs-full_ |
| Data Type: |
xbrli:monetaryItemType |
| Balance Type: |
credit |
| Period Type: |
instant |
|
| X |
- DefinitionThe amount of current trade payables and current other payables. [Refer: Current trade payables; Other current payables] Reference 1: http://www.xbrl.org/2003/role/disclosureRef
-Name IAS
-Number 1
-IssueDate 2023-01-01
-Paragraph 54
-Subparagraph k
-URI https://taxonomy.ifrs.org/xifrs-link?type=IAS&num=1&code=ifrs-tx-2023-en-r&anchor=para_54_k&doctype=Standard
-URIDate 2023-03-23
| Name: |
ifrs-full_TradeAndOtherCurrentPayables |
| Namespace Prefix: |
ifrs-full_ |
| Data Type: |
xbrli:monetaryItemType |
| Balance Type: |
credit |
| Period Type: |
instant |
|
| X |
- DefinitionThe amount of current trade receivables and current other receivables. [Refer: Current trade receivables; Other current receivables] Reference 1: http://www.xbrl.org/2003/role/disclosureRef
-Name IAS
-Number 1
-IssueDate 2023-01-01
-Paragraph 54
-Subparagraph h
-URI https://taxonomy.ifrs.org/xifrs-link?type=IAS&num=1&code=ifrs-tx-2023-en-r&anchor=para_54_h&doctype=Standard
-URIDate 2023-03-23
Reference 2: http://www.xbrl.org/2003/role/disclosureRef
-Name IAS
-Number 1
-IssueDate 2023-01-01
-Paragraph 78
-Subparagraph b
-URI https://taxonomy.ifrs.org/xifrs-link?type=IAS&num=1&code=ifrs-tx-2023-en-r&anchor=para_78_b&doctype=Standard
-URIDate 2023-03-23
| Name: |
ifrs-full_TradeAndOtherCurrentReceivables |
| Namespace Prefix: |
ifrs-full_ |
| Data Type: |
xbrli:monetaryItemType |
| Balance Type: |
debit |
| Period Type: |
instant |
|
| X |
- DefinitionThe amount of deferred revenue.
| Name: |
syta_DeferredRevenuecurrent |
| Namespace Prefix: |
syta_ |
| Data Type: |
xbrli:monetaryItemType |
| Balance Type: |
credit |
| Period Type: |
instant |
|
v3.23.3
Unaudited Condensed Interim Consolidated Statements of Loss and Comprehensive Loss - USD ($)
|
3 Months Ended |
9 Months Ended |
Sep. 30, 2023 |
Sep. 30, 2022 |
Sep. 30, 2023 |
Sep. 30, 2022 |
| Profit or loss [abstract] |
|
|
|
|
| Revenue |
$ 1,842,390
|
$ 2,567,885
|
$ 6,355,744
|
$ 4,370,387
|
| Cost of sales (Note 9) |
(1,352,293)
|
(1,711,782)
|
(4,564,640)
|
(3,150,560)
|
| Gross profit |
490,097
|
856,103
|
1,791,104
|
1,219,827
|
| EXPENSES |
|
|
|
|
| Amortization and depreciation |
453,500
|
351,310
|
1,308,639
|
811,234
|
| Development expenses |
87,652
|
36,567
|
173,102
|
299,937
|
| Selling and marketing (Note 10) |
1,423,760
|
1,225,475
|
3,464,928
|
3,434,201
|
| General and administrative (Note 11) |
1,318,284
|
1,174,041
|
4,414,096
|
4,684,702
|
| Inventory impairment (Note 4) |
|
|
|
303,316
|
| Inventory loss (income) from water damage |
(405,364)
|
|
(405,364)
|
|
| Bad debts (recovered) (Note 3) |
16,512
|
|
26,660
|
63,285
|
| Insurance proceeds from water damage |
(380,077)
|
|
(380,077)
|
|
| Share-based payments (Note 8) |
202,072
|
539,660
|
773,605
|
2,478,695
|
| Total operating expenses |
2,716,339
|
3,327,053
|
9,375,589
|
12,075,370
|
| Net operating loss |
(2,226,242)
|
(2,470,950)
|
(7,584,485)
|
(10,855,543)
|
| OTHER EXPENSES |
|
|
|
|
| Finance expense (Note 12) |
33,684
|
82,720
|
109,033
|
128,446
|
| Foreign exchange |
(109,895)
|
180,367
|
(188,494)
|
199,535
|
| Change in fair value of convertible promissory note (Note 6) |
|
474,514
|
|
3,725,362
|
| Change in fair value of opening warrant liability (Note 7) |
|
|
|
962,350
|
| Change in fair value of warrant liability (Note 7) |
(294,858)
|
(2,680,603)
|
1,561,765
|
(8,125,538)
|
| Transaction costs (Note 13) |
|
|
|
965,247
|
| Total other expenses |
(371,069)
|
(1,943,002)
|
1,482,304
|
(2,144,598)
|
| Net loss for the period |
(1,855,173)
|
(527,948)
|
(9,066,789)
|
(8,710,945)
|
| Other comprehensive income |
|
|
|
|
| Translation adjustment |
|
137,110
|
|
138,628
|
| Comprehensive loss for the period |
$ (1,855,173)
|
$ (390,838)
|
$ (9,066,789)
|
$ (8,572,317)
|
| Weighted average shares (after the 100-1 reverse stock split) (in Shares) |
1,792,431
|
165,351
|
1,052,526
|
147,155
|
| Basic and diluted loss per share after the 100-1 reverse stock split (in Dollars per share) |
$ (1.04)
|
$ (3.19)
|
$ (8.61)
|
$ (59.2)
|
| X |
- DefinitionThe amount of profit (loss) attributable to ordinary equity holders of the parent entity (the numerator) divided by the weighted average number of ordinary shares outstanding during the period (the denominator). Reference 1: http://www.xbrl.org/2003/role/disclosureRef
-Name IAS
-Number 33
-IssueDate 2023-01-01
-Paragraph 66
-URI https://taxonomy.ifrs.org/xifrs-link?type=IAS&num=33&code=ifrs-tx-2023-en-r&anchor=para_66&doctype=Standard
-URIDate 2023-03-23
Reference 2: http://www.xbrl.org/2003/role/disclosureRef
-Name IAS
-Number 33
-IssueDate 2023-01-01
-Paragraph 67
-URI https://taxonomy.ifrs.org/xifrs-link?type=IAS&num=33&code=ifrs-tx-2023-en-r&anchor=para_67&doctype=Standard
-URIDate 2023-03-23
| Name: |
ifrs-full_BasicEarningsLossPerShare |
| Namespace Prefix: |
ifrs-full_ |
| Data Type: |
dtr-types:perShareItemType |
| Balance Type: |
na |
| Period Type: |
duration |
|
| X |
- DefinitionThe amount of all expenses directly or indirectly attributed to the goods or services sold. Attributed expenses include, but are not limited to, costs previously included in the measurement of inventory that has now been sold, such as depreciation and maintenance of factory buildings and equipment used in the production process, unallocated production overheads, and abnormal amounts of production costs of inventories. Reference 1: http://www.xbrl.org/2003/role/disclosureRef
-Name IAS
-Number 1
-IssueDate 2023-01-01
-Paragraph 99
-URI https://taxonomy.ifrs.org/xifrs-link?type=IAS&num=1&code=ifrs-tx-2023-en-r&anchor=para_99&doctype=Standard
-URIDate 2023-03-23
Reference 2: http://www.xbrl.org/2003/role/disclosureRef
-Name IAS
-Number 1
-IssueDate 2023-01-01
-Paragraph 103
-URI https://taxonomy.ifrs.org/xifrs-link?type=IAS&num=1&code=ifrs-tx-2023-en-r&anchor=para_103&doctype=Standard
-URIDate 2023-03-23
| Name: |
ifrs-full_CostOfSales |
| Namespace Prefix: |
ifrs-full_ |
| Data Type: |
xbrli:monetaryItemType |
| Balance Type: |
debit |
| Period Type: |
duration |
|
| X |
- DefinitionThe amount of depreciation and amortisation expense. Depreciation and amortisation are the systematic allocations of depreciable amounts of assets over their useful lives. Reference 1: http://www.xbrl.org/2003/role/disclosureRef
-Name IFRS
-Number 8
-IssueDate 2023-01-01
-Paragraph 28
-Subparagraph e
-URI https://taxonomy.ifrs.org/xifrs-link?type=IFRS&num=8&code=ifrs-tx-2023-en-r&anchor=para_28_e&doctype=Standard
-URIDate 2023-03-23
Reference 2: http://www.xbrl.org/2003/role/disclosureRef
-Name IFRS
-Number 8
-IssueDate 2023-01-01
-Paragraph 23
-Subparagraph e
-URI https://taxonomy.ifrs.org/xifrs-link?type=IFRS&num=8&code=ifrs-tx-2023-en-r&anchor=para_23_e&doctype=Standard
-URIDate 2023-03-23
Reference 3: http://www.xbrl.org/2003/role/disclosureRef
-Name IFRS
-Number 12
-IssueDate 2023-01-01
-Paragraph B13
-Subparagraph d
-URI https://taxonomy.ifrs.org/xifrs-link?type=IFRS&num=12&code=ifrs-tx-2023-en-r&anchor=para_B13_d&doctype=Appendix&subtype=B
-URIDate 2023-03-23
Reference 4: http://www.xbrl.org/2003/role/exampleRef
-Name IAS
-Number 1
-IssueDate 2023-01-01
-Paragraph 102
-URI https://taxonomy.ifrs.org/xifrs-link?type=IAS&num=1&code=ifrs-tx-2023-en-r&anchor=para_102&doctype=Standard
-URIDate 2023-03-23
Reference 5: http://www.xbrl.org/2003/role/disclosureRef
-Name IAS
-Number 1
-IssueDate 2023-01-01
-Paragraph 99
-URI https://taxonomy.ifrs.org/xifrs-link?type=IAS&num=1&code=ifrs-tx-2023-en-r&anchor=para_99&doctype=Standard
-URIDate 2023-03-23
Reference 6: http://www.xbrl.org/2003/role/disclosureRef
-Name IAS
-Number 1
-IssueDate 2023-01-01
-Paragraph 104
-URI https://taxonomy.ifrs.org/xifrs-link?type=IAS&num=1&code=ifrs-tx-2023-en-r&anchor=para_104&doctype=Standard
-URIDate 2023-03-23
| Name: |
ifrs-full_DepreciationAndAmortisationExpense |
| Namespace Prefix: |
ifrs-full_ |
| Data Type: |
xbrli:monetaryItemType |
| Balance Type: |
debit |
| Period Type: |
duration |
|
| X |
- References
+ Details
| Name: |
ifrs-full_ExpenseByNatureAbstract |
| Namespace Prefix: |
ifrs-full_ |
| Data Type: |
xbrli:stringItemType |
| Balance Type: |
na |
| Period Type: |
duration |
|
| X |
- DefinitionThe amount of expense relating to general and administrative activities of the entity. Reference 1: http://www.xbrl.org/2009/role/commonPracticeRef
-Name IAS
-Number 1
-IssueDate 2023-01-01
-Paragraph 112
-Subparagraph c
-URI https://taxonomy.ifrs.org/xifrs-link?type=IAS&num=1&code=ifrs-tx-2023-en-r&anchor=para_112_c&doctype=Standard
-URIDate 2023-03-23
| Name: |
ifrs-full_GeneralAndAdministrativeExpense |
| Namespace Prefix: |
ifrs-full_ |
| Data Type: |
xbrli:monetaryItemType |
| Balance Type: |
debit |
| Period Type: |
duration |
|
| X |
- DefinitionThe amount of revenue less cost of sales. [Refer: Cost of sales; Revenue] Reference 1: http://www.xbrl.org/2003/role/exampleRef
-Name IAS
-Number 1
-IssueDate 2023-01-01
-Paragraph 103
-URI https://taxonomy.ifrs.org/xifrs-link?type=IAS&num=1&code=ifrs-tx-2023-en-r&anchor=para_103&doctype=Standard
-URIDate 2023-03-23
| Name: |
ifrs-full_GrossProfit |
| Namespace Prefix: |
ifrs-full_ |
| Data Type: |
xbrli:monetaryItemType |
| Balance Type: |
credit |
| Period Type: |
duration |
|
| X |
- References
+ Details
| Name: |
ifrs-full_IncomeStatementAbstract |
| Namespace Prefix: |
ifrs-full_ |
| Data Type: |
xbrli:stringItemType |
| Balance Type: |
na |
| Period Type: |
duration |
|
| X |
- DefinitionThe amount of all operating expenses. Reference 1: http://www.xbrl.org/2009/role/commonPracticeRef
-Name IAS
-Number 1
-IssueDate 2023-01-01
-Paragraph 85
-URI https://taxonomy.ifrs.org/xifrs-link?type=IAS&num=1&code=ifrs-tx-2023-en-r&anchor=para_85&doctype=Standard
-URIDate 2023-03-23
| Name: |
ifrs-full_OperatingExpense |
| Namespace Prefix: |
ifrs-full_ |
| Data Type: |
xbrli:monetaryItemType |
| Balance Type: |
debit |
| Period Type: |
duration |
|
| X |
- DefinitionThe amount of income and expense (including reclassification adjustments) that is not recognised in profit or loss as required or permitted by IFRSs. [Refer: IFRSs [member]] Reference 1: http://www.xbrl.org/2003/role/disclosureRef
-Name IFRS
-Number 12
-IssueDate 2023-01-01
-Paragraph B12
-Subparagraph b
-Clause viii
-URI https://taxonomy.ifrs.org/xifrs-link?type=IFRS&num=12&code=ifrs-tx-2023-en-r&anchor=para_B12_b_viii&doctype=Appendix&subtype=B
-URIDate 2023-03-23
Reference 2: http://www.xbrl.org/2003/role/disclosureRef
-Name IAS
-Number 1
-IssueDate 2023-01-01
-Paragraph 81A
-Subparagraph b
-URI https://taxonomy.ifrs.org/xifrs-link?type=IAS&num=1&code=ifrs-tx-2023-en-r&anchor=para_81A_b&doctype=Standard
-URIDate 2023-03-23
Reference 3: http://www.xbrl.org/2003/role/disclosureRef
-Name IAS
-Number 1
-IssueDate 2023-01-01
-Paragraph 91
-Subparagraph a
-URI https://taxonomy.ifrs.org/xifrs-link?type=IAS&num=1&code=ifrs-tx-2023-en-r&anchor=para_91_a&doctype=Standard
-URIDate 2023-03-23
Reference 4: http://www.xbrl.org/2003/role/disclosureRef
-Name IAS
-Number 1
-IssueDate 2023-01-01
-Paragraph 106
-Subparagraph d
-Clause ii
-URI https://taxonomy.ifrs.org/xifrs-link?type=IAS&num=1&code=ifrs-tx-2023-en-r&anchor=para_106_d_ii&doctype=Standard
-URIDate 2023-03-23
| Name: |
ifrs-full_OtherComprehensiveIncome |
| Namespace Prefix: |
ifrs-full_ |
| Data Type: |
xbrli:monetaryItemType |
| Balance Type: |
credit |
| Period Type: |
duration |
|
| X |
- References
+ Details
| Name: |
ifrs-full_OtherComprehensiveIncomeAbstract |
| Namespace Prefix: |
ifrs-full_ |
| Data Type: |
xbrli:stringItemType |
| Balance Type: |
na |
| Period Type: |
duration |
|
| X |
- DefinitionThe amount of operating income (expense) that the entity does not separately disclose in the same statement or note. Reference 1: http://www.xbrl.org/2009/role/commonPracticeRef
-Name IAS
-Number 1
-IssueDate 2023-01-01
-Paragraph 85
-URI https://taxonomy.ifrs.org/xifrs-link?type=IAS&num=1&code=ifrs-tx-2023-en-r&anchor=para_85&doctype=Standard
-URIDate 2023-03-23
| Name: |
ifrs-full_OtherOperatingIncomeExpense |
| Namespace Prefix: |
ifrs-full_ |
| Data Type: |
xbrli:monetaryItemType |
| Balance Type: |
credit |
| Period Type: |
duration |
|
| X |
- DefinitionThe total of income less expenses from continuing and discontinued operations, excluding the components of other comprehensive income. [Refer: Other comprehensive income] Reference 1: http://www.xbrl.org/2003/role/disclosureRef
-Name IAS
-Number 7
-IssueDate 2023-01-01
-Paragraph 18
-Subparagraph b
-URI https://taxonomy.ifrs.org/xifrs-link?type=IAS&num=7&code=ifrs-tx-2023-en-r&anchor=para_18_b&doctype=Standard
-URIDate 2023-03-23
Reference 2: http://www.xbrl.org/2003/role/disclosureRef
-Name IFRS
-Number 1
-IssueDate 2023-01-01
-Paragraph 32
-Subparagraph a
-Clause ii
-URI https://taxonomy.ifrs.org/xifrs-link?type=IFRS&num=1&code=ifrs-tx-2023-en-r&anchor=para_32_a_ii&doctype=Standard
-URIDate 2023-03-23
Reference 3: http://www.xbrl.org/2003/role/disclosureRef
-Name IFRS
-Number 1
-IssueDate 2023-01-01
-Paragraph 24
-Subparagraph b
-URI https://taxonomy.ifrs.org/xifrs-link?type=IFRS&num=1&code=ifrs-tx-2023-en-r&anchor=para_24_b&doctype=Standard
-URIDate 2023-03-23
Reference 4: http://www.xbrl.org/2003/role/disclosureRef
-Name IFRS
-Number 8
-IssueDate 2023-01-01
-Paragraph 28
-Subparagraph b
-URI https://taxonomy.ifrs.org/xifrs-link?type=IFRS&num=8&code=ifrs-tx-2023-en-r&anchor=para_28_b&doctype=Standard
-URIDate 2023-03-23
Reference 5: http://www.xbrl.org/2003/role/disclosureRef
-Name IFRS
-Number 8
-IssueDate 2023-01-01
-Paragraph 23
-URI https://taxonomy.ifrs.org/xifrs-link?type=IFRS&num=8&code=ifrs-tx-2023-en-r&anchor=para_23&doctype=Standard
-URIDate 2023-03-23
Reference 6: http://www.xbrl.org/2003/role/exampleRef
-Name IFRS
-Number 12
-IssueDate 2023-01-01
-Paragraph B10
-Subparagraph b
-URI https://taxonomy.ifrs.org/xifrs-link?type=IFRS&num=12&code=ifrs-tx-2023-en-r&anchor=para_B10_b&doctype=Appendix&subtype=B
-URIDate 2023-03-23
Reference 7: http://www.xbrl.org/2003/role/exampleRef
-Name IFRS
-Number 17
-IssueDate 2023-01-01
-Paragraph 113
-Subparagraph b
-URI https://taxonomy.ifrs.org/xifrs-link?type=IFRS&num=17&code=ifrs-tx-2023-en-r&anchor=para_113_b&doctype=Standard
-URIDate 2023-03-23
Reference 8: http://www.xbrl.org/2003/role/disclosureRef
-Name IAS
-Number 1
-IssueDate 2023-01-01
-Paragraph 81A
-Subparagraph a
-URI https://taxonomy.ifrs.org/xifrs-link?type=IAS&num=1&code=ifrs-tx-2023-en-r&anchor=para_81A_a&doctype=Standard
-URIDate 2023-03-23
Reference 9: http://www.xbrl.org/2003/role/disclosureRef
-Name IAS
-Number 1
-IssueDate 2023-01-01
-Paragraph 106
-Subparagraph d
-Clause i
-URI https://taxonomy.ifrs.org/xifrs-link?type=IAS&num=1&code=ifrs-tx-2023-en-r&anchor=para_106_d_i&doctype=Standard
-URIDate 2023-03-23
| Name: |
ifrs-full_ProfitLoss |
| Namespace Prefix: |
ifrs-full_ |
| Data Type: |
xbrli:monetaryItemType |
| Balance Type: |
credit |
| Period Type: |
duration |
|
| X |
- DefinitionThe profit (loss) from operating activities of the entity. [Refer: Profit (loss)] Reference 1: http://www.xbrl.org/2003/role/exampleRef
-Name IAS
-Number 32
-IssueDate 2023-01-01
-Paragraph IE33
-URI https://taxonomy.ifrs.org/xifrs-link?type=IAS&num=32&code=ifrs-tx-2023-en-r&anchor=para_IE33&doctype=Illustrative%20Examples
-URIDate 2023-03-23
Reference 2: http://www.xbrl.org/2009/role/commonPracticeRef
-Name IAS
-Number 1
-IssueDate 2023-01-01
-Paragraph 85
-URI https://taxonomy.ifrs.org/xifrs-link?type=IAS&num=1&code=ifrs-tx-2023-en-r&anchor=para_85&doctype=Standard
-URIDate 2023-03-23
| Name: |
ifrs-full_ProfitLossFromOperatingActivities |
| Namespace Prefix: |
ifrs-full_ |
| Data Type: |
xbrli:monetaryItemType |
| Balance Type: |
credit |
| Period Type: |
duration |
|
| X |
- DefinitionThe amount of expenditure directly attributable to research or development activities, recognised in profit or loss. Reference 1: http://www.xbrl.org/2003/role/disclosureRef
-Name IAS
-Number 38
-IssueDate 2023-01-01
-Paragraph 126
-URI https://taxonomy.ifrs.org/xifrs-link?type=IAS&num=38&code=ifrs-tx-2023-en-r&anchor=para_126&doctype=Standard
-URIDate 2023-03-23
| Name: |
ifrs-full_ResearchAndDevelopmentExpense |
| Namespace Prefix: |
ifrs-full_ |
| Data Type: |
xbrli:monetaryItemType |
| Balance Type: |
debit |
| Period Type: |
duration |
|
| X |
- DefinitionThe income arising in the course of an entity's ordinary activities. Income is increases in assets, or decreases in liabilities, that result in increases in equity, other than those relating to contributions from holders of equity claims. Reference 1: http://www.xbrl.org/2003/role/disclosureRef
-Name IFRS
-Number 8
-IssueDate 2023-01-01
-Paragraph 28
-Subparagraph a
-URI https://taxonomy.ifrs.org/xifrs-link?type=IFRS&num=8&code=ifrs-tx-2023-en-r&anchor=para_28_a&doctype=Standard
-URIDate 2023-03-23
Reference 2: http://www.xbrl.org/2003/role/disclosureRef
-Name IFRS
-Number 8
-IssueDate 2023-01-01
-Paragraph 23
-Subparagraph a
-URI https://taxonomy.ifrs.org/xifrs-link?type=IFRS&num=8&code=ifrs-tx-2023-en-r&anchor=para_23_a&doctype=Standard
-URIDate 2023-03-23
Reference 3: http://www.xbrl.org/2003/role/disclosureRef
-Name IFRS
-Number 8
-IssueDate 2023-01-01
-Paragraph 32
-URI https://taxonomy.ifrs.org/xifrs-link?type=IFRS&num=8&code=ifrs-tx-2023-en-r&anchor=para_32&doctype=Standard
-URIDate 2023-03-23
Reference 4: http://www.xbrl.org/2003/role/disclosureRef
-Name IFRS
-Number 5
-IssueDate 2023-01-01
-Paragraph 33
-Subparagraph b
-Clause i
-URI https://taxonomy.ifrs.org/xifrs-link?type=IFRS&num=5&code=ifrs-tx-2023-en-r&anchor=para_33_b_i&doctype=Standard
-URIDate 2023-03-23
Reference 5: http://www.xbrl.org/2003/role/disclosureRef
-Name IFRS
-Number 8
-IssueDate 2023-01-01
-Paragraph 33
-Subparagraph a
-URI https://taxonomy.ifrs.org/xifrs-link?type=IFRS&num=8&code=ifrs-tx-2023-en-r&anchor=para_33_a&doctype=Standard
-URIDate 2023-03-23
Reference 6: http://www.xbrl.org/2003/role/disclosureRef
-Name IFRS
-Number 8
-IssueDate 2023-01-01
-Paragraph 34
-URI https://taxonomy.ifrs.org/xifrs-link?type=IFRS&num=8&code=ifrs-tx-2023-en-r&anchor=para_34&doctype=Standard
-URIDate 2023-03-23
Reference 7: http://www.xbrl.org/2003/role/disclosureRef
-Name IFRS
-Number 12
-IssueDate 2023-01-01
-Paragraph B12
-Subparagraph b
-Clause v
-URI https://taxonomy.ifrs.org/xifrs-link?type=IFRS&num=12&code=ifrs-tx-2023-en-r&anchor=para_B12_b_v&doctype=Appendix&subtype=B
-URIDate 2023-03-23
Reference 8: http://www.xbrl.org/2003/role/exampleRef
-Name IFRS
-Number 12
-IssueDate 2023-01-01
-Paragraph B10
-Subparagraph b
-URI https://taxonomy.ifrs.org/xifrs-link?type=IFRS&num=12&code=ifrs-tx-2023-en-r&anchor=para_B10_b&doctype=Appendix&subtype=B
-URIDate 2023-03-23
Reference 9: http://www.xbrl.org/2003/role/disclosureRef
-Name IAS
-Number 1
-IssueDate 2023-01-01
-Paragraph 82
-Subparagraph a
-URI https://taxonomy.ifrs.org/xifrs-link?type=IAS&num=1&code=ifrs-tx-2023-en-r&anchor=para_82_a&doctype=Standard
-URIDate 2023-03-23
Reference 10: http://www.xbrl.org/2003/role/exampleRef
-Name IAS
-Number 1
-IssueDate 2023-01-01
-Paragraph 103
-URI https://taxonomy.ifrs.org/xifrs-link?type=IAS&num=1&code=ifrs-tx-2023-en-r&anchor=para_103&doctype=Standard
-URIDate 2023-03-23
Reference 11: http://www.xbrl.org/2003/role/exampleRef
-Name IAS
-Number 1
-IssueDate 2023-01-01
-Paragraph 102
-URI https://taxonomy.ifrs.org/xifrs-link?type=IAS&num=1&code=ifrs-tx-2023-en-r&anchor=para_102&doctype=Standard
-URIDate 2023-03-23
| Name: |
ifrs-full_Revenue |
| Namespace Prefix: |
ifrs-full_ |
| Data Type: |
xbrli:monetaryItemType |
| Balance Type: |
credit |
| Period Type: |
duration |
|
| X |
- DefinitionThe amount of expense relating to the marketing and selling of goods or services. Reference 1: http://www.xbrl.org/2009/role/commonPracticeRef
-Name IAS
-Number 1
-IssueDate 2023-01-01
-Paragraph 85
-URI https://taxonomy.ifrs.org/xifrs-link?type=IAS&num=1&code=ifrs-tx-2023-en-r&anchor=para_85&doctype=Standard
-URIDate 2023-03-23
| Name: |
ifrs-full_SalesAndMarketingExpense |
| Namespace Prefix: |
ifrs-full_ |
| Data Type: |
xbrli:monetaryItemType |
| Balance Type: |
debit |
| Period Type: |
duration |
|
| X |
- DefinitionThe number of ordinary shares outstanding at the beginning of the period, adjusted by the number of ordinary shares bought back or issued during the period multiplied by a time-weighting factor. Reference 1: http://www.xbrl.org/2003/role/disclosureRef
-Name IAS
-Number 33
-IssueDate 2023-01-01
-Paragraph 70
-Subparagraph b
-URI https://taxonomy.ifrs.org/xifrs-link?type=IAS&num=33&code=ifrs-tx-2023-en-r&anchor=para_70_b&doctype=Standard
-URIDate 2023-03-23
| Name: |
ifrs-full_WeightedAverageShares |
| Namespace Prefix: |
ifrs-full_ |
| Data Type: |
xbrli:sharesItemType |
| Balance Type: |
na |
| Period Type: |
duration |
|
| X |
- DefinitionThe amount of Bad debts (recovered).
| Name: |
syta_BadDebtrecovered |
| Namespace Prefix: |
syta_ |
| Data Type: |
xbrli:monetaryItemType |
| Balance Type: |
debit |
| Period Type: |
duration |
|
| X |
- DefinitionAmount of change in fair value of convertible debenture.
| Name: |
syta_ChangeInFairValueOfConvertibleDebentures |
| Namespace Prefix: |
syta_ |
| Data Type: |
xbrli:monetaryItemType |
| Balance Type: |
debit |
| Period Type: |
duration |
|
| X |
- DefinitionChange in fair value of warrant liability.
| Name: |
syta_ChangeInFairValueOfWarrantLiability |
| Namespace Prefix: |
syta_ |
| Data Type: |
xbrli:monetaryItemType |
| Balance Type: |
debit |
| Period Type: |
duration |
|
| X |
- DefinitionChange in fair value of warrant liability.
| Name: |
syta_ChangesInFairValueOfWarrantLiability |
| Namespace Prefix: |
syta_ |
| Data Type: |
xbrli:monetaryItemType |
| Balance Type: |
debit |
| Period Type: |
duration |
|
| X |
- DefinitionThe amount of finance expense.
| Name: |
syta_FinanceExpense |
| Namespace Prefix: |
syta_ |
| Data Type: |
xbrli:monetaryItemType |
| Balance Type: |
debit |
| Period Type: |
duration |
|
| X |
- DefinitionForeign exchange loss amount.
| Name: |
syta_ForeignExchangeAmount |
| Namespace Prefix: |
syta_ |
| Data Type: |
xbrli:monetaryItemType |
| Balance Type: |
debit |
| Period Type: |
duration |
|
| X |
- DefinitionThe amount of Insurance proceeds from water damage.
| Name: |
syta_InsuranceProceedsFromWaterDamages |
| Namespace Prefix: |
syta_ |
| Data Type: |
xbrli:monetaryItemType |
| Balance Type: |
debit |
| Period Type: |
duration |
|
| X |
- DefinitionThe amount of Inventory Impairment.
| Name: |
syta_InventoryImpairment |
| Namespace Prefix: |
syta_ |
| Data Type: |
xbrli:monetaryItemType |
| Balance Type: |
debit |
| Period Type: |
duration |
|
| X |
- DefinitionThe amount of Inventory loss (income) from water damage.
| Name: |
syta_InventoryLossincomeFromWaterDamages |
| Namespace Prefix: |
syta_ |
| Data Type: |
xbrli:monetaryItemType |
| Balance Type: |
debit |
| Period Type: |
duration |
|
| X |
- References
+ Details
| Name: |
syta_OtherExpensecAbstract |
| Namespace Prefix: |
syta_ |
| Data Type: |
xbrli:stringItemType |
| Balance Type: |
na |
| Period Type: |
duration |
|
| X |
- DefinitionAmount of share-based payments.
| Name: |
syta_SharebasedPayment |
| Namespace Prefix: |
syta_ |
| Data Type: |
xbrli:monetaryItemType |
| Balance Type: |
debit |
| Period Type: |
duration |
|
| X |
- References
+ Details
| Name: |
syta_TranslationAdjustment |
| Namespace Prefix: |
syta_ |
| Data Type: |
xbrli:monetaryItemType |
| Balance Type: |
debit |
| Period Type: |
duration |
|
v3.23.3
| X |
- DefinitionThe amount of profit (loss) attributable to ordinary equity holders of the parent entity (the numerator), divided by the weighted average number of ordinary shares outstanding during the period (the denominator), both adjusted for the effects of all dilutive potential ordinary shares. [Refer: Ordinary shares [member]; Weighted average [member]] Reference 1: http://www.xbrl.org/2003/role/disclosureRef
-Name IAS
-Number 33
-IssueDate 2023-01-01
-Paragraph 66
-URI https://taxonomy.ifrs.org/xifrs-link?type=IAS&num=33&code=ifrs-tx-2023-en-r&anchor=para_66&doctype=Standard
-URIDate 2023-03-23
Reference 2: http://www.xbrl.org/2003/role/disclosureRef
-Name IAS
-Number 33
-IssueDate 2023-01-01
-Paragraph 67
-URI https://taxonomy.ifrs.org/xifrs-link?type=IAS&num=33&code=ifrs-tx-2023-en-r&anchor=para_67&doctype=Standard
-URIDate 2023-03-23
| Name: |
ifrs-full_DilutedEarningsLossPerShare |
| Namespace Prefix: |
ifrs-full_ |
| Data Type: |
dtr-types:perShareItemType |
| Balance Type: |
na |
| Period Type: |
duration |
|
| X |
- References
+ Details
| Name: |
ifrs-full_IncomeStatementAbstract |
| Namespace Prefix: |
ifrs-full_ |
| Data Type: |
xbrli:stringItemType |
| Balance Type: |
na |
| Period Type: |
duration |
|
v3.23.3
Unaudited Condensed Interim Consolidated Statement of Changes in Shareholders’ Equity - USD ($)
|
Share Capital |
Reserves |
Accumulated other comprehensive Income (loss) |
Deficit |
Total |
| Balance at Dec. 31, 2021 |
$ 54,655,244
|
$ 10,389,555
|
$ (38,739)
|
$ (62,519,412)
|
$ 2,486,648
|
| Balance (in Shares) at Dec. 31, 2021 |
52,767
|
|
|
|
|
| Shares issued on acquisition of ClearRF |
$ 190,095
|
|
|
|
190,095
|
| Shares issued on acquisition of ClearRF (in Shares) |
1,390
|
|
|
|
|
| Share issued on capital raise |
$ 10,936,974
|
307,189
|
|
|
11,244,163
|
| Share issued on capital raise (in Shares) |
72,157
|
|
|
|
|
| Share issuance costs on capital raise |
$ (1,051,647)
|
|
|
|
(1,051,647)
|
| Pre-funded warrants exercised |
$ 2,575,200
|
|
|
|
2,575,200
|
| Pre-funded warrants exercised (in Shares) |
14,800
|
|
|
|
|
| Shares issued for debt |
$ 2,669,227
|
|
|
|
2,669,227
|
| Shares issued for debt (in Shares) |
29,297
|
|
|
|
|
| Issuance of shares in conversion of RSU |
$ 22,200
|
|
|
|
22,200
|
| Issuance of shares in conversion of RSU (in Shares) |
300
|
|
|
|
|
| Share based payments |
|
2,478,695
|
|
|
2,478,695
|
| Translation adjustment |
|
|
(138,628)
|
|
(138,628)
|
| Net loss |
|
|
|
(8,710,945)
|
(8,710,945)
|
| Balance at Sep. 30, 2022 |
$ 69,997,293
|
13,175,439
|
(177,367)
|
(71,230,357)
|
11,765,008
|
| Balance (in Shares) at Sep. 30, 2022 |
170,711
|
|
|
|
|
| Balance at Dec. 31, 2022 |
$ 73,312,866
|
13,647,399
|
98,870
|
(77,818,663)
|
9,240,472
|
| Balance (in Shares) at Dec. 31, 2022 |
448,686
|
|
|
|
|
| Warrants exercised |
$ 7,583,617
|
(3,975,046)
|
|
|
3,608,571
|
| Warrants exercised (in Shares) |
390,748
|
|
|
|
|
| Warrants transferred from liability |
|
3,975,046
|
|
|
3,975,046
|
| Share issued on capital raise |
$ 4,565,250
|
|
|
|
4,565,250
|
| Share issued on capital raise (in Shares) |
1,014,500
|
|
|
|
|
| Share issuance costs on capital raise |
$ (759,121)
|
|
|
|
(759,121)
|
| Pre-funded warrants exercised |
|
|
|
|
|
| Shares issued for debt |
|
|
|
|
|
| Share based payments |
|
773,605
|
|
|
773,605
|
| Translation adjustment |
|
|
|
|
|
| Net loss |
|
|
|
(9,066,789)
|
(9,066,789)
|
| Balance at Sep. 30, 2023 |
$ 84,702,612
|
$ 14,421,004
|
$ 98,870
|
$ (86,885,452)
|
$ 12,337,034
|
| Balance (in Shares) at Sep. 30, 2023 |
1,853,955
|
|
|
|
|
| X |
- DefinitionThe amount of residual interest in the assets of the entity after deducting all its liabilities. Reference 1: http://www.xbrl.org/2003/role/disclosureRef
-Name IFRS
-Number 1
-IssueDate 2023-01-01
-Paragraph 24
-Subparagraph a
-URI https://taxonomy.ifrs.org/xifrs-link?type=IFRS&num=1&code=ifrs-tx-2023-en-r&anchor=para_24_a&doctype=Standard
-URIDate 2023-03-23
Reference 2: http://www.xbrl.org/2003/role/disclosureRef
-Name IFRS
-Number 1
-IssueDate 2023-01-01
-Paragraph 32
-Subparagraph a
-Clause i
-URI https://taxonomy.ifrs.org/xifrs-link?type=IFRS&num=1&code=ifrs-tx-2023-en-r&anchor=para_32_a_i&doctype=Standard
-URIDate 2023-03-23
Reference 3: http://www.xbrl.org/2003/role/disclosureRef
-Name IFRS
-Number 13
-IssueDate 2023-01-01
-Paragraph 93
-Subparagraph a
-URI https://taxonomy.ifrs.org/xifrs-link?type=IFRS&num=13&code=ifrs-tx-2023-en-r&anchor=para_93_a&doctype=Standard
-URIDate 2023-03-23
Reference 4: http://www.xbrl.org/2003/role/disclosureRef
-Name IFRS
-Number 13
-IssueDate 2023-01-01
-Paragraph 93
-Subparagraph b
-URI https://taxonomy.ifrs.org/xifrs-link?type=IFRS&num=13&code=ifrs-tx-2023-en-r&anchor=para_93_b&doctype=Standard
-URIDate 2023-03-23
Reference 5: http://www.xbrl.org/2003/role/disclosureRef
-Name IFRS
-Number 13
-IssueDate 2023-01-01
-Paragraph 93
-Subparagraph e
-URI https://taxonomy.ifrs.org/xifrs-link?type=IFRS&num=13&code=ifrs-tx-2023-en-r&anchor=para_93_e&doctype=Standard
-URIDate 2023-03-23
Reference 6: http://www.xbrl.org/2003/role/disclosureRef
-Name IAS
-Number 1
-IssueDate 2023-01-01
-Paragraph 55
-URI https://taxonomy.ifrs.org/xifrs-link?type=IAS&num=1&code=ifrs-tx-2023-en-r&anchor=para_55&doctype=Standard
-URIDate 2023-03-23
Reference 7: http://www.xbrl.org/2003/role/disclosureRef
-Name IAS
-Number 1
-IssueDate 2023-01-01
-Paragraph 78
-Subparagraph e
-URI https://taxonomy.ifrs.org/xifrs-link?type=IAS&num=1&code=ifrs-tx-2023-en-r&anchor=para_78_e&doctype=Standard
-URIDate 2023-03-23
| Name: |
ifrs-full_Equity |
| Namespace Prefix: |
ifrs-full_ |
| Data Type: |
xbrli:monetaryItemType |
| Balance Type: |
credit |
| Period Type: |
instant |
|
| X |
- DefinitionThe increase (decrease) in the number of ordinary shares issued. [Refer: Ordinary shares [member]] Reference 1: http://www.xbrl.org/2009/role/commonPracticeRef
-Name IAS
-Number 1
-IssueDate 2023-01-01
-Paragraph 112
-Subparagraph c
-URI https://taxonomy.ifrs.org/xifrs-link?type=IAS&num=1&code=ifrs-tx-2023-en-r&anchor=para_112_c&doctype=Standard
-URIDate 2023-03-23
| Name: |
ifrs-full_IncreaseDecreaseInNumberOfOrdinarySharesIssued |
| Namespace Prefix: |
ifrs-full_ |
| Data Type: |
xbrli:sharesItemType |
| Balance Type: |
na |
| Period Type: |
duration |
|
| X |
- DefinitionThe increase (decrease) in equity through changes in ownership interests in subsidiaries that do not result in loss of control. [Refer: Subsidiaries [member]] Reference 1: http://www.xbrl.org/2003/role/disclosureRef
-Name IAS
-Number 1
-IssueDate 2023-01-01
-Paragraph 106
-Subparagraph d
-Clause iii
-URI https://taxonomy.ifrs.org/xifrs-link?type=IAS&num=1&code=ifrs-tx-2023-en-r&anchor=para_106_d_iii&doctype=Standard
-URIDate 2023-03-23
| Name: |
ifrs-full_IncreaseDecreaseThroughChangesInOwnershipInterestsInSubsidiariesThatDoNotResultInLossOfControl |
| Namespace Prefix: |
ifrs-full_ |
| Data Type: |
xbrli:monetaryItemType |
| Balance Type: |
credit |
| Period Type: |
duration |
|
| X |
- DefinitionThe increase (decrease) in equity resulting from the exercise of warrants. Reference 1: http://www.xbrl.org/2009/role/commonPracticeRef
-Name IAS
-Number 1
-IssueDate 2023-01-01
-Paragraph 106
-Subparagraph d
-URI https://taxonomy.ifrs.org/xifrs-link?type=IAS&num=1&code=ifrs-tx-2023-en-r&anchor=para_106_d&doctype=Standard
-URIDate 2023-03-23
| Name: |
ifrs-full_IncreaseDecreaseThroughExerciseOfWarrantsEquity |
| Namespace Prefix: |
ifrs-full_ |
| Data Type: |
xbrli:monetaryItemType |
| Balance Type: |
credit |
| Period Type: |
duration |
|
| X |
- DefinitionThe increase (decrease) in equity resulting from share-based payment transactions. [Refer: Equity] Reference 1: http://www.xbrl.org/2003/role/disclosureRef
-Name IAS
-Number 1
-IssueDate 2023-01-01
-Paragraph 106
-Subparagraph d
-Clause iii
-URI https://taxonomy.ifrs.org/xifrs-link?type=IAS&num=1&code=ifrs-tx-2023-en-r&anchor=para_106_d_iii&doctype=Standard
-URIDate 2023-03-23
| Name: |
ifrs-full_IncreaseDecreaseThroughSharebasedPaymentTransactions |
| Namespace Prefix: |
ifrs-full_ |
| Data Type: |
xbrli:monetaryItemType |
| Balance Type: |
credit |
| Period Type: |
duration |
|
| X |
- DefinitionThe increase (decrease) in equity resulting from transactions with owners. Reference 1: http://www.xbrl.org/2009/role/commonPracticeRef
-Name IAS
-Number 1
-IssueDate 2023-01-01
-Paragraph 106
-Subparagraph d
-URI https://taxonomy.ifrs.org/xifrs-link?type=IAS&num=1&code=ifrs-tx-2023-en-r&anchor=para_106_d&doctype=Standard
-URIDate 2023-03-23
| Name: |
ifrs-full_IncreaseDecreaseThroughTransactionsWithOwners |
| Namespace Prefix: |
ifrs-full_ |
| Data Type: |
xbrli:monetaryItemType |
| Balance Type: |
credit |
| Period Type: |
duration |
|
| X |
- DefinitionThe increase in equity through the issue of equity instruments. Reference 1: http://www.xbrl.org/2003/role/disclosureRef
-Name IAS
-Number 1
-IssueDate 2023-01-01
-Paragraph 106
-Subparagraph d
-Clause iii
-URI https://taxonomy.ifrs.org/xifrs-link?type=IAS&num=1&code=ifrs-tx-2023-en-r&anchor=para_106_d_iii&doctype=Standard
-URIDate 2023-03-23
| Name: |
ifrs-full_IssueOfEquity |
| Namespace Prefix: |
ifrs-full_ |
| Data Type: |
xbrli:monetaryItemType |
| Balance Type: |
credit |
| Period Type: |
duration |
|
| X |
- DefinitionThe number of shares that have been authorised and issued, reduced by treasury shares held. [Refer: Treasury shares] Reference 1: http://www.xbrl.org/2003/role/disclosureRef
-Name IAS
-Number 1
-IssueDate 2023-01-01
-Paragraph 79
-Subparagraph a
-Clause iv
-URI https://taxonomy.ifrs.org/xifrs-link?type=IAS&num=1&code=ifrs-tx-2023-en-r&anchor=para_79_a_iv&doctype=Standard
-URIDate 2023-03-23
| Name: |
ifrs-full_NumberOfSharesOutstanding |
| Namespace Prefix: |
ifrs-full_ |
| Data Type: |
xbrli:sharesItemType |
| Balance Type: |
na |
| Period Type: |
instant |
|
| X |
- DefinitionThe total of income less expenses from continuing and discontinued operations, excluding the components of other comprehensive income. [Refer: Other comprehensive income] Reference 1: http://www.xbrl.org/2003/role/disclosureRef
-Name IAS
-Number 7
-IssueDate 2023-01-01
-Paragraph 18
-Subparagraph b
-URI https://taxonomy.ifrs.org/xifrs-link?type=IAS&num=7&code=ifrs-tx-2023-en-r&anchor=para_18_b&doctype=Standard
-URIDate 2023-03-23
Reference 2: http://www.xbrl.org/2003/role/disclosureRef
-Name IFRS
-Number 1
-IssueDate 2023-01-01
-Paragraph 32
-Subparagraph a
-Clause ii
-URI https://taxonomy.ifrs.org/xifrs-link?type=IFRS&num=1&code=ifrs-tx-2023-en-r&anchor=para_32_a_ii&doctype=Standard
-URIDate 2023-03-23
Reference 3: http://www.xbrl.org/2003/role/disclosureRef
-Name IFRS
-Number 1
-IssueDate 2023-01-01
-Paragraph 24
-Subparagraph b
-URI https://taxonomy.ifrs.org/xifrs-link?type=IFRS&num=1&code=ifrs-tx-2023-en-r&anchor=para_24_b&doctype=Standard
-URIDate 2023-03-23
Reference 4: http://www.xbrl.org/2003/role/disclosureRef
-Name IFRS
-Number 8
-IssueDate 2023-01-01
-Paragraph 28
-Subparagraph b
-URI https://taxonomy.ifrs.org/xifrs-link?type=IFRS&num=8&code=ifrs-tx-2023-en-r&anchor=para_28_b&doctype=Standard
-URIDate 2023-03-23
Reference 5: http://www.xbrl.org/2003/role/disclosureRef
-Name IFRS
-Number 8
-IssueDate 2023-01-01
-Paragraph 23
-URI https://taxonomy.ifrs.org/xifrs-link?type=IFRS&num=8&code=ifrs-tx-2023-en-r&anchor=para_23&doctype=Standard
-URIDate 2023-03-23
Reference 6: http://www.xbrl.org/2003/role/exampleRef
-Name IFRS
-Number 12
-IssueDate 2023-01-01
-Paragraph B10
-Subparagraph b
-URI https://taxonomy.ifrs.org/xifrs-link?type=IFRS&num=12&code=ifrs-tx-2023-en-r&anchor=para_B10_b&doctype=Appendix&subtype=B
-URIDate 2023-03-23
Reference 7: http://www.xbrl.org/2003/role/exampleRef
-Name IFRS
-Number 17
-IssueDate 2023-01-01
-Paragraph 113
-Subparagraph b
-URI https://taxonomy.ifrs.org/xifrs-link?type=IFRS&num=17&code=ifrs-tx-2023-en-r&anchor=para_113_b&doctype=Standard
-URIDate 2023-03-23
Reference 8: http://www.xbrl.org/2003/role/disclosureRef
-Name IAS
-Number 1
-IssueDate 2023-01-01
-Paragraph 81A
-Subparagraph a
-URI https://taxonomy.ifrs.org/xifrs-link?type=IAS&num=1&code=ifrs-tx-2023-en-r&anchor=para_81A_a&doctype=Standard
-URIDate 2023-03-23
Reference 9: http://www.xbrl.org/2003/role/disclosureRef
-Name IAS
-Number 1
-IssueDate 2023-01-01
-Paragraph 106
-Subparagraph d
-Clause i
-URI https://taxonomy.ifrs.org/xifrs-link?type=IAS&num=1&code=ifrs-tx-2023-en-r&anchor=para_106_d_i&doctype=Standard
-URIDate 2023-03-23
| Name: |
ifrs-full_ProfitLoss |
| Namespace Prefix: |
ifrs-full_ |
| Data Type: |
xbrli:monetaryItemType |
| Balance Type: |
credit |
| Period Type: |
duration |
|
| X |
- DefinitionIssuance of shares in conversion of ristricted stock units.
| Name: |
syta_IssuanceOfSharesInConversionOfRistrictedStockUnits |
| Namespace Prefix: |
syta_ |
| Data Type: |
xbrli:monetaryItemType |
| Balance Type: |
credit |
| Period Type: |
duration |
|
| X |
- DefinitionPre-funded warrants exercised.
| Name: |
syta_PrefundedWarrantsExercised |
| Namespace Prefix: |
syta_ |
| Data Type: |
xbrli:monetaryItemType |
| Balance Type: |
credit |
| Period Type: |
duration |
|
| X |
- DefinitionPre-funded warrants exercised shares.
| Name: |
syta_PrefundedWarrantsExercisedShares |
| Namespace Prefix: |
syta_ |
| Data Type: |
xbrli:sharesItemType |
| Balance Type: |
na |
| Period Type: |
duration |
|
| X |
- DefinitionShare Issuance costs on capital raise.
| Name: |
syta_ShareIssuanceCostsOnCapitalRaise |
| Namespace Prefix: |
syta_ |
| Data Type: |
xbrli:monetaryItemType |
| Balance Type: |
credit |
| Period Type: |
duration |
|
| X |
- DefinitionShare issued on capital raise.
| Name: |
syta_ShareIssuedOnCapitalRaise |
| Namespace Prefix: |
syta_ |
| Data Type: |
xbrli:sharesItemType |
| Balance Type: |
na |
| Period Type: |
duration |
|
| X |
- DefinitionShares issued for debt of new issues.
| Name: |
syta_SharesIssuedForDebtShares |
| Namespace Prefix: |
syta_ |
| Data Type: |
xbrli:sharesItemType |
| Balance Type: |
na |
| Period Type: |
duration |
|
| X |
- DefinitionShares issued on acquisition.
| Name: |
syta_SharesIssuedOnAcquisition |
| Namespace Prefix: |
syta_ |
| Data Type: |
xbrli:sharesItemType |
| Balance Type: |
na |
| Period Type: |
duration |
|
| X |
- DefinitionShares issued on acquisition.
| Name: |
syta_StockIssuedDuringPeriodValueIssuedForAcquisition |
| Namespace Prefix: |
syta_ |
| Data Type: |
xbrli:monetaryItemType |
| Balance Type: |
credit |
| Period Type: |
duration |
|
| X |
- DefinitionWarrants exercised shares.
| Name: |
syta_WarrantsExercisedinShares |
| Namespace Prefix: |
syta_ |
| Data Type: |
xbrli:sharesItemType |
| Balance Type: |
na |
| Period Type: |
duration |
|
v3.23.3
Unaudited Condensed Interim Consolidated Statements of Cash Flows - USD ($)
|
9 Months Ended |
Sep. 30, 2023 |
Sep. 30, 2022 |
| Operating activities |
|
|
| Net loss for the year |
$ (9,066,789)
|
$ (8,710,945)
|
| Items not affecting cash: |
|
|
| Amortization and depreciation |
1,308,639
|
811,234
|
| Bad debt expense |
26,660
|
63,285
|
| Impairment of inventory |
|
303,316
|
| Fair value changes on convertible debenture |
|
3,725,362
|
| Fair value changes on opening warrant liability |
|
962,350
|
| Fair value changes on warrant liability |
1,561,765
|
(8,125,538)
|
| Interest expense, net of repayments |
|
|
| Foreign exchange |
13,436
|
|
| Income on inventory due to water damage |
(405,364)
|
|
| Share based payments |
773,605
|
2,478,695
|
| Net Change in non-cash working capital |
|
|
| Trade receivables |
(631,278)
|
(326,749)
|
| Prepaids |
(54,974)
|
(390,022)
|
| Inventory |
1,596,000
|
(2,903,506)
|
| Advances to suppliers |
(1,385,957)
|
(638,831)
|
| Accounts payable and accrued liabilities |
(489,431)
|
(528,817)
|
| Deferred revenues |
(149,600)
|
|
| Net cash used in operating activities |
(6,903,288)
|
(13,280,167)
|
| Investing activities |
|
|
| Intangible asset additions |
(2,051,354)
|
(2,295,839)
|
| Equipment additions |
(3,737)
|
(12,159)
|
| Proceeds of long term deposit |
|
18,999
|
| Acquisition of ClearRF |
|
(155,014)
|
| Net cash used in investing activities |
(2,055,091)
|
(2,444,013)
|
| Financing activities |
|
|
| Lease payments |
(227,829)
|
(150,831)
|
| Bank loan |
531,521
|
(27,159)
|
| Convertible debt issued, net of repayments |
|
(4,000,000)
|
| Proceeds on share issuance, net of share issuance cost |
4,565,250
|
19,268,584
|
| Transaction costs |
(1,068,121)
|
|
| Exercise of warrants |
3,608,571
|
14,800
|
| Net cash from financing activities |
7,409,392
|
15,105,394
|
| Effect of foreign exchange on cash |
1,440
|
(12,330)
|
| Change in cash and restricted cash for the period |
(1,547,587)
|
(631,116)
|
| Cash and restricted cash, beginning of the period |
1,913,742
|
1,619,742
|
| Cash and restricted cash, end of period |
$ 366,155
|
$ 988,626
|
| X |
- DefinitionAdjustments for decrease (increase) in inventories to reconcile profit (loss) to net cash flow from (used in) operating activities. [Refer: Inventories; Profit (loss)] Reference 1: http://www.xbrl.org/2009/role/commonPracticeRef
-Name IAS
-Number 7
-IssueDate 2023-01-01
-Paragraph 20
-Subparagraph a
-URI https://taxonomy.ifrs.org/xifrs-link?type=IAS&num=7&code=ifrs-tx-2023-en-r&anchor=para_20_a&doctype=Standard
-URIDate 2023-03-23
| Name: |
ifrs-full_AdjustmentsForDecreaseIncreaseInInventories |
| Namespace Prefix: |
ifrs-full_ |
| Data Type: |
xbrli:monetaryItemType |
| Balance Type: |
debit |
| Period Type: |
duration |
|
| X |
- DefinitionAdjustments for the decrease (increase) in prepaid expenses to reconcile profit (loss) to net cash flow from (used in) operating activities. [Refer: Current prepaid expenses; Profit (loss)] Reference 1: http://www.xbrl.org/2009/role/commonPracticeRef
-Name IAS
-Number 7
-IssueDate 2023-01-01
-Paragraph 20
-URI https://taxonomy.ifrs.org/xifrs-link?type=IAS&num=7&code=ifrs-tx-2023-en-r&anchor=para_20&doctype=Standard
-URIDate 2023-03-23
| Name: |
ifrs-full_AdjustmentsForDecreaseIncreaseInPrepaidExpenses |
| Namespace Prefix: |
ifrs-full_ |
| Data Type: |
xbrli:monetaryItemType |
| Balance Type: |
debit |
| Period Type: |
duration |
|
| X |
- DefinitionAdjustments for decrease (increase) in trade and other receivables to reconcile profit (loss) to net cash flow from (used in) operating activities. [Refer: Trade and other receivables; Profit (loss)] Reference 1: http://www.xbrl.org/2009/role/commonPracticeRef
-Name IAS
-Number 7
-IssueDate 2023-01-01
-Paragraph 20
-URI https://taxonomy.ifrs.org/xifrs-link?type=IAS&num=7&code=ifrs-tx-2023-en-r&anchor=para_20&doctype=Standard
-URIDate 2023-03-23
| Name: |
ifrs-full_AdjustmentsForDecreaseIncreaseInTradeAndOtherReceivables |
| Namespace Prefix: |
ifrs-full_ |
| Data Type: |
xbrli:monetaryItemType |
| Balance Type: |
debit |
| Period Type: |
duration |
|
| X |
- DefinitionAdjustments for deferred tax expense to reconcile profit (loss) to net cash flow from (used in) operating activities. [Refer: Deferred tax expense (income); Profit (loss)] Reference 1: http://www.xbrl.org/2009/role/commonPracticeRef
-Name IAS
-Number 7
-IssueDate 2023-01-01
-Paragraph 20
-URI https://taxonomy.ifrs.org/xifrs-link?type=IAS&num=7&code=ifrs-tx-2023-en-r&anchor=para_20&doctype=Standard
-URIDate 2023-03-23
| Name: |
ifrs-full_AdjustmentsForDeferredTaxExpense |
| Namespace Prefix: |
ifrs-full_ |
| Data Type: |
xbrli:monetaryItemType |
| Balance Type: |
debit |
| Period Type: |
duration |
|
| X |
- DefinitionAdjustments for depreciation and amortisation expense to reconcile profit (loss) to net cash flow from (used in) operating activities. [Refer: Depreciation and amortisation expense; Profit (loss)] Reference 1: http://www.xbrl.org/2009/role/commonPracticeRef
-Name IAS
-Number 7
-IssueDate 2023-01-01
-Paragraph 20
-Subparagraph b
-URI https://taxonomy.ifrs.org/xifrs-link?type=IAS&num=7&code=ifrs-tx-2023-en-r&anchor=para_20_b&doctype=Standard
-URIDate 2023-03-23
| Name: |
ifrs-full_AdjustmentsForDepreciationAndAmortisationExpense |
| Namespace Prefix: |
ifrs-full_ |
| Data Type: |
xbrli:monetaryItemType |
| Balance Type: |
debit |
| Period Type: |
duration |
|
| X |
- DefinitionAdjustments for share-based payments to reconcile profit (loss) to net cash flow from (used in) operating activities. [Refer: Profit (loss)] Reference 1: http://www.xbrl.org/2009/role/commonPracticeRef
-Name IAS
-Number 7
-IssueDate 2023-01-01
-Paragraph 20
-Subparagraph b
-URI https://taxonomy.ifrs.org/xifrs-link?type=IAS&num=7&code=ifrs-tx-2023-en-r&anchor=para_20_b&doctype=Standard
-URIDate 2023-03-23
| Name: |
ifrs-full_AdjustmentsForSharebasedPayments |
| Namespace Prefix: |
ifrs-full_ |
| Data Type: |
xbrli:monetaryItemType |
| Balance Type: |
debit |
| Period Type: |
duration |
|
| X |
- DefinitionAdjustments for unrealised foreign exchange losses (gains) to reconcile profit (loss) to net cash flow from (used in) operating activities. [Refer: Profit (loss)] Reference 1: http://www.xbrl.org/2009/role/commonPracticeRef
-Name IAS
-Number 7
-IssueDate 2023-01-01
-Paragraph 20
-Subparagraph b
-URI https://taxonomy.ifrs.org/xifrs-link?type=IAS&num=7&code=ifrs-tx-2023-en-r&anchor=para_20_b&doctype=Standard
-URIDate 2023-03-23
Reference 2: http://www.xbrl.org/2003/role/exampleRef
-Name IAS
-Number 7
-IssueDate 2023-01-01
-Section A Statement of cash flows for an entity other than a financial institution
-URI https://taxonomy.ifrs.org/xifrs-link?type=IAS&num=7&code=ifrs-tx-2023-en-r&doctype=Illustrative%20Examples&dita_xref=IAS07_IE_A_TI
-URIDate 2023-03-23
| Name: |
ifrs-full_AdjustmentsForUnrealisedForeignExchangeLossesGains |
| Namespace Prefix: |
ifrs-full_ |
| Data Type: |
xbrli:monetaryItemType |
| Balance Type: |
debit |
| Period Type: |
duration |
|
| X |
- DefinitionThe amount of cash on hand and demand deposits, along with short-term, highly liquid investments that are readily convertible to known amounts of cash and that are subject to an insignificant risk of changes in value. [Refer: Cash; Cash equivalents] Reference 1: http://www.xbrl.org/2003/role/disclosureRef
-Name IAS
-Number 7
-IssueDate 2023-01-01
-Paragraph 45
-URI https://taxonomy.ifrs.org/xifrs-link?type=IAS&num=7&code=ifrs-tx-2023-en-r&anchor=para_45&doctype=Standard
-URIDate 2023-03-23
Reference 2: http://www.xbrl.org/2003/role/disclosureRef
-Name IFRS
-Number 12
-IssueDate 2023-01-01
-Paragraph B13
-Subparagraph a
-URI https://taxonomy.ifrs.org/xifrs-link?type=IFRS&num=12&code=ifrs-tx-2023-en-r&anchor=para_B13_a&doctype=Appendix&subtype=B
-URIDate 2023-03-23
Reference 3: http://www.xbrl.org/2003/role/disclosureRef
-Name IAS
-Number 1
-IssueDate 2023-01-01
-Paragraph 54
-Subparagraph i
-URI https://taxonomy.ifrs.org/xifrs-link?type=IAS&num=1&code=ifrs-tx-2023-en-r&anchor=para_54_i&doctype=Standard
-URIDate 2023-03-23
| Name: |
ifrs-full_CashAndCashEquivalents |
| Namespace Prefix: |
ifrs-full_ |
| Data Type: |
xbrli:monetaryItemType |
| Balance Type: |
debit |
| Period Type: |
instant |
|
| X |
- DefinitionThe cash flows from (used in) financing activities, which are activities that result in changes in the size and composition of the contributed equity and borrowings of the entity. Reference 1: http://www.xbrl.org/2003/role/disclosureRef
-Name IAS
-Number 7
-IssueDate 2023-01-01
-Paragraph 10
-URI https://taxonomy.ifrs.org/xifrs-link?type=IAS&num=7&code=ifrs-tx-2023-en-r&anchor=para_10&doctype=Standard
-URIDate 2023-03-23
Reference 2: http://www.xbrl.org/2003/role/disclosureRef
-Name IAS
-Number 7
-IssueDate 2023-01-01
-Paragraph 50
-Subparagraph d
-URI https://taxonomy.ifrs.org/xifrs-link?type=IAS&num=7&code=ifrs-tx-2023-en-r&anchor=para_50_d&doctype=Standard
-URIDate 2023-03-23
| Name: |
ifrs-full_CashFlowsFromUsedInFinancingActivities |
| Namespace Prefix: |
ifrs-full_ |
| Data Type: |
xbrli:monetaryItemType |
| Balance Type: |
debit |
| Period Type: |
duration |
|
| X |
- DefinitionThe cash flows from (used in) investing activities, which are the acquisition and disposal of long-term assets and other investments not included in cash equivalents. Reference 1: http://www.xbrl.org/2003/role/disclosureRef
-Name IAS
-Number 7
-IssueDate 2023-01-01
-Paragraph 10
-URI https://taxonomy.ifrs.org/xifrs-link?type=IAS&num=7&code=ifrs-tx-2023-en-r&anchor=para_10&doctype=Standard
-URIDate 2023-03-23
Reference 2: http://www.xbrl.org/2003/role/disclosureRef
-Name IAS
-Number 7
-IssueDate 2023-01-01
-Paragraph 50
-Subparagraph d
-URI https://taxonomy.ifrs.org/xifrs-link?type=IAS&num=7&code=ifrs-tx-2023-en-r&anchor=para_50_d&doctype=Standard
-URIDate 2023-03-23
| Name: |
ifrs-full_CashFlowsFromUsedInInvestingActivities |
| Namespace Prefix: |
ifrs-full_ |
| Data Type: |
xbrli:monetaryItemType |
| Balance Type: |
debit |
| Period Type: |
duration |
|
| X |
- DefinitionThe cash flows from (used in) operating activities, which are the principal revenue-producing activities of the entity and other activities that are not investing or financing activities. [Refer: Revenue] Reference 1: http://www.xbrl.org/2003/role/disclosureRef
-Name IAS
-Number 7
-IssueDate 2023-01-01
-Paragraph 10
-URI https://taxonomy.ifrs.org/xifrs-link?type=IAS&num=7&code=ifrs-tx-2023-en-r&anchor=para_10&doctype=Standard
-URIDate 2023-03-23
Reference 2: http://www.xbrl.org/2003/role/disclosureRef
-Name IAS
-Number 7
-IssueDate 2023-01-01
-Paragraph 50
-Subparagraph d
-URI https://taxonomy.ifrs.org/xifrs-link?type=IAS&num=7&code=ifrs-tx-2023-en-r&anchor=para_50_d&doctype=Standard
-URIDate 2023-03-23
| Name: |
ifrs-full_CashFlowsFromUsedInOperatingActivities |
| Namespace Prefix: |
ifrs-full_ |
| Data Type: |
xbrli:monetaryItemType |
| Balance Type: |
na |
| Period Type: |
duration |
|
| X |
- DefinitionThe effect of exchange rate changes on cash and cash equivalents held or due in a foreign currency. [Refer: Cash and cash equivalents] Reference 1: http://www.xbrl.org/2003/role/disclosureRef
-Name IAS
-Number 7
-IssueDate 2023-01-01
-Paragraph 25
-URI https://taxonomy.ifrs.org/xifrs-link?type=IAS&num=7&code=ifrs-tx-2023-en-r&anchor=para_25&doctype=Standard
-URIDate 2023-03-23
Reference 2: http://www.xbrl.org/2003/role/disclosureRef
-Name IAS
-Number 7
-IssueDate 2023-01-01
-Paragraph 28
-URI https://taxonomy.ifrs.org/xifrs-link?type=IAS&num=7&code=ifrs-tx-2023-en-r&anchor=para_28&doctype=Standard
-URIDate 2023-03-23
| Name: |
ifrs-full_EffectOfExchangeRateChangesOnCashAndCashEquivalents |
| Namespace Prefix: |
ifrs-full_ |
| Data Type: |
xbrli:monetaryItemType |
| Balance Type: |
debit |
| Period Type: |
duration |
|
| X |
- DefinitionThe increase (decrease) in cash and cash equivalents after the effect of exchange rate changes on cash and cash equivalents held in foreign currencies. [Refer: Cash and cash equivalents; Effect of exchange rate changes on cash and cash equivalents] Reference 1: http://www.xbrl.org/2003/role/disclosureRef
-Name IAS
-Number 7
-IssueDate 2023-01-01
-Paragraph 45
-URI https://taxonomy.ifrs.org/xifrs-link?type=IAS&num=7&code=ifrs-tx-2023-en-r&anchor=para_45&doctype=Standard
-URIDate 2023-03-23
| Name: |
ifrs-full_IncreaseDecreaseInCashAndCashEquivalents |
| Namespace Prefix: |
ifrs-full_ |
| Data Type: |
xbrli:monetaryItemType |
| Balance Type: |
debit |
| Period Type: |
duration |
|
| X |
- DefinitionThe cash outflow for payment of lease liabilities, classified as financing activities. [Refer: Lease liabilities] Reference 1: http://www.xbrl.org/2003/role/exampleRef
-Name IAS
-Number 7
-IssueDate 2023-01-01
-Paragraph 17
-Subparagraph e
-URI https://taxonomy.ifrs.org/xifrs-link?type=IAS&num=7&code=ifrs-tx-2023-en-r&anchor=para_17_e&doctype=Standard
-URIDate 2023-03-23
| Name: |
ifrs-full_PaymentsOfLeaseLiabilitiesClassifiedAsFinancingActivities |
| Namespace Prefix: |
ifrs-full_ |
| Data Type: |
xbrli:monetaryItemType |
| Balance Type: |
credit |
| Period Type: |
duration |
|
| X |
- DefinitionThe cash inflow from the exercise of share purchase warrants. Reference 1: http://www.xbrl.org/2009/role/commonPracticeRef
-Name IAS
-Number 7
-IssueDate 2023-01-01
-Paragraph 17
-URI https://taxonomy.ifrs.org/xifrs-link?type=IAS&num=7&code=ifrs-tx-2023-en-r&anchor=para_17&doctype=Standard
-URIDate 2023-03-23
| Name: |
ifrs-full_ProceedsFromExerciseOfWarrants |
| Namespace Prefix: |
ifrs-full_ |
| Data Type: |
xbrli:monetaryItemType |
| Balance Type: |
debit |
| Period Type: |
duration |
|
| X |
- DefinitionThe cash inflow from issuing shares. Reference 1: http://www.xbrl.org/2003/role/exampleRef
-Name IAS
-Number 7
-IssueDate 2023-01-01
-Paragraph 17
-Subparagraph a
-URI https://taxonomy.ifrs.org/xifrs-link?type=IAS&num=7&code=ifrs-tx-2023-en-r&anchor=para_17_a&doctype=Standard
-URIDate 2023-03-23
| Name: |
ifrs-full_ProceedsFromIssuingShares |
| Namespace Prefix: |
ifrs-full_ |
| Data Type: |
xbrli:monetaryItemType |
| Balance Type: |
debit |
| Period Type: |
duration |
|
| X |
- DefinitionThe total of income less expenses from continuing and discontinued operations, excluding the components of other comprehensive income. [Refer: Other comprehensive income] Reference 1: http://www.xbrl.org/2003/role/disclosureRef
-Name IAS
-Number 7
-IssueDate 2023-01-01
-Paragraph 18
-Subparagraph b
-URI https://taxonomy.ifrs.org/xifrs-link?type=IAS&num=7&code=ifrs-tx-2023-en-r&anchor=para_18_b&doctype=Standard
-URIDate 2023-03-23
Reference 2: http://www.xbrl.org/2003/role/disclosureRef
-Name IFRS
-Number 1
-IssueDate 2023-01-01
-Paragraph 32
-Subparagraph a
-Clause ii
-URI https://taxonomy.ifrs.org/xifrs-link?type=IFRS&num=1&code=ifrs-tx-2023-en-r&anchor=para_32_a_ii&doctype=Standard
-URIDate 2023-03-23
Reference 3: http://www.xbrl.org/2003/role/disclosureRef
-Name IFRS
-Number 1
-IssueDate 2023-01-01
-Paragraph 24
-Subparagraph b
-URI https://taxonomy.ifrs.org/xifrs-link?type=IFRS&num=1&code=ifrs-tx-2023-en-r&anchor=para_24_b&doctype=Standard
-URIDate 2023-03-23
Reference 4: http://www.xbrl.org/2003/role/disclosureRef
-Name IFRS
-Number 8
-IssueDate 2023-01-01
-Paragraph 28
-Subparagraph b
-URI https://taxonomy.ifrs.org/xifrs-link?type=IFRS&num=8&code=ifrs-tx-2023-en-r&anchor=para_28_b&doctype=Standard
-URIDate 2023-03-23
Reference 5: http://www.xbrl.org/2003/role/disclosureRef
-Name IFRS
-Number 8
-IssueDate 2023-01-01
-Paragraph 23
-URI https://taxonomy.ifrs.org/xifrs-link?type=IFRS&num=8&code=ifrs-tx-2023-en-r&anchor=para_23&doctype=Standard
-URIDate 2023-03-23
Reference 6: http://www.xbrl.org/2003/role/exampleRef
-Name IFRS
-Number 12
-IssueDate 2023-01-01
-Paragraph B10
-Subparagraph b
-URI https://taxonomy.ifrs.org/xifrs-link?type=IFRS&num=12&code=ifrs-tx-2023-en-r&anchor=para_B10_b&doctype=Appendix&subtype=B
-URIDate 2023-03-23
Reference 7: http://www.xbrl.org/2003/role/exampleRef
-Name IFRS
-Number 17
-IssueDate 2023-01-01
-Paragraph 113
-Subparagraph b
-URI https://taxonomy.ifrs.org/xifrs-link?type=IFRS&num=17&code=ifrs-tx-2023-en-r&anchor=para_113_b&doctype=Standard
-URIDate 2023-03-23
Reference 8: http://www.xbrl.org/2003/role/disclosureRef
-Name IAS
-Number 1
-IssueDate 2023-01-01
-Paragraph 81A
-Subparagraph a
-URI https://taxonomy.ifrs.org/xifrs-link?type=IAS&num=1&code=ifrs-tx-2023-en-r&anchor=para_81A_a&doctype=Standard
-URIDate 2023-03-23
Reference 9: http://www.xbrl.org/2003/role/disclosureRef
-Name IAS
-Number 1
-IssueDate 2023-01-01
-Paragraph 106
-Subparagraph d
-Clause i
-URI https://taxonomy.ifrs.org/xifrs-link?type=IAS&num=1&code=ifrs-tx-2023-en-r&anchor=para_106_d_i&doctype=Standard
-URIDate 2023-03-23
| Name: |
ifrs-full_ProfitLoss |
| Namespace Prefix: |
ifrs-full_ |
| Data Type: |
xbrli:monetaryItemType |
| Balance Type: |
credit |
| Period Type: |
duration |
|
| X |
- DefinitionThe cash outflow for the purchases of intangible assets, classified as investing activities. [Refer: Intangible assets other than goodwill] Reference 1: http://www.xbrl.org/2003/role/exampleRef
-Name IAS
-Number 7
-IssueDate 2023-01-01
-Paragraph 16
-Subparagraph a
-URI https://taxonomy.ifrs.org/xifrs-link?type=IAS&num=7&code=ifrs-tx-2023-en-r&anchor=para_16_a&doctype=Standard
-URIDate 2023-03-23
| Name: |
ifrs-full_PurchaseOfIntangibleAssetsClassifiedAsInvestingActivities |
| Namespace Prefix: |
ifrs-full_ |
| Data Type: |
xbrli:monetaryItemType |
| Balance Type: |
credit |
| Period Type: |
duration |
|
| X |
- DefinitionThe cash outflow for the purchases of property, plant and equipment, classified as investing activities. [Refer: Property, plant and equipment] Reference 1: http://www.xbrl.org/2003/role/exampleRef
-Name IAS
-Number 7
-IssueDate 2023-01-01
-Paragraph 16
-Subparagraph a
-URI https://taxonomy.ifrs.org/xifrs-link?type=IAS&num=7&code=ifrs-tx-2023-en-r&anchor=para_16_a&doctype=Standard
-URIDate 2023-03-23
| Name: |
ifrs-full_PurchaseOfPropertyPlantAndEquipmentClassifiedAsInvestingActivities |
| Namespace Prefix: |
ifrs-full_ |
| Data Type: |
xbrli:monetaryItemType |
| Balance Type: |
credit |
| Period Type: |
duration |
|
| X |
- DefinitionThe amount of accounts payable and accrued liabilities.
| Name: |
syta_AdjustmentsForDecreaseIncreaseInAccountsPayableAndAccruedLiabilities |
| Namespace Prefix: |
syta_ |
| Data Type: |
xbrli:monetaryItemType |
| Balance Type: |
debit |
| Period Type: |
duration |
|
| X |
- DefinitionThe amount of advances to suppliers.
| Name: |
syta_AdjustmentsForDecreaseIncreaseInAdvancesToSuppliers |
| Namespace Prefix: |
syta_ |
| Data Type: |
xbrli:monetaryItemType |
| Balance Type: |
debit |
| Period Type: |
duration |
|
| X |
- References
+ Details
| Name: |
syta_BadDebtExpense |
| Namespace Prefix: |
syta_ |
| Data Type: |
xbrli:monetaryItemType |
| Balance Type: |
debit |
| Period Type: |
duration |
|
| X |
- DefinitionConvertible debt issued, net of repayments.
| Name: |
syta_ConvertibleDebtIssuedNetOfRepayments |
| Namespace Prefix: |
syta_ |
| Data Type: |
xbrli:monetaryItemType |
| Balance Type: |
debit |
| Period Type: |
duration |
|
| X |
- DefinitionThe amount of fair value changes on derivatives.
| Name: |
syta_FairValueChangesOnDerivatives |
| Namespace Prefix: |
syta_ |
| Data Type: |
xbrli:monetaryItemType |
| Balance Type: |
debit |
| Period Type: |
duration |
|
| X |
- DefinitionThe amount of fair value changes on opening warrant liability.
| Name: |
syta_FairValueChangesOnOpeningWarrantLiability |
| Namespace Prefix: |
syta_ |
| Data Type: |
xbrli:monetaryItemType |
| Balance Type: |
debit |
| Period Type: |
duration |
|
| X |
- DefinitionFair value changes on warrant liability.
| Name: |
syta_FairValueChangesOnWarrantLiability |
| Namespace Prefix: |
syta_ |
| Data Type: |
xbrli:monetaryItemType |
| Balance Type: |
debit |
| Period Type: |
duration |
|
| X |
- References
+ Details
| Name: |
syta_FinancingActivitiesAbstract |
| Namespace Prefix: |
syta_ |
| Data Type: |
xbrli:stringItemType |
| Balance Type: |
na |
| Period Type: |
duration |
|
| X |
- References
+ Details
| Name: |
syta_FuturePurhaseConsideration |
| Namespace Prefix: |
syta_ |
| Data Type: |
xbrli:monetaryItemType |
| Balance Type: |
credit |
| Period Type: |
duration |
|
| X |
- DefinitionAmount of inventory write-down, also referred to as “inventory impairment,” is an accounting term that recognizes when your inventory's market value falls below the book value, but it still considered sellable.
| Name: |
syta_ImpairmentOfInventory |
| Namespace Prefix: |
syta_ |
| Data Type: |
xbrli:monetaryItemType |
| Balance Type: |
debit |
| Period Type: |
duration |
|
| X |
- DefinitionThe amount of income on inventory due to water damage.
| Name: |
syta_IncomeOnInventoryDueToWaterDamage |
| Namespace Prefix: |
syta_ |
| Data Type: |
xbrli:monetaryItemType |
| Balance Type: |
credit |
| Period Type: |
duration |
|
| X |
- DefinitionInterest expense, net of repayments.
| Name: |
syta_InterestExpenseNetOfRepayments |
| Namespace Prefix: |
syta_ |
| Data Type: |
xbrli:monetaryItemType |
| Balance Type: |
debit |
| Period Type: |
duration |
|
| X |
- References
+ Details
| Name: |
syta_InvestingActivitiesAbstract |
| Namespace Prefix: |
syta_ |
| Data Type: |
xbrli:stringItemType |
| Balance Type: |
na |
| Period Type: |
duration |
|
| X |
- References
+ Details
| Name: |
syta_ItemsNotAffectingCashAbstract |
| Namespace Prefix: |
syta_ |
| Data Type: |
xbrli:stringItemType |
| Balance Type: |
na |
| Period Type: |
duration |
|
| X |
- References
+ Details
| Name: |
syta_NetChangeInNonCashWorkingCapitalAbstract |
| Namespace Prefix: |
syta_ |
| Data Type: |
xbrli:stringItemType |
| Balance Type: |
na |
| Period Type: |
duration |
|
| X |
- References
+ Details
| Name: |
syta_OperatingActivitiesAbstract |
| Namespace Prefix: |
syta_ |
| Data Type: |
xbrli:stringItemType |
| Balance Type: |
na |
| Period Type: |
duration |
|
| X |
- DefinitionThe cash inflow from borrowings obtained. [Refer: Borrowings]
| Name: |
syta_ProceedsFromToBorrowingsClassifiedAsFinancingActivities |
| Namespace Prefix: |
syta_ |
| Data Type: |
xbrli:monetaryItemType |
| Balance Type: |
debit |
| Period Type: |
duration |
|
| X |
- DefinitionThe amount of proceeds of long term deposit.
| Name: |
syta_ProceedsOfLongTermDeposit |
| Namespace Prefix: |
syta_ |
| Data Type: |
xbrli:monetaryItemType |
| Balance Type: |
debit |
| Period Type: |
duration |
|
| X |
- DefinitionThe amount of transactions Cost.
| Name: |
syta_TransactionsCost |
| Namespace Prefix: |
syta_ |
| Data Type: |
xbrli:monetaryItemType |
| Balance Type: |
debit |
| Period Type: |
duration |
|
v3.23.3
Nature of Operations and Going Concern
|
9 Months Ended |
Sep. 30, 2023 |
|---|
| Nature of Operations and Going Concern [Abstract] |
|
| NATURE OF OPERATIONS AND GOING CONCERN |
| 1. | NATURE
OF OPERATIONS AND GOING CONCERN |
Siyata Mobile Inc. (“Siyata”
or the “Company”) was incorporated under the Business Corporations Act, British Columbia on October 15, 1986. The Company’s
shares are listed on NASDAQ under the symbol SYTA and warrants issued on September 29, 2020, are traded under the symbol SYTAW. The Company’s
principal activity is the sale of vehicle-mounted, cellular-based communications platforms over advanced mobile networks and cellular
booster systems. The registered and records office is located at 7404 King George Blvd, Suite- 200, Surrey, BC, V3W-1N6.
These unaudited condensed interim consolidated
financial statements have been prepared in accordance with International Financial Reporting Standards (“IFRS”) IAS 34 Interim
Financial Reporting, with the assumption that the Company will be able to realize its assets and discharge its liabilities in the
normal course of business rather than a process of forced liquidation. These unaudited condensed interim consolidated financial statements
do not include any adjustments relating to the recoverability and classification of recorded asset amounts and classification of liabilities
that might be necessary should the Company be unable to continue as a going concern.
The Company incurred a net loss of
$9,466,789 during the nine month period ended September 30, 2023 $9,066,788 (September 30, 2022- nine month period net loss of $8,710,945),
and, as of that date, the Company’s total deficit was $86,885,452 (December 31, 2022 - $77,818,663). The Company’s continuation
as a going concern is dependent upon the success of the Company’s sale of inventory, the existing cash flows, and the ability of
the Company to obtain additional debt or equity financing, all of which are uncertain. These material uncertainties raise substantial
doubt on the Company’s ability to continue as a going concern.
|
| X |
- References
+ Details
| Name: |
syta_NatureOfOperationsAndGoingConcernTextBlock |
| Namespace Prefix: |
syta_ |
| Data Type: |
dtr:textBlockItemType |
| Balance Type: |
na |
| Period Type: |
duration |
|
| X |
- References
+ Details
| Name: |
syta_NatureofOperationsandGoingConcernLineItems |
| Namespace Prefix: |
syta_ |
| Data Type: |
xbrli:stringItemType |
| Balance Type: |
na |
| Period Type: |
duration |
|
v3.23.3
Basis of Preparation
|
9 Months Ended |
Sep. 30, 2023 |
|---|
| Basis of Preparation [Abstract] |
|
| BASIS OF PREPARATION |
Statement of compliance
These unaudited condensed interim consolidated
financial statements, including comparatives, have been prepared in accordance with International Accounting Standards (IAS) 34 Interim
Financial Reporting. Omitted from these financial statements are certain information and note disclosures normally included in the
annual financial statements. These financial statements and notes presented should be read in conjunction with the annual financial statements
for the year ended December 31, 2022.
The accounting methods and principles
of computation adopted in these financial statements are the same as those in annual consolidated financial statements for the year ended
December 31, 2022.
The preparation of these unaudited
condensed interim consolidated financial statements requires management to make estimates, judgments and assumptions that affect the application
of accounting policies and the reported amounts of assets, liabilities, income and expenses. The significant judgements made by management
when applying the Company’s accounting policies and the key sources of estimation uncertainty were the same as those that applied
to the Company’s December 31, 2022 annual consolidated financial statements. Basis of consolidation and presentation
These unaudited condensed interim consolidated
financial statements of the Company have been prepared on a historical cost basis, except for financial instruments classified as financial
instruments at fair value through profit and loss, which are stated at their fair value. In addition, the condensed interim consolidated
financial statements have been prepared using the accrual basis of accounting, except for the statement of cash flows.
These unaudited condensed interim consolidated
financial statements incorporate the financial statements of the Company and its wholly controlled subsidiaries. Control exists when the
Company has the power, directly or indirectly, to govern the financial and operating policies of an entity so as to obtain benefits from
its activities. These condensed interim consolidated financial statements include the accounts of the Company and its direct wholly-owned
subsidiaries. All intercompany transactions and balances have been eliminated.
The unaudited condensed interim consolidated
financial statements include the accounts of the Company and its wholly-owned subsidiaries:
| Name of Subsidiary |
|
Place of Incorporation |
|
Ownership |
|
| Queensgate Resources Corp. |
|
British Columbia, Canada |
|
|
100 |
% |
| Queensgate Resources US Corp. |
|
Nevada, USA |
|
|
100 |
% |
| Siyata Mobile (Canada) Inc. |
|
British Columbia, Canada |
|
|
100 |
% |
| Siyata Mobile Israel Ltd. |
|
Israel |
|
|
100 |
% |
| Signifi Mobile Inc. |
|
Quebec, Canada |
|
|
100 |
% |
| ClearRF Nevada Ltd. |
|
Nevada, USA |
|
|
100 |
% |
Recent adoptions
of accounting pronouncements
The following amendments became effective
on January 1, 2023, and did not have a material impact on the Company’s condensed interim consolidated financial statements:
| ● | In
February 2021, the IASB issued Definition of Accounting Estimates (Amendments to IAS 8). The amendments define accounting estimates and
clarify the distinction between changes in accounting estimates and changes in accounting policies. |
| ● | In
February 2021, the IASB issued Disclosure of Accounting Policies (Amendments to IAS 1 and IFRS Practice Statement 2). The amendments
provide guidance to help entities disclose their material (previously “significant”) accounting policies. |
| ● | In
May 2021, the IASB issued Deferred Tax related to Assets and Liabilities arising from a Single Transaction (Amendments to IAS 12). The
amendments narrow the scope of the recognition exemption so that companies would be required to recognize deferred tax for transactions
that give rise to equal amounts of taxable and deductible temporary differences, such as leases. |
Future accounting pronouncements
The standards, amendments, and interpretations
issued before 2023 but not yet adopted by the Company have been disclosed in Note 3 of the Company’s December 31, 2022 annual consolidated
financial statements. The Company is currently considering the impact of adopting these standards, amendments and interpretations on its
consolidated financial statement.
|
| X |
- DefinitionThe disclosure of the basis used for the preparation of the financial statements. Reference 1: http://www.xbrl.org/2009/role/commonPracticeRef
-Name IAS
-Number 1
-IssueDate 2023-01-01
-Paragraph 10
-Subparagraph e
-URI https://taxonomy.ifrs.org/xifrs-link?type=IAS&num=1&code=ifrs-tx-2023-en-r&anchor=para_10_e&doctype=Standard
-URIDate 2023-03-23
| Name: |
ifrs-full_DisclosureOfBasisOfPreparationOfFinancialStatementsExplanatory |
| Namespace Prefix: |
ifrs-full_ |
| Data Type: |
dtr-types:textBlockItemType |
| Balance Type: |
na |
| Period Type: |
duration |
|
| X |
- References
+ Details
| Name: |
ifrs-full_DisclosureOfVoluntaryChangeInAccountingPolicyAbstract |
| Namespace Prefix: |
ifrs-full_ |
| Data Type: |
xbrli:stringItemType |
| Balance Type: |
na |
| Period Type: |
duration |
|
v3.23.3
Trade and Other Receivables
|
9 Months Ended |
Sep. 30, 2023 |
|---|
| Trade and Other Receivables [Abstract] |
|
| TRADE AND OTHER RECEIVABLES |
| 3. | TRADE
AND OTHER RECEIVABLES |
| | |
September 30,
2023 | | |
December 31,
2022 | |
| Trade receivables | |
$ | 2,752,951 | | |
$ | 2,015,291 | |
| Allowance for doubtful accounts | |
| (1,047,802 | ) | |
| (1,056,393 | ) |
| Taxes receivable | |
| 474,097 | | |
| 615,730 | |
| Total | |
$ | 2,179,246 | | |
$ | 1,574,628 | |
|
| X |
- DefinitionThe disclosure of trade and other receivables. [Refer: Trade and other receivables] Reference 1: http://www.xbrl.org/2009/role/commonPracticeRef
-Name IAS
-Number 1
-IssueDate 2023-01-01
-Paragraph 10
-Subparagraph e
-URI https://taxonomy.ifrs.org/xifrs-link?type=IAS&num=1&code=ifrs-tx-2023-en-r&anchor=para_10_e&doctype=Standard
-URIDate 2023-03-23
| Name: |
ifrs-full_DisclosureOfTradeAndOtherReceivablesExplanatory |
| Namespace Prefix: |
ifrs-full_ |
| Data Type: |
dtr-types:textBlockItemType |
| Balance Type: |
na |
| Period Type: |
duration |
|
v3.23.3
Inventory
|
9 Months Ended |
Sep. 30, 2023 |
|---|
| Inventory [Abstract] |
|
| INVENTORY |
| | |
September 30,
2023 | | |
December 31,
2022 | |
| Finished products | |
$ | 2,601,980 | | |
$ | 7,392,002 | |
| Impairment of finished products | |
| - | | |
| (3,555,683 | ) |
| Accessories and spare parts | |
| 299,934 | | |
| 675,001 | |
| Impairment of accessories and spare parts | |
| - | | |
| (418,770 | ) |
| Total | |
$ | 2,901,914 | | |
$ | 4,092,550 | |
|
| X |
- DefinitionThe entire disclosure for inventories. Reference 1: http://www.xbrl.org/2003/role/disclosureRef
-Name IAS
-Number 2
-IssueDate 2023-01-01
-Section Disclosure
-URI https://taxonomy.ifrs.org/xifrs-link?type=IAS&num=2&code=ifrs-tx-2023-en-r&doctype=Standard&dita_xref=IAS02_g36-39_TI
-URIDate 2023-03-23
| Name: |
ifrs-full_DisclosureOfInventoriesExplanatory |
| Namespace Prefix: |
ifrs-full_ |
| Data Type: |
dtr-types:textBlockItemType |
| Balance Type: |
na |
| Period Type: |
duration |
|
| X |
- References
+ Details
| Name: |
syta_InventoryAbstract |
| Namespace Prefix: |
syta_ |
| Data Type: |
xbrli:stringItemType |
| Balance Type: |
na |
| Period Type: |
duration |
|
v3.23.3
Bank Loan
|
9 Months Ended |
Sep. 30, 2023 |
|---|
| Bank Loan [Abstract] |
|
| BANK LOAN |
The Company has obtained in April 2023, a $2,000,0000 line of credit
factoring for its North American receivables with an 85% advance rate with interest of 1.8% for the first 30 days, then 0.5% every 10
days thereafter of the face value.
This loan is collateralized by the North American receivables, inventory
and equipment. As at September 30, 2023 the bank loan balance is $531,521.
|
| X |
- DefinitionThe disclosure of loans and advances to banks. [Refer: Loans and advances to banks] Reference 1: http://www.xbrl.org/2009/role/commonPracticeRef
-Name IAS
-Number 1
-IssueDate 2023-01-01
-Paragraph 10
-Subparagraph e
-URI https://taxonomy.ifrs.org/xifrs-link?type=IAS&num=1&code=ifrs-tx-2023-en-r&anchor=para_10_e&doctype=Standard
-URIDate 2023-03-23
| Name: |
ifrs-full_DisclosureOfLoansAndAdvancesToBanksExplanatory |
| Namespace Prefix: |
ifrs-full_ |
| Data Type: |
dtr-types:textBlockItemType |
| Balance Type: |
na |
| Period Type: |
duration |
|
| X |
- References
+ Details
| Name: |
us-gaap_LongtermLoansPayableToBankCurrentAndNoncurrentAbstract |
| Namespace Prefix: |
us-gaap_ |
| Data Type: |
xbrli:stringItemType |
| Balance Type: |
na |
| Period Type: |
duration |
|
v3.23.3
Convertible Debentures
|
9 Months Ended |
Sep. 30, 2023 |
|---|
| Convertible Debentures [Abstract] |
|
| CONVERTIBLE DEBENTURES |
On November 3, 2021, the Company issued
a US$7,200,000 convertible promissory note (the “Promissory Note”) and 2,142,857 warrants for gross proceeds of US$6,000,000.
The Company elected to measure the promissory note (hybrid contract) at fair value through profit or loss (“FVTPL”) on initial
recognition and, as such, the embedded conversion feature was not separated. The warrants were recorded as a liability.
During the three months ended March
31, 2022, the Company completed a secondary offering of its common shares, and as a result of the terms of the convertible promissory
note, the Company was required to direct 20% of the gross proceed of the offering to the lender. A total of US$4,000,000 was repaid to
the lender on January 13, 2022. Commencing in May 2022, the Company made monthly payments of $400,000 through issuance of common shares
towards the principal balance of the promissory note, resulting the promissory note being fully repaid by December 31, 2022. The Company
issued 13,112,255 common shares, with a total market value of $4,138,002. The difference between the fair value of the shares issued,
and the value of the principal repaid of $938,002 was included in profit and loss in the change in fair value of convertible promissory
note.
For the three months ended March 31,
2022 the Company recorded a fair value loss of $2,023,751 on the Convertible debenture.
|
| X |
- References
+ Details
| Name: |
syta_ConvertibleDebenturesLineItems |
| Namespace Prefix: |
syta_ |
| Data Type: |
xbrli:stringItemType |
| Balance Type: |
na |
| Period Type: |
duration |
|
| X |
- References
+ Details
| Name: |
syta_ConvertibleDebenturesTextBlock |
| Namespace Prefix: |
syta_ |
| Data Type: |
dtr:textBlockItemType |
| Balance Type: |
na |
| Period Type: |
duration |
|
v3.23.3
Warrant Liability
|
9 Months Ended |
Sep. 30, 2023 |
|---|
| Warrant Liability [Abstract] |
|
| WARRANT LIABILITY |
The balance of the warrant liability
is as follows:
| | |
November 3,
2021 | | |
January 11,
2022 | | |
October 12,
2022 | | |
January 19,
2023 | | |
Total | |
| Balance December 31, 2022 | |
$ | 197,733 | | |
$ | 501,330 | | |
$ | 2,035,741 | | |
$ | - | | |
$ | 2,734,804 | |
| Exercise of warrants | |
| (197,733 | ) | |
| - | | |
| (1,717,801 | ) | |
| - | | |
| (1,915,534 | ) |
| Warrants issued | |
| - | | |
| - | | |
| - | | |
| 2,875,580 | | |
| 2,875,580 | |
| Transfer to equity | |
| - | | |
| - | | |
| (564,946 | ) | |
| (3,410,100 | ) | |
| (3,975,046 | ) |
| Change in fair value | |
| - | | |
| (487,407 | ) | |
| 247,006 | | |
| 534,520 | | |
| 294,119 | |
| Balance September 30, 2023 | |
$ | - | | |
$ | 13,923 | | |
$ | - | | |
$ | - | | |
$ | 13,923 | |
January 19, 2023 warrants
On January 19, 2023, the Company entered
into warrant exercise agreements with fourteen existing accredited investors to exercise certain outstanding warrants to purchase up to
an aggregate of 180,429 of the Company’s common shares. In consideration for the immediate exercise of the outstanding warrants
for cash, the Company agreed to reduce the exercise price from $23.00 to $20.00 per share and issue new unregistered warrants to purchase
up to an aggregate of 180,429 common shares with an exercise price of $20.00 per share. The gross proceeds to the Company from the exercise
totaled approximately $3,608,571, prior to deducting warrant inducement agent fees and offering expenses.
The new warrants are exercisable immediately
upon issuance at an exercise price of $20.00 per share and have a term of exercise equal to five years. In connection with the exercise,
the Company will be required pursuant to the terms of 29,891 of its remaining unexercised common share purchase warrants, to reduce the
exercise price of such warrants from $23.00 per common share to an exercise price of $20.00 per common share.
On March 30, 2023, the SEC accepted
the registration statement of the Company to the effect that all of the 210,320 outstanding $20.00 warrants become immediately a cashless
exercise and their underlying shares become immediately tradeable. Subsequent to the quarter ended March 31, 2023, 210,320 warrants were
exercised cashless in exchange for 210,320 common shares of the Company. All of the warrants that became cashless exercise were transferred
to equity at March 30, 2023, as they no longer met the definition of a liability.
The fair value of the warrants issued
at January 19, 2023 was $2,875,580 and was determined using the stock price at the date of issue, with a 15% discount for lack of marketability.
This method was used as the warrants contained an alternative cashless exercise feature.
The fair value of the warrants on March
30, 2023 was $3,410,100 and was determined using the stock price on the date, as the warrants were cashless exercise at that date. November 3, 2021 warrants
The warrants allowed for the purchase
of 18,929 common shares of the Company at an exercise price of US $400.00 per common share and expired 5 years from the issue date of
the related promissory note. Under the terms of these warrants, the exercise price of the warrant was adjusted to $230.00 when an offering
was closed on January 3, 2022 that issued shares at a price lower than the exercise price. On January 19, 2023 the warrant holders entered
into the agreement noted above to exercise the warrants, and receive new warrants in exchange.
At December 31, 2022 the fair value
of the warrants was $197,733 and was determined using a Black-Scholes option pricing model with the following assumptions: initial stock
price $15.00, strike rate $23.00 dividend yield 0%, term 3.84 years, volatility 110% and risk-free rate 4.08%.
At January 19, 2023 prior to exercise,
the fair value of the warrants was $NIL and was determined using a Black-Scholes option pricing model with the following assumptions:
initial stock price $19.00, strike rate $20.00 dividend yield 0%, term 0.0 years, volatility 130% and risk-free rate 3.62%.
January 11, 2022 warrants
The Company assessed that the 85,200
warrants, and 14,800 pre-funded warrants issued in the January 2022 equity offering did not meet the “fixed for fixed” test
and are therefore recorded as liabilities at fair value through profit and loss, and revalued at the end of each period.
At December 31, 2022 the fair value
of the warrants was $501,330 and was determined using a Black-Scholes option pricing model with the following assumptions: initial stock
price $15.00, strike rate $230.00, dividend yield 0%, term 4.03 years, volatility 110% and risk-free rate 4.08%.
At September 30, 2023 the fair value
of the warrants was $13,923 and was determined using a Black-Scholes option pricing model with the following assumptions: initial stock
price $282.00, strike rate $230.00, dividend yield 0%, term 3.28 years, volatility 105% and risk-free rate 4.72%.
October 12, 2022 warrants
The Company assessed that the 174,000
warrants and 15,900 pre-funded warrants issued as part of the October 2022 equity offering did not meet the “fixed for fixed”
test and are therefore reported as liabilities at fair value through profit and loss, and revalued at the end of each period. On January
19, 2023 the warrant holders entered into the agreement noted above to exercise 161,500 of the 174,000 warrants, and receive new warrants
in exchange. The remaining 12,500 warrants that were outstanding at January 19, 2023 were converted to cashless exercise warrants on March
30, 2023 as described above. The fair value of the warrants as at
December 31, 2022 was $1,850,758 and was determined using the Black-Scholes Option Pricing Model with the following assumptions: share
price: $15.00; exercise price $23.00; expected volatility: 100%; dividend yield 0%; risk free rate: 3.98%.
The fair value of the 12,500 unexercised
warrants on January 19, 2023 was $132,957 and was determined using the Black-Scholes Option Pricing Model with the following assumptions:
share price: $19.00; exercise price $20.00; term 4.73 years; expected volatility: 115%; dividend yield 0%; risk free rate: 3.49%.
The fair value of the 161,500 exercised
warrants immediately prior to exercise on January 19, 2023 was $NIL and was determined using the Black-Scholes Option Pricing Model with
the following assumptions: share price: $19.00; exercise price $20.00; term 0 years; expected volatility: 115%; dividend yield 0%; risk
free rate: 3.49%.
The fair value of the 29,891 (17,391
waiver warrants plus 12,500 unexercised warrants) outstanding warrants on March 30, 2023 prior to the transfer to equity was $564,946
and was determined using the stock price on the date, as the warrants were cashless exercise at that date.
In connection with the October 2022
equity offering, the Company issued 17,391 waiver warrants exercisable at $23.00 per share which expire, if unexercised, on October 12,
2027, to entice the holder of the convertible promissory note to waive their right to block the equity offering. The waiver warrants did
not meet the “fixed for fixed” test and are therefore reported as liabilities at fair value through profit and loss and revalued
at the end of each period. On March 30, 2023, the waiver warrants were modified to cashless exercise as described above, and therefore
met the “fixed for fixed” test and were reclassified to equity.
The fair value of the waiver warrants
as at December 31, 2022 was $184,983 and was determined using the Black-Scholes Option Pricing Model with the following assumptions: share
price: $15.00; exercise price $23.00; expected volatility: 100%; dividend yield 0%; risk free rate: 3.10%.
The fair value of the waiver warrants
as at March 30, 2023 prior to transfer to equity was $328,696 and was determined using the stock price on the date, as the warrants were
cashless exercise at that date.
|
| X |
- DefinitionThe disclosure of financial liabilities. [Refer: Financial liabilities] Reference 1: http://www.xbrl.org/2003/role/disclosureRef
-Name IFRS
-Number 7
-IssueDate 2023-01-01
-Paragraph 7
-URI https://taxonomy.ifrs.org/xifrs-link?type=IFRS&num=7&code=ifrs-tx-2023-en-r&anchor=para_7&doctype=Standard
-URIDate 2023-03-23
| Name: |
ifrs-full_DisclosureOfFinancialLiabilitiesExplanatory |
| Namespace Prefix: |
ifrs-full_ |
| Data Type: |
dtr-types:textBlockItemType |
| Balance Type: |
na |
| Period Type: |
duration |
|
| X |
- References
+ Details
| Name: |
ifrs-full_WarrantyProvisionAbstract |
| Namespace Prefix: |
ifrs-full_ |
| Data Type: |
xbrli:stringItemType |
| Balance Type: |
na |
| Period Type: |
duration |
|
v3.23.3
Share Capital
|
9 Months Ended |
Sep. 30, 2023 |
|---|
| Share Capital [Abstract] |
|
| SHARE CAPITAL |
| |
(a) |
Authorized Unlimited number of common shares without par value |
As at September 30, 2023, the Company
had 1,853,955 common shares issued and outstanding (December 31, 2022 – 448,686) after taking into account the 100-to-1 reverse
stock split that took place on August 10, 2023.
As of the date of issuance of these
financial statements total outstanding common shares is 3,902,168 (post 100-to-1 reverse split that was effective as of August 10, 2023),
due to the issuance of 1,870,000 shares from a capital raise on October 31, 2023 and the exercise of 180,000 prefunded warrants also issued
on October 31, 2023 that were exercised into 177,313 additional common shares on November 1, 2023, as well as the conversion of 900 RSU’s
into 900 common shares on October 3, 2023.
| (b) | Common
share transactions |
Transactions for the nine months
ended September 30, 2023 are as follows:
| | ● | The Company issued 180,429 common shares on the exercise of various warrants for gross proceeds of $3,608,571. Additionally, the Company issued 180,429 warrants to replace those warrants that were exercised. As an incentive to investors to exercise the 180,429 warrants, the Company issued cashless warrants to those investors that were exercisable as of March 30, 2023. As well, any holders of the $23.00 warrants that had a ratchet provision also became cashless. As a result, 210,319 common shares were issued for cashless warrants in Q2 2023. On June 28, 2023 the Company issued 500,000 at $4.50 per share for gross proceeds of $2,250,000 before offering expenses and other expenses included in share issuance costs. On July 13, 2023, the Company issued 514,500
shares at $4.50 per share for gross proceeds of $2,315,250 before offering expenses and other expenses included in share issuance costs. |
Subsequent to September 30, 2023 the Company
issued 1,870,000 common shares at $0.65 per share and also issued 530,000 prefunded warrants with an exercise price of $0.01 and a purchase
price of $0.64 per warrant for total gross proceeds of $1,554,700 before offering expenses and other expenses included in share issuance
costs.
Transactions for the nine months
ended September 30, 2022 are as follows:
On January 11, 2022, the Company completed
an underwritten public offering in the United States, raising a total of $20,013,043 in gross proceeds. The Company allocated the gross
proceeds firstly to the warrant liabilities, with the remainder to the common shares. Direct costs have been allocated based on the percentage
allocation of the proceeds. The underwritten public offering resulted in the sale to the public of 72,157 Units at $230.00 per Unit, with
each Unit being comprised of one common share and one warrant (the “Unit Warrants”) exercisable at $230.00 per share. The
Unit warrants are exercisable immediately and have a term of 5 years. Gross proceeds of $10,936,974 were allocated to the common shares,
and $5,395,878 to the unit warrants liability
In addition, the
Company issued 14,800 pre-funded units (“Pre-Funded Units”) at $229.00 per Pre-Funded Unit. Each Pre-Funded Unit is comprised
of a one-pre-funded warrant (a “Pre-Funded Warrant”) to purchase one common share, and one warrant to purchase one common
share. The Pre-Funded Warrant allows the holder to acquire one common share of the Company at an exercise price of $1.00 per common share,
and a warrant to purchase a common share at an exercise price of $230.00 per share. The warrants are exercisable immediately and have
a term of 5 years. Each Pre-Funded Warrant is exercisable immediately and is exercisable until all Pre-Funded Warrants are exercised.
Proceeds of $2,560,400 were allocated to the pre-funded warrants and $1,106,747 to the unit warrants in the warrant liability. The Company determined that the pre-funded
warrants within the Pre-funded Units are common shares in substance, as they require only a minimal exercise price of $1.00. In addition,
the underwriting agreement includes both the Units and Pe-funded Units and were negotiated together in the equity raise. Given that the
purpose of the Prefunded Unit is in substance the same as that of the Unit (i.e., resulting in the ownership of both common shares and
common share warrants) and that the terms of the warrants in both the Units and Prefunded Units are the same (i.e., the obligations of
the Company for the units are the same), the Company determined that the Units and Pre-funded Units are closely related and should be
combined into one unit of account for the purposes of allocating proceeds.
Therefore, the
proceeds from the sale of the Units and Pre-funded Units are combined and allocated among the common shares, pre-funded warrants, and
the common share warrants using the residual method, with the warrant liability being initially recognized at fair value as of the registration
date and the residual amount being allocated to the common shares (i.e., equity).
The Company concurrently sold an additional
13,043 warrants to purchase 13,043 common shares exercisable at $230.00 per share (the “Option Warrants”) pursuant to an over-allotment
option exercised by the underwriter. The exercise price of the warrants issued in connection with the exercise of the over-allotment option
was $0.97 per warrant. Each Option Warrant is exercisable immediately and has a term of five years from the issue date. Proceeds of $975,393
were allocated to the option warrant liability. As the fair value of the warrant liability exceeded the proceeds received on the warrants
of $13,043, a fair value loss of $962,350 was recognized in the statement of profit and loss as a fair value change in the opening warrant
liability.
The fair value of the common shares
and pre-funded units was determined by reference to the market price on the day of the offering, which was $173.00 per share. The Unit
Warrants, Warrants, and Option Warrants were valued using the Black-Scholes model using the following assumptions: initial stock price
$173.00, strike rate $230.00, dividend yield 0%, term 5 years, volatility 60.0% and risk-free rate 0.50%.
The Company also issued warrants to
the placement agents to purchase 4,348 common shares at an exercise price of $253.00 per share (the “Placement Agent Warrants”),
which are exercisable 180 days from January 11, 2022, with a term of five years. The fair value of the Placement Agent Warrants was determined
to be $307,189 using the Black-Scholes model with the following assumptions: initial stock price $173.00, strike rate $253.00, dividend
yield 0%, term 5 years, volatility 60.0% and risk-free rate 0.50%.
The Company assessed that the warrants
issued under the public offering, excluding the Placement Agent Warrants did not meet the “fixed for fixed” test and are therefore
reported as liabilities at fair value through profit and loss, and revalued at the end of each period. The Placement Agent Warrants were
assessed under IFRS 2 Share Based Payments, as equity-settled share-based payments and have been recorded in equity. The direct costs related to the issuance
of the common shares and warrants issued in the January 2022 underwritten public offering were $2,016,895, including the value of the
Placement Agent Warrants. Direct costs of $965,248 were allocated to the warrant liability and expensed immediately in profit and loss.
During the period, 14,800 Pre-Funded Warrants were exercised for gross proceeds of $14,800, converting into 14,800 common shares that
were fully issued.
On March 31, 2022, as part of the ClearRF
acquisition (Note 3), the Company issued 1,390 shares to the vendor with a fair value of $190,094.
The Company issued 1,550 common shares, with a fair value
of $170,500 ($110.00 per share) to consultants as part of their compensation for services rendered.
The Company issued 8,542 common shares with a fair value
of $1,002,461 as combined payments of the monthly principal repayment of $400,000 for the months of May and June 2022 payable in shares
per the terms of the promissory note.
The Company issued 15,500 common shares, with a fair value
of $170,500 ($110.00 per share) to consultants as part of their compensation for services rendered.
The Company issued 300 shares with a fair value of $22,200
($74.00 per share) resulting from a supplier converting RSU’s into common shares. The Company issued 600 shares, with a
fair value of $61,800 ($103.00 per share), to a supplier as partial compensation according to their contractual agreements.
The Company issued 4,049 shares, with a fair value of $441,296
($109.00 per share),as payment for the monthly principal repayment of $400,000 on the promissory note. ·
The Company issued 6,849 shares, with a fair value of $520,548 ($76.00
per share), as payment for the monthly principal repayment of $400,000 on the promissory note.
The Company issued 600 shares, with a fair value of $61,800
($103.00 per share), to a supplier as partial compensation according to their contractual agreements.
The Company has a shareholder-approved
“rolling” stock option plan (the “Plan”) in compliance with Nasdaq policies. Under the Plan the maximum number
of shares reserved for issuance may not exceed 15% of the total number of issued and outstanding common shares at the time of granting.
The exercise price of each stock option shall not be less than the market price of the Company’s stock at the date of grant, less
a discount of up to 25%. Options can have a maximum term of ten years and typically terminate 90 days following the termination of the
optionee’s employment or engagement, except in the case of retirement or death. Vesting of options is at the discretion of the Board
of Directors at the time the options are granted.
A summary of the Company’s
stock option activity is as follows:
| | |
| | |
Weighted | |
| | |
Number of | | |
Average | |
| | |
Stock | | |
Exercise | |
| | |
Options | | |
Price | |
| Outstanding options, December 31, 2021 | |
| 4,146 | | |
$ | 1,388.00 | |
| Granted | |
| 11,450 | | |
| 115.00 | |
| Expired/Cancelled | |
| (534 | ) | |
| (3,090.00 | ) |
| Outstanding options, December 31, 2022 | |
| 15,062 | | |
$ | 352.91 | |
| Granted | |
| - | | |
| - | |
| Expired/Cancelled | |
| - | | |
| - | |
| Outstanding options, September 30, 2023 | |
| 15,062 | | |
$ | 352.91 | |
As at September 30, 2023 stock
options outstanding are as follows:
| Grant Date |
|
Number of
options
outstanding |
|
|
Number of
options
exercisable |
|
|
Weighted
Average
Exercise
Price |
|
|
Expiry date |
|
Remaining
contractual
life (years) |
|
| 24-Dec-18 |
|
|
129 |
|
|
|
129 |
|
|
|
5,400.00
|
|
|
24-Dec-23 |
|
|
0.23 |
|
| 15-Jan-19 |
|
|
8 |
|
|
|
8 |
|
|
|
5,400.00 |
|
|
15-Jan-24 |
|
|
0.29 |
|
| 21-Mar-19 |
|
|
123 |
|
|
|
123 |
|
|
|
5,900.00 |
|
|
21-Mar-24 |
|
|
0.47 |
|
| 1-Jan-20 |
|
|
21 |
|
|
|
21 |
|
|
|
5,400.00 |
|
|
1-Jan-24 |
|
|
0.25 |
|
| 15-Nov-20 |
|
|
950 |
|
|
|
950 |
|
|
|
600.00 |
|
|
15-Nov-30 |
|
|
7.13 |
|
| 15-Nov-20 |
|
|
1,615 |
|
|
|
1,615 |
|
|
|
600.00 |
|
|
15-Nov-25 |
|
|
2.13 |
|
| 2-Jan-21 |
|
|
570 |
|
|
|
570 |
|
|
|
1,150.00 |
|
|
2-Jan-26 |
|
|
2.26 |
|
| 2-Jan-21 |
|
|
50 |
|
|
|
50 |
|
|
|
1,150.00 |
|
|
2-Jan-31 |
|
|
7.26 |
|
| 18-Jan-21 |
|
|
145 |
|
|
|
145 |
|
|
|
1,150.00 |
|
|
18-Jan-26 |
|
|
2.30 |
|
| 1-Jan-22 |
|
|
200 |
|
|
|
200 |
|
|
|
400.00 |
|
|
29-Oct-26 |
|
|
3.08 |
|
| 13-Apr-22 |
|
|
7,950 |
|
|
|
3,975 |
|
|
|
110.00 |
|
|
13-Apr-27 |
|
|
3.54 |
|
| 12-Jul-22 |
|
|
3,300 |
|
|
|
1,375 |
|
|
|
110.00 |
|
|
12-Jul-25 |
|
|
1.78 |
|
| Total |
|
|
15,061 |
|
|
|
9,161 |
|
|
$ |
352.91 |
|
|
|
|
|
3.12 |
|
Transactions for the nine months
ended September 30, 2023 are as follows:
| | ● | On January 1, 2022, the Company granted 200
stock options at $400.00 per share that vest in 8 equal quarterly periods with the first vesting occurring on the grant date. The fair
value on the date of the grant was $54,480 ($272.40 per option). | | | | | | | ● | On April 13, 2022, the Company granted 7,950 stock options to executives and employees at an exercise price of $110.00 per share. These options vest quarterly over three years period with the first vesting taking place at the date of the grant. The fair value of these options on the date of the grant is $678,520 ($85.35 per share). |
| |
(d) |
Restricted share units |
The Company approved on February 14,
2022, the addition of the issuance of restricted share units to the existing executive stock option plan.
A summary of the Company’s restricted share unit activity
is as follows:
| | |
Number of
RSU’s | | |
Weighted
Average
Issue Price | |
| Outstanding RSU, December 31, 2021 | |
| 0 | | |
$ | - | |
| Granted | |
| 31,950 | | |
| 105.08 | |
| Exercised | |
| (300 | ) | |
| (103.00 | ) |
| Outstanding RSU, December 31, 2022 | |
| 31,650 | | |
$ | 105.02 | |
| Granted | |
| - | | |
| - | |
| Exercised | |
| - | | |
| - | |
| Outstanding RSU, September 30, 2023 | |
| 31,650 | | |
$ | 105.02 | |
| Grant Date | |
Number of
RSU’s
outstanding | | |
Weighted Average
Issue Price | |
| 9-Mar-22 | |
| 2,250,000 | | |
| 1.03 | |
| 13-Apr-22 | |
| 825,000 | | |
| 1.10 | |
| 12-Jul-22 | |
| 90,000 | | |
| 1.10 | |
| Total | |
| 3,165,000 | | |
$ | 1.05 | |
Transactions for the nine month period
ended September 30, 2022, are as follows:
| | ● | On March 9, 2022, the Company granted 4,500 RSU’s to Directors that vest immediately. On the date of granting, the fair value and stock price was $103.00/share. |
| |
● |
On March 9, 2022, the Company granted 18,000
RSU’s to a Director that vest quarterly over 12 periods with the first vesting of 1,500 RSU’s occurring on the date of the
granted and another 1,500 vest every three months until all of the granted RSU’s have vested. On the date of granting, the fair
value and the stock price was $103.00/share.
|
| |
|
|
| |
● |
On April 13, 2022, the Company granted 2,400 RSU’s to consultants
that vest immediately. On the date of granting, the fair value and the stock price was $110.00/share. |
| |
|
|
| |
● |
On April 13, 2022, the Company granted 5,850 RSU’s to employees
of the Company that vest quarterly over 12 periods with the first vesting of 488 RSU’s occurring on the date of the granted and
another 488 RSU’s vest every three months until all of the granted RSU’s have vested. On the date of granting, the fair value
and the stock price was $110.00/share. |
Transactions subsequent to the period end where 900 RSU’s
were converted into 900 common shares on October 3, 2023.
A summary of the Company’s
agent options activity is as follows:
| | |
Number of
options | | |
Weighted
average
exercise
price | |
| Outstanding agent options, December 31, 2021 | |
| 4,459 | | |
$ | 751.00 | |
| Granted | |
| 4,873 | | |
| 251.00 | |
| Expired | |
| (17 | ) | |
| 2,049.00 | |
| Outstanding agent options, December 31, 2022 | |
| 9,315 | | |
$ | 487.06 | |
| Granted | |
| - | | |
| - | |
| Expired | |
| - | | |
| - | |
| Outstanding agent options, September 30, 2023 | |
| 9,315 | | |
$ | 487.06 | |
As at September 30, 2023 agent
options outstanding are as follows:
| Grant Date | |
Number of
options
outstanding | | |
Number of
options
exercisable | | |
Weighted
Average
Exercise
Price | | |
Expiry date | |
Remaining
contractual
life (years) | |
| 29-Sep-20 | |
| 1,135 | | |
| 1,135 | | |
$ | 660.00 | | |
28-Sep-25 | |
| 2.00 | |
| 29-Sep-20 | |
| 2,660 | | |
| 2,660 | | |
$ | 685.00 | | |
28-Sep-25 | |
| 2.00 | |
| 31-Dec-20 | |
| 647 | | |
| 647 | | |
$ | 1,150.00 | | |
30-Jun-24 | |
| 0.75 | |
| 11-Jan-22 | |
| 4,348 | | |
| 4,348 | | |
$ | 253.00 | | |
11-Jan-27 | |
| 3.28 | |
| 1-Apr-22 | |
| 525 | | |
| 525 | | |
$ | 230.00 | | |
8-Mar-27 | |
| 3.44 | |
| Total | |
| 9,315 | | |
| 9,315 | | |
| 487.06 | | |
| |
| 2.59 | |
Transactions for the nine month period
ended September 30, 2022 are as follows:
| | ● | The Company issued warrants to the placement agents to purchase 4,348 common shares at an exercise price of $253.00 per share (the “Placement Agent Warrants”), which are exercisable 180 days from January 11, 2022, with a term of five years. The fair value of the Placement Agent Warrants was determined to be $307,189 using the Black-Scholes model with the following assumptions: initial stock price $173.00, strike rate $253.00, dividend yield 0%, term 5 years, volatility 60.0% and risk-free rate 0.50%. The Company also issued 525 agent’s options with a fair value of $61,950 with an exercise price of $230.00. | As part of the capital raise that occurred on
October 31, 2023 as more fully described in the Subsequent Events Note 17, the Company issued 120,000 warrants to the underwriter exerciseable
at the lower of: $0.715 per warrant or a cashless exercise with a five year term.
Agent’s options outstanding as of the date
of the MD&A are as follows:
| Grant Date | |
Number of
options
outstanding | | |
Number of
options
exercisable | | |
Weighted
Average
Exercise
Price | | |
Expiry date | |
Remaining
contractual
life (years) | |
| 29-Sep-20 | |
| 1,135 | | |
| 1,135 | | |
$ | 660.00 | | |
28-Sep-25 | |
| 1.87 | |
| 29-Sep-20 | |
| 2,660 | | |
| 2,660 | | |
$ | 685.00 | | |
28-Sep-25 | |
| 1.87 | |
| 31-Dec-20 | |
| 647 | | |
| 647 | | |
$ | 1,150.00 | | |
30-Jun-24 | |
| 0.63 | |
| 11-Jan-22 | |
| 4,348 | | |
| 4,348 | | |
$ | 253.00 | | |
11-Jan-27 | |
| 3.16 | |
| 1-Apr-22 | |
| 525 | | |
| 525 | | |
$ | 230.00 | | |
8-Mar-27 | |
| 3.32 | |
| 31-Oct-23 | |
| 120,000 | | |
| 0 | | |
$ | 0.72 | | |
31-Oct-28 | |
| 4.97 | |
| Total | |
| 129,315 | | |
| 9,315 | | |
| 35.75 | | |
| |
| 4.79 | |
| |
(f) |
Share purchase warrants |
A summary of the Company’s
share purchase warrant activity is as follows:
| | |
Number of
Warrants | | |
average
exercise price | |
| | |
| | |
| |
| Outstanding, December 31, 2021 | |
| 51,213 | | |
$ | 989.00 | |
| Granted | |
| 291,391 | | |
$ | 94.00 | |
| Expired | |
| (1,284 | ) | |
$ | 3,347.00 | |
| Outstanding, December 31, 2022 | |
| 341,320 | | |
$ | 176.00 | |
| Granted | |
| 180,429 | | |
$ | 20.00 | |
| Exercised | |
| (390,748 | ) | |
$ | 9.00 | |
| Outstanding, September 30, 2023 | |
| 131,001 | | |
$ | 383.62 | |
As at September 30, 2023 the
share purchase warrants outstanding are as follows:
| Grant Date | |
Number of
Warrants
outstanding
and
exercisable | | |
Exercise
Price | | |
Expiry date |
| 29-Sep-20 | |
| 18,056 | | |
| 685.00 | | |
28-Sep-25 |
| 31-Dec-20 | |
| 12,945 | | |
| 1,150.00 | | |
30-Jun-24 |
| 11-Jan-22 | |
| 100,000 | | |
| 230.00 | | |
10-Jan-27 |
| Total | |
| 131,001 | | |
$ | 383.62 | | |
|
Transactions for the nine
months ended September 30, 2023 are as follows:
| | ● | 180,429 warrants were exercised on January 12, 2023. The Company issued 180,429 warrants to replace those warrants that were exercised. As an incentive to investors to exercise the 180,429 warrants, the Company issued cashless warrants to those investors that were exercisable as of March 31, 2023. As well, any holders of the $23.00 warrants that had a ratchet provision also became cashless. As a result, 210,318 cashless warrants were exercised in Q2 2023. |
Transactions for the nine
month period ended September 30, 2022 are as follows:
| ● | On January 11, 2022 as part of an underwritten public offering,
the Company issued a total of 100,000 share purchase warrants, exercisable at $230.00 per warrant and with a term of five years. |
|
| X |
- References
+ Details
| Name: |
ifrs-full_DisclosureOfClassesOfShareCapitalAbstract |
| Namespace Prefix: |
ifrs-full_ |
| Data Type: |
xbrli:stringItemType |
| Balance Type: |
na |
| Period Type: |
duration |
|
| X |
- DefinitionThe disclosure of classes of share capital. [Refer: Share capital [member]] Reference 1: http://www.xbrl.org/2003/role/disclosureRef
-Name IAS
-Number 1
-IssueDate 2023-01-01
-Paragraph 79
-Subparagraph a
-URI https://taxonomy.ifrs.org/xifrs-link?type=IAS&num=1&code=ifrs-tx-2023-en-r&anchor=para_79_a&doctype=Standard
-URIDate 2023-03-23
| Name: |
ifrs-full_DisclosureOfClassesOfShareCapitalExplanatory |
| Namespace Prefix: |
ifrs-full_ |
| Data Type: |
dtr-types:textBlockItemType |
| Balance Type: |
na |
| Period Type: |
duration |
|
v3.23.3
Cost of Sales
|
9 Months Ended |
Sep. 30, 2023 |
|---|
| Cost of Sales [Abstract] |
|
| COST OF SALES |
| (in thousands) | |
Nine months
ended
30-Sep-23 | | |
Nine months
ended
30-Sep-22 | | |
Three months
ended
30-Sep-23 | | |
Three months
ended
30-Sep-22 | |
| Inventory expensed | |
$ | 3,627 | | |
$ | 2,167 | | |
$ | 1,035 | | |
$ | 1,328 | |
| Royalties | |
| 300 | | |
| 178 | | |
| 103 | | |
| 84 | |
| Other expenses | |
| 638 | | |
| 806 | | |
| 214 | | |
| 300 | |
| Total | |
$ | 4,565 | | |
$ | 3,151 | | |
$ | 1,352 | | |
$ | 1,712 | |
|
| X |
- DefinitionThe disclosure of the cost of sales. [Refer: Cost of sales] Reference 1: http://www.xbrl.org/2009/role/commonPracticeRef
-Name IAS
-Number 1
-IssueDate 2023-01-01
-Paragraph 10
-Subparagraph e
-URI https://taxonomy.ifrs.org/xifrs-link?type=IAS&num=1&code=ifrs-tx-2023-en-r&anchor=para_10_e&doctype=Standard
-URIDate 2023-03-23
| Name: |
ifrs-full_DisclosureOfCostOfSalesExplanatory |
| Namespace Prefix: |
ifrs-full_ |
| Data Type: |
dtr-types:textBlockItemType |
| Balance Type: |
na |
| Period Type: |
duration |
|
| X |
- References
+ Details
| Name: |
us-gaap_RetailLandSalesEstimatedCostOfMajorImprovementsAbstract |
| Namespace Prefix: |
us-gaap_ |
| Data Type: |
xbrli:stringItemType |
| Balance Type: |
na |
| Period Type: |
duration |
|
v3.23.3
Selling and Marketing Expenses
|
9 Months Ended |
Sep. 30, 2023 |
|---|
| Selling and Marketing Expenses [Abstract] |
|
| SELLING AND MARKETING EXPENSES |
| 10. | SELLING
AND MARKETING EXPENSES |
| (in thousands) | |
Nine months
ended
30-Sep-23 | | |
Nine months
ended
30-Sep-22 | | |
Three months
ended
30-Sep-23 | | |
Three months
ended
30-Sep-22 | |
| Salaries and related expenses | |
$ | 2,007 | | |
$ | 1,981 | | |
$ | 691 | | |
$ | 720 | |
| Advertising and marketing | |
$ | 1,321 | | |
| 1,334 | | |
| 697 | | |
| 472 | |
| Travel and conferences | |
$ | 137 | | |
| 119 | | |
| 36 | | |
| 33 | |
| Total | |
$ | 3,465 | | |
$ | 3,434 | | |
$ | 1,424 | | |
$ | 1,225 | |
|
| X |
- References
+ Details
| Name: |
syta_SellingAndMarketingExpensesAbstract |
| Namespace Prefix: |
syta_ |
| Data Type: |
xbrli:stringItemType |
| Balance Type: |
na |
| Period Type: |
duration |
|
| X |
- References
+ Details
| Name: |
syta_SellingAndMarketingExpensesTextBlock |
| Namespace Prefix: |
syta_ |
| Data Type: |
dtr:textBlockItemType |
| Balance Type: |
na |
| Period Type: |
duration |
|
v3.23.3
General and Administrative Expenses
|
9 Months Ended |
Sep. 30, 2023 |
|---|
| General and Administrative Expenses [Abstract] |
|
| GENERAL AND ADMINISTRATIVE EXPENSES |
| 11. | GENERAL
AND ADMINISTRATIVE EXPENSES |
| (in thousands) | |
Nine months
ended
30-Sep-23 | | |
Nine months
ended
30-Sep-22 | | |
Three months
ended
30-Sep-23 | | |
Three months
ended
30-Sep-22 | |
| Salaries and related expenses | |
$ | 725 | | |
| 438 | | |
$ | 284 | | |
$ | 144 | |
| Professional services | |
| 1,622 | | |
| 1,349 | | |
| 296 | | |
| 408 | |
| Consulting and director fees | |
| 782 | | |
| 949 | | |
| 296 | | |
| 251 | |
| Travel | |
| 63 | | |
| 107 | | |
| 16 | | |
| 9 | |
| Office and general | |
| 906 | | |
| 1,244 | | |
| 296 | | |
| 260 | |
| Regulatory and filing fees | |
| 143 | | |
| 109 | | |
| 59 | | |
| 44 | |
| Shareholder relations | |
| 173 | | |
| 489 | | |
| 71 | | |
| 58 | |
| Total | |
$ | 4,414 | | |
| 4,685 | | |
$ | 1,318 | | |
$ | 1,174 | |
|
| X |
- DefinitionThe disclosure of general and administrative expenses. [Refer: Administrative expenses] Reference 1: http://www.xbrl.org/2009/role/commonPracticeRef
-Name IAS
-Number 1
-IssueDate 2023-01-01
-Paragraph 10
-Subparagraph e
-URI https://taxonomy.ifrs.org/xifrs-link?type=IAS&num=1&code=ifrs-tx-2023-en-r&anchor=para_10_e&doctype=Standard
-URIDate 2023-03-23
| Name: |
ifrs-full_DisclosureOfGeneralAndAdministrativeExpenseExplanatory |
| Namespace Prefix: |
ifrs-full_ |
| Data Type: |
dtr-types:textBlockItemType |
| Balance Type: |
na |
| Period Type: |
duration |
|
| X |
- References
+ Details
| Name: |
ifrs-full_SellingGeneralAndAdministrativeExpenseAbstract |
| Namespace Prefix: |
ifrs-full_ |
| Data Type: |
xbrli:stringItemType |
| Balance Type: |
na |
| Period Type: |
duration |
|
v3.23.3
Transaction Costs
|
9 Months Ended |
Sep. 30, 2023 |
|---|
| Transaction Costs [Abstract] |
|
| TRANSACTION COSTS |
Transaction costs incurred in relation
to the January 2023 warrant raise and issuance described in Note 8 were $439,600 and were included in the change in fair value of warrant
liability on the statement of operations.
Transaction costs incurred in the nine
months ended September 30, 2022 were $965,247, which are costs incurred for the January 11, 2022 capital raise that were allocated to
the warrant liability and expensed through the statement of operations.
|
| X |
- DefinitionThe disclosure of finance income (cost). [Refer: Finance income (cost)] Reference 1: http://www.xbrl.org/2009/role/commonPracticeRef
-Name IAS
-Number 1
-IssueDate 2023-01-01
-Paragraph 10
-Subparagraph e
-URI https://taxonomy.ifrs.org/xifrs-link?type=IAS&num=1&code=ifrs-tx-2023-en-r&anchor=para_10_e&doctype=Standard
-URIDate 2023-03-23
| Name: |
ifrs-full_DisclosureOfFinanceIncomeExpenseExplanatory |
| Namespace Prefix: |
ifrs-full_ |
| Data Type: |
dtr-types:textBlockItemType |
| Balance Type: |
na |
| Period Type: |
duration |
|
| X |
- References
+ Details
| Name: |
syta_TransactionCostsLineItems |
| Namespace Prefix: |
syta_ |
| Data Type: |
xbrli:stringItemType |
| Balance Type: |
na |
| Period Type: |
duration |
|
v3.23.3
Financial Instruments
|
9 Months Ended |
Sep. 30, 2023 |
|---|
| Financial Instruments [Abstract] |
|
| FINANCIAL INSTRUMENTS |
The fair values of the Company’s
cash, trade and other receivables, accounts payable and accrued liabilities and long-term debt, approximate carrying value, which is the
amount recorded on the consolidated statement of financial position.
Credit risk
Credit risk is the risk of an unexpected
loss if a customer or third party to a financial instrument fails to meet its contractual obligations. The Company places its cash with
institutions of high creditworthiness. Management has assessed there to be a low level of credit risk associated with its cash balances.
The Company’s exposure to credit
risk is influenced mainly by the individual characteristics of each customer. However, management also considers the demographics of the
Company’s customer base, including the default risk of the industry and country in which customers operate, as these factors may
have an influence on credit risk. Approximately 19% of the Company’s revenue for the nine months ended September 30, 2023 (September
30, 2022 -26%) is attributable to sales transactions with a single customer.
The Company has established a credit
policy under which each new customer is analyzed individually for creditworthiness before28 the Company’s standard payment and delivery
terms and conditions are offered. The Company’s review includes external ratings, when available, and in some cases bank references.
Purchase limits are established for each customer, which represents the maximum open amount without requiring approval from the Risk Management
Committee; these limits are reviewed quarterly. In prior years, certain key customers were offered extended payment terms on their purchases
due to slow down from Covid-19 and budget approvals for government tenders.
As a result, the Company had customers
with overdue receivables on their books which resulted in the Company taking a bad debt provision on these overdue receivables which amounted
to $1,047,802 at September 30, 2023 (September 30, 2022 - $1,028,000). More than 60% (2022 – 22%) of
the Company’s customers have been active with the Company for over four years, and the allowance for doubtful accounts of $1,047,802
(2022 - $1,028,000) has been recognized against these customers. In monitoring customer credit risk, customers are grouped according to
their credit characteristics, including whether they are an individual or legal entity, whether they are a wholesale, retail or end-user
customer, geographic location, industry, aging profile, maturity, and the existence of previous financial difficulties. Trade and other
receivables relate mainly to the Company’s wholesale customers. Customers that are graded as “high risk” are placed
on a restricted customer list and monitored by the Company.
The carrying amount of financial assets
represents the maximum credit exposure, notwithstanding the carrying amount of security or any other credit enhancements.
Liquidity risk
Liquidity risk is the risk that the
Company will encounter difficulty in meeting the obligations associated with its financial liabilities that are settled by delivering
cash or another financial asset. The Company’s approach to managing liquidity is to ensure, as far as possible, that it will always
have sufficient liquidity to meet its liabilities when due, under both normal and stressed conditions, without incurring unacceptable
losses or risking damage to the Company’s reputation.
The Company examines current forecasts
of its liquidity requirements so as to make certain that there is sufficient cash for its operating needs, and it is careful at all times
to have enough unused credit facilities so that the Company does not exceed its credit limits and is in compliance with its financial
covenants (if any). These forecasts take into consideration matters such as the Company’s plan to use debt for financing its activity,
compliance with required financial covenants, compliance with certain liquidity ratios, and compliance with external requirements such
as laws or regulation.
The Company uses activity-based costing
to cost its products and services, which assists it in monitoring cash flow requirements and optimizing its cash return on investments.
Typically, the Company ensures that it has sufficient cash on demand to meet expected operational expenses for a period of 90 days, including
the servicing of financial obligations; this excludes the potential impact of extreme circumstances that cannot reasonably be predicted,
such as natural disasters.
With the exception of employee benefits,
the Company’s accounts payable and accrued liabilities have contractual terms of 90 days. The employment benefits included in accrued
liabilities have variable maturities within the coming year. Market risk
Currency risk is the risk that the fair
value or future cash flows of a financial instrument will fluctuate because of changes in foreign exchange rates.
Interest rate risk is the risk that
the fair value of future cash flows will fluctuate as a result of changes in interest rates. The Company’s sensitivity to interest
rates is inherently involved in the calculation of the fair value of the warranty liability which are revalued based on changes parameters
which include the prevailing interest rate.
The Company is exposed to price risk
with respect to equity prices. Equity price risk is defined as the potential adverse impact on the Company’s earnings due to movements
in individual equity prices or general movements in the level of the stock market. The Company closely monitors individual equity movements,
and the stock market to determine the appropriate course of action to be taken by the Company.
|
| X |
- DefinitionThe disclosure of derivative financial instruments. [Refer: Derivatives [member]] Reference 1: http://www.xbrl.org/2009/role/commonPracticeRef
-Name IAS
-Number 1
-IssueDate 2023-01-01
-Paragraph 10
-Subparagraph e
-URI https://taxonomy.ifrs.org/xifrs-link?type=IAS&num=1&code=ifrs-tx-2023-en-r&anchor=para_10_e&doctype=Standard
-URIDate 2023-03-23
| Name: |
ifrs-full_DisclosureOfDerivativeFinancialInstrumentsExplanatory |
| Namespace Prefix: |
ifrs-full_ |
| Data Type: |
dtr-types:textBlockItemType |
| Balance Type: |
na |
| Period Type: |
duration |
|
| X |
- References
+ Details
| Name: |
ifrs-full_DisclosureOfFinancialInstrumentsAbstract |
| Namespace Prefix: |
ifrs-full_ |
| Data Type: |
xbrli:stringItemType |
| Balance Type: |
na |
| Period Type: |
duration |
|
v3.23.3
Related Party Transactions
|
9 Months Ended |
Sep. 30, 2023 |
|---|
| Related Party Transactions [Abstract] |
|
| RELATED PARTY TRANSACTIONS |
| 14. | RELATED
PARTY TRANSACTIONS |
Key Personnel Compensation
Key management personnel includes those
persons having authority and responsibility for planning, directing, and controlling the activities of the Company as a whole. The Company
has determined that key management personnel consists of executive and non-executive members of the Company’s Board of Directors
and corporate officers. The remuneration of directors and key management personnel for the three and six month period ended June 30, 2023
and 2022 are as follows:
| | |
2023 | | |
2022 | |
| Payments to key management personnel: | |
| | |
| |
| Salaries, consulting and directors’ fees | |
$ | 1,007,410 | | |
$ | 1,162,885 | |
| Share-based payments | |
| 593,146 | | |
| 1,824,713 | |
| Total | |
$ | 1,600,556 | | |
$ | 2,987,598 | |
Salaries, consulting and
directors’ fees shown above are classified within profit and loss as shown below:
| | |
| |
(in thousands) | |
| Type of Service | |
Nature of Relationship | |
2023 | | |
2022 | |
| Selling and marketing expenses | |
VP Technology/VP Sales International | |
$ | 225 | | |
$ | 234 | |
| General and administrative expense | |
Companies controlled by the CEO, CFO and Directors | |
$ | 782 | | |
$ | 929 | |
|
v3.23.3
Segmented Information
|
9 Months Ended |
Sep. 30, 2023 |
|---|
| Segmented Information Disclosure [Abstract] |
|
| SEGMENTED INFORMATION |
| 15. |
SEGMENTED INFORMATION |
The Company is domiciled in Canada,
and it operates and produces its income primarily in Israel, Europe and North America. The Company operates as a single segment being
the sale of cellular-based communications products.
The Company’s entity-wide disclosures
include disaggregated information about product sales, geographical areas, and major customers.
Geographical area information is shown
below:
| External revenues by Geography for the three and nine month period ended | |
9 months ended Sep 30 | | |
3 months ended Sep 30 | |
| (in thousands) | |
2023 | | |
2022 | | |
2023 | | |
2022 | |
| USA | |
$ | 4,478 | | |
$ | 2,368 | | |
$ | 1,276 | | |
$ | 1,648 | |
| Canada | |
| 1,036 | | |
| 1,114 | | |
| 304 | | |
| 495 | |
| EMEA | |
| 842 | | |
| 841 | | |
| 262 | | |
| 391 | |
| Australia | |
| - | | |
| 47 | | |
| - | | |
| 34 | |
| Total | |
$ | 6,356 | | |
$ | 4,370 | | |
$ | 1,842 | | |
$ | 2,568 | |
Non-current asset geographic area information
is shown below:
| (in thousands) | |
Sept 30,
2023 | | |
December 31,
2022 | |
| Long-term receivable total | |
$ | 137 | | |
$ | 150 | |
| Canada | |
| - | | |
| - | |
| EMEA | |
| 137 | | |
| 150 | |
| | |
| | | |
| | |
| Right of use asset total | |
$ | 666 | | |
$ | 887 | |
| Canada | |
| 100 | | |
| 177 | |
| EMEA | |
| 566 | | |
| 710 | |
| | |
| | | |
| | |
| Equipment total | |
$ | 180 | | |
$ | 207 | |
| Canada | |
| - | | |
| - | |
| EMEA | |
| 180 | | |
| 207 | |
| | |
| | | |
| | |
| Intangibles total | |
$ | 7,997 | | |
$ | 6,988 | |
| Canada | |
| 36 | | |
| - | |
| EMEA | |
| 7,961 | | |
| 6,988 | |
Product information is shown below:
| Revenue by product line | |
9 months ended Sep 30 | | |
3 months ended Sep 30 | |
| (in thousands) | |
2023 | | |
2022 | | |
2023 | | |
2022 | |
| Cellular boosters and related accessories | |
$ | 1,800 | | |
| 1,882 | | |
$ | 778 | | |
| 717 | |
| Rugged devices and related accessories | |
$ | 4,556 | | |
| 2,488 | | |
$ | 1,064 | | |
| 1,851 | |
| Total | |
$ | 6,356 | | |
$ | 4,370 | | |
$ | 1,842 | | |
$ | 2,568 | |
|
| X |
- References
+ Details
| Name: |
syta_SegmentedInformationDisclosureTextBlock |
| Namespace Prefix: |
syta_ |
| Data Type: |
dtr:textBlockItemType |
| Balance Type: |
na |
| Period Type: |
duration |
|
v3.23.3
Supplemental Information with Respect to Cash Flows
|
9 Months Ended |
Sep. 30, 2023 |
|---|
| Supplemental Information with Respect to Cash Flows [Abstract] |
|
| SUPPLEMENTAL INFORMATION WITH RESPECT TO CASH FLOWS |
| 16. | SUPPLEMENTAL
INFORMATION WITH RESPECT TO CASH FLOWS |
| | |
Nine months ended
September 30 | |
| | |
2023 | | |
2022 | |
| Change in non-cash working capital: | |
| | |
| |
| Trade and other receivables | |
$ | (631,278 | ) | |
$ | (326,749 | ) |
| Prepaids | |
| (54,974 | ) | |
| (390,022 | ) |
| Inventory | |
| 1,596,000 | | |
| (2,903,506 | ) |
| Advances to suppliers | |
| (1,385,957 | ) | |
| (638,831 | ) |
| Accounts payable and accrued liabilities | |
| (489,431 | ) | |
| (528,817 | ) |
| Deferred revenue | |
| (149,600 | ) | |
| - | |
| | |
$ | (1,115,240 | ) | |
$ | (4,787,926 | ) |
For the nine months ended September
30, 2023, the Company paid $42,783 (September 30, 2022 - $39,869) in interest and $Nil (September 30, 2022 - $nil) in income taxes.
|
| X |
- DefinitionThe entire disclosure for a statement of cash flows. Reference 1: http://www.xbrl.org/2003/role/disclosureRef
-Name IAS
-Number 7
-IssueDate 2023-01-01
-Section Presentation of a statement of cash flows
-URI https://taxonomy.ifrs.org/xifrs-link?type=IAS&num=7&code=ifrs-tx-2023-en-r&doctype=Standard&dita_xref=IAS07_g10-17_TI
-URIDate 2023-03-23
| Name: |
ifrs-full_DisclosureOfCashFlowStatementExplanatory |
| Namespace Prefix: |
ifrs-full_ |
| Data Type: |
dtr-types:textBlockItemType |
| Balance Type: |
na |
| Period Type: |
duration |
|
| X |
- References
+ Details
| Name: |
ifrs-full_StatementOfCashFlowsAbstract |
| Namespace Prefix: |
ifrs-full_ |
| Data Type: |
xbrli:stringItemType |
| Balance Type: |
na |
| Period Type: |
duration |
|
v3.23.3
Subsequent Events
|
9 Months Ended |
Sep. 30, 2023 |
|---|
| Subsequent Events [Abstract] |
|
| SUBSEQUENT EVENTS |
Subsequent to the period end, the Company’s
registered offering of common shares on October 31, 2023, resulted in the Company issuing both 1,870.000 common shares at $0.65 per share
plus 530,000 prefunded warrants at $0.64 per warrant, with a prefunded warrant exercise price of $0.01 per share, for total gross proceeds
of $1,554,700 before offering and underwriting expenses. On November 1, 2023, 180,000 of the prefunded warrants were exercised and converted
into 177,313 common shares of the Company.
On October 3, 2023, an investor exercised
their right to convert 900 RSU’s into 900 common shares of the Company.
|
| X |
- DefinitionThe entire disclosure for events after the reporting period. Reference 1: http://www.xbrl.org/2003/role/disclosureRef
-Name IAS
-Number 10
-IssueDate 2023-01-01
-Section Disclosure
-URI https://taxonomy.ifrs.org/xifrs-link?type=IAS&num=10&code=ifrs-tx-2023-en-r&doctype=Standard&dita_xref=IAS10_g17-22_TI
-URIDate 2023-03-23
| Name: |
ifrs-full_DisclosureOfEventsAfterReportingPeriodExplanatory |
| Namespace Prefix: |
ifrs-full_ |
| Data Type: |
dtr-types:textBlockItemType |
| Balance Type: |
na |
| Period Type: |
duration |
|
| X |
- References
+ Details
| Name: |
syta_SubsequentEventAbstract |
| Namespace Prefix: |
syta_ |
| Data Type: |
xbrli:stringItemType |
| Balance Type: |
na |
| Period Type: |
duration |
|
v3.23.3
Accounting Policies, by Policy (Policies)
|
9 Months Ended |
Sep. 30, 2023 |
|---|
| Accounting Policies [Abstract] |
|
| Basis of consolidation and presentation |
Basis of consolidation and presentation These unaudited condensed interim consolidated
financial statements of the Company have been prepared on a historical cost basis, except for financial instruments classified as financial
instruments at fair value through profit and loss, which are stated at their fair value. In addition, the condensed interim consolidated
financial statements have been prepared using the accrual basis of accounting, except for the statement of cash flows. These unaudited condensed interim consolidated
financial statements incorporate the financial statements of the Company and its wholly controlled subsidiaries. Control exists when the
Company has the power, directly or indirectly, to govern the financial and operating policies of an entity so as to obtain benefits from
its activities. These condensed interim consolidated financial statements include the accounts of the Company and its direct wholly-owned
subsidiaries. All intercompany transactions and balances have been eliminated. The unaudited condensed interim consolidated
financial statements include the accounts of the Company and its wholly-owned subsidiaries:
| Name of Subsidiary |
|
Place of Incorporation |
|
Ownership |
|
| Queensgate Resources Corp. |
|
British Columbia, Canada |
|
|
100 |
% |
| Queensgate Resources US Corp. |
|
Nevada, USA |
|
|
100 |
% |
| Siyata Mobile (Canada) Inc. |
|
British Columbia, Canada |
|
|
100 |
% |
| Siyata Mobile Israel Ltd. |
|
Israel |
|
|
100 |
% |
| Signifi Mobile Inc. |
|
Quebec, Canada |
|
|
100 |
% |
| ClearRF Nevada Ltd. |
|
Nevada, USA |
|
|
100 |
% |
|
| Recent adoptions of accounting pronouncements |
Recent adoptions
of accounting pronouncements The following amendments became effective
on January 1, 2023, and did not have a material impact on the Company’s condensed interim consolidated financial statements:
| ● | In
February 2021, the IASB issued Definition of Accounting Estimates (Amendments to IAS 8). The amendments define accounting estimates and
clarify the distinction between changes in accounting estimates and changes in accounting policies. |
| ● | In
February 2021, the IASB issued Disclosure of Accounting Policies (Amendments to IAS 1 and IFRS Practice Statement 2). The amendments
provide guidance to help entities disclose their material (previously “significant”) accounting policies. |
| ● | In
May 2021, the IASB issued Deferred Tax related to Assets and Liabilities arising from a Single Transaction (Amendments to IAS 12). The
amendments narrow the scope of the recognition exemption so that companies would be required to recognize deferred tax for transactions
that give rise to equal amounts of taxable and deductible temporary differences, such as leases. |
|
| Future accounting pronouncements |
Future accounting pronouncements The standards, amendments, and interpretations
issued before 2023 but not yet adopted by the Company have been disclosed in Note 3 of the Company’s December 31, 2022 annual consolidated
financial statements. The Company is currently considering the impact of adopting these standards, amendments and interpretations on its
consolidated financial statement.
|
| X |
- DefinitionThe description of the entity's material accounting policy basis of consolidation and presentation.
| Name: |
syta_DescriptionOfAccountingPolicyForBasisOfConsolidationAndPresentationTextBlock |
| Namespace Prefix: |
syta_ |
| Data Type: |
dtr:textBlockItemType |
| Balance Type: |
na |
| Period Type: |
duration |
|
| X |
- DefinitionThe description of the entity's material accounting policy information for recent adoptions of accounting pronouncements.
| Name: |
syta_DescriptionOfAccountingPolicyForRecentAdoptionsOfAccountingPronouncementsTextBlock |
| Namespace Prefix: |
syta_ |
| Data Type: |
dtr:textBlockItemType |
| Balance Type: |
na |
| Period Type: |
duration |
|
| X |
- DefinitionNew Accounting Pronouncements Policy Text Block.
| Name: |
syta_NewAccountingPronouncementsPolicyTextBlock |
| Namespace Prefix: |
syta_ |
| Data Type: |
dtr:textBlockItemType |
| Balance Type: |
na |
| Period Type: |
duration |
|
| X |
- References
+ Details
| Name: |
us-gaap_AccountingPoliciesAbstract |
| Namespace Prefix: |
us-gaap_ |
| Data Type: |
xbrli:stringItemType |
| Balance Type: |
na |
| Period Type: |
duration |
|
v3.23.3
Basis of Preparation (Tables)
|
9 Months Ended |
Sep. 30, 2023 |
|---|
| Basis of Preparation [Abstract] |
|
| Schedule of Unaudited Condensed Interim Consolidated Financial Statements |
The unaudited condensed interim consolidated
financial statements include the accounts of the Company and its wholly-owned subsidiaries:
| Name of Subsidiary |
|
Place of Incorporation |
|
Ownership |
|
| Queensgate Resources Corp. |
|
British Columbia, Canada |
|
|
100 |
% |
| Queensgate Resources US Corp. |
|
Nevada, USA |
|
|
100 |
% |
| Siyata Mobile (Canada) Inc. |
|
British Columbia, Canada |
|
|
100 |
% |
| Siyata Mobile Israel Ltd. |
|
Israel |
|
|
100 |
% |
| Signifi Mobile Inc. |
|
Quebec, Canada |
|
|
100 |
% |
| ClearRF Nevada Ltd. |
|
Nevada, USA |
|
|
100 |
% |
|
| X |
- References
+ Details
| Name: |
ifrs-full_DisclosureOfVoluntaryChangeInAccountingPolicyAbstract |
| Namespace Prefix: |
ifrs-full_ |
| Data Type: |
xbrli:stringItemType |
| Balance Type: |
na |
| Period Type: |
duration |
|
| X |
- DefinitionThe disclosure of consolidated financial statements.
| Name: |
syta_DisclosureOfConsolidatedFinancialStatementsTableTextBlock |
| Namespace Prefix: |
syta_ |
| Data Type: |
dtr:textBlockItemType |
| Balance Type: |
na |
| Period Type: |
duration |
|
v3.23.3
Trade and Other Receivables (Tables)
|
9 Months Ended |
Sep. 30, 2023 |
|---|
| Trade and Other Receivables [Abstract] |
|
| Schedule of Trade and Other Receivables |
| | |
September 30,
2023 | | |
December 31,
2022 | |
| Trade receivables | |
$ | 2,752,951 | | |
$ | 2,015,291 | |
| Allowance for doubtful accounts | |
| (1,047,802 | ) | |
| (1,056,393 | ) |
| Taxes receivable | |
| 474,097 | | |
| 615,730 | |
| Total | |
$ | 2,179,246 | | |
$ | 1,574,628 | |
|
| X |
- DefinitionThe disclosure of loans and advances to customers. [Refer: Loans and advances to customers] Reference 1: http://www.xbrl.org/2009/role/commonPracticeRef
-Name IAS
-Number 1
-IssueDate 2023-01-01
-Paragraph 10
-Subparagraph e
-URI https://taxonomy.ifrs.org/xifrs-link?type=IAS&num=1&code=ifrs-tx-2023-en-r&anchor=para_10_e&doctype=Standard
-URIDate 2023-03-23
| Name: |
ifrs-full_DisclosureOfLoansAndAdvancesToCustomersExplanatory |
| Namespace Prefix: |
ifrs-full_ |
| Data Type: |
dtr-types:textBlockItemType |
| Balance Type: |
na |
| Period Type: |
duration |
|
v3.23.3
Inventory (Tables)
|
9 Months Ended |
Sep. 30, 2023 |
|---|
| Inventory [Abstract] |
|
| Schedule of Inventory |
| | |
September 30,
2023 | | |
December 31,
2022 | |
| Finished products | |
$ | 2,601,980 | | |
$ | 7,392,002 | |
| Impairment of finished products | |
| - | | |
| (3,555,683 | ) |
| Accessories and spare parts | |
| 299,934 | | |
| 675,001 | |
| Impairment of accessories and spare parts | |
| - | | |
| (418,770 | ) |
| Total | |
$ | 2,901,914 | | |
$ | 4,092,550 | |
|
| X |
- References
+ Details
| Name: |
syta_InventoryAbstract |
| Namespace Prefix: |
syta_ |
| Data Type: |
xbrli:stringItemType |
| Balance Type: |
na |
| Period Type: |
duration |
|
v3.23.3
Warrant Liability (Tables)
|
9 Months Ended |
Sep. 30, 2023 |
|---|
| Warrant Liability [Abstract] |
|
| Schedule of the Warrant Liability |
The balance of the warrant liability
is as follows:
| | |
November 3,
2021 | | |
January 11,
2022 | | |
October 12,
2022 | | |
January 19,
2023 | | |
Total | |
| Balance December 31, 2022 | |
$ | 197,733 | | |
$ | 501,330 | | |
$ | 2,035,741 | | |
$ | - | | |
$ | 2,734,804 | |
| Exercise of warrants | |
| (197,733 | ) | |
| - | | |
| (1,717,801 | ) | |
| - | | |
| (1,915,534 | ) |
| Warrants issued | |
| - | | |
| - | | |
| - | | |
| 2,875,580 | | |
| 2,875,580 | |
| Transfer to equity | |
| - | | |
| - | | |
| (564,946 | ) | |
| (3,410,100 | ) | |
| (3,975,046 | ) |
| Change in fair value | |
| - | | |
| (487,407 | ) | |
| 247,006 | | |
| 534,520 | | |
| 294,119 | |
| Balance September 30, 2023 | |
$ | - | | |
$ | 13,923 | | |
$ | - | | |
$ | - | | |
$ | 13,923 | |
|
| X |
- References
+ Details
| Name: |
ifrs-full_WarrantyProvisionAbstract |
| Namespace Prefix: |
ifrs-full_ |
| Data Type: |
xbrli:stringItemType |
| Balance Type: |
na |
| Period Type: |
duration |
|
| X |
- DefinitionTabular disclosure of condensed financial statements, including, but not limited to, the balance sheet, income statement, and statement of cash flows. Reference 1: http://www.xbrl.org/2009/role/commonPracticeRef
-Name Regulation S-X (SX)
-Number 210
-Section 12
-Subsection 04
-Paragraph (a)
-Publisher SEC
| Name: |
srt_ScheduleOfCondensedFinancialStatementsTableTextBlock |
| Namespace Prefix: |
srt_ |
| Data Type: |
dtr-types:textBlockItemType |
| Balance Type: |
na |
| Period Type: |
duration |
|
v3.23.3
Share Capital (Tables)
|
9 Months Ended |
Sep. 30, 2023 |
|---|
| Share Capital [Abstract] |
|
| Schedule of Stock Option Activity |
A summary of the Company’s
stock option activity is as follows:
| | |
| | |
Weighted | |
| | |
Number of | | |
Average | |
| | |
Stock | | |
Exercise | |
| | |
Options | | |
Price | |
| Outstanding options, December 31, 2021 | |
| 4,146 | | |
$ | 1,388.00 | |
| Granted | |
| 11,450 | | |
| 115.00 | |
| Expired/Cancelled | |
| (534 | ) | |
| (3,090.00 | ) |
| Outstanding options, December 31, 2022 | |
| 15,062 | | |
$ | 352.91 | |
| Granted | |
| - | | |
| - | |
| Expired/Cancelled | |
| - | | |
| - | |
| Outstanding options, September 30, 2023 | |
| 15,062 | | |
$ | 352.91 | |
| | |
Number of
RSU’s | | |
Weighted
Average
Issue Price | |
| Outstanding RSU, December 31, 2021 | |
| 0 | | |
$ | - | |
| Granted | |
| 31,950 | | |
| 105.08 | |
| Exercised | |
| (300 | ) | |
| (103.00 | ) |
| Outstanding RSU, December 31, 2022 | |
| 31,650 | | |
$ | 105.02 | |
| Granted | |
| - | | |
| - | |
| Exercised | |
| - | | |
| - | |
| Outstanding RSU, September 30, 2023 | |
| 31,650 | | |
$ | 105.02 | |
| | |
Number of
options | | |
Weighted
average
exercise
price | |
| Outstanding agent options, December 31, 2021 | |
| 4,459 | | |
$ | 751.00 | |
| Granted | |
| 4,873 | | |
| 251.00 | |
| Expired | |
| (17 | ) | |
| 2,049.00 | |
| Outstanding agent options, December 31, 2022 | |
| 9,315 | | |
$ | 487.06 | |
| Granted | |
| - | | |
| - | |
| Expired | |
| - | | |
| - | |
| Outstanding agent options, September 30, 2023 | |
| 9,315 | | |
$ | 487.06 | |
| | |
Number of
Warrants | | |
average
exercise price | |
| | |
| | |
| |
| Outstanding, December 31, 2021 | |
| 51,213 | | |
$ | 989.00 | |
| Granted | |
| 291,391 | | |
$ | 94.00 | |
| Expired | |
| (1,284 | ) | |
$ | 3,347.00 | |
| Outstanding, December 31, 2022 | |
| 341,320 | | |
$ | 176.00 | |
| Granted | |
| 180,429 | | |
$ | 20.00 | |
| Exercised | |
| (390,748 | ) | |
$ | 9.00 | |
| Outstanding, September 30, 2023 | |
| 131,001 | | |
$ | 383.62 | |
|
| Schedule of Stock Options Outstanding |
As at September 30, 2023 stock
options outstanding are as follows:
| Grant Date |
|
Number of
options
outstanding |
|
|
Number of
options
exercisable |
|
|
Weighted
Average
Exercise
Price |
|
|
Expiry date |
|
Remaining
contractual
life (years) |
|
| 24-Dec-18 |
|
|
129 |
|
|
|
129 |
|
|
|
5,400.00
|
|
|
24-Dec-23 |
|
|
0.23 |
|
| 15-Jan-19 |
|
|
8 |
|
|
|
8 |
|
|
|
5,400.00 |
|
|
15-Jan-24 |
|
|
0.29 |
|
| 21-Mar-19 |
|
|
123 |
|
|
|
123 |
|
|
|
5,900.00 |
|
|
21-Mar-24 |
|
|
0.47 |
|
| 1-Jan-20 |
|
|
21 |
|
|
|
21 |
|
|
|
5,400.00 |
|
|
1-Jan-24 |
|
|
0.25 |
|
| 15-Nov-20 |
|
|
950 |
|
|
|
950 |
|
|
|
600.00 |
|
|
15-Nov-30 |
|
|
7.13 |
|
| 15-Nov-20 |
|
|
1,615 |
|
|
|
1,615 |
|
|
|
600.00 |
|
|
15-Nov-25 |
|
|
2.13 |
|
| 2-Jan-21 |
|
|
570 |
|
|
|
570 |
|
|
|
1,150.00 |
|
|
2-Jan-26 |
|
|
2.26 |
|
| 2-Jan-21 |
|
|
50 |
|
|
|
50 |
|
|
|
1,150.00 |
|
|
2-Jan-31 |
|
|
7.26 |
|
| 18-Jan-21 |
|
|
145 |
|
|
|
145 |
|
|
|
1,150.00 |
|
|
18-Jan-26 |
|
|
2.30 |
|
| 1-Jan-22 |
|
|
200 |
|
|
|
200 |
|
|
|
400.00 |
|
|
29-Oct-26 |
|
|
3.08 |
|
| 13-Apr-22 |
|
|
7,950 |
|
|
|
3,975 |
|
|
|
110.00 |
|
|
13-Apr-27 |
|
|
3.54 |
|
| 12-Jul-22 |
|
|
3,300 |
|
|
|
1,375 |
|
|
|
110.00 |
|
|
12-Jul-25 |
|
|
1.78 |
|
| Total |
|
|
15,061 |
|
|
|
9,161 |
|
|
$ |
352.91 |
|
|
|
|
|
3.12 |
|
| Grant Date | |
Number of
RSU’s
outstanding | | |
Weighted Average
Issue Price | |
| 9-Mar-22 | |
| 2,250,000 | | |
| 1.03 | |
| 13-Apr-22 | |
| 825,000 | | |
| 1.10 | |
| 12-Jul-22 | |
| 90,000 | | |
| 1.10 | |
| Total | |
| 3,165,000 | | |
$ | 1.05 | |
| Grant Date | |
Number of
options
outstanding | | |
Number of
options
exercisable | | |
Weighted
Average
Exercise
Price | | |
Expiry date | |
Remaining
contractual
life (years) | |
| 29-Sep-20 | |
| 1,135 | | |
| 1,135 | | |
$ | 660.00 | | |
28-Sep-25 | |
| 2.00 | |
| 29-Sep-20 | |
| 2,660 | | |
| 2,660 | | |
$ | 685.00 | | |
28-Sep-25 | |
| 2.00 | |
| 31-Dec-20 | |
| 647 | | |
| 647 | | |
$ | 1,150.00 | | |
30-Jun-24 | |
| 0.75 | |
| 11-Jan-22 | |
| 4,348 | | |
| 4,348 | | |
$ | 253.00 | | |
11-Jan-27 | |
| 3.28 | |
| 1-Apr-22 | |
| 525 | | |
| 525 | | |
$ | 230.00 | | |
8-Mar-27 | |
| 3.44 | |
| Total | |
| 9,315 | | |
| 9,315 | | |
| 487.06 | | |
| |
| 2.59 | |
| Grant Date | |
Number of
options
outstanding | | |
Number of
options
exercisable | | |
Weighted
Average
Exercise
Price | | |
Expiry date | |
Remaining
contractual
life (years) | |
| 29-Sep-20 | |
| 1,135 | | |
| 1,135 | | |
$ | 660.00 | | |
28-Sep-25 | |
| 1.87 | |
| 29-Sep-20 | |
| 2,660 | | |
| 2,660 | | |
$ | 685.00 | | |
28-Sep-25 | |
| 1.87 | |
| 31-Dec-20 | |
| 647 | | |
| 647 | | |
$ | 1,150.00 | | |
30-Jun-24 | |
| 0.63 | |
| 11-Jan-22 | |
| 4,348 | | |
| 4,348 | | |
$ | 253.00 | | |
11-Jan-27 | |
| 3.16 | |
| 1-Apr-22 | |
| 525 | | |
| 525 | | |
$ | 230.00 | | |
8-Mar-27 | |
| 3.32 | |
| 31-Oct-23 | |
| 120,000 | | |
| 0 | | |
$ | 0.72 | | |
31-Oct-28 | |
| 4.97 | |
| Total | |
| 129,315 | | |
| 9,315 | | |
| 35.75 | | |
| |
| 4.79 | |
| Grant Date | |
Number of
Warrants
outstanding
and
exercisable | | |
Exercise
Price | | |
Expiry date |
| 29-Sep-20 | |
| 18,056 | | |
| 685.00 | | |
28-Sep-25 |
| 31-Dec-20 | |
| 12,945 | | |
| 1,150.00 | | |
30-Jun-24 |
| 11-Jan-22 | |
| 100,000 | | |
| 230.00 | | |
10-Jan-27 |
| Total | |
| 131,001 | | |
$ | 383.62 | | |
|
|
| X |
- References
+ Details
| Name: |
ifrs-full_DisclosureOfClassesOfShareCapitalAbstract |
| Namespace Prefix: |
ifrs-full_ |
| Data Type: |
xbrli:stringItemType |
| Balance Type: |
na |
| Period Type: |
duration |
|
| X |
- DefinitionThe disclosure of stock options outstanding
| Name: |
syta_ScheduleOfStockOptionsOutstandingTableTextBlock |
| Namespace Prefix: |
syta_ |
| Data Type: |
dtr:textBlockItemType |
| Balance Type: |
na |
| Period Type: |
duration |
|
| X |
- DefinitionThe disclosure of the Company’s stock option activity.
| Name: |
syta_ScheduleOfTheCompanysStockOptionActivityTableTextBlock |
| Namespace Prefix: |
syta_ |
| Data Type: |
dtr:textBlockItemType |
| Balance Type: |
na |
| Period Type: |
duration |
|
v3.23.3
Cost of Sales (Tables)
|
9 Months Ended |
Sep. 30, 2023 |
|---|
| Cost of Sales [Abstract] |
|
| Schedule of Cost of Sales |
| (in thousands) | |
Nine months
ended
30-Sep-23 | | |
Nine months
ended
30-Sep-22 | | |
Three months
ended
30-Sep-23 | | |
Three months
ended
30-Sep-22 | |
| Inventory expensed | |
$ | 3,627 | | |
$ | 2,167 | | |
$ | 1,035 | | |
$ | 1,328 | |
| Royalties | |
| 300 | | |
| 178 | | |
| 103 | | |
| 84 | |
| Other expenses | |
| 638 | | |
| 806 | | |
| 214 | | |
| 300 | |
| Total | |
$ | 4,565 | | |
$ | 3,151 | | |
$ | 1,352 | | |
$ | 1,712 | |
|
| X |
- DefinitionSchedule of Cost of Sales.
| Name: |
syta_ScheduleOfCostOfSalesTableTextBlock |
| Namespace Prefix: |
syta_ |
| Data Type: |
dtr:textBlockItemType |
| Balance Type: |
na |
| Period Type: |
duration |
|
| X |
- References
+ Details
| Name: |
us-gaap_RetailLandSalesEstimatedCostOfMajorImprovementsAbstract |
| Namespace Prefix: |
us-gaap_ |
| Data Type: |
xbrli:stringItemType |
| Balance Type: |
na |
| Period Type: |
duration |
|
v3.23.3
Selling and Marketing Expenses (Tables)
|
9 Months Ended |
Sep. 30, 2023 |
|---|
| Selling and Marketing Expenses [Abstract] |
|
| Schedule of Selling and Marketing Expenses |
| (in thousands) | |
Nine months
ended
30-Sep-23 | | |
Nine months
ended
30-Sep-22 | | |
Three months
ended
30-Sep-23 | | |
Three months
ended
30-Sep-22 | |
| Salaries and related expenses | |
$ | 2,007 | | |
$ | 1,981 | | |
$ | 691 | | |
$ | 720 | |
| Advertising and marketing | |
$ | 1,321 | | |
| 1,334 | | |
| 697 | | |
| 472 | |
| Travel and conferences | |
$ | 137 | | |
| 119 | | |
| 36 | | |
| 33 | |
| Total | |
$ | 3,465 | | |
$ | 3,434 | | |
$ | 1,424 | | |
$ | 1,225 | |
|
| X |
- DefinitionSchedule of Selling and Marketing Expenses.
| Name: |
syta_ScheduleOfSellingAndMarketingExpensesTableTextBlock |
| Namespace Prefix: |
syta_ |
| Data Type: |
dtr:textBlockItemType |
| Balance Type: |
na |
| Period Type: |
duration |
|
| X |
- References
+ Details
| Name: |
syta_SellingAndMarketingExpensesAbstract |
| Namespace Prefix: |
syta_ |
| Data Type: |
xbrli:stringItemType |
| Balance Type: |
na |
| Period Type: |
duration |
|
v3.23.3
General and Administrative Expenses (Tables)
|
9 Months Ended |
Sep. 30, 2023 |
|---|
| General and Administrative Expenses [Abstract] |
|
| Schedule of General and Administrative Eexpenses |
| (in thousands) | |
Nine months
ended
30-Sep-23 | | |
Nine months
ended
30-Sep-22 | | |
Three months
ended
30-Sep-23 | | |
Three months
ended
30-Sep-22 | |
| Salaries and related expenses | |
$ | 725 | | |
| 438 | | |
$ | 284 | | |
$ | 144 | |
| Professional services | |
| 1,622 | | |
| 1,349 | | |
| 296 | | |
| 408 | |
| Consulting and director fees | |
| 782 | | |
| 949 | | |
| 296 | | |
| 251 | |
| Travel | |
| 63 | | |
| 107 | | |
| 16 | | |
| 9 | |
| Office and general | |
| 906 | | |
| 1,244 | | |
| 296 | | |
| 260 | |
| Regulatory and filing fees | |
| 143 | | |
| 109 | | |
| 59 | | |
| 44 | |
| Shareholder relations | |
| 173 | | |
| 489 | | |
| 71 | | |
| 58 | |
| Total | |
$ | 4,414 | | |
| 4,685 | | |
$ | 1,318 | | |
$ | 1,174 | |
|
| X |
- References
+ Details
| Name: |
ifrs-full_SellingGeneralAndAdministrativeExpenseAbstract |
| Namespace Prefix: |
ifrs-full_ |
| Data Type: |
xbrli:stringItemType |
| Balance Type: |
na |
| Period Type: |
duration |
|
| X |
- References
+ Details
| Name: |
syta_DisclosureOfGeneralAndAdministrativeEexpensesTableTextBlock |
| Namespace Prefix: |
syta_ |
| Data Type: |
dtr:textBlockItemType |
| Balance Type: |
na |
| Period Type: |
duration |
|
v3.23.3
Related Party Transactions (Tables)
|
9 Months Ended |
Sep. 30, 2023 |
|---|
| Related Party Transactions [Abstract] |
|
| Schedule of Remuneration of Directors and Key Management Personnel |
The remuneration of directors and key management personnel for the three and six month period ended June 30, 2023
and 2022 are as follows:
| | |
2023 | | |
2022 | |
| Payments to key management personnel: | |
| | |
| |
| Salaries, consulting and directors’ fees | |
$ | 1,007,410 | | |
$ | 1,162,885 | |
| Share-based payments | |
| 593,146 | | |
| 1,824,713 | |
| Total | |
$ | 1,600,556 | | |
$ | 2,987,598 | |
|
| Schedule of Salaries, Consulting and Directors’ Fees Shown Above are Classified Within Profit and Loss |
Salaries, consulting and
directors’ fees shown above are classified within profit and loss as shown below:
| | |
| |
(in thousands) | |
| Type of Service | |
Nature of Relationship | |
2023 | | |
2022 | |
| Selling and marketing expenses | |
VP Technology/VP Sales International | |
$ | 225 | | |
$ | 234 | |
| General and administrative expense | |
Companies controlled by the CEO, CFO and Directors | |
$ | 782 | | |
$ | 929 | |
|
| X |
- References
+ Details
| Name: |
syta_ScheduleOfRemunerationOfDirectorsAndKeyManagementPersonnelTableTextBlock |
| Namespace Prefix: |
syta_ |
| Data Type: |
dtr:textBlockItemType |
| Balance Type: |
na |
| Period Type: |
duration |
|
| X |
- DefinitionThe entire disclosure of salaries, consulting and directors’ fees shown above are classified within profit and loss.
| Name: |
syta_ScheduleOfSalariesConsultingAndDirectorsFeesShownAboveAreClassifiedWithinProfitAndLoss |
| Namespace Prefix: |
syta_ |
| Data Type: |
dtr:textBlockItemType |
| Balance Type: |
na |
| Period Type: |
duration |
|
v3.23.3
Segmented Information (Tables)
|
9 Months Ended |
Sep. 30, 2023 |
|---|
| Segmented Information Disclosure [Abstract] |
|
| Schedule of Geographical Segments, Segment Revenue Is Based on the Geographical Location of the Customers |
Geographical area information is shown
below:
| External revenues by Geography for the three and nine month period ended | |
9 months ended Sep 30 | | |
3 months ended Sep 30 | |
| (in thousands) | |
2023 | | |
2022 | | |
2023 | | |
2022 | |
| USA | |
$ | 4,478 | | |
$ | 2,368 | | |
$ | 1,276 | | |
$ | 1,648 | |
| Canada | |
| 1,036 | | |
| 1,114 | | |
| 304 | | |
| 495 | |
| EMEA | |
| 842 | | |
| 841 | | |
| 262 | | |
| 391 | |
| Australia | |
| - | | |
| 47 | | |
| - | | |
| 34 | |
| Total | |
$ | 6,356 | | |
$ | 4,370 | | |
$ | 1,842 | | |
$ | 2,568 | |
|
| Schedule of Non Current Asset Geographic Area Information |
Non-current asset geographic area information
is shown below:
| (in thousands) | |
Sept 30,
2023 | | |
December 31,
2022 | |
| Long-term receivable total | |
$ | 137 | | |
$ | 150 | |
| Canada | |
| - | | |
| - | |
| EMEA | |
| 137 | | |
| 150 | |
| | |
| | | |
| | |
| Right of use asset total | |
$ | 666 | | |
$ | 887 | |
| Canada | |
| 100 | | |
| 177 | |
| EMEA | |
| 566 | | |
| 710 | |
| | |
| | | |
| | |
| Equipment total | |
$ | 180 | | |
$ | 207 | |
| Canada | |
| - | | |
| - | |
| EMEA | |
| 180 | | |
| 207 | |
| | |
| | | |
| | |
| Intangibles total | |
$ | 7,997 | | |
$ | 6,988 | |
| Canada | |
| 36 | | |
| - | |
| EMEA | |
| 7,961 | | |
| 6,988 | |
|
| Schedule of Product Information |
Product information is shown below:
| Revenue by product line | |
9 months ended Sep 30 | | |
3 months ended Sep 30 | |
| (in thousands) | |
2023 | | |
2022 | | |
2023 | | |
2022 | |
| Cellular boosters and related accessories | |
$ | 1,800 | | |
| 1,882 | | |
$ | 778 | | |
| 717 | |
| Rugged devices and related accessories | |
$ | 4,556 | | |
| 2,488 | | |
$ | 1,064 | | |
| 1,851 | |
| Total | |
$ | 6,356 | | |
$ | 4,370 | | |
$ | 1,842 | | |
$ | 2,568 | |
|
| X |
- References
+ Details
| Name: |
syta_DisclosureOfGeographicalSegmentTextBlock |
| Namespace Prefix: |
syta_ |
| Data Type: |
dtr:textBlockItemType |
| Balance Type: |
na |
| Period Type: |
duration |
|
| X |
- References
+ Details
| Name: |
syta_ScheduleOfNonCurrentAssetGeographicAreaInformationTableTextBlock |
| Namespace Prefix: |
syta_ |
| Data Type: |
dtr:textBlockItemType |
| Balance Type: |
na |
| Period Type: |
duration |
|
| X |
- References
+ Details
| Name: |
syta_ScheduleOfProductTableTextBlock |
| Namespace Prefix: |
syta_ |
| Data Type: |
dtr:textBlockItemType |
| Balance Type: |
na |
| Period Type: |
duration |
|
v3.23.3
Supplemental Information with Respect to Cash Flows (Tables)
|
9 Months Ended |
Sep. 30, 2023 |
|---|
| Supplemental Information with Respect to Cash Flows [Abstract] |
|
| Schedule of Supplemental Information with Respect to Cash Flows |
| | |
Nine months ended
September 30 | |
| | |
2023 | | |
2022 | |
| Change in non-cash working capital: | |
| | |
| |
| Trade and other receivables | |
$ | (631,278 | ) | |
$ | (326,749 | ) |
| Prepaids | |
| (54,974 | ) | |
| (390,022 | ) |
| Inventory | |
| 1,596,000 | | |
| (2,903,506 | ) |
| Advances to suppliers | |
| (1,385,957 | ) | |
| (638,831 | ) |
| Accounts payable and accrued liabilities | |
| (489,431 | ) | |
| (528,817 | ) |
| Deferred revenue | |
| (149,600 | ) | |
| - | |
| | |
$ | (1,115,240 | ) | |
$ | (4,787,926 | ) |
|
| X |
- References
+ Details
| Name: |
ifrs-full_StatementOfCashFlowsAbstract |
| Namespace Prefix: |
ifrs-full_ |
| Data Type: |
xbrli:stringItemType |
| Balance Type: |
na |
| Period Type: |
duration |
|
| X |
- References
+ Details
| Name: |
syta_ScheduleOfSupplementalInformationWithRespectToCashFlowsTableTextBlock |
| Namespace Prefix: |
syta_ |
| Data Type: |
dtr:textBlockItemType |
| Balance Type: |
na |
| Period Type: |
duration |
|
v3.23.3
Nature of Operations and Going Concern (Details) - USD ($)
|
9 Months Ended |
|
Sep. 30, 2023 |
Sep. 30, 2022 |
Dec. 31, 2022 |
| Nature of Operations and Going Concern (Details) [Line Items] |
|
|
|
| Net loss |
$ 9,066,788
|
$ 8,710,945
|
|
| Total deficit |
86,885,452
|
|
$ 77,818,663
|
| Siyata Mobile (Canada) Inc. [Member] |
|
|
|
| Nature of Operations and Going Concern (Details) [Line Items] |
|
|
|
| Net loss |
$ 9,466,789
|
|
|
| X |
- DefinitionThe profit (loss) before tax expense or income. [Refer: Profit (loss)] Reference 1: http://www.xbrl.org/2003/role/disclosureRef
-Name IFRS
-Number 5
-IssueDate 2023-01-01
-Paragraph 33
-Subparagraph b
-Clause i
-URI https://taxonomy.ifrs.org/xifrs-link?type=IFRS&num=5&code=ifrs-tx-2023-en-r&anchor=para_33_b_i&doctype=Standard
-URIDate 2023-03-23
Reference 2: http://www.xbrl.org/2003/role/exampleRef
-Name IFRS
-Number 8
-IssueDate 2023-01-01
-Paragraph 28
-Subparagraph b
-URI https://taxonomy.ifrs.org/xifrs-link?type=IFRS&num=8&code=ifrs-tx-2023-en-r&anchor=para_28_b&doctype=Standard
-URIDate 2023-03-23
Reference 3: http://www.xbrl.org/2003/role/exampleRef
-Name IFRS
-Number 8
-IssueDate 2023-01-01
-Paragraph 23
-URI https://taxonomy.ifrs.org/xifrs-link?type=IFRS&num=8&code=ifrs-tx-2023-en-r&anchor=para_23&doctype=Standard
-URIDate 2023-03-23
Reference 4: http://www.xbrl.org/2003/role/exampleRef
-Name IAS
-Number 1
-IssueDate 2023-01-01
-Paragraph 103
-URI https://taxonomy.ifrs.org/xifrs-link?type=IAS&num=1&code=ifrs-tx-2023-en-r&anchor=para_103&doctype=Standard
-URIDate 2023-03-23
Reference 5: http://www.xbrl.org/2003/role/exampleRef
-Name IAS
-Number 1
-IssueDate 2023-01-01
-Paragraph 102
-URI https://taxonomy.ifrs.org/xifrs-link?type=IAS&num=1&code=ifrs-tx-2023-en-r&anchor=para_102&doctype=Standard
-URIDate 2023-03-23
| Name: |
ifrs-full_ProfitLossBeforeTax |
| Namespace Prefix: |
ifrs-full_ |
| Data Type: |
xbrli:monetaryItemType |
| Balance Type: |
credit |
| Period Type: |
duration |
|
| X |
- References
+ Details
| Name: |
syta_NatureofOperationsandGoingConcernDetailsLineItems |
| Namespace Prefix: |
syta_ |
| Data Type: |
xbrli:stringItemType |
| Balance Type: |
na |
| Period Type: |
duration |
|
v3.23.3
| X |
- DefinitionThe country in which a subsidiary of the entity is incorporated. [Refer: Subsidiaries [member]] Reference 1: http://www.xbrl.org/2003/role/disclosureRef
-Name IAS
-Number 27
-IssueDate 2023-01-01
-Paragraph 16
-Subparagraph b
-Clause ii
-URI https://taxonomy.ifrs.org/xifrs-link?type=IAS&num=27&code=ifrs-tx-2023-en-r&anchor=para_16_b_ii&doctype=Standard
-URIDate 2023-03-23
Reference 2: http://www.xbrl.org/2003/role/disclosureRef
-Name IAS
-Number 27
-IssueDate 2023-01-01
-Paragraph 17
-Subparagraph b
-Clause ii
-URI https://taxonomy.ifrs.org/xifrs-link?type=IAS&num=27&code=ifrs-tx-2023-en-r&anchor=para_17_b_ii&doctype=Standard
-URIDate 2023-03-23
Reference 3: http://www.xbrl.org/2003/role/disclosureRef
-Name IFRS
-Number 12
-IssueDate 2023-01-01
-Paragraph 12
-Subparagraph b
-URI https://taxonomy.ifrs.org/xifrs-link?type=IFRS&num=12&code=ifrs-tx-2023-en-r&anchor=para_12_b&doctype=Standard
-URIDate 2023-03-23
Reference 4: http://www.xbrl.org/2003/role/disclosureRef
-Name IFRS
-Number 12
-IssueDate 2023-01-01
-Paragraph 19B
-Subparagraph b
-URI https://taxonomy.ifrs.org/xifrs-link?type=IFRS&num=12&code=ifrs-tx-2023-en-r&anchor=para_19B_b&doctype=Standard
-URIDate 2023-03-23
| Name: |
ifrs-full_CountryOfIncorporationOrResidenceOfSubsidiary |
| Namespace Prefix: |
ifrs-full_ |
| Data Type: |
xbrli:stringItemType |
| Balance Type: |
na |
| Period Type: |
duration |
|
| X |
- DefinitionThe name of a subsidiary. [Refer: Subsidiaries [member]] Reference 1: http://www.xbrl.org/2003/role/disclosureRef
-Name IAS
-Number 27
-IssueDate 2023-01-01
-Paragraph 17
-Subparagraph b
-Clause i
-URI https://taxonomy.ifrs.org/xifrs-link?type=IAS&num=27&code=ifrs-tx-2023-en-r&anchor=para_17_b_i&doctype=Standard
-URIDate 2023-03-23
Reference 2: http://www.xbrl.org/2003/role/disclosureRef
-Name IAS
-Number 27
-IssueDate 2023-01-01
-Paragraph 16
-Subparagraph b
-Clause i
-URI https://taxonomy.ifrs.org/xifrs-link?type=IAS&num=27&code=ifrs-tx-2023-en-r&anchor=para_16_b_i&doctype=Standard
-URIDate 2023-03-23
Reference 3: http://www.xbrl.org/2003/role/disclosureRef
-Name IFRS
-Number 12
-IssueDate 2023-01-01
-Paragraph 12
-Subparagraph a
-URI https://taxonomy.ifrs.org/xifrs-link?type=IFRS&num=12&code=ifrs-tx-2023-en-r&anchor=para_12_a&doctype=Standard
-URIDate 2023-03-23
Reference 4: http://www.xbrl.org/2003/role/disclosureRef
-Name IFRS
-Number 12
-IssueDate 2023-01-01
-Paragraph 19B
-Subparagraph a
-URI https://taxonomy.ifrs.org/xifrs-link?type=IFRS&num=12&code=ifrs-tx-2023-en-r&anchor=para_19B_a&doctype=Standard
-URIDate 2023-03-23
| Name: |
ifrs-full_NameOfSubsidiary |
| Namespace Prefix: |
ifrs-full_ |
| Data Type: |
xbrli:stringItemType |
| Balance Type: |
na |
| Period Type: |
duration |
|
| X |
- DefinitionThe percentage of voting equity interests acquired in a business combination. [Refer: Business combinations [member]] Reference 1: http://www.xbrl.org/2003/role/disclosureRef
-Name IFRS
-Number 3
-IssueDate 2023-01-01
-Paragraph B64
-Subparagraph c
-URI https://taxonomy.ifrs.org/xifrs-link?type=IFRS&num=3&code=ifrs-tx-2023-en-r&anchor=para_B64_c&doctype=Appendix&subtype=B
-URIDate 2023-03-23
| Name: |
ifrs-full_PercentageOfVotingEquityInterestsAcquired |
| Namespace Prefix: |
ifrs-full_ |
| Data Type: |
dtr-types:percentItemType |
| Balance Type: |
na |
| Period Type: |
instant |
|
| X |
- References
+ Details
| Name: |
syta_BasisofPreparationDetailsScheduleofUnauditedCondensedInterimConsolidatedFinancialStatementsLineItems |
| Namespace Prefix: |
syta_ |
| Data Type: |
xbrli:stringItemType |
| Balance Type: |
na |
| Period Type: |
duration |
|
| X |
- Details
| Name: |
ifrs-full_SignificantInvestmentsInSubsidiariesAxis=syta_QueensgateResourcesCorpMember |
| Namespace Prefix: |
|
| Data Type: |
na |
| Balance Type: |
|
| Period Type: |
|
|
| X |
- Details
| Name: |
ifrs-full_SignificantInvestmentsInSubsidiariesAxis=syta_QueensgateResourcesUSCorpMember |
| Namespace Prefix: |
|
| Data Type: |
na |
| Balance Type: |
|
| Period Type: |
|
|
| X |
- Details
| Name: |
ifrs-full_SignificantInvestmentsInSubsidiariesAxis=syta_SiyataMobileCanadaIncMember |
| Namespace Prefix: |
|
| Data Type: |
na |
| Balance Type: |
|
| Period Type: |
|
|
| X |
- Details
| Name: |
ifrs-full_SignificantInvestmentsInSubsidiariesAxis=syta_SiyataMobileIsraelLtdMember |
| Namespace Prefix: |
|
| Data Type: |
na |
| Balance Type: |
|
| Period Type: |
|
|
| X |
- Details
| Name: |
ifrs-full_SignificantInvestmentsInSubsidiariesAxis=syta_SignifiMobileIncMember |
| Namespace Prefix: |
|
| Data Type: |
na |
| Balance Type: |
|
| Period Type: |
|
|
| X |
- Details
| Name: |
ifrs-full_SignificantInvestmentsInSubsidiariesAxis=syta_ClearRFNevadaLtdMember |
| Namespace Prefix: |
|
| Data Type: |
na |
| Balance Type: |
|
| Period Type: |
|
|
v3.23.3
Trade and Other Receivables (Details) - Schedule of Trade and Other Receivables - USD ($)
|
Sep. 30, 2023 |
Dec. 31, 2022 |
| Schedule Of Trade And Other Receivables Abstract |
|
|
| Trade receivables |
$ 2,752,951
|
$ 2,015,291
|
| Allowance for doubtful accounts |
(1,047,802)
|
(1,056,393)
|
| Taxes receivable |
474,097
|
615,730
|
| Total |
$ 2,179,246
|
$ 1,574,628
|
| X |
- DefinitionThe amount of current trade receivables. [Refer: Trade receivables] Reference 1: http://www.xbrl.org/2003/role/exampleRef
-Name IAS
-Number 1
-IssueDate 2023-01-01
-Paragraph 78
-Subparagraph b
-URI https://taxonomy.ifrs.org/xifrs-link?type=IAS&num=1&code=ifrs-tx-2023-en-r&anchor=para_78_b&doctype=Standard
-URIDate 2023-03-23
Reference 2: http://www.xbrl.org/2003/role/exampleRef
-Name IAS
-Number 1
-IssueDate 2023-01-01
-Paragraph 68
-URI https://taxonomy.ifrs.org/xifrs-link?type=IAS&num=1&code=ifrs-tx-2023-en-r&anchor=para_68&doctype=Standard
-URIDate 2023-03-23
| Name: |
ifrs-full_CurrentTradeReceivables |
| Namespace Prefix: |
ifrs-full_ |
| Data Type: |
xbrli:monetaryItemType |
| Balance Type: |
debit |
| Period Type: |
instant |
|
| X |
- DefinitionThe amount of non-current trade receivables and non-current other receivables. [Refer: Non-current trade receivables; Other non-current receivables] Reference 1: http://www.xbrl.org/2003/role/disclosureRef
-Name IAS
-Number 1
-IssueDate 2023-01-01
-Paragraph 54
-Subparagraph h
-URI https://taxonomy.ifrs.org/xifrs-link?type=IAS&num=1&code=ifrs-tx-2023-en-r&anchor=para_54_h&doctype=Standard
-URIDate 2023-03-23
Reference 2: http://www.xbrl.org/2003/role/disclosureRef
-Name IAS
-Number 1
-IssueDate 2023-01-01
-Paragraph 78
-Subparagraph b
-URI https://taxonomy.ifrs.org/xifrs-link?type=IAS&num=1&code=ifrs-tx-2023-en-r&anchor=para_78_b&doctype=Standard
-URIDate 2023-03-23
| Name: |
ifrs-full_NoncurrentReceivables |
| Namespace Prefix: |
ifrs-full_ |
| Data Type: |
xbrli:monetaryItemType |
| Balance Type: |
debit |
| Period Type: |
instant |
|
| X |
- DefinitionThe amount due from customers for goods and services sold. Reference 1: http://www.xbrl.org/2003/role/exampleRef
-Name IAS
-Number 1
-IssueDate 2023-01-01
-Paragraph 78
-Subparagraph b
-URI https://taxonomy.ifrs.org/xifrs-link?type=IAS&num=1&code=ifrs-tx-2023-en-r&anchor=para_78_b&doctype=Standard
-URIDate 2023-03-23
| Name: |
ifrs-full_TradeReceivables |
| Namespace Prefix: |
ifrs-full_ |
| Data Type: |
xbrli:monetaryItemType |
| Balance Type: |
debit |
| Period Type: |
instant |
|
| X |
- DefinitionAllowance for doubtful accounts.
| Name: |
syta_AllowanceForDoubtfulAccounts |
| Namespace Prefix: |
syta_ |
| Data Type: |
xbrli:monetaryItemType |
| Balance Type: |
credit |
| Period Type: |
instant |
|
| X |
- References
+ Details
| Name: |
syta_ScheduleOfTradeAndOtherReceivablesAbstract |
| Namespace Prefix: |
syta_ |
| Data Type: |
xbrli:stringItemType |
| Balance Type: |
na |
| Period Type: |
duration |
|
v3.23.3
Inventory (Details) - Schedule of Inventory - USD ($)
|
Sep. 30, 2023 |
Dec. 31, 2022 |
| Schedule of inventory [Abstract] |
|
|
| Finished products |
$ 2,601,980
|
$ 7,392,002
|
| Impairment of finished products |
|
(3,555,683)
|
| Accessories and spare parts |
299,934
|
675,001
|
| Impairment of accessories and spare parts |
|
(418,770)
|
| Total |
$ 2,901,914
|
$ 4,092,550
|
| X |
- DefinitionA classification of current inventory representing the amount of goods that have completed the production process and are held for sale in the ordinary course of business. [Refer: Inventories] Reference 1: http://www.xbrl.org/2009/role/commonPracticeRef
-Name IAS
-Number 2
-IssueDate 2023-01-01
-Paragraph 37
-URI https://taxonomy.ifrs.org/xifrs-link?type=IAS&num=2&code=ifrs-tx-2023-en-r&anchor=para_37&doctype=Standard
-URIDate 2023-03-23
Reference 2: http://www.xbrl.org/2003/role/exampleRef
-Name IAS
-Number 1
-IssueDate 2023-01-01
-Paragraph 78
-Subparagraph c
-URI https://taxonomy.ifrs.org/xifrs-link?type=IAS&num=1&code=ifrs-tx-2023-en-r&anchor=para_78_c&doctype=Standard
-URIDate 2023-03-23
| Name: |
ifrs-full_FinishedGoods |
| Namespace Prefix: |
ifrs-full_ |
| Data Type: |
xbrli:monetaryItemType |
| Balance Type: |
debit |
| Period Type: |
instant |
|
| X |
- DefinitionA classification of current inventory representing the amount of interchangeable parts that are kept in an inventory and are used for the repair or replacement of failed parts. [Refer: Inventories] Reference 1: http://www.xbrl.org/2009/role/commonPracticeRef
-Name IAS
-Number 2
-IssueDate 2023-01-01
-Paragraph 37
-URI https://taxonomy.ifrs.org/xifrs-link?type=IAS&num=2&code=ifrs-tx-2023-en-r&anchor=para_37&doctype=Standard
-URIDate 2023-03-23
| Name: |
ifrs-full_SpareParts |
| Namespace Prefix: |
ifrs-full_ |
| Data Type: |
xbrli:monetaryItemType |
| Balance Type: |
debit |
| Period Type: |
instant |
|
| X |
- DefinitionImpairment of accessories and spare parts.
| Name: |
syta_ImpairmentOfAccessoriesAndSpareParts |
| Namespace Prefix: |
syta_ |
| Data Type: |
xbrli:monetaryItemType |
| Balance Type: |
debit |
| Period Type: |
instant |
|
| X |
- DefinitionImpairment of finished products.
| Name: |
syta_ImpairmentOfFinishedProducts |
| Namespace Prefix: |
syta_ |
| Data Type: |
xbrli:monetaryItemType |
| Balance Type: |
debit |
| Period Type: |
instant |
|
| X |
- References
+ Details
| Name: |
syta_ScheduleOfInventoryAbstract |
| Namespace Prefix: |
syta_ |
| Data Type: |
xbrli:stringItemType |
| Balance Type: |
na |
| Period Type: |
duration |
|
| X |
- DefinitionAmount of total inventories.
| Name: |
syta_TotalInventories |
| Namespace Prefix: |
syta_ |
| Data Type: |
xbrli:monetaryItemType |
| Balance Type: |
debit |
| Period Type: |
instant |
|
v3.23.3
| X |
- DefinitionThe interest rate on borrowings. [Refer: Borrowings] Reference 1: http://www.xbrl.org/2009/role/commonPracticeRef
-Name IFRS
-Number 7
-IssueDate 2023-01-01
-Paragraph 7
-URI https://taxonomy.ifrs.org/xifrs-link?type=IFRS&num=7&code=ifrs-tx-2023-en-r&anchor=para_7&doctype=Standard
-URIDate 2023-03-23
| Name: |
ifrs-full_BorrowingsInterestRate |
| Namespace Prefix: |
ifrs-full_ |
| Data Type: |
dtr-types:percentItemType |
| Balance Type: |
na |
| Period Type: |
instant |
|
| X |
- DefinitionThe amount of current borrowings. [Refer: Borrowings] Reference 1: http://www.xbrl.org/2009/role/commonPracticeRef
-Name IAS
-Number 1
-IssueDate 2023-01-01
-Paragraph 55
-URI https://taxonomy.ifrs.org/xifrs-link?type=IAS&num=1&code=ifrs-tx-2023-en-r&anchor=para_55&doctype=Standard
-URIDate 2023-03-23
| Name: |
ifrs-full_ShorttermBorrowings |
| Namespace Prefix: |
ifrs-full_ |
| Data Type: |
xbrli:monetaryItemType |
| Balance Type: |
credit |
| Period Type: |
instant |
|
| X |
- References
+ Details
| Name: |
syta_BankLoanDetailsLineItems |
| Namespace Prefix: |
syta_ |
| Data Type: |
xbrli:stringItemType |
| Balance Type: |
na |
| Period Type: |
duration |
|
| X |
- Details
| Name: |
ifrs-full_ConsolidatedStructuredEntitiesAxis=syta_NorthAmericanReceivablesMember |
| Namespace Prefix: |
|
| Data Type: |
na |
| Balance Type: |
|
| Period Type: |
|
|
v3.23.3
Convertible Debentures (Details) - USD ($)
|
|
|
1 Months Ended |
3 Months Ended |
9 Months Ended |
Jan. 13, 2022 |
Nov. 03, 2021 |
May 31, 2022 |
Mar. 31, 2022 |
Sep. 30, 2023 |
| Convertible Debentures [Abstract] |
|
|
|
|
|
| Convertible promissory note issued |
|
$ 7,200,000
|
|
|
|
| Warrants issued (in Shares) |
|
2,142,857
|
|
|
|
| Gross proceeds |
|
$ 6,000,000
|
|
|
|
| Percentage of gross proceeds |
|
|
|
20.00%
|
|
| Total amount repaid |
$ 4,000,000
|
|
|
|
|
| Monthly payment |
|
|
$ 400,000
|
|
|
| Common shares issued (in Shares) |
|
|
|
|
13,112,255
|
| Market value |
|
|
|
|
$ 4,138,002
|
| Principal amount |
|
|
|
|
$ 938,002
|
| Convertible debenture |
|
|
|
$ 2,023,751
|
|
| X |
- DefinitionThe fair value of financial liabilities. [Refer: At fair value [member]; Financial liabilities] Reference 1: http://www.xbrl.org/2003/role/disclosureRef
-Name IFRS
-Number 7
-IssueDate 2023-01-01
-Paragraph 25
-URI https://taxonomy.ifrs.org/xifrs-link?type=IFRS&num=7&code=ifrs-tx-2023-en-r&anchor=para_25&doctype=Standard
-URIDate 2023-03-23
| Name: |
ifrs-full_FinancialLiabilitiesAtFairValue |
| Namespace Prefix: |
ifrs-full_ |
| Data Type: |
xbrli:monetaryItemType |
| Balance Type: |
credit |
| Period Type: |
instant |
|
| X |
- DefinitionThe cash inflow from the issuing of ordinary shares. [Refer: Ordinary shares [member]] Reference 1: http://www.xbrl.org/2009/role/commonPracticeRef
-Name IAS
-Number 7
-IssueDate 2023-01-01
-Paragraph 17
-URI https://taxonomy.ifrs.org/xifrs-link?type=IAS&num=7&code=ifrs-tx-2023-en-r&anchor=para_17&doctype=Standard
-URIDate 2023-03-23
| Name: |
ifrs-full_ProceedsFromIssueOfOrdinaryShares |
| Namespace Prefix: |
ifrs-full_ |
| Data Type: |
xbrli:monetaryItemType |
| Balance Type: |
debit |
| Period Type: |
duration |
|
| X |
- DefinitionClass of warrant or right issued during the period.
| Name: |
syta_ClassOfWarrantOrRightIssuedDuringThePeriod |
| Namespace Prefix: |
syta_ |
| Data Type: |
xbrli:sharesItemType |
| Balance Type: |
na |
| Period Type: |
duration |
|
| X |
- References
+ Details
| Name: |
syta_ConvertibleDebenturesAbstract |
| Namespace Prefix: |
syta_ |
| Data Type: |
xbrli:stringItemType |
| Balance Type: |
na |
| Period Type: |
duration |
|
| X |
- DefinitionThe amount of convertible promissory note issued.
| Name: |
syta_ConvertiblePromissoryNoteIssued |
| Namespace Prefix: |
syta_ |
| Data Type: |
xbrli:monetaryItemType |
| Balance Type: |
credit |
| Period Type: |
duration |
|
| X |
- DefinitionThe cash inflow from the exercise of share purchase warrants.
| Name: |
syta_ExercisePriceOfWarrantsOrRight |
| Namespace Prefix: |
syta_ |
| Data Type: |
xbrli:monetaryItemType |
| Balance Type: |
debit |
| Period Type: |
duration |
|
| X |
- DefinitionThe amount of market value.
| Name: |
syta_MarketValue |
| Namespace Prefix: |
syta_ |
| Data Type: |
xbrli:monetaryItemType |
| Balance Type: |
debit |
| Period Type: |
duration |
|
| X |
- DefinitionPercentage of gross proceeds to the lender.
| Name: |
syta_PercentageOfGrossProceeds |
| Namespace Prefix: |
syta_ |
| Data Type: |
dtr:percentItemType |
| Balance Type: |
na |
| Period Type: |
duration |
|
| X |
- DefinitionThe disclosure of principal amount.
| Name: |
syta_PrincipaLAmount |
| Namespace Prefix: |
syta_ |
| Data Type: |
xbrli:monetaryItemType |
| Balance Type: |
debit |
| Period Type: |
duration |
|
v3.23.3
Warrant Liability (Details) - USD ($)
|
|
|
|
|
1 Months Ended |
3 Months Ended |
9 Months Ended |
12 Months Ended |
Oct. 12, 2022 |
Jan. 11, 2022 |
Jan. 03, 2022 |
Nov. 03, 2021 |
Jan. 19, 2023 |
Mar. 30, 2023 |
Sep. 30, 2023 |
Dec. 31, 2022 |
| Warrant Liability (Details) [Line Items] |
|
|
|
|
|
|
|
|
| Purchase of aggregate shares |
|
|
|
|
180,429
|
|
|
|
| Exercise price of warrant |
|
|
$ 230
|
|
$ 20
|
|
|
|
| Aggregate common shares |
|
|
|
|
180,429
|
|
|
|
| Gross proceeds amount |
|
|
|
|
$ 3,608,571
|
|
|
|
| Exercise warrants term |
|
|
|
|
5 years
|
|
|
|
| Outstanding warrants |
|
|
|
|
|
210,320
|
|
|
| Outstanding warrants per share |
|
|
|
|
|
$ 20
|
|
|
| Warrants exercised |
|
|
|
|
174,000
|
210,320
|
|
|
| Exchange of common shares |
|
|
|
|
|
210,320
|
|
|
| Fair value of the warrants amount |
|
|
|
|
|
$ 3,410,100
|
$ 13,923
|
|
| Common shares |
|
|
|
18,929
|
|
|
|
|
| Warrant expiry term |
|
|
|
5 years
|
|
|
|
|
| Initial stock price |
|
|
|
|
$ 19
|
|
$ 282
|
|
| Strike rate |
|
|
|
|
$ 20
|
|
$ 230
|
|
| Dividend yield percentage |
|
|
|
|
0.00%
|
|
0.00%
|
0.00%
|
| Warrants term |
|
|
|
|
0 years
|
|
3 years 3 months 10 days
|
|
| Volatility percentage |
|
|
|
|
130.00%
|
|
105.00%
|
|
| Risk-free rate percentage |
|
|
|
|
3.62%
|
|
4.72%
|
3.10%
|
| Warrants |
174,000
|
85,200
|
|
|
12,500
|
|
|
|
| Pre-funded warrants |
15,900
|
14,800
|
|
|
|
|
530,000
|
|
| Share price |
|
|
|
|
|
|
|
$ 15
|
| Exercise price |
|
|
|
|
|
|
$ 230
|
$ 23
|
| Expected volatility percentage |
|
|
|
|
|
|
|
100.00%
|
| Warrants issued |
|
|
|
|
|
|
$ 17,391
|
|
| Exercisable per share |
|
|
|
|
|
|
$ 23
|
|
| Fair value of the waiver warrants |
|
|
|
|
|
328,696
|
|
$ 184,983
|
| Top of range [Member] |
|
|
|
|
|
|
|
|
| Warrant Liability (Details) [Line Items] |
|
|
|
|
|
|
|
|
| Exercise price of warrant |
|
|
|
|
$ 23
|
|
|
|
| Bottom of range [Member] |
|
|
|
|
|
|
|
|
| Warrant Liability (Details) [Line Items] |
|
|
|
|
|
|
|
|
| Exercise price of warrant |
|
|
|
|
20
|
|
|
|
| Warrants [member] |
|
|
|
|
|
|
|
|
| Warrant Liability (Details) [Line Items] |
|
|
|
|
|
|
|
|
| Exercise price of warrant |
|
|
|
$ 400
|
|
|
|
|
| Warrants [member] |
|
|
|
|
|
|
|
|
| Warrant Liability (Details) [Line Items] |
|
|
|
|
|
|
|
|
| Exercise price of warrant |
|
|
|
|
$ 20
|
|
|
|
| Holder exercised warrants |
|
|
|
|
29,891
|
|
|
|
| Warrants exercised |
|
|
|
|
161,500
|
|
|
|
| January 19, 2023 Warrants [Member] |
|
|
|
|
|
|
|
|
| Warrant Liability (Details) [Line Items] |
|
|
|
|
|
|
|
|
| Fair value of the warrants amount |
|
|
|
|
$ 2,875,580
|
|
|
|
| Discount for lack of marketability percentage |
|
|
|
|
15.00%
|
|
|
|
| November 3, 2021 Warrants [Member] |
|
|
|
|
|
|
|
|
| Warrant Liability (Details) [Line Items] |
|
|
|
|
|
|
|
|
| Fair value of the warrants amount |
|
|
|
|
|
|
|
$ 197,733
|
| Initial stock price |
|
|
|
|
|
|
|
$ 15
|
| Strike rate |
|
|
|
|
|
|
|
$ 23
|
| Dividend yield percentage |
|
|
|
|
|
|
|
0.00%
|
| Warrants term |
|
|
|
|
|
|
|
3 years 10 months 2 days
|
| Volatility percentage |
|
|
|
|
|
|
|
110.00%
|
| Risk-free rate percentage |
|
|
|
|
|
|
|
4.08%
|
| Black Scholes Option Pricing Model [Member] |
|
|
|
|
|
|
|
|
| Warrant Liability (Details) [Line Items] |
|
|
|
|
|
|
|
|
| Fair value of the warrants amount |
|
|
|
|
$ 132,957
|
|
|
$ 501,330
|
| Initial stock price |
|
|
|
|
|
|
|
$ 15
|
| Strike rate |
|
|
|
|
|
|
|
$ 230
|
| Dividend yield percentage |
|
|
|
|
|
|
|
0.00%
|
| Warrants term |
|
|
|
|
|
|
|
4 years 10 days
|
| Volatility percentage |
|
|
|
|
|
|
|
110.00%
|
| Risk-free rate percentage |
|
|
|
|
|
|
|
4.08%
|
| Black Scholes Option Pricing Model [Member] | Prior to Exercise [Member] |
|
|
|
|
|
|
|
|
| Warrant Liability (Details) [Line Items] |
|
|
|
|
|
|
|
|
| Fair value of the warrants amount |
|
|
|
|
|
|
|
|
| October 12, 2022 Warrants [Member] |
|
|
|
|
|
|
|
|
| Warrant Liability (Details) [Line Items] |
|
|
|
|
|
|
|
|
| Fair value of the warrants amount |
|
|
|
|
$ 12,500
|
|
$ 29,891
|
$ 1,850,758
|
| Dividend yield percentage |
|
|
|
|
0.00%
|
|
|
0.00%
|
| Warrants term |
|
|
|
|
4 years 8 months 23 days
|
|
|
|
| Volatility percentage |
|
|
|
|
115.00%
|
|
|
|
| Risk-free rate percentage |
|
|
|
|
3.49%
|
|
|
3.98%
|
| Share price |
|
|
|
|
$ 19
|
|
|
$ 15
|
| Exercise price |
|
|
|
|
$ 20
|
|
|
$ 23
|
| Expected volatility percentage |
|
|
|
|
|
|
|
100.00%
|
| Warrants issued |
|
|
|
|
|
|
$ 17,391
|
|
| Unexercised warrants |
|
|
|
|
|
|
12,500
|
|
| Fair value of the outstanding warrants |
|
|
|
|
|
$ 564,946
|
|
|
| October 12, 2022 Warrants [Member] | Prior to Exercise [Member] |
|
|
|
|
|
|
|
|
| Warrant Liability (Details) [Line Items] |
|
|
|
|
|
|
|
|
| Fair value of the warrants amount |
|
|
|
|
$ 161,500
|
|
|
|
| Dividend yield percentage |
|
|
|
|
0.00%
|
|
|
|
| Warrants term |
|
|
|
|
0 years
|
|
|
|
| Volatility percentage |
|
|
|
|
115.00%
|
|
|
|
| Risk-free rate percentage |
|
|
|
|
3.49%
|
|
|
|
| Share price |
|
|
|
|
$ 19
|
|
|
|
| Exercise price |
|
|
|
|
20
|
|
|
|
| Common Shares [Member] |
|
|
|
|
|
|
|
|
| Warrant Liability (Details) [Line Items] |
|
|
|
|
|
|
|
|
| Exercise price of warrant |
|
|
|
|
$ 20
|
|
|
|
| Holder exercised warrants |
|
|
|
|
23
|
|
|
|
| X |
- DefinitionThe exercise price of share options granted. Reference 1: http://www.xbrl.org/2003/role/disclosureRef
-Name IFRS
-Number 2
-IssueDate 2023-01-01
-Paragraph 47
-Subparagraph a
-Clause i
-URI https://taxonomy.ifrs.org/xifrs-link?type=IFRS&num=2&code=ifrs-tx-2023-en-r&anchor=para_47_a_i&doctype=Standard
-URIDate 2023-03-23
| Name: |
ifrs-full_ExercisePriceShareOptionsGranted2019 |
| Namespace Prefix: |
ifrs-full_ |
| Data Type: |
dtr-types:perShareItemType |
| Balance Type: |
na |
| Period Type: |
duration |
|
| X |
- References
+ Details
| Name: |
syta_AggregateCommonShares |
| Namespace Prefix: |
syta_ |
| Data Type: |
xbrli:sharesItemType |
| Balance Type: |
na |
| Period Type: |
duration |
|
| X |
- References
+ Details
| Name: |
syta_AggregateShares |
| Namespace Prefix: |
syta_ |
| Data Type: |
xbrli:sharesItemType |
| Balance Type: |
na |
| Period Type: |
duration |
|
| X |
- References
+ Details
| Name: |
syta_ClassOfWarrantOrRightissuedDuringThePeriod |
| Namespace Prefix: |
syta_ |
| Data Type: |
xbrli:sharesItemType |
| Balance Type: |
na |
| Period Type: |
instant |
|
| X |
- References
+ Details
| Name: |
syta_CommonShares |
| Namespace Prefix: |
syta_ |
| Data Type: |
xbrli:sharesItemType |
| Balance Type: |
na |
| Period Type: |
duration |
|
| X |
- References
+ Details
| Name: |
syta_DiscountForLackOfMarketabilityPercentage |
| Namespace Prefix: |
syta_ |
| Data Type: |
dtr:percentItemType |
| Balance Type: |
na |
| Period Type: |
duration |
|
| X |
- References
+ Details
| Name: |
syta_DividendYieldPercentage |
| Namespace Prefix: |
syta_ |
| Data Type: |
dtr:percentItemType |
| Balance Type: |
na |
| Period Type: |
duration |
|
| X |
- References
+ Details
| Name: |
syta_ExchangeOfCommonShares |
| Namespace Prefix: |
syta_ |
| Data Type: |
xbrli:sharesItemType |
| Balance Type: |
na |
| Period Type: |
duration |
|
| X |
- References
+ Details
| Name: |
syta_ExercisablePerShare |
| Namespace Prefix: |
syta_ |
| Data Type: |
dtr:perShareItemType |
| Balance Type: |
na |
| Period Type: |
duration |
|
| X |
- References
+ Details
| Name: |
syta_ExercisePrice |
| Namespace Prefix: |
syta_ |
| Data Type: |
dtr:perShareItemType |
| Balance Type: |
na |
| Period Type: |
instant |
|
| X |
- References
+ Details
| Name: |
syta_ExerciseWarrantsTerm |
| Namespace Prefix: |
syta_ |
| Data Type: |
xbrli:durationItemType |
| Balance Type: |
na |
| Period Type: |
duration |
|
| X |
- References
+ Details
| Name: |
syta_ExpectedVolatilityPercentage |
| Namespace Prefix: |
syta_ |
| Data Type: |
dtr:percentItemType |
| Balance Type: |
na |
| Period Type: |
duration |
|
| X |
- DefinitionThe amount of fair value of the outstanding warrants.
| Name: |
syta_FairValueOfTheOutstandingWarrants |
| Namespace Prefix: |
syta_ |
| Data Type: |
xbrli:monetaryItemType |
| Balance Type: |
credit |
| Period Type: |
duration |
|
| X |
- DefinitionThe amount of fair value of the waiver warrants.
| Name: |
syta_FairValueOfTheWaiverWarrants |
| Namespace Prefix: |
syta_ |
| Data Type: |
xbrli:monetaryItemType |
| Balance Type: |
credit |
| Period Type: |
duration |
|
| X |
- DefinitionThe amount of fair value of the warrants.
| Name: |
syta_FairValueOfTheWarrantsAmount |
| Namespace Prefix: |
syta_ |
| Data Type: |
xbrli:monetaryItemType |
| Balance Type: |
credit |
| Period Type: |
duration |
|
| X |
- DefinitionThe amount of gross proceeds.
| Name: |
syta_GrossProceedsAmounts |
| Namespace Prefix: |
syta_ |
| Data Type: |
xbrli:monetaryItemType |
| Balance Type: |
credit |
| Period Type: |
duration |
|
| X |
- References
+ Details
| Name: |
syta_InitialStockPrice |
| Namespace Prefix: |
syta_ |
| Data Type: |
dtr:perShareItemType |
| Balance Type: |
na |
| Period Type: |
duration |
|
| X |
- References
+ Details
| Name: |
syta_OutstandingWarrant |
| Namespace Prefix: |
syta_ |
| Data Type: |
xbrli:sharesItemType |
| Balance Type: |
na |
| Period Type: |
duration |
|
| X |
- References
+ Details
| Name: |
syta_OutstandingWarrantsPerShare |
| Namespace Prefix: |
syta_ |
| Data Type: |
dtr:perShareItemType |
| Balance Type: |
na |
| Period Type: |
duration |
|
| X |
- References
+ Details
| Name: |
syta_PrefundedWarrants |
| Namespace Prefix: |
syta_ |
| Data Type: |
xbrli:sharesItemType |
| Balance Type: |
na |
| Period Type: |
duration |
|
| X |
- DefinitionThe percentage of Risk-free rate.
| Name: |
syta_RiskfreeRatePercentage |
| Namespace Prefix: |
syta_ |
| Data Type: |
dtr:percentItemType |
| Balance Type: |
na |
| Period Type: |
duration |
|
| X |
- References
+ Details
| Name: |
syta_SharePrices |
| Namespace Prefix: |
syta_ |
| Data Type: |
dtr:perShareItemType |
| Balance Type: |
na |
| Period Type: |
duration |
|
| X |
- References
+ Details
| Name: |
syta_StrikeRatePerShare |
| Namespace Prefix: |
syta_ |
| Data Type: |
dtr:perShareItemType |
| Balance Type: |
na |
| Period Type: |
duration |
|
| X |
- DefinitionUnexercised warrants issued.
| Name: |
syta_UnexercisedWarrantsIssued |
| Namespace Prefix: |
syta_ |
| Data Type: |
xbrli:sharesItemType |
| Balance Type: |
na |
| Period Type: |
duration |
|
| X |
- DefinitionThe percentage of volatility.
| Name: |
syta_VolatilityPercentage |
| Namespace Prefix: |
syta_ |
| Data Type: |
dtr:percentItemType |
| Balance Type: |
na |
| Period Type: |
duration |
|
| X |
- References
+ Details
| Name: |
syta_WarrantLiabilityDetailsLineItems |
| Namespace Prefix: |
syta_ |
| Data Type: |
xbrli:stringItemType |
| Balance Type: |
na |
| Period Type: |
duration |
|
| X |
- References
+ Details
| Name: |
syta_Warrants |
| Namespace Prefix: |
syta_ |
| Data Type: |
xbrli:sharesItemType |
| Balance Type: |
na |
| Period Type: |
duration |
|
| X |
- References
+ Details
| Name: |
syta_WarrantsExercised |
| Namespace Prefix: |
syta_ |
| Data Type: |
xbrli:sharesItemType |
| Balance Type: |
na |
| Period Type: |
duration |
|
| X |
- DefinitionAmount of warrants issued,
| Name: |
syta_WarrantsIssued |
| Namespace Prefix: |
syta_ |
| Data Type: |
xbrli:monetaryItemType |
| Balance Type: |
credit |
| Period Type: |
duration |
|
| X |
- References
+ Details
| Name: |
syta_WarrantsTerm |
| Namespace Prefix: |
syta_ |
| Data Type: |
xbrli:durationItemType |
| Balance Type: |
na |
| Period Type: |
duration |
|
| X |
- Details
| Name: |
ifrs-full_RangeAxis=ifrs-full_TopOfRangeMember |
| Namespace Prefix: |
|
| Data Type: |
na |
| Balance Type: |
|
| Period Type: |
|
|
| X |
- Details
| Name: |
ifrs-full_RangeAxis=ifrs-full_BottomOfRangeMember |
| Namespace Prefix: |
|
| Data Type: |
na |
| Balance Type: |
|
| Period Type: |
|
|
| X |
- Details
| Name: |
ifrs-full_RangeAxis=ifrs-full_WarrantsMember |
| Namespace Prefix: |
|
| Data Type: |
na |
| Balance Type: |
|
| Period Type: |
|
|
| X |
- Details
| Name: |
syta_ClassOfWarrantOrRightsAxis=ifrs-full_WarrantsMember |
| Namespace Prefix: |
|
| Data Type: |
na |
| Balance Type: |
|
| Period Type: |
|
|
| X |
- Details
| Name: |
syta_ClassOfWarrantOrRightsAxis=syta_January192023WarrantsMember |
| Namespace Prefix: |
|
| Data Type: |
na |
| Balance Type: |
|
| Period Type: |
|
|
| X |
- Details
| Name: |
syta_ClassOfWarrantOrRightsAxis=syta_November32021WarrantsMember |
| Namespace Prefix: |
|
| Data Type: |
na |
| Balance Type: |
|
| Period Type: |
|
|
| X |
- Details
| Name: |
syta_ClassOfWarrantOrRightsAxis=syta_BlackScholesOptionPricingModelMember |
| Namespace Prefix: |
|
| Data Type: |
na |
| Balance Type: |
|
| Period Type: |
|
|
| X |
- Details
| Name: |
ifrs-full_RangesOfExercisePricesForOutstandingShareOptionsAxis=syta_PriorToExerciseMember |
| Namespace Prefix: |
|
| Data Type: |
na |
| Balance Type: |
|
| Period Type: |
|
|
| X |
- Details
| Name: |
syta_ClassOfWarrantOrRightsAxis=syta_October122022WarrantsMember |
| Namespace Prefix: |
|
| Data Type: |
na |
| Balance Type: |
|
| Period Type: |
|
|
| X |
- Details
| Name: |
ifrs-full_ClassesOfShareCapitalAxis=syta_CommonSharesMember |
| Namespace Prefix: |
|
| Data Type: |
na |
| Balance Type: |
|
| Period Type: |
|
|
v3.23.3
Warrant Liability (Details) - Schedule of the Warrant Liability
|
9 Months Ended |
|
Sep. 30, 2023
USD ($)
|
|---|
| Condensed Financial Statements, Captions [Line Items] |
|
| Balance-beginning of period |
$ 2,734,804
|
| Exercise of warrants |
(1,915,534)
|
| Warrants issued |
2,875,580
|
| Transfer to equity |
(3,975,046)
|
| Change in fair value |
294,119
|
| Balance-Ending of period |
13,923
|
| Warrants Nov 3, 2021 [Member] |
|
| Condensed Financial Statements, Captions [Line Items] |
|
| Balance-beginning of period |
197,733
|
| Exercise of warrants |
(197,733)
|
| Warrants issued |
|
| Transfer to equity |
|
| Change in fair value |
|
| Balance-Ending of period |
|
| Warrants Jan 11, 2022 [Member] |
|
| Condensed Financial Statements, Captions [Line Items] |
|
| Balance-beginning of period |
501,330
|
| Exercise of warrants |
|
| Warrants issued |
|
| Transfer to equity |
|
| Change in fair value |
(487,407)
|
| Balance-Ending of period |
13,923
|
| October 12, 2022 [Member] |
|
| Condensed Financial Statements, Captions [Line Items] |
|
| Balance-beginning of period |
2,035,741
|
| Exercise of warrants |
(1,717,801)
|
| Warrants issued |
|
| Transfer to equity |
(564,946)
|
| Change in fair value |
247,006
|
| Balance-Ending of period |
|
| January 19, 2023 [Member] |
|
| Condensed Financial Statements, Captions [Line Items] |
|
| Balance-beginning of period |
|
| Exercise of warrants |
|
| Warrants issued |
2,875,580
|
| Transfer to equity |
(3,410,100)
|
| Change in fair value |
534,520
|
| Balance-Ending of period |
|
| X |
- DefinitionThe increase (decrease) in the fair value measurement of the entity's own equity instruments. [Refer: At fair value [member]; Entity's own equity instruments [member]] Reference 1: http://www.xbrl.org/2003/role/disclosureRef
-Name IFRS
-Number 13
-IssueDate 2023-01-01
-Paragraph 93
-Subparagraph e
-URI https://taxonomy.ifrs.org/xifrs-link?type=IFRS&num=13&code=ifrs-tx-2023-en-r&anchor=para_93_e&doctype=Standard
-URIDate 2023-03-23
| Name: |
ifrs-full_IncreaseDecreaseInFairValueMeasurementEntitysOwnEquityInstruments |
| Namespace Prefix: |
ifrs-full_ |
| Data Type: |
xbrli:monetaryItemType |
| Balance Type: |
credit |
| Period Type: |
duration |
|
| X |
- DefinitionLine items represent financial concepts included in a table. These concepts are used to disclose reportable information associated with domain members defined in one or many axes to the table. Reference 1: http://www.xbrl.org/2003/role/disclosureRef
-Name Regulation S-X (SX)
-Number 210
-Section 12
-Subsection 04
-Paragraph a
-Publisher SEC
Reference 2: http://www.xbrl.org/2003/role/disclosureRef
-Name Regulation S-X (SX)
-Number 210
-Section 5
-Subsection 04
-Paragraph c
-Subparagraph Schedule I
-Publisher SEC
Reference 3: http://www.xbrl.org/2003/role/disclosureRef
-Name Regulation S-X (SX)
-Number 210
-Section 7
-Subsection 05
-Paragraph c
-Subparagraph Schedule II
-Publisher SEC
Reference 4: http://www.xbrl.org/2003/role/disclosureRef
-Name Regulation S-X (SX)
-Number 210
-Section 9
-Subsection 06
-Publisher SEC
| Name: |
srt_CondensedFinancialStatementsCaptionsLineItems |
| Namespace Prefix: |
srt_ |
| Data Type: |
xbrli:stringItemType |
| Balance Type: |
na |
| Period Type: |
duration |
|
| X |
- DefinitionThe amount of warrant liabilities.
| Name: |
syta_BalanceWarrantLiability |
| Namespace Prefix: |
syta_ |
| Data Type: |
xbrli:monetaryItemType |
| Balance Type: |
credit |
| Period Type: |
instant |
|
| X |
- DefinitionAmount of exercise of the pre-funded warrants.
| Name: |
syta_ExerciseOfThePrefundedWarrants |
| Namespace Prefix: |
syta_ |
| Data Type: |
xbrli:monetaryItemType |
| Balance Type: |
credit |
| Period Type: |
duration |
|
| X |
- DefinitionAmount of total number of liability warrants.
| Name: |
syta_TotalNumberOfLiabilityWarrants |
| Namespace Prefix: |
syta_ |
| Data Type: |
xbrli:monetaryItemType |
| Balance Type: |
credit |
| Period Type: |
duration |
|
| X |
- References
+ Details
| Name: |
syta_TransferToEquity |
| Namespace Prefix: |
syta_ |
| Data Type: |
xbrli:monetaryItemType |
| Balance Type: |
credit |
| Period Type: |
duration |
|
| X |
- Details
| Name: |
syta_ClassOfWarrantOrRightsAxis=syta_November32021Member |
| Namespace Prefix: |
|
| Data Type: |
na |
| Balance Type: |
|
| Period Type: |
|
|
| X |
- Details
| Name: |
syta_ClassOfWarrantOrRightsAxis=syta_January112022Member |
| Namespace Prefix: |
|
| Data Type: |
na |
| Balance Type: |
|
| Period Type: |
|
|
| X |
- Details
| Name: |
syta_ClassOfWarrantOrRightsAxis=syta_October122022Member |
| Namespace Prefix: |
|
| Data Type: |
na |
| Balance Type: |
|
| Period Type: |
|
|
| X |
- Details
| Name: |
syta_ClassOfWarrantOrRightsAxis=syta_January192023Member |
| Namespace Prefix: |
|
| Data Type: |
na |
| Balance Type: |
|
| Period Type: |
|
|
v3.23.3
Share Capital (Details) - USD ($)
|
|
|
|
|
|
1 Months Ended |
9 Months Ended |
|
|
Jul. 13, 2023 |
Jan. 12, 2023 |
Apr. 13, 2022 |
Jan. 11, 2022 |
Jan. 01, 2022 |
Jun. 28, 2023 |
Mar. 31, 2022 |
Sep. 30, 2023 |
Jun. 30, 2023 |
Dec. 31, 2022 |
| Share Capital [Line Items] |
|
|
|
|
|
|
|
|
|
|
| Number of shares issued |
|
|
|
|
|
500,000
|
|
|
210,319
|
|
| Description of issuance |
|
|
|
|
|
|
|
As of the date of issuance of these
financial statements total outstanding common shares is 3,902,168 (post 100-to-1 reverse split that was effective as of August 10, 2023),
due to the issuance of 1,870,000 shares from a capital raise on October 31, 2023 and the exercise of 180,000 prefunded warrants also issued
on October 31, 2023 that were exercised into 177,313 additional common shares on November 1, 2023, as well as the conversion of 900 RSU’s
into 900 common shares on October 3, 2023.
|
|
|
| Proceeds from exercise of options (in Dollars) |
|
|
|
|
|
$ 2,250,000
|
|
|
|
|
| Exercise warrants issued |
|
|
|
|
|
|
|
180,429
|
|
|
| Warrants price (in Dollars per share) |
|
|
|
|
|
|
|
$ 23
|
|
|
| Company issued per share (in Dollars per share) |
|
|
|
|
|
$ 4.5
|
|
$ 0.65
|
|
|
| Description of subsequent |
|
|
|
|
|
|
|
Subsequent to September 30, 2023 the Company
issued 1,870,000 common shares at $0.65 per share and also issued 530,000 prefunded warrants with an exercise price of $0.01 and a purchase
price of $0.64 per warrant for total gross proceeds of $1,554,700 before offering expenses and other expenses included in share issuance
costs.
|
|
|
| Gross proceeds (in Dollars) |
|
|
|
$ 20,013,043
|
|
|
|
|
|
|
| Sale to public share units |
|
|
|
|
|
|
|
72,157
|
|
|
| Public shares per unit (in Dollars per share) |
|
|
|
|
|
|
|
$ 230
|
|
|
| Exercisable per share (in Dollars per share) |
|
|
|
|
|
|
|
$ 230
|
|
|
| Exercisable term |
|
|
|
|
|
|
|
5 years
|
|
|
| Gross Proceeds (in Dollars) |
|
|
|
|
|
|
|
$ 10,936,974
|
|
|
| Unit warrants (in Dollars) |
|
|
|
|
|
|
|
$ 5,395,878
|
|
|
| Shares issued pre-funded units |
|
|
|
|
|
|
|
14,800
|
|
|
| Pre-funded per unit (in Dollars per share) |
|
|
|
|
|
|
|
$ 229
|
|
|
| Value, per share (in Dollars per share) |
|
|
|
|
|
|
|
1
|
|
|
| Exercise price per share (in Dollars per share) |
|
|
|
|
|
|
|
$ 230
|
|
$ 23
|
| Warrant term years |
|
|
|
|
|
|
|
5 years
|
|
|
| Issued pre-funded units (in Dollars) |
|
|
|
|
|
|
|
$ 2,560,400
|
|
|
| Minimal exercise price (in Dollars per share) |
|
|
|
|
|
|
|
$ 1
|
|
|
| Over-allotment option per share (in Dollars per share) |
|
|
|
|
|
|
|
$ 0.97
|
|
|
| Proceeds received on warrants (in Dollars) |
|
|
|
|
|
|
|
$ 13,043
|
|
|
| Fair value loss (in Dollars) |
|
|
|
|
|
|
|
$ 962,350
|
|
|
| Initial stock price (in Dollars per share) |
|
|
|
$ 173
|
|
|
|
|
|
|
| Strike rate (in Dollars per share) |
|
|
|
$ 253
|
|
|
|
|
|
|
| Dividend yield percentage |
|
|
|
0.00%
|
|
|
|
|
|
|
| Volatility percentage |
|
|
|
60.00%
|
|
|
|
|
|
|
| Risk free rate |
|
|
|
0.50%
|
|
|
|
|
|
|
| Description of company issued |
|
|
|
|
|
|
|
The Company issued 1,550 common shares, with a fair value
of $170,500 ($110.00 per share) to consultants as part of their compensation for services rendered.The Company issued 8,542 common shares with a fair value
of $1,002,461 as combined payments of the monthly principal repayment of $400,000 for the months of May and June 2022 payable in shares
per the terms of the promissory note.The Company issued 15,500 common shares, with a fair value
of $170,500 ($110.00 per share) to consultants as part of their compensation for services rendered.The Company issued 300 shares with a fair value of $22,200
($74.00 per share) resulting from a supplier converting RSU’s into common shares. The Company issued 600 shares, with a
fair value of $61,800 ($103.00 per share), to a supplier as partial compensation according to their contractual agreements.The Company issued 4,049 shares, with a fair value of $441,296
($109.00 per share),as payment for the monthly principal repayment of $400,000 on the promissory note. ·The Company issued 6,849 shares, with a fair value of $520,548 ($76.00
per share), as payment for the monthly principal repayment of $400,000 on the promissory note.The Company issued 600 shares, with a fair value of $61,800
($103.00 per share), to a supplier as partial compensation according to their contractual agreements
|
|
|
| Shares reserved percentage |
|
|
|
|
|
|
|
15.00%
|
|
|
| Stock discount rate |
|
|
|
|
|
|
|
25.00%
|
|
|
| Stock option issued |
|
|
7,950
|
|
200
|
|
|
|
|
|
| Stock option exercise price (in Dollars per share) |
|
|
$ 110
|
|
$ 400
|
|
|
|
|
|
| Fair value granted (in Dollars) |
|
|
$ 678,520
|
|
$ 54,480
|
|
|
|
|
|
| Fair value options (in Dollars) |
|
|
$ 85.35
|
|
$ 272.4
|
|
|
|
|
|
| RSU's transactions description |
|
|
|
|
|
|
|
●On March 9, 2022, the Company granted 4,500 RSU’s to Directors that vest immediately. On the date of granting, the fair value and stock price was $103.00/share.
●
On March 9, 2022, the Company granted 18,000
RSU’s to a Director that vest quarterly over 12 periods with the first vesting of 1,500 RSU’s occurring on the date of the
granted and another 1,500 vest every three months until all of the granted RSU’s have vested. On the date of granting, the fair
value and the stock price was $103.00/share.
●
On April 13, 2022, the Company granted 2,400 RSU’s to consultants
that vest immediately. On the date of granting, the fair value and the stock price was $110.00/share.
●
On April 13, 2022, the Company granted 5,850 RSU’s to employees
of the Company that vest quarterly over 12 periods with the first vesting of 488 RSU’s occurring on the date of the granted and
another 488 RSU’s vest every three months until all of the granted RSU’s have vested. On the date of granting, the fair value
and the stock price was $110.00/share.
Transactions subsequent to the period end where 900 RSU’s
were converted into 900 common shares on October 3, 2023.
|
|
|
| Agents options, description |
|
|
|
|
|
|
|
●The Company issued warrants to the placement agents to purchase 4,348 common shares at an exercise price of $253.00 per share (the “Placement Agent Warrants”), which are exercisable 180 days from January 11, 2022, with a term of five years. The fair value of the Placement Agent Warrants was determined to be $307,189 using the Black-Scholes model with the following assumptions: initial stock price $173.00, strike rate $253.00, dividend yield 0%, term 5 years, volatility 60.0% and risk-free rate 0.50%. The Company also issued 525 agent’s options with a fair value of $61,950 with an exercise price of $230.00.As part of the capital raise that occurred on
October 31, 2023 as more fully described in the Subsequent Events Note 17, the Company issued 120,000 warrants to the underwriter exerciseable
at the lower of: $0.715 per warrant or a cashless exercise with a five year term.
|
|
|
| Exercise warrants |
|
180,429
|
|
|
|
|
|
180,429
|
|
|
| Warrants issued |
|
|
|
|
|
|
|
180,429
|
|
|
| Cashless warrants exercised |
|
|
|
|
|
|
|
210,318
|
|
|
| Transactions during the year, description |
|
|
|
|
|
|
|
●On January 11, 2022 as part of an underwritten public offering,
the Company issued a total of 100,000 share purchase warrants, exercisable at $230.00 per warrant and with a term of five years.
|
|
|
| ClearRF Acquisition [Member] |
|
|
|
|
|
|
|
|
|
|
| Share Capital [Line Items] |
|
|
|
|
|
|
|
|
|
|
| Shares issued to vendor |
|
|
|
|
|
|
1,390
|
|
|
|
| Fair value amount (in Dollars) |
|
|
|
|
|
|
$ 190,094
|
|
|
|
| Warrants [member] |
|
|
|
|
|
|
|
|
|
|
| Share Capital [Line Items] |
|
|
|
|
|
|
|
|
|
|
| Warrants price (in Dollars per share) |
|
|
|
|
|
|
|
$ 23
|
|
|
| Ordinary shares [member] |
|
|
|
|
|
|
|
|
|
|
| Share Capital [Line Items] |
|
|
|
|
|
|
|
|
|
|
| Number of shares issued |
|
|
|
|
|
|
|
1,853,955
|
|
448,686
|
| Number of shares outstanding |
|
|
|
|
|
|
|
1,853,955
|
|
448,686
|
| Ordinary shares [member] | Common Share Transactions [Member] |
|
|
|
|
|
|
|
|
|
|
| Share Capital [Line Items] |
|
|
|
|
|
|
|
|
|
|
| Number of shares issued |
|
|
|
|
|
|
|
180,429
|
|
|
| Warrants [member] |
|
|
|
|
|
|
|
|
|
|
| Share Capital [Line Items] |
|
|
|
|
|
|
|
|
|
|
| Number of shares issued |
|
|
|
|
|
|
|
180,429
|
|
|
| Proceeds from exercise of options (in Dollars) |
|
|
|
|
|
|
|
$ 3,608,571
|
|
|
| Pre-Funded Units [member] |
|
|
|
|
|
|
|
|
|
|
| Share Capital [Line Items] |
|
|
|
|
|
|
|
|
|
|
| Warrant term years |
|
|
|
|
|
|
|
5 years
|
|
|
| Pre-funded warrants issued (in Dollars) |
|
|
|
|
|
|
|
$ 1,106,747
|
|
|
| Over-Allotment Option [Member] |
|
|
|
|
|
|
|
|
|
|
| Share Capital [Line Items] |
|
|
|
|
|
|
|
|
|
|
| Warrant term years |
|
|
|
|
|
|
|
5 years
|
|
|
| Additional warrants purchased |
|
|
|
|
|
|
|
13,043
|
|
|
| Warrants to purchase shares |
|
|
|
|
|
|
|
13,043
|
|
|
| Common shares exercisable per share (in Dollars per share) |
|
|
|
|
|
|
|
$ 230
|
|
|
| Option warrant exercisable term description |
|
|
|
|
|
|
|
Each Option Warrant is exercisable immediately and has a term of five years from the issue date.
|
|
|
| Option warrants issued (in Dollars) |
|
|
|
|
|
|
|
$ 975,393
|
|
|
| Market price per share (in Dollars per share) |
|
|
|
|
|
|
|
$ 173
|
|
|
| Initial stock price (in Dollars per share) |
|
|
|
|
|
|
|
173
|
|
|
| Strike rate (in Dollars per share) |
|
|
|
|
|
|
|
$ 230
|
|
|
| Dividend yield percentage |
|
|
|
|
|
|
|
0.00%
|
|
|
| Volatility percentage |
|
|
|
|
|
|
|
60.00%
|
|
|
| Risk free rate |
|
|
|
|
|
|
|
0.50%
|
|
|
| Placement Agent Warrants [member] |
|
|
|
|
|
|
|
|
|
|
| Share Capital [Line Items] |
|
|
|
|
|
|
|
|
|
|
| Exercisable term |
|
|
|
5 years
|
|
|
|
|
|
|
| Warrant term years |
|
|
|
5 years
|
|
|
|
|
|
|
| Warrants issued |
|
|
|
|
|
|
|
4,348
|
|
|
| Exercise price per share (in Dollars per share) |
|
|
|
|
|
|
|
$ 253
|
|
|
| Fair value of placement agent warrants (in Dollars) |
|
|
|
$ 307,189
|
|
|
|
|
|
|
| Common share transactions, description |
|
|
|
|
|
|
|
The direct costs related to the issuance
of the common shares and warrants issued in the January 2022 underwritten public offering were $2,016,895, including the value of the
Placement Agent Warrants. Direct costs of $965,248 were allocated to the warrant liability and expensed immediately in profit and loss.
During the period, 14,800 Pre-Funded Warrants were exercised for gross proceeds of $14,800, converting into 14,800 common shares that
were fully issued.
|
|
|
| Stock Options [member] |
|
|
|
|
|
|
|
|
|
|
| Share Capital [Line Items] |
|
|
|
|
|
|
|
|
|
|
| Option warrant exercisable term description |
|
|
|
|
|
|
|
Options can have a maximum term of ten years and typically terminate 90 days following the termination of the
optionee’s employment or engagement, except in the case of retirement or death. Vesting of options is at the discretion of the Board
of Directors at the time the options are granted.
|
|
|
| Non adjusting Events [Member] |
|
|
|
|
|
|
|
|
|
|
| Share Capital [Line Items] |
|
|
|
|
|
|
|
|
|
|
| Number of shares issued |
514,500
|
|
|
|
|
|
|
|
|
|
| Proceeds from exercise of options (in Dollars) |
$ 2,315,250
|
|
|
|
|
|
|
|
|
|
| Company issued per share (in Dollars per share) |
$ 4.5
|
|
|
|
|
|
|
|
|
|
| X |
- DefinitionThe description of the termination terms of a retirement benefit plan. Reference 1: http://www.xbrl.org/2003/role/disclosureRef
-Name IAS
-Number 26
-IssueDate 2023-01-01
-Paragraph 36
-Subparagraph f
-URI https://taxonomy.ifrs.org/xifrs-link?type=IAS&num=26&code=ifrs-tx-2023-en-r&anchor=para_36_f&doctype=Standard
-URIDate 2023-03-23
| Name: |
ifrs-full_DescriptionOfAnyRetirementBenefitPlanTerminationTerms |
| Namespace Prefix: |
ifrs-full_ |
| Data Type: |
xbrli:stringItemType |
| Balance Type: |
na |
| Period Type: |
duration |
|
| X |
- DefinitionThe expected volatility of the share price used to calculate the fair value of the share options granted. Expected volatility is a measure of the amount by which a price is expected to fluctuate during a period. The measure of volatility used in option pricing models is the annualised standard deviation of the continuously compounded rates of return on the share over a period of time. Reference 1: http://www.xbrl.org/2003/role/disclosureRef
-Name IFRS
-Number 2
-IssueDate 2023-01-01
-Paragraph 47
-Subparagraph a
-Clause i
-URI https://taxonomy.ifrs.org/xifrs-link?type=IFRS&num=2&code=ifrs-tx-2023-en-r&anchor=para_47_a_i&doctype=Standard
-URIDate 2023-03-23
| Name: |
ifrs-full_DescriptionOfExpectedVolatilityShareOptionsGranted |
| Namespace Prefix: |
ifrs-full_ |
| Data Type: |
dtr-types:percentItemType |
| Balance Type: |
na |
| Period Type: |
duration |
|
| X |
- DefinitionThe description of financial liabilities that have been redesignated on transition to IFRSs. [Refer: IFRSs [member]; Financial liabilities] Reference 1: http://www.xbrl.org/2003/role/disclosureRef
-Name IFRS
-Number 1
-IssueDate 2023-01-01
-Paragraph 29A
-URI https://taxonomy.ifrs.org/xifrs-link?type=IFRS&num=1&code=ifrs-tx-2023-en-r&anchor=para_29A&doctype=Standard
-URIDate 2023-03-23
| Name: |
ifrs-full_DescriptionOfRedesignatedFinancialLiabilities |
| Namespace Prefix: |
ifrs-full_ |
| Data Type: |
xbrli:stringItemType |
| Balance Type: |
na |
| Period Type: |
duration |
|
| X |
- DefinitionThe implied yield currently available on zero-coupon government issues of the country in whose currency the exercise price for share options granted is expressed, with a remaining term equal to the expected term of the option being valued (based on the option's remaining contractual life and taking into account the effects of expected early exercise). [Refer: Government [member]] Reference 1: http://www.xbrl.org/2003/role/disclosureRef
-Name IFRS
-Number 2
-IssueDate 2023-01-01
-Paragraph 47
-Subparagraph a
-Clause i
-URI https://taxonomy.ifrs.org/xifrs-link?type=IFRS&num=2&code=ifrs-tx-2023-en-r&anchor=para_47_a_i&doctype=Standard
-URIDate 2023-03-23
| Name: |
ifrs-full_DescriptionOfRiskFreeInterestRateShareOptionsGranted |
| Namespace Prefix: |
ifrs-full_ |
| Data Type: |
dtr-types:percentItemType |
| Balance Type: |
na |
| Period Type: |
duration |
|
| X |
- DefinitionThe description, in the entity's interim financial report, of events and transactions that are significant to an understanding of the changes in the financial position and performance of the entity since the end of the last annual reporting period. Information disclosed in relation to those events and transactions shall update the relevant information presented in the most recent annual financial report. Reference 1: http://www.xbrl.org/2003/role/disclosureRef
-Name IAS
-Number 34
-IssueDate 2023-01-01
-Paragraph 15
-URI https://taxonomy.ifrs.org/xifrs-link?type=IAS&num=34&code=ifrs-tx-2023-en-r&anchor=para_15&doctype=Standard
-URIDate 2023-03-23
| Name: |
ifrs-full_DescriptionOfSignificantEventsAndTransactions |
| Namespace Prefix: |
ifrs-full_ |
| Data Type: |
xbrli:stringItemType |
| Balance Type: |
na |
| Period Type: |
duration |
|
| X |
- DefinitionLine items represent concepts included in a table. These concepts are used to disclose reportable information associated with members defined in one or many axes of the table.
| Name: |
ifrs-full_DisclosureOfClassesOfShareCapitalLineItems |
| Namespace Prefix: |
ifrs-full_ |
| Data Type: |
xbrli:stringItemType |
| Balance Type: |
na |
| Period Type: |
duration |
|
| X |
- DefinitionThe discount rate used in the previous measurement of fair value less costs of disposal. Reference 1: http://www.xbrl.org/2003/role/disclosureRef
-Name IAS
-Number 36
-IssueDate 2023-01-01
-Paragraph 130
-Subparagraph f
-Clause iii
-URI https://taxonomy.ifrs.org/xifrs-link?type=IAS&num=36&code=ifrs-tx-2023-en-r&anchor=para_130_f_iii&doctype=Standard
-URIDate 2023-03-23
| Name: |
ifrs-full_DiscountRateUsedInPreviousMeasurementOfFairValueLessCostsOfDisposal |
| Namespace Prefix: |
ifrs-full_ |
| Data Type: |
dtr-types:percentItemType |
| Balance Type: |
na |
| Period Type: |
instant |
|
| X |
- DefinitionThe amount of dividends paid per other share. Reference 1: http://www.xbrl.org/2003/role/disclosureRef
-Name IAS
-Number 34
-IssueDate 2023-01-01
-Paragraph 16A
-Subparagraph f
-URI https://taxonomy.ifrs.org/xifrs-link?type=IAS&num=34&code=ifrs-tx-2023-en-r&anchor=para_16A_f&doctype=Standard
-URIDate 2023-03-23
| Name: |
ifrs-full_DividendsPaidOtherSharesPerShare |
| Namespace Prefix: |
ifrs-full_ |
| Data Type: |
dtr-types:perShareItemType |
| Balance Type: |
na |
| Period Type: |
duration |
|
| X |
- DefinitionThe exercise price of outstanding share options. Reference 1: http://www.xbrl.org/2003/role/disclosureRef
-Name IFRS
-Number 2
-IssueDate 2023-01-01
-Paragraph 45
-Subparagraph d
-URI https://taxonomy.ifrs.org/xifrs-link?type=IFRS&num=2&code=ifrs-tx-2023-en-r&anchor=para_45_d&doctype=Standard
-URIDate 2023-03-23
| Name: |
ifrs-full_ExercisePriceOfOutstandingShareOptions2019 |
| Namespace Prefix: |
ifrs-full_ |
| Data Type: |
dtr-types:perShareItemType |
| Balance Type: |
na |
| Period Type: |
instant |
|
| X |
- DefinitionThe rate of expected credit losses, calculated as percentage of the gross carrying amount. Expected credit losses are the weighted average of credit losses with the respective risks of a default occurring as the weights. Reference 1: http://www.xbrl.org/2003/role/exampleRef
-Name IFRS
-Number 7
-IssueDate 2023-01-01
-Paragraph 35N
-URI https://taxonomy.ifrs.org/xifrs-link?type=IFRS&num=7&code=ifrs-tx-2023-en-r&anchor=para_35N&doctype=Standard
-URIDate 2023-03-23
Reference 2: http://www.xbrl.org/2003/role/exampleRef
-Name IFRS
-Number 7
-IssueDate 2023-01-01
-Paragraph IG20D
-URI https://taxonomy.ifrs.org/xifrs-link?type=IFRS&num=7&code=ifrs-tx-2023-en-r&anchor=para_IG20D&doctype=Implementation%20Guidance
-URIDate 2023-03-23
| Name: |
ifrs-full_ExpectedCreditLossRate |
| Namespace Prefix: |
ifrs-full_ |
| Data Type: |
dtr-types:percentItemType |
| Balance Type: |
na |
| Period Type: |
instant |
|
| X |
- DefinitionThe percentage of an expected dividend used to calculate the fair value of share options granted. Reference 1: http://www.xbrl.org/2003/role/disclosureRef
-Name IFRS
-Number 2
-IssueDate 2023-01-01
-Paragraph 47
-Subparagraph a
-Clause i
-URI https://taxonomy.ifrs.org/xifrs-link?type=IFRS&num=2&code=ifrs-tx-2023-en-r&anchor=para_47_a_i&doctype=Standard
-URIDate 2023-03-23
| Name: |
ifrs-full_ExpectedDividendAsPercentageShareOptionsGranted |
| Namespace Prefix: |
ifrs-full_ |
| Data Type: |
dtr-types:percentItemType |
| Balance Type: |
na |
| Period Type: |
duration |
|
| X |
- DefinitionThe amount of financial assets that are measured at fair value and for which gains (losses) are recognised in profit or loss. A financial asset shall be measured at fair value through profit or loss unless it is measured at amortised cost or at fair value through other comprehensive income. A gain (loss) on a financial asset measured at fair value shall be recognised in profit or loss unless it is part of a hedging relationship, it is an investment in an equity instrument for which the entity has elected to present gains and losses in other comprehensive income or it is a financial asset measured at fair value through other comprehensive income. [Refer: At fair value [member]; Financial assets] Reference 1: http://www.xbrl.org/2003/role/disclosureRef
-Name IFRS
-Number 7
-IssueDate 2023-01-01
-Paragraph 8
-Subparagraph a
-URI https://taxonomy.ifrs.org/xifrs-link?type=IFRS&num=7&code=ifrs-tx-2023-en-r&anchor=para_8_a&doctype=Standard
-URIDate 2023-03-23
| Name: |
ifrs-full_FinancialAssetsAtFairValueThroughProfitOrLoss |
| Namespace Prefix: |
ifrs-full_ |
| Data Type: |
xbrli:monetaryItemType |
| Balance Type: |
debit |
| Period Type: |
instant |
|
| X |
- DefinitionThe number of shares authorised. Reference 1: http://www.xbrl.org/2003/role/disclosureRef
-Name IAS
-Number 1
-IssueDate 2023-01-01
-Paragraph 79
-Subparagraph a
-Clause i
-URI https://taxonomy.ifrs.org/xifrs-link?type=IAS&num=1&code=ifrs-tx-2023-en-r&anchor=para_79_a_i&doctype=Standard
-URIDate 2023-03-23
| Name: |
ifrs-full_NumberOfSharesAuthorised |
| Namespace Prefix: |
ifrs-full_ |
| Data Type: |
xbrli:sharesItemType |
| Balance Type: |
na |
| Period Type: |
instant |
|
| X |
- DefinitionThe number of shares issued by the entity. Reference 1: http://www.xbrl.org/2009/role/commonPracticeRef
-Name IAS
-Number 1
-IssueDate 2023-01-01
-Paragraph 106
-Subparagraph d
-URI https://taxonomy.ifrs.org/xifrs-link?type=IAS&num=1&code=ifrs-tx-2023-en-r&anchor=para_106_d&doctype=Standard
-URIDate 2023-03-23
| Name: |
ifrs-full_NumberOfSharesIssued |
| Namespace Prefix: |
ifrs-full_ |
| Data Type: |
xbrli:sharesItemType |
| Balance Type: |
na |
| Period Type: |
instant |
|
| X |
- DefinitionThe number of shares that have been authorised and issued, reduced by treasury shares held. [Refer: Treasury shares] Reference 1: http://www.xbrl.org/2003/role/disclosureRef
-Name IAS
-Number 1
-IssueDate 2023-01-01
-Paragraph 79
-Subparagraph a
-Clause iv
-URI https://taxonomy.ifrs.org/xifrs-link?type=IAS&num=1&code=ifrs-tx-2023-en-r&anchor=para_79_a_iv&doctype=Standard
-URIDate 2023-03-23
| Name: |
ifrs-full_NumberOfSharesOutstanding |
| Namespace Prefix: |
ifrs-full_ |
| Data Type: |
xbrli:sharesItemType |
| Balance Type: |
na |
| Period Type: |
instant |
|
| X |
- DefinitionThe nominal value per share. Reference 1: http://www.xbrl.org/2003/role/disclosureRef
-Name IAS
-Number 1
-IssueDate 2023-01-01
-Paragraph 79
-Subparagraph a
-Clause iii
-URI https://taxonomy.ifrs.org/xifrs-link?type=IAS&num=1&code=ifrs-tx-2023-en-r&anchor=para_79_a_iii&doctype=Standard
-URIDate 2023-03-23
| Name: |
ifrs-full_ParValuePerShare |
| Namespace Prefix: |
ifrs-full_ |
| Data Type: |
dtr-types:perShareItemType |
| Balance Type: |
na |
| Period Type: |
instant |
|
| X |
- DefinitionThe fair value of defined benefit plan assets. Plan assets comprise assets held by a long-term employee benefit fund and qualifying insurance policies. [Refer: At fair value [member]] Reference 1: http://www.xbrl.org/2009/role/commonPracticeRef
-Name IAS
-Number 19
-IssueDate 2023-01-01
-Paragraph 57
-Subparagraph a
-URI https://taxonomy.ifrs.org/xifrs-link?type=IAS&num=19&code=ifrs-tx-2023-en-r&anchor=para_57_a&doctype=Standard
-URIDate 2023-03-23
| Name: |
ifrs-full_PlanAssetsAtFairValue |
| Namespace Prefix: |
ifrs-full_ |
| Data Type: |
xbrli:monetaryItemType |
| Balance Type: |
debit |
| Period Type: |
instant |
|
| X |
- DefinitionThe cash inflow from the exercise of options. Reference 1: http://www.xbrl.org/2009/role/commonPracticeRef
-Name IAS
-Number 7
-IssueDate 2023-01-01
-Paragraph 17
-URI https://taxonomy.ifrs.org/xifrs-link?type=IAS&num=7&code=ifrs-tx-2023-en-r&anchor=para_17&doctype=Standard
-URIDate 2023-03-23
| Name: |
ifrs-full_ProceedsFromExerciseOfOptions |
| Namespace Prefix: |
ifrs-full_ |
| Data Type: |
xbrli:monetaryItemType |
| Balance Type: |
debit |
| Period Type: |
duration |
|
| X |
- DefinitionAgents options, description.
| Name: |
syta_AgentsOptionsDescription |
| Namespace Prefix: |
syta_ |
| Data Type: |
xbrli:stringItemType |
| Balance Type: |
na |
| Period Type: |
duration |
|
| X |
- DefinitionThe amount of black scholes value.
| Name: |
syta_BlackScholesValue |
| Namespace Prefix: |
syta_ |
| Data Type: |
xbrli:monetaryItemType |
| Balance Type: |
debit |
| Period Type: |
duration |
|
| X |
- DefinitionCashless warrants exercised.
| Name: |
syta_CashlessWarrantsExercised |
| Namespace Prefix: |
syta_ |
| Data Type: |
xbrli:sharesItemType |
| Balance Type: |
na |
| Period Type: |
duration |
|
| X |
- DefinitionCommon share, unit of warrants.
| Name: |
syta_CommonShareUnitOfWarrants |
| Namespace Prefix: |
syta_ |
| Data Type: |
xbrli:monetaryItemType |
| Balance Type: |
debit |
| Period Type: |
duration |
|
| X |
- Definitionhe amount of company issued per share.
| Name: |
syta_CompanyIssuedPerShare |
| Namespace Prefix: |
syta_ |
| Data Type: |
dtr:perShareItemType |
| Balance Type: |
na |
| Period Type: |
instant |
|
| X |
- DefinitionDescription of company issued.
| Name: |
syta_DescriptionOfCompanyIssued |
| Namespace Prefix: |
syta_ |
| Data Type: |
xbrli:stringItemType |
| Balance Type: |
na |
| Period Type: |
duration |
|
| X |
- DefinitionDescription of subsequent.
| Name: |
syta_DescriptionOfSubsequent |
| Namespace Prefix: |
syta_ |
| Data Type: |
xbrli:stringItemType |
| Balance Type: |
na |
| Period Type: |
duration |
|
| X |
- References
+ Details
| Name: |
syta_ExercisePrice |
| Namespace Prefix: |
syta_ |
| Data Type: |
dtr:perShareItemType |
| Balance Type: |
na |
| Period Type: |
instant |
|
| X |
- DefinitionExercise Price per share.
| Name: |
syta_ExercisePricePerShare |
| Namespace Prefix: |
syta_ |
| Data Type: |
dtr:perShareItemType |
| Balance Type: |
na |
| Period Type: |
instant |
|
| X |
- DefinitionThe amount of gross proceed.
| Name: |
syta_GrossProceed |
| Namespace Prefix: |
syta_ |
| Data Type: |
xbrli:monetaryItemType |
| Balance Type: |
debit |
| Period Type: |
instant |
|
| X |
- References
+ Details
| Name: |
syta_GrossProceedsAmount |
| Namespace Prefix: |
syta_ |
| Data Type: |
xbrli:monetaryItemType |
| Balance Type: |
debit |
| Period Type: |
instant |
|
| X |
- DefinitionNumber of fair value granted.
| Name: |
syta_NumberOfFairValueGranted |
| Namespace Prefix: |
syta_ |
| Data Type: |
xbrli:monetaryItemType |
| Balance Type: |
credit |
| Period Type: |
duration |
|
| X |
- DefinitionNumber of fair value option.
| Name: |
syta_NumberOfFairValueOption |
| Namespace Prefix: |
syta_ |
| Data Type: |
xbrli:monetaryItemType |
| Balance Type: |
credit |
| Period Type: |
duration |
|
| X |
- DefinitionNumber of shares issued 1.
| Name: |
syta_NumberOfSharesIssued1 |
| Namespace Prefix: |
syta_ |
| Data Type: |
xbrli:sharesItemType |
| Balance Type: |
na |
| Period Type: |
duration |
|
| X |
- References
+ Details
| Name: |
syta_OptionWarrantsIssued |
| Namespace Prefix: |
syta_ |
| Data Type: |
xbrli:monetaryItemType |
| Balance Type: |
debit |
| Period Type: |
duration |
|
| X |
- References
+ Details
| Name: |
syta_OverallotmentOptionPerShare |
| Namespace Prefix: |
syta_ |
| Data Type: |
dtr:perShareItemType |
| Balance Type: |
na |
| Period Type: |
instant |
|
| X |
- DefinitionPre-funded warrants exercised.
| Name: |
syta_PrefundedWarrantsExercisedShare |
| Namespace Prefix: |
syta_ |
| Data Type: |
xbrli:monetaryItemType |
| Balance Type: |
credit |
| Period Type: |
duration |
|
| X |
- DefinitionPre-funded warrants issued.
| Name: |
syta_PrefundedWarrantsIssued |
| Namespace Prefix: |
syta_ |
| Data Type: |
xbrli:monetaryItemType |
| Balance Type: |
credit |
| Period Type: |
duration |
|
| X |
- DefinitionProceeds from issued of warrants.
| Name: |
syta_ProceedsFromIssuedOfWarrants |
| Namespace Prefix: |
syta_ |
| Data Type: |
xbrli:sharesItemType |
| Balance Type: |
na |
| Period Type: |
duration |
|
| X |
- DefinitionRedemption of price per share.
| Name: |
syta_RedemptionOfPricePerShare |
| Namespace Prefix: |
syta_ |
| Data Type: |
dtr:perShareItemType |
| Balance Type: |
na |
| Period Type: |
duration |
|
| X |
- DefinitionNumber of shares of Sale of public share units as of the balance sheet date, including shares that had been issued and were previously outstanding but which are now held in the treasury.
| Name: |
syta_SaleOfPublicShareUnits |
| Namespace Prefix: |
syta_ |
| Data Type: |
xbrli:sharesItemType |
| Balance Type: |
na |
| Period Type: |
instant |
|
| X |
- DefinitionStock option exercise price per common share.
| Name: |
syta_StockOptionExercisePrice |
| Namespace Prefix: |
syta_ |
| Data Type: |
dtr:perShareItemType |
| Balance Type: |
na |
| Period Type: |
instant |
|
| X |
- DefinitionThe amount of stock option issued.
| Name: |
syta_StockOptionIssued |
| Namespace Prefix: |
syta_ |
| Data Type: |
xbrli:sharesItemType |
| Balance Type: |
na |
| Period Type: |
duration |
|
| X |
- DefinitionPrice of a single share of a number of saleable stocks of a company.
| Name: |
syta_StockPrice |
| Namespace Prefix: |
syta_ |
| Data Type: |
dtr:perShareItemType |
| Balance Type: |
na |
| Period Type: |
instant |
|
| X |
- DefinitionA strike price is a set price at which a derivative contract can be bought or sold when it is exercised. For call options, the strike price is where the security can be bought by the option holder; for put options, the strike price is the price at which the security can be sold.
| Name: |
syta_StrikeRate |
| Namespace Prefix: |
syta_ |
| Data Type: |
dtr:perShareItemType |
| Balance Type: |
na |
| Period Type: |
duration |
|
| X |
- DefinitionTransactions during the year description.
| Name: |
syta_TransactionsDuringTheYearDescription |
| Namespace Prefix: |
syta_ |
| Data Type: |
xbrli:stringItemType |
| Balance Type: |
na |
| Period Type: |
duration |
|
| X |
- DefinitionNumber of warrant issued.
| Name: |
syta_WarrantIssued |
| Namespace Prefix: |
syta_ |
| Data Type: |
xbrli:sharesItemType |
| Balance Type: |
na |
| Period Type: |
duration |
|
| X |
- DefinitionWarrants or rights outstanding term.
| Name: |
syta_WarrantsOrRightsOutstandingTerm |
| Namespace Prefix: |
syta_ |
| Data Type: |
xbrli:durationItemType |
| Balance Type: |
na |
| Period Type: |
duration |
|
| X |
- DefinitionThe weighted average exercise price of share options exercisable in a share-based payment arrangement. [Refer: Weighted average [member]]
| Name: |
syta_WeightedAverageExercisePriceOfShareOptionsExercisableInSharebasedPaymentArrangements |
| Namespace Prefix: |
syta_ |
| Data Type: |
dtr:perShareItemType |
| Balance Type: |
na |
| Period Type: |
instant |
|
| X |
- Details
| Name: |
ifrs-full_TypesOfSharebasedPaymentArrangementsAxis=ifrs-full_WarrantsMember |
| Namespace Prefix: |
|
| Data Type: |
na |
| Balance Type: |
|
| Period Type: |
|
|
| X |
- Details
| Name: |
ifrs-full_ClassesOfShareCapitalAxis=ifrs-full_OrdinarySharesMember |
| Namespace Prefix: |
|
| Data Type: |
na |
| Balance Type: |
|
| Period Type: |
|
|
| X |
- Details
| Name: |
ifrs-full_ClassesOfShareCapitalAxis=ifrs-full_WarrantsMember |
| Namespace Prefix: |
|
| Data Type: |
na |
| Balance Type: |
|
| Period Type: |
|
|
| X |
- Details
| Name: |
ifrs-full_ClassesOfShareCapitalAxis=syta_PreFundedUnitsMember |
| Namespace Prefix: |
|
| Data Type: |
na |
| Balance Type: |
|
| Period Type: |
|
|
| X |
- Details
| Name: |
ifrs-full_ClassesOfShareCapitalAxis=syta_OptionWarrantsMember |
| Namespace Prefix: |
|
| Data Type: |
na |
| Balance Type: |
|
| Period Type: |
|
|
| X |
- Details
| Name: |
ifrs-full_ClassesOfShareCapitalAxis=syta_PlacementAgentWarrantsMember |
| Namespace Prefix: |
|
| Data Type: |
na |
| Balance Type: |
|
| Period Type: |
|
|
| X |
- Details
| Name: |
ifrs-full_ClassesOfShareCapitalAxis=syta_StockOptionsMember |
| Namespace Prefix: |
|
| Data Type: |
na |
| Balance Type: |
|
| Period Type: |
|
|
| X |
- Details
| Name: |
ifrs-full_NonadjustingEventsAfterReportingPeriodAxis=syta_NonAdjustingEventMember |
| Namespace Prefix: |
|
| Data Type: |
na |
| Balance Type: |
|
| Period Type: |
|
|
v3.23.3
Share Capital (Details) - Schedule of Stock Option Activity - $ / shares
|
9 Months Ended |
12 Months Ended |
Sep. 30, 2023 |
Dec. 31, 2022 |
| Stock Options [Member] |
|
|
| Schedule of stock option activity [Abstract] |
|
|
| Number of options, Outstanding at beginning |
15,062
|
4,146
|
| Weighted average exercise price, Outstanding at beginning |
$ 352.91
|
$ 1,388
|
| Number of options, Granted |
|
11,450
|
| Weighted average exercise price, Granted |
|
$ 115
|
| Number of options, Expired/Cancelled |
|
(534)
|
| Weighted average exercise price, Expired/Cancelled |
|
$ (3,090)
|
| Number of options, Outstanding at ending |
15,062
|
15,062
|
| Weighted average exercise price, Outstanding at ending |
$ 352.91
|
$ 352.91
|
| Restricted Share Units [Member] |
|
|
| Schedule of stock option activity [Abstract] |
|
|
| Number of options, Outstanding at beginning |
31,650
|
0
|
| Weighted average exercise price, Outstanding at beginning |
$ 105.02
|
|
| Number of options, Granted |
|
31,950
|
| Weighted average exercise price, Granted |
|
$ 105.08
|
| Number of options, Exercised |
|
(300)
|
| Weighted average exercise price, Exercised |
|
$ (103)
|
| Number of options, Outstanding at ending |
31,650
|
31,650
|
| Weighted average exercise price, Outstanding at ending |
$ 105.02
|
$ 105.02
|
| Agents’ Options [Member] |
|
|
| Schedule of stock option activity [Abstract] |
|
|
| Number of options, Outstanding at beginning |
9,315
|
4,459
|
| Weighted average exercise price, Outstanding at beginning |
$ 487.06
|
$ 751
|
| Number of options, Granted |
|
4,873
|
| Weighted average exercise price, Granted |
|
$ 251
|
| Number of options, Expired/Cancelled |
|
(17)
|
| Weighted average exercise price, Expired/Cancelled |
|
$ 2,049
|
| Number of options, Outstanding at ending |
9,315
|
9,315
|
| Weighted average exercise price, Outstanding at ending |
$ 487.06
|
$ 487.06
|
| Share Purchase Warrants [Member] |
|
|
| Schedule of stock option activity [Abstract] |
|
|
| Number of options, Outstanding at beginning |
341,320
|
51,213
|
| Weighted average exercise price, Outstanding at beginning |
$ 176
|
$ 989
|
| Number of options, Granted |
180,429
|
291,391
|
| Weighted average exercise price, Granted |
$ 20
|
$ 94
|
| Number of options, Exercised |
(390,748)
|
|
| Weighted average exercise price, Exercised |
$ 9
|
|
| Number of options, Expired/Cancelled |
|
(1,284)
|
| Weighted average exercise price, Expired/Cancelled |
|
$ 3,347
|
| Number of options, Outstanding at ending |
131,001
|
341,320
|
| Weighted average exercise price, Outstanding at ending |
$ 383.62
|
$ 176
|
| X |
- DefinitionThe weighted average exercise price of share options granted in a share-based payment arrangement. [Refer: Weighted average [member]] Reference 1: http://www.xbrl.org/2003/role/disclosureRef
-Name IFRS
-Number 2
-IssueDate 2023-01-01
-Paragraph 45
-Subparagraph b
-Clause ii
-URI https://taxonomy.ifrs.org/xifrs-link?type=IFRS&num=2&code=ifrs-tx-2023-en-r&anchor=para_45_b_ii&doctype=Standard
-URIDate 2023-03-23
| Name: |
ifrs-full_WeightedAverageExercisePriceOfShareOptionsGrantedInSharebasedPaymentArrangement2019 |
| Namespace Prefix: |
ifrs-full_ |
| Data Type: |
dtr-types:perShareItemType |
| Balance Type: |
na |
| Period Type: |
duration |
|
| X |
- DefinitionThe weighted average exercise price of share options outstanding in a share-based payment arrangement. [Refer: Weighted average [member]] Reference 1: http://www.xbrl.org/2003/role/disclosureRef
-Name IFRS
-Number 2
-IssueDate 2023-01-01
-Paragraph 45
-Subparagraph b
-Clause i
-URI https://taxonomy.ifrs.org/xifrs-link?type=IFRS&num=2&code=ifrs-tx-2023-en-r&anchor=para_45_b_i&doctype=Standard
-URIDate 2023-03-23
Reference 2: http://www.xbrl.org/2003/role/disclosureRef
-Name IFRS
-Number 2
-IssueDate 2023-01-01
-Paragraph 45
-Subparagraph b
-Clause vi
-URI https://taxonomy.ifrs.org/xifrs-link?type=IFRS&num=2&code=ifrs-tx-2023-en-r&anchor=para_45_b_vi&doctype=Standard
-URIDate 2023-03-23
| Name: |
ifrs-full_WeightedAverageExercisePriceOfShareOptionsOutstandingInSharebasedPaymentArrangement2019 |
| Namespace Prefix: |
ifrs-full_ |
| Data Type: |
dtr-types:perShareItemType |
| Balance Type: |
na |
| Period Type: |
instant |
|
| X |
- DefinitionNumber of options exercised.
| Name: |
syta_NumberOfOptionsExercised |
| Namespace Prefix: |
syta_ |
| Data Type: |
xbrli:sharesItemType |
| Balance Type: |
na |
| Period Type: |
duration |
|
| X |
- DefinitionNumber of options granted.
| Name: |
syta_NumberOfOptionsGranted |
| Namespace Prefix: |
syta_ |
| Data Type: |
xbrli:sharesItemType |
| Balance Type: |
na |
| Period Type: |
duration |
|
| X |
- DefinitionNumber of options outstanding.
| Name: |
syta_NumberOfOptionsOutstanding |
| Namespace Prefix: |
syta_ |
| Data Type: |
xbrli:sharesItemType |
| Balance Type: |
na |
| Period Type: |
instant |
|
| X |
- DefinitionNumber of Stock Options, Expired.
| Name: |
syta_NumberOfShareOptionsExpiredInSharebasedPaymentArrangement1 |
| Namespace Prefix: |
syta_ |
| Data Type: |
xbrli:sharesItemType |
| Balance Type: |
na |
| Period Type: |
duration |
|
| X |
- References
+ Details
| Name: |
syta_ShareCapitalDetailsScheduleofStockOptionActivityLineItems |
| Namespace Prefix: |
syta_ |
| Data Type: |
xbrli:stringItemType |
| Balance Type: |
na |
| Period Type: |
duration |
|
| X |
- DefinitionThe weighted average exercise price of share options exercised in a share-based payment arrangement. [Refer: Weighted average [member]]
| Name: |
syta_WeightedAverageExercisePriceOfSharesOptionsExercisedInSharebasedPaymentArrangement2019 |
| Namespace Prefix: |
syta_ |
| Data Type: |
dtr:perShareItemType |
| Balance Type: |
na |
| Period Type: |
duration |
|
| X |
- DefinitionThe weighted average exercise price of share options expired in a share-based payment arrangement. [Refer: Weighted average [member]]
| Name: |
syta_WeightedAverageExercisePriceOfSharesOptionsExpiredInSharebasedPaymentArrangement2019 |
| Namespace Prefix: |
syta_ |
| Data Type: |
dtr:perShareItemType |
| Balance Type: |
na |
| Period Type: |
duration |
|
| X |
- Details
| Name: |
ifrs-full_TypesOfSharebasedPaymentArrangementsAxis=syta_StockOptionsMember |
| Namespace Prefix: |
|
| Data Type: |
na |
| Balance Type: |
|
| Period Type: |
|
|
| X |
- Details
| Name: |
ifrs-full_TypesOfSharebasedPaymentArrangementsAxis=ifrs-full_RestrictedShareUnitsMember |
| Namespace Prefix: |
|
| Data Type: |
na |
| Balance Type: |
|
| Period Type: |
|
|
| X |
- Details
| Name: |
ifrs-full_TypesOfSharebasedPaymentArrangementsAxis=syta_AgentsOptionsMember |
| Namespace Prefix: |
|
| Data Type: |
na |
| Balance Type: |
|
| Period Type: |
|
|
| X |
- Details
| Name: |
ifrs-full_TypesOfSharebasedPaymentArrangementsAxis=syta_SharePurchaseWarrantsMember |
| Namespace Prefix: |
|
| Data Type: |
na |
| Balance Type: |
|
| Period Type: |
|
|
v3.23.3
Share Capital (Details) - Schedule of Stock Options Outstanding
|
9 Months Ended |
|
Sep. 30, 2023
$ / shares
shares
|
|---|
| Stock Options [Member] |
|
| Share Capital (Details) - Schedule of Stock Options Outstanding [Line Items] |
|
| Number of options outstanding |
15,061
|
| Number of options exercisable |
9,161
|
| Weighted Average Exercise Price (in Dollars per share) | $ / shares |
$ 352.91
|
| Remaining contractual life (years) |
3 years 1 month 13 days
|
| Stock Options [Member] | 24-Dec-18 [Member] |
|
| Share Capital (Details) - Schedule of Stock Options Outstanding [Line Items] |
|
| Number of options outstanding |
129
|
| Number of options exercisable |
129
|
| Weighted Average Exercise Price (in Dollars per share) | $ / shares |
$ 5,400
|
| Expiry date |
24-Dec-23
|
| Remaining contractual life (years) |
2 months 23 days
|
| Stock Options [Member] | 15-Jan-19 [Member] |
|
| Share Capital (Details) - Schedule of Stock Options Outstanding [Line Items] |
|
| Number of options outstanding |
8
|
| Number of options exercisable |
8
|
| Weighted Average Exercise Price (in Dollars per share) | $ / shares |
$ 5,400
|
| Expiry date |
15-Jan-24
|
| Remaining contractual life (years) |
3 months 14 days
|
| Stock Options [Member] | 21-Mar-19 [Member] |
|
| Share Capital (Details) - Schedule of Stock Options Outstanding [Line Items] |
|
| Number of options outstanding |
123
|
| Number of options exercisable |
123
|
| Weighted Average Exercise Price (in Dollars per share) | $ / shares |
$ 5,900
|
| Expiry date |
21-Mar-24
|
| Remaining contractual life (years) |
5 months 19 days
|
| Stock Options [Member] | 1-Jan-20 [Member] |
|
| Share Capital (Details) - Schedule of Stock Options Outstanding [Line Items] |
|
| Number of options outstanding |
21
|
| Number of options exercisable |
21
|
| Weighted Average Exercise Price (in Dollars per share) | $ / shares |
$ 5,400
|
| Expiry date |
1-Jan-24
|
| Remaining contractual life (years) |
3 months
|
| Stock Options [Member] | 15-Nov-20 [Member] |
|
| Share Capital (Details) - Schedule of Stock Options Outstanding [Line Items] |
|
| Number of options outstanding |
950
|
| Number of options exercisable |
950
|
| Weighted Average Exercise Price (in Dollars per share) | $ / shares |
$ 600
|
| Expiry date |
15-Nov-30
|
| Remaining contractual life (years) |
7 years 1 month 17 days
|
| Stock Options [Member] | 15-Nov-20 [Member] |
|
| Share Capital (Details) - Schedule of Stock Options Outstanding [Line Items] |
|
| Number of options outstanding |
1,615
|
| Number of options exercisable |
1,615
|
| Weighted Average Exercise Price (in Dollars per share) | $ / shares |
$ 600
|
| Expiry date |
15-Nov-25
|
| Remaining contractual life (years) |
2 years 1 month 17 days
|
| Stock Options [Member] | 2-Jan-21 [Member] |
|
| Share Capital (Details) - Schedule of Stock Options Outstanding [Line Items] |
|
| Number of options outstanding |
570
|
| Number of options exercisable |
570
|
| Weighted Average Exercise Price (in Dollars per share) | $ / shares |
$ 1,150
|
| Expiry date |
2-Jan-26
|
| Remaining contractual life (years) |
2 years 3 months 3 days
|
| Stock Options [Member] | 2-Jan-21 [Member] |
|
| Share Capital (Details) - Schedule of Stock Options Outstanding [Line Items] |
|
| Number of options outstanding |
50
|
| Number of options exercisable |
50
|
| Weighted Average Exercise Price (in Dollars per share) | $ / shares |
$ 1,150
|
| Expiry date |
2-Jan-31
|
| Remaining contractual life (years) |
7 years 3 months 3 days
|
| Stock Options [Member] | 18-Jan-21 [Member] |
|
| Share Capital (Details) - Schedule of Stock Options Outstanding [Line Items] |
|
| Number of options outstanding |
145
|
| Number of options exercisable |
145
|
| Weighted Average Exercise Price (in Dollars per share) | $ / shares |
$ 1,150
|
| Expiry date |
18-Jan-26
|
| Remaining contractual life (years) |
2 years 3 months 18 days
|
| Stock Options [Member] | 01-Jan-22 [Member] |
|
| Share Capital (Details) - Schedule of Stock Options Outstanding [Line Items] |
|
| Number of options outstanding |
200
|
| Number of options exercisable |
200
|
| Weighted Average Exercise Price (in Dollars per share) | $ / shares |
$ 400
|
| Expiry date |
29-Oct-26
|
| Remaining contractual life (years) |
3 years 29 days
|
| Stock Options [Member] | 13-Apr-22 [Member] |
|
| Share Capital (Details) - Schedule of Stock Options Outstanding [Line Items] |
|
| Number of options outstanding |
7,950
|
| Number of options exercisable |
3,975
|
| Weighted Average Exercise Price (in Dollars per share) | $ / shares |
$ 110
|
| Expiry date |
13-Apr-27
|
| Remaining contractual life (years) |
3 years 6 months 14 days
|
| Stock Options [Member] | 12-Jul-22 [Member] |
|
| Share Capital (Details) - Schedule of Stock Options Outstanding [Line Items] |
|
| Number of options outstanding |
3,300
|
| Number of options exercisable |
1,375
|
| Weighted Average Exercise Price (in Dollars per share) | $ / shares |
$ 110
|
| Expiry date |
12-Jul-25
|
| Remaining contractual life (years) |
1 year 9 months 10 days
|
| Restricted share units [member] |
|
| Share Capital (Details) - Schedule of Stock Options Outstanding [Line Items] |
|
| Number of options outstanding |
3,165,000
|
| Weighted Average Exercise Price (in Dollars per share) | $ / shares |
$ 1.05
|
| Restricted share units [member] | 9-Mar-22 [Member] |
|
| Share Capital (Details) - Schedule of Stock Options Outstanding [Line Items] |
|
| Number of options outstanding |
2,250,000
|
| Weighted Average Exercise Price (in Dollars per share) | $ / shares |
$ 1.03
|
| Restricted share units [member] | 13-Apr-22 [Member] |
|
| Share Capital (Details) - Schedule of Stock Options Outstanding [Line Items] |
|
| Number of options outstanding |
825,000
|
| Weighted Average Exercise Price (in Dollars per share) | $ / shares |
$ 1.1
|
| Restricted share units [member] | 12-Jul-22 [Member] |
|
| Share Capital (Details) - Schedule of Stock Options Outstanding [Line Items] |
|
| Number of options outstanding |
90,000
|
| Weighted Average Exercise Price (in Dollars per share) | $ / shares |
$ 1.1
|
| Agent Option Outstanding [Member] |
|
| Share Capital (Details) - Schedule of Stock Options Outstanding [Line Items] |
|
| Number of options outstanding |
9,315
|
| Number of options exercisable |
9,315
|
| Weighted Average Exercise Price (in Dollars per share) | $ / shares |
$ 487.06
|
| Remaining contractual life (years) |
2 years 7 months 2 days
|
| Agent Option Outstanding [Member] | 29-Sep-20 [Member] |
|
| Share Capital (Details) - Schedule of Stock Options Outstanding [Line Items] |
|
| Number of options outstanding |
1,135
|
| Number of options exercisable |
1,135
|
| Weighted Average Exercise Price (in Dollars per share) | $ / shares |
$ 660
|
| Expiry date |
28-Sep-25
|
| Remaining contractual life (years) |
2 years
|
| Agent Option Outstanding [Member] | 29-Sep-20 [Member] |
|
| Share Capital (Details) - Schedule of Stock Options Outstanding [Line Items] |
|
| Number of options outstanding |
2,660
|
| Number of options exercisable |
2,660
|
| Weighted Average Exercise Price (in Dollars per share) | $ / shares |
$ 685
|
| Expiry date |
28-Sep-25
|
| Remaining contractual life (years) |
2 years
|
| Agent Option Outstanding [Member] | 31-Dec-20 [Member] |
|
| Share Capital (Details) - Schedule of Stock Options Outstanding [Line Items] |
|
| Number of options outstanding |
647
|
| Number of options exercisable |
647
|
| Weighted Average Exercise Price (in Dollars per share) | $ / shares |
$ 1,150
|
| Expiry date |
30-Jun-24
|
| Remaining contractual life (years) |
9 months
|
| Agent Option Outstanding [Member] | 11-Jan-22 [Member] |
|
| Share Capital (Details) - Schedule of Stock Options Outstanding [Line Items] |
|
| Number of options outstanding |
4,348
|
| Number of options exercisable |
4,348
|
| Weighted Average Exercise Price (in Dollars per share) | $ / shares |
$ 253
|
| Expiry date |
11-Jan-27
|
| Remaining contractual life (years) |
3 years 3 months 10 days
|
| Agent Option Outstanding [Member] | 1-Apr-22 [Member] |
|
| Share Capital (Details) - Schedule of Stock Options Outstanding [Line Items] |
|
| Number of options outstanding |
525
|
| Number of options exercisable |
525
|
| Weighted Average Exercise Price (in Dollars per share) | $ / shares |
$ 230
|
| Expiry date |
8-Mar-27
|
| Remaining contractual life (years) |
3 years 5 months 8 days
|
| Agent Option Outstanding MD&A [Member] |
|
| Share Capital (Details) - Schedule of Stock Options Outstanding [Line Items] |
|
| Number of options outstanding |
129,315
|
| Number of options exercisable |
9,315
|
| Weighted Average Exercise Price (in Dollars per share) | $ / shares |
$ 35.75
|
| Remaining contractual life (years) |
4 years 9 months 14 days
|
| Agent Option Outstanding MD&A [Member] | 1-Apr-22 [Member] |
|
| Share Capital (Details) - Schedule of Stock Options Outstanding [Line Items] |
|
| Number of options outstanding |
525
|
| Number of options exercisable |
525
|
| Weighted Average Exercise Price (in Dollars per share) | $ / shares |
$ 230
|
| Expiry date |
8-Mar-27
|
| Remaining contractual life (years) |
3 years 3 months 25 days
|
| Agent Option Outstanding MD&A [Member] | 29-Sep-20 [Member] |
|
| Share Capital (Details) - Schedule of Stock Options Outstanding [Line Items] |
|
| Number of options outstanding |
1,135
|
| Number of options exercisable |
1,135
|
| Weighted Average Exercise Price (in Dollars per share) | $ / shares |
$ 660
|
| Expiry date |
28-Sep-25
|
| Remaining contractual life (years) |
1 year 10 months 13 days
|
| Agent Option Outstanding MD&A [Member] | 29-Sep-20 [Member] |
|
| Share Capital (Details) - Schedule of Stock Options Outstanding [Line Items] |
|
| Number of options outstanding |
2,660
|
| Number of options exercisable |
2,660
|
| Weighted Average Exercise Price (in Dollars per share) | $ / shares |
$ 685
|
| Expiry date |
28-Sep-25
|
| Remaining contractual life (years) |
1 year 10 months 13 days
|
| Agent Option Outstanding MD&A [Member] | 31-Dec-20 [Member] |
|
| Share Capital (Details) - Schedule of Stock Options Outstanding [Line Items] |
|
| Number of options outstanding |
647
|
| Number of options exercisable |
647
|
| Weighted Average Exercise Price (in Dollars per share) | $ / shares |
$ 1,150
|
| Expiry date |
30-Jun-24
|
| Remaining contractual life (years) |
7 months 17 days
|
| Agent Option Outstanding MD&A [Member] | 11-Jan-22 [Member] |
|
| Share Capital (Details) - Schedule of Stock Options Outstanding [Line Items] |
|
| Number of options outstanding |
4,348
|
| Number of options exercisable |
4,348
|
| Weighted Average Exercise Price (in Dollars per share) | $ / shares |
$ 253
|
| Expiry date |
11-Jan-27
|
| Remaining contractual life (years) |
3 years 1 month 28 days
|
| Agent Option Outstanding MD&A [Member] | 31-Oct-23 [Member] |
|
| Share Capital (Details) - Schedule of Stock Options Outstanding [Line Items] |
|
| Number of options outstanding |
120,000
|
| Number of options exercisable |
0
|
| Weighted Average Exercise Price (in Dollars per share) | $ / shares |
$ 0.72
|
| Expiry date |
31-Oct-28
|
| Remaining contractual life (years) |
4 years 11 months 19 days
|
| Share Purchase Warrants [Member] |
|
| Share Capital (Details) - Schedule of Stock Options Outstanding [Line Items] |
|
| Number of options outstanding |
131,001
|
| Weighted Average Exercise Price (in Dollars per share) | $ / shares |
$ 383.62
|
| Share Purchase Warrants [Member] | 29-Sep-20 [Member] |
|
| Share Capital (Details) - Schedule of Stock Options Outstanding [Line Items] |
|
| Number of options outstanding |
18,056
|
| Weighted Average Exercise Price (in Dollars per share) | $ / shares |
$ 685
|
| Expiry date |
28-Sep-25
|
| Share Purchase Warrants [Member] | 31-Dec-20 [Member] |
|
| Share Capital (Details) - Schedule of Stock Options Outstanding [Line Items] |
|
| Number of options outstanding |
12,945
|
| Weighted Average Exercise Price (in Dollars per share) | $ / shares |
$ 1,150
|
| Expiry date |
30-Jun-24
|
| Share Purchase Warrants [Member] | 11-Jan-22 [Member] |
|
| Share Capital (Details) - Schedule of Stock Options Outstanding [Line Items] |
|
| Number of options outstanding |
100,000
|
| Weighted Average Exercise Price (in Dollars per share) | $ / shares |
$ 230
|
| Expiry date |
10-Jan-27
|
| X |
- DefinitionThe potential dilutive effect on the weighted average number of ordinary shares that relate to the assumed exercise of the entity's share options. Reference 1: http://www.xbrl.org/2009/role/commonPracticeRef
-Name IAS
-Number 33
-IssueDate 2023-01-01
-Paragraph 70
-Subparagraph b
-URI https://taxonomy.ifrs.org/xifrs-link?type=IAS&num=33&code=ifrs-tx-2023-en-r&anchor=para_70_b&doctype=Standard
-URIDate 2023-03-23
| Name: |
ifrs-full_DilutiveEffectOfShareOptionsOnNumberOfOrdinaryShares |
| Namespace Prefix: |
ifrs-full_ |
| Data Type: |
xbrli:sharesItemType |
| Balance Type: |
na |
| Period Type: |
duration |
|
| X |
- DefinitionThe number of shares that have been authorised and issued, reduced by treasury shares held. [Refer: Treasury shares] Reference 1: http://www.xbrl.org/2003/role/disclosureRef
-Name IAS
-Number 1
-IssueDate 2023-01-01
-Paragraph 79
-Subparagraph a
-Clause iv
-URI https://taxonomy.ifrs.org/xifrs-link?type=IAS&num=1&code=ifrs-tx-2023-en-r&anchor=para_79_a_iv&doctype=Standard
-URIDate 2023-03-23
| Name: |
ifrs-full_NumberOfSharesOutstanding |
| Namespace Prefix: |
ifrs-full_ |
| Data Type: |
xbrli:sharesItemType |
| Balance Type: |
na |
| Period Type: |
instant |
|
| X |
- DefinitionThe weighted average exercise price of share options exercisable in a share-based payment arrangement. [Refer: Weighted average [member]] Reference 1: http://www.xbrl.org/2003/role/disclosureRef
-Name IFRS
-Number 2
-IssueDate 2023-01-01
-Paragraph 45
-Subparagraph b
-Clause vii
-URI https://taxonomy.ifrs.org/xifrs-link?type=IFRS&num=2&code=ifrs-tx-2023-en-r&anchor=para_45_b_vii&doctype=Standard
-URIDate 2023-03-23
| Name: |
ifrs-full_WeightedAverageExercisePriceOfShareOptionsExercisableInSharebasedPaymentArrangement2019 |
| Namespace Prefix: |
ifrs-full_ |
| Data Type: |
dtr-types:perShareItemType |
| Balance Type: |
na |
| Period Type: |
instant |
|
| X |
- References
+ Details
| Name: |
syta_ExpiryDate |
| Namespace Prefix: |
syta_ |
| Data Type: |
xbrli:stringItemType |
| Balance Type: |
na |
| Period Type: |
duration |
|
| X |
- DefinitionThe weighted average remaining contractual life of outstanding share options.
| Name: |
syta_RemainingContractualLifeyears |
| Namespace Prefix: |
syta_ |
| Data Type: |
xbrli:durationItemType |
| Balance Type: |
na |
| Period Type: |
duration |
|
| X |
- References
+ Details
| Name: |
syta_ShareCapitalDetailsScheduleofStockOptionsOutstandingLineItems |
| Namespace Prefix: |
syta_ |
| Data Type: |
xbrli:stringItemType |
| Balance Type: |
na |
| Period Type: |
duration |
|
| X |
- Details
| Name: |
ifrs-full_TypesOfSharebasedPaymentArrangementsAxis=syta_StockOptionsMember |
| Namespace Prefix: |
|
| Data Type: |
na |
| Balance Type: |
|
| Period Type: |
|
|
| X |
- Details
| Name: |
ifrs-full_CreationDateAxis=syta_TwentyFourDecemberTwoThousandEighteenMember |
| Namespace Prefix: |
|
| Data Type: |
na |
| Balance Type: |
|
| Period Type: |
|
|
| X |
- Details
| Name: |
ifrs-full_CreationDateAxis=syta_FifteenJanuaryTwoThousandNineteenMember |
| Namespace Prefix: |
|
| Data Type: |
na |
| Balance Type: |
|
| Period Type: |
|
|
| X |
- Details
| Name: |
ifrs-full_CreationDateAxis=syta_TwentyOneMarchNineteenMember |
| Namespace Prefix: |
|
| Data Type: |
na |
| Balance Type: |
|
| Period Type: |
|
|
| X |
- Details
| Name: |
ifrs-full_CreationDateAxis=syta_OneJanTwentyMember |
| Namespace Prefix: |
|
| Data Type: |
na |
| Balance Type: |
|
| Period Type: |
|
|
| X |
- Details
| Name: |
ifrs-full_CreationDateAxis=syta_FifteenNovemberTwoThousandTwentyMember |
| Namespace Prefix: |
|
| Data Type: |
na |
| Balance Type: |
|
| Period Type: |
|
|
| X |
- Details
| Name: |
ifrs-full_CreationDateAxis=syta_FifteenNovemberThousandTwentyOneMember |
| Namespace Prefix: |
|
| Data Type: |
na |
| Balance Type: |
|
| Period Type: |
|
|
| X |
- Details
| Name: |
ifrs-full_CreationDateAxis=syta_TwoJanTwentyOneMember |
| Namespace Prefix: |
|
| Data Type: |
na |
| Balance Type: |
|
| Period Type: |
|
|
| X |
- Details
| Name: |
ifrs-full_CreationDateAxis=syta_TwoJanTwentyOne1Member |
| Namespace Prefix: |
|
| Data Type: |
na |
| Balance Type: |
|
| Period Type: |
|
|
| X |
- Details
| Name: |
ifrs-full_CreationDateAxis=syta_EighteenthJanuaryTwoThousandAndTwentyOneMember |
| Namespace Prefix: |
|
| Data Type: |
na |
| Balance Type: |
|
| Period Type: |
|
|
| X |
- Details
| Name: |
ifrs-full_CreationDateAxis=syta_OneJanuaryTwoThousandAndTwentyTwoMember |
| Namespace Prefix: |
|
| Data Type: |
na |
| Balance Type: |
|
| Period Type: |
|
|
| X |
- Details
| Name: |
ifrs-full_CreationDateAxis=syta_ThirteenthAprilTwoThousandAndTwentyTwoMember |
| Namespace Prefix: |
|
| Data Type: |
na |
| Balance Type: |
|
| Period Type: |
|
|
| X |
- Details
| Name: |
ifrs-full_CreationDateAxis=syta_twelveJulyTwoThousandAndTwentyTwoMember |
| Namespace Prefix: |
|
| Data Type: |
na |
| Balance Type: |
|
| Period Type: |
|
|
| X |
- Details
| Name: |
ifrs-full_TypesOfSharebasedPaymentArrangementsAxis=ifrs-full_RestrictedShareUnitsMember |
| Namespace Prefix: |
|
| Data Type: |
na |
| Balance Type: |
|
| Period Type: |
|
|
| X |
- Details
| Name: |
ifrs-full_CreationDateAxis=syta_NineMarchTwoThousandTwnetyTwoMember |
| Namespace Prefix: |
|
| Data Type: |
na |
| Balance Type: |
|
| Period Type: |
|
|
| X |
- Details
| Name: |
ifrs-full_CreationDateAxis=syta_ThirteenAprilTwoThousandTwentyTwoMember |
| Namespace Prefix: |
|
| Data Type: |
na |
| Balance Type: |
|
| Period Type: |
|
|
| X |
- Details
| Name: |
ifrs-full_CreationDateAxis=syta_TwevleJulyTwoThousandTwentyTwoMember |
| Namespace Prefix: |
|
| Data Type: |
na |
| Balance Type: |
|
| Period Type: |
|
|
| X |
- Details
| Name: |
ifrs-full_TypesOfSharebasedPaymentArrangementsAxis=syta_AgentOptionOutstandingMember |
| Namespace Prefix: |
|
| Data Type: |
na |
| Balance Type: |
|
| Period Type: |
|
|
| X |
- Details
| Name: |
ifrs-full_CreationDateAxis=syta_TwentyNineSeptemberTwentyMember |
| Namespace Prefix: |
|
| Data Type: |
na |
| Balance Type: |
|
| Period Type: |
|
|
| X |
- Details
| Name: |
ifrs-full_CreationDateAxis=syta_TwentyNineSeptemberTwoThousandTwentyOneMember |
| Namespace Prefix: |
|
| Data Type: |
na |
| Balance Type: |
|
| Period Type: |
|
|
| X |
- Details
| Name: |
ifrs-full_CreationDateAxis=syta_ThirtyDecemberTwentyMember |
| Namespace Prefix: |
|
| Data Type: |
na |
| Balance Type: |
|
| Period Type: |
|
|
| X |
- Details
| Name: |
ifrs-full_CreationDateAxis=syta_ElevenDecemberTwentyTwoMember |
| Namespace Prefix: |
|
| Data Type: |
na |
| Balance Type: |
|
| Period Type: |
|
|
| X |
- Details
| Name: |
ifrs-full_CreationDateAxis=syta_OneAprilTwentyTwoMember |
| Namespace Prefix: |
|
| Data Type: |
na |
| Balance Type: |
|
| Period Type: |
|
|
| X |
- Details
| Name: |
ifrs-full_TypesOfSharebasedPaymentArrangementsAxis=syta_AgentOptionOutstandingMDAMember |
| Namespace Prefix: |
|
| Data Type: |
na |
| Balance Type: |
|
| Period Type: |
|
|
| X |
- Details
| Name: |
ifrs-full_CreationDateAxis=syta_TwentyNineSeptemberTwenty2Member |
| Namespace Prefix: |
|
| Data Type: |
na |
| Balance Type: |
|
| Period Type: |
|
|
| X |
- Details
| Name: |
ifrs-full_CreationDateAxis=syta_TwentyNineSeptemberTwenty3Member |
| Namespace Prefix: |
|
| Data Type: |
na |
| Balance Type: |
|
| Period Type: |
|
|
| X |
- Details
| Name: |
ifrs-full_CreationDateAxis=syta_ThirtyfirstDecemberTwoThousandTwentyMember |
| Namespace Prefix: |
|
| Data Type: |
na |
| Balance Type: |
|
| Period Type: |
|
|
| X |
- Details
| Name: |
ifrs-full_CreationDateAxis=syta_ElevenDecemberTwentyTwo1Member |
| Namespace Prefix: |
|
| Data Type: |
na |
| Balance Type: |
|
| Period Type: |
|
|
| X |
- Details
| Name: |
ifrs-full_CreationDateAxis=syta_ThirtyFirstOctoberTwentyThreeMember |
| Namespace Prefix: |
|
| Data Type: |
na |
| Balance Type: |
|
| Period Type: |
|
|
| X |
- Details
| Name: |
ifrs-full_TypesOfSharebasedPaymentArrangementsAxis=syta_SharePurchaseWarrantsMember |
| Namespace Prefix: |
|
| Data Type: |
na |
| Balance Type: |
|
| Period Type: |
|
|
| X |
- Details
| Name: |
ifrs-full_CreationDateAxis=syta_ThirtyOneDecemberTwenty3Member |
| Namespace Prefix: |
|
| Data Type: |
na |
| Balance Type: |
|
| Period Type: |
|
|
| X |
- Details
| Name: |
ifrs-full_CreationDateAxis=syta_ElevenDecemberTwentyTwo2Member |
| Namespace Prefix: |
|
| Data Type: |
na |
| Balance Type: |
|
| Period Type: |
|
|
v3.23.3
Cost of Sales (Details) - Schedule of Cost of Sales - USD ($)
$ in Thousands |
3 Months Ended |
9 Months Ended |
Sep. 30, 2023 |
Sep. 30, 2022 |
Sep. 30, 2023 |
Sep. 30, 2022 |
| Schedule of Cost of Sales [Abstract] |
|
|
|
|
| Inventory expensed |
$ 1,035
|
$ 1,328
|
$ 3,627
|
$ 2,167
|
| Royalties |
103
|
84
|
300
|
178
|
| Other expenses |
214
|
300
|
638
|
806
|
| Total |
$ 1,352
|
$ 1,712
|
$ 4,565
|
$ 3,151
|
| X |
- DefinitionThe amount of expenses that the entity does not separately disclose in the same statement or note when the entity uses the 'nature of expense' form for its analysis of expenses. [Refer: Expenses, by nature] Reference 1: http://www.xbrl.org/2003/role/exampleRef
-Name IAS
-Number 1
-IssueDate 2023-01-01
-Paragraph 102
-URI https://taxonomy.ifrs.org/xifrs-link?type=IAS&num=1&code=ifrs-tx-2023-en-r&anchor=para_102&doctype=Standard
-URIDate 2023-03-23
Reference 2: http://www.xbrl.org/2003/role/disclosureRef
-Name IAS
-Number 1
-IssueDate 2023-01-01
-Paragraph 99
-URI https://taxonomy.ifrs.org/xifrs-link?type=IAS&num=1&code=ifrs-tx-2023-en-r&anchor=para_99&doctype=Standard
-URIDate 2023-03-23
| Name: |
ifrs-full_OtherExpenseByNature |
| Namespace Prefix: |
ifrs-full_ |
| Data Type: |
xbrli:monetaryItemType |
| Balance Type: |
debit |
| Period Type: |
duration |
|
| X |
- DefinitionThe amount of expense arising from royalties. Reference 1: http://www.xbrl.org/2009/role/commonPracticeRef
-Name IAS
-Number 1
-IssueDate 2023-01-01
-Paragraph 85
-URI https://taxonomy.ifrs.org/xifrs-link?type=IAS&num=1&code=ifrs-tx-2023-en-r&anchor=para_85&doctype=Standard
-URIDate 2023-03-23
| Name: |
ifrs-full_RoyaltyExpense |
| Namespace Prefix: |
ifrs-full_ |
| Data Type: |
xbrli:monetaryItemType |
| Balance Type: |
debit |
| Period Type: |
duration |
|
| X |
- DefinitionThe amount of all expenses directly or indirectly attributed to the goods or services sold. Attributed expenses include, but are not limited to, costs previously included in the measurement of inventory that has now been sold, such as depreciation and maintenance of factory buildings and equipment used in the production process, unallocated production overheads, and abnormal amounts of production costs of inventories.
| Name: |
syta_CostOfSalesTotal |
| Namespace Prefix: |
syta_ |
| Data Type: |
xbrli:monetaryItemType |
| Balance Type: |
debit |
| Period Type: |
duration |
|
| X |
- References
+ Details
| Name: |
syta_CostofSalesDetailsScheduleofCostofSalesLineItems |
| Namespace Prefix: |
syta_ |
| Data Type: |
xbrli:stringItemType |
| Balance Type: |
na |
| Period Type: |
duration |
|
| X |
- DefinitionThe amount of inventory expensed.
| Name: |
syta_InventoryExpensed |
| Namespace Prefix: |
syta_ |
| Data Type: |
xbrli:monetaryItemType |
| Balance Type: |
debit |
| Period Type: |
duration |
|
v3.23.3
Selling and Marketing Expenses (Details) - Schedule of Selling and Marketing Expenses - USD ($)
$ in Thousands |
3 Months Ended |
9 Months Ended |
Sep. 30, 2023 |
Sep. 30, 2022 |
Sep. 30, 2023 |
Sep. 30, 2022 |
| Schedule of selling and marketing expenses [Abstract] |
|
|
|
|
| Salaries and related expenses |
$ 691
|
$ 720
|
$ 2,007
|
$ 1,981
|
| Advertising and marketing |
697
|
472
|
1,321
|
1,334
|
| Travel and conferences |
36
|
33
|
137
|
119
|
| Total |
$ 1,424
|
$ 1,225
|
$ 3,465
|
$ 3,434
|
| X |
- DefinitionThe amount of expense arising from advertising. Reference 1: http://www.xbrl.org/2009/role/commonPracticeRef
-Name IAS
-Number 1
-IssueDate 2023-01-01
-Paragraph 112
-Subparagraph c
-URI https://taxonomy.ifrs.org/xifrs-link?type=IAS&num=1&code=ifrs-tx-2023-en-r&anchor=para_112_c&doctype=Standard
-URIDate 2023-03-23
| Name: |
ifrs-full_AdvertisingExpense |
| Namespace Prefix: |
ifrs-full_ |
| Data Type: |
xbrli:monetaryItemType |
| Balance Type: |
debit |
| Period Type: |
duration |
|
| X |
- References
+ Details
| Name: |
syta_SellingandMarketingExpensesDetailsScheduleofSellingandMarketingExpensesLineItems |
| Namespace Prefix: |
syta_ |
| Data Type: |
xbrli:stringItemType |
| Balance Type: |
na |
| Period Type: |
duration |
|
| X |
- DefinitionAmount of Selling and Marketing Expenses.
| Name: |
syta_TotalSellingMarketingExpenses |
| Namespace Prefix: |
syta_ |
| Data Type: |
xbrli:monetaryItemType |
| Balance Type: |
debit |
| Period Type: |
duration |
|
| X |
- DefinitionAmount of Travel and conferences.
| Name: |
syta_TravelAndConferences |
| Namespace Prefix: |
syta_ |
| Data Type: |
xbrli:monetaryItemType |
| Balance Type: |
debit |
| Period Type: |
duration |
|
v3.23.3
General and Administrative Expenses (Details) - Schedule of General and Administrative Eexpenses - USD ($)
$ in Thousands |
3 Months Ended |
9 Months Ended |
Sep. 30, 2023 |
Sep. 30, 2022 |
Sep. 30, 2023 |
Sep. 30, 2022 |
| Schedule of General and Administrative Eexpenses [Abstract] |
|
|
|
|
| Salaries and related expenses |
$ 284
|
$ 144
|
$ 725
|
$ 438
|
| Professional services |
296
|
408
|
1,622
|
1,349
|
| Consulting and director fees |
296
|
251
|
782
|
949
|
| Travel |
16
|
9
|
63
|
107
|
| Office and general |
296
|
260
|
906
|
1,244
|
| Regulatory and filing fees |
59
|
44
|
143
|
109
|
| Shareholder relations |
71
|
58
|
173
|
489
|
| Total |
$ 1,318
|
$ 1,174
|
$ 4,414
|
$ 4,685
|
| X |
- DefinitionThe amount of fees paid or payable for professional services. Reference 1: http://www.xbrl.org/2009/role/commonPracticeRef
-Name IAS
-Number 1
-IssueDate 2023-01-01
-Paragraph 112
-Subparagraph c
-URI https://taxonomy.ifrs.org/xifrs-link?type=IAS&num=1&code=ifrs-tx-2023-en-r&anchor=para_112_c&doctype=Standard
-URIDate 2023-03-23
| Name: |
ifrs-full_ProfessionalFeesExpense |
| Namespace Prefix: |
ifrs-full_ |
| Data Type: |
xbrli:monetaryItemType |
| Balance Type: |
debit |
| Period Type: |
duration |
|
| X |
- DefinitionThe amount of expense relating to selling, general and administrative activities of the entity. Reference 1: http://www.xbrl.org/2009/role/commonPracticeRef
-Name IAS
-Number 1
-IssueDate 2023-01-01
-Paragraph 85
-URI https://taxonomy.ifrs.org/xifrs-link?type=IAS&num=1&code=ifrs-tx-2023-en-r&anchor=para_85&doctype=Standard
-URIDate 2023-03-23
| Name: |
ifrs-full_SellingGeneralAndAdministrativeExpense |
| Namespace Prefix: |
ifrs-full_ |
| Data Type: |
xbrli:monetaryItemType |
| Balance Type: |
debit |
| Period Type: |
duration |
|
| X |
- DefinitionA class of employee benefits expense that represents wages and salaries. [Refer: Employee benefits expense] Reference 1: http://www.xbrl.org/2009/role/commonPracticeRef
-Name IAS
-Number 19
-IssueDate 2023-01-01
-Paragraph 9
-URI https://taxonomy.ifrs.org/xifrs-link?type=IAS&num=19&code=ifrs-tx-2023-en-r&anchor=para_9&doctype=Standard
-URIDate 2023-03-23
| Name: |
ifrs-full_WagesAndSalaries |
| Namespace Prefix: |
ifrs-full_ |
| Data Type: |
xbrli:monetaryItemType |
| Balance Type: |
debit |
| Period Type: |
duration |
|
| X |
- DefinitionConsulting and director fees.
| Name: |
syta_ConsultingAndDirectorFees |
| Namespace Prefix: |
syta_ |
| Data Type: |
xbrli:monetaryItemType |
| Balance Type: |
debit |
| Period Type: |
duration |
|
| X |
- DefinitionOffice and general expense.
| Name: |
syta_OfficeAndGeneralExpense |
| Namespace Prefix: |
syta_ |
| Data Type: |
xbrli:monetaryItemType |
| Balance Type: |
debit |
| Period Type: |
duration |
|
| X |
- DefinitionRegulatory and filing fees.
| Name: |
syta_RegulatoryAndFilingFees |
| Namespace Prefix: |
syta_ |
| Data Type: |
xbrli:monetaryItemType |
| Balance Type: |
debit |
| Period Type: |
duration |
|
| X |
- References
+ Details
| Name: |
syta_ScheduleOfGeneralAndAdministrativeEexpensesAbstract |
| Namespace Prefix: |
syta_ |
| Data Type: |
xbrli:stringItemType |
| Balance Type: |
na |
| Period Type: |
duration |
|
v3.23.3
| X |
- DefinitionThe amount of non-current warrant liabilities. [Refer: Warrant liability] Reference 1: http://www.xbrl.org/2009/role/commonPracticeRef
-Name IAS
-Number 1
-IssueDate 2023-01-01
-Paragraph 55
-URI https://taxonomy.ifrs.org/xifrs-link?type=IAS&num=1&code=ifrs-tx-2023-en-r&anchor=para_55&doctype=Standard
-URIDate 2023-03-23
| Name: |
ifrs-full_NoncurrentWarrantLiability |
| Namespace Prefix: |
ifrs-full_ |
| Data Type: |
xbrli:monetaryItemType |
| Balance Type: |
credit |
| Period Type: |
instant |
|
| X |
- References
+ Details
| Name: |
syta_TransactionCostsAbstract |
| Namespace Prefix: |
syta_ |
| Data Type: |
xbrli:stringItemType |
| Balance Type: |
na |
| Period Type: |
duration |
|
v3.23.3
Financial Instruments (Details) - USD ($)
|
9 Months Ended |
Sep. 30, 2023 |
Sep. 30, 2022 |
| Financial Instruments (Details) [Line Items] |
|
|
| Overdue receivables |
$ 1,047,802
|
$ 1,028,000
|
| Active customers, description |
More than 60% (2022 – 22%) of
the Company’s customers have been active with the Company for over four years
|
|
| Allowance for doubtful accounts |
$ 1,047,802
|
$ 1,028,000
|
| Customer One [Member] |
|
|
| Financial Instruments (Details) [Line Items] |
|
|
| Revenue percentage |
19.00%
|
26.00%
|
| X |
- DefinitionThe percentage of the entity's revenue. [Refer: Revenue] Reference 1: http://www.xbrl.org/2009/role/commonPracticeRef
-Name IFRS
-Number 8
-IssueDate 2023-01-01
-Paragraph 34
-URI https://taxonomy.ifrs.org/xifrs-link?type=IFRS&num=8&code=ifrs-tx-2023-en-r&anchor=para_34&doctype=Standard
-URIDate 2023-03-23
| Name: |
ifrs-full_PercentageOfEntitysRevenue |
| Namespace Prefix: |
ifrs-full_ |
| Data Type: |
dtr-types:percentItemType |
| Balance Type: |
na |
| Period Type: |
duration |
|
| X |
- DefinitionAllowance for doubtful accounts.
| Name: |
syta_AllowanceForDoubtfulAccountsAmount |
| Namespace Prefix: |
syta_ |
| Data Type: |
xbrli:monetaryItemType |
| Balance Type: |
debit |
| Period Type: |
instant |
|
| X |
- References
+ Details
| Name: |
syta_FinancialInstrumentsDetailsLineItems |
| Namespace Prefix: |
syta_ |
| Data Type: |
xbrli:stringItemType |
| Balance Type: |
na |
| Period Type: |
duration |
|
| X |
- Details
| Name: |
ifrs-full_MajorCustomersAxis=syta_CustomerOneMember |
| Namespace Prefix: |
|
| Data Type: |
na |
| Balance Type: |
|
| Period Type: |
|
|
v3.23.3
Related Party Transactions (Details) - Schedule of Remuneration of Directors and Key Management Personnel - USD ($)
|
9 Months Ended |
Sep. 30, 2023 |
Sep. 30, 2022 |
| Payments to key management personnel: |
|
|
| Salaries, consulting and directors’ fees |
$ 1,007,410
|
$ 1,162,885
|
| Share-based payments |
593,146
|
1,824,713
|
| Total |
$ 1,600,556
|
$ 2,987,598
|
| X |
- DefinitionThe amount of compensation to key management personnel. [Refer: Key management personnel of entity or parent [member]] Reference 1: http://www.xbrl.org/2003/role/disclosureRef
-Name IAS
-Number 24
-IssueDate 2023-01-01
-Paragraph 17
-URI https://taxonomy.ifrs.org/xifrs-link?type=IAS&num=24&code=ifrs-tx-2023-en-r&anchor=para_17&doctype=Standard
-URIDate 2023-03-23
| Name: |
ifrs-full_KeyManagementPersonnelCompensation |
| Namespace Prefix: |
ifrs-full_ |
| Data Type: |
xbrli:monetaryItemType |
| Balance Type: |
debit |
| Period Type: |
duration |
|
| X |
- DefinitionThe amount of compensation to key management personnel in the form of post-employment benefits. [Refer: Key management personnel of entity or parent [member]] Reference 1: http://www.xbrl.org/2003/role/disclosureRef
-Name IAS
-Number 24
-IssueDate 2023-01-01
-Paragraph 17
-Subparagraph b
-URI https://taxonomy.ifrs.org/xifrs-link?type=IAS&num=24&code=ifrs-tx-2023-en-r&anchor=para_17_b&doctype=Standard
-URIDate 2023-03-23
| Name: |
ifrs-full_KeyManagementPersonnelCompensationPostemploymentBenefits |
| Namespace Prefix: |
ifrs-full_ |
| Data Type: |
xbrli:monetaryItemType |
| Balance Type: |
debit |
| Period Type: |
duration |
|
| X |
- DefinitionThe amount of compensation to key management personnel in the form of share-based payments. [Refer: Key management personnel of entity or parent [member]] Reference 1: http://www.xbrl.org/2003/role/disclosureRef
-Name IAS
-Number 24
-IssueDate 2023-01-01
-Paragraph 17
-Subparagraph e
-URI https://taxonomy.ifrs.org/xifrs-link?type=IAS&num=24&code=ifrs-tx-2023-en-r&anchor=para_17_e&doctype=Standard
-URIDate 2023-03-23
| Name: |
ifrs-full_KeyManagementPersonnelCompensationSharebasedPayment |
| Namespace Prefix: |
ifrs-full_ |
| Data Type: |
xbrli:monetaryItemType |
| Balance Type: |
debit |
| Period Type: |
duration |
|
| X |
- References
+ Details
| Name: |
syta_PaymentsToKeyManagementPersonnelAbstract |
| Namespace Prefix: |
syta_ |
| Data Type: |
xbrli:stringItemType |
| Balance Type: |
na |
| Period Type: |
duration |
|
v3.23.3
| X |
- DefinitionThe amount of expense relating to general and administrative activities of the entity. Reference 1: http://www.xbrl.org/2009/role/commonPracticeRef
-Name IAS
-Number 1
-IssueDate 2023-01-01
-Paragraph 112
-Subparagraph c
-URI https://taxonomy.ifrs.org/xifrs-link?type=IAS&num=1&code=ifrs-tx-2023-en-r&anchor=para_112_c&doctype=Standard
-URIDate 2023-03-23
| Name: |
ifrs-full_GeneralAndAdministrativeExpense |
| Namespace Prefix: |
ifrs-full_ |
| Data Type: |
xbrli:monetaryItemType |
| Balance Type: |
debit |
| Period Type: |
duration |
|
| X |
- DefinitionThe amount of expense relating to the marketing and selling of goods or services. Reference 1: http://www.xbrl.org/2009/role/commonPracticeRef
-Name IAS
-Number 1
-IssueDate 2023-01-01
-Paragraph 85
-URI https://taxonomy.ifrs.org/xifrs-link?type=IAS&num=1&code=ifrs-tx-2023-en-r&anchor=para_85&doctype=Standard
-URIDate 2023-03-23
| Name: |
ifrs-full_SalesAndMarketingExpense |
| Namespace Prefix: |
ifrs-full_ |
| Data Type: |
xbrli:monetaryItemType |
| Balance Type: |
debit |
| Period Type: |
duration |
|
v3.23.3
Segmented Information (Details) - Schedule of Geographical Segments, Segment Revenue Is Based on the Geographical Location of the Customers - USD ($)
$ in Thousands |
3 Months Ended |
9 Months Ended |
Sep. 30, 2023 |
Sep. 30, 2022 |
Sep. 30, 2023 |
Sep. 30, 2022 |
| Segmented Information (Details) - Schedule of Geographical Segments, Segment Revenue Is Based on the Geographical Location of the Customers [Line Items] |
|
|
|
|
| Revenue |
$ 1,842
|
$ 2,568
|
$ 6,356
|
$ 4,370
|
| USA [Member] |
|
|
|
|
| Segmented Information (Details) - Schedule of Geographical Segments, Segment Revenue Is Based on the Geographical Location of the Customers [Line Items] |
|
|
|
|
| Revenue |
1,276
|
1,648
|
4,478
|
2,368
|
| Canada [Member] |
|
|
|
|
| Segmented Information (Details) - Schedule of Geographical Segments, Segment Revenue Is Based on the Geographical Location of the Customers [Line Items] |
|
|
|
|
| Revenue |
304
|
495
|
1,036
|
1,114
|
| EMEA [Member] |
|
|
|
|
| Segmented Information (Details) - Schedule of Geographical Segments, Segment Revenue Is Based on the Geographical Location of the Customers [Line Items] |
|
|
|
|
| Revenue |
262
|
391
|
842
|
841
|
| Australia [Member] |
|
|
|
|
| Segmented Information (Details) - Schedule of Geographical Segments, Segment Revenue Is Based on the Geographical Location of the Customers [Line Items] |
|
|
|
|
| Revenue |
|
$ 34
|
|
$ 47
|
| X |
- Details
| Name: |
srt_StatementGeographicalAxis=country_US |
| Namespace Prefix: |
|
| Data Type: |
na |
| Balance Type: |
|
| Period Type: |
|
|
| X |
- Details
| Name: |
srt_StatementGeographicalAxis=country_CA |
| Namespace Prefix: |
|
| Data Type: |
na |
| Balance Type: |
|
| Period Type: |
|
|
| X |
- Details
| Name: |
srt_StatementGeographicalAxis=syta_EMEAOneMember |
| Namespace Prefix: |
|
| Data Type: |
na |
| Balance Type: |
|
| Period Type: |
|
|
| X |
- Details
| Name: |
srt_StatementGeographicalAxis=country_AU |
| Namespace Prefix: |
|
| Data Type: |
na |
| Balance Type: |
|
| Period Type: |
|
|
v3.23.3
| X |
- DefinitionThe total amount of equipment.
| Name: |
syta_EquipmentTotal |
| Namespace Prefix: |
syta_ |
| Data Type: |
xbrli:monetaryItemType |
| Balance Type: |
debit |
| Period Type: |
instant |
|
| X |
- DefinitionThe amount of identifiable non-monetary assets without physical substance. This amount does not include goodwill.
| Name: |
syta_IntangiblesTotal |
| Namespace Prefix: |
syta_ |
| Data Type: |
xbrli:monetaryItemType |
| Balance Type: |
debit |
| Period Type: |
instant |
|
| X |
- DefinitionAmount of long term receivables.
| Name: |
syta_LongtermReceivableTotal |
| Namespace Prefix: |
syta_ |
| Data Type: |
xbrli:monetaryItemType |
| Balance Type: |
debit |
| Period Type: |
instant |
|
| X |
- DefinitionAmount from right of use assets.
| Name: |
syta_RightOfUseAssetTotal |
| Namespace Prefix: |
syta_ |
| Data Type: |
xbrli:monetaryItemType |
| Balance Type: |
debit |
| Period Type: |
instant |
|
| X |
- Details
| Name: |
srt_StatementGeographicalAxis=country_CA |
| Namespace Prefix: |
|
| Data Type: |
na |
| Balance Type: |
|
| Period Type: |
|
|
| X |
- Details
| Name: |
srt_StatementGeographicalAxis=syta_EuropeTheMiddleEastAndAfricaMember |
| Namespace Prefix: |
|
| Data Type: |
na |
| Balance Type: |
|
| Period Type: |
|
|
v3.23.3
Segmented Information (Details) - Schedule of Product Information - USD ($)
$ in Thousands |
3 Months Ended |
9 Months Ended |
Sep. 30, 2023 |
Sep. 30, 2022 |
Sep. 30, 2023 |
Sep. 30, 2022 |
| Segmented Information (Details) - Schedule of Product Information [Line Items] |
|
|
|
|
| Revenue by product |
$ 1,842
|
$ 2,568
|
$ 6,356
|
$ 4,370
|
| Cellular boosters and related accessories [Member] |
|
|
|
|
| Segmented Information (Details) - Schedule of Product Information [Line Items] |
|
|
|
|
| Revenue by product |
778
|
717
|
1,800
|
1,882
|
| Rugged devices and related accessories [Member] |
|
|
|
|
| Segmented Information (Details) - Schedule of Product Information [Line Items] |
|
|
|
|
| Revenue by product |
$ 1,064
|
$ 1,851
|
$ 4,556
|
$ 2,488
|
v3.23.3
| X |
- References
+ Details
| Name: |
ifrs-full_StatementOfCashFlowsAbstract |
| Namespace Prefix: |
ifrs-full_ |
| Data Type: |
xbrli:stringItemType |
| Balance Type: |
na |
| Period Type: |
duration |
|
v3.23.3
Supplemental Information with Respect to Cash Flows (Details) - Schedule of Supplemental Information with Respect to Cash Flows - USD ($)
|
9 Months Ended |
Sep. 30, 2023 |
Sep. 30, 2022 |
| Change in non-cash working capital: |
|
|
| Trade and other receivables |
$ (631,278)
|
$ (326,749)
|
| Prepaids |
(54,974)
|
(390,022)
|
| Inventory |
1,596,000
|
(2,903,506)
|
| Advances to suppliers |
(1,385,957)
|
(638,831)
|
| Accounts payable and accrued liabilities |
(489,431)
|
(528,817)
|
| Deferred revenue |
(149,600)
|
|
| Total |
$ (1,115,240)
|
$ (4,787,926)
|
| X |
- DefinitionAdjustments for decrease (increase) in inventories to reconcile profit (loss) to net cash flow from (used in) operating activities. [Refer: Inventories; Profit (loss)] Reference 1: http://www.xbrl.org/2009/role/commonPracticeRef
-Name IAS
-Number 7
-IssueDate 2023-01-01
-Paragraph 20
-Subparagraph a
-URI https://taxonomy.ifrs.org/xifrs-link?type=IAS&num=7&code=ifrs-tx-2023-en-r&anchor=para_20_a&doctype=Standard
-URIDate 2023-03-23
| Name: |
ifrs-full_AdjustmentsForDecreaseIncreaseInInventories |
| Namespace Prefix: |
ifrs-full_ |
| Data Type: |
xbrli:monetaryItemType |
| Balance Type: |
debit |
| Period Type: |
duration |
|
| X |
- DefinitionAdjustments for the decrease (increase) in prepaid expenses to reconcile profit (loss) to net cash flow from (used in) operating activities. [Refer: Current prepaid expenses; Profit (loss)] Reference 1: http://www.xbrl.org/2009/role/commonPracticeRef
-Name IAS
-Number 7
-IssueDate 2023-01-01
-Paragraph 20
-URI https://taxonomy.ifrs.org/xifrs-link?type=IAS&num=7&code=ifrs-tx-2023-en-r&anchor=para_20&doctype=Standard
-URIDate 2023-03-23
| Name: |
ifrs-full_AdjustmentsForDecreaseIncreaseInPrepaidExpenses |
| Namespace Prefix: |
ifrs-full_ |
| Data Type: |
xbrli:monetaryItemType |
| Balance Type: |
debit |
| Period Type: |
duration |
|
| X |
- DefinitionAdjustments for increase (decrease) in trade and other payables to reconcile profit (loss) to net cash flow from (used in) operating activities. [Refer: Trade and other payables; Profit (loss)] Reference 1: http://www.xbrl.org/2009/role/commonPracticeRef
-Name IAS
-Number 7
-IssueDate 2023-01-01
-Paragraph 20
-URI https://taxonomy.ifrs.org/xifrs-link?type=IAS&num=7&code=ifrs-tx-2023-en-r&anchor=para_20&doctype=Standard
-URIDate 2023-03-23
| Name: |
ifrs-full_AdjustmentsForIncreaseDecreaseInTradeAndOtherPayables |
| Namespace Prefix: |
ifrs-full_ |
| Data Type: |
xbrli:monetaryItemType |
| Balance Type: |
debit |
| Period Type: |
duration |
|
| X |
- DefinitionThe amount of deferred tax liabilities or assets. [Refer: Deferred tax liabilities; Deferred tax assets] Reference 1: http://www.xbrl.org/2003/role/disclosureRef
-Name IAS
-Number 12
-IssueDate 2023-01-01
-Paragraph 81
-Subparagraph g
-Clause i
-URI https://taxonomy.ifrs.org/xifrs-link?type=IAS&num=12&code=ifrs-tx-2023-en-r&anchor=para_81_g_i&doctype=Standard
-URIDate 2023-03-23
| Name: |
ifrs-full_DeferredTaxLiabilityAsset |
| Namespace Prefix: |
ifrs-full_ |
| Data Type: |
xbrli:monetaryItemType |
| Balance Type: |
credit |
| Period Type: |
instant |
|
| X |
- Definition
+ References
+ Details
| Name: |
syta_AdvancesToSuppliersNonCurrents |
| Namespace Prefix: |
syta_ |
| Data Type: |
xbrli:monetaryItemType |
| Balance Type: |
debit |
| Period Type: |
instant |
|
| X |
- References
+ Details
| Name: |
syta_ChangeInNonCashWorkingCapitalAbstract |
| Namespace Prefix: |
syta_ |
| Data Type: |
xbrli:stringItemType |
| Balance Type: |
na |
| Period Type: |
duration |
|
| X |
- DefinitionTrade and other receivables.
| Name: |
syta_TradeAndOtherReceivablesNonCurrent |
| Namespace Prefix: |
syta_ |
| Data Type: |
xbrli:monetaryItemType |
| Balance Type: |
debit |
| Period Type: |
instant |
|
v3.23.3
Subsequent Events (Details) - USD ($)
|
|
|
|
9 Months Ended |
|
|
|
|
Nov. 01, 2023 |
Oct. 12, 2022 |
Jan. 11, 2022 |
Sep. 30, 2023 |
Oct. 03, 2023 |
Jul. 13, 2023 |
Jun. 30, 2023 |
Jun. 28, 2023 |
| Subsequent Events [Line Items] |
|
|
|
|
|
|
|
|
| Cashless warrants |
|
|
|
1,870
|
|
|
|
|
| Company issued per share (in Dollars per share) |
|
|
|
$ 0.65
|
|
|
|
$ 4.5
|
| Prefunded warrants |
|
15,900
|
14,800
|
530,000
|
|
|
|
|
| Prefunded warrants per share (in Dollars per share) |
|
|
|
$ 0.64
|
|
|
|
|
| Prefunded warrant exercise price (in Dollars per share) |
|
|
|
$ 0.01
|
|
|
|
|
| Gross proceeds (in Dollars) |
|
|
|
$ 1,554,700
|
|
|
|
|
| Investor exercised shares |
|
|
|
|
|
|
210,319
|
500,000
|
| Non-Adjusting Events After Reporting Period [Member] |
|
|
|
|
|
|
|
|
| Subsequent Events [Line Items] |
|
|
|
|
|
|
|
|
| Company issued per share (in Dollars per share) |
|
|
|
|
|
$ 4.5
|
|
|
| Prefunded warrants |
180,000
|
|
|
|
|
|
|
|
| Converted common stock shares |
177,313
|
|
|
|
|
|
|
|
| Investor exercised shares |
|
|
|
|
|
514,500
|
|
|
| Non-Adjusting Events After Reporting Period [Member] | RSU’s [Member] |
|
|
|
|
|
|
|
|
| Subsequent Events [Line Items] |
|
|
|
|
|
|
|
|
| Investor exercised shares |
|
|
|
|
900
|
|
|
|
| Non-Adjusting Events After Reporting Period [Member] | Restricted share units [member] |
|
|
|
|
|
|
|
|
| Subsequent Events [Line Items] |
|
|
|
|
|
|
|
|
| Investor exercised shares |
|
|
|
|
900
|
|
|
|
| X |
- DefinitionThe number of shares issued by the entity. Reference 1: http://www.xbrl.org/2009/role/commonPracticeRef
-Name IAS
-Number 1
-IssueDate 2023-01-01
-Paragraph 106
-Subparagraph d
-URI https://taxonomy.ifrs.org/xifrs-link?type=IAS&num=1&code=ifrs-tx-2023-en-r&anchor=para_106_d&doctype=Standard
-URIDate 2023-03-23
| Name: |
ifrs-full_NumberOfSharesIssued |
| Namespace Prefix: |
ifrs-full_ |
| Data Type: |
xbrli:sharesItemType |
| Balance Type: |
na |
| Period Type: |
instant |
|
| X |
- DefinitionThe amount of cashless remaining warrant unexercised.
| Name: |
syta_CashlessRemainingWarrantUnexercised |
| Namespace Prefix: |
syta_ |
| Data Type: |
xbrli:sharesItemType |
| Balance Type: |
na |
| Period Type: |
duration |
|
| X |
- Definitionhe amount of company issued per share.
| Name: |
syta_CompanyIssuedPerShare |
| Namespace Prefix: |
syta_ |
| Data Type: |
dtr:perShareItemType |
| Balance Type: |
na |
| Period Type: |
instant |
|
| X |
- DefinitionConverted common stock shares.
| Name: |
syta_ConvertedCommonStockShares |
| Namespace Prefix: |
syta_ |
| Data Type: |
xbrli:sharesItemType |
| Balance Type: |
na |
| Period Type: |
duration |
|
| X |
- DefinitionPrefunded warrant exercise price.
| Name: |
syta_PrefundedWarrantExercisePrice |
| Namespace Prefix: |
syta_ |
| Data Type: |
dtr:perShareItemType |
| Balance Type: |
na |
| Period Type: |
instant |
|
| X |
- References
+ Details
| Name: |
syta_PrefundedWarrants |
| Namespace Prefix: |
syta_ |
| Data Type: |
xbrli:sharesItemType |
| Balance Type: |
na |
| Period Type: |
duration |
|
| X |
- DefinitionPrefunded warrants per share.
| Name: |
syta_PrefundedWarrantsPerShare |
| Namespace Prefix: |
syta_ |
| Data Type: |
dtr:perShareItemType |
| Balance Type: |
na |
| Period Type: |
duration |
|
| X |
- References
+ Details
| Name: |
syta_SubsequentEventsDetailsLineItems |
| Namespace Prefix: |
syta_ |
| Data Type: |
xbrli:stringItemType |
| Balance Type: |
na |
| Period Type: |
duration |
|
| X |
- Details
| Name: |
ifrs-full_NonadjustingEventsAfterReportingPeriodAxis=syta_NonAdjustingEventMember |
| Namespace Prefix: |
|
| Data Type: |
na |
| Balance Type: |
|
| Period Type: |
|
|
| X |
- Details
| Name: |
ifrs-full_ClassesOfAssetsAxis=ifrs-full_RightofuseAssetsMember |
| Namespace Prefix: |
|
| Data Type: |
na |
| Balance Type: |
|
| Period Type: |
|
|
| X |
- Details
| Name: |
ifrs-full_ClassesOfShareCapitalAxis=ifrs-full_RestrictedShareUnitsMember |
| Namespace Prefix: |
|
| Data Type: |
na |
| Balance Type: |
|
| Period Type: |
|
|
Siyata Mobile (NASDAQ:SYTA)
Historical Stock Chart
From Mar 2024 to Apr 2024

Siyata Mobile (NASDAQ:SYTA)
Historical Stock Chart
From Apr 2023 to Apr 2024
