false
0000714256
TX
0000714256
2023-11-13
2023-11-13
iso4217:USD
xbrli:shares
iso4217:USD
xbrli:shares
UNITED
STATES
SECURITIES
AND EXCHANGE COMMISSION
Washington,
D.C. 20549
FORM
8-K
CURRENT
REPORT
Pursuant
to Section 13 or 15(d) of the
Securities
Exchange Act of 1934
Date
of Report (Date of earliest event reported): November
13, 2023
| SANARA
MEDTECH INC. |
| (Exact
name of registrant as specified in its charter) |
| Texas |
|
001-39678 |
|
59-2219994 |
| (State
or other jurisdiction |
|
(Commission
|
|
(IRS
Employer |
| of
incorporation) |
|
File
Number) |
|
Identification
No.) |
1200
Summit Avenue,
Suite
414
Fort
Worth, Texas |
|
76102 |
| (Address
of principal executive offices) |
|
(Zip
Code) |
Registrant’s
telephone number, including area code: (817)
529-2300
(Former
name or former address, if changed since last report)
Not
Applicable
Check
the appropriate box below if the Form 8-K filing is intended to simultaneously satisfy the filing obligation of the registrant under
any of the following provisions (see General Instruction A.2. below):
| |
☐ |
Written
communications pursuant to Rule 425 under the Securities Act (17 CFR 230.425)
|
| |
|
|
| |
☐ |
Soliciting
material pursuant to Rule 14a-12 under the Exchange Act (17 CFR 240.14a-12)
|
| |
|
|
| |
☐ |
Pre-commencement
communications pursuant to Rule 14d-2(b) under the Exchange Act (17 CFR 240.14d-2(b))
|
| |
|
|
| |
☐ |
Pre-commencement
communications pursuant to Rule 13e-4(c) under the Exchange Act (17 CFR 240.13e-4(c)) |
Securities
registered pursuant to Section 12(b) of the Act:
| Title
of each class |
|
Trading
Symbol(s) |
|
Name
of each exchange on which registered |
| Common
Stock, $0.001 par value |
|
SMTI |
|
The
Nasdaq Capital
Market |
Indicate
by check mark whether the registrant is an emerging growth company as defined in Rule 405 of the Securities Act of 1933 (§230.405
of this chapter) or Rule 12b-2 of the Securities Exchange Act of 1934 (§240.12b-2 of this chapter).
Emerging
growth company ☐
If
an emerging growth company, indicate by check mark if the registrant has elected not to use the extended transition period for complying
with any new or revised financial accounting standards provided pursuant to Section 13(a) of the Exchange Act. ☐
| Item
2.02 | Results
of Operations and Financial Condition. |
On
November 13, 2023, Sanara MedTech Inc. (the “Company”) issued a press release announcing its financial results for the quarter
ended September 30, 2023. A copy of the Company’s press release is furnished as Exhibit 99.1 to this Current Report on Form 8-K
and is incorporated by reference herein.
In
addition, the Company is furnishing a copy of an earnings presentation (the “Presentation”) that the Company intends to use,
in whole or in part, in one or more meetings with investors or analysts, including in a webcast on November 14, 2023 at 9:00 a.m. (Eastern
Time). A copy of the Presentation is furnished as Exhibit 99.2 to this Current Report on Form 8-K and is incorporated by reference herein.
The
information in this Current Report on Form 8-K, including Exhibits 99.1 and 99.2 furnished hereto, shall not be deemed “filed”
for purposes of Section 18 of the Securities Exchange Act of 1934, as amended (the “Exchange Act”), or otherwise subject
to the liabilities of that section, nor shall it be deemed incorporated by reference in any filing under the Securities Act of 1933,
as amended, or the Exchange Act, except as expressly set forth in such filing.
| Item
9.01 | Financial
Statements and Exhibits. |
(d)
Exhibits
SIGNATURES
Pursuant
to the requirements of the Securities Exchange Act of 1934, the registrant has duly caused this report to be signed on its behalf by
the undersigned hereunto duly authorized.
| Date: |
November
13, 2023 |
|
|
| |
|
|
|
| |
|
Sanara
MedTech Inc. |
| |
|
|
|
| |
|
By: |
/s/
Michael D. McNeil |
| |
|
Name: |
Michael
D. McNeil |
| |
|
Title: |
Chief
Financial Officer |
Exhibit
99.1

Sanara
MedTech Inc. Announces Third Quarter 2023 Results
FORT
WORTH, TX / GlobeNewswire / November 13, 2023 / Sanara MedTech Inc. Based in Fort Worth, Texas, Sanara MedTech Inc. (“Sanara,”
the “Company,” “we,” “our” or “us”) (NASDAQ: SMTI), a medical technology company focused
on developing and commercializing transformative technologies to improve clinical outcomes and reduce healthcare expenditures in the
surgical, chronic wound and skincare markets, announced today its strategic, operational and financial results for the quarter ended
September 30, 2023.
Zach
Fleming, Sanara’s CEO stated, “Our third quarter performance included another record sales quarter as well as a narrowing
net loss and positive Adjusted EBITDA. In addition, we completed the acquisition of certain assets related to our collagen business,
which we believe is critical to our efforts to develop next generation collagen products while also materially adding to our bottom line
by eliminating the royalties we paid on CellerateRX® Surgical Powder and Gel (“CellerateRX”) and HYCOL®
Hydrolyzed Collagen (“HYCOL”). After quarter end, we had our first sales of both ALLOCYTE® Plus Advanced
Viable Bone Matrix (“ALLOCYTE Plus”) and BIASURGE™ Advanced Surgical Solution (“BIASURGE”). We believe
these two products will be important to our future growth plans while helping diversify our revenue mix and providing patients and doctors
with options that can improve outcomes while reducing healthcare expenditures.”
Third
Quarter 2023 Strategic and Operational Highlights (Unaudited)
| |
● |
The
Company generated net revenue of $16.0 million for the three months ended September 30, 2023, an eighth consecutive record sales
quarter. |
| |
|
|
| |
● |
The
Company’s loss before income taxes for the three months ended September 30, 2023 was $1.1 million compared to a loss before
income taxes of $3.2 million for the three months ended September 30, 2022. For the three months ended September 30, 2023, the Company
had a net loss of $1.1 million, compared to a net loss of $1.5 million for the three months ended September 30, 2022. The Company
generated Adjusted EBITDA* of $0.3 million for the three months ended September 30, 2023 compared to negative Adjusted EBITDA of
$1.6 million for the three months ended September 30, 2022. |
| |
|
|
| |
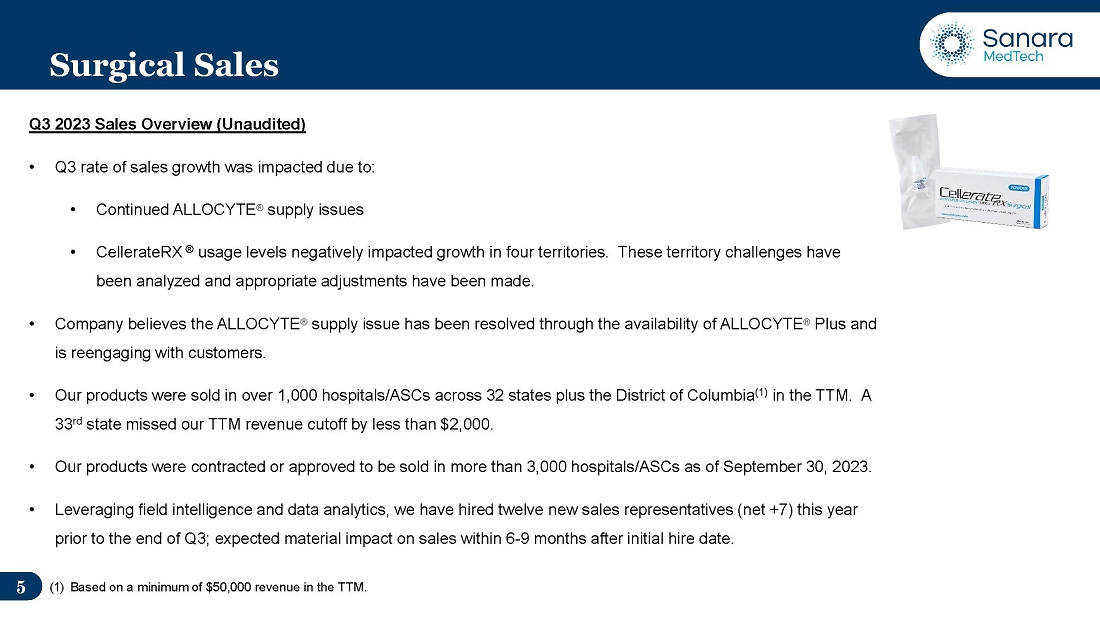
● |
During
the trailing twelve-month period, the Company’s products were sold in over 1,000 facilities across 32 states plus the District
of Columbia. The Company’s products were contracted or approved to be sold in more than 3,000 hospitals/ambulatory surgery
centers as of September 30, 2023. |
| |
|
|
| |
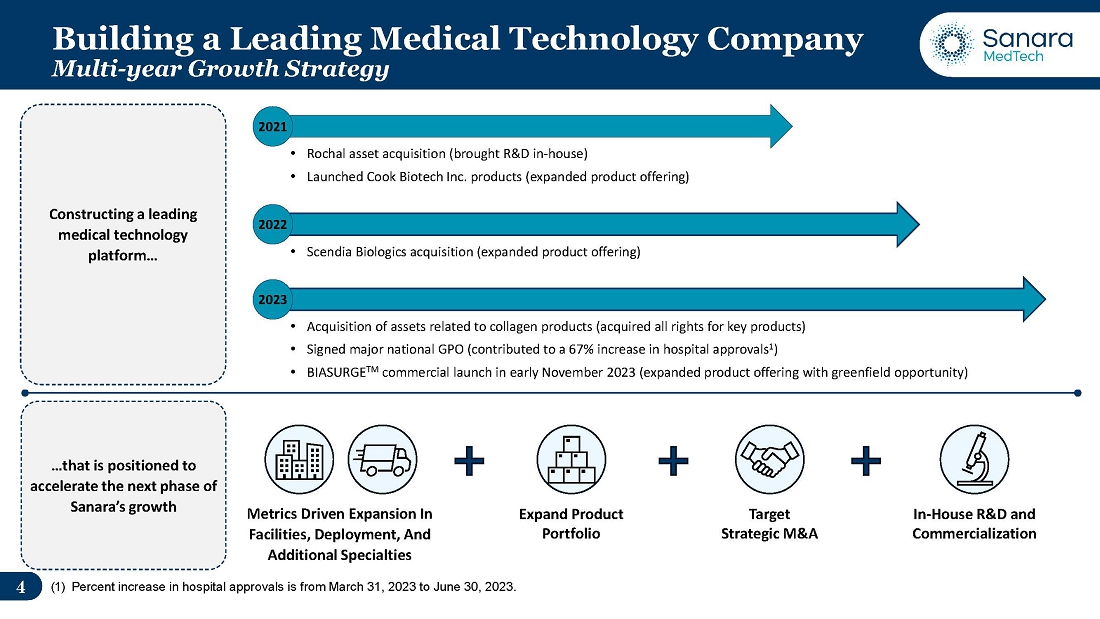
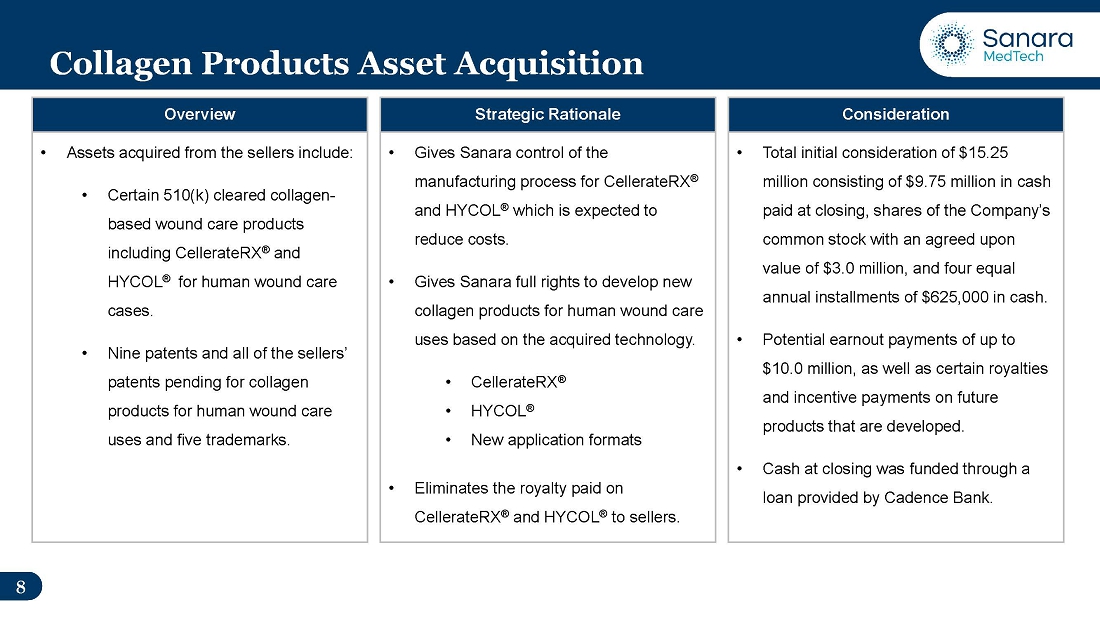
● |
On
August 2, 2023, the Company announced the acquisition of certain assets related to its collagen products business. The assets acquired
included, among others: |
| |
— |
All
rights and ownership (for human wound care uses) for certain 510(k) cleared collagen-based wound care products, including CellerateRX
and HYCOL. |
| |
|
|
| |
— |
All
patents, patents pending, trademarks and regulatory approvals related to collagen human wound care products owned by the sellers.
This includes nine patents and all of the sellers’ patents pending for collagen products for human wound care uses and five
trademarks. |
| |
● |
The
Company hired twelve new sales representatives in the nine months ended September 30, 2023. These representatives are expected to
help the Company increase facility penetration and reach additional specialties. The Company also continues to build out its corporate
infrastructure to support future growth. |
| |
|
|
| |
● |
Subsequent
to the end of the quarter, the Company completed its first sale of ALLOCYTE Plus, a human cell and tissue-based product. First sales
of Allocyte Plus occurred in early October 2023. This product is processed by an alternative supplier with in-house processing capabilities
affording greater control of product supply. |
| |
|
|
| |
● |
Subsequent
to the end of the quarter, the Company launched BIASURGE. Prior to launch, BIASURGE was added to 41 existing facility contracts.
First sales of BIASURGE occurred in early November 2023. The Company believes this product could be used in any surgery where Sanara
products are currently used. |
Sales
Analysis
CellerateRX
revenues continued to grow, however the rate of quarter-over-quarter growth slowed due to unique in-market challenges. The Company is
leveraging field intelligence and data analytics to implement appropriate adjustments to sales force deployment and facility penetration.
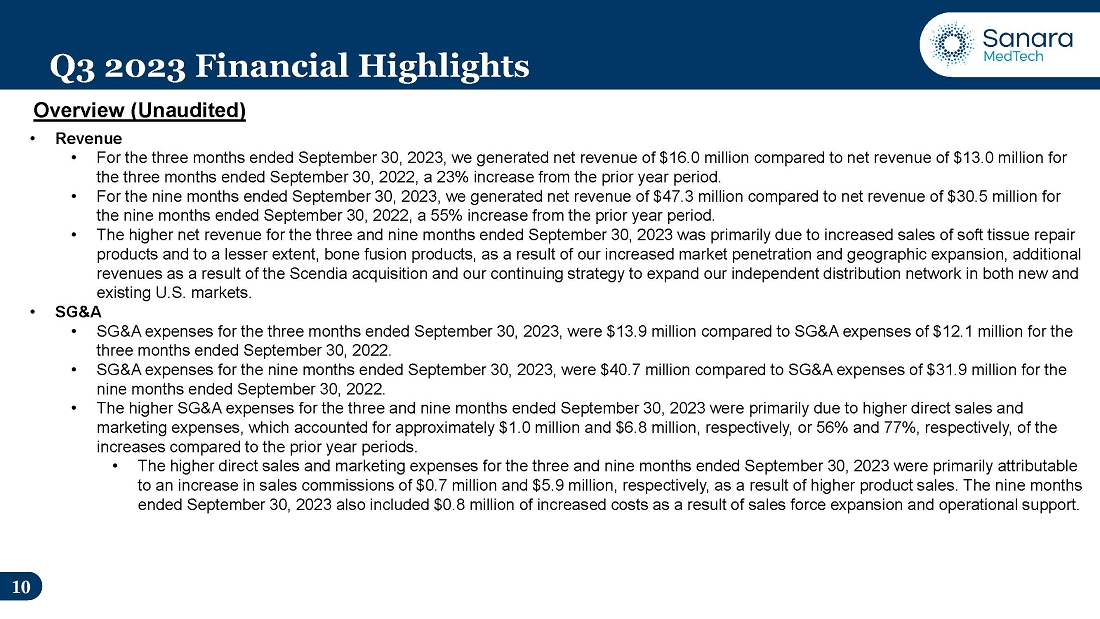
For the three months ended September 30, 2023, the Company
generated net revenue of $16.0 million compared to net revenue of $13.0 million for the three months ended September 30, 2022, a 23%
increase from the prior year period. For the nine months ended September 30, 2023, the Company generated net revenue of $47.3 million
compared to net revenue of $30.5 million for the nine months ended September 30, 2022, a 55% increase from the prior year period. The
higher net revenue for the three and nine months ended September 30, 2023 was primarily due to increased sales as a result of the Company’s
increased market penetration and geographic expansion, additional revenues as a result of the Scendia acquisition and the Company’s
continuing strategy to expand its independent distribution network in both new and existing U.S. markets. The Company’s sales growth
continued to be negatively impacted by supply issues related to its ALLOCYTE® Advanced Cellular Bone Matrix product in
the third quarter of 2023. However, subsequent to the end of the quarter, the Company brought on an alternative supplier and expanded
the ALLOCYTE® product line with the release of ALLOCYTE Plus. Sanara currently has
a sufficient supply to meet currently expected demand and believes it has measures in place to be able to regularly stock the product
in the future.
Earnings
Analysis
The
Company had a loss before income taxes of $1.1 million for the three months ended September 30, 2023, compared to a loss before income
taxes of $3.2 million for the three months ended September 30, 2022. For the nine months ended September 30, 2023, the Company had a
loss before income taxes of $4.2 million, compared to a loss before income taxes of $9.8 million for the nine months ended September
30, 2022. The lower loss for the three and nine months ended September 30, 2023 was due to operating expenses increasing at a slower
rate than net sales in addition to the benefit recorded as a result of the change in fair value of earnout liabilities. For the three
months ended September 30, 2023, the Company had a net loss of $1.1 million, compared to a net loss of $1.5 million for the three months
ended September 30, 2022. For the nine months ended September 30, 2023, the Company had a net loss of $4.2 million, compared to a net
loss of $3.9 million for the nine months ended September 30, 2022.
*
Adjusted EBITDA is a non-GAAP financial measure. See the discussion below under the heading “Use of Non-GAAP Financial Measures”
and the reconciliations at the end of this release for additional information.
Use
of Non-GAAP Financial Measures
To
supplement the Company’s financial information presented in accordance with generally accepted accounting principles in the United
States (“GAAP”), we present certain non-GAAP financial measures in this press release and on the related teleconference call,
including Adjusted EBITDA. The Company’s management uses these non-GAAP financial measures, both internally and externally, to
assess and communicate the financial performance of the Company. The Company defines Adjusted EBITDA as net loss excluding interest for
term loan, debt issuance cost amortization, accretion of finance liabilities, provision/benefit for income taxes, depreciation and amortization,
non-cash share-based compensation expense, change in fair value of earnout liabilities, and gains/losses from the disposal of property
and equipment. The Company’s believes Adjusted EBITDA is useful to investors because it facilitates comparisons of its core business
operations across periods on a consistent basis. Accordingly, the Company adjusts for items such as change in fair value of earnout liabilities
when calculating Adjusted EBITDA because the Company believes that it is not related to the Company’s core business operations.
The
Company’s non-GAAP financial measures are not in accordance with, nor an alternative for, measures conforming to GAAP and may be
different from non-GAAP financial measures used by other companies. In addition, these non-GAAP financial measures are not based on any
comprehensive set of accounting rules or principles. The Company continues to provide all information required by GAAP, but it believes
that evaluating its ongoing operating results may not be as useful if an investor or other user is limited to reviewing only GAAP financial
measures. The Company does not, nor does it suggest that investors should, consider these non-GAAP financial measures in isolation from,
or as a substitute for, financial information prepared in accordance with GAAP. Material limitations associated with the use of such
measures include that they do not reflect all costs included in operating expenses and may not be comparable with similarly named financial
measures of other companies. Furthermore, these non-GAAP financial measures are based on subjective determinations of management regarding
the nature and classification of events and circumstances. The Company presents these non-GAAP financial measures to provide investors
with information to evaluate the Company’s operating results in a manner similar to how management evaluates business performance.
To compensate for any limitations in such non-GAAP financial measures, management believes that it is useful in understanding and analyzing
the results of the business to review both GAAP information and the related non-GAAP financial measures. Whenever the Company uses a
non-GAAP financial measure, it provides a reconciliation of the non-GAAP financial measure to the most directly comparable GAAP financial
measure. Investors are encouraged to review and consider these reconciliations.
Conference
Call
Sanara
will host a conference call on Tuesday, November 14, 2023, at 9:00 a.m. Eastern Time. The toll-free number to call for this teleconference
is 888-506-0062 (international callers: 973-528-0011) and the access code is 780032. A telephonic replay of the conference call will
be available through Tuesday, November 28, 2023, by dialing 877-481-4010 (international callers: 919-882-2331) and entering the replay
passcode: 49390.
A
live webcast of Sanara’s conference call will be available under the Investor Relations section of the Company’s website,
www.SanaraMedTech.com. A one-year online replay will be available after the conclusion of the live broadcast.
About
Sanara MedTech Inc.
With
a focus on improving patient outcomes through evidence-based healing solutions, Sanara MedTech Inc. markets, distributes and develops
surgical, wound and skincare products for use by physicians and clinicians in hospitals, clinics and all post-acute care settings and
offers wound care and dermatology virtual consultation services via telemedicine. Sanara’s products are primarily sold in the North
American advanced wound care and surgical tissue repair markets. Sanara markets and distributes CellerateRX® Surgical
Activated Collagen®, FORTIFY TRG® Tissue Repair Graft and FORTIFY FLOWABLE® Extracellular
Matrix as well as a portfolio of advanced biologic products focusing on ACTIGENTM Verified Inductive Bone Matrix, ALLOCYTE®
Plus Advanced Viable Bone Matrix, BiFORM® Bioactive Moldable Matrix, TEXAGEN® Amniotic Membrane Allograft,
and BIASURGE™ Advanced Surgical Solution to the surgical market. In addition, the following products are sold in the wound care
market: BIAKŌS® Antimicrobial Skin and Wound Cleanser, BIAKŌS™ Antimicrobial Wound Gel, BIAKŌS®
Antimicrobial Skin and Wound Irrigation Solution and HYCOL® Hydrolyzed Collagen. Sanara’s pipeline also contains
potentially transformative product candidates for mitigation of opportunistic pathogens and biofilm, wound re-epithelialization and closure,
necrotic tissue debridement and cell compatible substrates. The Company believes it has the ability to drive its pipeline from concept
to preclinical and clinical development while meeting quality and regulatory requirements. Sanara is constantly seeking long-term strategic
partnerships with a focus on products that improve outcomes at a lower overall cost. In addition, Sanara is actively seeking to expand
within its six focus areas of wound and skin care for the acute, post-acute, and surgical markets. The focus areas are debridement, biofilm
removal, hydrolyzed collagen, advanced biologics, negative pressure wound therapy products and the oxygen delivery system segment of
the wound and skincare markets.
Information
about Forward-Looking Statements
The
statements in this press release that do not constitute historical facts are “forward-looking statements,” within the meaning
of and subject to the safe harbor created by the Private Securities Litigation Reform Act of 1995. These statements may be identified
by terms such as “aims,” “anticipates,” “believes,” “contemplates,” “continue,”
“could,” “estimates,” “expect,” “forecast,” “guidance,” “intend,”
“may,” “plan,” “possible,” “potential,” “predicts,” “preliminary,”
“projects,” “seeks,” “should,” “targets,” “will” or “would,”
or the negatives of these terms, variations of these terms or other similar expressions. These forward-looking statements include, among
others, statements regarding the potential benefits created by the acquisition of certain assets related to the Company’s collagen
products business, the anticipated impact of such acquisition on the Company’s business and future financial and operating results,
the Company’s ability to develop and commercialize the new collagen-based products currently under development, including the manufacturing,
distribution, marketing and sale of such products, the Company’s ability to maintain or replace the manufacturing and distribution
process of the sellers in the acquisition, including relationships with vendors, the development of new products, the timing of commercialization
of our products, the regulatory approval process and expansion of the Company’s business in telehealth and wound care. These items
involve risks, contingencies and uncertainties such as the extent of product demand, market and customer acceptance, the effect of economic
conditions, competition, pricing, uncertainties associated with the development and process for obtaining regulatory approval for new
products, the ability to consummate and integrate acquisitions, and other risks, contingencies and uncertainties detailed in the Company’s
SEC filings, which could cause the Company’s actual operating results, performance or business plans or prospects to differ materially
from those expressed in, or implied by these statements.
All
forward-looking statements speak only as of the date on which they are made, and the Company undertakes no obligation to revise any of
these statements to reflect the future circumstances or the occurrence of unanticipated events, except as required by applicable securities
laws.
Investor
Contact:
Callon
Nichols, Director of Investor Relations
713-826-0524
CNichols@sanaramedtech.com
SOURCE:
Sanara MedTech Inc.
SANARA
MEDTECH INC. AND SUBSIDIARIES
CONSOLIDATED
BALANCE SHEETS
| | |
(Unaudited) | | |
| |
| | |
September 30, 2023 | | |
December 31, 2022 | |
| Assets | |
| | | |
| | |
| Current assets | |
| | | |
| | |
| Cash | |
$ | 6,235,912 | | |
$ | 8,958,995 | |
| Accounts receivable, net | |
| 7,436,295 | | |
| 6,805,761 | |
| Accounts receivable – related party | |
| 11,032 | | |
| 98,548 | |
| Royalty receivable | |
| 49,344 | | |
| 99,594 | |
| Inventory, net | |
| 5,021,030 | | |
| 3,549,000 | |
| Prepaid and other assets | |
| 621,690 | | |
| 1,104,611 | |
| Total current assets | |
| 19,375,303 | | |
| 20,616,509 | |
| | |
| | | |
| | |
| Long-term assets | |
| | | |
| | |
| Property and equipment, net | |
| 1,327,056 | | |
| 1,416,436 | |
| Right of use assets – operating leases | |
| 2,094,188 | | |
| 806,402 | |
| Goodwill | |
| 3,601,781 | | |
| 3,601,781 | |
| Intangible assets, net | |
| 45,991,466 | | |
| 31,509,980 | |
| Investment in equity securities | |
| 3,084,278 | | |
| 3,084,278 | |
| Total long-term assets | |
| 56,098,769 | | |
| 40,418,877 | |
| | |
| | | |
| | |
| Total assets | |
$ | 75,474,072 | | |
$ | 61,035,386 | |
| | |
| | | |
| | |
| Liabilities and shareholders’ equity | |
| | | |
| | |
| Current liabilities | |
| | | |
| | |
| Accounts payable | |
$ | 1,939,887 | | |
$ | 1,392,701 | |
| Accounts payable – related parties | |
| 64,747 | | |
| 34,036 | |
| Accrued royalties and expenses | |
| 3,583,439 | | |
| 2,144,475 | |
| Accrued bonuses and commissions | |
| 6,084,654 | | |
| 7,758,284 | |
| Earnout liabilities – current | |
| 1,000,000 | | |
| 1,162,880 | |
| Operating lease liabilities – current | |
| 322,206 | | |
| 313,933 | |
| Current portion of debt | |
| 232,143 | | |
| - | |
| Total current liabilities | |
| 13,227,076 | | |
| 12,806,309 | |
| | |
| | | |
| | |
| Long-term liabilities | |
| | | |
| | |
| Earnout liabilities – long-term | |
| 4,871,986 | | |
| 6,003,811 | |
| Operating lease liabilities – long-term | |
| 1,846,293 | | |
| 505,291 | |
| Long-term debt, net of current portion | |
| 9,458,254 | | |
| - | |
| Other long-term liabilities | |
| 1,972,673 | | |
| - | |
| Total long-term liabilities | |
| 18,149,206 | | |
| 6,509,102 | |
| | |
| | | |
| | |
| Total liabilities | |
| 31,376,282 | | |
| 19,315,411 | |
| | |
| | | |
| | |
| Commitments and contingencies | |
| | | |
| | |
| | |
| | | |
| | |
| Shareholders’ equity | |
| | | |
| | |
| Common Stock: $0.001 par value, 20,000,000 shares authorized; 8,540,226 issued and outstanding as of September 30, 2023 and 8,299,957 issued and outstanding as of December 31, 2022 | |
| 8,540 | | |
| 8,300 | |
| Additional paid-in capital | |
| 72,107,881 | | |
| 65,213,987 | |
| Accumulated deficit | |
| (27,799,621 | ) | |
| (23,394,757 | ) |
| Total Sanara MedTech shareholders’ equity | |
| 44,316,800 | | |
| 41,827,530 | |
| Equity attributable to noncontrolling interest | |
| (219,010 | ) | |
| (107,555 | ) |
| Total shareholders’ equity | |
| 44,097,790 | | |
| 41,719,975 | |
| Total liabilities and shareholders’ equity | |
$ | 75,474,072 | | |
$ | 61,035,386 | |
SANARA
MEDTECH INC. AND SUBSIDIARIES
CONSOLIDATED
STATEMENTS OF OPERATIONS (UNAUDITED)
| | |
Three Months Ended | | |
Nine Months Ended | |
| | |
September 30, | | |
September 30, | |
| | |
2023 | | |
2022 | | |
2023 | | |
2022 | |
| | |
| | |
| | |
| | |
| |
| Net Revenue | |
$ | 16,024,948 | | |
$ | 13,044,571 | | |
$ | 47,300,029 | | |
$ | 30,526,572 | |
| | |
| | | |
| | | |
| | | |
| | |
| Cost of goods sold | |
| 1,751,349 | | |
| 2,228,561 | | |
| 6,064,524 | | |
| 3,991,728 | |
| | |
| | | |
| | | |
| | | |
| | |
| Gross profit | |
| 14,273,599 | | |
| 10,816,010 | | |
| 41,235,505 | | |
| 26,534,844 | |
| | |
| | | |
| | | |
| | | |
| | |
| Operating expenses | |
| | | |
| | | |
| | | |
| | |
| Selling, general and administrative expenses | |
| 13,877,879 | | |
| 12,062,195 | | |
| 40,658,424 | | |
| 31,865,958 | |
| Research and development | |
| 986,454 | | |
| 1,061,387 | | |
| 3,480,906 | | |
| 2,333,024 | |
| Depreciation and amortization | |
| 997,674 | | |
| 814,881 | | |
| 2,580,243 | | |
| 1,556,752 | |
| Change in fair value of earnout liabilities | |
| (681,753 | ) | |
| 109,689 | | |
| (1,494,910 | ) | |
| 173,116 | |
| Total operating expenses | |
| 15,180,254 | | |
| 14,048,152 | | |
| 45,224,663 | | |
| 35,928,850 | |
| | |
| | | |
| | | |
| | | |
| | |
| Operating loss | |
| (906,655 | ) | |
| (3,232,142 | ) | |
| (3,989,158 | ) | |
| (9,394,006 | ) |
| | |
| | | |
| | | |
| | | |
| | |
| Other expense | |
| | | |
| | | |
| | | |
| | |
| Interest expense and other | |
| (188,294 | ) | |
| - | | |
| (188,300 | ) | |
| - | |
| Share of losses from equity method investment | |
| - | | |
| - | | |
| - | | |
| (379,633 | ) |
| Total other expense | |
| (188,294 | ) | |
| - | | |
| (188,300 | ) | |
| (379,633 | ) |
| | |
| | | |
| | | |
| | | |
| | |
| Loss before income taxes | |
| (1,094,949 | ) | |
| (3,232,142 | ) | |
| (4,177,458 | ) | |
| (9,773,639 | ) |
| Income tax benefit | |
| - | | |
| 1,702,890 | | |
| - | | |
| 5,844,796 | |
| | |
| | | |
| | | |
| | | |
| | |
| Net loss | |
| (1,094,949 | ) | |
| (1,529,252 | ) | |
| (4,177,458 | ) | |
| (3,928,843 | ) |
| | |
| | | |
| | | |
| | | |
| | |
| Less: Net loss attributable to noncontrolling interest | |
| (34,579 | ) | |
| (58,792 | ) | |
| (111,455 | ) | |
| (98,485 | ) |
| | |
| | | |
| | | |
| | | |
| | |
| Net loss attributable to Sanara MedTech shareholders | |
$ | (1,060,370 | ) | |
$ | (1,470,460 | ) | |
$ | (4,066,003 | ) | |
$ | (3,830,358 | ) |
| | |
| | | |
| | | |
| | | |
| | |
| Net loss per share of common stock, basic and diluted | |
$ | (0.13 | ) | |
$ | (0.18 | ) | |
$ | (0.49 | ) | |
$ | (0.49 | ) |
| | |
| | | |
| | | |
| | | |
| | |
| Weighted average number of common shares outstanding, basic and diluted | |
| 8,332,341 | | |
| 8,107,261 | | |
| 8,244,503 | | |
| 7,836,882 | |
SANARA
MEDTECH INC. AND SUBSIDIARIES
CONSOLIDATED
STATEMENTS OF CASH FLOWS (UNAUDITED)
| | |
Nine Months Ended | |
| | |
September 30, | |
| | |
2023 | | |
2022 | |
| | |
| | |
| |
| Cash flows from operating activities: | |
| | | |
| | |
| Net loss | |
$ | (4,177,458 | ) | |
$ | (3,928,843 | ) |
| Adjustments to reconcile net loss to net cash used in operating activities: | |
| | | |
| | |
| Depreciation and amortization | |
| 2,580,243 | | |
| 1,556,752 | |
| Loss on disposal of property and equipment | |
| - | | |
| 2,876 | |
| Bad debt expense | |
| 214,061 | | |
| 220,000 | |
| Inventory obsolescence | |
| 222,691 | | |
| 289,406 | |
| Share-based compensation | |
| 2,582,163 | | |
| 1,971,537 | |
| Noncash lease expense | |
| 243,988 | | |
| 189,409 | |
| Loss on equity method investment | |
| - | | |
| 379,633 | |
| Benefit from deferred income taxes | |
| - | | |
| (5,844,796 | ) |
| Accretion of finance liabilities | |
| 39,699 | | |
| - | |
| Amortization of debt issuance costs | |
| 2,055 | | |
| - | |
| Change in fair value of earnout liabilities | |
| (1,494,910 | ) | |
| 173,116 | |
| Changes in operating assets and liabilities: | |
| | | |
| | |
| Accounts receivable, net | |
| (794,344 | ) | |
| (754,934 | ) |
| Accounts receivable – related party | |
| 87,516 | | |
| 10,920 | |
| Inventory, net | |
| (1,664,714 | ) | |
| (451,838 | ) |
| Prepaid and other assets | |
| 482,921 | | |
| (69,490 | ) |
| Accounts payable | |
| 547,186 | | |
| (800,788 | ) |
| Accounts payable – related parties | |
| 30,711 | | |
| (126,812 | ) |
| Accrued royalties and expenses | |
| 557,295 | | |
| 947,130 | |
| Accrued bonuses and commissions | |
| (1,673,629 | ) | |
| 1,516,858 | |
| Operating lease liabilities | |
| (182,498 | ) | |
| (189,990 | ) |
| Net cash used in operating activities | |
| (2,397,024 | ) | |
| (4,909,854 | ) |
| Cash flows from investing activities: | |
| | | |
| | |
| Purchases of property and equipment | |
| (210,970 | ) | |
| (93,651 | ) |
| Proceeds from disposal of property and equipment | |
| 650 | | |
| 894 | |
| Purchases of intangible assets | |
| - | | |
| (600,000 | ) |
| Investment in equity securities | |
| - | | |
| (250,000 | ) |
| Acquisitions, net of cash acquired | |
| (9,942,750 | ) | |
| (2,191,919 | ) |
| Net cash used in investing activities | |
| (10,153,070 | ) | |
| (3,134,676 | ) |
| Cash flows from financing activities: | |
| | | |
| | |
| Loan proceeds, net | |
| 9,688,341 | | |
| - | |
| Equity offering net proceeds | |
| 1,033,761 | | |
| - | |
| Net settlement of equity-based awards | |
| (150,296 | ) | |
| (102,931 | ) |
| Cash payment of finance and earnout liabilities | |
| (744,795 | ) | |
| - | |
| Distribution to noncontrolling interest member | |
| - | | |
| (220,000 | ) |
| Net cash provided by (used in) financing activities | |
| 9,827,011 | | |
| (322,931 | ) |
| Net decrease in cash | |
| (2,723,083 | ) | |
| (8,367,461 | ) |
| Cash, beginning of period | |
| 8,958,995 | | |
| 18,652,841 | |
| Cash, end of period | |
$ | 6,235,912 | | |
$ | 10,285,380 | |
| | |
| | | |
| | |
| Cash paid during the period for: | |
| | | |
| | |
| Interest | |
$ | 146,546 | | |
$ | - | |
| Supplemental noncash investing and financing activities: | |
| | | |
| | |
| Right of use assets obtained in exchange for lease obligations | |
| 1,531,773 | | |
| - | |
| Equity issued for acquisitions | |
| 3,089,645 | | |
| 15,738,518 | |
| Earnout and other liabilities generated by acquisitions | |
| 3,759,642 | | |
| 6,882,151 | |
| Investment in equity securities converted in asset acquisition | |
| - | | |
| 1,803,440 | |
Reconciliation
of GAAP to Non-GAAP Financial Measures
| Reconciliation of Net Loss to Adjusted EBITDA (Unaudited) | |
Three Months Ended | |
| | |
September 30,
2023 | | |
September 30, 2022 | |
| | |
| | |
| |
| Net Loss | |
$ | (1,094,949 | ) | |
$ | (1,529,252 | ) |
| Adjustments | |
| | | |
| | |
| Interest expense – Term Loan | |
| 146,540 | | |
| - | |
| Debt issuance costs amortization | |
| 2,055 | | |
| - | |
| Accretion of finance liabilities | |
| 39,699 | | |
| - | |
| Income tax benefit | |
| - | | |
| (1,702,890 | ) |
| Depreciation and amortization | |
| 997,674 | | |
| 814,881 | |
| Noncash share-based compensation expense | |
| 857,526 | | |
| 683,202 | |
| Change in fair value of earnout liabilities | |
| (681,753 | ) | |
| 109,689 | |
| Loss on disposal of property and equipment | |
| - | | |
| 376 | |
| Adjusted EBITDA | |
$ | 266,792 | | |
$ | (1,623,994 | ) |
Exhibit 99.2


v3.23.3
| X |
- DefinitionBoolean flag that is true when the XBRL content amends previously-filed or accepted submission.
| Name: |
dei_AmendmentFlag |
| Namespace Prefix: |
dei_ |
| Data Type: |
xbrli:booleanItemType |
| Balance Type: |
na |
| Period Type: |
duration |
|
| X |
- DefinitionFor the EDGAR submission types of Form 8-K: the date of the report, the date of the earliest event reported; for the EDGAR submission types of Form N-1A: the filing date; for all other submission types: the end of the reporting or transition period. The format of the date is YYYY-MM-DD.
| Name: |
dei_DocumentPeriodEndDate |
| Namespace Prefix: |
dei_ |
| Data Type: |
xbrli:dateItemType |
| Balance Type: |
na |
| Period Type: |
duration |
|
| X |
- DefinitionThe type of document being provided (such as 10-K, 10-Q, 485BPOS, etc). The document type is limited to the same value as the supporting SEC submission type, or the word 'Other'.
| Name: |
dei_DocumentType |
| Namespace Prefix: |
dei_ |
| Data Type: |
dei:submissionTypeItemType |
| Balance Type: |
na |
| Period Type: |
duration |
|
| X |
- DefinitionAddress Line 1 such as Attn, Building Name, Street Name
| Name: |
dei_EntityAddressAddressLine1 |
| Namespace Prefix: |
dei_ |
| Data Type: |
xbrli:normalizedStringItemType |
| Balance Type: |
na |
| Period Type: |
duration |
|
| X |
- DefinitionAddress Line 2 such as Street or Suite number
| Name: |
dei_EntityAddressAddressLine2 |
| Namespace Prefix: |
dei_ |
| Data Type: |
xbrli:normalizedStringItemType |
| Balance Type: |
na |
| Period Type: |
duration |
|
| X |
- Definition
+ References
+ Details
| Name: |
dei_EntityAddressCityOrTown |
| Namespace Prefix: |
dei_ |
| Data Type: |
xbrli:normalizedStringItemType |
| Balance Type: |
na |
| Period Type: |
duration |
|
| X |
- DefinitionCode for the postal or zip code
| Name: |
dei_EntityAddressPostalZipCode |
| Namespace Prefix: |
dei_ |
| Data Type: |
xbrli:normalizedStringItemType |
| Balance Type: |
na |
| Period Type: |
duration |
|
| X |
- DefinitionName of the state or province.
| Name: |
dei_EntityAddressStateOrProvince |
| Namespace Prefix: |
dei_ |
| Data Type: |
dei:stateOrProvinceItemType |
| Balance Type: |
na |
| Period Type: |
duration |
|
| X |
- DefinitionA unique 10-digit SEC-issued value to identify entities that have filed disclosures with the SEC. It is commonly abbreviated as CIK. Reference 1: http://www.xbrl.org/2003/role/presentationRef
-Publisher SEC
-Name Exchange Act
-Number 240
-Section 12
-Subsection b-2
| Name: |
dei_EntityCentralIndexKey |
| Namespace Prefix: |
dei_ |
| Data Type: |
dei:centralIndexKeyItemType |
| Balance Type: |
na |
| Period Type: |
duration |
|
| X |
- DefinitionIndicate if registrant meets the emerging growth company criteria. Reference 1: http://www.xbrl.org/2003/role/presentationRef
-Publisher SEC
-Name Exchange Act
-Number 240
-Section 12
-Subsection b-2
| Name: |
dei_EntityEmergingGrowthCompany |
| Namespace Prefix: |
dei_ |
| Data Type: |
xbrli:booleanItemType |
| Balance Type: |
na |
| Period Type: |
duration |
|
| X |
- DefinitionCommission file number. The field allows up to 17 characters. The prefix may contain 1-3 digits, the sequence number may contain 1-8 digits, the optional suffix may contain 1-4 characters, and the fields are separated with a hyphen.
| Name: |
dei_EntityFileNumber |
| Namespace Prefix: |
dei_ |
| Data Type: |
dei:fileNumberItemType |
| Balance Type: |
na |
| Period Type: |
duration |
|
| X |
- DefinitionTwo-character EDGAR code representing the state or country of incorporation.
| Name: |
dei_EntityIncorporationStateCountryCode |
| Namespace Prefix: |
dei_ |
| Data Type: |
dei:edgarStateCountryItemType |
| Balance Type: |
na |
| Period Type: |
duration |
|
| X |
- DefinitionThe exact name of the entity filing the report as specified in its charter, which is required by forms filed with the SEC. Reference 1: http://www.xbrl.org/2003/role/presentationRef
-Publisher SEC
-Name Exchange Act
-Number 240
-Section 12
-Subsection b-2
| Name: |
dei_EntityRegistrantName |
| Namespace Prefix: |
dei_ |
| Data Type: |
xbrli:normalizedStringItemType |
| Balance Type: |
na |
| Period Type: |
duration |
|
| X |
- DefinitionThe Tax Identification Number (TIN), also known as an Employer Identification Number (EIN), is a unique 9-digit value assigned by the IRS. Reference 1: http://www.xbrl.org/2003/role/presentationRef
-Publisher SEC
-Name Exchange Act
-Number 240
-Section 12
-Subsection b-2
| Name: |
dei_EntityTaxIdentificationNumber |
| Namespace Prefix: |
dei_ |
| Data Type: |
dei:employerIdItemType |
| Balance Type: |
na |
| Period Type: |
duration |
|
| X |
- DefinitionLocal phone number for entity.
| Name: |
dei_LocalPhoneNumber |
| Namespace Prefix: |
dei_ |
| Data Type: |
xbrli:normalizedStringItemType |
| Balance Type: |
na |
| Period Type: |
duration |
|
| X |
- DefinitionBoolean flag that is true when the Form 8-K filing is intended to satisfy the filing obligation of the registrant as pre-commencement communications pursuant to Rule 13e-4(c) under the Exchange Act. Reference 1: http://www.xbrl.org/2003/role/presentationRef
-Publisher SEC
-Name Exchange Act
-Number 240
-Section 13e
-Subsection 4c
| Name: |
dei_PreCommencementIssuerTenderOffer |
| Namespace Prefix: |
dei_ |
| Data Type: |
xbrli:booleanItemType |
| Balance Type: |
na |
| Period Type: |
duration |
|
| X |
- DefinitionBoolean flag that is true when the Form 8-K filing is intended to satisfy the filing obligation of the registrant as pre-commencement communications pursuant to Rule 14d-2(b) under the Exchange Act. Reference 1: http://www.xbrl.org/2003/role/presentationRef
-Publisher SEC
-Name Exchange Act
-Number 240
-Section 14d
-Subsection 2b
| Name: |
dei_PreCommencementTenderOffer |
| Namespace Prefix: |
dei_ |
| Data Type: |
xbrli:booleanItemType |
| Balance Type: |
na |
| Period Type: |
duration |
|
| X |
- DefinitionTitle of a 12(b) registered security. Reference 1: http://www.xbrl.org/2003/role/presentationRef
-Publisher SEC
-Name Exchange Act
-Number 240
-Section 12
-Subsection b
| Name: |
dei_Security12bTitle |
| Namespace Prefix: |
dei_ |
| Data Type: |
dei:securityTitleItemType |
| Balance Type: |
na |
| Period Type: |
duration |
|
| X |
- DefinitionName of the Exchange on which a security is registered. Reference 1: http://www.xbrl.org/2003/role/presentationRef
-Publisher SEC
-Name Exchange Act
-Number 240
-Section 12
-Subsection d1-1
| Name: |
dei_SecurityExchangeName |
| Namespace Prefix: |
dei_ |
| Data Type: |
dei:edgarExchangeCodeItemType |
| Balance Type: |
na |
| Period Type: |
duration |
|
| X |
- DefinitionBoolean flag that is true when the Form 8-K filing is intended to satisfy the filing obligation of the registrant as soliciting material pursuant to Rule 14a-12 under the Exchange Act. Reference 1: http://www.xbrl.org/2003/role/presentationRef
-Publisher SEC
-Name Exchange Act
-Section 14a
-Number 240
-Subsection 12
| Name: |
dei_SolicitingMaterial |
| Namespace Prefix: |
dei_ |
| Data Type: |
xbrli:booleanItemType |
| Balance Type: |
na |
| Period Type: |
duration |
|
| X |
- DefinitionTrading symbol of an instrument as listed on an exchange.
| Name: |
dei_TradingSymbol |
| Namespace Prefix: |
dei_ |
| Data Type: |
dei:tradingSymbolItemType |
| Balance Type: |
na |
| Period Type: |
duration |
|
| X |
- DefinitionBoolean flag that is true when the Form 8-K filing is intended to satisfy the filing obligation of the registrant as written communications pursuant to Rule 425 under the Securities Act. Reference 1: http://www.xbrl.org/2003/role/presentationRef
-Publisher SEC
-Name Securities Act
-Number 230
-Section 425
| Name: |
dei_WrittenCommunications |
| Namespace Prefix: |
dei_ |
| Data Type: |
xbrli:booleanItemType |
| Balance Type: |
na |
| Period Type: |
duration |
|
Sanara MedTech (NASDAQ:SMTI)
Historical Stock Chart
From Mar 2024 to Apr 2024

Sanara MedTech (NASDAQ:SMTI)
Historical Stock Chart
From Apr 2023 to Apr 2024
