0001413909
true
FY
0001413909
2022-01-01
2022-12-31
0001413909
2022-06-30
0001413909
2023-04-17
0001413909
2022-12-31
0001413909
2021-12-31
0001413909
2021-01-01
2021-12-31
0001413909
us-gaap:CommonStockMember
2020-12-31
0001413909
us-gaap:AdditionalPaidInCapitalMember
2020-12-31
0001413909
DSGT:DiscountOnCommonStockMember
2020-12-31
0001413909
DSGT:CommonStockToBeIssuedMember
2020-12-31
0001413909
DSGT:ObligationToIssueWarrantsMember
2020-12-31
0001413909
us-gaap:PreferredStockMember
2020-12-31
0001413909
DSGT:PreferredStockAdditionalPaidInCapitalMember
2020-12-31
0001413909
DSGT:PreferredStockEquityToBeIssuedMember
2020-12-31
0001413909
us-gaap:AccumulatedOtherComprehensiveIncomeMember
2020-12-31
0001413909
us-gaap:RetainedEarningsMember
2020-12-31
0001413909
2020-12-31
0001413909
us-gaap:CommonStockMember
2021-12-31
0001413909
us-gaap:AdditionalPaidInCapitalMember
2021-12-31
0001413909
DSGT:DiscountOnCommonStockMember
2021-12-31
0001413909
DSGT:CommonStockToBeIssuedMember
2021-12-31
0001413909
DSGT:ObligationToIssueWarrantsMember
2021-12-31
0001413909
us-gaap:PreferredStockMember
2021-12-31
0001413909
DSGT:PreferredStockAdditionalPaidInCapitalMember
2021-12-31
0001413909
DSGT:PreferredStockEquityToBeIssuedMember
2021-12-31
0001413909
us-gaap:AccumulatedOtherComprehensiveIncomeMember
2021-12-31
0001413909
us-gaap:RetainedEarningsMember
2021-12-31
0001413909
us-gaap:CommonStockMember
2021-01-01
2021-12-31
0001413909
us-gaap:AdditionalPaidInCapitalMember
2021-01-01
2021-12-31
0001413909
DSGT:DiscountOnCommonStockMember
2021-01-01
2021-12-31
0001413909
DSGT:CommonStockToBeIssuedMember
2021-01-01
2021-12-31
0001413909
DSGT:ObligationToIssueWarrantsMember
2021-01-01
2021-12-31
0001413909
us-gaap:PreferredStockMember
2021-01-01
2021-12-31
0001413909
DSGT:PreferredStockAdditionalPaidInCapitalMember
2021-01-01
2021-12-31
0001413909
DSGT:PreferredStockEquityToBeIssuedMember
2021-01-01
2021-12-31
0001413909
us-gaap:AccumulatedOtherComprehensiveIncomeMember
2021-01-01
2021-12-31
0001413909
us-gaap:RetainedEarningsMember
2021-01-01
2021-12-31
0001413909
us-gaap:CommonStockMember
2022-01-01
2022-12-31
0001413909
us-gaap:AdditionalPaidInCapitalMember
2022-01-01
2022-12-31
0001413909
DSGT:DiscountOnCommonStockMember
2022-01-01
2022-12-31
0001413909
DSGT:CommonStockToBeIssuedMember
2022-01-01
2022-12-31
0001413909
DSGT:ObligationToIssueWarrantsMember
2022-01-01
2022-12-31
0001413909
us-gaap:PreferredStockMember
2022-01-01
2022-12-31
0001413909
DSGT:PreferredStockAdditionalPaidInCapitalMember
2022-01-01
2022-12-31
0001413909
DSGT:PreferredStockEquityToBeIssuedMember
2022-01-01
2022-12-31
0001413909
us-gaap:AccumulatedOtherComprehensiveIncomeMember
2022-01-01
2022-12-31
0001413909
us-gaap:RetainedEarningsMember
2022-01-01
2022-12-31
0001413909
us-gaap:CommonStockMember
2022-12-31
0001413909
us-gaap:AdditionalPaidInCapitalMember
2022-12-31
0001413909
DSGT:DiscountOnCommonStockMember
2022-12-31
0001413909
DSGT:CommonStockToBeIssuedMember
2022-12-31
0001413909
DSGT:ObligationToIssueWarrantsMember
2022-12-31
0001413909
us-gaap:PreferredStockMember
2022-12-31
0001413909
DSGT:PreferredStockAdditionalPaidInCapitalMember
2022-12-31
0001413909
DSGT:PreferredStockEquityToBeIssuedMember
2022-12-31
0001413909
us-gaap:AccumulatedOtherComprehensiveIncomeMember
2022-12-31
0001413909
us-gaap:RetainedEarningsMember
2022-12-31
0001413909
DSGT:ImperiumCanadaMember
DSGT:ClassAVotingParticipatingCommonSharesMember
2021-08-11
2021-08-12
0001413909
DSGT:ImperiumCanadaMember
DSGT:ClassAVotingParticipatingCommonSharesMember
2021-08-12
0001413909
DSGT:ACGolfCartsIncMember
us-gaap:CommonStockMember
2021-09-17
2021-09-17
0001413909
DSGT:ACGolfCartsIncMember
us-gaap:CommonStockMember
2021-09-17
0001413909
DSGT:FurnitureAndEquipmentMember
2022-01-01
2022-12-31
0001413909
us-gaap:VehiclesMember
2022-01-01
2022-12-31
0001413909
us-gaap:ComputerEquipmentMember
2022-01-01
2022-12-31
0001413909
DSGT:MachineryMember
2022-01-01
2022-12-31
0001413909
DSGT:EquipmentOnLeaseMember
2022-01-01
2022-12-31
0001413909
DSGT:PartsAndAccessoriesMember
2022-12-31
0001413909
DSGT:PartsAndAccessoriesMember
2021-12-31
0001413909
DSGT:GolfCartsMember
2022-12-31
0001413909
DSGT:GolfCartsMember
2021-12-31
0001413909
DSGT:EBikesMember
2022-12-31
0001413909
DSGT:EBikesMember
2021-12-31
0001413909
DSGT:ElectricVehiclesMember
2022-12-31
0001413909
DSGT:ElectricVehiclesMember
2021-12-31
0001413909
us-gaap:MachineryAndEquipmentMember
2022-12-31
0001413909
us-gaap:MachineryAndEquipmentMember
2021-12-31
0001413909
DSGT:FurnitureAndEquipmentMember
2022-12-31
0001413909
DSGT:FurnitureAndEquipmentMember
2021-12-31
0001413909
us-gaap:ComputerEquipmentMember
2022-12-31
0001413909
us-gaap:ComputerEquipmentMember
2021-12-31
0001413909
us-gaap:VehiclesMember
2022-12-31
0001413909
us-gaap:VehiclesMember
2021-12-31
0001413909
us-gaap:LoansPayableMember
2022-12-31
0001413909
us-gaap:LoansPayableMember
2021-12-31
0001413909
us-gaap:LoansPayableMember
2021-01-01
2021-12-31
0001413909
us-gaap:LoansPayableMember
2022-01-01
2022-12-31
0001413909
DSGT:LoansPayableOneMember
2022-12-31
0001413909
DSGT:LoansPayableOneMember
2021-12-31
0001413909
DSGT:LoansPayableOneMember
2022-01-01
2022-12-31
0001413909
DSGT:LoansPayableOneMember
2021-01-01
2021-12-31
0001413909
DSGT:LoansPayableTwoMember
2022-01-01
2022-12-31
0001413909
DSGT:LoansPayableTwoMember
2021-01-01
2021-12-31
0001413909
DSGT:LoansPayableTwoMember
2022-12-31
0001413909
DSGT:LoansPayableTwoMember
2021-12-31
0001413909
DSGT:LoansPayableThreeMember
2022-01-01
2022-12-31
0001413909
DSGT:LoansPayableThreeMember
2021-01-01
2021-12-31
0001413909
DSGT:LoansPayableThreeMember
2022-12-31
0001413909
DSGT:LoansPayableThreeMember
2021-12-31
0001413909
DSGT:LoansPayableFourMember
2022-01-01
2022-12-31
0001413909
DSGT:LoansPayableFourMember
2021-01-01
2021-12-31
0001413909
DSGT:LoansPayableFourMember
2022-12-31
0001413909
DSGT:LoansPayableFourMember
2021-12-31
0001413909
DSGT:LoansPayableFiveMember
2021-01-01
2021-12-31
0001413909
DSGT:LoansPayableFiveMember
2021-12-31
0001413909
DSGT:CanadaEmergencyBusinessAccountProgramMember
2020-04-17
0001413909
DSGT:CanadaEmergencyBusinessAccountProgramMember
2020-04-16
2020-04-17
0001413909
DSGT:CanadaEmergencyBusinessAccountProgramMember
2020-04-21
0001413909
DSGT:CanadaEmergencyBusinessAccountProgramMember
2020-04-20
2020-04-21
0001413909
DSGT:PaycheckProtectionProgramMember
2020-05-21
0001413909
DSGT:PaycheckProtectionProgramMember
2020-05-20
2020-05-21
0001413909
2020-06-05
0001413909
2020-06-04
2020-06-05
0001413909
DSGT:NonRelatedPartyMember
2021-09-11
2021-09-13
0001413909
DSGT:NonRelatedPartyMember
2021-09-13
0001413909
DSGT:ConvertiblePomissoryNotesMember
2022-12-31
0001413909
DSGT:ConvertiblePomissoryNotesMember
2021-12-31
0001413909
2022-12-01
0001413909
srt:MinimumMember
2022-12-01
0001413909
srt:MaximumMember
2022-12-01
0001413909
DSGT:SharePurchaseAgreementMember
2022-02-27
2022-02-28
0001413909
DSGT:SharePurchaseAgreementMember
2022-03-30
2022-03-31
0001413909
DSGT:SharePurchaseAgreementMember
2022-07-28
2022-07-29
0001413909
DSGT:SharePurchaseAgreementMember
2022-08-28
2022-08-29
0001413909
DSGT:SharePurchaseAgreementMember
2022-09-14
2022-09-15
0001413909
DSGT:SharePurchaseAgreementMember
2022-10-17
2022-10-18
0001413909
DSGT:SharePurchaseAgreementMember
2022-10-20
2022-10-21
0001413909
DSGT:SharePurchaseAgreementMember
2022-02-16
2022-02-17
0001413909
DSGT:SharePurchaseAgreementMember
2022-02-17
0001413909
DSGT:SharePurchaseAgreementMember
2022-01-01
2022-12-31
0001413909
DSGT:LoansPayableFiveMember
2022-12-31
0001413909
DSGT:LoansPayableSixMember
2022-12-31
0001413909
DSGT:LoansPayableSixMember
2021-12-31
0001413909
srt:DirectorMember
2015-03-31
0001413909
srt:DirectorMember
2022-12-31
0001413909
srt:DirectorMember
2021-12-31
0001413909
DSGT:ConvertiblePromissoryNoteMember
2017-06-05
0001413909
DSGT:ConvertiblePromissoryNoteMember
2022-12-31
0001413909
DSGT:ConvertiblePromissoryNoteMember
2021-12-31
0001413909
DSGT:CopierLeaseMember
2019-10-01
0001413909
DSGT:CopierLeaseMember
2022-12-31
0001413909
stpr:CA
2020-07-10
0001413909
DSGT:CABCMember
2020-07-14
0001413909
DSGT:CABCMember
2022-12-31
0001413909
DSGT:FD150LeaseAgreementMember
2021-04-01
0001413909
DSGT:FD150LeaseAgreementMember
2022-12-31
0001413909
DSGT:TrailerLeaseAgreementMember
2021-06-02
0001413909
DSGT:TrailerLeaseAgreementMember
2022-12-31
0001413909
DSGT:RedeemableSeriesCPreferredStockMember
2022-12-31
0001413909
DSGT:RedeemableSeriesDPreferredStockMember
2022-12-31
0001413909
DSGT:RedeemableSeriesEPreferredStockMember
2022-12-31
0001413909
DSGT:RedeemableSeriesFPreferredStockMember
2022-12-31
0001413909
DSGT:RedeemableSeriesFPreferredStockMember
2022-01-01
2022-12-31
0001413909
us-gaap:SeriesFPreferredStockMember
2022-01-01
2022-12-31
0001413909
us-gaap:SeriesFPreferredStockMember
DSGT:SecuritiesPurchaseAgreementMember
2022-10-20
2022-10-21
0001413909
us-gaap:SeriesFPreferredStockMember
DSGT:SecuritiesPurchaseAgreementMember
2022-10-21
0001413909
us-gaap:SeriesFPreferredStockMember
DSGT:SecuritiesPurchaseAgreementMember
2022-09-14
2022-09-15
0001413909
us-gaap:SeriesFPreferredStockMember
DSGT:SecuritiesPurchaseAgreementMember
2022-08-25
2022-08-26
0001413909
us-gaap:SeriesFPreferredStockMember
DSGT:SecuritiesPurchaseAgreementMember
2022-07-28
2022-07-29
0001413909
us-gaap:SeriesFPreferredStockMember
DSGT:SecuritiesPurchaseAgreementMember
2022-07-29
0001413909
us-gaap:SeriesFPreferredStockMember
DSGT:SecuritiesPurchaseAgreementMember
2022-03-30
2022-03-31
0001413909
us-gaap:SeriesFPreferredStockMember
DSGT:SecuritiesPurchaseAgreementMember
2022-02-06
2022-02-07
0001413909
us-gaap:SeriesFPreferredStockMember
DSGT:SecuritiesPurchaseAgreementMember
2022-01-03
2022-01-04
0001413909
us-gaap:SeriesCPreferredStockMember
2021-12-31
0001413909
DSGT:SecondClosingMember
us-gaap:SeriesCPreferredStockMember
2020-11-06
2020-11-06
0001413909
DSGT:SecondClosingMember
us-gaap:SeriesCPreferredStockMember
2020-12-06
2020-12-07
0001413909
DSGT:SecuritiesPurchaseAgreementMember
us-gaap:SeriesFPreferredStockMember
2020-12-20
2020-12-23
0001413909
DSGT:SecuritiesPurchaseAgreementMember
us-gaap:SeriesFPreferredStockMember
2020-12-23
0001413909
DSGT:SecuritiesPurchaseAgreementMember
us-gaap:SeriesFPreferredStockMember
DSGT:FirstAndSecondClosingMember
2020-12-20
2020-12-23
0001413909
DSGT:SecuritiesPurchaseAgreementMember
us-gaap:SeriesFPreferredStockMember
DSGT:AdditionalClosingMember
2020-12-20
2020-12-23
0001413909
DSGT:SecuritiesPurchaseAgreementMember
us-gaap:WarrantMember
2020-12-20
2020-12-23
0001413909
DSGT:SecuritiesPurchaseAgreementMember
us-gaap:SeriesFPreferredStockMember
DSGT:FirstClosingMember
2020-01-01
2020-12-31
0001413909
DSGT:FirstClosingMember
us-gaap:SeriesFPreferredStockMember
DSGT:SecuritiesPurchaseAgreementMember
2021-02-03
2021-02-04
0001413909
DSGT:SecondClosingMember
us-gaap:SeriesFPreferredStockMember
DSGT:SecuritiesPurchaseAgreementMember
2021-02-03
2021-02-04
0001413909
us-gaap:SeriesFPreferredStockMember
DSGT:SecuritiesPurchaseAgreementMember
2021-06-09
2021-06-10
0001413909
DSGT:SecuritiesPurchaseAgreementMember
us-gaap:SeriesFPreferredStockMember
2021-07-19
2021-07-20
0001413909
DSGT:SecuritiesPurchaseAgreementMember
us-gaap:WarrantMember
2021-07-19
2021-07-20
0001413909
us-gaap:SeriesFPreferredStockMember
2021-08-01
2021-08-03
0001413909
us-gaap:SeriesFPreferredStockMember
2021-10-21
2021-10-22
0001413909
us-gaap:SeriesFPreferredStockMember
2021-11-29
2021-11-30
0001413909
us-gaap:SeriesFPreferredStockMember
DSGT:SecuritiesPurchaseAgreementMember
2021-12-13
2021-12-14
0001413909
us-gaap:SeriesFPreferredStockMember
DSGT:SecuritiesPurchaseAgreementMember
2021-12-25
2021-12-31
0001413909
DSGT:MezzaninePreferredEquitySeriesCAndSeriesFMember
2022-01-01
2022-12-31
0001413909
us-gaap:PreferredStockMember
us-gaap:RedeemablePreferredStockMember
2020-12-31
0001413909
DSGT:StockToBeIssuedMember
2020-12-31
0001413909
us-gaap:PreferredStockMember
us-gaap:RedeemablePreferredStockMember
2021-01-01
2021-12-31
0001413909
DSGT:StockToBeIssuedMember
2021-01-01
2021-12-31
0001413909
us-gaap:PreferredStockMember
us-gaap:RedeemablePreferredStockMember
2021-12-31
0001413909
DSGT:StockToBeIssuedMember
2021-12-31
0001413909
us-gaap:PreferredStockMember
us-gaap:RedeemablePreferredStockMember
2022-01-01
2022-12-31
0001413909
DSGT:StockToBeIssuedMember
2022-01-01
2022-12-31
0001413909
us-gaap:PreferredStockMember
us-gaap:RedeemablePreferredStockMember
2022-12-31
0001413909
DSGT:StockToBeIssuedMember
2022-12-31
0001413909
us-gaap:RedeemablePreferredStockMember
2021-01-01
2021-12-31
0001413909
us-gaap:RedeemablePreferredStockMember
2022-01-01
2022-12-31
0001413909
us-gaap:SeriesAPreferredStockMember
2022-12-31
0001413909
DSGT:SeriesBConvertiblePreferredStockMember
2022-12-31
0001413909
us-gaap:SeriesBPreferredStockMember
DSGT:ConsultantMember
2022-11-03
2022-11-03
0001413909
us-gaap:SeriesBPreferredStockMember
srt:ChiefExecutiveOfficerMember
2022-08-01
2022-08-01
0001413909
us-gaap:SeriesBPreferredStockMember
srt:DirectorMember
2022-06-26
2022-06-27
0001413909
us-gaap:SeriesBPreferredStockMember
2020-10-26
0001413909
us-gaap:SeriesBPreferredStockMember
2020-10-24
2020-10-26
0001413909
us-gaap:SeriesBPreferredStockMember
2021-02-15
2021-02-17
0001413909
us-gaap:SeriesBPreferredStockMember
2021-02-17
0001413909
us-gaap:CommonStockMember
2021-02-15
2021-02-17
0001413909
us-gaap:CommonStockMember
2021-02-17
0001413909
us-gaap:SeriesBPreferredStockMember
2021-05-26
0001413909
us-gaap:SeriesBPreferredStockMember
2021-05-24
2021-05-26
0001413909
us-gaap:SeriesBPreferredStockMember
2021-09-14
2021-09-16
0001413909
us-gaap:SeriesBPreferredStockMember
2021-09-16
0001413909
us-gaap:SeriesBPreferredStockMember
2021-03-03
2021-03-04
0001413909
us-gaap:SeriesBPreferredStockMember
2021-01-01
2021-12-31
0001413909
DSGT:InvestorRelationsMember
2022-01-01
2022-12-31
0001413909
us-gaap:CommonStockMember
DSGT:InvestorRelationsMember
2022-01-01
2022-12-31
0001413909
us-gaap:CommonStockMember
DSGT:PrepaidLegalServiceMember
2022-01-01
2022-12-31
0001413909
us-gaap:CommonStockMember
us-gaap:SeriesFPreferredStockMember
2022-01-01
2022-12-31
0001413909
DSGT:DebtSettlementMember
2021-01-01
2021-12-31
0001413909
us-gaap:CommonStockMember
DSGT:LegalSettlementMember
2021-01-01
2021-12-31
0001413909
DSGT:ConsultantMember
2021-01-01
2021-12-31
0001413909
us-gaap:CommonStockMember
us-gaap:SeriesBPreferredStockMember
2021-01-01
2021-12-31
0001413909
us-gaap:SeriesCPreferredStockMember
2021-01-01
2021-12-31
0001413909
us-gaap:SeriesFPreferredStockMember
2021-01-01
2021-12-31
0001413909
DSGT:DebtSettlementMember
2020-12-31
0001413909
DSGT:CommonStockToBeIssuedMember
DSGT:ServiceAgreementMember
2021-01-01
2021-12-31
0001413909
us-gaap:WarrantMember
2022-01-01
2022-12-31
0001413909
us-gaap:WarrantMember
2021-12-31
0001413909
DSGT:WarrantOneMember
2021-12-31
0001413909
DSGT:WarrantTwoMember
2021-12-31
0001413909
DSGT:SecuritiesPurchaseAgreementMember
us-gaap:SeriesFPreferredStockMember
us-gaap:WarrantMember
2021-07-20
0001413909
us-gaap:WarrantMember
2021-01-01
2021-12-31
0001413909
us-gaap:WarrantMember
2022-12-31
0001413909
us-gaap:MeasurementInputRiskFreeInterestRateMember
srt:MinimumMember
2022-12-31
0001413909
us-gaap:MeasurementInputRiskFreeInterestRateMember
srt:MaximumMember
2022-12-31
0001413909
us-gaap:MeasurementInputRiskFreeInterestRateMember
srt:MinimumMember
2021-12-31
0001413909
us-gaap:MeasurementInputRiskFreeInterestRateMember
srt:MaximumMember
2021-12-31
0001413909
us-gaap:MeasurementInputExpectedTermMember
srt:MinimumMember
2022-12-31
0001413909
us-gaap:MeasurementInputExpectedTermMember
srt:MaximumMember
2022-12-31
0001413909
us-gaap:MeasurementInputExpectedTermMember
srt:MinimumMember
2021-12-31
0001413909
us-gaap:MeasurementInputExpectedTermMember
srt:MaximumMember
2021-12-31
0001413909
us-gaap:MeasurementInputExpectedDividendRateMember
2022-12-31
0001413909
us-gaap:MeasurementInputExpectedDividendRateMember
2021-12-31
0001413909
us-gaap:MeasurementInputPriceVolatilityMember
srt:MinimumMember
2022-12-31
0001413909
us-gaap:MeasurementInputPriceVolatilityMember
srt:MaximumMember
2022-12-31
0001413909
us-gaap:MeasurementInputPriceVolatilityMember
srt:MinimumMember
2021-12-31
0001413909
us-gaap:MeasurementInputPriceVolatilityMember
srt:MaximumMember
2021-12-31
0001413909
DSGT:PresidentCEOAndCFOMember
2022-01-01
2022-12-31
0001413909
DSGT:PresidentCEOAndCFOMember
2022-12-31
0001413909
DSGT:PresidentCEOAndCFOMember
2021-12-31
0001413909
us-gaap:SeriesBPreferredStockMember
2020-05-20
2020-05-21
0001413909
DSGT:DirectorsAndEmployeesMember
DSGT:SeriesBConvertiblePreferredSharesMember
2020-05-20
2020-05-21
0001413909
DSGT:SeriesBConvertiblePreferredSharesMember
srt:DirectorMember
2020-05-20
2020-05-21
0001413909
DSGT:SeriesBConvertiblePreferredSharesMember
2020-05-20
2020-05-21
0001413909
us-gaap:AdministrativeServiceMember
2022-01-01
2022-12-31
0001413909
DSGT:ElectricVehiclesMember
2022-01-01
2022-12-31
0001413909
DSGT:GolfCartsMember
2022-01-01
2022-12-31
0001413909
DSGT:GPSUnitsMember
2022-01-01
2022-12-31
0001413909
us-gaap:AdministrativeServiceMember
2022-12-31
0001413909
DSGT:ElectricVehiclesMember
2022-12-31
0001413909
DSGT:GolfCartsMember
2022-12-31
0001413909
DSGT:GPSUnitsMember
2022-12-31
0001413909
country:CA
2022-12-31
0001413909
country:US
2022-12-31
0001413909
country:GB
2022-12-31
0001413909
country:MX
2022-12-31
0001413909
country:AU
2022-12-31
0001413909
country:CN
2022-12-31
0001413909
country:CA
2022-01-01
2022-12-31
0001413909
country:US
2022-01-01
2022-12-31
0001413909
us-gaap:CommonStockMember
us-gaap:SubsequentEventMember
us-gaap:SeriesBPreferredStockMember
2023-01-04
2023-01-04
0001413909
us-gaap:SeriesBPreferredStockMember
us-gaap:SubsequentEventMember
2023-01-04
2023-01-04
0001413909
us-gaap:SeriesFPreferredStockMember
DSGT:SecuritiesPurchaseAgreementMember
us-gaap:SubsequentEventMember
2023-01-11
2023-01-12
0001413909
us-gaap:SeriesFPreferredStockMember
DSGT:SecuritiesPurchaseAgreementMember
us-gaap:SubsequentEventMember
2023-01-17
2023-01-18
0001413909
us-gaap:CommonStockMember
us-gaap:SubsequentEventMember
us-gaap:SeriesFPreferredStockMember
2023-01-10
2023-01-13
0001413909
us-gaap:SeriesFPreferredStockMember
us-gaap:SubsequentEventMember
2023-01-10
2023-01-13
0001413909
DSGT:CommonStockOneMember
us-gaap:SubsequentEventMember
DSGT:SeriesFPreferredStockOneMember
2023-01-17
2023-01-17
0001413909
DSGT:SeriesFPreferredStockOneMember
us-gaap:SubsequentEventMember
2023-01-17
2023-01-17
0001413909
us-gaap:SubsequentEventMember
2023-01-17
0001413909
us-gaap:SubsequentEventMember
2023-01-18
iso4217:USD
xbrli:shares
iso4217:USD
xbrli:shares
xbrli:pure
iso4217:CAD
DSGT:Integer
UNITED
STATES
SECURITIES
AND EXCHANGE COMMISSION
Washington,
D.C. 20549
FORM
10-K/A
Amendment No. 1
(Mark
One)
☒
ANNUAL REPORT PURSUANT TO SECTION 13 OR 15(d) OF THE SECURITIES EXCHANGE ACT OF 1934
For
the fiscal year ended December 31, 2022
OR
☐
TRANSITION REPORT PURSUANT TO SECTION 13 OR 15(d) OF THE SECURITIES EXCHANGE ACT OF 1934
For
the transition period from ____________ to ____________.
Commission
file number 000-53988
DSG
GLOBAL INC.
(Exact
Name of Registrant as Specified in Its charter)
| Nevada |
|
26-1134956 |
(State
or Other Jurisdiction of
Incorporation
or Organization) |
|
(I.R.S.
Employer
Identification
No.) |
207
- 15272 Croydon Drive
Surrey,
British Columbia, V3Z 0Z5, Canada
(Address
of Principal Executive Offices) (Zip Code)
(604)
575-3848
(Registrant’s
Telephone Number, Including Area Code)
Securities
registered pursuant to Section 12(b) of the Act: None
Securities
registered pursuant to Section 12(g) of the Act:
Common
Stock, $0.001 par value
(Title
of Class)
Indicate
by check mark if the registrant is a well-known seasoned issuer, as defined in Rule 405 of the Securities Act. Yes ☐ No ☒
Indicate
by check mark if the registrant is not required to file reports pursuant to Section 13 or 15(d) of the Act. Yes ☐ No ☒
Indicate
by check mark whether the registrant (1) has filed all reports required to be filed by Section 13 or 15(d) of the Securities Exchange
Act of 1934 during the preceding 12 months (or for such shorter period that the registrant was required to file such reports), and (2)
has been subject to such filing requirements for the past 90 days. Yes ☒ No ☐
Indicate
by check mark whether the registrant has submitted electronically and posted on its corporate Web site, if any, every Interactive Data
File required to be submitted and posted pursuant to Rule 405 of Regulation S-T (§232.405 of this chapter) during the preceding
12 months (or for such shorter period that the registrant was required to submit and post such files). Yes ☒ No ☐
Indicate
by check mark whether the registrant is a large accelerated filer, an accelerated filer, a non-accelerated filer, a smaller reporting
company, or an emerging growth company. See the definitions of “large accelerated filer,” “accelerated filer,”
“smaller reporting company, “and “emerging growth company” in Rule 12b-2 of the Exchange Act.
| Large
accelerated filer ☐ |
Accelerated
filer ☐ |
| Non-accelerated
filer ☒ |
Smaller
reporting company ☒ |
|
Emerging
growth company ☐ |
If
an emerging growth company, indicate by checkmark if the registrant has not elected to use the extended transition period for complying
with any new or revised financial accounting standards provided pursuant to Section 13(a) of the Exchange Act. ☐
Indicate
by check mark whether the registrant has filed a report on and attestation to its management’s assessment of the effectiveness
of its internal control over financial reporting under Section 404(b) of the Sarbanes-Oxley Act (15 U.S.C. 7262(b)) by the registered
public accounting firm that prepared or issued its audit report. ☐
If
securities are registered pursuant to Section 12(b) of the Act, indicate by check mark whether the financial statements of the registrant
included in the filing reflect the correction of an error to previously issued financial statements. ☐
Indicate
by check mark whether any of those error corrections are restatements that required a recovery analysis of incentive-based compensation
received by any of the registrant’s executive officers during the relevant recovery period pursuant to §240.10D-1(b). ☐
Indicate
by check mark whether the registrant is a shell company (as defined in Rule 12b-2 of the Exchange Act). Yes ☐ No ☒
As
of June 30, 2022, the aggregate market value of the voting and non-voting common equity held by non-affiliates was $10,011,073 based
on the closing price on that date. For purposes of calculating the aggregate market value of shares held by non-affiliates, we have assumed
that all outstanding shares are held by non-affiliates, except for shares held by each of our executive officers, directors. These assumptions
should not be deemed to constitute an admission that all executive officers and directors, are, in fact, affiliates of our company, or
that there are not other persons who may be deemed to be affiliates of our company. Further information concerning shareholdings of our
officers, directors, and principal stockholders is included or incorporated by reference in Part III, Item 12 of this Annual Report on
Form 10-K.
As
of April 17, 2023, the registrant had 145,429,993 shares of common stock issued and outstanding.
EXPLANATARY
NOTE
DSG
Global Inc. is filing this Amendment No. 1 on Form 10-K/A to amend the Annual Report on Form 10-K for the fiscal year ended December
31, 2022, originally filed with the Securities Exchange Commission (the “SEC”) by the Company on April 18, 2023 (the “Original
Form 10-K”), because the Original Form 10-K that was filed was not the version that had been approved by our independent auditors,
and was a prior version that had been sent by Management to the Company’s Edgar and XBRL filing service.
Because the original opinion filed
by the auditor was not approved, the auditor’s opinion has not been dual dated.
The
differences between the Original Form 10-K and this Form 10-K/A are as follows:
Consolidated
Balance Sheet
| Account | |
Original | | |
Re-filed 10-K/A | |
| Cash | |
| 48,713 | | |
| 53,779 | |
| Inventories | |
| 1,202,375 | | |
| 1,204,577 | |
| Loans payable | |
| 1,416,692 | | |
| 2,416,692 | |
| Notes payable | |
| 1,000,000 | | |
| - | |
| Preferred stock | |
| 3,015,180 | | |
| 3,087,180 | |
Consolidated
Statement of Operations
| Account | |
Original | | |
Re-filed 10-K/A | |
| Cost of revenue | |
| 2,085,171 | | |
| 2,082,968 | |
| Gross Profit | |
| 1,748,682 | | |
| 1,750,885 | |
| Compensation expense | |
| 3,459,553 | | |
| 3,534,816 | |
Consolidated
Statement of Stockholders’ Deficit
| Account | |
Original | | |
Re-filed 10-K/A | |
| Additional paid in capital | |
| 3,014,980 | | |
| 3,086,980 | |
Consolidated
Statements of Cash Flows
| Account | |
Original | | |
Re-filed 10-K/A | |
| Preferred shares issued for services | |
| 1,815,700 | | |
| 1,887,700 | |
| Inventories | |
| (514,167 | ) | |
| (491,899 | ) |
| Trade payables and accruals | |
| 2,228,216 | | |
| 2,277,657 | |
| Net cash used in operating activities | |
| (3,627,148 | ) | |
| (3,622,082 | ) |
| Cash at end of the year | |
| 48,713 | | |
| 53,779 | |
Except
as described above, no other changes have been made to the Form 10-K. The Form 10-K continues to speak as of the date of the Form 10-K,
and we have not updated the disclosures contained therein to reflect any events which occurred at a date subsequent to the filing of
the Form 10-K other than as expressly indicated in this Amendment. Currently dated certifications from the Company’s Chief Executive
Officer and Chief Financial Officer have been included as exhibits to this Amendment No. 1.
DSG
GLOBAL INC.
FORM
10-K
TABLE
OF CONTENTS
SPECIAL
NOTE REGARDING FORWARD-LOOKING STATEMENTS
This
Annual Report on Form 10-K contains forward-looking statements that include information relating to future events, future financial performance,
strategies, expectations, competitive environment, regulation, and availability of resources. The words “believe,” “may,”
“will,” “potentially,” “estimate,” “continue,” “anticipate,” “intend,”
“could,” “would,” “project,” “plan,” “expect” and similar expressions that
convey uncertainty of future events or outcomes are intended to identify forward-looking statements. Forward-looking statements are based
on our assumptions, estimates, analysis, and opinions made in light of our experience and our perception of market trends, current conditions
and expected developments, as well as other factors that we believe to be relevant and reasonable in the circumstances at the date that
such statements are made, but which are subject to known and unknown risks, and may prove to be incorrect. Such risks are discussed in
Item 1.A “Risk Factors”. In particular, without limiting the generality of the foregoing disclosure, the forward-looking
statements contained in this Annual Report and which are inherently subject to a variety of risks and uncertainties that could cause
actual results, performance or achievements to differ significantly include but are not limited to:
| |
● |
our
ability to successfully homologate our electric vehicles offerings; |
| |
● |
anticipated
timelines for product deliveries; |
| |
● |
the
production capacity of our manufacturing partners and suppliers; |
| |
● |
the
stability, availability and cost of international shipping services; |
| |
● |
our
ability to establish and maintain a dealership network for our electric vehicles; |
| |
● |
our
ability to attract and retain customers; |
| |
● |
the
consistency of current labor and material costs; |
| |
● |
the
availability of current government economic incentives for electric vehicles; |
| |
● |
the
expansion of our business in our core golf market as well as in new markets like electric vehicles, commercial fleet management and
agriculture; |
| |
● |
the
stability of general economic and business conditions, including changes in interest rates; |
| |
● |
the
Company’s ability to obtain financing to execute our business plans, as and when required and on reasonable terms; |
| |
● |
our
ability to accurately assess and respond to market demand in the electric vehicle and golf industries; |
| |
● |
our
ability to compete effectively in our chosen markets; |
| |
● |
consumer
willingness to accept and adopt the use of our products; |
| |
● |
the
anticipated reliability and performance of our product offerings; |
| |
● |
our
ability to attract and retain qualified employees and key personnel; |
| |
● |
our
ability to maintain, protect and enhance our intellectual property; and |
| |
● |
our
ability to comply with evolving legal standards and regulations, particularly concerning requirements for being a public company. |
Readers
are cautioned that the foregoing list is not exhaustive of all factors and assumptions which may have been used.
These
forward-looking statements speak only as of the date of this Form 10-K and are subject to uncertainties, assumptions and business and
economic risks. As such, our actual results could differ materially from those set forth in the forward-looking statements as a result
of the factors set forth below in Part I, Item 1A, “Risk Factors,” and in our other reports filed with the Securities and
Exchange Commission. Moreover, we operate in a very competitive and rapidly changing environment, and new risks emerge from time to time.
It is not possible for us to predict all risks, nor can we assess the impact of all factors on our business or the extent to which any
factor, or combination of factors, may cause actual results to differ materially from those contained in any forward-looking statements
we may make. In light of these risks, uncertainties and assumptions, the forward-looking events and circumstances discussed in this Form
10-K may not occur, and actual results could differ materially and adversely from those anticipated or implied in our forward-looking
statements.
You
should not rely upon forward-looking statements as predictions of future events. Although we believe that the expectations reflected
in our forward-looking statements are reasonable, we cannot guarantee that the future results, levels of activity, performance or events
and circumstances described in the forward-looking statements will be achieved or occur. Moreover, neither we nor any other person assumes
responsibility for the accuracy and completeness of the forward-looking statements. We undertake no obligation to update publicly any
forward-looking statements for any reason after the date of this Form 10-K to conform these statements to actual results or to changes
in our expectations, except as required by law.
You
should read this Annual Report on Form 10-K and the documents that we reference in this Annual Report on Form 10-K and have filed with
the Securities and Exchange Commission as exhibits thereto with the understanding that our actual future results and circumstances may
be materially different from what we expect.
PART
I
Business
Overview
When
used in the Annual Report, the terms “Company,” “we,” “our,” “us,” “DSG,”
or “VTS” mean DSG Global, Inc., its subsidiary Vantage Tag Systems Inc., and its wholly owned subsidiaries DSG Tag Systems
International, Ltd. and Imperium Motor Company and Imperium Motor of Canada Corporation (together “Imperium”).
DSG
Global Inc. is a technology development company based in Surrey, British Columbia, Canada, engaged in the design, manufacture, and marketing
of fleet management solutions for the golf industry, as well as commercial, government and military applications. In 2020, we established
an electric vehicle marketing and distribution division, Imperium Motor Company (“Imperium USA”) and its Canadian counterpart
in 2021, Imperium Motor of Canada Corporation (“Imperium Canada”), and in 2021 we formed a golf cart division, AC Golf Carts,
Inc. with exclusive world-wide rights of Shelby Cobra golf carts. The principal activities of our fleet management and golf division
are the development, sale and rental of GPS tracking devices and interfaces for golf vehicles, and related support services. More recently,
our subsidiary Vantage Tag (“Vantage”) expanded from its original purpose of producing and marketing GPS systems, to leading
DSG’s golf industry presence by supplying a comprehensive package of electric vehicles, fleet management systems, and back of house
support services to the golf industry, and to commercial customers in the last mile delivery, tourism and resort, education, agriculture,
and corporate markets. Meanwhile, our electric vehicle division is engaged in the importation, marketing and distribution of a range
low-speed and high-speed electric passenger vehicles for commuter, family, commercial, and public use.
We
were founded by a group of individuals who have dedicated their careers to fleet management technologies and have been at the forefront
of the industry’s most innovative developments. Our executive team has over 50 years of experience in the design and manufacture
of wireless, GPS, and fleet tracking solutions, and over 40 years automotive retail, wholesale, distribution, and manufacturing.
Our
principal executive office is located at 207 - 15272 Croydon Drive Surrey, British Columbia, V3Z 0Z5, Canada. The telephone number at
our principal executive office is 1 (877) 589-8806.
We
report in three segments, Golf Carts, TAG systems, and Electric Vehicles. Any assets, revenues or expenses that are not the result of
the three reporting segments are reported as Head Office administrative activities.
The
Company’s stock symbol is DSGT.
Our
CUSIP number is 23340C104.
Corporate
History
DSG
Global, Inc. (formerly Boreal Productions Inc.) was incorporated under the laws of the State of Nevada on September 24, 2007. We were
formed to option feature films and TV projects to be packaged and sold to movie studios and production companies.
In
January 2015, we changed our name to DSG Global, Inc. and effected a one-for-three reverse stock split of our issued and outstanding
common stock in anticipation of entering in a share exchange agreement with DSG TAG Systems, Inc., a corporation incorporated under the
laws of the State of Nevada on April 17, 2008 and extra provincially registered in British Columbia, Canada in 2008.
On
April 13, 2015, we entered into a share exchange agreement with Vantage Tag Systems Inc. (“VTS”) (formerly DSG Tag Systems
Inc.) and the shareholders of VTS who become parties to the agreement. Pursuant to the terms of the share exchange agreement, we agreed
to acquire not less than 75% and up to 100% of the issued and outstanding common shares in the capital stock of VTS in exchange for the
issuance to the selling shareholders of up to 20,000,000 pre-reverse split shares of our common stock on the basis of 1 common share
for 5.4935 common shares of VTS.
On
May 6, 2015, we completed the acquisition of approximately 75% (82,435,748 common shares) of the issued and outstanding common shares
of VTS as contemplated by the share exchange agreement by issuing 15,185,875 pre-reverse split shares of our common stock to shareholders
of VTS who became parties to the agreement. In addition, concurrent with the closing of the share exchange agreement, we issued an additional
179,823 pre-reverse split shares of our common stock to Westergaard Holdings Ltd. in partial settlement of accrued interest on outstanding
indebtedness of VTS.
Following
the initial closing of the share exchange agreement and through October 22, 2015, we acquired an additional 101,200 shares of common
stock of VTS from shareholders who became parties to the share exchange agreement and issued to these shareholders an aggregate of 18,422
pre-reverse split shares of our common stock. Following completion of these additional purchases, DSG Global Inc. owns approximately
100% of the issued and outstanding shares of common stock of VTS. An aggregate of 4,229,384 shares of Series A Convertible Preferred
Stock of VTS were exchanged for 51 Series B and 3,000,000 Series E preferred shares during the year ended December 31, 2018 by Westergaard
Holdings Ltd., an affiliate of Keith Westergaard, a previous member of our board of directors which have not been issued as of September
30, 2021.
The
reverse acquisition was accounted for as a recapitalization effected by a share exchange, wherein VTS is considered the acquirer for
accounting and financial reporting purposes. The assets and liabilities of the acquired entity have been brought forward at their book
value and no goodwill has been recognized. We adopted the business and operations of VTS upon the closing of the share exchange agreement.
DSG
TAG was incorporated under the laws of the State of Nevada on April 17, 2008 and extra provincially registered in British Columbia, Canada
in 2008. In March 2011, DSG TAG formed DSG Tag Systems International, Ltd. in the United Kingdom (“DSG UK”). DSG UK is a
wholly owned subsidiary of DSG TAG.
On
March 26, 2019, we effected a reverse stock split of our authorized and issued and outstanding shares of common stock on a four thousand
(4,000) for one (1) basis. Upon effect of the reverse split, our authorized capital decreased from 3,000,000,000 pre-reverse split shares
of common stock to 750,000 shares of common stock and correspondingly, our issued and outstanding shares of common stock decreased from
2,761,333,254 pre-reverse split to 690,403 shares of common stock, all with a par value of $0.001. Our outstanding shares of Preferred
Stock remain unchanged.
On
December 22, 2020, we amended our Articles of Incorporation to increase our authorized common shares from 150,000,000 to 350,000,000,
and to designate 14,010,000 shares of preferred stock, par value $0.001 per share, including 3,000,000 Series A Preferred stock, 10,000
Series B Convertible Preferred stock, 10,000 Series C Convertible Preferred stock, 1,000,000 Series D Convertible Preferred stock, 5,000,000
Series E Convertible Preferred stock and 10,000 Series F Convertible Preferred Stock.
Imperium
Motor Corp. was incorporated under the laws of the State of Nevada on September 15, 2020. Imperium Motor of Canada Corporation was incorporated
under the laws of British Columbia, Canada, on August 12, 2021.
Subsequent to year end, on January 5, 2023, Imperium Motor Corp. had its
name changed to Liteborne Motor Corporation.
On
August 12, 2021, the Company incorporated Imperium Motor of Canada Corporation (“Imperium Canada”), under the laws of British
Columbia, Canada, for which it subscribed to all authorized capital stock, 100 shares of Class A Voting Participating common shares,
at a price of $0.10 per share. Imperium Canada is a wholly owned subsidiary of the Company.
On
September 17, 2021, the Company incorporated AC Golf Carts, Inc. (“AC Golf Carts”), under the laws of the State of Nevada,
for which it subscribed to all authorized stock, 100 common shares at a price of $0.001 par value per share. AC Golf Carts is a wholly
owned subsidiary of the Company.
Recent
Financing Activities
On
February 17, 2022, the Company entered into a Waiver of Conditions (the “Waiver”) to the Share Purchase Agreement (the “SPA”)
dated December 13, 2021. The Company has received five payments in the amount of $250,000 on February 28, 2022, $250,000 on March 31,
2022, $90,000 on July 29, 2022, $250,000 on August 26, 2022, $125,000 on September 15, 2022, $125,000 on October 18, 2022, and $285,000
on October 21, 2022, for 1,375 preferred series F shares in total. Under the Waiver, the Company agrees to repay these amounts, on an
ongoing basis, by remitting 20% of all gross sales back to the subscriber until such time that the 500 shares of the Series F Preferred
Stock issued pursuant to this Waiver agreement are redeemed in full. As these preferred F series shares subscribed for under the Waiver
are mandatorily redeemable, the total amounts of $1,375,000 were recorded as liabilities, as per ASC 480-10. Under the original terms
of the SPA, redemption of preferred F series shares requires a 15% premium payment on the face value. As such, a total Redemption Premium
of $75,000 will be paid on the redemption as part of the 20% gross sales remittance and will be amortized as the repayments are made.
During the year ended December 31, 2022, $3,062 was recognized, and recorded as interest expense, included as part of the loan.
During
the year ended December 31, 2022, the Company made required payments in the amount of $20,411, which were applied against the loan payable.
Electric
Vehicle Division
Imperium Motor Company USA, name changed to Liteborne
Motor Corporation (“LMC or Liteborne”)
Imperium
Motor Company Canada
Overview
Imperium
Motor Company USA and Canada (“Imperium”) is a global technology company - specializing in fleet management, vehicle charging
network, lithium air battery development, and marketing and distribution of electric vehicles.
On
October 5, 2020, through Imperium Motor Corp., we entered into a Memorandum of Understanding dated September 10, 2020 with Skywell Shenzen
Vehicles Co. Ltd. aka Skywell New Energy Automobile Group Co., Ltd. (“Skywell”), a leading manufacturer of electric vehicles
in China. Pursuant to the Memorandum of Understanding, Imperium has received the exclusive right, subject to placement of an initial
vehicle order and corresponding payment to Skywell, to purchase, homologate, and distribute Skywell’s range of ET5 electric sport
utility vehicles in North America and the Caribbean. The Memorandum of Understanding, while stated to be non-binding, provides for the
conclusion of a definitive agreement by the parties following the placement of an initial vehicle order by the Company. The definitive
agreement was to have a minimum term of 3 years, and will renew automatically for successive 3-year terms, subject to the right of each
party to terminate the agreement by giving 30 days notice prior to renewal.
Effective
February 9, 2021, we entered into a definitive OEM Cooperation Agreement with Skywell dated February 5, 2021, which agreement modifies
and replaces the Memorandum of Understanding. Pursuant to the OEM Cooperation Agreement, Skywell has granted to the Company the exclusive
right to distribute Skywell’s electric passenger cars, trucks (including but not limited to the ET5 sport utility vehicle), buses
and spare parts in the United States and Canada for a term of 5 years. In order to maintain the distributions rights accorded by the
agreement, the Company must purchase and deliver 1,000 units within the first year of the term, 2,000 units in the second year, 3,000
units in the third year, 4,000 units in the fourth year, and 5,000 units in the fifth and final year of the term. Skywell may terminate
the agreement in its distribution with 30 days’ notice if the Company fails to satisfy sales quotas. Product price, terms of payment
and logistical matters are subject to the ongoing approval and agreement of the parties from time to time.
Imperium will hold the exclusive rights
to distribute the innovative Skywell Automotive Group lineup of electric vehicles (EV) in the North American market. Skywell is one of
the premier EV manufacturers in China, with a full range of advanced passenger vehicles, large and medium-sized buses, light buses, logistics
vehicles, and special purpose automobiles.
On
November 1, 2022, the Company announced the appointment of Alan M. Wagner as chief executive officer of the Imperium USA. Mr. Wagner’s extensive
expertise and reach across the automotive industry. Before joining LMC, Wagner served as executive director of Hyundai Transys and was
vice president of product development for Mercedes Benz Tech. Before that, he held multiple executive positions with Lear Corporation.
He was the vice president of engineering at Saleen Automotive/SMS Supercars and executive vice president of Saleen Electric. Wagner was
also vice president of Entech. Through the years, he has worked with General Motors, Ford, Shelby, Petty Enterprises, Toyota, Chrysler,
and BMW among other iconic automotive brands.
Imperium
offers an opportunity to be part of a potential $500 million EBITDA business in the electric vehicle industry with a well-known, proven
partner already exporting superior road ready vehicles worldwide. Among the many proof points to the quality of these vehicles is a five
passenger SUV, whose debut at the LA Auto Show, prompted extraordinary reviews and a surprise purchase off the floor by a legendary automotive
design expert in addition to pre-orders from attendees.
Subsequent to year end, of January 5, 2023, the Company changed the name
of Imperium USA to Liteborne Motor Company (“Liteborne”).
Liteborne,
now with strong industry leadership and a board of directors of exceptional industry depth, is well-poised to navigate the U.S. certification
process (known as homologation) already underway as it continues to build out a sales and dealer network.
In
short, while others struggle to manufacture and deliver vehicles at an affordable price, Liteborne’s reasonably priced solutions
based on modern, nimble, on-demand manufacturing is unique versus the chaos and cost of American design and build that characterizes
the EV landscape. We’re proud of the mission to offer North Americans an unprecedented, value driven line of electric vehicles
by importing beautifully designed, skillfully manufactured, and reliably-delivered EVs.
The
rest of the management team include Mr. Daniel Lock and Mr. Jonathan D’Agostino. Mr Lock, who is leading Homologation has over
20-years of automotive development and engineering management experience. Prior to Joining Liteborne he was a senior manager and program
manager at Hyundai Transys. A program planning manager at Gentherm, program manager and a product design engineer at Visteon. Mr. Lock
earned his BS in chemical engineering from Yale University. .Mr. Jonathan D’Agostino Started career at Sands Brothers in 1999.
After graduating from Fordham University with honors from NYS in legal and ethical studies he joined Lehman Brothers in 2003, spent several
years as an investment and merchant banker with several different banks, including Morgan Brothers, which was founded by a Lehman vice
chair. He became Professor Luc Montagnier’s partner in commercializing his preventative healthcare business, during which time
he won the 2008 Noble Prize for Medicine. After leaving traditional Merchant Banking he entered the green energy space working to create
power-efficient production of Green Hydrogen. Before Liteborne he founded and now is testing and commercializing HydroBoost, a product
that creates green hydrogen on demand for automobiles and trucks.
Electric
Vehicle Market Overview
Low
Speed Electric Vehicles (LSEV)
| |
● |
The
global market size for LSEVs is expected to reach $68B by 2025. |
| |
● |
Imperium
LSEV and HSEV sales are on track to reach $132 million by 2023. |
High
Speed Electric Vehicles (HSEV)
| |
● |
The
global electric vehicle market size was valued at $11.9B in 2017 and is projected to reach $56.7B by 2025, growing at a CAGR of 22.3%
from 2018 to 2025. |
| |
● |
Liteborne
is expected to begin importing vehicles in Q4 2023 with initial sales reaching up to $130,000,0000 in Rev and in 2024 Revenues will
reach up to $850,000,000. High profitability is expected |
United
States
The
number of electric vehicles (EVs) on U.S. roads is projected to reach 18.7 million in 2030, up from 1 million at the end of 2018. This
is about 7% of the 259 million vehicles (cars and light trucks) expected to be on U.S. roads in 2030. EV sales in the United States were
up 79% in 2018 while global EV sales grew 64% in the same year.
Canada
Sales
for 2018 were over 150% higher than 2017 and saw more EVs sold across the country in 2018 than in the previous three years combined.
Nearly 3% of all new vehicles are electric, a higher rate than in the United States.
Production
Partners
Zhejiang
Jonway Automobile Co.
Imperium
has exclusive distribution rights in the United States, Canada, Mexico and the Carribean for Jonway built EVs.
Zhejiang
Jonway Automobile Co., Ltd (“Jonway”) began manufacturing in May 2003. The Taizhou city, Zhejiang province manufacturing
plant has an area of 57.3 hectares with more than 800 employees. It has invested more than 600 million RMB in producing the three and
five-door SUVs, with a capacity to produce up to 30,000 units per year. The manufacturing operations include pressing, welding, painting
and assembling lines. It has also gained the TS16949:2009, GCC, SASO, SONCAP and CCC certification. Jonway offers a network of more than
500 auto dealerships in China alone and has started a distribution network in Italy.
As
a national first-class production enterprise, Jonway has passed the ISO 9001 quality management system certification, the product has
passed the European certification and the American DOT, EPA certification, and has been exported to more than 80 countries in the world.
Jonway has announced its third assembly plant in the city of Xuzhou, China.
Skywell
New Energy Automobile Group Co. Ltd.
Sky-well
New Energy Automobile Group Co. Ltd. was founded in 2011. Primarily engaged in the manufacturing and sales of large, medium and light
buses, passenger cars and related components, it has gradually become a leading enterprise of China’s new energy automobile industry.
By the end of 2016, the total assets of the company were 7.838 billion Yuan, with the net assets of 1.429 billion Yuan.
Skywell
owns Nanjing Jinlong Bus Manufacturing Co., Ltd., Wuhan Sky-well New Energy Automobile Co., Ltd., Shenzhen Sky-well Automobile Co., Ltd,
Nanjing Sky Source World Power Technology Co., Ltd and Qingdao Sky-well New Energy Automobile Group Co. Ltd. Its products include the
3.6-18 m series of electric passenger cars and passenger vehicles, which are widely sold in many countries and regions in Southeast Asia
and widely used in public transport, tourism, commuting, leasing and other markets. Skywell is also one of the first companies to enter
the clean energy bus industry. Known for its emphasis on technology research and development, its skilled workforce, its innovative designs
and high-quality products, it has achieved excellent results. Since 2014, Skywell has ranked as the leading seller of new energy passenger
cars in the China.
Skywell
has granted to the Company the exclusive right to distribute Skywell’s electric passenger cars, trucks (including but not limited
to the ET5 sport utility vehicle), buses and spare parts in the United States and Canada for a term of 5 years.
Imperium’s
Green Story
Gas
powered combustion engines are not the future of transportation, they are the past. Our line of electric vehicles produces no emissions,
almost no heat, little noise, and can be fully powered by renewable electricity producing resources like solar and wind energy. Imperium
intends to offer a combination solar/wind home charging station for a 100% sustainable, 100% zero carbon solution.
Imperium
EV Passenger Vehicles

| |
IMPERIUM ET5 by Skywell |
| |
|
|
| |
● |
SEATING for five passengers |
| |
● |
MOTOR 150 kW max power |
| |
● |
SPEED up to 150 kp/h |
| |
● |
RANGE up to 404 km or 520 km NEDC estimate |
| |
● |
BATTERY 55.33 or 71.98 kWh Li-ion |
| |
● |
EQUIPPED with Automatic Transmission, Air Conditioning,
Heater, Power Windows, Power Door Locks, Rear Camera, Push Button Start, Alloy Wheels, Am-Fm USB/SD Stereo and more |
Competition
in the EV Market
The
EV market is highly competitive and evolving rapidly, with new manufacturers and distributors consistently entering the industry to satisfy
actual and expected growth in the demand for competitively priced vehicles. As a result, we expect that we will experience significant
competition from new and established manufacturers, marketers and distributors. These include niche manufacturers of specialty electric
vehicles, and large established manufacturers of automobiles. These, including manufacturers of EVs such as the Tesla Model S, the Chevrolet
Volt and the Nissan Leaf.
Most
of our current and potential competitors have significantly greater financial, technical, manufacturing, marketing and other resources
than we do and may be able to devote greater resources to the design, development, manufacturing, distribution, promotion, sale and support
of their products. Virtually all of our competitors have more extensive customer bases and broader customer and industry relationships
than we do. In addition, almost all of these companies have longer operating histories and greater name recognition than we do. Our competitors
may be in a stronger position to respond quickly to new technologies and may be able to design, develop, market and sell their products
more effectively.
DSG
Technologies and Products—Fleet Management and Golf Division
We
have developed the TAG suite of products that we believe is the first completely modular fleet management solution for the golf industry.
The TAG suite of products is currently sold and installed around the world in golf facilities and as commercial applications through
a network of established distributors and partnerships with some of the most notable brands in fleet and equipment manufacture.
VTS
is giving fleet operator’s new capabilities to track and control their vehicles through the new INFINITY XL system and the new
3G-4G TAG. We have developed in-house a proprietary combination of hardware and software that is marketed around the world as the INFINITY
TAG system. We have primarily focused on the golf industry where the TAG system is deployed to help golf course operators manage their
fleet of golf carts, turf equipment, and utility vehicles. We are a leader in the category of fleet management in the golf industry and
were awarded “Best Technology of the Year” in 2010 by Boardroom magazine, a publication of the National Golf Course
Owners Association. To date, the TAG system is installed on vehicles around the world and has been used to monitor millions of rounds
of golf.
The
TAG system fills a void in the marketplace by offering a modular structure that allows the customer to customize their system to meet
desired functionality and budget constraints. In addition to the core TAG system vehicle control functionality, which can operate independently,
we offer 3 information display systems to the golf courses management and golfer — the alphanumeric TEXT and high definition 12”
INFINITY XL, 10” INFINITY RM and 10” INFINITY DM— providing the operator with three display options which is unique
in the industry. VTS also offers inhouse financing thru purchase or lease.
The
primary market for our TAG system is the golf industry, with over 40,000 golf operations worldwide. While the golf industry remains the
primary focus of our sales and marketing efforts, we have completed several successful pilots of the TAG system in other markets such
as agriculture and commercial fleet operations. With appropriate resources, we intend to expand our sales and marketing efforts into
these new markets.
We
are expanding our sales force in North America, which comprises the most significant portion of the golf fleet market and have developed
key relationships with privately owned distributors and golf equipment manufacturers such as E-Z-GO, Yamaha and Ransomes Jacobsen to
help drive sales through-out Europe, Asia, UK and many other markets worldwide Including our most recent move to New Zealand and Australia.
Our
most recent Vantage product range includes the Vantage brand Fleet golf cart, and retail golf carts for individual users under the Vantage
and Shelby brands. Shelby Golf cart products represent a unique offering within the golf and low speed vehicle industry, emphasizing
customization and user brand association. Shelby products will be sold via DSG and a network of licensed Shelby dealers under the AC
Golf Carts outlet brand. Those dealers will also act as service agents for both Shelby products and other DSG products in their locality.
In
order to successfully deliver products, increase sales, and maintain customer satisfaction, we need to have a reliable supplier of our
hardware units and components at competitive prices. Presently, we source our TAG and INFINITY fleet from a North American Fortune 200
company with manufacturing in China and our RAPTORS from a supplier operating in the United Kingdom and Asia. This new relationship that
has been established provides us with higher quality, newer technology at a competitive price.
In
addition, VTS recently engaged with a telecommunications provider to provide new technology in hardware and wireless access through-out
the world therefor allowing VTS to substantially reduce cellular cost.
Technology
Overview
DSG
produces a “modular” suite of products to provide fleet management solution for any vehicle required for a golf operation
and provides two golfer information display options to meet the operators budget requirements. DSG believes that it is currently the
only company in the golf fleet management industry with these capabilities.
The
VTS TAG System is designed from the ground up to be a golf/turf vehicle fleet management system. Its main function is addressing the
golf course operator needs. While employing same core technology (cellular wireless and GPS) as traditional commercial vehicle fleet
management systems, DSG has created patent pending solutions to adapt it to the very specific requirements of the golf environment. Compared
to mainstream fleet tracking products, DSG collects 10 to 50 times more data points per MB (megabyte) of cellular data due to its proprietary
data collection and compression algorithms. Also, the relative positioning accuracy is improved by almost one order of magnitude by the
use of application-specific geo-data validation and correction methods.
DSG’s
proprietary methods make it possible to offer a solution suitable for use on golf courses at a price low enough to be affordable in the
industry. Every system component incorporates state-of-the-art technology (server, mobile trackers, display). In developing its products
VTS TAG Systems has adopted an application-oriented approach placing the most emphasis (and research & development) on server and
end-user software by taking advantage of the commodity level reached by mainstream technologies such as Global Positioning (GPS) and
M2M (Machine to Machine) Cellular Data in the wider context of Commercial Fleet Management.
DSG
leveraged the existence of an abundance of very cost-effective telematics solutions by selecting an “off-the-shelf” hardware
platform that meets all the main performance and environmental requirements for operation in the harsh, outdoor golf course environment.
While removing all risk and cost associated with developing a proprietary hardware platform, DSG has maintained the unique nature of
its hardware solution by developing a set of proprietary adapters and interfaces specifically for the golf application.
DSG
has secured an exclusive supply agreement with the third-party hardware manufacturers for the vertical of golf industry. Additionally,
DSG owns the design of all proprietary adapters and interfaces. This removes the risk of a potential competitor utilizing the same hardware
platform. Competitors could attempt to reverse engineer or copycat the TAG technology and equipment. This risk factor is mitigated by
the fact that our product does not rely on a particular technology or hardware platform to be successful but on a very specific vertical
software application that is far more difficult to copy (and respectively easier to protect).
The
application software contains patent features implemented in every core component of the system. The TAG device runs DSG proprietary
firmware incorporating unique data collection and compression algorithms. The web server software which powers the end-user application
is also proprietary and incorporates the industry knowledge accumulated through the over 70 years of collective experience of the DSG
team.
This
approach has given the product line a high level of endurance against technology obsolescence. At any point in time, if a hardware component
is discontinued or a better/less expensive hardware platform becomes available, the software application can be easily adapted to operate
on the new platform or with the new component. The company benefits from the constant increase of performance and cost reduction of mainstream
hardware technology without any additional cost.
The
web-based Software-as-a-Service (SaaS) model used by VTS TAG System is optimal for low operating and support costs and rapid-cycle release
for software updates. It is also a major factor in eliminating or substantially reducing the need for any end-user premises equipment.
Customers have access to the service through any internet connected computer or mobile device, there is no need for a local wireless
network on the facility and installation time and cost are minimal.
DSG
is positioned to take advantage of mainstream technology and utilize “best of breed” hardware platforms to create new generations
of products. Our software is designed to be “portable” to future new platforms with better GPS and wireless technology in
order to maintain the Company competitive edge.
All
new product development effort of DSG is following the same model: select the best of breed third-party hardware platform, design and
produce custom proprietary accessories while focusing the bulk of the development efforts on vertical software application to address
a very specific set of end-customer needs.
The
latest addition to the TAG family of products, the TAG INFINITY is a perfect example of this development philosophy in action: the main
component is a last-generation Android tablet PC wrapped in a custom designed outdoor enclosure containing the power supply and interface
components required for the golf environment. The software application is taking advantage of all the advanced high-resolution graphics,
touch user interface and computing power of the Android OS delivering a vastly superior user experience compared to competitive systems.
The time to market for this product was 30% of how long it took to develop and launch this type of products in the past.
The
TAG Control Unit
The
company’s flagship product is the TAG Control unit. The TAG can operate as a “stand alone” unit or with one of two
displays; the INFINITY 10” alphanumeric display or the INFINITY high definition “touch activated” screen. The TAG is
GPS enabled and communicates with the TAG software using cellular GSM networks. Utilizing the cellular networks rather than erecting
a local Wi-Fi network assures carrier grade uptime, and vehicle tracking “off- property”. GSM is the de facto global standard
for mobile communications.
The
TAG unit itself is discreetly installed usually in the nose of the vehicle to give the GPS clear line of site. It is then connected to
the vehicle battery and ignition. The property is then mapped using the latest satellite imagery that is graphically enhanced and loaded
into the TAG System as a map.
Once
installed the vehicle owner utilizes the TAG software to locate the vehicle in real time using any computer, smartphone, or tablet that
has an internet connection and perform various management operations.

The
operator can use the geo-fencing capabilities to create “zones” on the property where they can control the vehicles behavior
such as shutting down a vehicle that is entering a sensitive or dangerous area. The TAG System also monitors the strength of the vehicle’s
battery helping to prevent sending out vehicles undercharged batteries which can be an inconvenience for the course and negatively impact
the golfer experience.
Features
and Benefits:
| ● |
Internal
battery utilizing Smart Power technology which charges the battery only when the vehicle is running (gas) or being charged (electric) |
| |
|
| ● |
Pace
of Play management and reporting which is a critical statistic for the golf operator |
| |
|
| ● |
No
software to install |
| |
|
| ● |
Web
based access on any computer, smartphone, or tablet |
| |
|
| ● |
Set
up restricted zones to protect property, vehicles, and customers |
| |
|
| ● |
Real
time tracking both on and off property (using Street Maps) |
| |
|
| ● |
Email
alerts of zone activity |
| |
|
| ● |
Cart
lockdown |
| |
|
| ● |
Detailed
usage reporting for improved maintenance, proper vehicle rotation, and staff efficiency |
| |
|
| ● |
Geofencing
security features |
| |
|
| ● |
Ability
to enforce cart path rules which is key to protecting course on wet weather days |
| |
|
| ● |
Modular
system allows for hardware and feature options to fit any budget or operations |
INFINITY
10” Display
The
INFINITY 10” is paired with the TAG Control unit as DSG’s entry level display system for operators who desire to provide
basic hole distance information and messaging to the golf customer. The INFINITY 10” is a very cost-effective solution for operators
who desire to give their customers GPS services with the benefits of a Fleet Management back end. The INFINITY 10” can be mounted
on the steering column or the dash depending on the customer’s preference.

VTS’s
entry level alphanumeric golf information display
Features
and Benefits:
| ● |
Hole
information display |
| |
|
| ● |
Yardage
displays for front, middle, back locations of the pin |
| |
|
| ● |
Messaging
capabilities – to individual carts or fleet broadcast |
| |
|
| ● |
Zone
violation warnings |
| |
|
| ● |
Pace
of Play notifications |
| |
|
| ● |
Smart
battery technology to prevent power drain |
| |
|
| ● |
Versatile
mounting option |
INFINITY
XL 12” Display
The
INFINITY XL 12” is a solution for operators who desire to provide a high-level visual information experience to their customers.
The INFINITY XL 12” is a high definition “Infinity XL 12” “ activated display screen mounted in the golf cart
integrated with the TAG Control unit to provide a full back/front end Fleet Management solution. The INFINITY XL 12” displays hole
graphics, yardage, and detailed course information to the golfer and provides interactive features such as Food and Beverage ordering
and scorekeeping.

The
industry leading Infinity XL 12” HD – the most sophisticated display in the market.
Features
and Benefits:
| ● |
Integrated
Food and Beverage ordering |
| |
|
| ● |
Pro
Tips |
| |
|
| ● |
Flyover
capability |
| |
|
| ● |
Daily
pin placement display |
| |
|
| ● |
Interactive
Scorecard with email capability |
| |
|
| ● |
Multiple
language choices |
| |
|
| ● |
No
power drain with Smart Battery technology |
| |
|
| ● |
Full
broadcast messaging capabilities |
| |
|
| ● |
Pace
of Play display |
| |
|
| ● |
Vivid
hole graphics |
| |
|
| ● |
Option
of steering or roof mount |
| |
|
| ● |
Generate
advertising revenue and market additional services |
PROGRAMMATIC
Advertising Platform
A
unique feature of the INFINITY XL 12” system is the advertising display capability. This can be used by the operator for internal
promotion of services or for generating revenue by selling the ad real estate since the golf demographic is very desirable to advertisers.
The INFINITY XL 12” displays banner, panel, full page, pro tip, and Green view ads. There is also ad real estate on the interactive
feature screens for Food and Beverage ordering and the scorecard. The Infinity XL 12” System can also display animated GIF files
or play video for added impact.

Advertising
displayed in multiple formats including animated GIF and video
DSG
has developed proprietary “Ad Manager” software which is used to place and change the ads on the system(s) from a central
NOC (Network Operations Center) in real time. The Ad Manager can deploy to a single system or multiple systems. This creates a network
of screens that is also very desirable to advertisers as ad content can be deployed locally, regionally, or nationally. The advertising
platform is an important part of the company’s future marketing and sales strategy.
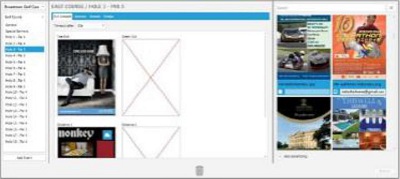
DSG
R3 Advertising Platform
The
DSG R3 program delivers advance ROI (Revenue Optimization Intelligence). Utilizing all streams of advertising delivery, such as automated,
direct, and self-serve. The R3 program has the ability to deliver relevant advertising to golfers the moment they sit in the cart. The
R3 model is more effective than the previous advertising model of ‘One to One’, these are local ads only sold through direct
sales by courses, or 3 rd party advertising sales firms. The new R3 model offers ‘Many to one’ advertising options,
delivering thousands of national, regional, and local advertisers an opportunity to advertise on our screens through our R3 Marketplace.
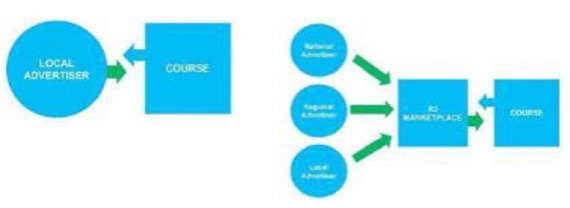
Previous
‘One to One’ model vs the new R3 model ‘Many to One’

TAG
TURF/ECO TAG
The
TAG Turf and the new ECO TAG were developed to give course operators the same back end management features for their turf equipment and
utility vehicles. Turf equipment is expensive, and a single piece can run over $100,000 and represents a large portion of a golf course
operating budget. The TAG Turf and ECO TAG have comprehensive reporting that the operator can utilize to implement programs that can
increase efficiencies, reduce labor costs, help lower idle times, provide fuel consumption and equipment performance, provide historical
data on cutting patterns, and reduce pollution from emissions by monitoring idle times. Since the golf course needs to be maintained
regardless of volume these cost saving measures directly impact the operator’s bottom line.
Features
and Benefits:
| ● |
Can
be installed on any turf, utility, or service vehicle |
| |
|
| ● |
Work
activity tracking and management |
| |
|
| ● |
Work
breakdown and analysis per area, work group, activity type or specific vehicle |
| |
|
| ● |
Vehicle
idling alerts |
| |
|
| ● |
Zone
entry alerts |
| |
|
| ● |
Detailed
travel (cutting patterns) history |
| |
|
| ● |
Detailed
usage reports with mileage and hours |
| |
|
| ● |
Protection
for ecological areas through geo fencing |
| |
|
| ● |
Vehicle
lock down and ‘off property’ locating features |
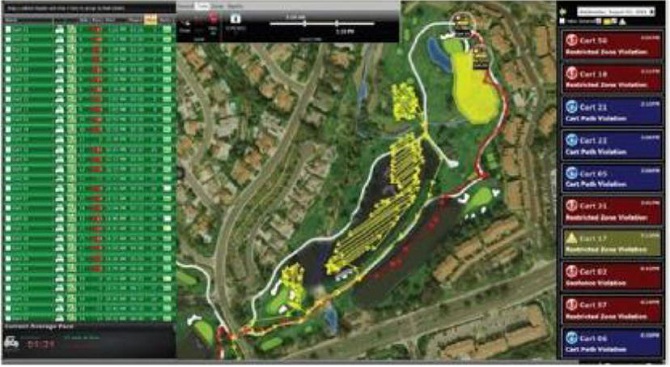
The
TAG Turf provides detailed trail history and cutting patterns
Golf
Carts
The
Company distributes fleet carts for golf courses, as well as consumer and utility carts under the Vantage brand, ranging from newly in-house
designed SR-1 Single Rider, to the Vantage V-Club and Pro varts.
In
early 2022 the Company acquired the global distribution and branding rights to market the “Shelby” branded golf carts and
E-bikes named for the legendary American race car driver. The carts will be marketed to the rapidly growing and lucrative Golf Community
market such as the Villages in Florida where personal golf carts are both the preferred means of transportation and a status symbol.
The
unique styling and performance features of the Shelby range of vehicles has broad appeal among consumers looking for a vehicle with performance
heritage. Shelby golf cart models include the Shelby G.T. 500 series 2 seat, 4 seat and 6 seat models also available in Cobra ultimate
high-performance trim, with a sport utility model due for release in the 3rd quarter of 2023. DSG exhibited the Shelby range at the 2023
PGA golf show where it generated enormous excitement with more than 70 dealers from the USA alone registering their interest.
Vantage
BayCar

Motor:
Industry leading maintenance free 5kw AC. Highly efficient, smooth, high torque motor.
Battery
Pack.: Extended range from larger 105ah LITHIUM battery pack.
Battery
Charger: Opportunity on board charge anywhere there’s access to regular 110v power outlet.
Braking
System: Regenerative engine braking with auto park brake system
Suspension:
McPherson Strut front suspension.
Full
electrics. LED Headlights, taillights, Sequential turn lights, LCD Screen. 10” Display. Speedo, Battery State of Charge. Trip
and Total Milage, Gear selection indicator.
USB
outlets. 4 x on-dash USB jacks, 10” Alloy wheels with ProTour or radial tires
Convertible
rear seat. Folds out to handy flat bed for groceries, guest luggage or equipment.
Extended
canopy to protect rear seat occupants
Warranty.
The industry’s most comprehensive 5-year Bumper to bumper warranty
Telemetry.
Your service technician has Password protected App connect Bluetooth Smart Phone access to vehicle controller. Change vehicle setting,
Diagnostics, fault history and reports.
Telemetry.
Password protected App connect Bluetooth access to Lithium Battery Management System.
AC
Smart Drive maintenance free motor. Integrated onboard Smart Charger
VantagePro

Motor:
Industry leading maintenance free 5kw AC. Highly efficient, smooth, high torque motor.
Battery
Pack.: Extended range from larger 105ah LITHIUM battery pack.
Battery
Charger: Opportunity on board charge anywhere there’s access to regular 110v power outlet.
GPS
Fleet Management System: Level 1 GPS Fleet management included in lease or rental. (Pace of play alerts, Geo Fencing, Security lockdown
and more)
Braking
System: Regenerative engine braking with auto park brake system
Suspension:
Automotive McPherson Strut front suspension. USB outlets. 4 x on-dash USB jacks
Accessories.
2 x sand bottles, Beverage Cool Box, Club and Ball Washer
Warranty.
The industry’s most comprehensive 7-year Bumper to bumper warranty
Service
& Maintenance. Level 1 on-site service included in lease or rental.
Vantage
Tag GPS fleet management system from the world leaders in Golf Cart Fleet Management.
Telemetry.
Password protected App connect Bluetooth Smart Phone access to vehicle controller. Change vehicle setting, Diagnostics, fault history
and reports.
Telemetry.
Password protected App connect Bluetooth access to Lithium Battery Management System. AC Smart Drive maintenance free motor. Integrated
onboard Smart Charger.
Vantage
Tour

Motor:
Industry leading maintenance free 5kw AC. Highly efficient, smooth, high torque motor.
Battery
Pack.: Extended range from larger 105ah LITHIUM battery pack.
Battery
Charger: Opportunity on board charge anywhere there’s access to regular 110v power outlet.
Braking
System: Regenerative engine braking with auto park brake system
Suspension:
McPherson Strut front suspension.
Full
electrics. LED Headlights, taillights, Sequential turn lights, LCD Screen. 10” Display. Speedo, Battery State of Charge.
Trip and Total Milage, Gear selection indicator.
USB
outlets. 4 x on-dash USB jacks
10”
Alloy wheels with ProTour or radial tires
Warranty.
The industry’s most comprehensive 7 year Bumper to bumper warranty
Service
& Maintenance. Complimentary first on-site cart service (your home or golf course) Meet your service tech. The comfort of knowing
you have professional parts and service support.
Telemetry.
Your service technician has Password protected App connect Bluetooth Smart Phone access to vehicle controller. Change vehicle setting,
Diagnostics, fault history and reports.
Telemetry.
Password protected App connect Bluetooth access to Lithium Battery Management System.
AC
Smart Drive maintenance free motor. Integrated onboard Smart Charger
Shelby
Golf Cart

Motor:
Enormous power from true 6.3kw AC Motor.
Battery
Pack. 110ah Lithium Battery pack.
Onboard
integrated battery charger.
Electrics.
LED Headlights, tail lights, blinkers and turn lights.
USB
outlets on dash.
9”
Bluetooth Touchscreen. Hands free phone calls, audio and video streaming, backup camera, inbuilt radio
14”
alloy wheels with radial
Tires
Front trunk.
Distinctive
styling and colour options from the Officially Licensed Shelby
GT500
Golf Cart.
Revenue
Model
DSG
derives revenue from five different sources.
Systems
Sales Revenue, which consists of the sales price paid by those customers who purchase our TAG system hardware lease our TAG system
hardware.
Monthly
Service Fees are paid by all customers for the wireless data fee charges required to operate the GPS tracking on the TAG systems.
Monthly
Rental Fees are paid by those customers that rent the TAG system hardware. The amount of a customer’s monthly payment varies
based on the type of equipment rented (a TAG, a TAG and INFINITY 10”, or a TAG and INFINITY XL 12”).
Golf
Cart Sales Revenue, which consist of the sales price paid by the customers who purchase our Vantage and licensed Shelby golf carts.
Programmatic
Advertising Revenue is a new source of revenue that we believe has the potential to be strategic for us in the future. We are in
the process of implementing and designing software to provide advertising and other media functionality on our INFINITY.
We
recognize revenue when persuasive evidence of an arrangement exists, delivery has occurred, the fee is fixed or determinable, and collectability
is reasonably assured. In instances where final acceptance of the product is specified by the customer, revenue is deferred until all
acceptance criteria have been met. We accrue for warranty costs, sales returns, and other allowances based on its historical experience.
Our
revenue recognition policies are discussed in more detail under “Note 2 – Summary of Significant Accounting Policies”
in the notes to our Consolidated Financial Statements included in Part II, Item 8 of this Form 10-K.
Markets
Sales
and Marketing Plan
The
market for the TAG System is the worldwide golf cart and Turf equipment fleets. There are 40,000 golf courses around the world with North
America being the largest individual market with 20,000. This represents over 3,000,000 vehicles. The golf market has five distinct types
of operations. Municipal, Private Country Clubs, Destination Resorts, Public Commercial, Military and University affiliated. VTS has
deployed and has case studies developed TAG systems in each of these categories.
Our
marketing strategy is focused on building brand awareness, generating quality leads, and providing excellent customer service.
North
America Sales
Since
the largest market is North America the Company employs a direct sales team and sales agents that provide full sales coverage. Our sales
agents are experienced golf industry professionals who maintain established relationships with the golf industry and carry multiple golf
lines. Our sales objective is to offer our existing and prospective customers a dedicated, knowledgeable, and outstanding customer service
team.
In
addition, our team is dedicated to existing accounts that focus on up-selling and cross-selling additional products to our current customer
base, securing renewal agreements, and providing excellent customer service. The current regions are:
| ● |
Western
Canada |
| |
|
| ● |
Central
Canada |
| |
|
| ● |
Eastern
Canada |
| |
|
| ● |
Northeast
USA |
| |
|
| ● |
Western
USA |
| |
|
| ● |
Southeastern
USA |
| |
|
| ● |
Midwest
USA |
International
Sales
DSG
focuses on select global golf markets that offer significant volume opportunities and that value the benefits that our products deliver.
We
utilize strategic distributor partnerships in each targeted region/country to sell, install and service our products. Distributors are
selected based on market strength, market share, technical and selling capability, and overall reputation. We believe that DSG solutions
appeal to all distributors because they are universal and fit any make or model of vehicle. We maintain and leverage our strong relationship
with Yamaha, E-Z-GO and Ransomes Jacobsen (sister company to E-Z-GO) in developing our distributor network around the world. Today, many
of our distributor partners are the leading distributors for E-Z-GO and RJ and hold a dominant position in their respective markets.
While they are Yamaha or E-Z-GO distributors, most sell DSG products to all courses regardless of their choice of golf car as a value
add to their customers and to generate additional revenue. We complement this distributor base with independent distributors as needed
to ensure we have sufficient coverage in critical markets.
Currently
DSG is focused on expanding in Europe, Asia and South Africa. The Company plans to expand next into Australia, New Zealand and Latin
America.
Management
Companies
Many
golf facilities are managed by management companies. The portfolios of these companies vary from a few to hundreds of golf courses. Troon®,
the world’s largest player in golf course management, has over 200 courses under management. The management companies provide everything
from branding, staffing, management systems, marketing, and procurement. DSG is currently providing products and services to Troon, OB
Sports, Kemper Sports, Trump, Marriott Golf, Blue Green, Crown Golf, American Golf, Billy Casper, Club Corp, and Club Link.
DSG
has been successful in completing installations and developing relationships with several of the key players who control a substantial
number of courses. DSG will continue to implement system developments that are driven by the needs of these management companies such
as combined reporting, multiple course access through a centralized dashboard. This development will become a competitive advantage for
DSG in the management company market.
DSG
has dedicated a team to create specific collateral for this market and has assigned a senior executive to have direct responsibility
to manage these relationships.
Competition
We
compete with a number of established producers and distributors of vehicle fleet management systems. Our competitors include producers
of golf specific applications, such as GPS Industries, LLC., one of the leading suppliers of golf cart fleet management systems, as well
as producers of non-golf specific utility vehicle fleet management systems, such as Toro. Many of our competitors have longer operating
histories, better brand recognition and greater financial resources than we do. In order for us to successfully compete in our industry
we must:
| |
● |
demonstrate
our products’ competitive advantages; |
| |
|
|
| |
● |
develop
a comprehensive marketing system; and |
| |
|
|
| |
● |
increase
our financial resources. |
However,
there can be no assurance that even if we do these things, we will be able to compete effectively with the other companies in our industry.
We
believe that we will be able to compete effectively in our industry because of the versatility, reliability, and relative affordability
of our products when compared to those of our competitors. We will attempt to build awareness of our competitive advantages among existing
and potential customers through trade shows, sales visits and demonstrations, online marketing, and positive word of mouth advertising.
However,
as we are a newly established company relative to our competitors, we face the same problems as other new companies starting up in an
industry, such as limited access to capital. Our competitors may be substantially larger and better funded than us, and have significantly
longer histories of research, operation and development than us. In addition, they may be able to provide more competitive products than
we can and generally be able to respond more quickly to new or emerging technologies and changes in legislation and regulations relating
to the industry. Additionally, our competitors may devote greater resources to the development, promotion and sale of their products
or services than we do. Increased competition could also result in loss of key personnel, reduced margins or loss of market share, any
of which could harm our business.
Our
primary competitor in the field of golf course fleet management is GPS Industries, a company that was founded in 1996 by our sole officer,
founder and one of our directors, Mr. Bob Silzer. GPS Industries is currently the largest player in the marketplace with an installed
base of approximately 750 golf courses worldwide. GPS Industries was consolidated by various mergers and acquisitions with a diversity
of hardware platforms and application software. Since 2009, when GPS Industries has introduced their latest product offering called the
Visage, in an exclusive partnership with Club Car, their strategy has been to target mostly their existing customers and motivate them
into replacing their existing, older GPS system, with the Visage system.
GPS
Industries is leveraging very heavily their partnership with Club Car, which is one of the three largest golf cart manufacturers in the
world and at times is benefiting from golf operators’ preference for Club Car and their vehicles when they select their management
system.
Market
Mix
Since
the introduction of the DSG product line, we have shown golf course operators that they have now access to a budget-friendly fleet management
tool that works not only on golf carts but also with all other vehicles used on the golf course such as turf maintenance, shuttles, and
other utility vehicles.
Marketing
studies have identified that half of the golf course operators only need a fleet management system and only 15% need a high-end GPS golf
system. This illustrates the strong competitive advantage that VTS TAG Systems has versus GPS Industries since their product can only
address the needs of a relatively small fraction of the marketplace.
Consequently,
GPS Industries’ installed base has steadily declined since most of their new product installations have replaced older product
for existing customers and some customers have opted for a lower budget system and switched over to VTS TAG Systems.
Marketing
Activities
The
Company has a multi-layered approach marketing the TAG suite of products. One of the foundations of this plan is attending industry trade
shows which are well attended by golf operators. The two largest shows are the PGA Merchandise Show and the Golf Industry Show which
are held in Florida at the end of January. The Company also attends a number of regional shows around North America. International events
are attended by our distributors and partners.
The
second layer of marketing is memberships in key organizations such as the National Golf Course Owners Association, Golf Course Superintendents
Association, and Club Managers Association of America. These are very influential in the industry and have marketing channels such as
publications, email blasts, and web-based marketing. The Company also markets directly to course operators through email, surveys direct
mail programs.
Lead
Generation
One
of the primary sources of lead generation is through the Company’s strategic partnerships with E-Z-GO, Yamaha, and Ransomes Jacobson.
These relationships provide the Company with a great deal of market intelligence. The sales forces of the partners work in tandem with
the DSG sales team by passing on the leads, creating joint proposals, and distributing TAG sales material. The Company has also created
co-branded materials for specific value items of interest to operators such as Pace of Play solutions. DSG sale s and marketing staff
attend partner sales events to conduct training and discuss marketing strategies.
The
Company is in the process of testing an internal telemarketing program in several key markets to gauge whether this particular channel
warrants larger scale implementation.
Competitive
Advantages
Pricing
One
of the “heroes” of the TAG System is providing the course operator a range of modular fleet management options that are very
competitively priced. Pricing options range from the TURF, TAG, Infinity 10”, and Infinity XL 12” System, giving the customer
a wide range of pricing options.
Functional
advantages
DSG
has the distinctive advantage of being able to offer a true fleet management system, encompassing all the vehicles on the golf course,
not just the golf carts. Due to the modular nature of the system, customers have now the option to configure their system’s configuration
to match exactly their needs and their budget.
Product
advantages
DSG
products are the robust, reliable, and user-friendly systems in the world. DSG is the only company currently providing systems that are
waterproof with internal batteries to ensure our partners retain the full golf cart manufacturer’s warranty.
Operational
Plan
Our
Operations Department’s main functions are outlined below:
Product
Supply Chain Management
| ● |
Product
procurement, lead-time management |
| ● |
Inventory
Control |
Customer
Service
| ● |
Training |
| ● |
Troubleshooting
& Support |
| ● |
Hardware
Repairs |
Installations
| ● |
Content
& graphics procurement |
| ● |
System
configurations |
| ● |
Shipping
and Installation |
Infrastructure
Management
| ● |
Communication
Servers Management |
| ● |
Cellular
Data Carriers |
| ● |
Service
and administration tools |
Product
Supply Chain
In
order to maintain high product quality and control, and to optimize production costs, the Company is currently procuring all main hardware
components offshore. Final assembly is locally performed to ensure product quality. Other key components are also procured directly from
local manufacturers or suppliers to keep the price as low as possible.
The
Company is requesting the suppliers to perform a complete set of quality testing and minimum 24 hours’ burn-in before the product
is delivered. The local hardware assembler and components supplier offers a 12-month warranty. The main hardware components offshore
supplier offers a warranty plan of 15 months from the date the product is shipped. With an extended 90 days beyond the current warranty,
such repair service would be paid by the supplier except for component replacement costs, which would be paid by DSG.
Another
important activity related to the management of the product supply chain is working closely with the suppliers and ensuring that we have
alternate sources for the main components and identify well in advance any components that may go “end-of-life” and find
suitable replacements before product shortages may occur.
Inventory
Control
The
Company has implemented strict inventory management procedures that govern the inbound flow of products from suppliers, the outgoing
flow to customers as well as the internal movement of inventory between warehouses (Canada, US and UK). There are also procedures in
place to control the flow of equipment returning from customers for repairs and their replacements.
Installation
The
Company is utilizing a small number of its own field engineers, geographically positioned to be in close proximity of areas with high
concentrations of current and future customers. Occasionally, when new installations exceed the internal capacity, the company employs
a number of external contractors, on a project-by-project basis. Each contractor has been trained extensively to perform product installations
and the Company has created an extensive collection of Installation Manuals for all products and vehicle types.
The
product was designed with ease of installation as one of its features. Additionally, the installation process includes a pre-shipping
configuration process that prepares each device with all the settings and graphics content (if applicable) required for the specific
location it will be deployed. This makes the installation process a lot simpler and less time consuming in the field which reduces costs
(accommodations, food, travel) for internal staff as well as external contractor cost (less billable time).
Another
benefit of the simplified installation procedure is increased scalability in anticipation of increased number of installs in the future
by reducing the skill level and training time requirements for additional contractors.
Customer
Service
The
Company has deployed its Customer Service staff strategically, so it has at least one service representative active during business hours
in North America, Europe and South Africa.
The
Company is handling Customer Service directly in North America and UK, offering telephone and on-line support to end-customers. In other
international markets, the first-line customer service is handled by local distributor’s staff while DSG is supplying training
and more advanced support to the distributors.
For
the management of the customer service activities, the Company is utilizing SalesForce.com CRM system which allows creating, updating,
closing and escalation of service cases, including the issuance of RMA (Return Material Authorization) numbers for defective equipment.
Using SalesForce.com also allows generation of management reports for service issues, customer satisfaction, and equipment failures in
order to quickly identify trends, problem accounts or systemic issues.
In
addition, DSG began offering the DSG Par 72 Service & Support Plan to guarantee service and support to client courses in the golf
business, during fiscal 2016. This program for client courses which guarantees service and support programs within 24 hours of a problem
arising.
Product
Development and Engineering
The
Company employs a team of software engineers in house to develop and maintain the main components of the server software and firmware.
All
product development is derived from business needs assessment and customer requests.
The
Product Manager is reviewing periodically the list of feature requests with the Sales, establishes priorities and updates the Product
Roadmap.
The
software engineers are also responsible for developing specialized tools and systems utilized increase efficiency in the operation of
the Company. These projects include functionality such as: automated system monitoring, automatic service alerts, improved remote troubleshooting
tools, cellular data monitoring and reporting. All these tools are critical in future ability to support more customers with less resources,
streamline support, and improve internal efficiency.
All
hardware development (electronics and mechanical) is generally outsourced, however small projects like mounting solutions or cabling
are handled in house.
Material
Contracts
On
March 2, 2020, we entered into an advisory services agreement with a third party. Under the terms of this five-year agreement, the third
party has agreed to provide the Company with strategic brand and business positioning, strategic marketing, concept development and ongoing
strategic consulting services. In consideration of the services to be rendered by the third party, the Company has agreed to (1) make
a cash payment in the amount of $350,000 payable in several tranches following the Company’s completion of future financings of
the Company, and monthly payments of $10,000 following the first twelve months of the engagement, and (2) issue a five-year warrant to
purchase 2,829,859 at an exercise price of $0.25 per share, upon the execution of the agreement (the “First Warrant”), and
a five-year warrant to purchase such number of shares of the Company’s common stock that is equal to 10% of the Company’s
shares of common stock calculated on a fully diluted basis as of the closing date of the future financing, at an exercise price per share
equal to the 80% of the price of the Company’s securities in such future financing less the number of shares represented
by the First Warrant. The warrants contains, among other provisions customary for the instruments of this nature, provisions pertaining
to cashless exercise, and two-year piggy-back registration rights which allows the holders of the warrants to have the shares of the
Company’s common stock underlying the warrants registered alongside other registrable securities of the Company, subject to underwriter
cutbacks in case of underwritten public offering(s) of the Company’s securities, if any.
On
April 17, 2020, the Company received a loan in the principal amount of $29,890 (CDN$40,000) under the Canada Emergency Business Account
program. The loan is non-interest bearing and eligible for CDN$10,000 forgiveness if repaid by December 31, 2022. If not repaid by December
31, 2022, the loan bears interest at 5% per annum and is due on December 31, 2025.
On
April 21, 2020, the Company received a loan in the principal amount of $29,889 (CDN$40,000) under the Canada Emergency Business Account
program. The loan is non-interest bearing and eligible for CDN$10,000 forgiveness if repaid by December 31, 2022. If not repaid by December
31, 2022, the loan bears interest at 5% per annum and is due on December 31, 2025.
On
June 5, 2020, the Company received a loan in the principal amount of $150,000. The loan bears interest at 3.75% per annum and is due
on June 5, 2050. The loan is secured by all tangible and intangible assets of Company. Fixed payments of $731 are due monthly and begin
12 months from the date of the loan.
On
July 10, 2020, we signed a two-year operating lease agreement for retail, showroom and warehouse space in Fairfield, CA expiring on August
31, 2022 and with the first right of refusal for a 3–5-year lease extension, if written notice is provided prior to the expiration
of the current term. The annual rent for the premises starts at $93,000. The lease includes a rent-free period with rent payments commencing
on October 1, 2020.
On
July 14, 2020, we signed a three-year operating lease agreement expiring on July 31, 2023 for office space in Surrey, BC with two rights
to renew, each for an additional two-year term, if written notice is provided no later than 9 months prior to the expiration of the current
term. The annual base rent for the premises starts at CDN$51,552, with additional rent of CDN$1,551 per month for operating expenses.
The lease includes a rent-free period with rent payments commencing on November 1, 2020.
On
December 23, 2020, we entered into a two-year redeemable stock purchase agreement (the “Series F SPA”) with a third party
for the purchase of shares of the Company’s Series F Preferred Stock (“Series F”) at a price of $1,000 per share. In
addition, the Company agreed to issued 3,000,000 Warrants, exercisable into one common share per Warrant at an exercise price of $0.50,
for a term of 5 years and are not eligible for cashless exercise. On the date of the SPA, the third party purchased 1,500 shares of Series
F in exchange for $1,500,000. Further, under the terms of the SPA, the third party agreed to purchase an additional 1,500 shares of Series
F upon the filing by the Company of a registration statement with the Securities and Exchange Commission (the “Registration Statement”)
registering the shares underlying the Series F and underlying the Warrants. At the Company’s request, the third party agrees to
purchase an additional 1,000 shares of Series F every thirty days (an “Additional Closing”) as long as the Registration Statement
remains effective and the Company’s average daily trading volume for the third trading days prior to an Additional Closing is at
least $500,000 per day.
On
September 13, 2021, the Company entered into a securities purchase agreement with a non-related party. Pursuant to the agreement, the
Company received cash proceeds of $2,000,000 on September 13, 2021, in exchange for the issuance of an unsecured promissory note in the
principal amount of $2,400,000, which was inclusive of a $400,000 original issue discount and bears interest at 9% per annum to the holder
and matures June 20, 2022. If the note is not paid in full before December 12, 2021, an additional $100,000 of guaranteed interest will
be added to the note. An additional $100,000 of guaranteed interest will be added to the note on the 12th day of each succeeding
month during which any portion of the note remains unpaid. Any principal or interest on the note that is not paid when due or during
any period of default bears interest at 24% per annum.
In
the event of a default, the note is convertible at the price that is equal to a 40% discount to the lowest trading price of the Company’s
common shares during the 30-day trading period prior to the conversion date.
On
December 1, 2022, the Company issued a promissory note in the principal amount of $1,000,000. The note is unsecured, bears interest at
10% per annum, and is due on December 1, 2025. Any principal or interest on the note that is not paid when due or during any period of
default bears interest at 18% per annum.
Description
of Property
On
July 14, 2020, the Company entered into a three-year operating lease agreement expiring on July 31, 2023 for office space in Surrey,
BC (the “Croyden Lease”) with two rights to renew, each for an additional two-year term, if written notice is provided no
later than 9 months prior to the expiration of the current term. The annual base rent for the premises starts at CDN$51,552, with additional
rent of CDN$1,551 per month for operating expenses. The lease includes a rent-free period with rent payments commencing on November 1,
2020.
On
October 13, 2019, we signed a three-year operating lease agreement expiring on November 30, 2022 with the right to renew for an additional
two-year term if written notice is provided within 10 months prior to the expiration of the current term. The annual rent for the premises
started at approximately $47,400 and commenced on December 1, 2019. On April 1, 2020, the Company terminated this lease.
On
July 10, 2020, the Company entered into a two-year operating lease agreement for retail, showroom and warehouse space in Fairfield, CA
(the “Fairfield Lease”) expiring on August 31, 2022 and with the first right of refusal for a 3–5-year lease extension,
if written notice is provided prior to the expiration of the current term. The annual rent for the premises starts at $93,000. The lease
includes a rent-free period with rent payments commencing on October 1, 2020.
For
the year ended December 31, 2021, the Company made gross operating lease payments of $144,758 which are included in general and administration
expense.
For
the year ended December 31, 2022, the Company made gross operating lease payments of $130,066 which are included in general and administration
expense.
Intellectual
Property
General
Our
success will depend in part on our ability to protect our products and product candidates by obtaining and maintaining a strong proprietary
position both in the United States and in other countries. To develop and maintain our proprietary position, we will rely on patent protection,
trade secrets, know-how, continuing technological innovations and licensing opportunities. In that regard, we retain and rely on the
advice of legal counsel specialized in the field of intellectual property.
Patents
DSG
owns two U.S. patents
| ● |
US
Patent No. 8,836,490 for a “Vehicle Management” was issued September 16, 2014 and expires June 29, 2031. |
| |
|
| ● |
US
Patent No. 9,280,902 for a “Facilities Management” was issued March 8, 2016 and expires January 24, 2032. |
Domain
Names
We
have registered and own the domain name of our websites www.vantage-tag.com, www.dsgtglobal.com, and www.imperiummotorcompany.com.
Copyright
We
own the common law copyright in the contents of our websites (www.vantage-tag.com, www.dsgtglobal.com, www.imperiummotorcompany.com)
and our various promotional materials.
Trademarks
We
own the common-law trademark rights in our corporate name, product names, and associated logos, including “DSG TAG”, “TAG
Golf”, “ECO TAG”, “TAG Text”, “TAG Touch”, “TAG Turf”, “TAG Commercial”
and “TAG Military”. We have not applied to register any trademarks with the U.S. Patent and Trademark Office or with any
other national or multi-national trademark authority. We assert common law trademark rights in our corporate name and those of our subsidiaries.
Employees
As
of March 31, 2023, we have forty full-time employees and contractors in general and administrative, operations, engineering, research
and development, business development, sales and marketing, and finance. We also engage independent contractors and consultants from
time to time on an as-needed basis to supplement our core staff.
Investing
in our common stock involves a high degree of risk. You should carefully consider the risks and uncertainties described below, together
with all of the other information in this Form 10-K, including our consolidated financial statements and related notes, before investing
in our common stock. If any of the following risks materialize, our business, financial condition, results of operations and prospects
could be materially and adversely affected. In that event, the price of our common stock could decline, and you could lose part or all
of your investment.
Risks
Related to Our Business
We
have limited cash on hand and we will require a significant amount of capital to carry out our proposed business plan to import, market
and sell electric vehicles, to continue to expand our fleet management technology sales and service operations, and to manufacture, market
and sell our new line of VANTAGE golf carts. There is no assurance that we will raise sufficient capital to execute our business plan
or to continue to fund operations of our Company. There is substantial doubt as to the ability of our Company to continue as a going
concern.
We
incurred a comprehensive loss of $7,655,826 during the year ended December 31, 2022 ($6,347,178 – December 31, 2021). We had cash
of $53,779 as at December 31, 2022, and our working capital deficit was $6,956,175. As at December 31, 2021 we had cash of $275,383 and
a working capital deficit of $2,314,163. We believe that we will need significant additional equity financing to execute our business
plan and to continue as a going concern, given that, among other things:
| |
● |
we
have begun the importation and homologation of our range of electric vehicles, and we expect to incur significant ramp-up in costs
and expenses through the establishment and supply of our dealership network and the fulfilment of anticipated product orders; |
| |
|
|
| |
● |
we
have endeavoured to manufacture and assemble our new line of Vantage golf carts in North America, and we anticipate significant ramp-up
costs and expenses through the establishment of a manufacturing facility; |
| |
|
|
| |
● |
we
anticipate that the gross profit generated from the sale of our electric vehicle and golf cart offerings will not be sufficient to
cover our operating expenses until we achieve a high volume of sales, and our achieving profitability will depend, in part, on our
ability to materially reduce the bill of materials and per unit manufacturing cost of our products; and |
| |
|
|
| |
● |
we
do not anticipate that we will be eligible to obtain bank loans, or other forms of debt financing on terms that would be acceptable
to us. |
We
anticipate generating a significant loss for the current fiscal year. The report of independent registered public accounting firm on
our audited financial statements includes an explanatory paragraph relating to our ability to continue as a going concern.
We
expect significant increases in costs and expenses to forestall profits for the foreseeable future, even if we generate increased revenues
in the near term. Our recently introduced and planned products might not become commercially successful. If we are to ever achieve profitability,
we must have a successful introduction and acceptance of our electric vehicles and golf carts, which may not occur. We expect that our
operating losses will increase substantially in 2022, and thereafter, and we also expect to continue to incur operating losses and to
experience negative cash flows for the next several years.
There
is no assurance that any amount raised through this offering will be sufficient to continue to fund the operations of our Company.
We
will need additional financing to implement our business plan.
The
Company will need additional financing to fully implement its business plan in a manner that not only continues to expand an already
established direct-to-consumer approach, but also allows the Company to establish a stronger brand name in all the areas in which it
operates. In particular, the Company will need additional financing to:
| |
● |
Effectuate
its business plan and further develop its golf products and service division, and its electric vehicle marketing and distribution
division; |
| |
|
|
| |
● |
Expand
its facilities, human resources, and infrastructure; and |
| |
|
|
| |
● |
Increase
its marketing efforts and lead generation. |
There
are no assurances that additional financing will be available on favourable terms, or at all. If additional financing is not available,
the Company will need to reduce, defer or cancel development programs, planned initiatives and overhead expenditures. The failure to
adequately fund our capital requirements could have a material adverse effect on the Company’s business, financial condition and
results of operations. Moreover, the sale of additional equity securities to raise financing will result in additional dilution to the
Company’s stockholders and incurring additional indebtedness could involve the imposition of covenants that restrict the Company’s
operations.
We
currently have negative operating cash flows, and if we are unable to generate positive operating cash flows in the future our viability
as an operating business will be adversely affected.
We
have made significant up-front investments in research and development, sales and marketing, and general and administrative expenses
to rapidly develop and expand our business. We are currently incurring expenditures related to our operations that have generated a negative
operating cash flow. Operating cash flow may decline in certain circumstances, many of which are beyond our control. We might not generate
sufficient revenues in the near future. Because we continue to incur such significant future expenditures for research and development,
sales, marketing, general, and administrative expenses, we may continue to experience negative cash flow until we reach a sufficient
level of sales with positive gross margins to cover operating expenses. An inability to generate positive cash flow until we reach a
sufficient level of sales with positive gross margins to cover operating expenses or raise additional capital on reasonable terms will
adversely affect our viability as an operating business.
To
carry out our proposed business plan for the next 12 months to develop, manufacture, sell and service electric vehicles we will require
additional capital.
To
carry out our proposed business plan for the next 12 months, we estimate that we will need approximately $35 million in addition to cash
on hand as of December 31, 2022. If cash on hand, revenue from the sale of our cars, if any, and cash received upon the exercise of outstanding
warrants, if any are exercised, are not sufficient to cover our cash requirements, we will need to raise additional funds through the
sale of our equity securities, in either private placements or registered offerings and/or shareholder loans. If we are unsuccessful
in raising enough funds through such capital-raising efforts we may review other financing possibilities such as bank loans. Financing
might not be available to us or, if available, may not be available on terms that are acceptable to us.
Our
ability to obtain the necessary financing to carry out our business plan is subject to a number of factors, including general market
conditions and investor acceptance of our business plan. These factors may make the timing, amount, terms and conditions of such financing
unattractive or unavailable to us. If we are unable to raise sufficient funds, we will have to significantly reduce our spending, delay
or cancel our planned activities or substantially change our current corporate structure. We might not be able to obtain any funding,
and we might not have sufficient resources to conduct our business as projected, either of which could mean that we would be forced to
curtail or discontinue our operations.
Terms
of future financings may adversely impact your investment.
We
may have to engage in common equity, debt or preferred stock financing in the future. Your rights and the value of your investment in
our securities could be reduced. Interest on debt securities could increase costs and negatively impacts operating results. Preferred
stock could be issued in series from time to time with such designation, rights, preferences and limitations as needed to raise capital.
The terms of preferred stock could be more advantageous to those investors than to the holders of common shares. In addition, if we need
to raise equity capital from the sale of common shares, institutional or other investors may negotiate terms at least as, and possibly
more, favourable than the terms of your investment. Common shares which we sell could be sold into any market which develops, which could
adversely affect the market price.
Our
future growth depends upon consumers’ willingness to adopt our range of electric vehicles.
Our
growth highly depends upon the adoption by consumers of, and we are subject to an elevated risk of, any reduced demand for alternative
fuel vehicles in general and electric vehicles in particular. If the market for low speed or for high speed electric vehicles does not
develop as we expect, or develops more slowly than we expect, our business, prospects, financial condition and operating results will
be negatively impacted. The market for alternative fuel vehicles is relatively new, rapidly evolving, characterized by rapidly changing
technologies, price competition, additional competitors, evolving government regulation and industry standards, frequent new vehicle
announcements and changing consumer demands and behaviours. Factors that may influence the adoption of alternative fuel vehicles, and
specifically electric vehicles, include:
| |
● |
perceptions
about electric vehicle quality, safety (in particular with respect to lithium-ion battery packs), design, performance and cost,
especially if adverse events or accidents occur that are linked to the quality or safety of electric vehicles; |
| |
|
|
| |
● |
the
limited range over which electric vehicles may be driven on a single battery charge; |
| |
|
|
| |
● |
the
decline of an electric vehicle’s range resulting from deterioration over time in the battery’s ability to hold a charge; |
| |
|
|
| |
● |
concerns
about electric grid capacity and reliability, which could derail our efforts to promote electric vehicles as a practical solution
to vehicles which require gasoline; |
| |
|
|
| |
● |
the
availability of alternative fuel vehicles, including plug-in hybrid electric vehicles; |
| |
|
|
| |
● |
the
availability of service for electric vehicles; |
| |
|
|
| |
● |
volatility
in the cost of oil and gasoline; |
| |
|
|
| |
● |
government
regulations and economic incentives promoting fuel efficiency and alternate forms of energy; |
| |
|
|
| |
● |
access
to charging stations, standardization of electric vehicle charging systems and consumers’ perceptions about convenience and
cost to charge an electric vehicle; |
The
influence of any of the factors described above may cause current or potential customers not to purchase our electric vehicles, which
would materially adversely affect our business, operating results, financial condition and prospects.
The
range of our electric vehicles on a single charge declines over time which may negatively influence potential customers’ decisions
whether to purchase our vehicles.
The
range of our electric vehicles on a single charge declines principally as a function of usage, time and charging patterns. For example,
a customer’s use of their vehicle as well as the frequency with which they charge the battery of their vehicle can result in additional
deterioration of the battery’s ability to hold a charge. Battery deterioration will be variable as between our various offered
vehicles. Such battery deterioration and the related decrease in range may negatively influence potential customer decisions whether
to purchase our vehicles, which may harm our ability to market and sell our vehicles.
If
we are unable to keep up with advances in electric vehicle technology, we may suffer a decline in our competitive position.
We
may be unable to keep up with changes in electric vehicle technology and, as a result, may suffer a decline in our competitive position.
Any failure to keep up with advances in electric vehicle technology would result in a decline in our competitive position which would
materially and adversely affect our business, prospects, operating results and financial condition. Our research and development efforts
may not be sufficient to adapt to changes in electric vehicle technology. As technologies change we plan to upgrade or adapt our vehicles
and introduce new models to continue to provide vehicles with the latest technology and, in particular, battery cell technology. However,
our vehicles may not compete effectively with alternative vehicles if we are not able to source and integrate the latest technology into
our vehicles. For example, we do not manufacture battery cells which makes us depend upon other suppliers of battery cell technology
for our battery packs.
Demand
in the vehicle industry is highly volatile.
Volatility
of demand in the vehicle industry may materially and adversely affect our business, prospects, operating results and financial condition.
The markets in which we will be competing have been subject to considerable volatility in demand in recent periods. Demand for automobile
sales depends to a large extent on general, economic, political and social conditions in a given market and the introduction of new vehicles
and technologies. As a new start-up manufacturer we will have fewer financial resources than more established vehicle manufacturers to
withstand changes in the market and disruptions in demand.
We
depend on third-parties for our electric vehicle manufacturing needs.
The
delivery of our licensed vehicles to future customers and the revenue derived therefrom depends on the ability of our suppliers, including
Jonway and Skywell, to fulfil their obligations under their respective license and distribution agreement with our company. Fulfilment
of these obligations is outside of our control and depends on a variety of factors, including their respective operations, financial
condition and geopolitical and economic risks that could affect China.. If they are unable to fulfil their obligations or are only able
to partially fulfil their obligations under our existing agreements with them, or if they are forced to terminate our agreements with
them, either as a result of the coronavirus outbreak, the Chinese government’s measures relating thereto or otherwise, we will
not be able to produce or sell our licensed vehicles in the volumes anticipated and on the timetable that we anticipate, if at all.
We
do not currently have all arrangements in place that are required to fully execute our business plan.
To
sell our electric vehicles and VANTAGE golf carts as envisioned we must enter into certain additional agreements and arrangements that
are not currently in place. These include entering into agreements with distributors, arranging for the transportation and storage for
our planned electric vehicles, arranging for a facility for the assembly of our electric vehicles, and obtaining battery and other essential
supplies in the quantities that we require. If we are unable to enter into such agreements or are only able to do so on terms that are
unfavourable to us, we may not be able to fully carry out our business plans.
We
are subject to numerous environmental, and health and safety laws and any breach of such laws may have a material adverse effect on our
business and operating results.
We
are subject to numerous environmental and health and safety laws, including statutes, regulations, bylaws and other legal requirements.
These laws relate to the generation, use, handling, storage, transportation and disposal of regulated substances, including hazardous
substances (such as batteries), dangerous goods and waste, emissions or discharges into soil, water and air, including noise and odors
(which could result in remediation obligations), and occupational health and safety matters, including indoor air quality. These legal
requirements vary by location and can arise under federal, provincial, state or municipal laws. Any breach of such laws and/or requirements
would have a material adverse effect on our Company and its operating results.
Our
vehicles are subject to motor vehicle standards and the failure to satisfy such mandated safety standards would have a material adverse
effect on our business and operating results.
All
vehicles sold must comply with federal, state and provincial motor vehicle safety standards. In both Canada and the United States vehicles
that meet or exceed all federally mandated safety standards are certified under the federal regulations. In this regard, Canadian and
U.S. motor vehicle safety standards are substantially the same. Rigorous testing and the use of approved materials and equipment are
among the requirements for achieving federal certification. Failure by us to have the SOLO, the Tofino or any future model EV satisfy
motor vehicle standards would have a material adverse effect on our business and operating results.
If
we are unable to reduce and adequately control the costs associated with operating our business, including our costs of manufacturing,
sales and materials, our business, financial condition, operating results and prospects will suffer.
If
we are unable to reduce and/or maintain a sufficiently low level of costs for designing, manufacturing, marketing, selling and distributing
and servicing our electric vehicles relative to their selling prices, our operating results, gross margins, business and prospects could
be materially and adversely impacted.
We
have very limited experience servicing our vehicles. If we are unable to address the service and warranty requirements of our future
customers our business will be materially and adversely affected.
If
we are unable to address the service requirements of our future customers our business and prospects will be materially and adversely
affected. In addition, we anticipate the level and quality of the service we will provide our customers will have a direct impact on
the success of our future vehicles. If we are unable to offer satisfactory service to our customers, our ability to generate customer
loyalty, grow our business and sell additional vehicles could be impaired.
We
will continue to encounter substantial competition in our business.
The
Company believes that existing and new competitors will continue to improve their products and services, as well as introduce new products
and services with competitive price and performance characteristics. The Company expects that it must continue to innovate, and to invest
in product development and productivity improvements, to compete effectively in the several markets in which the Company participates.
The Company’s competitors could develop a more efficient product or service or undertake more aggressive and costly marketing campaigns
than those implemented by the Company, which could adversely affect the Company’s marketing strategies and have an adverse effect
on the Company’s business, financial condition and results of operations.
Important
factors affecting the Company’s current ability to compete successfully include:
| |
● |
lead
generation and marketing costs; |
| |
|
|
| |
● |
service
delivery protocols; |
| |
|
|
| |
● |
branded
name advertising; and |
| |
|
|
| |
● |
product
and service pricing. |
In
periods of reduced demand for the Company’s products and services, the Company can either choose to maintain market share by reducing
product and service pricing to meet the competition, or maintain its product and service pricing, which would likely sacrifice market
share. Sales and overall profitability may be reduced in either case. In addition, there can be no assurance that additional competitors
will not enter the Company’s existing markets, or that the Company will be able to continue to compete successfully against its
competition.
The
unavailability, reduction or elimination of government and economic incentives could have a material adverse effect on our business,
financial condition, operating results and prospects.
Any
reduction, elimination or discriminatory application of government subsidies and economic incentives that are offered to purchasers of
EVs or persons installing home charging stations, the reduced need for such subsidies and incentives due to the perceived success of
the electric vehicle, fiscal tightening or other reasons may result in the diminished competitiveness of the alternative fuel vehicle
industry generally or our electric vehicles in particular. This could materially and adversely affect the growth of the alternative fuel
automobile markets and our business, prospects, financial condition and operating results.
If
we fail to manage future growth effectively, we may not be able to market and sell our vehicles successfully.
Any
failure to manage our growth effectively could materially and adversely affect our business, prospects, operating results and financial
condition. We plan to expand our operations in the near future in connection with the planned marketing and sale of our licensed vehicles
and our VANTAGE golf carts. Our future operating results depend to a large extent on our ability to manage this expansion and growth
successfully. Risks that we face in undertaking this expansion include:
| |
● |
training
new personnel |
| |
|
|
| |
● |
forecasting
production, sales and revenue; |
| |
|
|
| |
● |
controlling
expenses and investments in anticipation of expanded operations; |
| |
|
|
| |
● |
establishing
or expanding design, manufacturing, sales and service facilities; |
| |
|
|
| |
● |
implementing
and enhancing administrative infrastructure, systems and processes; |
| |
|
|
| |
● |
addressing
new markets; and |
| |
|
|
| |
● |
establishing
international operations. |
We
intend to continue to hire a number of additional personnel, including design and manufacturing personnel and service technicians, for
our electric vehicles and golf carts. Competition for individuals with experience in designing, manufacturing and servicing electric
vehicles is intense, and we may not be able to attract, assimilate, train or retain additional highly qualified personnel in the future.
The failure to attract, integrate, train, motivate and retain these additional employees could seriously harm our business and prospects.
Our
business may be adversely affected by labour and union activities.
Although
none of our employees are currently represented by a labour union, it is common throughout the automobile industry generally for many
employees at automobile companies to belong to a union, which can result in higher employee costs and increased risk of work stoppages.
We will also directly and indirectly depend upon other companies with unionized work forces, such as parts suppliers and trucking and
freight companies, and work stoppages or strikes organized by such unions could have a material adverse impact on our business, financial
condition or operating results. If a work stoppage occurs within our business, or that of our key suppliers, it could delay the manufacture
and sale of our electric vehicles and have a material adverse effect on our business, prospects, operating results or financial condition.
Additionally, if we expand our business to include full in-house manufacturing of our vehicles, our employees might join or form a labour
union and we may be required to become a union signatory.
We
may become subject to product liability claims, which could harm our financial condition and liquidity if we are not able to successfully
defend or insure against such claims.
We
may become subject to product liability claims, which could harm our business, prospects, operating results and financial condition.
The automobile industry experiences significant product liability claims and we face inherent risk of exposure to claims in the event
our vehicles do not perform as expected or malfunction resulting in personal injury or death. Our risks in this area are particularly
pronounced given we have limited field experience of our vehicles. A successful product liability claim against us could require us to
pay a substantial monetary award. Moreover, a product liability claim could generate substantial negative publicity about our vehicles
and business and inhibit or prevent commercialization of other future vehicle candidates which would have a material adverse effect on
our brand, business, prospects and operating results. We plan to maintain product liability insurance for all our vehicles, but any such
insurance might not be sufficient to cover all potential product liability claims. Any lawsuit seeking significant monetary damages either
in excess of our coverage or outside of our coverage may have a material adverse effect on our reputation, business and financial condition.
We may not be able to secure additional product liability insurance coverage on commercially acceptable terms or at reasonable costs
when needed, particularly if we do face liability for our products and are forced to make a claim under our policy.
We
rely on key executive officers, and their knowledge of our business and technical expertise would be difficult to replace.
We
are highly dependent on our executive officer. If the Company’s senior executive or other key personnel are unable or unwilling
to continue in their present positions, the Company may not be able to replace them easily or at all, and the Company’s business
may be disrupted. Competition for senior management personnel is intense, the pool of qualified candidates is very limited, and we may
not be able to retain the services of our senior executives or attract and retain high-quality senior executives in the future. Such
failure could have a material adverse effect on the Company’s business, financial condition and results of operations.
We
may never pay dividends to our common stockholders.
The
Company currently intends to retain its future earnings to support operations and to finance expansion; accordingly, the Company does
not anticipate paying any cash dividends in the foreseeable future.
The
declaration, payment and amount of any future dividends on common stock will be at the discretion of the Company’s Board of Directors,
and will depend upon, among other things, earnings, financial condition, capital requirements, level of indebtedness and other considerations
the Board of Directors considers relevant. There is no assurance that future dividends will be paid on common stock or, if dividends
are paid, the amount thereof.
Our
common stock is quoted through the OTC Markets, which may have an unfavourable impact on our stock price and liquidity.
The
Company’s common stock is quoted on the OTC Markets, which is a significantly more limited market than the New York Stock Exchange
or NASDAQ. The trading volume may be limited by the fact that many major institutional investment funds, including mutual funds, follow
a policy of not investing in OTC Markets stocks and certain major brokerage firms restrict their brokers from recommending OTC Markets
stocks because they are considered speculative and volatile.
The
trading volume of the Company’s common stock has been and may continue to be limited and sporadic. As a result, the quoted price
for the Company’s common stock on the OTC Markets may not necessarily be a reliable indicator of its fair market value.
Additionally,
the securities of small capitalization companies may trade less frequently and in more limited volume than those of more established
companies. The market for small capitalization companies is generally volatile, with wide price fluctuations not necessarily related
to the operating performance of such companies.
Our
stock price has been volatile, and your investment in our common stock could suffer a decline in value.
There
has been significant volatility in the market price and trading volume of equity securities, which is unrelated to the financial performance
of the companies issuing the securities. These broad market fluctuations may negatively affect the market price of our common stock.
We have, and may in the future, incur rapid and substantial increases or decreases in our stock price that do not coincide in timing
with the disclosure of news or developments by us. The stock market in general, and the market for mining companies in particular, has
experienced extreme volatility that has often been unrelated to the operating performance of particular companies. You may not be able
to resell your shares at or above the price you pay for those shares due to fluctuations in the market price of our Common Stock caused
by changes in our operating performance or prospects and other factors.
Some
specific factors that may have a significant effect on our Common Stock market price include:
| |
● |
actual
or anticipated fluctuations in our operating results or future prospects; |
| |
|
|
| |
● |
our
announcements or our competitors’ announcements of new products; |
| |
|
|
| |
● |
the
public’s reaction to our press releases, our other public announcements and our filings with the SEC; |
| |
|
|
| |
● |
strategic
actions by us or our competitors, such as acquisitions or restructurings; |
| |
|
|
| |
● |
new
laws or regulations or new interpretations of existing laws or regulations applicable to our business; |
| |
|
|
| |
● |
changes
in accounting standards, policies, guidance, interpretations or principles; |
| |
|
|
| |
● |
changes
in our growth rates or our competitors’ growth rates; |
| |
|
|
| |
● |
developments
regarding our patents or proprietary rights or those of our competitors; |
| |
|
|
| |
● |
our
inability to raise additional capital as needed; |
| |
|
|
| |
● |
substantial
sales of Common Stock underlying warrants and preferred stock; |
| |
|
|
| |
● |
concern
as to the efficacy of our products; |
| |
|
|
| |
● |
changes
in financial markets or general economic conditions; |
| |
|
|
| |
● |
sales
of Common Stock by us or members of our management team; and |
| |
|
|
| |
● |
changes
in stock market analyst recommendations or earnings estimates regarding our Common Stock, other comparable companies or our industry
generally. |
Our
future sales of our Common Stock could adversely affect its price and our future capital-raising activities could involve the issuance
of equity securities, which would dilute shareholders’ investments and could result in a decline in the trading price of our Common
Stock.
We
may sell securities in the public or private equity markets if and when conditions are favourable, even if we do not have an immediate
need for additional capital at that time. Sales of substantial amounts of our common stock, or the perception that such sales could occur,
could adversely affect the prevailing market price of our common stock and our ability to raise capital. We may issue additional common
stock in future financing transactions or as incentive compensation for our executive management and other key personnel, consultants
and advisors. Issuing any equity securities would be dilutive to the equity interests represented by our then-outstanding shares of common
stock. The market price for our common stock could decrease as the market takes into account the dilutive effect of any of these issuances.
Furthermore, we may enter into financing transactions at prices that represent a substantial discount to the market price of our common
stock. A negative reaction by investors and securities analysts to any discounted sale of our equity securities could result in a decline
in the trading price of our common stock.
Our
common stock is classified as a “penny stock.”
Rule
3a51-1 of the Securities Exchange Act of 1934 establishes the definition of a “penny stock,” for purposes relevant to us,
as any equity security that has a minimum bid price of less than $5.00 per share or with an exercise price of less than $5.00 per share,
subject to a limited number of exceptions which are not available to us. It is likely that the Company’s common stock will be considered
to be a penny stock for the immediately foreseeable future.
For
any transaction involving a penny stock, unless exempt, the penny stock rules require that a broker or dealer approve a person’s
account for transactions in penny stocks and the broker or dealer receive from the investor a written agreement to the transaction, setting
forth the identity and quantity of the penny stock to be purchased. In order to approve a person’s account for transactions in
penny stocks, the broker or dealer must obtain financial information and investment experience and objectives of the investor, make a
reasonable determination that transactions in penny stocks are suitable for that person, and make a reasonable determination that that
person has sufficient knowledge and experience in financial matters to be capable of evaluating the risks of transactions in penny stocks.
The
broker or dealer must also provide disclosure to its customers, prior to executing trades, about the risks of investing in penny stocks
in both public offerings and in secondary trading, the commissions payable to both the broker-dealer and the registered representative,
and the rights and remedies available to an investor in cases of fraud in penny stock transactions.
Because
of these regulations, broker-dealers may not wish to furnish the necessary paperwork and disclosures and/or may encounter difficulties
in their attempt to buy or sell shares of the Company’s common stock, which may in turn affect the ability of Company stockholders
to sell their shares.
Accordingly,
the penny stock classification adversely affects any market liquidity for the Company’s common stock and subjects the shares to
certain risks associated with trading in penny stocks. These risks include difficulty for investors in purchasing or disposing of shares,
difficulty in obtaining accurate bid and ask quotations, difficulty in establishing the market value of the shares, and a lack of securities
analyst coverage.
Our
success depends on attracting and retaining key personnel.
Our
future plans could be harmed if we are unable to attract or retain key personnel, and our future success will depend, in part, on our
ability to attract and retain qualified management and technical personnel. Equally, our success depends on the ability of our management
and employees to interpret market data correctly and to interpret and respond to economic market and other conditions in order to locate
and adopt appropriate investment opportunities, monitor such investments, and ultimately, if required, to successfully divest such investments.
Further, no assurance can be given that our key personnel will continue their association or employment with us or that replacement personnel
with comparable skills can be found. We have sought to and will continue to ensure that management and any key employees are appropriately
compensated, however, their services cannot be guaranteed. If we are unable to attract and retain key personnel, our business may be
adversely affected.
We
do not know whether we will be successful in hiring or retaining qualified personnel, and our inability to hire qualified personnel on
a timely basis, or the departure of key employees, could materially and adversely affect our development and profitable commercialization
plans, our business prospects, results of operations, and financial condition.
Should
we fail to maintain an effective system of internal controls, we may not be able to accurately report our financial results or prevent
fraud, which could harm our brand and operating results. Our compliance with the annual internal control report requirement for each
fiscal year will depend on the effectiveness of our financial reporting and data systems and controls. Inferior internal controls could
cause investors to lose confidence in our reported financial information, which could have a negative effect on the trading price of
our stock and our access to capital. In addition, our internal control systems rely on people trained in the execution of the controls.
Loss of these people or our inability to replace them with similarly skilled and trained individuals or new processes in a timely manner
could adversely impact our internal control mechanisms.
The
requirements of being a public company may strain our resources, divert management’s attention and affect our ability to attract
and retain qualified board members and officers. Compliance with these rules and regulations increase our legal and financial compliance
costs, make some activities more difficult, time-consuming or costly and increase demand on our systems and resources.
Protecting
our intellectual property is necessary to protect our brand.
We
may not be able to protect important intellectual property and we could incur substantial costs defending against claims that our products
infringe on the proprietary rights of others. Our ability to compete effectively will depend, in part, on our ability to protect our
proprietary system-level technologies, systems designs, and manufacturing processes.
We
will rely on patents, trademarks, and other policies and procedures related to confidentiality to protect our intellectual property.
However, some of our intellectual property is not covered by any patent or patent application. We could incur substantial costs in prosecuting
or defending patent infringement suits or otherwise protecting our intellectual property rights. While we have attempted to safeguard
and maintain our proprietary rights, we do not know whether we have been or will be completely successful in doing so. Moreover, patent
applications and enforcement, thereof, filed in foreign countries may be subject to laws, rules and procedures that are substantially
different from those of the United States, and any resulting foreign patents may be difficult and expensive to enforce. We could incur
substantial costs in prosecuting or defending trademark infringement suits.
Further,
our competitors may independently develop or patent technologies or processes that are substantially equivalent or superior to ours.
In the event we are found to be infringing third party patents, we could be required to pay substantial royalties and/or damages, and
we do not know whether we will be able to obtain licenses to use such patents on acceptable terms, if at all.
Failure
to obtain needed licenses could delay or prevent the development, manufacture, or sale of our products, and could necessitate the expenditure
of significant resources to develop or acquire non-infringing intellectual property.
Asserting,
defending and maintaining our intellectual property rights could be difficult and costly and failure to do so may diminish our ability
to compete effectively and may harm our operating results. As a result, we may need to pursue legal action in the future to enforce our
intellectual property rights, to protect our trade secrets and domain names, and to determine the validity and scope of the proprietary
rights of others. If third parties prepare and file applications for trademarks used or registered by us, we may oppose those applications
and be required to participate in proceedings to determine the priority of rights to the trademark.
Similarly,
competitors may have filed applications for patents, may have received patents and may obtain additional patents and proprietary rights
relating to products or technology that block or compete with ours. We may have to participate in interference proceedings to determine
the priority of invention and the right to a patent for the technology.
Confidentiality
agreements to which we are party may be breached, and we may not have adequate remedies for any breach. Also, our trade secrets may also
be known without breach of such agreements or may be independently developed by competitors. Inability to maintain the proprietary nature
of our technology and processes could allow our competitors to limit or eliminate any competitive advantages we may have.
As
part of our business strategy, we intend to consider acquisitions of companies, technologies and products that we believe could improve
our ability to compete in our core markets or allow us to enter new markets. Acquisitions, involve numerous risks, any of which could
harm our business, including, difficulty in integrating the technologies, products, operations and existing contracts of a target company
and realizing the anticipated benefits of the combined businesses; difficulty in supporting and transitioning customers, if any, of the
target company; inability to achieve anticipated synergies or increase the revenue and profit of the acquired business; potential disruption
of our ongoing business and distraction of management; the price we pay or other resources that we devote may exceed the value we realize;
or the value we could have realized if we had allocated the purchase price or other resources to another opportunity and inability to
generate sufficient revenue to offset acquisition costs.
If
we finance acquisitions by issuing equity securities, our existing stockholders may be diluted; and as a result, if we fail to properly
evaluate acquisitions or investments, we may not achieve the anticipated benefits of any such acquisitions, and we may incur costs in
excess of what we anticipate.
Risks
Relating to Ownership of Our Securities
If
we issue additional shares in the future our existing shareholders will experience dilution.
Our
certificate of incorporation authorizes the issuance of up to 350,000,000 shares of common stock with a par value of $0.001. Our board
of directors may choose to issue some or all of such shares to acquire one or more businesses or to provide additional financing in the
future. The issuance of any such shares will result in a reduction of the book value and market price of the outstanding shares of our
common stock. If we issue any such additional shares, such issuance will cause a reduction in the proportionate ownership and voting
power of all current shareholders. Further, such issuance may result in a change of control of our corporation.
The
price of our common stock could be volatile and could decline following the Offering at a time when you want to sell your holdings.
Numerous
factors, many of which are beyond our control, may cause the market price of our common stock to fluctuate significantly. These factors
include:
| |
● |
quarterly
variations in our results of operations or those of our competitors; |
| |
|
|
| |
● |
delays
in the establishment of manufacturing, assembly, and storage facilities for the distribution of our products; |
| |
|
|
| |
● |
announcements
by us or our competitors of acquisitions, new products, significant contracts, commercial relationships or capital commitments; |
| |
|
|
| |
● |
intellectual
property infringements; |
| |
|
|
| |
● |
our
ability to develop and market new and enhanced products on a timely basis; |
| |
|
|
| |
● |
commencement
of, or our involvement in, litigation; |
| |
|
|
| |
● |
major
changes in our Board of Directors or management, including the departure of Mr. Silzer; |
| |
|
|
| |
● |
changes
in governmental regulations; |
| |
|
|
| |
● |
changes
in earnings estimates or recommendations by securities analysts; |
| |
|
|
| |
● |
the
impact of the COVID-19 pandemic on capital markets; |
| |
|
|
| |
● |
our
failure to generate material revenues; |
| |
|
|
| |
● |
our
public disclosure of the terms of this financing and any financing which we consummate in the future; |
| |
|
|
| |
● |
any
acquisitions we may consummate; |
| |
|
|
| |
● |
announcements
by us or our competitors of significant contracts, new services, acquisitions, commercial relationships, joint ventures or capital
commitments; |
| |
● |
frustration
or cancellation of key contracts; |
| |
|
|
| |
● |
short
selling activities; |
| |
|
|
| |
● |
changes
in market valuations of similar companies; and |
| |
|
|
| |
● |
general
economic conditions and slow or negative growth of end markets. |
Securities
class action litigation is often instituted against companies following periods of volatility in their stock price. This type of litigation
could result in substantial costs to us and divert our management’s attention and resources.
Moreover,
securities markets may from time to time experience significant price and volume fluctuations for reasons unrelated to operating performance
of particular companies, such as the uncertainty associated with the COVID-19 pandemic. These market fluctuations may adversely affect
the price of our common stock and other interests in our company at a time when you want to sell your interest in us.
Our
common stock may be affected by limited trading volume and price fluctuations, which could adversely impact the value of our common stock.
Our
common stock has experienced, and is likely to experience in the future, significant price and volume fluctuations, which could adversely
affect the market price of our common stock without regard to our operating performance. In addition, we believe that factors such as
quarterly fluctuations in our financial results and changes in the overall economy or the condition of the financial markets could cause
the price of our common stock to fluctuate substantially. These fluctuations may also cause short sellers to periodically enter the market
in the belief that we will have poor results in the future. We cannot predict the actions of market participants and, therefore, can
offer no assurances that the market for our common stock will be stable or appreciate over time.
Future
sales or perceived sales of our common stock could depress our stock price.
If
the holders of our presently issued our future issued common stock were to attempt to sell a substantial amount of their holdings at
once, the market price of our common stock could decline. Moreover, the perceived risk of this potential dilution could cause shareholders
to attempt to sell their shares and investors to short the common stock, a practice in which an investor sells shares that he or she
does not own at prevailing market prices, hoping to purchase shares later at a lower price to cover the sale. As each of these events
would cause the number of shares of our common stock being offered for sale to increase, our common stock market price would likely further
decline. All of these events could combine to make it very difficult for us to sell equity or equity-related securities in the future
at a time and price that we deem appropriate.
Trading
on the OTC Markets may be volatile and sporadic, which could depress the market price of our common stock and make it difficult for our
stockholders to resell their shares.
Our
common stock is quoted on OTC Markets. Trading in stock quoted on OTC Markets is often thin and characterized by wide fluctuations in
trading prices due to many factors that may have little to do with our operations or business prospects. This volatility could depress
the market price of our common stock for reasons unrelated to operating performance. Moreover, OTC Markets is not a stock exchange, and
trading of securities on the OTC Markets is often more sporadic than the trading of securities listed on a quotation system like NASDAQ
or a stock exchange like the American Stock Exchange. Accordingly, our shareholders may have difficulty reselling any of their shares.
Our
stock is a penny stock. Trading of our stock may be restricted by the SEC’s penny stock regulations and FINRA’s sales practice
requirements, which may limit a stockholder’s ability to buy and sell our stock.
Our
stock is a penny stock. The Securities and Exchange Commission has adopted Rule 15g-9 which generally defines “penny stock”
to be any equity security that has a market price (as defined) less than $5.00 per share or an exercise price of less than $5.00 per
share, subject to certain exceptions. Our securities are covered by the penny stock rules, which impose additional sales practice requirements
on broker-dealers who sell to persons other than established customers and “accredited investors”. The term “accredited
investor” refers generally to institutions with assets in excess of $5,000,000 or individuals with a net worth in excess of $1,000,000
or annual income exceeding $200,000 or $300,000 jointly with their spouse. The penny stock rules require a broker-dealer, prior to a
transaction in a penny stock not otherwise exempt from the rules, to deliver a standardized risk disclosure document in a form prepared
by the SEC which provides information about penny stocks and the nature and level of risks in the penny stock market. The broker-dealer
also must provide the customer with current bid and offer quotations for the penny stock, the compensation of the broker-dealer and its
salesperson in the transaction and monthly account statements showing the market value of each penny stock held in the customer’s
account. The bid and offer quotations, and the broker-dealer and salesperson compensation information, must be given to the customer
orally or in writing prior to effecting the transaction and must be given to the customer in writing before or with the customer’s
confirmation. In addition, the penny stock rules require that prior to a transaction in a penny stock not otherwise exempt from these
rules, the broker-dealer must make a special written determination that the penny stock is a suitable investment for the purchaser and
receive the purchaser’s written agreement to the transaction. These disclosure requirements may have the effect of reducing the
level of trading activity in the secondary market for the stock that is subject to these penny stock rules. Consequently, these penny
stock rules may affect the ability of broker-dealers to trade our securities. We believe the penny stock rules discourage investor interest
in, and limit the marketability of, our common stock.
FINRA
sales practice requirements may also limit a stockholder’s ability to buy and sell our stock.
In
addition to the “penny stock” rules promulgated by the Securities and Exchange Commission (see above for a discussion of
penny stock rules), FINRA rules require that in recommending an investment to a customer, a broker-dealer must have reasonable grounds
for believing that the investment is suitable for that customer. Prior to recommending speculative low-priced securities to their non-institutional
customers, broker-dealers must make reasonable efforts to obtain information about the customer’s financial status, tax status,
investment objectives and other information. Under interpretations of these rules, FINRA believes that there is a high probability that
speculative low-priced securities will not be suitable for at least some customers. FINRA requirements make it more difficult for broker-dealers
to recommend that their customers buy our common stock, which may limit your ability to buy and sell our stock and have an adverse effect
on the market for our shares.
Our
business is subject to changing regulations related to corporate governance and public disclosure that have increased both our costs
and the risk of noncompliance.
Because
our common stock is publicly traded, we are subject to certain rules and regulations of federal, state and financial market exchange
entities charged with the protection of investors and the oversight of companies whose securities are publicly traded. These entities,
including the Public Company Accounting Oversight Board, the SEC and FINRA, have issued requirements and regulations and continue to
develop additional regulations and requirements in response to corporate scandals and laws enacted by Congress, most notably the Sarbanes-Oxley
Act of 2002. Our efforts to comply with these regulations have resulted in, and are likely to continue resulting in, increased general
and administrative expenses and diversion of management time and attention from revenue-generating activities to compliance activities.
Because new and modified laws, regulations and standards are subject to varying interpretations in many cases due to their lack of specificity,
their application in practice may evolve over time as new guidance is provided by regulatory and governing bodies. This evolution may
result in continuing uncertainty regarding compliance matters and additional costs necessitated by ongoing revisions to our disclosure
and governance practices.
Provisions
in our articles of incorporation and bylaws could discourage a change in control, or an acquisition of us by a third party, even if the
acquisition would be favourable to you, thereby adversely affecting existing shareholders.
Our
articles of incorporation and bylaws contain provisions that may have the effect of making more difficult or delaying attempts by others
to obtain control of our Company, even when these attempts may be in the best interests of our shareholders. For example, our articles
of incorporation authorize our Board of Directors, without stockholder approval, to issue one or more series of preferred stock, which
could have voting and conversion rights that adversely affect or dilute the voting power of the holders of common stock. These provisions
and others that could be adopted in the future could deter unsolicited takeovers or delay or prevent changes in our control or management,
including transactions in which stockholders might otherwise receive a premium for their shares over then-current market prices. These
provisions may also limit the ability of stockholders to approve transactions that they may deem to be in their best interests.
Because
Robert Silzer, our Chief Executive Officer and Chairman, controls a significant number of shares of our voting capital stock, he has
effective control over actions requiring stockholder approval.
Robert
Silzer, our Chairman and Chief Executive Officer, holds 2,019 shares of our common stock and 150,376 shares of Series A Preferred stock,
which are entitled to vote with holders of the common stock as a class at the rate of 665 votes per share of Series A Preferred stock
(100,000,040 votes, or approximately 75.0% of votes). In addition, our Directors James Singerling and Stephen Johnston each holds 25,000
shares of Series A Preferred stock (16,625,000 votes, or approximately 12.5% of aggregate votes each). As a result, Mr. Silzer, Singerling
and Johnston control 133,250,040 or approximately 92% of shares entitled to vote, and have the ability to control the outcome of matters
submitted to our stockholders for approval, including the election of directors and any merger, consolidation or sale of all or substantially
all of our assets. In addition, they have the ability to control the management and affairs of our company. Accordingly, any investors
who purchase shares will be minority shareholders and as such will have little to no say in the direction of us and the election of directors.
Additionally, this concentration of ownership might harm the market price of our common stock by:
| |
● |
delaying,
deferring or preventing a change in corporate control; |
| |
● |
impeding
a merger, consolidation, takeover or other business combination involving us; or |
| |
● |
discouraging
a potential acquirer from making a tender offer or otherwise attempting to obtain control of us. |
We
may never pay dividends to our common stockholders.
So
long as any shares of our senior ranking Series A, B, C, D, or E Preferred Stock are outstanding, the Company may not declare, pay or
set apart for payment any dividend or make any distribution on the common stock. Furthermore, each of the 3,805 shares of Series F Preferred
stock outstanding as of the date of this Quarterly report is entitled, until converted or redeemed, to receive cumulative dividends of
10% per annum, payable quarterly, in cash or Preferred Shares.
Subject
to our obligation to pay Series F Preferred stock dividends, and regardless of restrictions imposed by our other series of Preferred
Stock, we currently intend to retain all available funds and any future earnings for use in the operation of our business and do not
anticipate paying any non-compulsory dividends on our preferred stock or common stock in the foreseeable future, if at all. Any future
determination to declare dividends will be made at the discretion of our Board of Directors and will depend on our financial condition,
results of operations, capital requirements, general business conditions and other factors that our Board of Directors may deem relevant.
Any return to stockholders will therefore be limited to the increase, if any, of our share price that stockholders may be able to realize
if they sell their shares.
| ITEM
1B. |
UNRESOLVED
STAFF COMMENTS |
None.
Our
principal executive office is located at 207-15272 Croydon Drive, Surrey, BC, V3Z 0Z5 Canada, where we lease approximately 2,024 square
feet of office space. On July 14, 2020, the Company entered into a three-year operating lease agreement expiring on July 31, 2023 for
office space in Surrey, BC with two rights to renew, each for an additional two-year term, if written notice is provided no later than
9 months prior to the expiration of the current term. The annual base rent for the premises starts at CDN$51,552, with additional rent
of CDN$1,551 per month for operating expenses. The lease includes a rent-free period with rent payments commencing on November 1, 2020.
| ITEM
3. |
LEGAL
PROCEEDINGS |
On
September 7, 2016, Chetu Inc. has filed a Complaint for Damage in Florida to recover unpaid invoice amounts of $27,335 plus interest
of $4,939. The invoice was not paid due to a dispute that the Company did not think that vendor had delivered the service according to
the agreement between the two parties. As at December 31, 2022, included in trade and other payables is $17,983 (December 31, 2021 -
$29,329) related to this unpaid invoice, interest and legal fees.
We
may, from time to time, be party to litigation and subject to claims incident to the ordinary course of business. As our growth continues,
we may become party to an increasing number of litigation matters and claims. The outcome of litigation and claims cannot be predicted
with certainty, and the resolution of any future matters could materially affect our future financial position, results of operations
or cash flows.
| ITEM
4. |
MINE
SAFETY DISCLOSURES |
Not
applicable.
PART
II
| ITEM
5. |
MARKET
FOR REGISTRANT’S COMMON EQUITY, RELATED STOCKHOLDER MATTERS AND ISSUER PURCHASES OF EQUITY SECURITIES |
Market
Information for Common Stock
Our
common stock is currently quoted on the OTC Market’s OTCQB Venture Marketplace (“OTCQB”) under the symbol “DSGT”.
The following table sets forth for the periods indicated the high and low bid price per share of our common stock as reported on the
OTCQB. The following quotations reflect inter-dealer prices, without retail mark-up, mark-down or commission, and may not represent actual
transactions:
OTC
Markets Group Inc. OTCQB (1)
| Quarter Ended | |
High $ | | |
Low $ | |
| | |
| | |
| |
| December 31, 2022 | |
| 0.10 | | |
| 0.04 | |
| September 30, 2022 | |
| 0.17 | | |
| 0.05 | |
| June 30, 2022 | |
| 0.08 | | |
| 0.04 | |
| March 31, 2022 | |
| 0.15 | | |
| 0.07 | |
| December 31, 2021 | |
| 0.35 | | |
| 0.13 | |
| September 30, 2021 | |
| 0.33 | | |
| 0.13 | |
| June 30, 2021 | |
| 0.48 | | |
| 0.18 | |
| March 31, 2021 | |
| 1.23 | | |
| 0.34 | |
(1)
Over-the-counter market quotations reflect inter-dealer prices without retail mark-up, mark-down or commission, and may not represent
actual transactions.
Holders
of Record
As
of December 31, 2022, there were 98 holders of record of our common stock. The actual number of stockholders is greater than this number
of record holders and includes stockholders who are beneficial owners but whose shares are held in street name by brokers and other nominees.
Dividend
Policy
We
have never declared or paid cash dividends on our common stock. We currently intend to retain all available funds and any future earnings
for use in the operation of our business and do not anticipate paying any dividends on our common stock in the foreseeable future, if
at all. Any future determination to declare dividends will be made at the discretion of our board of directors and will depend on our
financial condition, results of operations, capital requirements, general business conditions and other factors that our board of directors
may deem relevant.
Purchases
of Equity Securities by the Issuer and Affiliated Purchasers
We
did not purchase any of our shares of common stock or other securities during 2022 and 2021.
Recent
Sale of Unregistered Securities
On
January 4, 2022, pursuant to the December Series 2021 F SPA, the Company received $250,000 for the subscription of 250 Series F preferred
shares. These shares were issued on April 1, 2022, and were recorded as such.
On
February 7, 2022, pursuant to the December 2021 Series F SPA, the Company received $250,000 for the subscription of 250 Series F preferred
shares.
On
March 31, 2022, pursuant to the December 2021 Series F SPA, the Company received $250,000 for the subscription of 250 Series F preferred
shares. The shares were issued on April 1, 2022.
On
July 29, 2022, pursuant to the December 2021 Series F SPA, the Company received $90,000 for the subscription of 90 Series F preferred
shares, as well as issued 368 Series F preferred shares to settle $368,000 in dividends payable.
On
August 29, 2022, pursuant to the December 2021 Series F SPA, the Company received $250,000 for the subscription of 250 Series F preferred
shares.
On
September 15, 2022, pursuant to the December 2021 Series F SPA, the Company received $125,000 for the subscription of 125 Series F preferred
shares. The shares were issued on October 18, 2022.
On
October 21, 2022, pursuant to the December 2021 Series F SPA, the Company received $410,000 for the subscription of 410 Series F preferred
shares, as well as issued 96 Series F preferred shares to settle $96,000 in dividends payable.
| ITEM
6. |
SELECTED
FINANCIAL DATA |
We
are a smaller reporting company as defined by Rule 12b-2 of the Exchange Act and are not required to provide the information required
under this item.
| ITEM
7. |
MANAGEMENT’S
DISCUSSION AND ANALYSIS OF FINANCIAL CONDITION AND RESULTS OF OPERATIONS |
You
should read the following discussion and analysis of our financial condition and results of operations in conjunction with the consolidated
financial statements and the related notes to the consolidated financial statements included later in this Annual Report on Form 10-K.
In addition to historical financial information, the following discussion contains forward-looking statements that reflect our plans,
estimates, beliefs, and expectations that involve risks and uncertainties. Our actual results and the timing of events could differ materially
from those discussed in these forward-looking statements. Factors that could cause or contribute to these differences include those discussed
below and elsewhere in this Annual Report on Form 10-K, particularly in “Risk Factors” and “Special Note Regarding
Forward-Looking Statements.”
Business
Overview
DSG
Global, Inc., under the brand name Vantage Tag Systems Inc. (“VTS”) provides patented electronic tracking systems and fleet
management solutions to golf courses and other avenues that allow for remote management of the course’s fleet of golf carts, turf
equipment and utility vehicles. Their clients use VTS’s unique technology to significantly reduce operational costs, improve the
efficiency plus profitability of their fleet operations, increase safety, and enhance customer satisfaction. VTS has grown to become
a leader in the category of Fleet Management in the golf industry, with its technology installed in vehicles worldwide. VTS is now aggressively
branching into several new streams of revenue, through programmatic advertising, licensing and distribution, as well as expanding into
Commercial Fleet Management, a single rider golf cart and Agricultural applications. Additional information is available at http://vantage-tag.com/
Ready
Golf Ready: Our roots as a company are in golf, and our technology is changing the way golf is being played and driving new revenue for
courses.
| ● |
Vantage
TAG equipped golf carts enhance fleet management. |
| |
|
| ● |
Single
rider carts speed up pace of play and drive rental revenue. |
| |
|
| ● |
Onboard
touchscreens drive revenue and offer an enhanced course experience. |
| |
|
| ● |
Combination
of technology and single rider carts has the ability to decrease average play time to 2:20 and drive numerous extra plays per hour.
|
| |
|
| ● |
Our
“Pennies A Day, Pennies A Round” model provides easy entry to leasing single-rider vehicles. |
In
Development: DSG’s Infinity On-Board Screen Offers Gaming Revenue Potential
| ● |
In
the next 2 years, sports betting will generate $10B / licensed in 20+ States. |
| |
|
| ● |
In
negotiations with leading mobile gaming developers. |
| |
|
| ● |
DSG’s
existing infinity screens work with current gaming technology. |
Business
Unit Overview: On Board Media
| ● |
38,000
courses globally. |
| |
|
| ● |
26,000
courses capable of installing the DSG TAG SYSTEM with the TAG and INFINITIY. |
| |
|
| ● |
Courses
with INFINITY screens in carts can generate $90,000 - $110,000 in additional revenue. |
| ● |
Screens
for free and own revenue generated by 250 golf courses. |
| |
|
| ● |
DSG
single-rider golf cars are available in any quantity for most courses on a revenue share basis with no upfront cost to the golf course.
|
| |
|
| ● |
Programmatic
Advertising has the ability to increase revenue 4x more than standard advertising, an average increase of $200,000 - $300,000 per
course. |
Business
Unit Overview: TAG / Fleet Management Vantage Golf Potential:
| ● |
38,000
courses globally. |
| |
|
| ● |
4
Million golf carts in the world market. |
| |
|
| ● |
DSG
Tech on 300 courses now, with an additional 500 courses added in 2020 driving $15 million in sales. |
| |
|
| ● |
Key
component of our “Pennies A Day, Pennies A Round” program. |
Reverse
Acquisition
DSG
Global, Inc. (formerly Boreal Productions Inc.) was incorporated under the laws of the State of Nevada on September 24, 2007. We were
formed to option feature films and TV projects to be packaged and sold to movie studios and production companies.
In
January 2015, we changed our name to DSG Global, Inc. and effected a one-for-three reverse stock split of our issued and outstanding
common stock in anticipation of entering in a share exchange agreement with DSG TAG Systems, Inc., a corporation incorporated under the
laws of the State of Nevada on April 17, 2008 and extra provincially registered in British Columbia, Canada in 2008.
On
April 13, 2015, we entered into a share exchange agreement with Vantage Tag Systems Inc. (“VTS”) (formerly DSG Tag Systems
Inc.) and the shareholders of VTS who become parties to the agreement. Pursuant to the terms of the share exchange agreement, we agreed
to acquire not less than 75% and up to 100% of the issued and outstanding common shares in the capital stock of VTS in exchange for the
issuance to the selling shareholders of up to 20,000,000 pre-reverse split shares of our common stock on the basis of 1 common share
for 5.4935 common shares of VTS.
On
May 6, 2015, we completed the acquisition of approximately 75% (82,435,748 common shares) of the issued and outstanding common shares
of VTS as contemplated by the share exchange agreement by issuing 15,185,875 pre-reverse split shares of our common stock to shareholders
of VTS who became parties to the agreement. In addition, concurrent with the closing of the share exchange agreement, we issued an additional
179,823 pre-reverse split shares of our common stock to Westergaard Holdings Ltd. in partial settlement of accrued interest on outstanding
indebtedness of VTS.
Following
the initial closing of the share exchange agreement and through October 22, 2015, we acquired an additional 101,200 shares of common
stock of VTS from shareholders who became parties to the share exchange agreement and issued to these shareholders an aggregate of 18,422
pre-reverse split shares of our common stock. Following completion of these additional purchases, DSG Global Inc. owns approximately
100% of the issued and outstanding shares of common stock of VTS. An aggregate of 4,229,384 shares of Series A Convertible Preferred
Stock of VTS were exchanged for 51 Series B and 3,000,000 Series E preferred shares during the year ended December 31, 2018 by Westergaard
Holdings Ltd., an affiliate of Keith Westergaard, a previous member of our board of directors which have not been issued as of December
31, 2020.
The
reverse acquisition was accounted for as a recapitalization effected by a share exchange, wherein VTS is considered the acquirer for
accounting and financial reporting purposes. The assets and liabilities of the acquired entity have been brought forward at their book
value and no goodwill has been recognized. We adopted the business and operations of VTS upon the closing of the share exchange agreement.
Factors
Affecting Our Performance
We
believe that the growth of our business and our future success depend on various opportunities, challenges, and other factors, including
the following:
Inventory
Sourcing
In
order to successfully deliver products, increase sales, and maintain customer satisfaction, we continue to source new, reliable suppliers
of our hardware units and components at competitive prices. Presently, we out-source our INFINITY, TAG and Vantage Golf Carts from suppliers
in China, which continues to provide us with higher quality, newer technology at competitive pricing.
In
addition, DSG is currently in negotiations with a telecommunications provider to provide new technology in hardware and wireless access.
However, there is no guarantee that we will conclude any agreement in this regard.
Competition
We
compete with a number of established producers and distributors of vehicle fleet management systems, as well as producers of non-golf
specific utility vehicle fleet management systems. Many of our competitors have longer operating histories, better brand recognition
and greater financial resources than we do. In order for us to successfully compete in our industry we must demonstrate our products’
competitive advantages, develop a comprehensive marketing strategy, and increase our financial resources.
We
believe that we will be able to compete effectively in our industry because of the versatility, reliability, and relative affordability
of our products when compared to those of our competitors. We will attempt to build awareness of our competitive advantages among existing
and potential customers through trade shows, sales visits and demonstrations, online marketing, and positive word of mouth advertising.
However, there can be no assurance that even if we do these things, we will be able to compete effectively with the other companies in
our industry.
Additional
Capital
We
require additional capital to continue to develop software and products, meet our contractual obligations, and execute our business plan.
There can be no assurances that we will be able to raise additional capital on acceptable terms or at all, which would adversely affect
our ability to achieve our business objectives.
Components
of Our Results of Operations
Revenue
The Company reports four operating
segments, GPS Devices, Golf Carts, Electric Vehicles and Administrative.
GPS
Devices
In this segment revenue is recognized for sales of the Tag system hardware
either by direct sales to those customers who purchase or lease our TAG system hardware, rental of the units, and monthly service fees
paid by all customers for the wireless data fee charges required to operate the GPS tracking on the TAG systems. The Company offers different
levels of the system from a base model up to an advanced system (a TAG, a TAG and TEXT, or a TAG and INFINITY).
Golf
Carts
Golf
Cart Sales Revenue consists of the sales price paid by the customers who purchase our Vantage and licensed Shelby golf carts.
Electric
Vehicles
Electric
fleet sales revenue is a new source of revenue which consists primarily of wholesale distribution sales of our electronic fleet including
vehicles, e-bikes and e-scooters. Golf cart sales are also included within this source of revenue.
Administrative
Expenses
related to the overall operations of the Company not associated with a specific revenue segment
In
Planning
Programmatic
advertising revenue is a new source of revenue that we believe has the potential to be strategic for us in the future. We
are in the process of implementing and designing software to provide advertising and other media functionality on our INFINITY
units. No costs have been incurred yet for this project.
We
recognize revenue when it satisfies a performance obligation by transferring control over a product to a customer. Revenue is measured
based on the consideration the Company expects to receive in exchange for those products. In instances where final acceptance of the
product is specified by the customer, revenue is deferred until all acceptance criteria have been met. We accrue for warranty costs,
sales returns, and other allowances based on its historical experience.
Our
revenue recognition policies are discussed in more detail under “Note 3 – Summary of Significant Accounting Policies”
in the notes to our Consolidated Financial Statements included in Part I, Item 1 of this Form 10-K.
Cost
of Revenue
Our
cost of revenue consists primarily of hardware purchases, wireless data fees, mapping, installation costs, freight expenses and inventory
adjustments.
Hardware
purchases. Our equipment purchases consist primarily of TAG system control units, TEXT display, and INFINITY displays. The TAG
system control unit is sold as a stand-alone unit or in conjunction with our TEXT alphanumeric display or INFINITY high definition “touch
activated” display. Hardware purchases also include costs of components used during installations, such as cables, mounting solutions,
and other miscellaneous equipment.
Wireless
data fees. Our wireless data fees consist primarily of the data fees charged by outside providers of GPS tracking used in all
of our TAG system control units.
Mapping.
Our mapping costs consist of aerial mapping, course map, geofencing, and 3D flyovers for golf courses. This cost is incurred
at the time of hardware installation.
Installation.
Our installation costs consist primarily of costs incurred by our employed service technicians for the cost of travel, meals,
and miscellaneous components required during installations. In addition, these costs also include fees paid to external contractors for
installations on a project-by-project basis.
Freight
expenses and Inventory adjustments. Our freight expenses consist primarily of costs to ship hardware to courses for installations.
Our inventory adjustments include inventory write offs, write downs, and other adjustments to the cost of inventory.
Operating
expenses & other income (expenses) We classify our operating expenses and other income (expenses) into six categories: compensation,
general and administrative, warranty, foreign currency exchange, and finance costs. Our operating expenses consist primarily of sales
and marketing, salaries and wages, consulting fees, professional fees, trade shows, software development, and allocated costs. Allocated
costs include charges for facilities, office expenses, telephones and other miscellaneous expenses. Our other income (expenses) primarily
consists of financing costs and foreign exchange gains or losses.
Compensation
expense. Our compensation expenses consist primarily of personnel costs, such as employee salaries, payroll expenses, and employee
benefits. This includes salaries for management, administration, engineering, sales and marketing, and service support technicians. Salaries
and wages directly related to projects or research and development are expensed as incurred to their operating expense category.
General
and administrative. Our general and administrative expenses consist primarily of sales and marketing, commissions, travel, trade
shows, consultant fees, insurance, and compliance and other administrative functions, as well as accounting and legal professional services
fees, allocated costs and other corporate expenses. Sales and marketing includes brand marketing, marketing materials, and media management.
Warranty
expense (recovery). Our warranty expenses consist primarily of associated material product costs, labour costs for technical
support staff, and other associated overhead. Warranty costs are expensed as they are incurred.
Bad
debt. Our bad debt expense consists primarily of amounts written down for doubtful accounts recorded on trade receivables.
Depreciation
and amortization. Our depreciation and amortization costs consist primarily of depreciation and amortization on fixed assets,
equipment on lease and intangible assets.
Foreign
currency exchange. Our foreign currency exchange consists primarily of foreign exchange fluctuations recorded in Canadian dollar
(CAD), British Pounds (GBP), or Euro (EUR) at the rates of exchange in effect when the transaction occurred.
Finance
costs. Our finance costs consist primarily of investor interest expense, investor commission fees, and other financing charges
for obtaining debt financing.
We
expect to continue to invest in corporate infrastructure and incur additional expenses associated with being a public company, including
increased legal and accounting costs, investor relations costs, higher insurance premiums and compliance costs associated with Section
404 of the Sarbanes-Oxley Act of 2002. In addition, we expect sales and marketing expenses to increase in absolute dollars in future
periods. In particular, we expect to incur additional marketing costs to support the expansion of our offerings in new markets like commercial
fleet management and agriculture.
Results
of Operations
The
following tables set forth our consolidated results of operations as a percentage of revenue for the periods presented:
| | |
For the year ended | |
| | |
December 31, 2022 | | |
December 31, 2021 | |
| Revenue | |
| 100.0 | % | |
| 100.0 | % |
| Cost of revenue | |
| 54.3 | % | |
| 53.1 | % |
| Gross profit | |
| 45.7 | % | |
| 46.9 | % |
| Operating expenses | |
| | | |
| | |
| Compensation expense | |
| 92.2 | % | |
| 144.2 | % |
| General and administration expense | |
| 89.4 | % | |
| 165.7 | % |
| Research and development | |
| 1.4 | % | |
| 18.5 | % |
| Bad debt | |
| (0.8 | )% | |
| 2.4 | % |
| Depreciation and amortization expense | |
| 0.4 | % | |
| 0.6 | % |
| Total operating expense | |
| 182.6 | % | |
| 331.4 | % |
| Loss from operations | |
| (136.9 | )% | |
| (284.5 | )% |
| Other income (expense) | |
| | | |
| | |
| Foreign currency exchange | |
| (0.7 | )% | |
| (2.9 | )% |
| Other (expenses) income | |
| - | % | |
| 0.6 | % |
| Redemption premium | |
| (0.1 | )% | |
| - | % |
| Gain (loss) on sale | |
| (0.1 | )% | |
| - | % |
| Gain (loss) on disposal | |
| 0.1 | % | |
| - | % |
| Gain (loss) on extinguishment of debt | |
| 1.1 | % | |
| 1.7 | % |
| Finance costs | |
| (60.2 | )% | |
| (20.1 | )% |
| Total other expense | |
| (59.9 | )% | |
| (20.6 | )% |
| Loss before income taxes | |
| (196.9 | )% | |
| (305.1 | )% |
| Provision for income taxes | |
| - | % | |
| - | % |
| Net loss | |
| (196.9 | )% | |
| (305.1 | )% |
| Other comprehensive income (expense) | |
| | | |
| | |
| Foreign currency translation adjustments | |
| 1.5 | % | |
| 1.8 | % |
| Comprehensive loss | |
| (195.4 | )% | |
| (303.3 | )% |
Comparison
of the Years Ended December 31, 2022 and 2021
Revenue
| | |
For the Years Ended December 31, | | |
| |
| | |
2022 | | |
2021 | | |
% Change | |
| Revenue | |
$ | 3,833,853 | | |
$ | 2,092,819 | | |
| 83.2 | % |
Revenue
increased by $1,741,034 or 83.2%, for the year ended December 31, 2022 as compared to year ended December 31, 2021. Sales increased for
the year ended, year over year, as the result of overcoming challenges related to COVID-19 and aggressive marketing and installation
of new product. This compares to the comparative period in which the Company experienced a decrease of revenue due to Covid-19.
Cost
of Revenue
| | |
For the Years Ended December 31, | | |
| |
| | |
2022 | | |
2021 | | |
% Change | |
| Cost of revenue | |
$ | 2,082,968 | | |
$ | 1,110,698 | | |
| 87.5 | % |
Cost
of revenue increased by $972,270 or 87.5%, for the year ended December 31, 2022 as compared to the year ended December 31, 2021. The
table below outlines the differences in detail:
| | |
For the Years Ended | |
| | |
December 31, 2022 | | |
December 31, 2021 | | |
Difference | | |
% Difference | |
| Cost of goods | |
$ | 1,986,013 | | |
$ | 993,869 | | |
$ | 992,144 | | |
| 99.8 | % |
| Mapping & freight costs | |
| 25,474 | | |
| 41,143 | | |
| (15,669 | ) | |
| (38.1 | )% |
| Wireless fees | |
| 71,481 | | |
| 75,686 | | |
| (4,205 | ) | |
| (5.6 | )% |
| | |
| | | |
| | | |
| | | |
| | |
| | |
$ | 2,082,968 | | |
$ | 1,110,698 | | |
$ | 972,270 | | |
| 87.5 | % |
Cost
of sales increased for the years ended, year over year, primarily due to increase of price of product sold. This increase was consistent
with the increase in revenue for the same period. Product costs increased due to the increase in raw materials and shipping costs that occurred because of global logistical
issues as a result of covid-19.
Compensation
Expense
| | |
For the Years Ended December 31, | | |
| |
| | |
2022 | | |
2021 | | |
% Change | |
| Compensation expense | |
$ | 3,534,816 | | |
$ | 3,017,181 | | |
| 17.2 | % |
Compensation
expense increased by $517,635 or 17.2%, for the year ended December 31, 2022 as compared to the year ended December 31, 2021 primarily
as a result of non-cash warrants and shares issued for consulting services during the period, and the hiring of new sales representatives.
General
and Administration Expense
| | |
For the Years Ended December 31, | | |
| |
| | |
2022 | | |
2021 | | |
% Change | |
| General & administration expense | |
$ | 3,429,075 | | |
$ | 3,467,995 | | |
| (1.1 | )% |
General
& administration expense decreased by $38,920 or 1.1% for the year ended December 31, 2022 as compared to the year ended December
31, 2021. The table below outlines the differences in detail:
| | |
For the Years Ended | |
| | |
December 2022 | | |
December 2021 | | |
Difference | | |
% Difference | |
| Accounting & legal | |
$ | 302,143 | | |
$ | 212,659 | | |
$ | 89,484 | | |
| 42.1 | % |
| Marketing & advertising | |
| 286,717 | | |
| 134,856 | | |
| 151,861 | | |
| 112.6 | % |
| Subcontractor & commissions | |
| 650,324 | | |
| 1,601,963 | | |
| (951,639 | ) | |
| (59.4 | )% |
| Hardware | |
| 57,861 | | |
| 49,808 | | |
| 8,053 | | |
| 16.2 | % |
| | |
| 111,465 | | |
| 117,386 | | |
| (5,921 | ) | |
| (5.0 | )% |
| Office expense, rent, software, design, bank & credit card charges, telephone & meals | |
| 2,020,565 | | |
| 1,351,323 | | |
| 669,242 | | |
| 49.5 | % |
| | |
$ | 3,429,075 | | |
$ | 3,467,995 | | |
$ | (38,920 | ) | |
| (1.1 | )% |
| | |
| | | |
| | | |
| | | |
| | |
The
overall increase of general and admin expenses was primarily due to decreases in subcontractors and commission, offset by a substantial
increase in marketing and advertising and general office expenses. Subcontractors and commissions decreased as a result of reduction
of contractors due to delays in homologation process. General office expenses increased as a result of greater trade show presentations,
new software implementation, design of SR1 and operating lease expenses in the current period. Accounting and legal expenses increased
because of switching audit firms, and legal representation for the company.
Foreign
Currency Exchange
| | |
For the Years Ended December 31, | | |
| |
| | |
2022 | | |
2021 | | |
% Change | |
| Foreign currency exchange (gain) loss | |
$ | (28,241 | ) | |
$ | (59,793 | ) | |
| (52.8 | )% |
For
the year ended December 31, 2022, we recognized a $28,241 gain in foreign exchange gain as compared to $59,793 in foreign exchange gain
for the year ended December 31, 2021. The change was primarily due to beneficial movements in foreign currency rates and a reduction
on payables, receivables and other foreign exchange transactions denominated in currencies other than the functional currencies of the
legal entities in which the transactions are recorded. Foreign currency fluctuations are primarily from the Canadian dollar, Euro, and
British pound.
(Gain)
loss on extinguishment of debt
| | |
For the Years Ended December 31, | | |
| |
| | |
2022 | | |
2021 | | |
% Change | |
| (Gain) loss on extinguishment of debt | |
$ | (40,355 | ) | |
$ | (35,169 | ) | |
| 14.7 | % |
The
Company recorded a gain of $40,355 for the year ended December 31, 2022, compared to a gain of $35,169 for the year ended December 31,
2021. The Company recorded a gain for amounts owing to various vendors as not deemed payable or as settled.
Research
and development
| | |
For the Years Ended December 31, | | |
| |
| | |
2022 | | |
2021 | | |
% Change | |
| Research and development | |
$ | 52,344 | | |
$ | 388,035 | | |
| (86.5 | )% |
Research
and development expense decreased by $335,691 or 86.5% for the year ended December 31, 2022 as compared to the year ended December 31,
2021. The decrease is the result of delays in the homologations process of our High speed vehicles.
Finance
Costs
| | |
For the Years Ended December 31, | | |
| |
| | |
2022 | | |
2021 | | |
% Change | |
| Finance costs | |
$ | 2,306,849 | | |
$ | 420,102 | | |
| 449.1 | % |
Finance
costs increased by $1,886,747 or 449.1%, for the year ended December 31, 2022 as compared to the year ended December 31, 2021. The increase
is as a result of interest on new convertible debt being recorded for the year ended December 31, 2022.
Net
Loss
| | |
For the Years Ended December 31, | | |
| |
| | |
2022 | | |
2021 | | |
% Change | |
| Net loss | |
$ | (7,547,391 | ) | |
$ | (6,384,655 | ) | |
| 20.8 | % |
As
a result of the above factors, net loss increased by $1,144,184 or 18.0% for the year ended December 31, 2022 as compared to the year
ended December 31, 2021.
Liquidity
and Capital Resources
From
our incorporation in April 17, 2008 through December 31, 2022, we have financed our operations, capital expenditures and working capital
needs through the sale of common shares and preferred shares and the incurrence of indebtedness, including term loans, convertible loans,
revolving lines of credit and purchase order financing. At December 31, 2022, we had $9,009,606 in outstanding current liabilities which
has either already reached maturity or matures within the next twelve months.
The
Company had cash of $53,779 at December 31, 2022, compared to $275,383 as at December 31, 2021. And a working capital deficit of $6,846,711
as of December 31, 2022 compared to working capital deficit of $2,314,163 as of December 31, 2021.
Liquidity
and Financial Condition
| | |
At December 31,
2022 | | |
At December 31,
2021 | | |
Percentage Increase/(Decrease) | |
| Current assets | |
$ | 2,162,895 | | |
$ | 1,700,226 | | |
| 27.2 | % |
| Current liabilities | |
$ | 9,009,606 | | |
$ | 4,014,389 | | |
| 124.4 | % |
| Working capital | |
$ | (6,846,711 | ) | |
$ | (2,314,163 | ) | |
| 195.9 | % |
Cash
Flow Analysis
Our
cash flows from operating, investing, and financing activities are summarized as follows:
| | |
December 31 | |
| | |
2022 | | |
2021 | |
| | |
| | |
| |
| Net cash (used in) provided by operating activities | |
$ | (3,622,082 | ) | |
$ | (5,613,568 | ) |
| Net cash (used in) provided by investing activities | |
| 1,333 | | |
| (26,541 | ) |
| Net cash (used in) provided by financing activities | |
| 3,343,116 | | |
| 4,496,907 | |
| Effect of exchange rate changes on cash | |
| 56,029 | | |
| 46,568 | |
| Net (decrease) increase in cash | |
| (221,604 | ) | |
| (1,096,633 | ) |
| Cash at beginning of year | |
| 275,383 | | |
| 1,372,016 | |
| Cash at end of year | |
$ | 53,779 | | |
$ | 275,383 | |
Net
Cash Used in Operating Activities
During
the year ended December 31, 2022, cash used in operations totaled $3,622,082. This consists of the net loss of $7,547,391, adjusted by
$3,925,309 for non-cash items and changes in non-cash working capital. Non-cash and working capital adjustments consisted primarily of
non-cash change in accretion of discounts on debt of $315,065, offset by increase in prepaid expenses of $195,439, increase in trade
payables and accruals of $2,277,657, decrease in accounts receivable and other receivables of $482,113, an increase in deferred revenue
of $225,490, decrease in inventories of $499,031, and the settlement of payables for services with preferred shares in the amount of
$1,887,700.
During
the year ended December 31, 2021, cash used in operations totaled $5,613,568. This consists of the net loss of $6,384,655, adjusted by
$771,087 for non-cash items and changes in non-cash working capital. Changes in non-cash working capital items consisted primarily of
increases in; lease receivables of $763,592, inventories of $457,817, prepaids of $259,909, and trade receivables of $259,437, and a
reduction in trade payables and accruals of $362,792.
Net
Cash Used in Investing Activities.
During
the year ended December 31, 2022, cash provided by investing activities consisted of $8,892 for the acquisition of fixed assets, and
the disposal of fixed assets for proceeds of $10,225.
During
the year ended December 31, 2021, cash used in investing activities consisted of $26,541 for the acquisition of fixed assets.
Net
Cash Provided by Financing Activities.
Net
cash provided by financing activities during the year ended December 31, 2022, totaled $3,343,116 which consisted primarily of $1,000,000
in proceeds from the issuance of preferred shares, $1,500,000 in proceeds from loans payable, and $863,527 from the sale of lease receivables,
partially offset by repayments made of $20,411 on loans payable.
Net
cash provided by financing activities during the year ended December 31, 2021, totaled $4,496,907 which consisted primarily of $2,536,066
in proceeds from the issuance of preferred shares, $261,934 in proceeds from issuing warrants and warrants to be issued, and $1,897,500
in proceeds from the loan facility entered into during the year, partially offset by payments on outstanding notes payable of $193,889.
Outstanding
Indebtedness
Our
current indebtedness as of December 31, 2022, is comprised of the following:
| |
● |
Unsecured,
convertible note payable to a former related party with an outstanding principal amount of $310,000, bearing interest at 5% per annum,
mature and in default; |
| |
|
|
| |
● |
Senior
secured, convertible note payable with an outstanding principal amount of $Nil, and a carrying value of $9,514 relating to an outstanding
penalty; |
| |
|
|
| |
● |
Unsecured,
promissory note with outstanding principal amount of $2,400,000, bearing interest at 9% per
annum and 24% per annum in default, maturing June 20, 2022. If not repaid by December 12,
2021, an additional $100,000 of guaranteed interest will be added on December 12, 2021 and
the 12th day of each succeeding month during which any portion of the convertible note remains
unpaid. In the event of a default, the note is convertible at the price that is equal to
a 40% discount to the lowest trading price of the Company’s common shares during the
30 day trading period prior to the conversion date; As at December 31, 2022, the note is
in default.
During
the year ended December 31, 2022, the Company recorded $1,918,065 in interest expense including $1,603,000 of additional interest.
As at December 31, 2022, the carrying value of the convertible promissory note was $2,400,000 (December 31, 2021 - $2,084,935).
As
the note is in default, it has become convertible at the holders request. The fair value of the loan approximates carrying value
as it is now short term in nature, effectively due on demand. |
| |
● |
Unsecured
loan payable with an outstanding principal amount of $29,520 (CAD$40,000). The loan is non-interest bearing and eligible for CAD$10,000
forgiveness if repaid by December 31, 2022. If not repaid by December 31, 2022, the loan bears interest at 5% per annum and is due
on December 31, 2025; |
| |
|
|
| |
● |
Secured
loan payable with an outstanding principal amount of $150,000. The loan bears interest at 3.75% per annum and is due on June 5, 2050.
The loan is secured by all tangible and intangible assets of Company. Fixed payments of $731 are due monthly and begin 12 months
from the date of the loan which is applied against any accrued interest first. |
| |
● |
Series
F Preferred Stock payments, five payments in the amount of $250,000 on February 28, 2022, $250,000 on March 31, 2022, $90,000 on July
29, 2022, $250,000 on August 26, 2022, $125,000 on September 15, 2022, $125,000 on October 21 2022, and $285,000 on October 21, 2022.
Until such time that the 965 shares of the Series F Preferred Stock are redeemed in full, an amount equal to 20% of any gross proceeds
collected by the Company are also required to be remitted. Under the original terms of the SPA, redemption of preferred F series shares
requires a 15% premium payment on the face value. As such, a Redemption Premium of $75,000 was recognized, and recorded as interest expense,
included as part of the loan, and will be repaid as part of the 20% gross sales remittance. As at December 31, 2022, there was a balance
of $1,357,651 outstanding. |
| |
|
|
| |
● |
Unsecured
promissory note payable with an outstanding principal amount of $1,000,000 on December 1, 2022. The note bears interest at 10% per annum and is due on
December 1, 2025. If not repaid by December 1, 2025, the note bears interest at 18% per annum on all interest and outstanding principal
amounts. |
Related
Party Transactions
During
the year ended December 31, 2022, the Company incurred $412,573 (2021 - $409,038) in salaries, bonuses of $120,000, and $218,946 (2021
- $197,906) in consulting fees to the President and CEO, and CFO of the Company, and the President, CEO’s, and CFO’s of the
Company’s subsidiaries. As at December 31, 2022, the Company owed $nil (2021 - $28,118 ($35,710 CDN)) to the President, CEO, and
CFO of the Company and the $49,441 (2021 - $nil) to the President, CEOs, and CFOs of the Company’s subsidiaries for management
fees and salaries, which is recorded in trade and other payables. The amounts owed and owing are unsecured, non-interest bearing, and
due on demand.
On
March 4, 2021, the Company issued an aggregate of 16 shares of Series B convertible preferred shares to the Company’s board of
directors for past services. These preferred shares were valued at $849,600 based on the fair value of the underlying common stock. The
issuance is recorded under compensation expense.
| Director |
|
#
of Preferred Shares |
|
| Stephen
Johnston |
|
|
4 |
|
| James
B Singerling |
|
|
4 |
|
| Robert
Silzer |
|
|
4 |
|
| Carol
Cookerly |
|
|
2 |
|
| Michael
Leemhuis |
|
|
2 |
|
| Total |
|
|
16 |
|
The
Series B preferred stock convertible on a 1 for 100,000 basis into common shares.
On
June 27, 2022, the Company issued an aggregate of 105 shares of Series B convertible preferred shares to the Company’s board of
directors for past services. These preferred shares were valued at $777,000 based on the fair value of the underlying common stock. The
issuance is recorded under compensation expense.
| Director |
|
#
of Preferred Shares |
|
| Stephen
Johnston |
|
|
25 |
|
| James
B Singerling |
|
|
25 |
|
| Robert
Silzer |
|
|
25 |
|
| Carol
Cookerly |
|
|
15 |
|
| Michael
Leemhuis |
|
|
15 |
|
| Total |
|
|
105 |
|
The
Series B preferred stock is convertible on a 1 for 100,000 basis into common shares.
On
August 1, 2022, the Company issued an aggregate of 191 shares of Series B convertible preferred shares to the CEO of the Company. These
preferred shares were value at $897,700 based on the fair value of the underlying common stock.
Prospective
Capital Needs
We
estimate our operating expenses and working capital requirements for the twelve-month period to be as follows:
| Estimated Expenses for the Twelve-Month Period ending December 31, 2023 |
| General and administrative | |
$ | 5,929,500 | |
| Research and development | |
| 4,230,600 | |
| Marketing | |
| 1,500,000 | |
| Sales and dealer network | |
| 785,000 | |
| Payroll overhead | |
| 2,449,000 | |
| Service and maintenance | |
| 2,355,900 | |
| Assembly facility | |
| 2,750,000 | |
| Inventory | |
| 15,700,500 | |
| Total | |
$ | 35,700,500 | |
During
the year ended December 31, 2022, cash used in operating activities totaled $3,622,082. The relatively normal level of cash used compared
to our estimated working capital needs in the future is the result of the planned scaling of the business in the Golf Cart division,
including the SR-1 that was designed in house. We need to reduce the current level of payables in the future to maintain a good relationship
with our vendors and expand our sales and service team to achieve our operational objectives. At present, our cash requirements for the
next 12 months outweigh the funds available. Of the $35,700,500 that we require for the next 12 months, we had $53,779 in cash as of
December 31, 2022, and a working capital deficit of $6,956,175. Our principal sources of liquidity are cash generated from product sales
and debt financings. As of December 31, 2022, the Company had secured signed contracts of over $10.5 million of which approximately $3
million was recognized the fiscal year 2022. The Company expects to satisfy the majority of its performance obligations on the remaining
contracts during fiscal 2023 totaling approximately $7.5 million. To achieve sustained profitability and positive cash flows from operations,
we will need to increase revenue and/or reduce operating expenses. Our ability to maintain, or increase, current revenue levels to achieve
and sustain profitability will depend, in part, on demand for our products.
In
order to improve our liquidity, we also plan to pursue additional equity financing from private investors or possibly a registered public
offering. We do not currently have any definitive arrangements in place for the completion of any further private placement financings
and there is no assurance that we will be successful in completing any further private placement financings. If we are unable to achieve
the necessary additional financing, then we plan to reduce the amounts that we spend on our business activities and administrative expenses
in order to be within the amount of capital resources obligations and execute our business plan. There can be no assurances that we will
be able to raise additional capital on acceptable terms or at all, which would adversely affect our ability to achieve our business objectives.
Off-Balance
Sheet Transactions
We
do not have any off-balance sheet arrangements.
Contractual
Obligations and Known Future Cash Requirements
Indemnification
Agreements
In
the ordinary course of business, we enter into agreements of varying scope and terms pursuant to which we agree to indemnify customers,
vendors, lessors, business partners and other parties with respect to certain matters, including, but not limited to, losses arising
out of breach of such agreements, services to be provided by us or from intellectual property infringement claims made by third parties.
In addition, we have entered into indemnification agreements with directors and certain officers and employees that will require us,
among other things, to indemnify them against certain liabilities that may arise by reason of their status or service as directors, officers
or employees. No demands have been made upon us to provide indemnification under such agreements and there are no claims that we are
aware of that could have a material effect on our consolidated balance sheet, consolidated statements of operations, consolidated statements
of comprehensive loss or consolidated statements of cash flows.
Operating
Leases
We
currently lease our corporate headquarters in Surrey, British Columbia under an operating lease agreement that expire on July 31, 2023,
respectively. The terms of the lease agreement provides for rental payments on a graduated basis.
Critical
Accounting Policies and Estimates
We
prepare our consolidated financial statements in accordance with U.S. GAAP. The preparation of consolidated financial statements also
requires us to make estimates and assumptions that affect the reported amounts of assets, liabilities, revenue, costs and expenses, and
related disclosures. We base our estimates on historical experience and on various other assumptions that we believe to be reasonable
under the circumstances. Actual results could differ significantly from the estimates made by our management. To the extent that there
are differences between our estimates and actual results, our future financial statements presentation, financial condition, results
of operations, and cash flows will be affected.
We
believe that the assumptions and estimates associated with revenue recognition, derivative liabilities, foreign currency and foreign
currency transactions and comprehensive loss have the greatest potential impact on our consolidated financial statements. Therefore,
we consider these to be our critical accounting policies and estimates. For further information on all of our significant accounting
policies, see the notes to our consolidated financial statements.
Recently
Issued and Adopted Accounting Pronouncements
Recently
Issued Accounting Pronouncements Applicable to the Company
Applicable
for fiscal years beginning after December 15, 2022:
In
July 2022, FASB issued ASU 2022-03, Fair Value Measurement (Topic 820); Fair Value Measurement of Equity Securities Subject to Contractual
Sale Restrictions. The FASB issued final guidance to clarify that a contractual restriction on the sale of an equity security is
not considered part of the unit of account of the equity security and, therefore, is not considered when measuring fair value. Recognizing
a contractual sale restriction as a separate unit of account is not permitted. The guidance will be applied prospectively, with special
transition provisions for entities that qualify as investment companies under ASC 946. The guidance is effective in 2024 for calendar-year
public business entities and in 2025 for all other calendar-year companies. Early adoption is permitted.
In
October 3, 2022, FASB issued ASU 2022-04, Liabilities — Supplier Finance Programs (Subtopic 405-50): Disclosure of Supplier
Finance Program Obligations. The FASB issued final guidance that requires entities that use supplier finance programs in connection
with the purchase of goods and services to disclose the key terms of the programs and information about their obligations outstanding
at the end of the reporting period, including a rollforward of those obligations. The guidance does not affect the recognition, measurement
or financial statement presentation of supplier finance program obligations. The guidance should be applied retrospectively to all periods
in which a balance sheet is presented, except for the rollforward requirement, which should be applied prospectively. The guidance is
effective for all entities for fiscal years beginning after 15 December 2022, including interim periods within those fiscal years, except
for the rollforward requirement, which is effective for fiscal years beginning after 15 December 2023. Early adoption is permitted.
| ITEM
7A. |
QUANTITATIVE
AND QUALITATIVE DISCLOSURES ABOUT MARKET RISK |
Not
applicable.
| ITEM
8. |
FINANCIAL
STATEMENTS AND SUPPLEMENTAL DATA |
DSG
GLOBAL INC.
INDEX
TO CONSOLIDATED FINANCIAL STATEMENTS
Report
of Independent Registered Public Accounting Firm
To
the Board of Directors and Shareholders of DSG Global, Inc.
Opinion
on the Financial Statements
We
have audited the accompanying consolidated balance sheet of DSG Global, Inc. (the “Company”) as of December 31, 2022, the
related consolidated statements of operations, stockholders’ equity (deficit), and cash flows for the year then ended, and the
related notes (collectively referred to as the “financial statements”). In our opinion, the financial statements present
fairly, in all material respects, the financial position of the Company as of December 31, 2022, and the results of its operations and
its cash flows for the year ended December 31, 2022, in conformity with accounting principles generally accepted in the United States
of America.
Substantial
Doubt about the Company’s Ability to Continue as a Going Concern
The
accompanying financial statements have been prepared assuming that the Company will continue as a going concern. As discussed in Note
2 to the financial statements, the Company’s significant operating losses raise substantial doubt about its ability to continue
as a going concern. The financial statements do not include any adjustments that might result from the outcome of this uncertainty.
Basis
for Opinion
These
financial statements are the responsibility of the Company’s management. Our responsibility is to express an opinion on the Company’s
financial statements based on our audit. We are a public accounting firm registered with the Public Company Accounting Oversight Board
(United States) (“PCAOB”) and are required to be independent with respect to the Company in accordance with the U.S. federal
securities laws and the applicable rules and regulations of the Securities and Exchange Commission and the PCAOB.
We
conducted our audit in accordance with the standards of the PCAOB. Those standards require that we plan and perform the audit to obtain
reasonable assurance about whether the financial statements are free of material misstatement, whether due to error or fraud. The Company
is not required to have, nor were we engaged to perform, an audit of its internal control over financial reporting. As part of our audit,
we are required to obtain an understanding of internal control over financial reporting but not for the purpose of expressing an opinion
on the effectiveness of the Company’s internal control over financial reporting. Accordingly, we express no such opinion.
Our
audit included performing procedures to assess the risks of material misstatement of the financial statements, whether due to error or
fraud, and performing procedures that respond to those risks. Such procedures included examining, on a test basis, evidence regarding
the amounts and disclosures in the financial statements. Our audit also included evaluating the accounting principles used and significant
estimates made by management, as well as evaluating the overall presentation of the financial statements. We believe that our audit provides
a reasonable basis for our opinion.
Critical
Audit Matter
The
critical audit matter communicated below is a matter arising from the current-period audit of the financial statements that was communicated
or required to be communicated to the audit committee and that (1) relates to accounts or disclosures that are material to the financial
statements and (2) involved our especially challenging, subjective, or complex judgments. The communication of critical audit matters
does not alter in any way our opinion on the financial statements, taken as a whole, and we are not, by communicating the critical audit
matter below, providing a separate opinion on the critical audit matter or on the accounts or disclosures to which it relates.
Revenue
recognition — identification of contractual terms in certain customer arrangements
As
described in Note 3 to the consolidated financial statements, management applies FASB Topic 606, Revenue from Contacts with Customers
(“ASC 606”) to recognize revenue. Management recognizes revenue upon transfer of control of promised goods or services
to customers in an amount that reflects the consideration the Company expects to receive in exchange for those goods or services. In
instances where final acceptance of the product is specified by the customer, revenue is deferred until all acceptance criteria have
been met.
The
principal considerations for our determination that performing procedures over the full completion of revenue contracts and subsequent
payment collections is a critical audit matter. This in turn led to significant effort in performing our audit procedures which were
designed to evaluate whether the contractual terms, the timing of revenue recognition and the subsequent collections were appropriately
identified and accounted for by management under ASC 606.
Our
audit procedures included, among others, understanding of controls relating to management’s revenue recognition process, examining
transaction related documents, confirming revenues and outstanding receivables at the balance sheet date with a sample of the customers,
and testing collections subsequent to the balance sheet date.
Other
Matter
The
consolidated financial statements for the year ended December 31, 2021 which are presented for comparative purposes, was audited by another
auditor who expressed an unmodified opinion on those consolidated financial statements on March 31, 2022.
/s/
BF Borgers CPA PC
BF
Borgers CPA PC
Served
as Auditor since 2022
Lakewood,
CO
July
13, 2023
DSG
GLOBAL, INC.
CONSOLIDATED
BALANCE SHEETS
AS
AT DECEMBER 31, 2022 AND 2021
(Expressed
in U.S. Dollars)
| | |
December 31, 2022 | | |
December 31, 2021 | |
| | |
| | |
| |
| ASSETS | |
| | | |
| | |
| CURRENT ASSETS | |
| | | |
| | |
| Cash | |
$ | 53,779 | | |
$ | 275,383 | |
| Trade receivables | |
| 711,028 | | |
| 239,822 | |
| Lease receivable | |
| 3,627 | | |
| 87,020 | |
| Inventories | |
| 1,204,577 | | |
| 712,678 | |
| Prepaid expenses and deposits | |
| 189,884 | | |
| 385,323 | |
| TOTAL CURRENT ASSETS | |
| 2,162,895 | | |
| 1,700,226 | |
| | |
| | | |
| | |
| Lease receivable | |
| 15,918 | | |
| 723,216 | |
| Fixed assets, net | |
| 25,546 | | |
| 35,314 | |
| Equipment on lease, net | |
| 29,561 | | |
| 141,880 | |
| Intangible assets, net | |
| 10,376 | | |
| 11,604 | |
| TOTAL ASSETS | |
$ | 2,244,296 | | |
$ | 2,612,240 | |
| | |
| | | |
| | |
| LIABILITIES AND STOCKHOLDERS’ DEFICIT | |
| | | |
| | |
| CURRENT LIABILITIES | |
| | | |
| | |
| Trade and other payables | |
$ | 3,356,256 | | |
$ | 1,202,598 | |
| Deferred revenue | |
| 481,474 | | |
| 255,984 | |
| Lease liability | |
| 35,670 | | |
| 121,270 | |
| Loans payable | |
| 2,416,692 | | |
| 2,115,049 | |
| Convertible notes payable | |
| 2,719,514 | | |
| 319,488 | |
| TOTAL CURRENT LIABILITIES | |
| 9,009,606 | | |
| 4,014,389 | |
| | |
| | | |
| | |
| Lease liability | |
| 4,982 | | |
| 38,696 | |
| Loans payable | |
| 150,000 | | |
| 212,898 | |
| TOTAL LIABILITIES | |
| 9,164,588 | | |
| 4,265,983 | |
| | |
| | | |
| | |
| MEZZANINE EQUITY | |
| | | |
| | |
| Redeemable preferred stock, $0.001 par value, 24,010,000 shares authorized (2021 – 24,010,000), 52,023 issued and outstanding, 860 to be issued (2021 – 50,804 issued and outstanding, 1,206 to be issued | |
| 2,635,345 | | |
| 3,143,402 | |
| | |
| | | |
| | |
| STOCKHOLDERS’ DEFICIT | |
| | | |
| | |
| Preferred stock, $0.001 par value, 3,010,000 shares authorized (2021 – 3,010,000), 200,780 issued and outstanding (2021 - 200,454 issued and outstanding) | |
| 3,087,180 | | |
| 1,199,480 | |
| Common stock, $0.001 par value, 350,000,000 shares authorized, (2021 – 350,000,000); 145,429,993 issued and outstanding (2021 – 128,345,183 issued and outstanding) | |
| 145,435 | | |
| 128,350 | |
| Additional paid in capital, common stock | |
| 50,916,150 | | |
| 50,068,418 | |
| Discounts on common stock | |
| (69,838 | ) | |
| (69,838 | ) |
| Common stock to be issued | |
| - | | |
| 19,647 | |
| Obligation to issue warrants | |
| 261,934 | | |
| 261,934 | |
| Other accumulated comprehensive income | |
| 1,345,588 | | |
| 1,289,559 | |
| Accumulated deficit | |
| (65,242,086 | ) | |
| (57,694,695 | ) |
| TOTAL STOCKHOLDERS’ DEFICIT | |
| (9,555,637 | ) | |
| (4,797,145 | ) |
| | |
| | | |
| | |
| TOTAL LIABILITIES MEZZANINE EQUITY AND STOCKHOLDERS’ DEFICIT | |
$ | 2,244,296 | | |
$ | 2,612,240 | |
The
accompanying notes are an integral part of the audited consolidated financial statements
DSG
GLOBAL, INC.
CONSOLIDATED
STATEMENTS OF OPERATIONS
FOR
THE YEARS ENDED DECEMBER 31, 2022 AND 2021
(Expressed
in U.S. Dollars)
| | |
2022 | | |
2021 | |
| | |
| | |
| |
| Revenue | |
$ | 3,833,853 | | |
$ | 2,092,819 | |
| Cost of revenue | |
| 2,082,968 | | |
| 1,110,698 | |
| Gross profit | |
| 1,750,885 | | |
| 982,121 | |
| | |
| | | |
| | |
| Operating expenses | |
| | | |
| | |
| Compensation expense | |
| 3,534,816 | | |
| 3,017,181 | |
| General and administration expense | |
| 3,429,075 | | |
| 3,467,995 | |
| Research and development | |
| 52,344 | | |
| 388,035 | |
| Bad debt expense (recovery) | |
| (29,389 | ) | |
| 49,586 | |
| Depreciation and amortization expense | |
| 13,670 | | |
| 12,837 | |
| Total operating expense | |
| 7,000,516 | | |
| 6,935,634 | |
| Loss from operations | |
| (5,249,631 | ) | |
| (5,953,513 | ) |
| | |
| | | |
| | |
| Other income (expense) | |
| | | |
| | |
| Foreign currency exchange | |
| (28,241 | ) | |
| (59,793 | ) |
| Other (expense) income | |
| - | | |
| 13,584 | |
| Loss on sale of lease receivable | |
| (3,923 | ) | |
| - | |
| (Loss) Gain on extinguishment of debt | |
| 40,355 | | |
| 35,169 | |
| Gain on disposal | |
| 3,960 | | |
| - | |
| Interest on preferred shares | |
| (3,062 | ) | |
| - | |
| Finance costs | |
| (2,306,849 | ) | |
| (420,102 | ) |
| Total other income (expense) | |
| (2,297,760 | ) | |
| (431,142 | ) |
| Net loss | |
$ | (7,547,391 | ) | |
$ | (6,384,655 | ) |
| | |
| | | |
| | |
| Net loss per share | |
| | | |
| | |
| Basic and diluted | |
$ | (0.06 | ) | |
$ | (0.06 | ) |
| | |
| | | |
| | |
| Weighted average number of shares used in computing basic and diluted net loss per share: | |
| | | |
| | |
| Basic and diluted | |
| 136,607,605 | | |
| 114,897,055 | |
The
accompanying notes are an integral part of the audited consolidated financial statements
DSG
GLOBAL, INC.
CONSOLIDATED
STATEMENTS OF COMPREHENSIVE LOSS
FOR
THE YEARS ENDED DECEMBER 31, 2022 AND 2021
(Expressed
in U.S. Dollars)
| | |
2022 | | |
2021 | |
| | |
| | |
| |
| Net loss | |
$ | (7,547,391 | ) | |
$ | (6,384,655 | ) |
| Other comprehensive income (loss) | |
| | | |
| | |
| Foreign currency translation adjustments | |
| 56,029 | | |
| 37,477 | |
| | |
| | | |
| | |
| Comprehensive loss | |
$ | (7,491,362 | ) | |
$ | (6,347,178 | ) |
The
accompanying notes are an integral part of the audited consolidated financial statements
DSG
GLOBAL, INC.
CONSOLIDATED
STATEMENTS OF STOCKHOLDERS’ DEFICIT
AS
AT DECEMBER 31, 2022 AND 2021
(Expressed
in U.S. Dollars)
| | |
| | |
| | |
| | |
| | |
| | |
| | |
| | |
| | |
| | |
| | |
| | |
| | |
| |
| | |
Common Stock | | |
Preferred Stock (equity) | |
| | |
Shares | | |
Amount | | |
Additional paid in capital | | |
Discount on common stock | | |
To be issued | | |
Obligation to issue warrants | | |
Shares | | |
Par value | | |
Additional
paid in
capital | | |
To be issued | | |
Accumulated
other
comprehensive
income | | |
Accumulated deficit | | |
Total
stockholders’
deficit | |
| Balance, December 31, 2020 | |
| 95,765,736 | | |
$ | 94,018 | | |
$ | 43,299,937 | | |
$ | (69,838 | ) | |
$ | 1,436,044 | | |
$ | 163,998 | | |
| 200,508 | | |
$ | 200 | | |
$ | 744,480 | | |
$ | 1,340,000 | | |
$ | 1,252,082 | | |
$ | (51,310,040 | ) | |
$ | (3,049,119 | ) |
| | |
| | | |
| | | |
| | | |
| | | |
| | | |
| | | |
| | | |
| | | |
| | | |
| | | |
| | | |
| | | |
| | |
| Shares issued for debt settlement | |
| 8,968,975 | | |
| 8,854 | | |
| 1,618,425 | | |
| - | | |
| (1,436,044 | ) | |
| - | | |
| - | | |
| - | | |
| - | | |
| - | | |
| - | | |
| - | | |
| 191,235 | |
| Shares and warrants issued for services | |
| 2,430,000 | | |
| 2,430 | | |
| 1,805,704 | | |
| - | | |
| 19,647 | | |
| 97,936 | | |
| - | | |
| - | | |
| - | | |
| - | | |
| - | | |
| - | | |
| 1,925,717 | |
| Cancellation of shares due to duplicate issuance | |
| (1,866,288 | | |
| - | | |
| - | | |
| - | | |
| - | | |
| - | | |
| (45 | ) | |
| - | | |
| - | | |
| - | | |
| - | | |
| - | | |
| - | |
| Preferred shares issued for services | |
| - | | |
| - | | |
| - | | |
| - | | |
| - | | |
| - | | |
| 116 | | |
| - | | |
| 2,189,600 | | |
| (1,340,000 | ) | |
| - | | |
| - | | |
| 849,600 | |
| Shares issued on conversion of preferred shares | |
| 23,046,760 | | |
| 23,048 | | |
| 3,799,852 | | |
| - | | |
| - | | |
| - | | |
| (125 | ) | |
| - | | |
| (1,734,800 | ) | |
| - | | |
| - | | |
| - | | |
| 2,088,100 | |
| Dividends to be settled with preferred shares | |
| - | | |
| - | | |
| (455,500 | ) | |
| - | | |
| - | | |
| - | | |
| - | | |
| - | | |
| - | | |
| - | | |
| - | | |
| - | | |
| (455,500 | ) |
| Net loss for the period | |
| - | | |
| - | | |
| - | | |
| - | | |
| - | | |
| - | | |
| - | | |
| - | | |
| - | | |
| - | | |
| 37,477 | | |
| (6,384,655 | ) | |
| (6,347,178 | ) |
| | |
| | | |
| | | |
| | | |
| | | |
| | | |
| | | |
| | | |
| | | |
| | | |
| | | |
| | | |
| | | |
| | |
| Balance, December 31, 2021 | |
| 128,345,183 | | |
$ | 128,350 | | |
$ | 50,068,418 | | |
$ | (69,838 | ) | |
$ | 19,647 | | |
$ | 261,934 | | |
| 200,454 | | |
$ | 200 | | |
$ | 1,199,280 | | |
| - | | |
$ | 1,289,559 | | |
$ | (57,694,695 | ) | |
$ | (4,797,145 | ) |
| Balance, value | |
| 128,345,183 | | |
$ | 128,350 | | |
$ | 50,068,418 | | |
$ | (69,838 | ) | |
$ | 19,647 | | |
$ | 261,934 | | |
| 200,454 | | |
$ | 200 | | |
$ | 1,199,280 | | |
| - | | |
$ | 1,289,559 | | |
$ | (57,694,695 | ) | |
$ | (4,797,145 | ) |
| | |
| | | |
| | | |
| | | |
| | | |
| | | |
| | | |
| | | |
| | | |
| | | |
| | | |
| | | |
| | | |
| | |
| Shares and warrants issued for services | |
| 1,160,000 | | |
| 1,160 | | |
| 105,600 | | |
| - | | |
| (19,647 | ) | |
| - | | |
| 326 | | |
| - | | |
| 1,887,700 | | |
| - | | |
| - | | |
| | | |
| 1,974,813 | |
| Dividends | |
| - | | |
| - | | |
| 455,500 | | |
| - | | |
| - | | |
| - | | |
| - | | |
| - | | |
| - | | |
| - | | |
| - | | |
| - | | |
| 455,500 | |
| Shares issued on conversion of preferred shares | |
| 15,924,810 | | |
| 15,925 | | |
| 286,632 | | |
| - | | |
| - | | |
| - | | |
| | | |
| - | | |
| - | | |
| - | | |
| - | | |
| - | | |
| 302,557 | |
| Net loss for the period | |
| - | | |
| - | | |
| - | | |
| - | | |
| - | | |
| - | | |
| - | | |
| - | | |
| - | | |
| - | | |
| 56,029 | | |
| (7,547,391 | ) | |
| (7,491,362 | ) |
| Balance, December 31, 2022 | |
| 145,429,993 | | |
$ | 145,435 | | |
$ | 50,916,150 | | |
$ | (69,838 | ) | |
$ | - | | |
$ | 261,934 | | |
| 200,780 | | |
$ | 200 | | |
$ | 3,086,980 | | |
| - | | |
$ | 1,345,588 | | |
$ | (65,242,086 | ) | |
$ | (9,555,637 | ) |
| Balance, value | |
| 145,429,993 | | |
$ | 145,435 | | |
$ | 50,916,150 | | |
$ | (69,838 | ) | |
$ | - | | |
$ | 261,934 | | |
| 200,780 | | |
$ | 200 | | |
$ | 3,086,980 | | |
| - | | |
$ | 1,345,588 | | |
$ | (65,242,086 | ) | |
$ | (9,555,637 | ) |
The
accompanying notes are an integral part of the audited consolidated financial statements
DSG
GLOBAL INC.
CONSOLIDATED
STATEMENTS OF CASH FLOWS
FOR
THE YEARS ENDED DECEMBER 31, 2022 AND 2021
(Expressed
in U.S. Dollars)
| | |
December 31, 2022 | | |
December 31, 2021 | |
| | |
| | |
| |
| Net loss | |
$ | (7,547,391 | ) | |
$ | (6,384,655 | ) |
| | |
| | | |
| | |
| Adjustments to reconcile net loss to net cash used in operating activities: | |
| | | |
| | |
| Depreciation and amortization | |
| 13,670 | | |
| 130,059 | |
| Change in ROU assets | |
| 161,804 | | |
| 27,360 | |
| Accretion of discounts on debt | |
| 315,065 | | |
| 187,435 | |
| Bad debt expense (recovery) | |
| (29,389 | ) | |
| 49,586 | |
| Loss on sale of lease receivable | |
| 3,923 | | |
| - | |
| Preferred shares issued for services | |
| 1,887,700 | | |
| 849,600 | |
| Common shares and warrants issued for services | |
| 97,353 | | |
| 1,644,136 | |
| Obligation to issue warrants | |
| - | | |
| 19,647 | |
| (Gain) loss on extinguishment of debt | |
| (40,355 | ) | |
| (35,169 | ) |
| Unrealized foreign exchange gain | |
| (2,304 | ) | |
| (1,857 | ) |
| Gain on asset disposal | |
| (3,960 | ) | |
| | |
| | |
| | | |
| | |
| Changes in non-cash working capital: | |
| | | |
| | |
| Trade receivables, net | |
| (499,031 | ) | |
| (259,437 | ) |
| Inventories | |
| (491,899 | ) | |
| (457,817 | ) |
| Prepaid expense and deposits | |
| 195,439 | | |
| (259,909 | ) |
| Lease receivable | |
| (19,545 | ) | |
| (763,592 | ) |
| Trade payables and accruals | |
| 2,277,657 | | |
| (362,792 | ) |
| Deferred revenue | |
| 225,490 | | |
| 155,508 | |
| Interest on mandatorily redeemable preferred shares | |
| 3,062 | | |
| - | |
| Lease liabilities | |
| (169,371 | ) | |
| (151,671 | ) |
| Net cash used in operating activities | |
| (3,622,082 | ) | |
| (5,613,568 | ) |
| | |
| | | |
| | |
| Cash flows from investing activities | |
| | | |
| | |
| Purchase of equipment | |
| (8,892 | ) | |
| (26,541 | ) |
| Disposal of property and equipment | |
| 10,225 | | |
| - | |
| Net cash used in investing activities | |
| 1,333 | | |
| (26,541 | ) |
| | |
| | | |
| | |
| Cash flows from financing activities | |
| | | |
| | |
| Proceeds from issuing preferred shares, and shares to be issued | |
| 1,000,000 | | |
| 2,536,066 | |
| Proceeds on warrants issued | |
| - | | |
| 261,934 | |
| Repayment on lease liabilities | |
| - | | |
| (4,704 | ) |
| Proceeds from sale of lease receivable | |
| 863,527 | | |
| - | |
| Proceeds from loans payable | |
| 1,500,000 | | |
| 1,897,500 | |
| Payments on loans payable | |
| (20,411 | ) | |
| (193,889 | ) |
| Net cash provided by financing activities | |
| 3,343,116 | | |
| 4,496,907 | |
| | |
| | | |
| | |
| Effect of exchange rate changes on cash | |
| 56,029 | | |
| 46,568 | |
| Net increase in cash | |
| (221,604 | ) | |
| (1,096,633 | ) |
| Cash at beginning of year | |
| 275,383 | | |
| 1,372,016 | |
| | |
| | | |
| | |
| Cash at the end of the year | |
$ | 53,779 | | |
$ | 275,383 | |
| | |
| | | |
| | |
| Supplemental Cash Flow Information (Note 19) | |
| | | |
| | |
The
accompanying notes are an integral part of the audited consolidated financial statements
DSG
GLOBAL, INC.
NOTES
TO CONSOLIDATED FINANCIAL STATEMENTS
(Expressed
in U.S. Dollars)
Note
1 –ORGANIZATION
DSG
Global, Inc. (the “Company”) was incorporated under the laws of the State of Nevada on September 24, 2007.
The
Company is a technology development company engaged in the design, manufacture, and marketing of fleet management solutions in the golf
industry. The Company’s principal activities are the sale and rental of GPS tracking devices and interfaces for golf vehicles and
related support services. Starting during the year ended December 31, 2021, the Company began to market low speed electric vehicles,
and e-bikes, recognizing its first sales in this space. See Note 16 for segmented reporting. The Company continued the homologation project
for electric vehicles .
On
August 12, 2021, the Company incorporated Imperium Motor of Canada Corporation (“Imperium Canada”), under the laws of British
Columbia, Canada, for which it subscribed to all authorized capital stock, 100 shares of Class A Voting Participating common shares,
at a price of $0.10 per share. Imperium Canada is a wholly owned subsidiary of the Company.
On
September 17, 2021, the Company incorporated AC Golf Carts Inc. (“AC Golf Carts”), under the laws of the Sate of
Nevada, for which it subscribed to all authorized stock, 100
common shares at a price of $0.001
par value per share. AC Golf Carts is a wholly owned subsidiary of the Company.
Subsequent to year end, on
January 5, 2023, Imperium Motor Corp. had its name changed to Liteborne Motor Corporation.
Note
2 – GOING CONCERN
These
consolidated financial statements have been prepared on a going concern basis, which implies the Company will continue to realize its
assets and discharge its liabilities in the normal course of business. The continuation of the Company as a going concern is dependent
upon the continued financial support from its shareholders and note holders, the ability of the Company to obtain necessary equity financing
to continue operations, and ultimately the attainment of profitable operations.
The
outbreak of the coronavirus, also known as “COVID-19”, spread across the globe and has impacted worldwide economic activity.
During the year ended December 31, 2022, conditions surrounding the coronavirus continued to rapidly evolve and government authorities
implemented emergency measures to mitigate the spread of the virus. The outbreak and the related mitigation measures may have an adverse
impact on global economic conditions as well as on the Company’s business activities going forward. The extent to which the coronavirus
may impact the Company’s business activities will depend on future developments, such as the ultimate geographic spread of the
disease, the duration of the outbreak, travel restrictions, business disruptions, and the effectiveness of actions taken in Canada and
other countries to contain and treat the disease. These events are highly uncertain and as such, the Company cannot determine their financial
impact at this time. While certain restrictions are presently in the process of being relaxed, it is unclear when the world will return
to the previous normal, if ever. This may adversely impact the expected implementation of the Company’s plans moving forward.
As
at December 31, 2022, the Company has a working capital deficit of $6,846,711 and has an accumulated deficit of $65,242,086 since inception.
Furthermore, the Company incurred a net loss of $7,547,391 and used $3,622,082 of cash flows for operating activities during the twelve
months ended December 31, 2022. These factors raise substantial doubt regarding the Company’s ability to continue as a going concern.
These consolidated financial statements do not include any adjustments to the recoverability and classification of recorded
asset amounts and classification of liabilities that might be necessary should the Company be unable to continue as a going concern.
Note
3 – SUMMARY OF SIGNIFICANT ACCOUNTING POLICIES
Basis
of Presentation
The
consolidated financial statements of the Company have been prepared in accordance with accounting principles generally accepted in the
United States (“U.S. GAAP”) and are expressed in U.S. dollars. These consolidated financial statements include the accounts
of the Company and its wholly owned subsidiaries. All significant intercompany accounts and transactions have been eliminated. Certain
comparative information has been reclassified to conform with the financial statement presentation adopted in the current year.
Principles
of Consolidation
The
consolidated financial statements include the accounts of DSG Global Inc. and its subsidiary VTS and its wholly owned subsidiaries
DSG UK, Imperium Canada, Imperium, AC Golf Carts, and Liteborne collectively referred to as the “Company”. All intercompany
accounts, transactions and profits were eliminated in the consolidated financial statements.
Use
of Estimates
The
preparation of consolidated financial statements in conformity with U.S. GAAP requires management to make estimates and assumptions that
affect the reported amounts of assets and liabilities and the disclosure of contingent assets and liabilities at the date of the financial
statements and the reported amounts of revenues and expenses during the reporting period. The Company regularly evaluates estimates and
assumptions related to revenue recognition, the collectability of accounts receivable, valuation of inventory, useful lives and recoverability
of long-lived assets, fair value derivative liabilities, the Company’s incremental borrowing rate, leases and deferred income tax
asset valuation allowances. The Company bases its estimates and assumptions on current facts, historical experience and various other
factors that it believes to be reasonable under the circumstances, the results of which form the basis for making judgments about the
carrying values of assets and liabilities and the accrual of costs and expenses that are not readily apparent from other sources. The
actual results experienced by the Company may differ materially and adversely from those estimates. Estimates and assumptions are reviewed
periodically, and the effects of revisions are reflected in the consolidated financial statements in the period they are determined.
The
Company’s policy for equipment requires judgment in determining whether the present value of future expected economic benefits
exceeds capitalized costs. The policy requires management to make certain estimates and assumptions about future economic benefits related
to its operations. Estimates and assumptions may change if new information becomes available. If information becomes available suggesting
that the recovery of capitalized cost is unlikely, the capitalized cost is written off to the consolidated statement of operations.
The
assessment of whether the going concern assumption is appropriate requires management to take into account all available information
about the future, which is at least, but is not limited to, 12 months from the date the financial statements are issued. The Company
is aware that material uncertainties related to events or conditions may cast substantial doubt upon the Company’s ability to continue
as a going concern.
Foreign
Currency Translation
The
Company’s functional and reporting currency is the U.S. dollar. The functional currency of VTS is the Canadian dollar. The functional
currency of DSG UK is the British pound. Monetary assets and liabilities denominated in foreign currencies are translated using the exchange
rate prevailing at the balance sheet date. Non-monetary assets, liabilities, and items recorded in income arising from transactions denominated
in foreign currencies are translated at rates of exchange in effect at the date of the transaction. Gains and losses arising on translation
or settlement of foreign currency denominated transactions or balances are included in the determination of income.
The
accounts of VTS and DSG UK are translated to U.S. dollars using the current rate method. Accordingly, assets and liabilities are translated
into U.S. dollars at the period-end exchange rate while revenues and expenses are translated at the average exchange rates during the
period. Related exchange gains and losses are included in a separate component of stockholders’ equity as accumulated other comprehensive
income (loss).
Reportable
Segments
The
Company has four reportable
segments: GPS Devices, those related to its sales and rentals of GPS tracking devices and interfaces for golf vehicles and related support
services; Golf Vehicles, the sale of golf vehicles; Electric Vehicles, the sale of electric vehicles, including e-bikes; and Administration,
those expenses related to the overall operations of the Company not associated with a specific revenue segment. The Company’s activities
are interrelated, and each activity is dependent upon and supportive of the other. Accordingly, all significant operating decisions are
based on analysis of financial products provided as a single global business.
Revenue
Recognition and Warranty Reserve
Revenue
from Contracts with Customers
The
Company recognizes revenue when it satisfies a performance obligation by transferring control over a product to a customer. Revenue is
measured based on the consideration the Company expects to receive in exchange for those products. In instances where final acceptance
of the product is specified by the customer, revenue is deferred until all acceptance criteria have been met. Revenues are recognized
under Topic 606 in a manner that reasonably reflects the delivery of its products and services to customers in return for expected
consideration and includes the following elements:
| |
● |
executed
contracts with the Company’s customers that it believes are legally enforceable; |
| |
● |
identification
of performance obligations in the respective contract; |
| |
● |
determination
of the transaction price for each performance obligation in the respective contract; |
| |
● |
allocation
the transaction price to each performance obligation; and |
| |
● |
recognition
of revenue only when the Company satisfies each performance obligation. |
Performance
Obligations and Signification Judgments
The
Company’s revenue streams can be categorized into the following performance obligations and recognition patterns:
| |
1. |
Sale,
delivery and installation of Tag, Text and Infinity products, along with digital mapping and customer training. The Company recognizes
revenue at a point in time when final sign-off on the installation is obtained from the General Manager and/or Director of Golf. |
| |
2. |
Provision
of internet connectivity, regular software updates, software maintenance and basic customer support service. The Company recognizes
revenue over time, evenly over the term of the service. |
| |
3. |
Sale
and delivery of Fairway Rider (golf carts) products. The Company recognizes revenue at a point in time when control transfers to the
customer. |
| |
4. |
Sale
and delivery of Electric Vehicles. The Company recognizes revenue at a point in time when control transfers to the customer. |
Transaction
prices for performance obligations are explicitly outlined in relevant agreements, therefore, the Company does not believe that significant
judgments are required with respect to the determination of the transaction price, including any variable consideration identified.
Warranty
Reserve
The
Company accrues for warranty costs, sales returns, and other allowances based on its historical experience. The Company matches its
warranty period for parts and products to that of the manufacturer’s warranty period. Therefore, any defect will result in a
warranty claim to the manufacturer and not the Company. During the years ended December 31, 2022 and 2021, the Company did not
provide a warranty for any of its products sold during those periods. The warranty reserve was $Nil
as at December 31, 2022 and 2021.
Research
and Development
Research
and development expenses include payroll, employee benefits, and other headcount-related expenses associated with product development.
Research and development expenses also include third-party development and programming costs, localization costs incurred to translate
software for international markets, and the amortization of purchased software code and services content. Such costs related to software
development are included in research and development expense until the point that technological feasibility is reached. Research and
development is expensed and is included in operating expenses.
Income
Taxes
The
Company accounts for income taxes using the asset and liability method in accordance with ASC 740, Income Taxes. The asset and liability
method provides that deferred income tax assets and liabilities are recognized for the expected future tax consequences of temporary
differences between the financial reporting and tax bases of assets and liabilities, and for operating loss and tax credit carryforwards.
Deferred income tax assets and liabilities are measured using the currently enacted tax rates and laws that will be in effect when the
differences are expected to reverse. The Company records a valuation allowance to reduce deferred income tax assets to the amount that
is believed more likely than not to be realized.
As
of December 31, 2022 and 2021, the Company did not have any amounts recorded pertaining to uncertain tax positions. The Company recognizes
interest and penalties related to uncertain tax positions in general and administrative expense. The Company did not incur any penalties
or interest during the years ended December 31, 2022 and 2021. On December 22, 2017, the U.S. enacted the Tax Cuts and Jobs Act (“the
Tax Act”) which significantly changed U.S. tax law. The Tax Act lowered the Company’s statutory federal income tax rate from
a maximum of 39% to a rate of 21% effective January 1, 2018. The Company has deferred tax losses and assets and they were adjusted as
a result of the change in tax law reducing the federal income tax rate. The Company’s tax years 2015 and forward remain open.
Concentration
of Credit Risk
Financial
instruments that potentially subject the Company to concentrations of credit risk are cash, and trade receivables arising from its normal
business activities. The Company places its cash in what it believes to be credit-worthy financial institutions. The Company has a diversified
customer base, most of which are in Canada, United States and the United Kingdom. The Company controls credit risk related to trade receivables
through credit approvals, credit limits and monitoring procedures. The Company routinely assesses the financial strength of its customers
and, based upon factors surrounding the credit risk, establishes an allowance, if required, for uncollectible accounts and, as a consequence,
believes that its accounts receivable credit risk exposure beyond such allowance is limited.
Risks
and Uncertainties
The
Company is subject to risks from, among other things, competition associated with the industry in general, other risks associated with
financing, liquidity requirements, rapidly changing customer requirements, limited operating history, foreign currency exchange rates
and the volatility of public markets.
Contingencies
Certain
conditions may exist as of the date the consolidated financial statements are issued, which may result in a loss to the Company, but
which will only be resolved when one or more future events occur or fail to occur. The Company’s management and legal counsel assess
such contingent liabilities, and such assessment inherently involves judgment. In assessing loss contingencies related to legal proceedings
that are pending against the Company or un-asserted claims that may result in such proceedings, the Company’s legal counsel evaluates
the perceived merits of any legal proceedings or un-asserted claims as well as the perceived merits of the amount of relief sought or
expected to be sought.
If
the assessment of a contingency indicates it is probable that a material loss has been incurred and the amount of the liability can be
estimated, then the estimated liability would be accrued in the Company’s consolidated financial statements. If the assessment
indicates that a potential material loss contingency is not probable but is reasonably possible, or is probable but cannot be estimated,
then the nature of the contingent liability, together with an estimate of the range of possible loss if determinable and material would
be disclosed. Loss contingencies considered to be remote by management are generally not disclosed unless they involve guarantees, in
which case the guarantee would be disclosed.
Cash
and Cash Equivalents
Cash
and equivalents include cash in hand and cash in demand deposits, certificates of deposit and all highly liquid debt instruments with
original maturities of three months or less. At December 31, 2022 and 2021, there were no uninsured balances for accounts in Canada,
the United States and the United Kingdom. The Company has not experienced any losses in such accounts and believes it is not exposed
to any risks on its cash in bank accounts. At December 31, 2022 and 2021, the Company did not hold any cash equivalents.
Accounts
Receivable
All
accounts receivable under standard terms are due thirty (30) days from the date billed. If the funds are not received within thirty (30)
days, the customer is contacted to arrange payment. Currently, the Company does not provide for an allowance for uncollectable
accounts receivable due to its history of not having any collectability issues from customers.
Financing
Receivables and Guarantees
The
Company provides financing arrangements, including operating leases and financed service contracts for certain qualified customers. Lease
receivables primarily represent sales-type and direct-financing leases. Leases typically have two- to three-year terms and are collateralized
by a security interest in the underlying assets. The Company makes an allowance for uncollectible financing receivables based on a variety
of factors, including the risk rating of the portfolio, macroeconomic conditions, historical experience, and other market factors. At
December 31, 2022 and 2021 management determined that there was no allowance necessary. The Company also provides financing guarantees,
which are generally for various third-party financing arrangements to channel partners and other customers. The Company could be called
upon to make payment under these guarantees in the event of non-payment to the third party. As at December 31, 2022 and 2021, no financing
receivables are outstanding.
Advertising
Costs
The
Company expenses all advertising costs as incurred. Advertising and marketing costs were $286,717 and $134,856 for the years ended December
31, 2022 and 2021, respectively.
Inventory
Inventories
are valued at the lower of cost or net realizable value. Cost is determined using the first-in-first-out basis for finished goods. Net
realizable value is determined on the basis of anticipated sales proceeds less the estimated selling expenses. Management compares the
cost of inventories with the net realizable value and an adjustment is made to write down inventories to net realizable value, if
lower.
Fixed
Assets and Equipment on Lease
Fixed
assets and equipment on lease are stated at cost less accumulated depreciation. Fixed assets and equipment on lease are depreciated using
the straight-line method over the shorter of the estimated useful life of the asset or the lease term. The estimated useful lives of
fixed assets are generally as follows:
SCHEDULE
OF ESTIMATED USEFUL LIVES OF EQUIPMENT
| Furniture
and equipment |
5-years
straight-line |
| Vehicles |
5-years
straight-line |
| Computer
equipment |
3-years
straight-line |
| Machinery |
5-years
straight-line |
| Equipment
on lease |
5-years
straight-line |
Intangible
Assets
Intangible
assets are stated at cost less accumulated amortization and are comprised of patents. The patents are amortized straight-line over the
estimated useful life of 20 years and are reviewed annually for impairment.
Impairment
of Long-Lived Assets
The
Company reviews long-lived assets such as equipment, equipment on lease, and intangible assets with finite useful lives for impairment
whenever events or changes in circumstance indicate that the carrying amount may not be recoverable. If the total of the expected undiscounted
future cash flows is less than the carrying value of the asset, a loss is recognized for the excess of the carrying amount over the fair
value of the asset.
Financial
Instruments and Fair Value Measurements
The
Company analyzes all financial instruments with features of both liabilities and equity under ASC 480, “Distinguishing Liabilities
from Equity,” and ASC 815 “Derivatives and Hedging”.
ASC
820, “Fair Value Measurements and Disclosures,” requires disclosure of the fair value of financial instruments held
by the Company. ASC 825, “Financial Instruments,” defines fair value, and establishes a three-level valuation hierarchy
for disclosures of fair value measurement that enhances disclosure requirements for fair value measures. The carrying amounts reported
in the consolidated balance sheets for receivables and current liabilities each qualify as financial instruments and are a reasonable
estimate of their fair values because of the short period of time between the origination of such instruments and their expected realization
and their current market rate of interest. The three levels of valuation hierarchy are defined as follows:
Level
1
Level
1 applies to assets or liabilities for which there are quoted prices in active markets for identical assets or liabilities.
Level
2
Level
2 applies to assets or liabilities for which there are inputs other than quoted prices that are observable for the asset or liability
such as quoted prices for similar assets or liabilities in active markets; quoted prices for identical assets or liabilities in markets
with insufficient volume or infrequent transactions (less active markets); or model-derived valuations in which significant inputs are
observable or can be derived principally from, or corroborated by, observable market data.
Level
3
Level
3 applies to assets or liabilities for which there are unobservable inputs to the valuation methodology that are significant to the measurement
of the fair value of the assets or liabilities.
The
Company’s financial instruments consist of cash, trade receivables, trade and other payables, lease liabilities, convertible note
payable to related party, loans payable, derivative liabilities and convertible notes payable. Except for cash, loans payable, and derivative
liabilities, the Company’s financial instruments’ carrying amounts, excluding any unamortized discounts, approximate their
fair values due to their short term to maturity. The fair value of long-term lease liabilities approximates their carrying value due
to minimal changes in interest rates and the Company’s credit risk since initial recognition. Cash and derivative liabilities are
measured and recognized at fair value based on level 1 and level 2 inputs, respectively, for all periods presented.
Government
Grants
Government
grants are recognized where there is reasonable assurance that the grant will be received, and all attached conditions will be complied
with. When the grant relates to an expense item, it is recognized as income over the period necessary to match the grant on a systematic
basis to the costs that it is intended to compensate. The Canadian Emergency Business Account (“CEBA”) are recognized as
government grants. See Note 8 (a) and (b).
Loss
per Share
The
Company computes net income (loss) per share in accordance with ASC 260, Earnings per Share. ASC 260 requires presentation of both basic
and diluted earnings per share (“EPS”) on the face of the consolidated statement of operations. Basic EPS is computed by
dividing net income (loss) available to common shareholders (numerator) by the weighted average number of shares outstanding (denominator)
during the period. Diluted EPS gives effect to all dilutive potential common shares outstanding during the period using the treasury
stock method and convertible preferred stock using the if-converted method. In computing diluted EPS, the average stock price for the
period is used in determining the number of shares assumed to be purchased from the exercise of stock options or warrants. Diluted EPS
excludes all dilutive potential shares if their effect is anti-dilutive.
Stock-Based
Compensation
The
Company records stock-based compensation in accordance with ASC 718, “Compensation – Stock Compensation”, using the
fair value method. All transactions in which goods or services are the consideration received for the issuance of equity instruments
are accounted for based on the fair value of the consideration received or the fair value of the equity instrument issued, whichever
is more reliably measurable.
The
Company uses the Black-Scholes option pricing model to calculate the fair value of stock-based awards. This model is affected by the
Company’s stock price as well as assumptions regarding a number of subjective variables. These subjective variables include but
are not limited to the Company’s expected stock price volatility over the term of the awards, and actual and projected employee
stock option exercise behaviors. The value of the portion of the award that is ultimately expected to vest is recognized as an expense
in the consolidated statement of operations over the requisite service period. During the years ended December 31, 2022, and 2021 there
was no stock-based compensation.
Leases
The
Company accounts for leases in accordance with ASC 842 “Leases”.
Lessee
Arrangements
The
Company determines if an arrangement is a lease at inception. Operating and financing right-of-use assets and lease liabilities are included
within fixed assets on the consolidated balance sheets. Right-of-use assets represent our right to use an underlying asset for the lease
term and lease liabilities represent our obligation to make lease payments arising from the lease. Right-of-use assets and liabilities
are recognized at commencement date based on the present value of lease payments over the lease term. The Company uses its incremental
borrowing rate, based on the information available at the commencement date, in determining the present value of future lease payments.
Right-of-use assets include any prepaid lease payments and exclude any lease incentives and initial direct costs incurred. Operating
lease expenses are recognized on a straight-line basis over the term of the lease, consisting of interest accrued on the lease liability
and depreciation of the right-of-use asset. The lease terms may include options to extend or terminate the lease if it is reasonably
certain the Company will exercise that option.
Lessor
Arrangements
The
Company determines if an arrangement is a lease at inception. The Company then determines whether to classify the lease as a sales-type
or direct financing lease. At commencement date, a lessor shall derecognize the underlying asset and recognize the net investment in
the lease, selling profit or loss arising from the lease, and initial direct directs as an expense if the fair value of the underlying
asset is different from it carrying amount. The lease receivable (or net investment in the lease) is included on the consolidated balance
sheets. The lease receivable amount is recognized based on the present value of lease payments over the lease term and the present value
of the unguaranteed residual asset, except when the lease is a direct financing lease, whereby the net investment in the lease should
be reduced by the amount of any selling profit. The unguaranteed residual asset is the amount the lessor expects to derive from the underlying
asset following the end of the lease term. The Company uses the rate implicit in the lease agreement at the date of commencement, in
determining the present value of the future lease payments and unguaranteed residual asset. Interest income is recognized over the term
of the lease and lease payments are recognized against the lease receivable balance when received. Currently, the Company only has sales-type
operating leases.
Recently
Issued Accounting Pronouncements
Applicable
for fiscal years beginning after December 15, 2022:
In
July 2022, FASB issued ASU 2022-03, Fair Value Measurement (Topic 820); Fair Value Measurement of Equity Securities Subject to Contractual
Sale Restrictions. The FASB issued final guidance to clarify that a contractual restriction on the sale of an equity security is
not considered part of the unit of account of the equity security and, therefore, is not considered when measuring fair value. Recognizing
a contractual sale restriction as a separate unit of account is not permitted. The guidance will be applied prospectively, with special
transition provisions for entities that qualify as investment companies under ASC 946. The guidance is effective in 2024 for calendar-year
public business entities and in 2025 for all other calendar-year companies. Early adoption is permitted.
In
October 3, 2022, FASB issued ASU 2022-04, Liabilities — Supplier Finance Programs (Subtopic 405-50): Disclosure of Supplier
Finance Program Obligations. The FASB issued final guidance that requires entities that use supplier finance programs in connection
with the purchase of goods and services to disclose the key terms of the programs and information about their obligations outstanding
at the end of the reporting period, including a rollforward of those obligations. The guidance does not affect the recognition, measurement
or financial statement presentation of supplier finance program obligations. The guidance should be applied retrospectively to all periods
in which a balance sheet is presented, except for the rollforward requirement, which should be applied prospectively. The guidance is
effective for all entities for fiscal years beginning after 15 December 2022, including interim periods within those fiscal years, except
for the rollforward requirement, which is effective for fiscal years beginning after 15 December 2023. Early adoption is permitted.
Note
4 – TRADE RECEIVABLES
As
of December 31, 2022 and 2021, trade receivables consist of the following:
SCHEDULE
OF TRADE RECEIVABLES
| | |
December 31, 2022 | | |
December 31, 2021 | |
| Accounts receivables | |
$ | 711,028 | | |
$ | 271,950 | |
| Allowance for doubtful accounts | |
| - | | |
| (32,128 | ) |
| Total trade receivables, net | |
$ | 711,028 | | |
$ | 239,822 | |
Note
5 – INVENTORIES
As
of December 31, 2022, and December 31, 2021, inventories consist of the following:
SCHEDULE
OF INVENTORIES
| | |
December 31, 2022 | | |
December 31, 2021 | |
| Parts and accessories | |
$ | 217,582 | | |
$ | 226,230 | |
| Golf carts | |
| 799,035 | | |
| 158,588 | |
| E-bikes | |
| 123,280 | | |
| 35,060 | |
| Electric vehicles | |
| 64,680 | | |
| 292,800 | |
| Total inventories | |
$ | 1,204,577 | | |
$ | 712,678 | |
Note
6 – FIXED ASSETS AND EQUIPMENT ON LEASE
As
of December 31, 2022 and 2021, fixed assets consisted of the following:
SCHEDULE OF FIXED ASSETS
| | |
December 31, 2022 | | |
December 31, 2021 | |
| Machinery | |
$ | 5,040 | | |
$ | 5,040 | |
| Furniture and equipment | |
| 2,587 | | |
| 2,350 | |
| Computer equipment | |
| 50,781 | | |
| 41,784 | |
| Vehicles | |
| 19,989 | | |
| 28,360 | |
| Fixed assets, gross | |
| 19,989 | | |
| 28,360 | |
| Accumulated depreciation | |
| (52,851 | ) | |
| (42,220 | ) |
| Fixed assets, net | |
$ | 25,546 | | |
$ | 35,314 | |
For
the year ended December 31, 2022, total depreciation expense for fixed assets and equipment on lease was $12,442 (2021 - $12,225) and
is included in general and administration expense. For the year ended December 31, 2022, total depreciation for right-of-use assets was
$111,465 (2021 - $117,386) and is included in general and administration expense as operating lease expense.
Note
7 – INTANGIBLE ASSETS
As
of December 31, 2022 and 2021, intangible assets consisted of the following:
SCHEDULE OF INTANGIBLE ASSETS
| | |
December 31, 2022 | | |
December 31, 2021 | |
| Intangible asset - Patents | |
$ | 22,353 | | |
$ | 22,353 | |
| Accumulated amortization | |
| (11,977 | ) | |
| (10,749 | ) |
| Intangible asset, net | |
$ | 10,376 | | |
$ | 11,604 | |
Patents
are amortized on a straight-line basis over their estimated useful life of 20 years. For the year ended December 31, 2022, total amortization
expense for intangible assets was $1,228 (2021 - $1,229).
Note
8 – TRADE AND OTHER PAYABLES
As
of December 31, 2022, and 2021, trade and other payables consist of the following:
SCHEDULE OF TRADE AND OTHER PAYABLES
| | |
December 31, 2022 | | |
December 31, 2021 | |
| Accounts payable and accrued expenses | |
$ | 1,462,557 | | |
$ | 949,937 | |
| Accrued interest | |
| 1,880,463 | | |
| 248,610 | |
| Other liabilities | |
| 13,236 | | |
| 4,051 | |
| Total trade and other payables | |
$ | 3,356,256 | | |
$ | 1,202,598 | |
Note
9 – LOANS PAYABLE
As
of December 31, 2022 and 2021, loans payable consisted of the following:
SCHEDULE OF LOANS PAYABLE
| | |
December 31, 2022 | | |
December 31, 2021 | |
| Unsecured loan payable in the amount of CDN$40,000, due on or before December 31, 2025(a) | |
$ | 29,520 | | |
| 31,449 | |
| Unsecured loan payable in the amount of CDN$40,000, due on or before December 31, 2025 (b) | |
| 29,520 | | |
| 31,449 | |
| Unsecured loan payable, due on May 21, 2022, interest at 1% per annum(c) | |
| - | | |
| 30,115 | |
| Secured loan payable, due on June 5, 2050, interest at 3.75% per annum(d) | |
| 150,000 | | |
| 150,000 | |
| Unsecured loan payable, due on June 20, 2022, interest at 9% per annum(e) | |
| - | | |
| 2,084,934 | |
| Unsecured loan payable, due on December
1, 2025, interest at 10%
per annum(f) | |
| 1,000,000 | | |
| - | |
| Preferred F series shares issued with mandatory redemption(g) | |
| 1,357,651 | | |
| - | |
| | |
| 2,566,692 | | |
| 2,327,947 | |
| Current portion | |
| (2,416,692 | ) | |
| (2,115,049 | ) |
| Loans payable, long-term portion | |
$ | 150,000 | | |
$ | 212,898 | |
| (e) |
2,000,000
on September 13, 2021,
in exchange for the issuance of an unsecured promissory note in the principal amount of $2,400,000,
which was inclusive of a $400,000
original issue discount
and bears interest at 9%
per annum to the holder and matures June
20, 2022. If
the note is not paid in full before December 12, 2021, an additional $100,000 of guaranteed interest will be added to the note. An
additional $100,000 of guaranteed interest will be added to the note on the 12th day of each succeeding month during which
any portion of the note remains unpaid.
Any principal or interest on the note that is not paid when due or during any period of default bears interest at 24% per annum. |
| |
|
| |
In the event of a default,
the note is convertible at the price that is equal to a 40% discount to the lowest trading price of the Company’s common shares
during the 30-day trading period prior to the conversion date. |
| |
|
| |
During the year ended December
31, 2022, the Company recorded $1,918,065 in interest expense including $1,603,000 of additional interest. As at December 31, 2022,
the carrying value of the convertible promissory note was $2,400,000 (December 31, 2021 - $2,084,935). |
| |
|
| |
As
the note is in default, it has become convertible at the holder’s request. The fair value of the loan approximates carrying
value as it is now short term in nature, effectively due on demand. |
| |
|
| (f) |
1,000,000.
The loan bears interest at 10%
per annum and is due on December 1, 2025. If not repaid by December 31, 2025, the loan bears interest at 18%
per annum. |
| |
|
| (g) |
|
| |
|
| |
During the year ended December
31, 2022, the Company made required payments in the amount of $20,411, which was applied against the loan payable. |
Note
10 – CONVERTIBLE LOANS
As
of December 31, 2022, and 2021, convertible loans payable consisted of the following:
Third
Party Convertible Notes Payable
| (a) |
On March 31, 2015, the Company issued a convertible
promissory note in the principal amount of $310,000 to a company owned by a former director of the Company for marketing services.
The note is unsecured, bears interest at 5% per annum, is convertible at $1.25 per common share, and is due on demand. As at December
31, 2022, the carrying value of the convertible promissory note was $310,000 (December 31, 2021 - $310,000). |
| |
|
| (b) |
On June 5, 2017, the Company issued a convertible promissory
note in the principal amount of $110,000. As at December 31, 2022, the carrying value of the note was $9,488 (December 31, 2021 -
$9,439), relating to an outstanding penalty. |
| |
|
| (c) |
As per Note 9 (e) above, the $2,400,000 convertible
note went into default, and therefore it has become convertible at the holder’s request. The fair value of the loan approximates
carrying value as it is now short term in nature, effectively due on demand. |
Note
11 – LEASES
Lessor
During
the year ended December 31, 2020, the Company began financing the lease of certain assets under rental revenue contracts with its customers
and accounts for them in accordance with ASC 842 as outlined under “Leases” in Note 3 of the consolidated financial statements
for the year ended December 31, 2020.
During
the year ended December 31, 2022, the Company recognized new lease receivables of $143,630, net of the $nil of leases transferred to
third party management (December 31, 2021 - $817,619 net of $120,231 of leases transferred to third party management). The lease receivable
reflects lease payments expected to be received over the terms of the agreements and derecognized $12,240 (December 31, 2021 - $492,096)
in inventory related to the underlying assets, being recorded to cost of goods sold. During the year ended December 31, 2022, the Company
sold $867,450 of lease receivables to a third party for $863,527. As a result of the sale, the Company derecognized the carrying value
of $867,450 for the leases sold on the date of the transaction and recognized a loss of $3,923 in other income and expenses.
SCHEDULE OF LEASE RECEIVABLES RECOGNIZED
| Lease receivable | |
December 31, 2022 | | |
December 31, 2021 | |
| Balance, beginning of the period | |
$ | 810,236 | | |
$ | 42,856 | |
| Additions | |
| 143,630 | | |
| 937,850 | |
| Transfer to third party | |
| (867,450 | ) | |
| (120,231 | ) |
| Interest on lease receivables | |
| 20,841 | | |
| 19,452 | |
| Receipt of payments | |
| (81,979 | ) | |
| (60,445 | ) |
| Foreign exchange | |
| (5,733 | ) | |
| (9,246 | ) |
| Balance, end of the period | |
| 19,545 | | |
| 810,236 | |
| Current portion of lease receivables | |
| (3,627 | ) | |
| (87,020 | ) |
| Long term potion of lease receivables | |
$ | 15,918 | | |
$ | 723,216 | |
Lease
receivables are measured at the commencement date based on the present value of future lease payments less the present value of the unguaranteed
residual asset. The Company used the rate implicit in the rental revenue contracts to calculate the present value of future payments
and unguaranteed residual asset at the date of commencement.
Lessee
The
Company leases certain assets under lease agreements.
On
October 1, 2019, the Company entered into a 5-year lease agreement for a photocopier (the “Copier Lease”). Upon recognition
of the lease, the Company recognized right-of-use assets of $8,683 and lease liabilities of $8,683. As of December 31, 2022, the Copier
lease had a remaining term of 1.75 years.
On
July 10, 2020, the Company entered into a lease agreement for retail, showroom and warehouse space in Fairfield, CA (the “Fairfield
Lease”). Upon initial recognition of the lease, the Company recognized right-of-use assets of $164,114 and lease liabilities of
$156,364. The difference between the recorded operating lease assets and lease liabilities is due to prepaid rent deposits to be applied
to first months’ rent of $7,750. The lease included a rent-free period with rent payments commencing on October 1, 2020. On August
10, 2022, the lease ended.
On
July 14, 2020, the Company entered into a lease agreement for office space in Surrey, BC (the “Croydon Lease”). Upon initial
recognition of the lease, the Company recognized right-of-use assets of $133,825 and lease liabilities of $125,014. The difference between
the recorded operating lease assets and lease liabilities is due to prepaid rent deposits to be applied to first months’ rent of
$8,811 (CDN$11,948). The lease included a rent-free period with rent payments commencing on September 1, 2020. As of December 31, 2022,
the lease had a remaining term of 0.58 years.
On
April 1, 2021, the Company entered into a lease agreement for equipment (the “FD150 Lease”). Upon initial recognition of
the lease, the Company recognized right-of-use assets of $1,018 and lease liabilities of $1,018. As of December 31, 2022, the Copier
lease had a remaining term of 1.33 years.
On
June 2, 2021, the Company entered into a lease agreement for a trailer (the “Trailer Lease”). Upon initial recognition of
the lease, the Company recognized right-of-use assets of $8,886 and lease liabilities of $8,886. As of December 31, 2022, the Copier
lease had a remaining term of 2.42 years.
Right-of-use
assets have been included within fixed assets, net and lease liabilities have been included in lease liability on the Company’s
consolidated balance sheet.
SCHEDULE OF CONSOLIDATED BALANCE SHEET OF LEASE
| Right-of-use assets | |
December 31, 2022 | | |
December 31, 2021 | |
| Cost | |
$ | 312,318 | | |
$ | 312,318 | |
| Accumulated depreciation | |
| (282,251 | ) | |
| (170,530 | ) |
| Foreign exchange | |
| (506 | ) | |
| 29 | |
| Total right-of-use assets | |
$ | 29,561 | | |
$ | 141,880 | |
| Lease liability | |
December 31, 2022 | | |
December 31, 2021 | |
| Current portion | |
$ | 35,670 | | |
$ | 121,270 | |
| Long-term portion | |
| 4,982 | | |
| 38,696 | |
| Total lease liability | |
$ | 40,652 | | |
$ | 159,966 | |
Lease
liabilities are measured at the commencement date based on the present value of future lease payments. As the Company’s leases
did not provide an implicit rate, the Company used its incremental borrowing rate based on the information available at the commencement
date in determining the present value of future payments. The Company used a weighted average discount rate of 11.98% in determining
its lease liabilities. The discount rate was derived from the Company’s assessment of borrowings.
Right-of-use
assets include any prepaid lease payments and exclude any lease incentives and initial direct costs incurred. Lease expense for minimum
lease payments is recognized on a straight-line basis over the lease term. The lease terms may include options to extend or terminate
the lease if it is reasonably certain that the Company will exercise that option.
Lease
expense for the year ended December 31, 2022, was $118,843 (2021 - $144,758) and is recorded in general and administration expense.
Future
minimum lease payments to be paid by the Company as a lessee for leases as of December 31, 2022 for the next three years are as follows:
SCHEDULE OF FUTURE MINIMUM LEASE PAYMENTS
| Lease commitments and lease liability | |
December 31, 2022 | |
| 2023 | |
$ | 37,814 | |
| 2024 | |
| 4,300 | |
| 2025 | |
| 1,070 | |
| Total future minimum lease payments | |
| 43,184 | |
| Discount | |
| (2,532 | ) |
| Total | |
| 40,652 | |
| Current portion of lease liabilities | |
| (35,670 | ) |
| Long-term portion of lease liabilities | |
$ | 4,982 | |
Note
12 – MEZZANINE EQUITY
Authorized
5,000,000
shares of redeemable Series C preferred shares, authorized, each having a par value of $0.001 per share. Each share of Series C preferred
shares is convertible into shares of common stock at a conversion rate equal to the lowest traded price for the fifteen trading days
immediately preceding the date of conversion.
1,000,000
shares of redeemable Series D preferred shares, authorized, each having a par value of $0.001 per share. Each share of Series D preferred
shares is convertible into 5 shares of common stock.
5,000,000
shares of redeemable Series E preferred shares, authorized, each having a par value of $0.001 per share. Each share of Series E preferred
shares is convertible into 4 shares of common stock.
10,000
shares of redeemable Series F preferred shares, authorized, each having a par value of $0.001 per share. Each share of Series F preferred
shares is convertible into common stock at an amount equal to the lesser of (a) one hundred percent of the lowest traded price for the
Company’s stock for the fifteen trading days immediately preceding the relevant Conversion and (b) a twenty percent discount to
the price of the common stock in an offering with gross proceeds of at least $10,000,000.
The
following table summarizes the Company’s redeemable preferred share activities for the years ended December 31, 2022, and December
31, 2021.
SCHEDULE
OF REDEEMABLE PREFERRED SHARE ACTIVITIES
| | |
Shares | | |
Par | | |
Additional paid in capital | | |
To be issued | | |
Total | |
| Balance December 31, 2020 | |
| 49,230 | | |
$ | 49 | | |
$ | 1,007,895 | | |
$ | 1,265,799 | | |
$ | 2,273,743 | |
| Issuance | |
| 3,500 | | |
| 4 | | |
| 2,731,989 | | |
| (745,926 | ) | |
| 1,986,067 | |
| Converted for common shares | |
| (1,926 | ) | |
| (2 | ) | |
| (1,538,098 | ) | |
| - | | |
| (1,538,100 | ) |
| Accrued preferred stock dividends | |
| - | | |
| - | | |
| - | | |
| 455,500 | | |
| 455,500 | |
| Balance, December 31, 2021 | |
| 50,804 | | |
$ | 51 | | |
$ | 2,201,786 | | |
$ | 975,373 | | |
$ | 3,177,210 | |
| | |
| | | |
| | | |
| | | |
| | | |
| | |
| Balance December 31, 2021 | |
| 50,804 | | |
$ | 51 | | |
$ | 2,201,786 | | |
$ | 975,373 | | |
$ | 3,177,210 | |
| Balance | |
| 50,804 | | |
$ | 51 | | |
$ | 2,201,786 | | |
$ | 975,373 | | |
$ | 3,177,210 | |
| Issuance | |
| 1,839 | | |
| - | | |
| 714,000 | | |
| (464,000 | ) | |
| 250,000 | |
| Converted for common shares | |
| (620 | ) | |
| - | | |
| (302,556 | ) | |
| (33,808 | )(2) | |
| (336,364 | ) |
| Accrued preferred stock dividends(1) | |
| - | | |
| - | | |
| (838,064 | ) | |
| 382,563 | | |
| (455,501 | ) |
| Balance, December 31, 2022 | |
| 52,023 | | |
$ | 51 | | |
$ | 1,775,166 | | |
$ | 860,128 | | |
$ | 2,635,345 | |
| Balance | |
| 52,023 | | |
$ | 51 | | |
$ | 1,775,166 | | |
$ | 860,128 | | |
$ | 2,635,345 | |
Mezzanine
Preferred Equity Transactions
During
the year ended December 31, 2022:
| |
● |
620 Series F Preferred Shares were converted into common
shares (see note 14). |
| |
|
|
| |
● |
On October 21, 2022, pursuant to the December 2021
Series F SPA, the Company received $410,000 for the subscription of 410 Series F preferred shares (see note 9(f)), as well as issued
96 Series F preferred shares to settle $96,000 in dividends payable. |
| |
|
|
| |
● |
On September 15, 2022, pursuant to the December 2021
Series F SPA, the Company received $125,000 for the subscription of 125 Series F preferred shares (see note 9(f)). The shares were
issued on October 18, 2022. |
| |
● |
On August 26, 2022, pursuant to the December 2021 Series
F SPA, the Company received $250,000 for the subscription of 250 Series F preferred shares (see note 9(f)). |
| |
|
|
| |
● |
On July 29, 2022, pursuant to the December 2021 Series
F SPA, the Company received $90,000 for the subscription of 90 Series F preferred shares, as well as issued 368 Series F preferred
shares to settle $368,000 in dividends payable. |
| |
|
|
| |
● |
On March 31, 2022, pursuant to the December 2021 Series
F SPA, the Company received $250,000 for the subscription of 250 Series F preferred shares (see note 9(f)). The shares were issued
on April 1, 2022. |
| |
|
|
| |
● |
On February 7, 2022, pursuant to the December 2021
Series F SPA, the Company received $250,000 for the subscription of 250 Series F preferred shares (see note 9(f)). |
| |
|
|
| |
● |
On January 4, 2022, pursuant to the December Series
2021 F SPA, the Company received $250,000 for the subscription of 250 Series F preferred shares (see note 9(f)). These shares were
issued April 1, 2022 and recorded as such. |
During
the year ended December 31, 2021:
| |
● |
1,512 Series C Preferred
Shares were converted into common shares, see note 14. |
| |
|
|
| |
● |
On November 6, 2020, the
Company received gross proceeds of $300,000 for 300 Series C Preferred Shares in lieu of the Second Closing for the Series C Share
Purchas Agreement (the “Series C SPA”). The shares were included in preferred shares to be issued at December 31, 2020.
The preferred shares were issued April 13, 2021. |
| |
|
|
| |
● |
On December 7, 2020, the
Company received gross proceeds of $200,000 for 200 Series C Preferred Shares in lieu of the Second Closing for the Series C SPA.
The shares are included in preferred shares to be issued as at December 31, 2020. The preferred shares were issued April 13, 2021.
|
| |
|
|
| |
● |
On
December 23, 2020, the Company entered into a Securities Purchase Agreement (the “Series F SPA”) whereby the Company
agreed to sell and the Purchaser agrees to purchase, in a series of closings (the “Closings”) of at least 1,000 Series
F preferred shares at a price of $1,000 per share. The First and Second Closings, will each be for 1,500 Preferred Shares at a purchase
price of $1,500,000, the Second Closing which will follow the filing of the Registration Statement. Any Additional Closings will
be for the purchase of at least 1,000 Series F preferred shares, every thirty calendar days, and shall follow the Registration Statement
being declared effective. The Company granted 3,000,000 warrants, with a relative fair value of $768,008, concurrently with the execution
of the Series F SPA and First Closing. The First Closing shares were included in preferred shares to be issued at December 31, 2020
with a relative fair value of $731,992. |
| |
|
|
| |
|
On February 4, 2021, the
Company issued 1,500 Series F preferred shares pursuant to the First Closing of the Series F SPA with a relative fair value of $731,992.
Additionally, the Company issued 1,500 Series F preferred shares pursuant to the Second Closing of the Series F SPA for gross proceeds
for $1,500,000. |
| |
|
|
| |
● |
On
June 10, 2021, pursuant to the Series F SPA, the Company received $350,000 for the subscription of an additional 350 Series F preferred
shares to be issued. |
| |
|
|
| |
● |
On
July 20, 2021, pursuant to another Securities Purchase Agreement (the “July Series F SPA”), the Company received $400,000
for the subscription of 400 Series F preferred shares with a relative fair value of $138,066 and 1,180,000 warrants with a relative
fair value of $261,934 valued on the agreement date which are recorded as obligation to issue shares and obligation to issue warrants
respectively at December 31, 2021, see note 14. |
| |
|
|
| |
● |
On
August 3, 2021, 275 Series F Preferred Shares were converted into common shares, see note 14. |
| |
● |
On
October 22, 2021, 210 Series F Preferred Shares were converted into common shares, see note 14. |
| |
|
|
| |
● |
On
November 30, 2021, 491 Series F Preferred Shares were converted into common shares, see note 14. |
| |
|
|
| |
● |
On
December 14, 2021, pursuant to another Securities Purchase Agreement (the “December Series F SPA”), the Company received
$312,000 for the subscription of 312 Series F preferred shares. $12,000 was incurred as share issuance costs. |
| |
|
|
| |
● |
On
December 31, 2021, pursuant to the December Series F SPA, the Company received $250,000 for the subscription of 250 Series F preferred
shares. |
Mezzanine
preferred equity, series C and series F, carry a dividend policy which entitles each preferred share to receive, and the Company to pay,
cumulative dividends of 10% per annum, payable quarterly, beginning on the original issuance date and ending on the date that such preferred
shares has been converted or redeemed. At the option of the Company, accrued dividends can be settled in preferred shares of the same
series, or in cash. Any dividends that are not paid quarterly on the dividend payment date shall entail a late fee, which must be paid
in cash at the rate of 18% per annum, which accrues and compounds daily from the dividend payment date, through to and including the
date of the actual payment in full. As at December 31, 2022 the Company recorded $382,563 in dividends to be settled in preferred shares,
and $107,081 in penalty interest.
Note
13 – PREFERRED STOCK
Authorized
3,000,000
shares of Series A preferred shares authorized, each having a par value of $0.001 per share.
10,000
shares of Series B convertible preferred shares authorized, each having a par value of $0.001 per share. Each share of Series B convertible
preferred shares is convertible into 100,000 shares of common stock.
Preferred
Stock Transactions
During
the year ended December 31, 2022:
| |
● |
On November 3, 2022, the
Company issued 30 shares of Series B preferred shares to a consultant of the Company for services to be rendered. These preferred
shares were value at $213,000 based on the fair value of the underlying common stock. |
| |
|
|
| |
● |
On August 1, 2022, the
Company issued an aggregate of 191 shares of Series B preferred shares to the CEO of the Company for past services. These preferred
shares were value at $897,000 based on the fair value of the underlying common stock. |
| |
|
|
| |
● |
On June 27, 2022, the Company
issued an aggregate of 105 shares of Series B preferred shares to the Company’s board of directors for past services. These
preferred shares were value at $777,000 based on the fair value of the underlying common stock. |
During
the year ended December 31, 2021:
| |
● |
On October 26, 2020, the
Company agreed to issue Series B preferred shares that are convertible into 1,000,000 common shares and 1,000,000 warrants for investor
relations services. The preferred shares were valued at $1,340,000 based on the fair value of the underlying common stock and included
in preferred shares to be issued at December 31, 2020. On February 17, 2021, the Company issued 100 shares of Series B preferred
shares and 1,000,000 warrants, see note 14. 1 Series B preferred share is convertible into 100,000 shares of common stock, which
meant that only 10 shares of Series B preferred shares should have been issued. On May 26, 2021, 50 shares of Series B preferred
shares, instead of 5 shares of Series B preferred shares, were converted into 500,000 shares of common stock with a fair value of
$670,000. On September 16, 2021, the Company cancelled 45 shares of Series B preferred shares and 5 shares of Series B preferred
shares were converted into 500,000 shares of common stock with a fair value of $670,000. |
| |
● |
On March 4, 2021, the Company
issued an aggregate of 16 shares of Series B preferred shares to the Company’s board of directors for past services. These
preferred shares were valued at $849,600 based on the fair value of the underlying common stock. |
| |
|
|
| |
● |
125 Series B preferred
shares with a fair value of $1,734,800, were converted into common shares, inclusive of the conversion noted above, see note 14. |
Note
14 – COMMON STOCK AND ADDITIONAL PAID IN CAPITAL
Authorized
350,000,000
common shares, authorized, each having a par value of $0.001 per share.
Common
Stock Transactions
During
the year ended December 31, 2022:
| |
● |
The Company issued an aggregate
of 500,000 shares of common stock to satisfy shares to be issued for investor relations. The shares had a fair value of $46,000
of which $26,353 of expense was recognized during the year period ended December 31, 2022. $19,647 of expense was recorded during
the year ended December 31, 2021 and $26,353 was recorded as prepaid. |
| |
|
|
| |
● |
The Company issued 160,000
shares of common stock with a fair value of $13,760 for investor relations services. |
| |
|
|
| |
● |
The Company issued 500,000
shares of common stock with a fair value of $47,000 for legal services. |
| |
|
|
| |
● |
The Company issued 15,924,810
shares of common stock with a fair value of $302,557 for conversion of 470 Series F Preferred Shares. |
During
the year ended December 31, 2021:
| |
● |
The Company issued an aggregate
of 8,138,975 shares of common stock with a fair value of $1,436,044, to satisfy shares to be issued at December 31, 2020 for debt
settlement. |
| |
|
|
| |
● |
The Company issued 715,000
shares of common stock with a fair value of $191,235 pursuant to a legal settlement, see Note 18. |
| |
|
|
| |
● |
The Company issued 2,430,000
shares of common stock with a fair value of $565,250 for consulting services. |
| |
|
|
| |
● |
The Company issued 23,046,760
shares of common stock with a fair value of $3,822,829 and share issue costs of $2,000 for conversion of 125 Series B Preferred Shares
with a fair value of $1,734,800, conversion of 1,512 Series C Preferred Shares with a fair value of $1,462,296, and conversion of
976 Series F Preferred Shares with a fair value of $625,803. |
| |
|
|
| |
● |
The Company cancelled 1,751,288
shares of common stock which were returned to treasury due to a duplicated issuance for share settled debt during the year ended
December 31, 2020. |
Common
Stock to be Issued
Common
stock to be issued as at December 31, 2022 consists of:
None.
Common
stock to be issued as at December 31, 2021 consists of:
| |
● |
97,260 shares valued at
$19,647 to be issued pursuant to a service agreement. These were issued February 11, 2022. |
Warrants
During
the year ended December 31, 2022:
| |
● |
On December 31, 2022, 6,813,371
warrants of the Company expired. |
During
the year ended December 31, 2021:
| |
● |
The Company granted 1,000,000
warrants with a contractual life of three years and exercise price of $0.25 per share pursuant to an investor relations agreement
dated October 26, 2020. The warrants were valued at $163,998. |
| |
|
|
| |
● |
The Company granted 500,000
warrants with a contractual life of four years and exercise price of $1.00 per share. The warrants were valued at $668,461. |
| |
|
|
| |
● |
The Company granted 2,000,000
warrants with a contractual life of five years and exercise price of $0.35 per share. The warrants were valued at $410,425. |
| |
|
|
| |
● |
On July 20, 2021, pursuant
to the July Series F SPA, the Company is to issue 1,180,000 warrants with a relative fair value of $138,066 valued on the agreement
date, see note 12. The warrants have a contractual life of 5 years and exercise price of $0.30 per share. As at December 31, 2021,
these warrants have not been issued. |
The
fair values of the warrants were calculated using the following assumptions for the Black Scholes Option Pricing Model:
SCHEDULE OF WARRANTS ASSUMPTIONS
| |
|
December
31, 2022 |
|
|
December
31, 2021 |
|
| Risk-free interest rate |
|
|
0.18% - 0.82 |
% |
|
|
0.18% - 0.82 |
% |
| Expected life |
|
|
3.29 - 5.11 years |
|
|
|
3.29 - 5.11 years |
|
| Expected dividend rate |
|
|
0 |
% |
|
|
0 |
% |
| Expected volatility |
|
|
285.40 – 300.18 |
% |
|
|
285.40 – 300.18 |
% |
Continuity
of the Company’s common stock purchase warrants issued and outstanding is as follows:
SCHEDULE OF WARRANTS OUTSTANDING
| | |
Warrants | | |
Weighted average
exercise price | |
| Outstanding as at December 31, 2020 | |
| 12,939,813 | | |
$ | 0.60 | |
| Granted | |
| 3,500,000 | | |
| 0.41 | |
| Outstanding as at December 31, 2021 | |
| 16,439,813 | | |
$ | 0.56 | |
| Expired | |
| 6,813,371 | | |
| 0.78 | |
| Outstanding as at December 31, 2022 | |
| 9,626,442 | | |
$ | 0.40 | |
As
at December 31, 2022, the weighted average remaining contractual life of warrants outstanding was 2.61 years (2021 – 2.53 years)
with an intrinsic value of $nil (2021 - $nil).
Note
15 – RELATED PARTY TRANSACTIONS
The
Company repaid $28,118
of management fees and salaries previously owing
to the President and CEO, of the Company from December 31, 2021 during the year ended December 31, 2022. As at December 31, 2022, the
Company owed $49,441
(December 31, 2021 - $28,118
($ 35,710
CDN)) to the President, CEO, and CFO of the Company
and to the President, CEOs, and CFOs of the Company’s subsidiaries for management fees and salaries. Amounts owed and owing are
unsecured, non-interest bearing, and due on demand.
On
March 4, 2021, the Company issued an aggregate of 16 shares of Series B convertible preferred shares to the Company’s board of
directors for past services. These preferred shares were valued at $849,600 based on the fair value of the underlying common stock. The
issuance is recorded under compensation expense.
On
May 21, 2020, the Company issued an aggregate of 136 shares of Series B convertible preferred shares to various parties for past services
to the Company, which included 122 issued to directors and employees and 2 issued to a former director of the Company. These preferred
shares were valued at $767,040, based on the fair value of the underlying common stock, discounted for the six months hold period before
the preferred shares can be converted. The issuance is recorded under compensation expense.
Note
16 – SEGMENT INFORMATION
During
the year ended December 31, 2022, the Company’s operations included revenue and costs from the sale and rental of GPS tracking
devices and interfaces for golf vehicles and related support services, the sale of golf vehicles, and the sale of electric vehicles
which includes e-bikes. The Company’s reporting segments are those associated with operating segments above, and the administration of the
Company.
SCHEDULE OF SEGMENT REPORTING INFORMATION
| | |
Administration | | |
Electric Vehicles | | |
Golf Carts | | |
GPS Units | | |
Total | |
| Revenue | |
$ | - | | |
$ | 221,567 | | |
$ | 1,394,964 | | |
$ | 2,217,322 | | |
$ | 3,833,853 | |
| Cost of revenue | |
| - | | |
| 191,367 | | |
| 827,299 | | |
| 1,064,302 | | |
| 2,082,968 | |
| Gross profit | |
| - | | |
| 30,200 | | |
| 567,665 | | |
| 1,153,020 | | |
| 1,750,885 | |
| | |
| | | |
| | | |
| | | |
| | | |
| | |
| Operating expenses | |
| | | |
| | | |
| | | |
| | | |
| | |
| Compensation expense | |
| 2,151,306 | | |
| 268,324 | | |
| 123,789 | | |
| 991,397 | | |
| 3,534,816 | |
| General and administration expense | |
| 1,765,303 | | |
| 362,924 | | |
| 891,777 | | |
| 409,071 | | |
| 3,429,075 | |
| Research and development | |
| - | | |
| 17,500 | | |
| 34,844 | | |
| - | | |
| 52,344 | |
| Bad debt expense (recovery) | |
| (29,389 | ) | |
| - | | |
| - | | |
| - | | |
| (29,389 | ) |
| Depreciation and amortization expense | |
| 13,670 | | |
| - | | |
| - | | |
| - | | |
| 13,670 | |
| Total operating expense | |
| 3,900,891 | | |
| 648,748 | | |
| 1,050,410 | | |
| 1,400,468 | | |
| 7,000,516 | |
| Loss from operations | |
| (3,900,891 | ) | |
| (618,548 | ) | |
| (482,745 | ) | |
| (247,448 | ) | |
| (5,249,631 | ) |
| | |
| | | |
| | | |
| | | |
| | | |
| | |
| Other income (expense) | |
| | | |
| | | |
| | | |
| | | |
| | |
| Foreign currency exchange | |
| (28,241 | ) | |
| - | | |
| - | | |
| - | | |
| (28,241 | ) |
| Loss on sale of lease receivable | |
| - | | |
| - | | |
| - | | |
| (3,923 | ) | |
| (3,923 | ) |
| (Loss) Gain on extinguishment of debt | |
| 40,355 | | |
| - | | |
| - | | |
| - | | |
| 40,355 | |
| Gain on disposal | |
| - | | |
| 3,960 | | |
| - | | |
| - | | |
| 3,960 | |
| Interest on preferred shares | |
| (3,062 | ) | |
| - | | |
| - | | |
| - | | |
| (3,062 | ) |
| Finance costs | |
| (2,055,801 | ) | |
| - | | |
| - | | |
| (251,048 | ) | |
| (2,306,849 | ) |
| Total other income (expense) | |
| (2,046,749 | ) | |
| 3,960 | | |
| - | | |
| (254,971 | ) | |
| (2,297,760 | ) |
| Net loss | |
$ | (5,947,640 | ) | |
$ | (614,588 | ) | |
$ | (482,745 | ) | |
$ | (502,419 | ) | |
$ | (7,547,391 | ) |
| | |
| | | |
| | | |
| | | |
| | | |
| | |
| Total Assets | |
$ | 164,567 | | |
$ | 351,561 | | |
$ | 1,007,916 | | |
$ | 720,252 | | |
$ | 2,244,296 | |
The
following table shows a breakdown of the geographic location where the Company’s assets as at December 31, 2022, are located.
SCHEDULE
OF ASSETS BY GEOGRAPHIC AREA
| | |
Canada | | |
USA | | |
UK | | |
Mexico | | |
Australia | | |
China | | |
Total | |
| Total
Assets | |
$ | 450,923 | | |
$ | 1,637,294 | | |
$ | 4,699 | | |
$ | 40,000 | | |
$ | 98,225 | | |
$ | 13,155 | | |
$ | 2,244,296 | |
Note
17 – COMMITMENTS
Product
Warranties
The
Company’s warranty policy generally covers a period of two years which is also covered by the manufacturer warranty. Thus, any
warranty costs incurred by the Company are immaterial .
Indemnifications
In
the normal course of business, the Company indemnifies other parties, including customers, lessors, and parties to other transactions
with the Company, with respect to certain matters. The Company has agreed to hold the other parties harmless against losses arising from
a breach of representations or covenants, or out of intellectual property infringement or other claims made against certain parties.
These agreements may limit the time within which an indemnification claim can be made and the amount of the claim. In addition, the Company
has entered into indemnification agreements with its officers and directors, and the Company’s bylaws contain similar indemnification
obligations to the Company’s agents. It is not possible to determine the maximum potential amount under these indemnification agreements
due to the Company’s limited history with prior indemnification claims and the unique facts and circumstances involved in each
particular agreement. Historically, payments made by the Company under these agreements have not had a material effect on the Company’s
operating results, financial position, or cash flows.
Note
18 – INCOME TAX
The
Company is subject to income taxes in Canada and the US. The statutory income tax rates were 27% in Canada and 27.5% in the US. A reconciliation
of the expected income tax recovery is as follows:
SCHEDULE
OF RECONCILIATION OF INCOME TAX EXPENSE
| | |
December 31, 2022 | | |
December 31, 2021 | |
| | |
Year Ended | |
| | |
December 31, 2022 | | |
December 31, 2021 | |
| | |
$ | | |
$ | |
| Income tax rate | |
| 27.00 | % | |
| 27.00 | % |
| Income tax recovery calculated using statutory rate | |
| (2,038,000 | ) | |
| (1,733,000 | ) |
| Increase (decrease) in income taxes resulting from: | |
| | | |
| | |
| Non-deductible (taxable) items | |
| 88,000 | | |
| 54,000 | |
| Effect of tax rate change | |
| (17,000 | ) | |
| (2,000 | ) |
| Effect of different tax jurisdiction rates | |
| 24,000 | | |
| 68,000 | |
| Change in tax assets not recognized | |
| 1,926,000 | | |
| 1,613,000 | |
| Income tax expense (recovery) | |
| - | | |
| - | |
The
nature and tax effect of the temporary difference giving rise to the deferred tax assets and liabilities at December 31, 2022 and 2021,
are summarized as follows:
SCHEDULE OF DEFERRED TAX ASSETS AND LIABILITIES
| | |
December 31, 2022 | | |
December 31, 2021 | |
| | |
Year Ended | |
| | |
December 31, 2022 | | |
December 31, 2021 | |
| | |
$ | | |
$ | |
| Deferred tax assets | |
| | | |
| | |
| Capital assets | |
| 20,000 | | |
| 16,000 | |
| ROU assets | |
| 31,000 | | |
| 5,000 | |
| Non-capital losses | |
| 17,317,000 | | |
| 15,426,000 | |
| Capital leases | |
| 9,000 | | |
| 24,000 | |
| Accounts receivable | |
| 29,000 | | |
| 9,000 | |
| Total deferred tax assets | |
| 17,406,000 | | |
| 15,480,000 | |
| Unrecognized benefit from income tax losses | |
| (17,406,000 | ) | |
| (15,480,000 | ) |
| Net deferred tax assets | |
| - | | |
| - | |
Deferred
income taxes arise from temporary differences between the tax and financial statement recognition of revenue and expense. In evaluating
the ability to recover the deferred tax assets within the jurisdiction from which they arise, the Company considered all available positive
and negative evidence, including scheduled reversals of deferred tax liabilities, projected future taxable income, tax planning strategies
and recent financial operations. In projecting future taxable income, the Company began with historical results adjusted for changes
in accounting policies and incorporates assumptions including the amount of future pretax operating income, the reversal of temporary
differences, and the implementation of feasible and prudent tax planning strategies. These assumptions require significant judgment about
the forecasts of future taxable income and are consistent with the plans and estimate the Company are using to manage the underlying
businesses. In evaluating the objective evidence that historical results provide, the Company consider three years of cumulative operating
income (loss).
As
of December 31, 2022, the Company had aggregate net operating losses of $65,242,086 (2021 - $57,694,695) to offset future taxable income
in the United States and the United Kingdom. The deferred tax assets at December 31, 2022 were fully reserved. Management believes it
is more likely than not that these assets will not be realized in the near future.
Note
19 – SUPPLEMENTAL CASH FLOW INFORMATION
SCHEDULE OF SUPPLEMENTAL CASH FLOW INFORMATION
| | |
December 31, 2022 | | |
December 31, 2021 | |
| | |
Year Ended | |
| | |
December 31, 2022 | | |
December 31, 2021 | |
| | |
| | |
| |
| Cash paid during the period for: | |
| | | |
| | |
| Income tax payments | |
$ | - | | |
$ | - | |
| Interest payments | |
| 11,222 | | |
| 57,111 | |
| | |
| | | |
| | |
| Non-cash investing and financing transactions: | |
| | | |
| | |
| Shares issued for debt settlement | |
$ | - | | |
$ | 191,235 | |
| Shares issued on conversion of preferred shares | |
$ | 302,557 | | |
$ | 2,088,100 | |
| Dividends payable with preferred shares to be issued | |
| 382,563 | | |
| 455,500 | |
| Initial recognition of lease assets | |
$ | 143,630 | | |
$ | 9,904 | |
| Initial recognition of lease liabilities | |
$ | 143,630 | | |
$ | 9,904 | |
Note
20 – SUBSEQUENT EVENTS
Management
has evaluated events subsequent to the year ended for transactions and other events that may require adjustment of and/or disclosure
in such consolidated financial statements.
Subsequent
to December 31, 2022:
| |
● |
On
January 4, 2023, 3,000,000 shares of common stock were issued for conversion of 30 Series B Preferred Shares. |
| |
|
|
| |
● |
On
January 12, 2023, pursuant to the December Series F SPA, the Company received $312,000 for the subscription of 312 Series F preferred
shares. These shares were issued on January 18, 2023. |
| |
|
|
| |
● |
On
January 18, 2023, pursuant to the December Series F SPA, the Company received $300,000 for the subscription of 300 Series F preferred
shares. |
| |
|
|
| |
● |
On January 13, 2023, 2,991,098
shares of common stock were issued for conversion of 84
Series F Preferred Shares with an aggregate carrying value of $40,991. |
| |
|
|
| |
● |
On February 17, 2023, 2,992,519
shares of common stock were issued for conversion of 100
Series F Preferred Shares with an aggregate carrying value of $48,799. |
| |
|
|
| |
● |
On January 18, 2023, the
Company received approval to increase the number of common stock authorized from 350,000,000 to 1,000,000,000. |
| ITEM 9. |
CHANGES IN AND DISAGREEMENTS
WITH ACCOUNTANTS ON ACCOUNTING AND FINANCIAL DISCLOSURE |
None.
| ITEM 9A. |
CONTROLS AND PROCEDURES |
Evaluation
of Disclosure Controls and Procedures
The
phrase “disclosure controls and procedures” refers to controls and procedures designed to ensure that information required
to be disclosed in our reports filed or submitted under the Securities Exchange Act of 1934, as amended, or the Exchange Act, such as
this Annual Report on Form 10-K, is recorded, processed, summarized and reported within the time periods specified in the rules and forms
of the U.S. Securities and Exchange Commission, or SEC. Disclosure controls and procedures are also designed to ensure that such information
is accumulated and communicated to our management, including our chief executive officer, or CEO, and chief financial officer, or CFO,
as appropriate to allow timely decision regarding required disclosure.
Our
management, with the participation of our CEO and CFO, has evaluated the effectiveness of our disclosure controls and procedures (as
defined in Rules 13a- 15(e) and 15d- 15(e) under the Exchange Act), as of December 31, 2022, the end of the period covered by this Annual
Report on Form 10-K. Based on such evaluation, our CEO and CFO have concluded that as of December 31, 2022, our disclosure controls and
procedures were designed at a reasonable assurance level and were effective to provide reasonable assurance that information we are required
to disclose in reports that we file or submit under the Exchange Act is recorded, processed, summarized, and reported within the time
periods specified in the rules and forms of the SEC, and that such information is accumulated and communicated to our management, including
our CEO and CFO, as appropriate, to allow timely decisions regarding required disclosure.
Management’s
Report on Internal Control over Financial Reporting
Our
management is responsible for establishing and maintaining adequate internal control over financial reporting as defined in Rules 13a-15(f)
and 15d-15(f) under the Exchange Act. Our internal control over financial reporting is designed to provide reasonable assurance regarding
the reliability of financial reporting and the preparation of consolidated financial statements for external purposes in accordance with
generally accepted accounting principles.
Our
management, with the participation of our CEO and CFO, has assessed the effectiveness of the internal control over financial reporting
as of December 31, 2022. In making this assessment, our management used the criteria set forth by the Committee of Sponsoring Organizations
of the Treadway Commission (“COSO”) in Internal Control — Integrated Framework (2013 Framework). Based on this
evaluation, our management has concluded that our internal control over financial reporting was effective as of December 31, 2022.
This
Annual Report on Form 10-K does not include an attestation report of our registered public accounting firm on our internal control over
financial reporting due to an exemption established by the JOBS Act for “emerging growth companies.”
Changes
in Internal Controls over Financial Reporting
There
was no change in our internal control over financial reporting identified in management’s evaluation pursuant to Rules 13a-15(d)
or 15d-15(d) of the Exchange Act during the year ended December 31, 2022, that materially affected, or is reasonable likely to materially
affect, our internal control over financial reporting.
Limitations
on Effectiveness of Controls and Procedures
In
designing and evaluating the disclosure controls and procedures, management recognizes that any controls and procedures, no matter how
well designed and operated, can provide only reasonable assurance of achieving the desired control objectives. In addition, the design
of disclosure controls and procedures must reflect the fact that there are resource constraints, and that management is required to apply
judgment in evaluating the benefits of possible controls and procedures relative to their costs.
| ITEM 9B. |
OTHER INFORMATION |
Amendment
of Series C Preferred Stock
On
September 30, 2020, the Company amended its Series C Preferred Stock. The Series C Preferred Stock shall be entitled to vote with the
holders of the Company’s Common Stock on an as-converted basis.
Designation
of Series F Preferred Stock
On
December 22, 2020, the Company designated its Series F Preferred Stock. The Series F Preferred Stock shall be entitled to vote with the
holders of the Company’s Common Stock on an as-converted basis.
Debt
Settlement Transactions
On
February 16, 2022, the Company settled to settled accounts payable of $24,000 in exchange for 160,000 shares of common stock.
On
April 23, 2020, the Company agreed to settle principal debt of $150,000 for 3,061,224 shares of common stock at $0.049 per share, a 30%
discount to market. On August 25, 2020, the terms of this settlement were amended to settle remaining principal of $120,000 for 10,714,285
common shares at an adjusted exercise price of $0.0112, a 30% discount to market. At December 31, 2020, 8,062,244 shares have been issued
and 3,264,285 shares were left to be issued. These shares were issued subsequently on January 5, 2021.
Preferred
Stock Transactions
During
the year ended December 31, 2022:
On
November 3, 2022, the Company issued 30 shares of Series B preferred shares to a consultant of the Company for services to be rendered.
These preferred shares were value at $213,000 based on the fair value of the underlying common stock.
On
August 1, 2022, the Company issued an aggregate of 191 shares of Series B preferred shares to the CEO of the Company for past services.
These preferred shares were value at $897,000 based on the fair value of the underlying common stock.
On
June 27, 2022, the Company issued an aggregate of 105 shares of Series B preferred shares to the Company’s board of directors for
past services. These preferred shares were value at $777,000 based on the fair value of the underlying common stock.
During
the year ended December 31, 2021:
On
October 26, 2020, the Company agreed to issue Series B preferred shares that are convertible into 1,000,000 common shares and 1,000,000
warrants for investor relations services. The preferred shares were valued at $1,340,000 based on the fair value of the underlying common
stock and included in preferred shares to be issued at December 31, 2020. On February 17, 2021, the Company issued 100 shares of Series
B preferred shares and 1,000,000 warrants, see note 14. 1 Series B preferred share is convertible into 100,000 shares of common stock,
which meant that only 10 shares of Series B preferred shares should have been issued. On May 26, 2021, 50 shares of Series B preferred
shares, instead of 5 shares of Series B preferred shares, were converted into 500,000 shares of common stock with a fair value of $670,000.
On September 16, 2021, the Company cancelled 45 shares of Series B preferred shares and 5 shares of Series B preferred shares were converted
into 500,000 shares of common stock with a fair value of $670,000.
On
March 4, 2021, the Company issued an aggregate of 16 shares of Series B preferred shares to the Company’s board of directors for
past services. These preferred shares were valued at $849,600 based on the fair value of the underlying common stock.
On
January 29, 2021, 17 Series B preferred shares with a fair value of $95,880, were converted into common shares, inclusive of the conversion
noted above.
On
March 30, 2021, 20 Series B preferred shares with a fair value of $112,800, were converted into common shares, inclusive of the conversion
noted above
On
May 26, 2021, 50 Series B preferred shares with a fair value of $670,000, were converted into common shares, inclusive of the conversion
noted above
On
July 20, 2021, 16 Series B preferred shares with a fair value of $90,240, were converted into common shares, inclusive of the conversion
noted above
On
September 16, 2021, 5 Series B preferred shares with a fair value of $670,000, were converted into common shares, inclusive of the conversion
noted above
On
October 5, 2021, 17 Series B preferred shares with a fair value of $95,880, were converted into common shares, inclusive of the conversion
noted above
On
January 15, 2021, 286 Series C Preferred Shares were converted into common shares.
On
January 19, 2021, 18 Series C Preferred Shares were converted into common shares.
On
March 4, 2021, 168 Series C Preferred Shares were converted into common shares.
On
March 31, 2021, 290 Series C Preferred Shares were converted into common shares.
On
May 4, 2021, 250 Series C Preferred Shares were converted into common shares.
On
May 28, 2021, 300 Series C Preferred Shares were converted into common shares.
On
July 06, 2021, 200 Series C Preferred Shares were converted into common shares.
On
November 6, 2020, the Company received gross proceeds of $300,000 for 300 Series C Preferred Shares in lieu of the Second Closing for
the Series C SPA. The shares were included in preferred shares to be issued at December 31, 2020. The preferred shares were issued April
13, 2021.
On
December 7, 2020, the Company received gross proceeds of $200,000 for 200 Series C Preferred Shares in lieu of the Second Closing for
the Series C SPA. The shares are included in preferred shares to be issued as at December 31, 2020. The preferred shares were issued
April 13, 2021.
On
December 23, 2020, the Company entered into a Securities Purchase Agreement (the “Series F SPA”) whereby the Company agreed
to sell and the Purchaser agrees to purchase, in a series of closings (the “Closings”) of at least 1,000 Series F preferred
shares at a price of $1,000 per share. The First and Second Closings, will each be for 1,500 Preferred Shares at a purchase price of
$1,500,000, the Second Closing which will follow the filing of the Registration Statement. Any Additional Closings will be for the purchase
of at least 1,000 Series F preferred shares, every thirty calendar days, and shall follow the Registration Statement being declared effective.
The Company granted 3,000,000 warrants, with a relative fair value of $768,008, concurrently with the execution of the Series F SPA and
First Closing. The First Closing shares were included in preferred shares to be issued at December 31, 2020 with a relative fair value
of $731,992.
On
February 4, 2021, the Company issued 1,500 Series F preferred shares pursuant to the First Closing of the Series F SPA with a relative
fair value of $731,992. Additionally, the Company issued 1,500 Series F preferred shares pursuant to the Second Closing of the Series
F SPA for gross proceeds for $1,500,000.
On
June 10, 2021, pursuant to the Series F SPA, the Company received $350,000 for the subscription of an additional 350 Series F preferred
shares to be issued.
On
July 20, 2021, pursuant to another Securities Purchase Agreement (the “July Series F SPA”), the Company received $400,000
for the subscription of 400 Series F preferred shares with a relative fair value of $261,934 and 1,180,000 warrants with a relative fair
value of $138,066 valued on the agreement date which are recorded as obligation to issue shares and warrants respectively at December
31, 2021.
On
August 3, 2021, 275 Series F Preferred Shares were converted into common shares.
On
October 22, 2021, 210 Series F Preferred Shares were converted into common shares.
On
November 30, 2021, 491 Series F Preferred Shares were converted into common shares.
On
December 14, 2021, pursuant to another Securities Purchase Agreement (the “December Series F SPA”), the Company received
$312,000 for the subscription of 312 Series F preferred shares. $12,000 was incurred as share issuance costs.
On
December 31, 2021, pursuant to the December Series F SPA, the Company received $250,000 for the subscription of 250 Series F preferred
shares.
PART
III
| ITEM 10. |
DIRECTORS, EXECUTIVE
OFFICERS AND CORPORATE GOVERNANCE |
Directors
and Executive Officers
The
following sets forth information about our director and executive officer as of the date of this report:
| NAME |
|
AGE |
|
POSITION |
| |
|
|
|
|
| Robert Silzer |
|
74 |
|
Director, President, Chief
Executive Officer, Secretary, Treasurer |
| |
|
|
|
|
| Rick Curtis |
|
64 |
|
President, Imperium Motor
Company |
| |
|
|
|
|
| Zahir Gonzalez Loaiza |
|
28 |
|
Interim Chief Financial
Officer |
| |
|
|
|
|
| Christian Dubois |
|
|
|
President, Imperium Motors
Canada |
| |
|
|
|
|
| Stephen Johnston |
|
69 |
|
Director |
| |
|
|
|
|
| James Singerling |
|
76 |
|
Director |
| |
|
|
|
|
| Michael Leemhuis |
|
66 |
|
Director |
| |
|
|
|
|
| Carol Cookerly |
|
64 |
|
Director |
| |
|
|
|
|
| Alan M. Wagner |
|
|
|
CEO, Liteborne Motor Corporation |
| |
|
|
|
|
| Daniel Lock |
|
|
|
Executive Director of Operations
and Homologation, Liteborne Motor Corporation |
| |
|
|
|
|
| Jonathan D’Agostino |
|
|
|
CFO, Liteborne Motor Corporation |
Our
directors will serve in that capacity until our next annual shareholder meeting or until his successor is elected and qualified. Officers
hold their positions at the will of our Board of Directors. There are no arrangements, agreements or understandings between non-management
security holders and management under which non-management security holders may directly or indirectly participate in or influence the
management of our affairs.
Executive
Management
Our
executive management team represents a significant depth of experience in biometrics and facial recognition technologies, intelligent
security and surveillance, high-growth and technology marketing, and domestic and international sales and business development. The team
represents a cross-disciplinary approach to management and business development.
Robert
Silzer, Director, President, Chief Executive Officer, Chief Financial Officer, Secretary and Treasurer.
Robert
Silzer has over 20 years’ experience in the GPS tracking and fleet solutions industries. He is the founder of DSG TAG Systems Inc.
and has served as Chief Executive Officer of DSG TAG since its inception in April 2008. Mr. Silzer is a product designer who has developed
multiple new product concepts and successfully introduced these products to market including the world’s first handheld bingo gaming
unit, the first handheld and color handheld GPS golf units and the first Wi-Fi enabled GPS golf business solution. Prior to establishing
DSG TAG, Mr. Silzer’s designed and a total golf solution that addressed the growing needs in Golf Course management. Through a
series of mergers and acquisitions different companies with diversified hardware and software platforms, he founded GPS Industries (“GPSI”)
in 1996, serving as its president, CEO, Chairman and director until 2007. Under his leadership, it became the largest operator of golf
GPS systems in the world and with a remarkable 750 golf courses worldwide using the installed system. Prior to founding GPSI, Mr. Silzer
founded XGA, an online golf store and website company in 1993. He also founded Advanced Gaming Technology, Inc. in 1992, an electronic
gaming company, where he served as Chief Executive Officer until 1998. From 1986 to 1992, Mr. Silzer founded and operated the private
company Supercart International. With over 30 years as an entrepreneur in the technology and other markets, Mr. Silzer has developed
expertise in taking companies to market, growing start-up business, initial public offerings, raising funds, operations, marketing and
international licensing.
Zahir
Loaiza, Interim Chief Financial Officer
Zahir
assumed the role of the Company’s acting CFO in March 2021, after having previously served as its Corporate Controller since 2019.
She oversees the management of cash flow and budgeting, financial reporting and preparation of financial statements, as well as the development
and implementation of internal financial controls.
Her
diverse international experience includes working as a staff accountant and controller at a publicly traded mining company, and at several
law firms in the U.S., Canada and South America. Prior to her career in accounting she owned and operated multiple retail businesses.
Ms. Loaiza holds a Licentiate degree in public accounting from Universidad de Carabobo, Venezuela, and is a Certified Assessment Evaluator.
Stephen
Johnston, Director
Stephen
Johnston is the founding Partner of Global Golf Advisors and one of the leading authorities on operational analysis and financial solutions
for golf businesses. Steve began his career at the accounting firm of Thorne Gunn/Thorne Riddell in Toronto in 1973. He earned his Chartered
Accountant designation while with Thorne Riddell in 1976 and in 1984 was promoted to Partner and given responsibility for major client
accounts. His audit experience with major accounts subsequently expanded into real estate, communications and insurance.
When
the firm became known as KPMG, Mr. Johnston continued as an Audit Partner and in 1992 created the KPMG Golf Industry Practice and assumed
responsibility as National Director. In 2006 he purchased the KPMG Golf Industry Practice and created Global Golf Advisors Inc., bringing
with him the entire staff complement and client files to the new firm.
Mr.
Johnston is a graduate of the University of Toronto with a Bachelor of Science degree and business courses complement relevant to his
Chartered Accountant designation. His main focus is developing financial and business solutions for private clubs, public golf courses
and resorts, golf communities, investors and lenders. Mr. Johnston provides a keen insight for banking and finance solutions arising
from his years of advising numerous international financial institutions.
He
has completed due diligence and valuation assignments for some of the largest golf-related transactions in North America and has completed
multiple market studies to reposition various golf assets. In addition, Mr. Johnston has been actively involved with workouts/receiverships,
providing operational and financial guidance. These assignments typically lead to member buyouts/transitions from developers or to an
outright disposition of property. He has been recognized as one of the Top Powerbrokers in Canadian Golf by The National Post over the
past 15 years.
James
Singerling, Director
From
1990 until his retirement in 2015, James Singerling, CCM, served as the CEO of Club Managers Association of America (CMAA), the foremost
professional association for managers of membership clubs in the US. In this role Mr. Singerling was credited for elevating the professional
role of club managers by creating industry-standard development and certification programs. For over two decades, he spearheaded efforts
to adopt the general manager/chief operating officer model at clubs nationwide, raising the qualifications and quality of club managers.
Mr. Singerling is also recognized for building new relationships for the industry with federal and state governments and within the association
community.
Michael
Leemhuis, Director
Michael
Leemhuis, M.A. Ed., CCM, CCE, PGA Master Professional is known for his extensive leadership and sports experience. Michael’s experience
has been gained in his roles as the President of the Ocean Reef Club; CEO of Congressional Country Club; President of the Club Managers
Association of America in 2009; GM/Director of Golf at the PGA TOUR; General Manager, Sport and Recreation at Sun City Resort; Tournament
Director of the Nedbank Million Dollar Golf Challenge and MD of Sports International. One of Mike’s career highlights was guiding
Congressional Country Club to the #1 spot in the Platinum Clubs of America and into the top 100 of Platinum Clubs in the World.
Education
combined with certification are what Mike believes are the cornerstones of success in business and in life and to that end Mike is a
Certified Club Manager (CCM) and Certified Chief Executive (CCE) through CMAA, as well as a certified PGA member through the PGA of America
and the PGA of South Africa (Master Professional).
Carol
Cookerly, Director
Carol
Cookerly is a graduate of Duke University and former broadcast journalist, Carol worked in public relations in New York City before founding
the agency in Atlanta. Founder and CEO of Cookerly Public Relations has grown the Company into one of the Southeast’s leading public
relations agencies representing a client roster more typical of national firms. In addition to creating higher visibility for a variety
of clients, the agency has built a stellar reputation for its ability to: manage high-profile issues and direct crisis communications
strategies; use data driven marketing to create behavioral change; and, drive engagement and brand success in social media.
Recent
visibility campaign successes include the award-winning introduction of the A-Class line of vehicles for Mercedes-Benz USA and the launch
of Novelis Inc.’s advanced-design lightweight aluminum battery enclosure for electric vehicles. Active in the community, Carol
is a councilwoman serving the city of Milton, Ga. She is a board member of the nation’s most innovative law enforcement support
organization, the Atlanta Police Foundation, for which she serves on two committees. In addition, she was recently appointed to the board
of Oglethorpe University’s Hammock School of Business.
Alan
M. Wagner, CEO, Liteborne Motor Corporation
Mr.
Wagner’s extensive expertise and reach across the automotive industry. Before joining LMC, Wagner served as executive director
of Hyundai Transys and was vice president of product development for Mercedes Benz Tech. Before that, he held multiple executive positions
with Lear Corporation. He was the vice president of engineering at Saleen Automotive/SMS Supercars and executive vice president of Saleen
Electric. Wagner was also vice president of Entech. Through the years, he has worked with General Motors, Ford, Shelby, Petty Enterprises,
Toyota, Chrysler, and BMW among other iconic automotive brands.
Daniel
Lock, Executive Director of Operations and Homologation, Liteborne Motor Corporation
Mr
Lock, who is leading Homologation has over 20-years of automotive development and engineering management experience. Prior to Joining
Liteborne he was a senior manager and program manager at Hyundai Transys. A program planning manager at Gentherm, program manager and
a product design engineer at Visteon. Mr. Lock earned his BS in chemical engineering from Yale University.
Jonathan
D’Agostino, CFO, Liteborne Motor Corporation
Mr.
Jonathan D’Agostino Started career at Sands Brothers in 1999. After graduating from Fordham University with honors from NYS in
legal and ethical studies he joined Lehman Brothers in 2003, spent several years as an investment and merchant banker with several different
banks, including Morgan Brothers, which was founded by a Lehman vice chair. He became Professor Luc Montagnier’s partner in commercializing
his preventative healthcare business, during which time he won the 2008 Noble Prize for Medicine. After leaving traditional Merchant
Banking he entered the green energy space working to create power-efficient production of Green Hydrogen. Before Liteborne he founded
and now is testing and commercializing HydroBoost, a product that creates green hydrogen on demand for automobiles and trucks.
Significant
Employees
Other
than Bob Silzer, we have no full-time employees whose services are materially significant to our business and operations who are employed
the Company.
Family
Relationships
There
are no family relationships among any of our directors or officers.
Involvement
in Certain Legal Proceedings
To
the best of our knowledge, none of our directors or executive officers has, during the past ten years:
| 1. |
been convicted in a criminal
proceeding or been subject to a pending criminal proceeding (excluding traffic violations and other minor offences); |
| |
|
| 2. |
had any bankruptcy petition
filed by or against the business or property of the person, or of any partnership, corporation or business association of which he
was a general partner or executive officer, either at the time of the bankruptcy filing or within two years prior to that time; |
| |
|
| 3. |
been subject to any order,
judgment, or decree, not subsequently reversed, suspended or vacated, of any court of competent jurisdiction or federal or state
authority, permanently or temporarily enjoining, barring, suspending or otherwise limiting, his involvement in any type of business,
securities, futures, commodities, investment, banking, savings and loan, or insurance activities, or to be associated with persons
engaged in any such activity; |
| |
|
| 4. |
been found by a court of
competent jurisdiction in a civil action or by the SEC or the Commodity Futures Trading Commission to have violated a federal or
state securities or commodities law, and the judgment has not been reversed, suspended, or vacated; |
| |
|
| 5. |
been the subject of, or
a party to, any federal or state judicial or administrative order, judgment, decree, or finding, not subsequently reversed, suspended
or vacated (not including any settlement of a civil proceeding among private litigants), relating to an alleged violation of any
federal or state securities or commodities law or regulation, any law or regulation respecting financial institutions or insurance
companies including, but not limited to, a temporary or permanent injunction, order of disgorgement or restitution, civil money penalty
or temporary or permanent cease-and-desist order, or removal or prohibition order, or any law or regulation prohibiting mail or wire
fraud or fraud in connection with any business entity; or |
| |
|
| 6. |
been the subject of, or
a party to, any sanction or order, not subsequently reversed, suspended or vacated, of any self-regulatory organization (as defined
in Section 3(a)(26) of the Exchange Act (15 U.S.C. 78c(a)(26))), any registered entity (as defined in Section 1(a)(29) of the Commodity
Exchange Act (7 U.S.C. 1(a)(29))), or any equivalent exchange, association, entity or organization that has disciplinary authority
over its members or persons associated with a member. |
Compliance
with Section 16(a) of the Securities Exchange Act of 1934
Section
16(a) of the Securities Exchange Act of 1934 requires our executive officers and directors and persons who own more than 10% of our common
stock to file with the Securities and Exchange Commission initial statements of beneficial ownership, reports of changes in ownership
and annual reports concerning their ownership of our common stock and other equity securities, on Forms 3, 4 and 5 respectively. Executive
officers, directors and greater than 10% shareholders are required by the SEC regulations to furnish us with copies of all Section 16(a)
reports that they file.
Based
solely on our review of the copies of such forms received by us, or written representations from certain reporting persons, we believe
that during fiscal year ended December 31, 2022, all filing requirements applicable to our officers, directors and greater than 10% percent
beneficial owners were complied with.
Term
of Office
Our
directors are appointed for a one-year term to hold office until the next annual general meeting of our stockholders or until removed
from office in accordance with our bylaws. Our officers are appointed by our Board of Directors and hold office until removed by the
Board of Directors.
Board
Leadership Structure
The
Board does not have an express policy regarding the separation of the roles of Chief Executive Officer and Director as the Board believes
it is in the best interests of the Company to make that determination based on the position and direction of the Company and the membership
of the Board. The Board has designated Robert Singerling as Lead Independent Director. Currently, Robert Silzer serves as both the Company’s
Chief Executive Officer and a Director. As Chief Executive Officer, Mr. Silzer is involved in the day-to-day operations of the Company
and also provides strategic guidance on the Company’s operations. The Board believes Mr. Silzer’s experience and knowledge
are valuable in the oversight of both the Company’s operations as well as with respect to the overall oversight of the Company
at the Board level. The Board believes that this leadership structure is appropriate as Mr. Silzer is intimately knowledgeable with the
Company’s current and planned operations.
Role
of the Board and the Audit Committee in Risk Oversight
While
management is charged with the day-to-day management of risks that the Company faces, the Board of Directors, and the Audit Committee
of the Board, have been responsible for oversight of risk management. The full Board, and the Audit Committee since it was formed, have
responsibility for general oversight of risks facing the Company. Specifically, the Audit Committee reviews and assesses the adequacy
of the Company’s risk management policies and procedures with regard to identification of the Company’s principal risks,
both financial and non-financial, and review updates on these risks from the Chief Financial Officer and the Chief Executive Officer.
The Audit Committee also reviews and assesses the adequacy of the implementation of appropriate systems to mitigate and manage the principal
risks.
Review
and Approval of Transactions with Related Parties
The
Board of Directors adopted a policy to comply with Item 404 of Regulation S-K of the Exchange Act as well as the Nasdaq Rules requiring
that disinterested directors approve transactions with related parties which are not market-based transactions.
Generally,
the Board of Directors will approve transactions only to the extent the disinterested directors believe that they are in the best interests
of the Company and on terms that are fair and reasonable (in the judgment of the disinterested directors) to the Company.
Audit
Committee
The
Board of Directors established the Audit Committee on April 1, 2021, Our Audit Committee charter complies with Section 3(a)(58)(A) of
the Exchange Act and Nasdaq Rule 5605. The Audit Committee was established to oversee the Company’s corporate accounting and financial
reporting processes and audits of its financial statements. The members of our Audit Committee are Michael Leemhuis, James Singerling,
and Stephen Johnston. Mr. Johnston serves as chair of the Audit Committee. The Board of Directors determined that all members of our
Audit Committee were independent under SEC Rule 10A-3(b)(1) and Nasdaq Rule 5605(a)(2). The Board has determined that all current members
of the Audit Committee are “financially literate” as interpreted by the Board in its business judgment. Stephen Johnston
has been qualified as an audit committee financial expert, as defined in the applicable rules of the SEC.
The
Audit Committee meets periodically with our independent accountants and management to review the scope and results of the annual audit
and to review our financial statements and related reporting matters prior to the submission of the financial statements to the Board.
In addition, the Audit Committee meets with the independent auditors at least on a quarterly basis to review and discuss the annual audit
or quarterly review of our financial statements.
We
have established an Audit Committee Charter that deals with the establishment of the Audit Committee and sets out its duties and responsibilities.
The Audit Committee is required to review and reassess the adequacy of the Audit Committee Charter on an annual basis. The Audit Committee
Charter is available on our Company website at www.dsgglobal.com and furnished as exhibit 99.2 of the registration statement of which
this prospectus forms a part.
Governance
and Nominating Committee
The
members of our Governance and Nominating Committee are Ms. Cookerly, and Messrs. Singerling, Johnston, and Leemhuis. Ms. Cookerly serves
as chair of the Governance and Nominating Committee. This committee’s responsibilities include, among other things: identifying
and evaluating candidates, including the nomination of incumbent directors for re-election and nominees recommended by shareholders,
to serve on our Board; considering and making recommendations to our Board regarding the composition and chairship of the committees
of our Board; developing and recommending to our Board’s corporate governance principles, codes of conduct and compliance mechanisms;
and overseeing periodic evaluations of the Board’s performance, including committees of the Board.
When
evaluating director candidates, the Governance and Nominating Committee may consider several factors, including relevant experience,
independence, commitment, compatibility with the Chief Executive Officer and the Board’s culture, prominence and understanding
of the Company’s business, as well as any other factors the Governance and Nominating Committee deems relevant at the time. The
Governance and Nominating Committee makes a recommendation to the full Board as to any person it believes should be nominated by our
Board, and our Board determines the nominees after considering the recommendation and report of the Governance and Nominating Committee.
The Governance and Nominating Committee Charter is available on our Company website at www.dsgglobal.com and furnished as exhibit 99.4
of the registration statement of which this prospectus forms a part.
Compensation
Committee
The
members of our Compensation Committee are Ms. Cookerly, and Messrs. Singerling, Johnston and Leemhuis. Mr. Singerling serves as chair
of the Compensation Committee. The Compensation Committee is responsible for making recommendations to the Board regarding the compensation
of executive officers, to review and administer our Company’s equity compensation plans, to review, discuss, and evaluate at least
annually the relationship between risk management policies and practices and compensation, as well as oversee the Company’s engagement
with shareholders and proxy advisors.
In
the event that our Nasdaq listing application is approved, effective upon the uplisting of our common stock to Nasdaq (which may not
occur), the Compensation Committee will be in compliance with Nasdaq Rule 5605(d). The Compensation Committee consists of only independent
directors in accordance with Nasdaq Rule 5605(a)(2) and all non-employee directors for purposes of Rule 16b-3 of the Exchange Act. The
compensation of our CEO, Mr. Silzer, must be determined by the Compensation Committee and the CEO may not be present during voting or
deliberations for his compensation.
Although
Nasdaq Rule 5605(d)(3) provides that the Compensation Committee may (in its discretion, not Board discretion) retain compensation consultants,
independent legal counsel, and other advisors, the independent directors acting as the Compensation Committee have not decided to do
so. Our Compensation Committee Charter is available at our website www.dsgglobal.com and furnished as exhibit 99.3 of the registration
statement of which this prospectus forms a part.
Code
of Business Conduct and Ethics
On
March 31, 2021, our Board of Directors adopted a Code of Business Conduct and Ethics Policy (the “Code of Conduct”). Our
Code of Conduct is applicable to all of the Company’s and its subsidiaries’ employees, including the Company’s Chief
Executive Officer and Chief Financial Officer. The Code of Conduct contains written standards that are designed to deter wrongdoing and
to promote honest and ethical conduct, including the ethical handling of actual or apparent conflicts of interest; full, fair, accurate,
timely and understandable public disclosures and communications, including financial reporting; compliance with applicable laws, rules
and regulations; prompt internal reporting of violations of the code; and accountability for adherence to the code. A copy of our Code
of Business Conduct and Ethics Policy of the Company is posted at our website at www.dsgglobal.com and furnished as exhibit 99.1 of the
registration statement of which this prospectus forms a part.
Insider
Trading Policy and Supplemental Policy Concerning Trading in Company Securities by Certain Designated Persons
Our
Insider Trading Policy and the Supplemental Policy Concerning Trading in Company Securities by Certain Designated Persons apply to all
of our officers, directors, and employees, and provide strict guidelines as to restrictions on trading activity in the Company’s
stock. including provisions for on trading blackout periods, benefit plans and Section 16 Reporting. These policies are posted at our
website www.dsgglobal.com and furnished as exhibit 99.5 and 99.6, respectively, of the registration statement of which this prospectus
forms a part.
Family
Relationships
There
are no family relationships among any of our directors or officers.
| ITEM 11. |
EXECUTIVE COMPENSATION |
Summary
Compensation Table
The
particulars of the compensation paid to the following persons:
| (a) |
our principal executive
officer; |
| |
|
| (b) |
our principal financial
officer; |
| |
|
| (c) |
each of our three most
highly compensated executive officers who were serving as executive officers at the end of the years ended December 31, 2022 and
2021; and |
| |
|
| (d) |
up to two additional individuals
for whom disclosure would have been provided under (c) but for the fact that the individual was not serving as our executive officer
at the end of the years ended December 31, 2022 and 2021, who we will collectively refer to as the named executive officers of our
Company, are set out in the following summary compensation table, except that no disclosure is provided for any named executive officer,
other than our principal executive officers, whose total compensation did not exceed $100,000 for the respective fiscal year: |
Name and principal position | |
Year | |
Salary ($) | | |
Bonus ($) | | |
Stock Awards ($) | | |
All Other Compensation ($) | | |
Total ($) | |
| Robert Silzer, Director, President, Chief | |
2022 | |
| 300,000 | | |
| 120,000 | | |
| 1,082,700 | | |
| 37,503 | | |
| 1,540,203 | |
| | |
2021 | |
| 300,000 | | |
| 196,556 | | |
| 212,400 | | |
| 39,038 | | |
| 747,994 | |
| Zahir Loaiza, Interim CFO | |
2022 | |
| 70,111 | | |
| - | | |
| - | | |
| - | | |
| 70,111 | |
| | |
2021 | |
| 74,606 | | |
| - | | |
| - | | |
| 10,000 | | |
| 84,606 | |
| Christian Dubois, former President Imperium Motor Company, Canada | |
2022 | |
| - | | |
| - | | |
| - | | |
| 80,000 | | |
| 80,000 | |
| | |
2021 | |
| - | | |
| - | | |
| - | | |
| 63,300 | | |
| 63,300 | |
| Rick Curtis, former CEO Imperium Motor Company, USA | |
2022 | |
| 52,500 | | |
| - | | |
| - | | |
| - | | |
| 52,500 | |
| | |
2021 | |
| 70,000 | | |
| - | | |
| - | | |
| 60,000 | | |
| 130,000 | |
| Alan Wagner, CEO Liteborne | |
2022 | |
| - | | |
| - | | |
| - | | |
| 35,000 | | |
| 35,000 | |
| Jonathan D’Agostino, CFO Liteborne | |
2022 | |
| - | | |
| - | | |
| - | | |
| 23,125 | | |
| 23,125 | |
| Daniel Lock, Executive Director of Operations Liteborne | |
2022 | |
| - | | |
| - | | |
| - | | |
| 33,048 | | |
| 33,048 | |
As
of December 31, 2022, we had no employment agreements with any of our executive officers or employees.
Summary
of Employment Agreements and Material Terms
We
have not entered into any employment or consulting agreements with any of our current officers, directors, or employees.
Outstanding
Equity Awards.
For
the years ended December 31, 2022 and 2021, no director or executive officer has received compensation from the Company pursuant to any
compensatory or benefit plan. There is no plan or understanding, express or implied, to pay any compensation to any director or executive
officer pursuant to any compensatory or benefit plan, although we anticipate that we will compensate our officers and directors for services
to us with stock or options to purchase stock, in lieu of cash.
Compensation
of Directors
The
particulars of the compensation paid to each of our director during our fiscal years ended December 31, 2022 and 2021 are set out in
the following summary compensation table, except that no disclosure is provided for any director who’s also a named executive officer
and whose compensation is fully reflected in the above Executive Summary Compensation Table:
DIRECTOR
COMPENSATION TABLE
Name and principal position | |
Year | |
Salary ($) | | |
Bonus ($) | | |
Stock Awards ($) | | |
Option Awards ($) | | |
Non-Equity Incentive Plan Compensation ($) | | |
Nonqualified Deferred Compensation Earnings ($) | | |
All Other Compensation ($) | | |
Total ($) | |
| Stephen Johnston, | |
2022 | |
Nil | | |
Nil | | |
185,000 | | |
Nil | | |
Nil | | |
Nil | | |
Nil | | |
Nil | |
| Director(1) | |
2021 | |
Nil | | |
Nil | | |
212,400 | | |
Nil | | |
Nil | | |
Nil | | |
Nil | | |
Nil | |
| James Singerling, | |
2022 | |
Nil | | |
Nil | | |
185,000 | | |
Nil | | |
Nil | | |
Nil | | |
Nil | | |
Nil | |
| Director(2) | |
2021 | |
Nil | | |
Nil | | |
212,400 | | |
Nil | | |
Nil | | |
Nil | | |
Nil | | |
Nil | |
| Michael Leemhuis, | |
2022 | |
Nil | | |
Nil | | |
111,000 | | |
Nil | | |
Nil | | |
Nil | | |
Nil | | |
Nil | |
| Director(3) | |
2021 | |
Nil | | |
Nil | | |
106,200 | | |
Nil | | |
Nil | | |
Nil | | |
Nil | | |
Nil | |
| Carol Cookerly, | |
2022 | |
Nil | | |
Nil | | |
111,000 | | |
Nil | | |
Nil | | |
Nil | | |
Nil | | |
Nil | |
| Director(4) | |
2021 | |
Nil | | |
Nil | | |
106,200 | | |
Nil | | |
Nil | | |
Nil | | |
Nil | | |
Nil | |
| Jason Sugarman, | |
2022 | |
Nil | | |
Nil | | |
Nil | | |
Nil | | |
Nil | | |
Nil | | |
Nil | | |
Nil | |
| Former Director(5) | |
2021 | |
Nil | | |
Nil | | |
Nil | | |
Nil | | |
Nil | | |
Nil | | |
Nil | | |
Nil | |
(1)
Mr. Johnston has served as a director since June 16, 2015.
(2)
Mr. Singerling has served as a director since June 16, 2015.
(3)
Mr. Leemhuis has served as a director since April 8, 2020.
(4)
Ms. Cookerly has served as a director since April 8, 2020.
(5)
Mr. Sugarman served as a director from April 8, 2020 until July 11, 2019.
| ITEM 12. |
SECURITY OWNERSHIP OF
CERTAIN BENEFICIAL OWNERS AND MANAGEMENT AND RELATED STOCKHOLDER MATTERS |
The
following table sets forth information regarding beneficial ownership of our common stock as of December 31, 2022 (i) by each person
who is known by us to beneficially own more than 5% of our common stock; (ii) by each of our officers and directors; and (iii) by all
of our officers and directors as a group.
| Name and Address of Beneficial Owner | |
Office, if Any | |
Title of Class | |
Amount and
Nature of
Beneficial
Ownership (1) | | |
Percent of Class (2) | |
| Officers and Directors | |
| |
| |
| | | |
| | |
Robert Silzer
214 - 5455 152nd Street
Surrey, British Columbia, Canada
V3S 5A5 | |
Director, president, chief executive officer, secretary, and treasurer | |
Common Stock | |
| 26,002,019 | (3) | |
| 13.992 | % |
Zahir Loaiza
214 - 5455 152nd Street
Surrey, British Columbia, Canada
V3S 5A5 | |
Interim Chief Financial Officer | |
Common Stock | |
| - | | |
| (4 | ) |
Christian Dubois
214 - 5455 152nd Street
Surrey, British Columbia, Canada
V3S 5A5 | |
Former President, Imperium Motor Company, Canada | |
Common Stock | |
| - | | |
| (4 | ) |
Rick Curtis
214 - 5455 152nd Street
Surrey, British Columbia, Canada
V3S 5A5 | |
Former Chief Executive Officer, Imperium Motor Company, USA | |
Common Stock | |
| 1,500,000 | | |
| (4 | ) |
Stephen Johnston
214 - 5455 152nd Street
Surrey, British Columbia, Canada
V3S 5A5 | |
Director | |
Common Stock | |
| 3,500,000 | (5) | |
| 1.883 | % |
James Singerling
214 - 5455 152nd Street Surrey, British Columbia, Canada
V3S 5A5 | |
Director | |
Common Stock | |
| 3,500,000 | (5) | |
| 1.883 | % |
Michael Leemhuis
214 - 5455 152nd Street Surrey, British Columbia, Canada
V3S 5A5 | |
Director | |
Common Stock | |
| 1,700,000 | (6) | |
| (4 | ) |
Carol Cookerly
214 - 5455 152nd Street Surrey, British Columbia, Canada
V3S 5A5 | |
Director | |
Common Stock | |
| 1,700,000 | (6) | |
| (4 | ) |
| All officers and directors as a group | |
| |
Common stock, $0.001 par value | |
| 37,902,019 | | |
| 20.396 | % |
| | |
| |
| |
| | | |
| | |
| 5%+ Security Holders | |
| |
| |
| - | | |
| (4 | ) |
| None | |
| |
| |
| - | | |
| - | |
| All 5%+ Security Holders | |
| |
Common stock, $0.001 par value | |
| - | | |
| (4)- | |
| (1)
|
Under
Rule 13d-3, a beneficial owner of a security includes any person who, directly or indirectly, through any contract, arrangement,
understanding, relationship, or otherwise has or shares: (i) voting power, which includes the power to vote, or to direct the voting
of shares; and (ii) investment power, which includes the power to dispose or direct the disposition of shares. Certain shares may
be deemed to be beneficially owned by more than one person (if, for example, persons share the power to vote or the power to dispose
of the shares). In addition, shares are deemed to be beneficially owned by a person if the person has the right to acquire the shares
(for example, upon exercise of an option) within 60 days of the date as of which the information is provided. In computing the percentage
ownership of any person, the amount of shares outstanding is deemed to include the amount of shares beneficially owned by such person
(and only such person) by reason of these acquisition rights. |
| |
|
| (2) |
Percentages
are based on 185,829,993 shares of our Company’s common stock issued and outstanding at December 31, 2022. Does not include:
(i) 9,626,442 common shares underlying outstanding warrants; (ii)7,727,556 common shares underlying shares of outstanding Series
C, and E Preferred Stock; or (iii) an indeterminate number of common shares underlying outstanding shares of Series F Preferred Stock. |
| |
|
| (3) |
Includes
2,019 issued common shares and 26,000,000 common shares issuable upon voluntary conversion of 260 Series B Preferred shares. Does not
include 150,376 shares of non-convertible Series A Preferred stock carrying voting rights with the common stock equal to 665 votes per
Series A Preferred share (100,002,059 votes, or [ ]% of votes in the aggregate). |
| |
|
| (4) |
Less
than 1% |
| |
|
| (5) |
Includes
3,500,000 common shares issuable upon voluntary conversion of 35 Series B Preferred shares. Does not include 25,000 shares of
non-convertible Series A Preferred stock carrying voting rights with the common stock equal to 665 votes per Series A Preferred
shares. |
| |
|
| (6) |
Includes
1,700,000 common shares issuable upon voluntary conversion of 17 Series B Preferred shares. |
| ITEM 13. |
CERTAIN RELATIONSHIPS
AND RELATED TRANSACTIONS, AND DIRECTOR INDEPENDENCE |
Transactions
with Related Persons
Except
as disclosed herein, no director, executive officer, shareholder holding at least 5% of shares of our common stock, or any family member
thereof, had any material interest, direct or indirect, in any transaction, or proposed transaction since the year ended December 31,
2020, in which the amount involved in the transaction exceeded or exceeds the lesser of $120,000 or one percent of the average of our
total assets at the year-end for the last three completed fiscal years.
As
at December 31, 2022 the Company incurred $412,573 (2021 - $409,038) in salaries, bonuses of $120,000 (2021 - $196,556), and $241,284
(2021 - $197,906) in consulting fees to the President and CEO, and CFO of the Company, and the President, CEO’s, and CFO’s
of the Company’s subsidiaries. The Company also repaid $28,118 of management fees and salaries previously owing to the President
and CEO, of the Company from December 31, 2021 during the year ended December 31, 2022. As at December 31, 2022, the Company owed $nil
(December 31, 2021 - $28,118) to the President, CEO, and CFO of the Company and $49,441 (December 31, 2021 - $nil) to the President,
CEO’s, and CFO’s of the Company’s subsidiaries for management fees and salaries. Amounts owed and owing are unsecured,
non-interest bearing, and due on demand.
On
August 1, 2022, the Company issued an aggregate of 191 shares of Series B convertible preferred shares to the CEO of the Company. These
preferred shares were value at $897,700 based on the fair value of the underlying common stock.
On
June 27, 2022, the Company issued an aggregate of 105 shares of Series B convertible preferred shares to the Company’s board of
directors for past services. These preferred shares were valued at $777,000 based on the fair value of the underlying common stock. The
issuance is recorded under compensation expense.
On
March 4, 2021, the Company issued an aggregate of 16 shares of Series B convertible preferred shares to the Company’s board of
directors for past services. These preferred shares were valued at $849,600 based on the fair value of the underlying common stock. The
issuance is recorded under compensation expense.
Promoters
and Certain Control Persons
We
did not have any promoters at any time during the past five fiscal years.
Director
Independence
We
currently act with five (5) directors consisting of Robert Silzer, Stephen Johnston, James Singerling, Michael Leemhuis and Carol Cookerly.
We have not made any determination as to whether any of our directors are independent directors, as that term is used in Rule 4200(a)
(15) of the Rules of National Association of Securities Dealers.
| ITEM 14. |
PRINCIPAL ACCOUNTING
FEES AND SERVICES |
Audit
Fees, Audit Related Fees, and All Other Fees
The
following represents fees for professional services rendered by our independent registered public accounting firm for each of the years
ended December 31, 2022 and 2021.
| | |
2022 | | |
2021 | |
| Audit fees | |
$ | 69,201 | | |
$ | 69,201 | |
| Audit related fees | |
| Nil | | |
| Nil | |
| Tax fees | |
| Nil | | |
| Nil | |
| All other fees | |
| Nil | | |
| Nil | |
| Total | |
$ | 69,201 | | |
$ | 69,201 | |
Audit
fees represent amounts billed for professional services rendered for the audit of our annual consolidated financial statements, reviews
of our quarterly reports on Form 10-Q and certain additional services associated with accessing capital markets, including reviewing
registration statements and the issuance and preparation of comfort letters and consents.
Saturna
Group Chartered Professional Accountants, LLP served as our independent registered public accounting firm from October 2017 to January
2019.
Buckley
Dodds, LLP served as our independent registered public accounting firm from March 2019 to January 2022.
BF
Borgers, Certified Public Accountants, serve as our independent registered public accounting firm since February 2022.
PART
IV
| ITEM 15. |
EXHIBITS AND FINANCIAL
STATEMENT SCHEDULES |
| |
We have filed
the following documents as part of this Annual Report on Form 10-K: |
| |
|
|
| |
1. |
Consolidated Financial
Statements |
| |
|
|
| |
|
Our consolidated financial
statements are listed in the “Index to Consolidated Financial Statements” under Part II, Item 8 of this Annual Report
on Form 10-K. |
| |
|
|
| |
2. |
Financial Statement Schedules |
| |
|
|
| |
|
All schedules have been
omitted because they are not required, not applicable, not present in amounts sufficient to require submission of the schedule, or
the required information is otherwise included in our consolidated financial statements and related notes. |
| |
|
|
| |
3. |
Exhibits |
| |
|
|
| |
|
See the Exhibit Index immediately
following the signature pages of this Annual Report on Form 10-K. |
| ITEM 16. |
FORM 10-K SUMMARY |
None.
SIGNATURES
Pursuant
to the requirements of Section 13 or 15(d) of the Securities Exchange Act of 1934, the registrant has duly caused this report to be signed
on its behalf by the undersigned, thereunto duly authorized.
| Dated: |
July 13, 2023 |
DSG
Global Inc. |
| |
|
|
| |
|
By: |
/s/
Robert Silzer |
| |
|
|
Robert
Silzer |
| |
|
|
Chief
Executive Officer and Chief Financial Officer |
| |
|
|
(Principal
Executive Officer and
Principal
Financial and Accounting Officer) |
POWER
OF ATTORNEY
KNOW
ALL PERSONS BY THESE PRESENTS, that each person whose signature appears below constitutes and appoints Robert Silzer as his true and
lawful attorneys-in-fact and agents, with full power of substitution for him, and in his name in any and all capacities, to sign any
and all amendments to this Annual Report on Form 10-K, and to file the same, with exhibits thereto and other documents in connection
therewith, with the Securities and Exchange Commission, granting unto said attorney-in-fact and agent, full power and authority to do
and perform each and every act and thing requisite and necessary to be done therewith, as fully to all intents and purposes as he might
or could do in person, hereby ratifying and confirming all that said attorney-in-fact and agent, or his substitute or substitutes, may
lawfully do or cause to be done by virtue hereof.
Pursuant
to the requirements of the Securities Exchange Act of 1934, this report has been signed below by the following persons on behalf of the
registrant and in the capacities and on the dates indicated.
| Signature |
|
Title |
|
Date |
| |
|
|
|
|
| /s/
Robert Silzer |
|
Chief
Executive Officer, Chief Financial Officer and Chairman of the |
|
July 13, 2023 |
| Robert
Silzer |
|
Board
of Directors (Principal Executive Officer and Principal Financial and Accounting Officer) |
|
|
| |
|
|
|
|
| /s/
Stephen Johnston |
|
Director |
|
July 13, 2023 |
| Stephen
Johnston |
|
|
|
|
| |
|
|
|
|
| /s/
James Singerling |
|
Director |
|
July 13, 2023 |
| James
Singerling |
|
|
|
|
| |
|
|
|
|
| /s/
Michael Leemhuis |
|
Director |
|
July 13, 2023 |
| Michael
Leemhuis |
|
|
|
|
| |
|
|
|
|
| /s/
Carol Cookerly |
|
Director |
|
July 13, 2023 |
| Carol
Cookerly |
|
|
|
|
EXHIBIT
INDEX
Exhibit
Number |
|
Exhibit
Description |
|
Filed
Form |
|
Exhibit |
|
Filing
Date |
|
Herewith |
| 3.1.1 |
|
Articles of Incorporation of the Registrant |
|
SB-2 |
|
3.1 |
|
10-22-07 |
|
|
| |
|
|
|
|
|
|
|
|
|
|
| 3.1.2 |
|
Certificate of Change of the Registrant |
|
8-K |
|
3.1 |
|
06-24-08 |
|
|
| |
|
|
|
|
|
|
|
|
|
|
| 3.1.3 |
|
Articles of Merger of the Registrant |
|
8-K |
|
3.1 |
|
02-23-15 |
|
|
| |
|
|
|
|
|
|
|
|
|
|
| 3.1.4 |
|
Certificate of Change of the Registrant |
|
8-K |
|
3.2 |
|
02-23-15 |
|
|
| |
|
|
|
|
|
|
|
|
|
|
| 3.1.5 |
|
Certificate of Correction of the Registrant |
|
8-K |
|
3.3 |
|
02-23-15 |
|
|
| |
|
|
|
|
|
|
|
|
|
|
| 3.1.6 |
|
Certificate of Change of the Registrant |
|
8-K |
|
3.1 |
|
03-26-19 |
|
|
| |
|
|
|
|
|
|
|
|
|
|
| 3.1.7 |
|
Certificate of Correction of the Registrant |
|
8-K |
|
3.2 |
|
03-26-19 |
|
|
| |
|
|
|
|
|
|
|
|
|
|
| 3.1.8 |
|
Series A - Certificates of Amendment and Designation dated November 22, 2019 |
|
|
|
|
|
|
|
* |
| |
|
|
|
|
|
|
|
|
|
|
| 3.1.9 |
|
Series C - Certificates of Amendment and Designation dated December 22, 2020 |
|
|
|
|
|
|
|
* |
| |
|
|
|
|
|
|
|
|
|
|
| 3.1.10 |
|
Series F – Certificates of Designation dated December 22, 2020 |
|
|
|
|
|
|
|
* |
| |
|
|
|
|
|
|
|
|
|
|
| 3.2.1 |
|
Bylaws of the Registrant |
|
SB-2 |
|
3.2 |
|
10-22-07 |
|
|
| |
|
|
|
|
|
|
|
|
|
|
| 3.2.2 |
|
Amendment No. 1 to Bylaws of the Registrant |
|
8-K |
|
3.2 |
|
06-19-15 |
|
|
| |
|
|
|
|
|
|
|
|
|
|
| 4.1.2 |
|
DSG Global, Inc. 2015 Omnibus Incentive Plan |
|
10-Q |
|
10.3 |
|
11-13-15 |
|
|
| |
|
|
|
|
|
|
|
|
|
|
| 10.1 |
|
Subscription Agreement / Debt Settlement, dated September 26, 2014, between DSG TAG Systems Inc. and Westergaard Holdings Ltd. |
|
8-K |
|
10.1 |
|
08-17-15 |
|
|
| |
|
|
|
|
|
|
|
|
|
|
| 10.2 |
|
Addendum to Subscription Agreement / Debt Settlement, dated October 7, 2014, between DSG TAG Systems Inc. and Westergaard Holdings Ltd. |
|
8-K |
|
10.2 |
|
08-17-15 |
|
|
| |
|
|
|
|
|
|
|
|
|
|
| 10.3 |
|
Second Addendum to Subscription Agreement / Debt Settlement, dated April 29, 2015, between DSG TAG Systems Inc. and Westergaard Holdings Ltd. |
|
8-K |
|
10.3 |
|
08-17-15 |
|
|
| |
|
|
|
|
|
|
|
|
|
|
| 10.4 |
|
Third Addendum to Subscription Agreement / Debt Settlement, dated August 11, 2015, between DSG TAG Systems Inc. and Westergaard Holdings Ltd. |
|
8-K |
|
10.4 |
|
08-17-15 |
|
|
| |
|
|
|
|
|
|
|
|
|
|
| 10.5 |
|
Letter from Westergaard Holdings Ltd., dated September 1, 2015, extending dates of redemption obligations. |
|
8-K |
|
10.1 |
|
09-08-15 |
|
|
Exhibit
Number |
|
Exhibit
Description |
|
Filed
Form |
|
Exhibit |
|
Filing
Date |
|
Herewith |
| |
|
|
|
|
|
|
|
|
|
|
| 10.6 |
|
Letter from Westergaard Holdings Ltd., dated November 10, 2015, extending dates of redemption obligations |
|
10-Q |
|
10.1 |
|
11-16-15 |
|
|
| |
|
|
|
|
|
|
|
|
|
|
| 10.7 |
|
Letter fromWestergaard Holdings Ltd., dated December 31, 2015, extending dates of redemption obligations |
|
8-K |
|
10.1 |
|
03-09-16 |
|
|
| |
|
|
|
|
|
|
|
|
|
|
| 10.8 |
|
Convertible Note of DSG TAG Systems Inc., dated March 31, 2015, payable to Adore Creative Agency, Inc. |
|
8-K |
|
10.5 |
|
08-17-15 |
|
|
| |
|
|
|
|
|
|
|
|
|
|
| 10.9 |
|
Convertible Note Agreement, dated August 25, 2015, between the Registrant and Jerry Katell, Katell Productions, LLC and Katell Properties, LLC |
|
10-Q |
|
10.2 |
|
11-13-15 |
|
|
| |
|
|
|
|
|
|
|
|
|
|
| 10.10 |
|
Agreement (TAG Infinity XL 12” ) dated February 15, 2014 between DSG TAG Systems Inc. and DSG Canadian Manufacturing Corp. |
|
8-K |
|
10.2 |
|
12-05-15 |
|
|
| |
|
|
|
|
|
|
|
|
|
|
| 10.11 |
|
Loan agreement, dated October 24, 2014 between DSG TAG Systems Inc. and A.Bosa & Co (Kootenay) Ltd. |
|
10-K |
|
10.5 |
|
05-28-19 |
|
|
| |
|
|
|
|
|
|
|
|
|
|
| 10.12 |
|
Lease agreement (Modified), dated January 21, 2016 and February 1, 2016 between DSG TAG Systems Inc. and Benchmark Group |
|
10-K |
|
10.6 |
|
05-28-19 |
|
|
| |
|
|
|
|
|
|
|
|
|
|
| 10.13 |
|
Loan agreement, dated February 11, 2016 between DSG TAG Systems Inc. and Jeremy Yaseniuk |
|
10-K |
|
10.7 |
|
05-28-19 |
|
|
| |
|
|
|
|
|
|
|
|
|
|
| 10.14 |
|
Loan agreement, dated March 31, 2016 between DSG TAG Systems Inc. and E. Gary Risler |
|
10-K |
|
10.8 |
|
05-28-19 |
|
|
| |
|
|
|
|
|
|
|
|
|
|
| 10.15 |
|
Letter from Westergaard Holdings Ltd., dated April 29, 2016 |
|
10-K |
|
10.1 |
|
05-20-16 |
|
|
| |
|
|
|
|
|
|
|
|
|
|
| 10.16 |
|
Security purchase agreement between DSG Global Inc. and Coastal Investment Partners, dated November 7 2016 |
|
8-K |
|
10.1 |
|
11-15-16 |
|
|
| |
|
|
|
|
|
|
|
|
|
|
| 10.17 |
|
Letter of Resignation by Board Member Keith Westergaard |
|
10-Q |
|
10.1 |
|
12-16-16 |
|
|
| |
|
|
|
|
|
|
|
|
|
|
| 10.18 |
|
Equity Financing Agreement dated September 18, 2019 between DSG Global, Inc. and GHS Investments, LLC |
|
S-1 |
|
10.9 |
|
10-04-19 |
|
|
| |
|
|
|
|
|
|
|
|
|
|
| 10.19 |
|
Registration Rights Agreement dated September 18, 2019 between DSG Global, Inc. and GHS Investments, LLC |
|
S-1 |
|
10.10 |
|
10-04-19 |
|
|
| |
|
|
|
|
|
|
|
|
|
|
| 10.20 |
|
Advisory Services Agreement dated as of March 2, 2020 Graj + Gustavsen, Inc.. |
|
8-K |
|
10.1 |
|
03-06-20 |
|
|
| |
|
|
|
|
|
|
|
|
|
|
| 10.21 |
|
Stock Purchase Agreement between the Company and GHS dated December 23, 2020 |
|
8-k |
|
10.1 |
|
12-31-20 |
|
|
| |
|
|
|
|
|
|
|
|
|
|
| 10.22 |
|
Warrant Agreement dated December 23, 2020 |
|
8-K |
|
10.2 |
|
12.31.20 |
|
|
| |
|
|
|
|
|
|
|
|
|
|
| 10.23 |
|
OEM Cooperation Agreement with Skywell New Energy Automobile Group Co. Ltd. Dated February 5, 2021. |
|
8-K |
|
10.1 |
|
02-23-21 |
|
|
| |
|
|
|
|
|
|
|
|
|
|
| 21 |
|
List of Subsidiary: |
|
10-K |
|
21.1 |
|
05-02-16 |
|
|
*Filed
herewith
| #* |
The information in this
exhibit is furnished and deemed not filed with the Securities and Exchange Commission for purposes of section 18 of the Exchange
Act of 1934, as amended, and is not to be incorporated by reference into any filing of DSG Global Inc. under the Securities Act of
1933, as amended, or the Exchange Act of 1934, as amended, whether made before or after the date hereof, regardless of any general
incorporation language in such filing. |
Exhibit
3.1.8

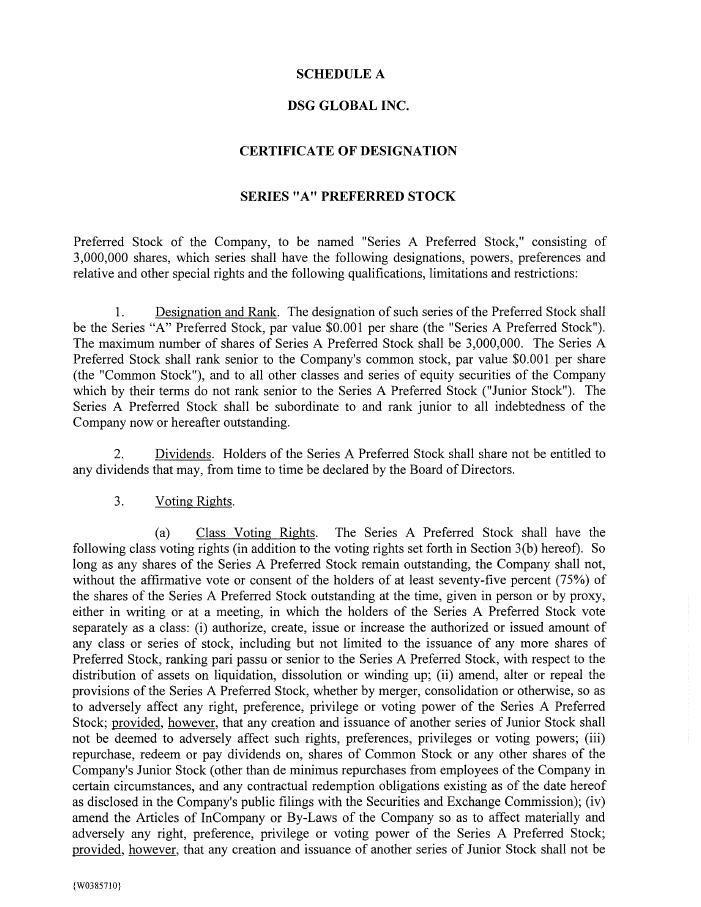
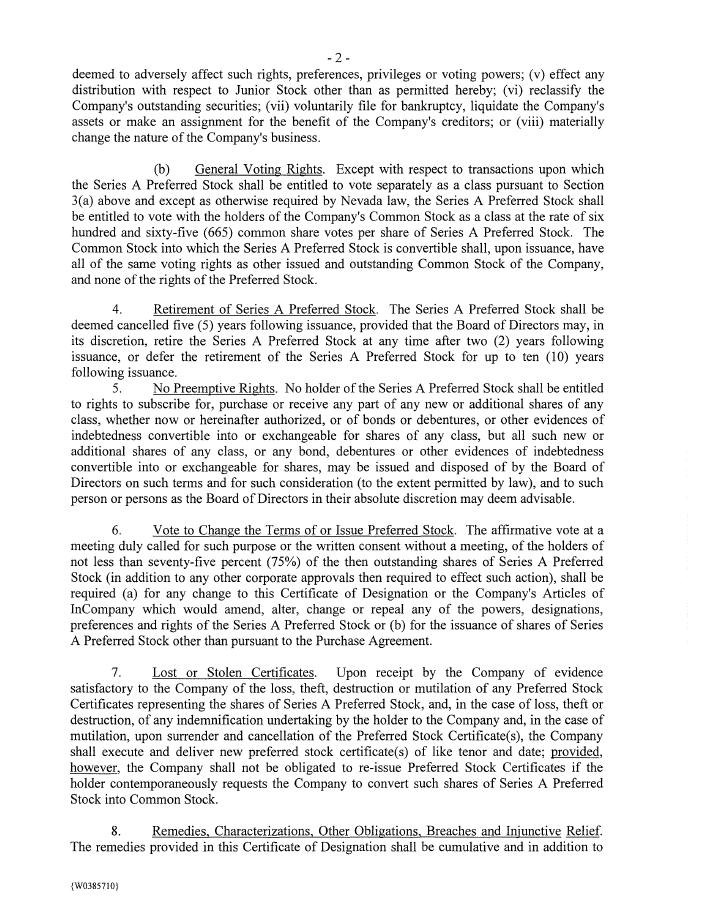
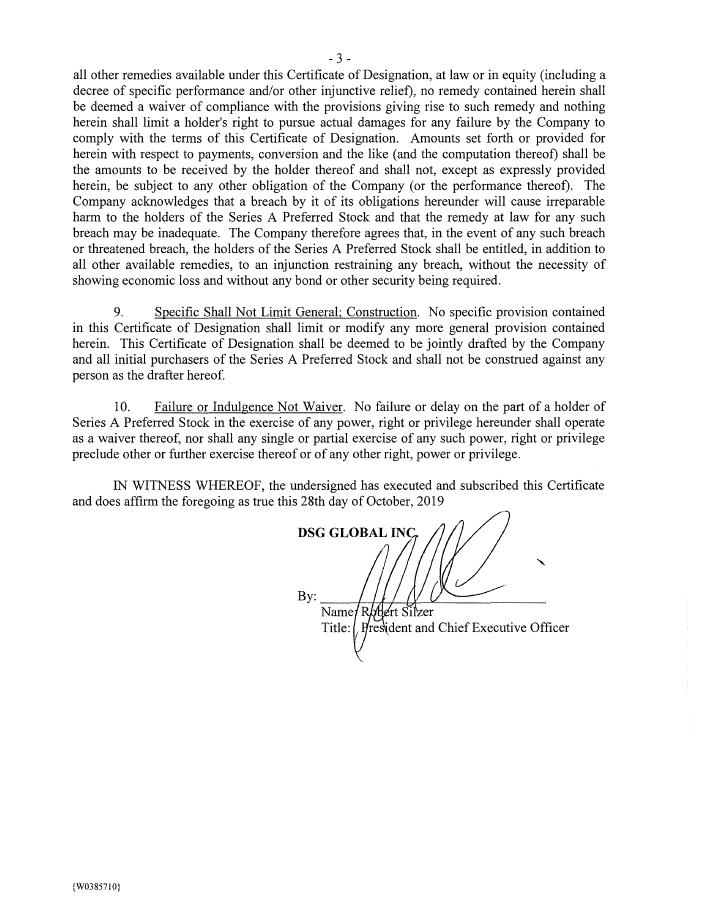
Exhibit
3.1.9
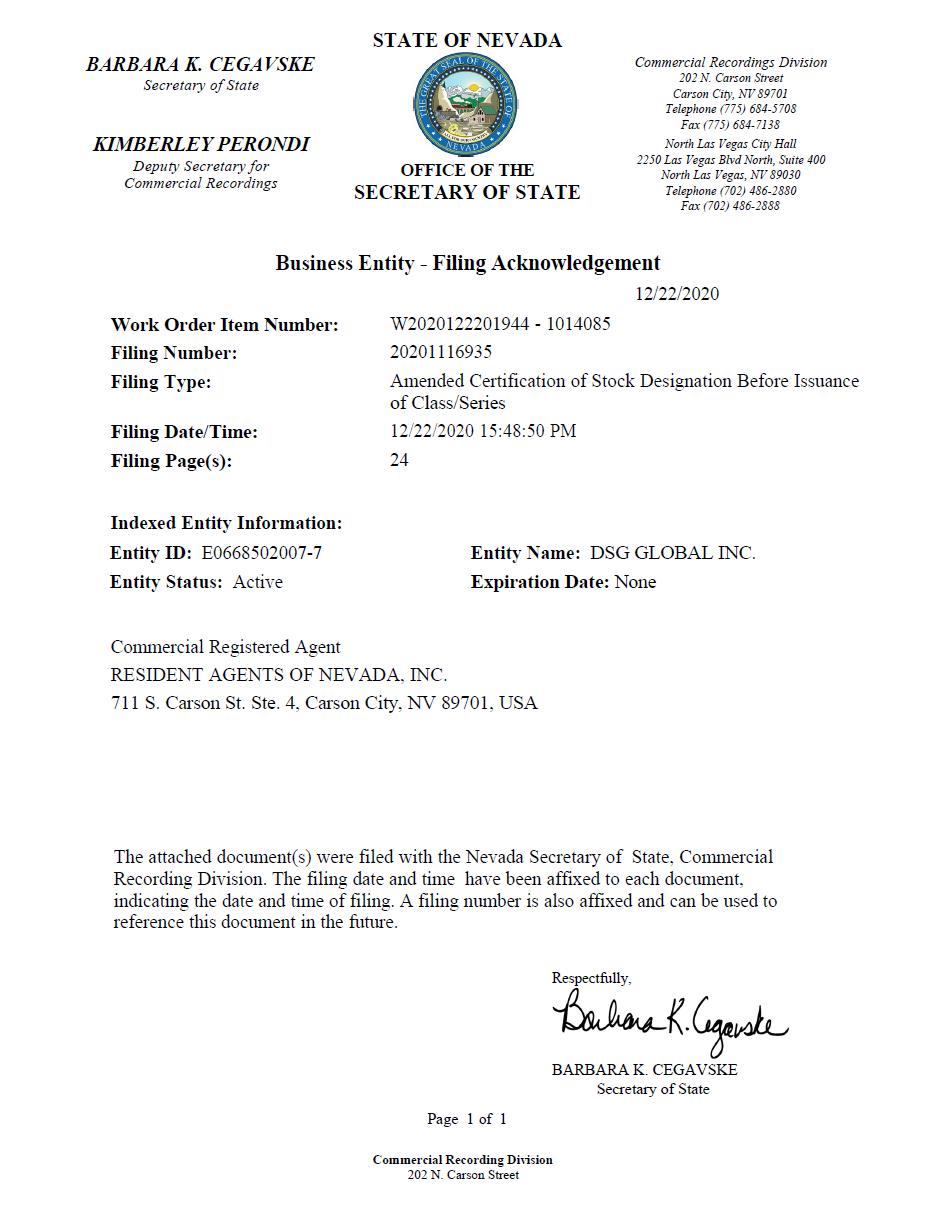
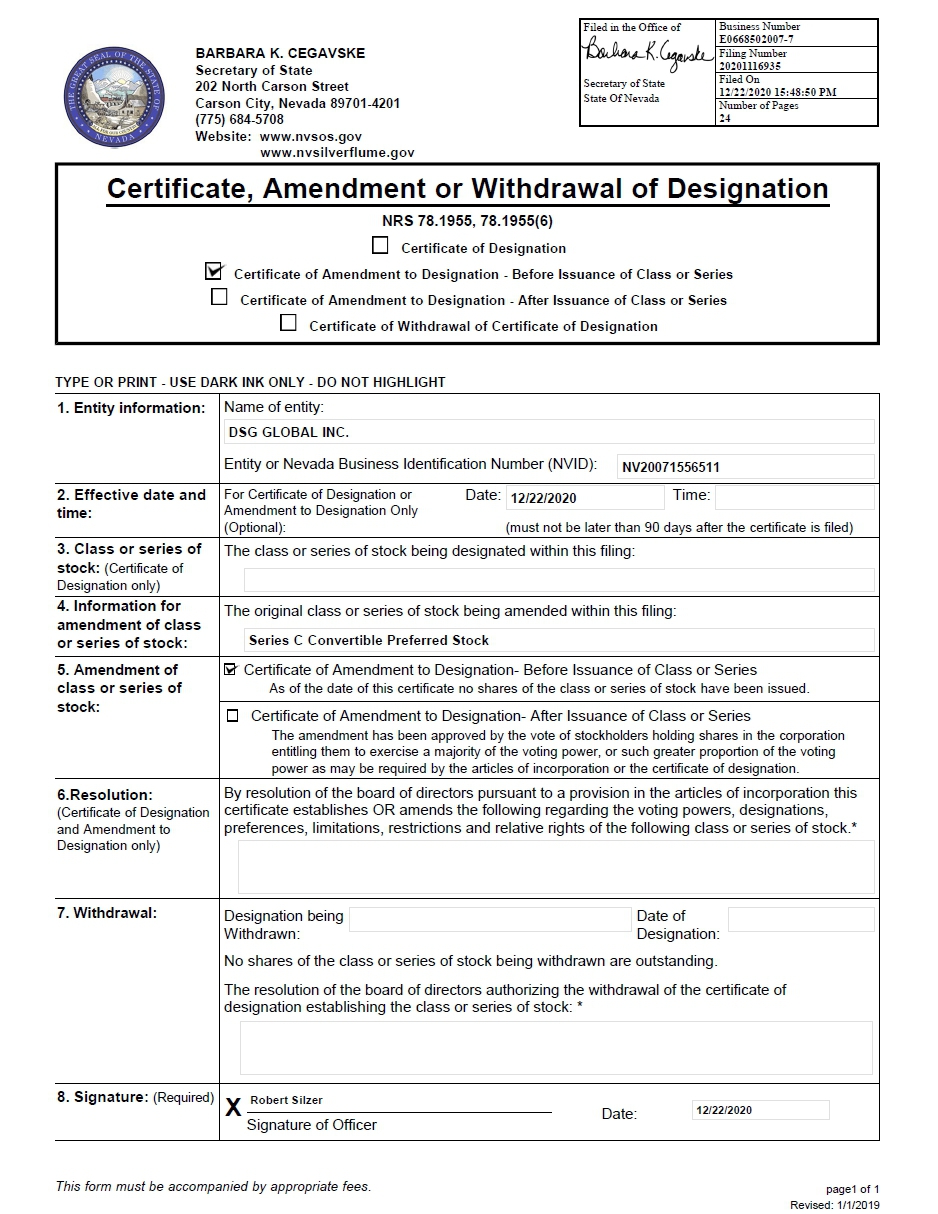

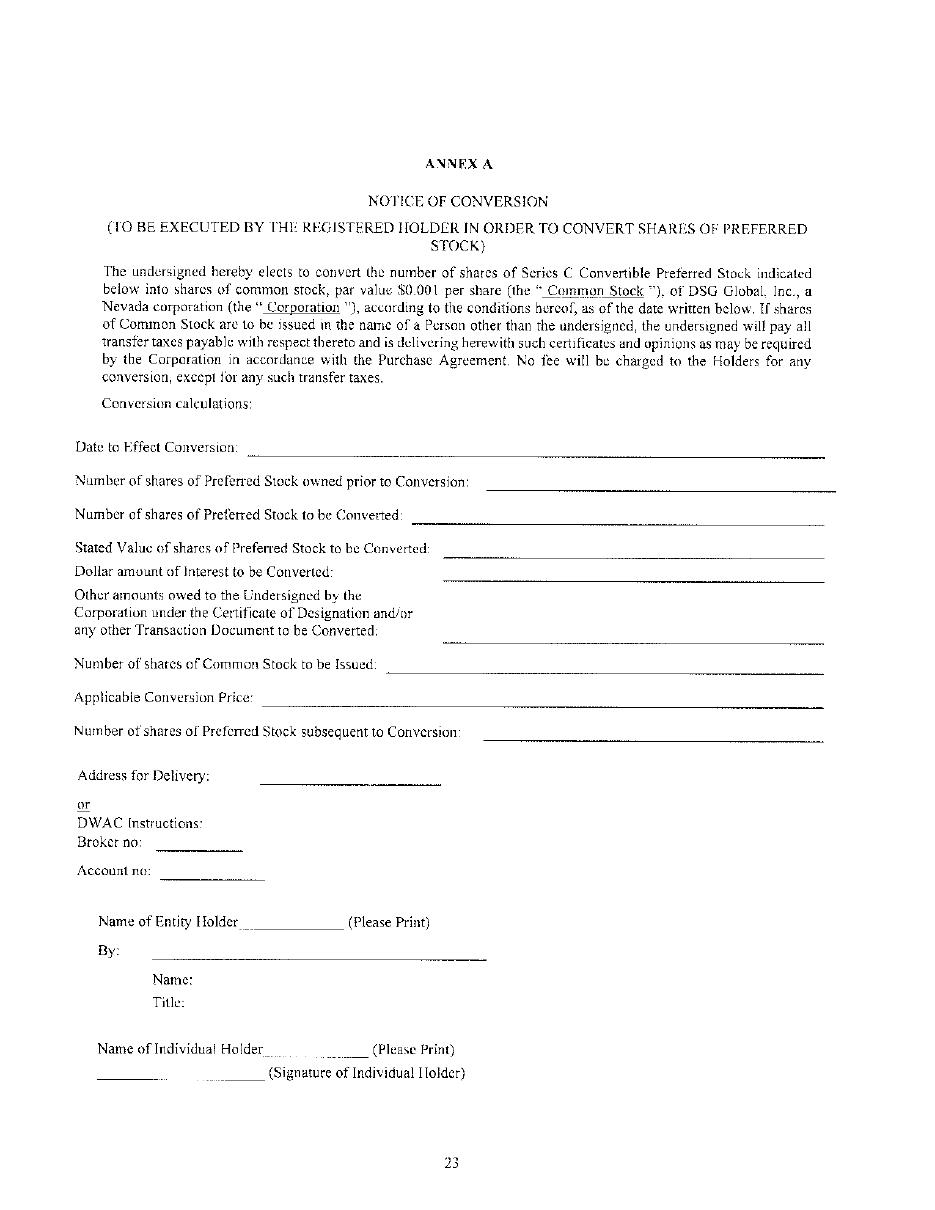
Exhibit
3.1.10
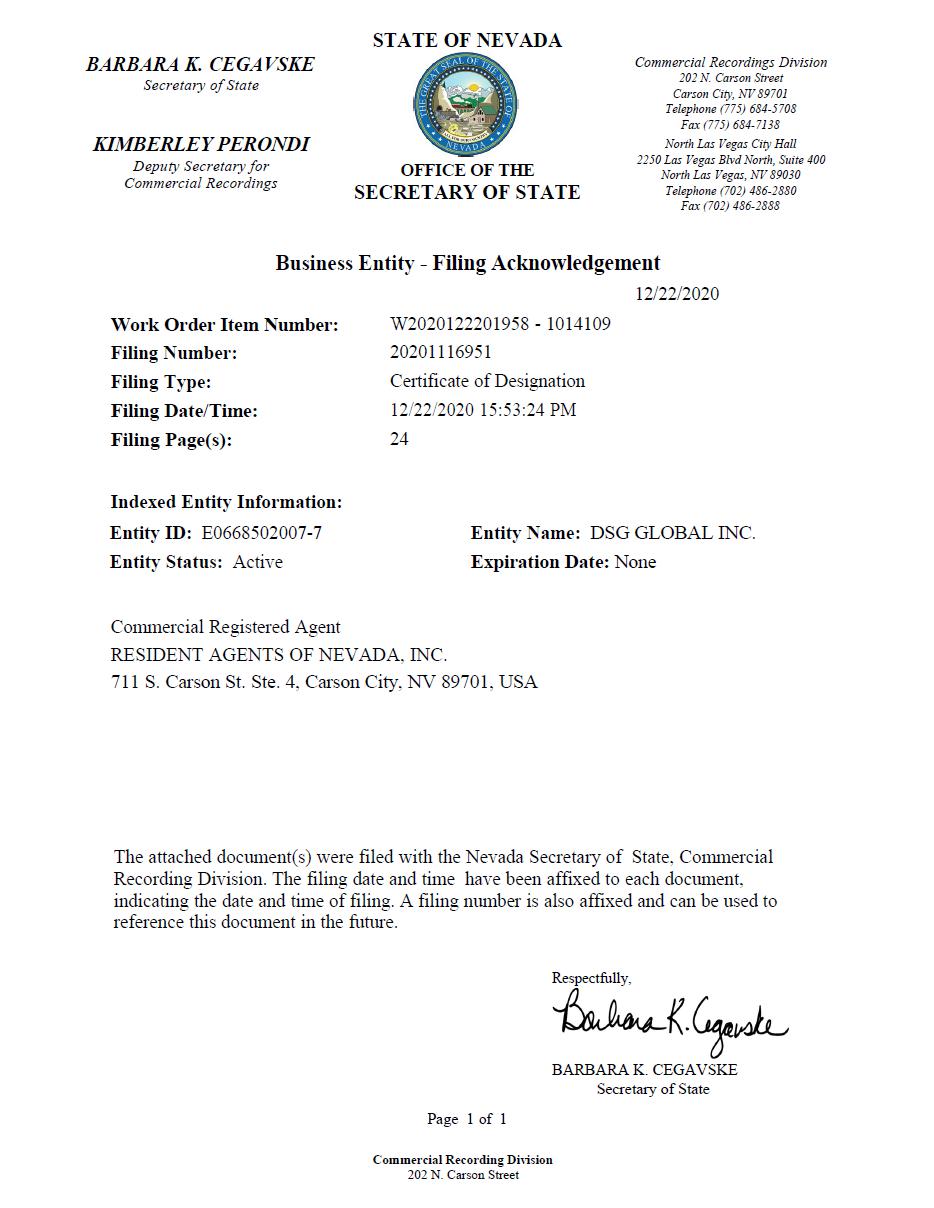
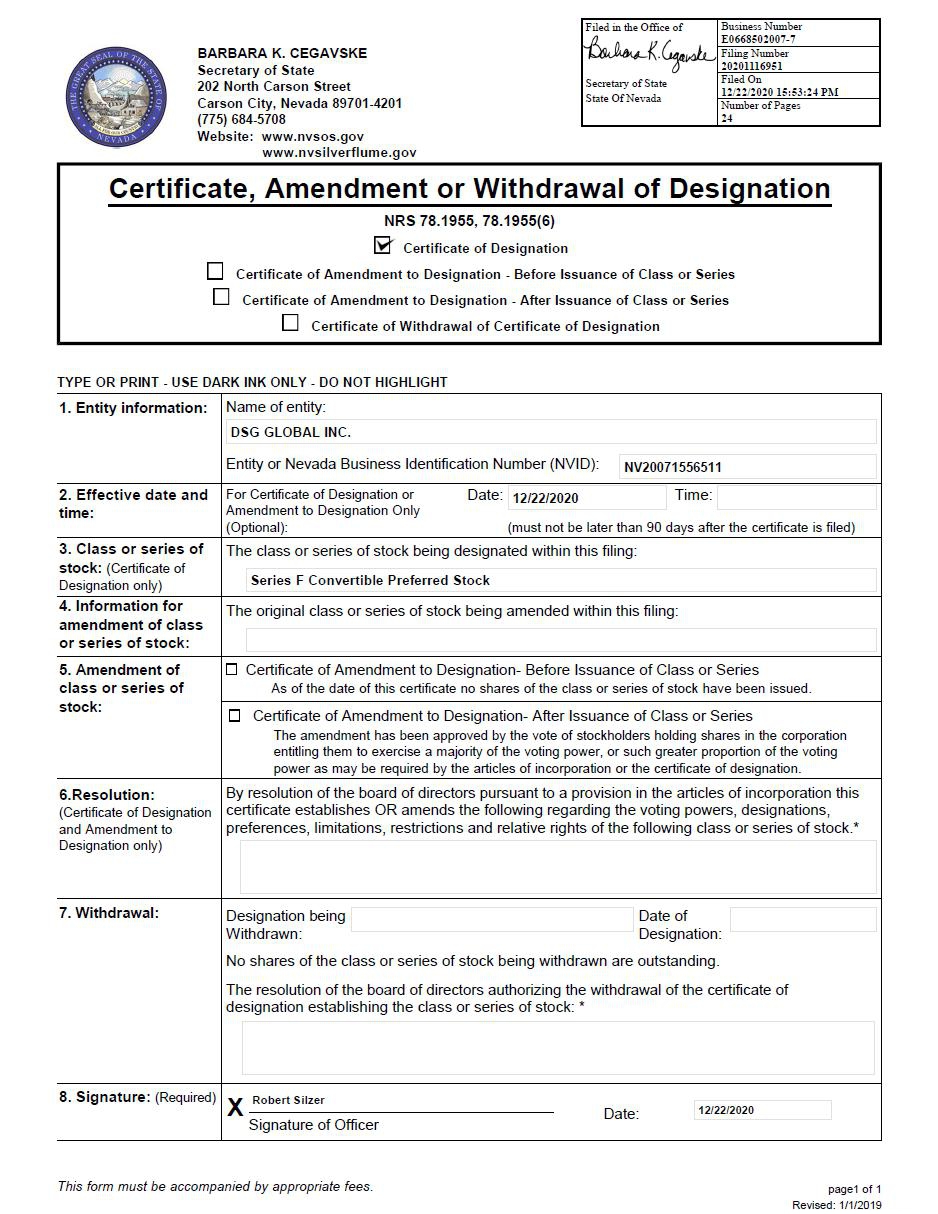

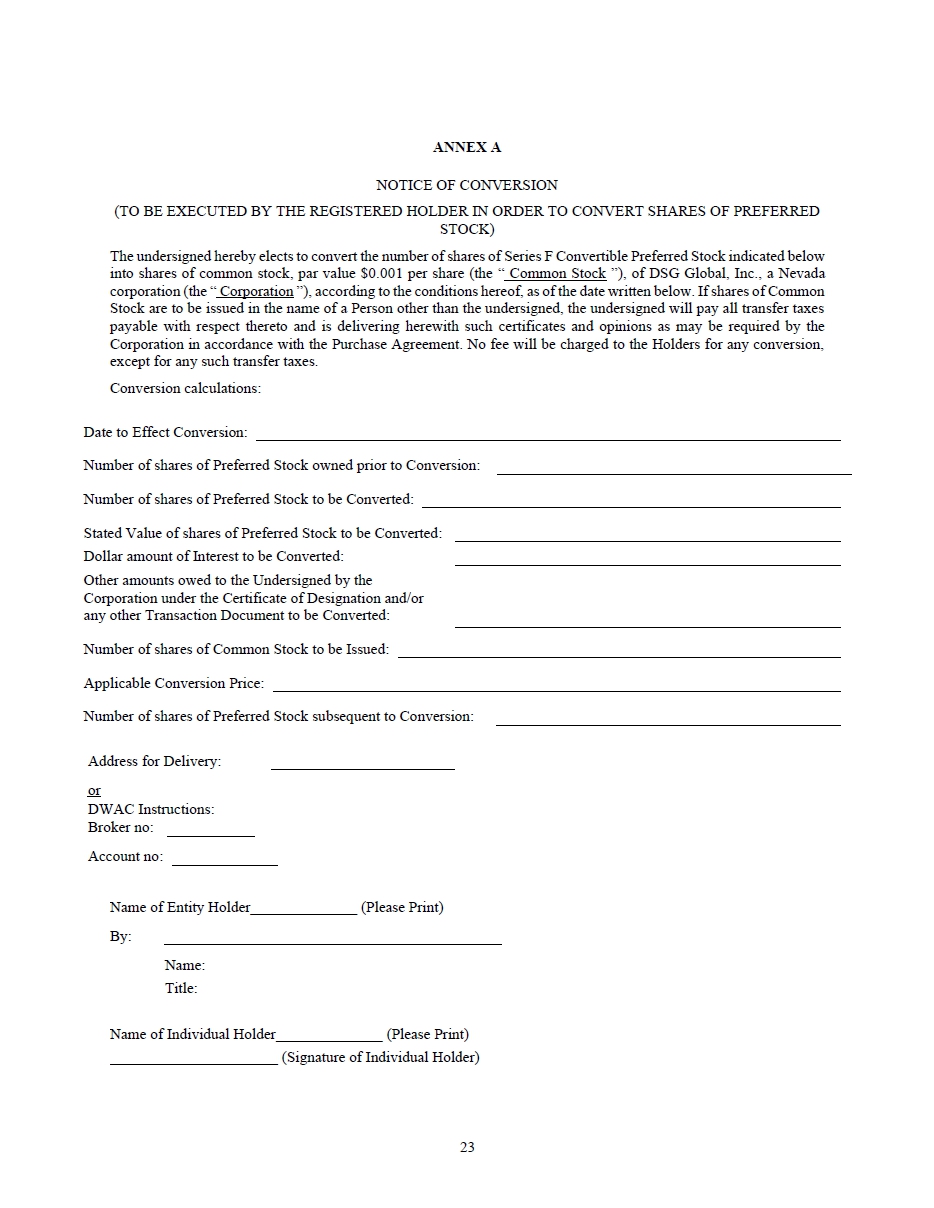
Exhibit
31.1
CERTIFICATION
PURSUANT TO
SECTION 302 OF THE SARBANES-OXLEY ACT OF 2002
I,
Robert Silzer, certify that:
1.
I have reviewed this Annual Report on Form 10-K/A of DSG Global Inc. (the “registrant”);
2.
Based on my knowledge, this report does not contain any untrue statement of a material fact or omit to state a material fact necessary
to make the statements made, in light of the circumstances under which such statements were made, not misleading with respect to the
period covered by this report;
3.
Based on my knowledge, the financial statements, and other financial information included in this report, fairly present in all material
respects the financial condition, results of operations and cash flows of the registrant as of, and for, the periods presented in this
report;
4.
I am responsible for establishing and maintaining disclosure controls and procedures (as defined in Exchange Act Rules 13a–15(e)
and 15d–15(e)) and internal control over financial reporting (as defined in Exchange Act Rules 13a–15(f) and 15d–15(f))
for the registrant and have:
(a)
designed such disclosure controls and procedures, or caused such disclosure controls and procedures to be designed under my supervision,
to ensure that material information relating to the registrant, including its consolidated subsidiary, is made known to us by others
within those entities, particularly during the period in which this report is being prepared;
(b)
designed such internal control over financial reporting, or caused such internal control over financial reporting to be designed under
my supervision, to provide reasonable assurance regarding the reliability of financial reporting and the preparation of financial statements
for external purposes in accordance with generally accepted accounting principles;
(c)
evaluated the effectiveness of the registrant’s disclosure controls and procedures and presented in this report my conclusions
about the effectiveness of the disclosure controls and procedures, as of the end of the period covered by this report based on such evaluation;
and
(d)
disclosed in this report any change in the registrant’s internal control over financial reporting that occurred during the registrant’s
most recent fiscal quarter (the registrant’s fourth fiscal quarter in the case of an annual report) that has materially affected,
or is reasonably likely to materially affect, the registrant’s internal control over financial reporting; and
5.
I have disclosed, based on my most recent evaluation of internal control over financial reporting, to the registrant’s auditors
and the audit committee of the registrant’s board of directors (or persons performing the equivalent functions):
(a)
all significant deficiencies and material weaknesses in the design or operation of internal control over financial reporting which are
reasonably likely to adversely affect the registrant’s ability to record, process, summarize and report financial information;
and
(b)
any fraud, whether or not material, that involves management or other employees who have a significant role in the registrant’s
internal control over financial reporting.
Date:
July 13, 2023
| |
/s/
Robert Silzer |
| |
Robert
Silzer |
| |
Chief
Executive Officer and Chief Financial Officer |
| |
(Principal
Executive Officer and Principal Financial Officer) |
Exhibit
32.1
CERTIFICATION
PURSUANT TO
SECTION 906 OF THE SARBANES-OXLEY ACT OF 2002
The
undersigned, Robert Silzer, hereby certifies, pursuant to Section 906 of the Sarbanes-Oxley Act of 2002, that
| 1.
|
the
Annual Report on Form 10-K/A of DSG Global Inc. for the year ended December 31, 2022 fully complies with the requirements of Section
13(a) or 15(d) of the Securities Exchange Act of 1934; and |
| |
|
| 2.
|
the
information contained in the Annual Report on Form 10-K fairly presents, in all material respects, the financial condition and results
of operations of DSG Global Inc. |
Date:
July 13, 2023
| |
/s/
Robert Silzer |
| |
Robert
Silzer |
| |
Chief
Executive Officer and Chief Financial Officer |
| |
(Principal
Executive Officer and Principal Financial Officer) |
v3.23.2
Cover - USD ($)
|
12 Months Ended |
|
|
Dec. 31, 2022 |
Apr. 17, 2023 |
Jun. 30, 2022 |
| Cover [Abstract] |
|
|
|
| Document Type |
10-K/A
|
|
|
| Amendment Flag |
true
|
|
|
| Amendment Description |
DSG
Global Inc. is filing this Amendment No. 1 on Form 10-K/A to amend the Annual Report on Form 10-K for the fiscal year ended December
31, 2022, originally filed with the Securities Exchange Commission (the “SEC”) by the Company on April 18, 2023 (the “Original
Form 10-K”), because the Original Form 10-K that was filed was not the version that had been approved by our independent auditors,
and was a prior version that had been sent by Management to the Company’s Edgar and XBRL filing service.
|
|
|
| Document Annual Report |
true
|
|
|
| Document Transition Report |
false
|
|
|
| Document Period End Date |
Dec. 31, 2022
|
|
|
| Document Fiscal Period Focus |
FY
|
|
|
| Document Fiscal Year Focus |
2022
|
|
|
| Current Fiscal Year End Date |
--12-31
|
|
|
| Entity File Number |
000-53988
|
|
|
| Entity Registrant Name |
DSG
GLOBAL INC.
|
|
|
| Entity Central Index Key |
0001413909
|
|
|
| Entity Tax Identification Number |
26-1134956
|
|
|
| Entity Incorporation, State or Country Code |
NV
|
|
|
| Entity Address, Address Line One |
207
- 15272 Croydon Drive
|
|
|
| Entity Address, Address Line Two |
Surrey
|
|
|
| Entity Address, City or Town |
British Columbia
|
|
|
| Entity Address, Country |
CA
|
|
|
| Entity Address, Postal Zip Code |
V3Z 0Z5
|
|
|
| City Area Code |
(604)
|
|
|
| Local Phone Number |
575-3848
|
|
|
| Entity Well-known Seasoned Issuer |
No
|
|
|
| Entity Voluntary Filers |
No
|
|
|
| Entity Current Reporting Status |
Yes
|
|
|
| Entity Interactive Data Current |
Yes
|
|
|
| Entity Filer Category |
Non-accelerated Filer
|
|
|
| Entity Small Business |
true
|
|
|
| Entity Emerging Growth Company |
false
|
|
|
| Entity Shell Company |
false
|
|
|
| Entity Public Float |
|
|
$ 10,011,073
|
| Entity Common Stock, Shares Outstanding |
|
145,429,993
|
|
| ICFR Auditor Attestation Flag |
false
|
|
|
| Auditor Firm ID |
5041
|
|
|
| Auditor Name |
BF Borgers CPA PC
|
|
|
| Auditor Location |
Lakewood,
CO
|
|
|
| X |
- DefinitionDescription of changes contained within amended document.
| Name: |
dei_AmendmentDescription |
| Namespace Prefix: |
dei_ |
| Data Type: |
xbrli:stringItemType |
| Balance Type: |
na |
| Period Type: |
duration |
|
| X |
- DefinitionBoolean flag that is true when the XBRL content amends previously-filed or accepted submission.
| Name: |
dei_AmendmentFlag |
| Namespace Prefix: |
dei_ |
| Data Type: |
xbrli:booleanItemType |
| Balance Type: |
na |
| Period Type: |
duration |
|
| X |
- DefinitionPCAOB issued Audit Firm Identifier Reference 1: http://www.xbrl.org/2003/role/presentationRef
-Publisher SEC
-Name Form 10-K
-Number 249
-Section 310
Reference 2: http://www.xbrl.org/2003/role/presentationRef
-Publisher SEC
-Name Form 20-F
-Number 249
-Section 220
-Subsection f
Reference 3: http://www.xbrl.org/2003/role/presentationRef
-Publisher SEC
-Name Form 40-F
-Number 249
-Section 240
-Subsection f
| Name: |
dei_AuditorFirmId |
| Namespace Prefix: |
dei_ |
| Data Type: |
dei:nonemptySequenceNumberItemType |
| Balance Type: |
na |
| Period Type: |
duration |
|
| X |
- ReferencesReference 1: http://www.xbrl.org/2003/role/presentationRef
-Publisher SEC
-Name Form 10-K
-Number 249
-Section 310
Reference 2: http://www.xbrl.org/2003/role/presentationRef
-Publisher SEC
-Name Form 20-F
-Number 249
-Section 220
-Subsection f
Reference 3: http://www.xbrl.org/2003/role/presentationRef
-Publisher SEC
-Name Form 40-F
-Number 249
-Section 240
-Subsection f
| Name: |
dei_AuditorLocation |
| Namespace Prefix: |
dei_ |
| Data Type: |
dei:internationalNameItemType |
| Balance Type: |
na |
| Period Type: |
duration |
|
| X |
- ReferencesReference 1: http://www.xbrl.org/2003/role/presentationRef
-Publisher SEC
-Name Form 10-K
-Number 249
-Section 310
Reference 2: http://www.xbrl.org/2003/role/presentationRef
-Publisher SEC
-Name Form 20-F
-Number 249
-Section 220
-Subsection f
Reference 3: http://www.xbrl.org/2003/role/presentationRef
-Publisher SEC
-Name Form 40-F
-Number 249
-Section 240
-Subsection f
| Name: |
dei_AuditorName |
| Namespace Prefix: |
dei_ |
| Data Type: |
dei:internationalNameItemType |
| Balance Type: |
na |
| Period Type: |
duration |
|
| X |
- DefinitionEnd date of current fiscal year in the format --MM-DD.
| Name: |
dei_CurrentFiscalYearEndDate |
| Namespace Prefix: |
dei_ |
| Data Type: |
xbrli:gMonthDayItemType |
| Balance Type: |
na |
| Period Type: |
duration |
|
| X |
- DefinitionBoolean flag that is true only for a form used as an annual report. Reference 1: http://www.xbrl.org/2003/role/presentationRef
-Publisher SEC
-Name Form 10-K
-Number 249
-Section 310
Reference 2: http://www.xbrl.org/2003/role/presentationRef
-Publisher SEC
-Name Form 20-F
-Number 249
-Section 220
-Subsection f
Reference 3: http://www.xbrl.org/2003/role/presentationRef
-Publisher SEC
-Name Form 40-F
-Number 249
-Section 240
-Subsection f
| Name: |
dei_DocumentAnnualReport |
| Namespace Prefix: |
dei_ |
| Data Type: |
xbrli:booleanItemType |
| Balance Type: |
na |
| Period Type: |
duration |
|
| X |
- DefinitionFiscal period values are FY, Q1, Q2, and Q3. 1st, 2nd and 3rd quarter 10-Q or 10-QT statements have value Q1, Q2, and Q3 respectively, with 10-K, 10-KT or other fiscal year statements having FY.
| Name: |
dei_DocumentFiscalPeriodFocus |
| Namespace Prefix: |
dei_ |
| Data Type: |
dei:fiscalPeriodItemType |
| Balance Type: |
na |
| Period Type: |
duration |
|
| X |
- DefinitionThis is focus fiscal year of the document report in YYYY format. For a 2006 annual report, which may also provide financial information from prior periods, fiscal 2006 should be given as the fiscal year focus. Example: 2006.
| Name: |
dei_DocumentFiscalYearFocus |
| Namespace Prefix: |
dei_ |
| Data Type: |
xbrli:gYearItemType |
| Balance Type: |
na |
| Period Type: |
duration |
|
| X |
- DefinitionFor the EDGAR submission types of Form 8-K: the date of the report, the date of the earliest event reported; for the EDGAR submission types of Form N-1A: the filing date; for all other submission types: the end of the reporting or transition period. The format of the date is YYYY-MM-DD.
| Name: |
dei_DocumentPeriodEndDate |
| Namespace Prefix: |
dei_ |
| Data Type: |
xbrli:dateItemType |
| Balance Type: |
na |
| Period Type: |
duration |
|
| X |
- DefinitionBoolean flag that is true only for a form used as a transition report. Reference 1: http://www.xbrl.org/2003/role/presentationRef
-Publisher SEC
-Name Forms 10-K, 10-Q, 20-F
-Number 240
-Section 13
-Subsection a-1
| Name: |
dei_DocumentTransitionReport |
| Namespace Prefix: |
dei_ |
| Data Type: |
xbrli:booleanItemType |
| Balance Type: |
na |
| Period Type: |
duration |
|
| X |
- DefinitionThe type of document being provided (such as 10-K, 10-Q, 485BPOS, etc). The document type is limited to the same value as the supporting SEC submission type, or the word 'Other'.
| Name: |
dei_DocumentType |
| Namespace Prefix: |
dei_ |
| Data Type: |
dei:submissionTypeItemType |
| Balance Type: |
na |
| Period Type: |
duration |
|
| X |
- DefinitionAddress Line 1 such as Attn, Building Name, Street Name
| Name: |
dei_EntityAddressAddressLine1 |
| Namespace Prefix: |
dei_ |
| Data Type: |
xbrli:normalizedStringItemType |
| Balance Type: |
na |
| Period Type: |
duration |
|
| X |
- DefinitionAddress Line 2 such as Street or Suite number
| Name: |
dei_EntityAddressAddressLine2 |
| Namespace Prefix: |
dei_ |
| Data Type: |
xbrli:normalizedStringItemType |
| Balance Type: |
na |
| Period Type: |
duration |
|
| X |
- Definition
+ References
+ Details
| Name: |
dei_EntityAddressCityOrTown |
| Namespace Prefix: |
dei_ |
| Data Type: |
xbrli:normalizedStringItemType |
| Balance Type: |
na |
| Period Type: |
duration |
|
| X |
- DefinitionISO 3166-1 alpha-2 country code.
| Name: |
dei_EntityAddressCountry |
| Namespace Prefix: |
dei_ |
| Data Type: |
dei:countryCodeItemType |
| Balance Type: |
na |
| Period Type: |
duration |
|
| X |
- DefinitionCode for the postal or zip code
| Name: |
dei_EntityAddressPostalZipCode |
| Namespace Prefix: |
dei_ |
| Data Type: |
xbrli:normalizedStringItemType |
| Balance Type: |
na |
| Period Type: |
duration |
|
| X |
- DefinitionA unique 10-digit SEC-issued value to identify entities that have filed disclosures with the SEC. It is commonly abbreviated as CIK. Reference 1: http://www.xbrl.org/2003/role/presentationRef
-Publisher SEC
-Name Exchange Act
-Number 240
-Section 12
-Subsection b-2
| Name: |
dei_EntityCentralIndexKey |
| Namespace Prefix: |
dei_ |
| Data Type: |
dei:centralIndexKeyItemType |
| Balance Type: |
na |
| Period Type: |
duration |
|
| X |
- DefinitionIndicate number of shares or other units outstanding of each of registrant's classes of capital or common stock or other ownership interests, if and as stated on cover of related periodic report. Where multiple classes or units exist define each class/interest by adding class of stock items such as Common Class A [Member], Common Class B [Member] or Partnership Interest [Member] onto the Instrument [Domain] of the Entity Listings, Instrument.
| Name: |
dei_EntityCommonStockSharesOutstanding |
| Namespace Prefix: |
dei_ |
| Data Type: |
xbrli:sharesItemType |
| Balance Type: |
na |
| Period Type: |
instant |
|
| X |
- DefinitionIndicate 'Yes' or 'No' whether registrants (1) have filed all reports required to be filed by Section 13 or 15(d) of the Securities Exchange Act of 1934 during the preceding 12 months (or for such shorter period that registrants were required to file such reports), and (2) have been subject to such filing requirements for the past 90 days. This information should be based on the registrant's current or most recent filing containing the related disclosure.
| Name: |
dei_EntityCurrentReportingStatus |
| Namespace Prefix: |
dei_ |
| Data Type: |
dei:yesNoItemType |
| Balance Type: |
na |
| Period Type: |
duration |
|
| X |
- DefinitionIndicate if registrant meets the emerging growth company criteria. Reference 1: http://www.xbrl.org/2003/role/presentationRef
-Publisher SEC
-Name Exchange Act
-Number 240
-Section 12
-Subsection b-2
| Name: |
dei_EntityEmergingGrowthCompany |
| Namespace Prefix: |
dei_ |
| Data Type: |
xbrli:booleanItemType |
| Balance Type: |
na |
| Period Type: |
duration |
|
| X |
- DefinitionCommission file number. The field allows up to 17 characters. The prefix may contain 1-3 digits, the sequence number may contain 1-8 digits, the optional suffix may contain 1-4 characters, and the fields are separated with a hyphen.
| Name: |
dei_EntityFileNumber |
| Namespace Prefix: |
dei_ |
| Data Type: |
dei:fileNumberItemType |
| Balance Type: |
na |
| Period Type: |
duration |
|
| X |
- DefinitionIndicate whether the registrant is one of the following: Large Accelerated Filer, Accelerated Filer, Non-accelerated Filer. Definitions of these categories are stated in Rule 12b-2 of the Exchange Act. This information should be based on the registrant's current or most recent filing containing the related disclosure. Reference 1: http://www.xbrl.org/2003/role/presentationRef
-Publisher SEC
-Name Exchange Act
-Number 240
-Section 12
-Subsection b-2
| Name: |
dei_EntityFilerCategory |
| Namespace Prefix: |
dei_ |
| Data Type: |
dei:filerCategoryItemType |
| Balance Type: |
na |
| Period Type: |
duration |
|
| X |
- DefinitionTwo-character EDGAR code representing the state or country of incorporation.
| Name: |
dei_EntityIncorporationStateCountryCode |
| Namespace Prefix: |
dei_ |
| Data Type: |
dei:edgarStateCountryItemType |
| Balance Type: |
na |
| Period Type: |
duration |
|
| X |
- DefinitionBoolean flag that is true when the registrant has submitted electronically every Interactive Data File required to be submitted pursuant to Rule 405 of Regulation S-T during the preceding 12 months (or for such shorter period that the registrant was required to submit such files). Reference 1: http://www.xbrl.org/2003/role/presentationRef
-Publisher SEC
-Name Regulation S-T
-Number 232
-Section 405
| Name: |
dei_EntityInteractiveDataCurrent |
| Namespace Prefix: |
dei_ |
| Data Type: |
dei:yesNoItemType |
| Balance Type: |
na |
| Period Type: |
duration |
|
| X |
- DefinitionThe aggregate market value of the voting and non-voting common equity held by non-affiliates computed by reference to the price at which the common equity was last sold, or the average bid and asked price of such common equity, as of the last business day of the registrant's most recently completed second fiscal quarter.
| Name: |
dei_EntityPublicFloat |
| Namespace Prefix: |
dei_ |
| Data Type: |
xbrli:monetaryItemType |
| Balance Type: |
credit |
| Period Type: |
instant |
|
| X |
- DefinitionThe exact name of the entity filing the report as specified in its charter, which is required by forms filed with the SEC. Reference 1: http://www.xbrl.org/2003/role/presentationRef
-Publisher SEC
-Name Exchange Act
-Number 240
-Section 12
-Subsection b-2
| Name: |
dei_EntityRegistrantName |
| Namespace Prefix: |
dei_ |
| Data Type: |
xbrli:normalizedStringItemType |
| Balance Type: |
na |
| Period Type: |
duration |
|
| X |
- DefinitionBoolean flag that is true when the registrant is a shell company as defined in Rule 12b-2 of the Exchange Act. Reference 1: http://www.xbrl.org/2003/role/presentationRef
-Publisher SEC
-Name Exchange Act
-Number 240
-Section 12
-Subsection b-2
| Name: |
dei_EntityShellCompany |
| Namespace Prefix: |
dei_ |
| Data Type: |
xbrli:booleanItemType |
| Balance Type: |
na |
| Period Type: |
duration |
|
| X |
- DefinitionIndicates that the company is a Smaller Reporting Company (SRC). Reference 1: http://www.xbrl.org/2003/role/presentationRef
-Publisher SEC
-Name Exchange Act
-Number 240
-Section 12
-Subsection b-2
| Name: |
dei_EntitySmallBusiness |
| Namespace Prefix: |
dei_ |
| Data Type: |
xbrli:booleanItemType |
| Balance Type: |
na |
| Period Type: |
duration |
|
| X |
- DefinitionThe Tax Identification Number (TIN), also known as an Employer Identification Number (EIN), is a unique 9-digit value assigned by the IRS. Reference 1: http://www.xbrl.org/2003/role/presentationRef
-Publisher SEC
-Name Exchange Act
-Number 240
-Section 12
-Subsection b-2
| Name: |
dei_EntityTaxIdentificationNumber |
| Namespace Prefix: |
dei_ |
| Data Type: |
dei:employerIdItemType |
| Balance Type: |
na |
| Period Type: |
duration |
|
| X |
- DefinitionIndicate 'Yes' or 'No' if the registrant is not required to file reports pursuant to Section 13 or Section 15(d) of the Act.
| Name: |
dei_EntityVoluntaryFilers |
| Namespace Prefix: |
dei_ |
| Data Type: |
dei:yesNoItemType |
| Balance Type: |
na |
| Period Type: |
duration |
|
| X |
- DefinitionIndicate 'Yes' or 'No' if the registrant is a well-known seasoned issuer, as defined in Rule 405 of the Securities Act. Is used on Form Type: 10-K, 10-Q, 8-K, 20-F, 6-K, 10-K/A, 10-Q/A, 20-F/A, 6-K/A, N-CSR, N-Q, N-1A. Reference 1: http://www.xbrl.org/2003/role/presentationRef
-Publisher SEC
-Name Securities Act
-Number 230
-Section 405
| Name: |
dei_EntityWellKnownSeasonedIssuer |
| Namespace Prefix: |
dei_ |
| Data Type: |
dei:yesNoItemType |
| Balance Type: |
na |
| Period Type: |
duration |
|
| X |
- ReferencesReference 1: http://www.xbrl.org/2003/role/presentationRef
-Publisher SEC
-Name Form 10-K
-Number 249
-Section 310
Reference 2: http://www.xbrl.org/2003/role/presentationRef
-Publisher SEC
-Name Form 20-F
-Number 249
-Section 220
-Subsection f
Reference 3: http://www.xbrl.org/2003/role/presentationRef
-Publisher SEC
-Name Form 40-F
-Number 249
-Section 240
-Subsection f
| Name: |
dei_IcfrAuditorAttestationFlag |
| Namespace Prefix: |
dei_ |
| Data Type: |
xbrli:booleanItemType |
| Balance Type: |
na |
| Period Type: |
duration |
|
| X |
- DefinitionLocal phone number for entity.
| Name: |
dei_LocalPhoneNumber |
| Namespace Prefix: |
dei_ |
| Data Type: |
xbrli:normalizedStringItemType |
| Balance Type: |
na |
| Period Type: |
duration |
|
v3.23.2
Consolidated Balance Sheets - USD ($)
|
Dec. 31, 2022 |
Dec. 31, 2021 |
| CURRENT ASSETS |
|
|
| Cash |
$ 53,779
|
$ 275,383
|
| Trade receivables |
711,028
|
239,822
|
| Lease receivable |
3,627
|
87,020
|
| Inventories |
1,204,577
|
712,678
|
| Prepaid expenses and deposits |
189,884
|
385,323
|
| TOTAL CURRENT ASSETS |
2,162,895
|
1,700,226
|
| Lease receivable |
15,918
|
723,216
|
| Fixed assets, net |
25,546
|
35,314
|
| Equipment on lease, net |
29,561
|
141,880
|
| Intangible assets, net |
10,376
|
11,604
|
| TOTAL ASSETS |
2,244,296
|
2,612,240
|
| CURRENT LIABILITIES |
|
|
| Trade and other payables |
3,356,256
|
1,202,598
|
| Deferred revenue |
481,474
|
255,984
|
| Lease liability |
35,670
|
121,270
|
| Loans payable |
2,416,692
|
2,115,049
|
| Convertible notes payable |
2,719,514
|
319,488
|
| TOTAL CURRENT LIABILITIES |
9,009,606
|
4,014,389
|
| Lease liability |
4,982
|
38,696
|
| Loans payable |
150,000
|
212,898
|
| TOTAL LIABILITIES |
9,164,588
|
4,265,983
|
| MEZZANINE EQUITY |
|
|
| Redeemable preferred stock, $0.001 par value, 24,010,000 shares authorized (2021 – 24,010,000), 52,023 issued and outstanding, 860 to be issued (2021 – 50,804 issued and outstanding, 1,206 to be issued |
2,635,345
|
3,143,402
|
| STOCKHOLDERS’ DEFICIT |
|
|
| Preferred stock, $0.001 par value, 3,010,000 shares authorized (2021 – 3,010,000), 200,780 issued and outstanding (2021 - 200,454 issued and outstanding) |
3,087,180
|
1,199,480
|
| Common stock, $0.001 par value, 350,000,000 shares authorized, (2021 – 350,000,000); 145,429,993 issued and outstanding (2021 – 128,345,183 issued and outstanding) |
145,435
|
128,350
|
| Additional paid in capital, common stock |
50,916,150
|
50,068,418
|
| Discounts on common stock |
(69,838)
|
(69,838)
|
| Common stock to be issued |
|
19,647
|
| Obligation to issue warrants |
261,934
|
261,934
|
| Other accumulated comprehensive income |
1,345,588
|
1,289,559
|
| Accumulated deficit |
(65,242,086)
|
(57,694,695)
|
| TOTAL STOCKHOLDERS’ DEFICIT |
(9,555,637)
|
(4,797,145)
|
| TOTAL LIABILITIES MEZZANINE EQUITY AND STOCKHOLDERS’ DEFICIT |
$ 2,244,296
|
$ 2,612,240
|
| X |
- DefinitionCommon stockm to be issued.
| Name: |
DSGT_CommonStockToBeIssued |
| Namespace Prefix: |
DSGT_ |
| Data Type: |
xbrli:monetaryItemType |
| Balance Type: |
credit |
| Period Type: |
instant |
|
| X |
- DefinitionDiscounts on common stock.
| Name: |
DSGT_DiscountsOnCommonStock |
| Namespace Prefix: |
DSGT_ |
| Data Type: |
xbrli:monetaryItemType |
| Balance Type: |
credit |
| Period Type: |
instant |
|
| X |
- DefinitionLease receivable current.
| Name: |
DSGT_LeaseReceivableCurrent |
| Namespace Prefix: |
DSGT_ |
| Data Type: |
xbrli:monetaryItemType |
| Balance Type: |
debit |
| Period Type: |
instant |
|
| X |
- DefinitionLease receivable noncurrent.
| Name: |
DSGT_LeaseReceivableNoncurrent |
| Namespace Prefix: |
DSGT_ |
| Data Type: |
xbrli:monetaryItemType |
| Balance Type: |
debit |
| Period Type: |
instant |
|
| X |
- DefinitionObligation to issue warrants.
| Name: |
DSGT_ObligationToIssueWarrants |
| Namespace Prefix: |
DSGT_ |
| Data Type: |
xbrli:monetaryItemType |
| Balance Type: |
credit |
| Period Type: |
instant |
|
| X |
- DefinitionSum of the carrying values as of the balance sheet date of obligations incurred through that date and due within one year (or the operating cycle, if longer), including liabilities incurred (and for which invoices have typically been received) and payable to vendors for goods and services received, taxes, interest, rent and utilities, accrued salaries and bonuses, payroll taxes and fringe benefits. Reference 1: http://fasb.org/us-gaap/role/ref/legacyRef
-Publisher FASB
-Name Accounting Standards Codification
-Topic 210
-SubTopic 10
-Section S99
-Paragraph 1
-Subparagraph (SX 210.5-02.19,20)
-URI https://asc.fasb.org/extlink&oid=120391452&loc=d3e13212-122682
| Name: |
us-gaap_AccountsPayableAndAccruedLiabilitiesCurrent |
| Namespace Prefix: |
us-gaap_ |
| Data Type: |
xbrli:monetaryItemType |
| Balance Type: |
credit |
| Period Type: |
instant |
|
| X |
- DefinitionAmount, after allowance for credit loss, of right to consideration from customer for product sold and service rendered in normal course of business, classified as current. Reference 1: http://www.xbrl.org/2003/role/disclosureRef
-Publisher FASB
-Name Accounting Standards Codification
-Topic 310
-SubTopic 10
-Section 45
-Paragraph 2
-URI https://asc.fasb.org/extlink&oid=124259787&loc=d3e4428-111522
Reference 2: http://www.xbrl.org/2003/role/disclosureRef
-Publisher FASB
-Name Accounting Standards Codification
-Topic 310
-SubTopic 10
-Section 45
-Paragraph 9
-URI https://asc.fasb.org/extlink&oid=124259787&loc=d3e4531-111522
| Name: |
us-gaap_AccountsReceivableNetCurrent |
| Namespace Prefix: |
us-gaap_ |
| Data Type: |
xbrli:monetaryItemType |
| Balance Type: |
debit |
| Period Type: |
instant |
|
| X |
- DefinitionAccumulated change in equity from transactions and other events and circumstances from non-owner sources, net of tax effect, at period end. Excludes Net Income (Loss), and accumulated changes in equity from transactions resulting from investments by owners and distributions to owners. Includes foreign currency translation items, certain pension adjustments, unrealized gains and losses on certain investments in debt and equity securities, other than temporary impairment (OTTI) losses related to factors other than credit losses on available-for-sale and held-to-maturity debt securities that an entity does not intend to sell and it is not more likely than not that the entity will be required to sell before recovery of the amortized cost basis, as well as changes in the fair value of derivatives related to the effective portion of a designated cash flow hedge. Reference 1: http://www.xbrl.org/2003/role/disclosureRef
-Publisher FASB
-Name Accounting Standards Codification
-Topic 210
-SubTopic 10
-Section S99
-Paragraph 1
-Subparagraph (SX 210.5-02(30)(a)(4))
-URI https://asc.fasb.org/extlink&oid=120391452&loc=d3e13212-122682
Reference 2: http://fasb.org/us-gaap/role/ref/legacyRef
-Publisher FASB
-Name Accounting Standards Codification
-Topic 220
-SubTopic 10
-Section 45
-Paragraph 11
-URI https://asc.fasb.org/extlink&oid=126968391&loc=d3e637-108580
Reference 3: http://www.xbrl.org/2003/role/disclosureRef
-Publisher FASB
-Name Accounting Standards Codification
-Topic 944
-SubTopic 210
-Section S99
-Paragraph 1
-Subparagraph (SX 210.7-03(a)(23)(a)(3))
-URI https://asc.fasb.org/extlink&oid=126734703&loc=d3e572229-122910
Reference 4: http://fasb.org/us-gaap/role/ref/legacyRef
-Publisher FASB
-Name Accounting Standards Codification
-Topic 220
-SubTopic 10
-Section 45
-Paragraph 14A
-URI https://asc.fasb.org/extlink&oid=126968391&loc=SL7669686-108580
Reference 5: http://www.xbrl.org/2003/role/disclosureRef
-Publisher FASB
-Name Accounting Standards Codification
-Topic 944
-SubTopic 40
-Section 65
-Paragraph 2
-Subparagraph (h)(2)
-URI https://asc.fasb.org/extlink&oid=124501264&loc=SL117420844-207641
Reference 6: http://www.xbrl.org/2003/role/disclosureRef
-Publisher FASB
-Name Accounting Standards Codification
-Topic 944
-SubTopic 40
-Section 65
-Paragraph 2
-Subparagraph (g)(2)(ii)
-URI https://asc.fasb.org/extlink&oid=124501264&loc=SL117420844-207641
Reference 7: http://fasb.org/us-gaap/role/ref/legacyRef
-Publisher FASB
-Name Accounting Standards Codification
-Topic 220
-SubTopic 10
-Section 45
-Paragraph 14
-URI https://asc.fasb.org/extlink&oid=126968391&loc=d3e681-108580
| Name: |
us-gaap_AccumulatedOtherComprehensiveIncomeLossNetOfTax |
| Namespace Prefix: |
us-gaap_ |
| Data Type: |
xbrli:monetaryItemType |
| Balance Type: |
credit |
| Period Type: |
instant |
|
| X |
- DefinitionValue received from shareholders in common stock-related transactions that are in excess of par value or stated value and amounts received from other stock-related transactions. Includes only common stock transactions (excludes preferred stock transactions). May be called contributed capital, capital in excess of par, capital surplus, or paid-in capital. Reference 1: http://fasb.org/us-gaap/role/ref/legacyRef
-Publisher FASB
-Name Accounting Standards Codification
-Topic 210
-SubTopic 10
-Section S99
-Paragraph 1
-Subparagraph (SX 210.5-02(30)(a)(1))
-URI https://asc.fasb.org/extlink&oid=120391452&loc=d3e13212-122682
| Name: |
us-gaap_AdditionalPaidInCapitalCommonStock |
| Namespace Prefix: |
us-gaap_ |
| Data Type: |
xbrli:monetaryItemType |
| Balance Type: |
credit |
| Period Type: |
instant |
|
| X |
- DefinitionSum of the carrying amounts as of the balance sheet date of all assets that are recognized. Assets are probable future economic benefits obtained or controlled by an entity as a result of past transactions or events. Reference 1: http://fasb.org/us-gaap/role/ref/legacyRef
-Publisher FASB
-Name Accounting Standards Codification
-Topic 942
-SubTopic 210
-Section S99
-Paragraph 1
-Subparagraph (SX 210.9-03(11))
-URI https://asc.fasb.org/extlink&oid=126897435&loc=d3e534808-122878
Reference 2: http://www.xbrl.org/2003/role/exampleRef
-Publisher FASB
-Name Accounting Standards Codification
-Topic 852
-SubTopic 10
-Section 55
-Paragraph 10
-URI https://asc.fasb.org/extlink&oid=84165509&loc=d3e56426-112766
Reference 3: http://www.xbrl.org/2003/role/disclosureRef
-Publisher FASB
-Name Accounting Standards Codification
-Topic 470
-SubTopic 10
-Section S99
-Paragraph 1B
-Subparagraph (SX 210.13-02(a)(4)(iii)(A))
-URI https://asc.fasb.org/extlink&oid=126975872&loc=SL124442552-122756
Reference 4: http://www.xbrl.org/2003/role/disclosureRef
-Publisher FASB
-Name Accounting Standards Codification
-Topic 280
-SubTopic 10
-Section 50
-Paragraph 22
-URI https://asc.fasb.org/extlink&oid=126901519&loc=d3e8736-108599
Reference 5: http://www.xbrl.org/2003/role/disclosureRef
-Publisher FASB
-Name Accounting Standards Codification
-Topic 470
-SubTopic 10
-Section S99
-Paragraph 1A
-Subparagraph (SX 210.13-01(a)(4)(iv))
-URI https://asc.fasb.org/extlink&oid=126975872&loc=SL124442526-122756
Reference 6: http://fasb.org/us-gaap/role/ref/legacyRef
-Publisher FASB
-Name Accounting Standards Codification
-Topic 944
-SubTopic 210
-Section S99
-Paragraph 1
-Subparagraph (SX 210.7-03(a)(12))
-URI https://asc.fasb.org/extlink&oid=126734703&loc=d3e572229-122910
Reference 7: http://www.xbrl.org/2009/role/commonPracticeRef
-Publisher FASB
-Name Accounting Standards Codification
-Topic 852
-SubTopic 10
-Section 50
-Paragraph 7
-Subparagraph (a)
-URI https://asc.fasb.org/extlink&oid=124433192&loc=SL2890621-112765
Reference 8: http://www.xbrl.org/2003/role/disclosureRef
-Publisher FASB
-Name Accounting Standards Codification
-Topic 470
-SubTopic 10
-Section S99
-Paragraph 1B
-Subparagraph (SX 210.13-02(a)(4)(i))
-URI https://asc.fasb.org/extlink&oid=126975872&loc=SL124442552-122756
Reference 9: http://www.xbrl.org/2009/role/commonPracticeRef
-Publisher FASB
-Name Accounting Standards Codification
-Topic 470
-SubTopic 10
-Section S99
-Paragraph 1A
-Subparagraph (SX 210.13-01(a)(4)(ii))
-URI https://asc.fasb.org/extlink&oid=126975872&loc=SL124442526-122756
Reference 10: http://www.xbrl.org/2003/role/disclosureRef
-Publisher FASB
-Name Accounting Standards Codification
-Topic 470
-SubTopic 10
-Section S99
-Paragraph 1A
-Subparagraph (SX 210.13-01(a)(5))
-URI https://asc.fasb.org/extlink&oid=126975872&loc=SL124442526-122756
Reference 11: http://www.xbrl.org/2003/role/disclosureRef
-Publisher FASB
-Name Accounting Standards Codification
-Topic 470
-SubTopic 10
-Section S99
-Paragraph 1A
-Subparagraph (SX 210.13-01(a)(4)(iii)(A))
-URI https://asc.fasb.org/extlink&oid=126975872&loc=SL124442526-122756
Reference 12: http://www.xbrl.org/2003/role/disclosureRef
-Publisher FASB
-Name Accounting Standards Codification
-Topic 470
-SubTopic 10
-Section S99
-Paragraph 1A
-Subparagraph (SX 210.13-01(a)(4)(i))
-URI https://asc.fasb.org/extlink&oid=126975872&loc=SL124442526-122756
Reference 13: http://www.xbrl.org/2003/role/disclosureRef
-Publisher FASB
-Name Accounting Standards Codification
-Topic 235
-SubTopic 10
-Section S99
-Paragraph 1
-Subparagraph (SX 210.4-08(g)(1)(ii))
-URI https://asc.fasb.org/extlink&oid=120395691&loc=d3e23780-122690
Reference 14: http://www.xbrl.org/2009/role/commonPracticeRef
-Publisher FASB
-Name Accounting Standards Codification
-Topic 470
-SubTopic 10
-Section S99
-Paragraph 1A
-Subparagraph (SX 210.13-01(a)(4)(iii))
-URI https://asc.fasb.org/extlink&oid=126975872&loc=SL124442526-122756
Reference 15: http://www.xbrl.org/2003/role/disclosureRef
-Publisher FASB
-Name Accounting Standards Codification
-Topic 825
-SubTopic 10
-Section 50
-Paragraph 28
-Subparagraph (f)
-URI https://asc.fasb.org/extlink&oid=123596393&loc=d3e14064-108612
Reference 16: http://www.xbrl.org/2003/role/disclosureRef
-Publisher FASB
-Name Accounting Standards Codification
-Topic 470
-SubTopic 10
-Section S99
-Paragraph 1B
-Subparagraph (SX 210.13-02(a)(4)(iii)(B))
-URI https://asc.fasb.org/extlink&oid=126975872&loc=SL124442552-122756
Reference 17: http://www.xbrl.org/2003/role/disclosureRef
-Publisher FASB
-Name Accounting Standards Codification
-Topic 810
-SubTopic 10
-Section 50
-Paragraph 3
-Subparagraph (bb)
-URI https://asc.fasb.org/extlink&oid=123419778&loc=d3e5710-111685
Reference 18: http://www.xbrl.org/2003/role/disclosureRef
-Publisher FASB
-Name Accounting Standards Codification
-Topic 470
-SubTopic 10
-Section S99
-Paragraph 1B
-Subparagraph (SX 210.13-02(a)(5))
-URI https://asc.fasb.org/extlink&oid=126975872&loc=SL124442552-122756
Reference 19: http://www.xbrl.org/2003/role/disclosureRef
-Publisher FASB
-Name Accounting Standards Codification
-Topic 280
-SubTopic 10
-Section 50
-Paragraph 32
-Subparagraph (d)
-URI https://asc.fasb.org/extlink&oid=126901519&loc=d3e8933-108599
Reference 20: http://www.xbrl.org/2003/role/disclosureRef
-Publisher FASB
-Name Accounting Standards Codification
-Topic 810
-SubTopic 10
-Section 45
-Paragraph 25
-Subparagraph (a)
-URI https://asc.fasb.org/extlink&oid=116870748&loc=SL6758485-165988
Reference 21: http://www.xbrl.org/2003/role/disclosureRef
-Publisher FASB
-Name Accounting Standards Codification
-Topic 470
-SubTopic 10
-Section S99
-Paragraph 1B
-Subparagraph (SX 210.13-02(a)(4)(iv))
-URI https://asc.fasb.org/extlink&oid=126975872&loc=SL124442552-122756
Reference 22: http://www.xbrl.org/2003/role/disclosureRef
-Publisher FASB
-Name Accounting Standards Codification
-Topic 210
-SubTopic 10
-Section S99
-Paragraph 1
-Subparagraph (SX 210.5-02(18))
-URI https://asc.fasb.org/extlink&oid=120391452&loc=d3e13212-122682
Reference 23: http://www.xbrl.org/2003/role/disclosureRef
-Publisher FASB
-Name Accounting Standards Codification
-Topic 323
-SubTopic 10
-Section 50
-Paragraph 3
-Subparagraph (c)
-URI https://asc.fasb.org/extlink&oid=114001798&loc=d3e33918-111571
Reference 24: http://www.xbrl.org/2003/role/disclosureRef
-Publisher FASB
-Name Accounting Standards Codification
-Topic 280
-SubTopic 10
-Section 50
-Paragraph 30
-Subparagraph (c)
-URI https://asc.fasb.org/extlink&oid=126901519&loc=d3e8906-108599
| Name: |
us-gaap_Assets |
| Namespace Prefix: |
us-gaap_ |
| Data Type: |
xbrli:monetaryItemType |
| Balance Type: |
debit |
| Period Type: |
instant |
|
| X |
- DefinitionSum of the carrying amounts as of the balance sheet date of all assets that are expected to be realized in cash, sold, or consumed within one year (or the normal operating cycle, if longer). Assets are probable future economic benefits obtained or controlled by an entity as a result of past transactions or events. Reference 1: http://www.xbrl.org/2003/role/disclosureRef
-Publisher FASB
-Name Accounting Standards Codification
-Topic 210
-SubTopic 10
-Section 45
-Paragraph 1
-URI https://asc.fasb.org/extlink&oid=124098289&loc=d3e6676-107765
Reference 2: http://www.xbrl.org/2003/role/exampleRef
-Publisher FASB
-Name Accounting Standards Codification
-Topic 852
-SubTopic 10
-Section 55
-Paragraph 10
-URI https://asc.fasb.org/extlink&oid=84165509&loc=d3e56426-112766
Reference 3: http://www.xbrl.org/2009/role/commonPracticeRef
-Publisher FASB
-Name Accounting Standards Codification
-Topic 852
-SubTopic 10
-Section 50
-Paragraph 7
-Subparagraph (a)
-URI https://asc.fasb.org/extlink&oid=124433192&loc=SL2890621-112765
Reference 4: http://www.xbrl.org/2003/role/disclosureRef
-Publisher FASB
-Name Accounting Standards Codification
-Topic 470
-SubTopic 10
-Section S99
-Paragraph 1A
-Subparagraph (SX 210.13-01(a)(4)(i))
-URI https://asc.fasb.org/extlink&oid=126975872&loc=SL124442526-122756
Reference 5: http://www.xbrl.org/2003/role/disclosureRef
-Publisher FASB
-Name Accounting Standards Codification
-Topic 470
-SubTopic 10
-Section S99
-Paragraph 1B
-Subparagraph (SX 210.13-02(a)(4)(iii)(A))
-URI https://asc.fasb.org/extlink&oid=126975872&loc=SL124442552-122756
Reference 6: http://www.xbrl.org/2003/role/disclosureRef
-Publisher FASB
-Name Accounting Standards Codification
-Topic 470
-SubTopic 10
-Section S99
-Paragraph 1A
-Subparagraph (SX 210.13-01(a)(4)(iii)(A))
-URI https://asc.fasb.org/extlink&oid=126975872&loc=SL124442526-122756
Reference 7: http://www.xbrl.org/2009/role/commonPracticeRef
-Publisher FASB
-Name Accounting Standards Codification
-Topic 470
-SubTopic 10
-Section S99
-Paragraph 1A
-Subparagraph (SX 210.13-01(a)(4)(iii))
-URI https://asc.fasb.org/extlink&oid=126975872&loc=SL124442526-122756
Reference 8: http://www.xbrl.org/2003/role/disclosureRef
-Publisher FASB
-Name Accounting Standards Codification
-Topic 825
-SubTopic 10
-Section 50
-Paragraph 28
-Subparagraph (f)
-URI https://asc.fasb.org/extlink&oid=123596393&loc=d3e14064-108612
Reference 9: http://www.xbrl.org/2003/role/disclosureRef
-Publisher FASB
-Name Accounting Standards Codification
-Topic 470
-SubTopic 10
-Section S99
-Paragraph 1A
-Subparagraph (SX 210.13-01(a)(5))
-URI https://asc.fasb.org/extlink&oid=126975872&loc=SL124442526-122756
Reference 10: http://www.xbrl.org/2003/role/disclosureRef
-Publisher FASB
-Name Accounting Standards Codification
-Topic 470
-SubTopic 10
-Section S99
-Paragraph 1B
-Subparagraph (SX 210.13-02(a)(4)(iv))
-URI https://asc.fasb.org/extlink&oid=126975872&loc=SL124442552-122756
Reference 11: http://www.xbrl.org/2003/role/disclosureRef
-Publisher FASB
-Name Accounting Standards Codification
-Topic 810
-SubTopic 10
-Section 45
-Paragraph 25
-Subparagraph (a)
-URI https://asc.fasb.org/extlink&oid=116870748&loc=SL6758485-165988
Reference 12: http://www.xbrl.org/2003/role/disclosureRef
-Publisher FASB
-Name Accounting Standards Codification
-Topic 470
-SubTopic 10
-Section S99
-Paragraph 1B
-Subparagraph (SX 210.13-02(a)(4)(iii)(B))
-URI https://asc.fasb.org/extlink&oid=126975872&loc=SL124442552-122756
Reference 13: http://www.xbrl.org/2003/role/disclosureRef
-Publisher FASB
-Name Accounting Standards Codification
-Topic 323
-SubTopic 10
-Section 50
-Paragraph 3
-Subparagraph (c)
-URI https://asc.fasb.org/extlink&oid=114001798&loc=d3e33918-111571
Reference 14: http://www.xbrl.org/2009/role/commonPracticeRef
-Publisher FASB
-Name Accounting Standards Codification
-Topic 470
-SubTopic 10
-Section S99
-Paragraph 1A
-Subparagraph (SX 210.13-01(a)(4)(ii))
-URI https://asc.fasb.org/extlink&oid=126975872&loc=SL124442526-122756
Reference 15: http://www.xbrl.org/2003/role/disclosureRef
-Publisher FASB
-Name Accounting Standards Codification
-Topic 470
-SubTopic 10
-Section S99
-Paragraph 1B
-Subparagraph (SX 210.13-02(a)(5))
-URI https://asc.fasb.org/extlink&oid=126975872&loc=SL124442552-122756
Reference 16: http://www.xbrl.org/2003/role/disclosureRef
-Publisher FASB
-Name Accounting Standards Codification
-Topic 810
-SubTopic 10
-Section 50
-Paragraph 3
-Subparagraph (bb)
-URI https://asc.fasb.org/extlink&oid=123419778&loc=d3e5710-111685
Reference 17: http://www.xbrl.org/2003/role/disclosureRef
-Publisher FASB
-Name Accounting Standards Codification
-Topic 470
-SubTopic 10
-Section S99
-Paragraph 1A
-Subparagraph (SX 210.13-01(a)(4)(iv))
-URI https://asc.fasb.org/extlink&oid=126975872&loc=SL124442526-122756
Reference 18: http://www.xbrl.org/2003/role/disclosureRef
-Publisher FASB
-Name Accounting Standards Codification
-Topic 210
-SubTopic 10
-Section S99
-Paragraph 1
-Subparagraph (SX 210.5-02(9))
-URI https://asc.fasb.org/extlink&oid=120391452&loc=d3e13212-122682
Reference 19: http://www.xbrl.org/2003/role/disclosureRef
-Publisher FASB
-Name Accounting Standards Codification
-Topic 235
-SubTopic 10
-Section S99
-Paragraph 1
-Subparagraph (SX 210.4-08(g)(1)(ii))
-URI https://asc.fasb.org/extlink&oid=120395691&loc=d3e23780-122690
Reference 20: http://www.xbrl.org/2003/role/disclosureRef
-Publisher FASB
-Name Accounting Standards Codification
-Topic 470
-SubTopic 10
-Section S99
-Paragraph 1B
-Subparagraph (SX 210.13-02(a)(4)(i))
-URI https://asc.fasb.org/extlink&oid=126975872&loc=SL124442552-122756
| Name: |
us-gaap_AssetsCurrent |
| Namespace Prefix: |
us-gaap_ |
| Data Type: |
xbrli:monetaryItemType |
| Balance Type: |
debit |
| Period Type: |
instant |
|
| X |
- References
+ Details
| Name: |
us-gaap_AssetsCurrentAbstract |
| Namespace Prefix: |
us-gaap_ |
| Data Type: |
xbrli:stringItemType |
| Balance Type: |
na |
| Period Type: |
duration |
|
| X |
- DefinitionAmount of currency on hand as well as demand deposits with banks or financial institutions. Includes other kinds of accounts that have the general characteristics of demand deposits. Also includes short-term, highly liquid investments that are both readily convertible to known amounts of cash and so near their maturity that they present insignificant risk of changes in value because of changes in interest rates. Excludes cash and cash equivalents within disposal group and discontinued operation. Reference 1: http://fasb.org/us-gaap/role/ref/legacyRef
-Publisher FASB
-Name Accounting Standards Codification
-Topic 230
-SubTopic 10
-Section 45
-Paragraph 4
-URI https://asc.fasb.org/extlink&oid=126954810&loc=d3e3044-108585
Reference 2: http://www.xbrl.org/2003/role/exampleRef
-Publisher FASB
-Name Accounting Standards Codification
-Topic 210
-SubTopic 10
-Section 45
-Paragraph 1
-Subparagraph (a)
-URI https://asc.fasb.org/extlink&oid=124098289&loc=d3e6676-107765
Reference 3: http://www.xbrl.org/2003/role/disclosureRef
-Publisher FASB
-Name Accounting Standards Codification
-Topic 210
-SubTopic 10
-Section S99
-Paragraph 1
-Subparagraph (SX 210.5-02(1))
-URI https://asc.fasb.org/extlink&oid=120391452&loc=d3e13212-122682
| Name: |
us-gaap_CashAndCashEquivalentsAtCarryingValue |
| Namespace Prefix: |
us-gaap_ |
| Data Type: |
xbrli:monetaryItemType |
| Balance Type: |
debit |
| Period Type: |
instant |
|
| X |
- DefinitionAggregate par or stated value of issued nonredeemable common stock (or common stock redeemable solely at the option of the issuer). This item includes treasury stock repurchased by the entity. Note: elements for number of nonredeemable common shares, par value and other disclosure concepts are in another section within stockholders' equity. Reference 1: http://www.xbrl.org/2003/role/exampleRef
-Publisher FASB
-Name Accounting Standards Codification
-Topic 852
-SubTopic 10
-Section 55
-Paragraph 10
-URI https://asc.fasb.org/extlink&oid=84165509&loc=d3e56426-112766
Reference 2: http://fasb.org/us-gaap/role/ref/legacyRef
-Publisher FASB
-Name Accounting Standards Codification
-Topic 210
-SubTopic 10
-Section S99
-Paragraph 1
-Subparagraph (SX 210.5-02(29))
-URI https://asc.fasb.org/extlink&oid=120391452&loc=d3e13212-122682
| Name: |
us-gaap_CommonStockValue |
| Namespace Prefix: |
us-gaap_ |
| Data Type: |
xbrli:monetaryItemType |
| Balance Type: |
credit |
| Period Type: |
instant |
|
| X |
- DefinitionThe portion of the carrying value of long-term convertible debt as of the balance sheet date that is scheduled to be repaid within one year or in the normal operating cycle if longer. Convertible debt is a financial instrument which can be exchanged for a specified amount of another security, typically the entity's common stock, at the option of the issuer or the holder. Reference 1: http://fasb.org/us-gaap/role/ref/legacyRef
-Publisher FASB
-Name Accounting Standards Codification
-Topic 210
-SubTopic 10
-Section S99
-Paragraph 1
-Subparagraph (SX 210.5-02(19))
-URI https://asc.fasb.org/extlink&oid=120391452&loc=d3e13212-122682
| Name: |
us-gaap_ConvertibleDebtCurrent |
| Namespace Prefix: |
us-gaap_ |
| Data Type: |
xbrli:monetaryItemType |
| Balance Type: |
credit |
| Period Type: |
instant |
|
| X |
- DefinitionAmount of deferred income and obligation to transfer product and service to customer for which consideration has been received or is receivable, classified as current. Reference 1: http://www.xbrl.org/2009/role/commonPracticeRef
-Publisher FASB
-Name Accounting Standards Codification
-Topic 210
-SubTopic 10
-Section S99
-Paragraph 1
-Subparagraph (SX 210.5-02(20))
-URI https://asc.fasb.org/extlink&oid=120391452&loc=d3e13212-122682
| Name: |
us-gaap_DeferredRevenueCurrent |
| Namespace Prefix: |
us-gaap_ |
| Data Type: |
xbrli:monetaryItemType |
| Balance Type: |
credit |
| Period Type: |
instant |
|
| X |
- DefinitionSum of the carrying amounts of all intangible assets, excluding goodwill, as of the balance sheet date, net of accumulated amortization and impairment charges. Reference 1: http://fasb.org/us-gaap/role/ref/legacyRef
-Publisher FASB
-Name Accounting Standards Codification
-Topic 350
-SubTopic 30
-Section 50
-Paragraph 2
-Subparagraph ((a)(1),(b))
-URI https://asc.fasb.org/extlink&oid=66006027&loc=d3e16323-109275
Reference 2: http://fasb.org/us-gaap/role/ref/legacyRef
-Publisher FASB
-Name Accounting Standards Codification
-Topic 350
-SubTopic 30
-Section 45
-Paragraph 1
-URI https://asc.fasb.org/extlink&oid=6388964&loc=d3e16212-109274
| Name: |
us-gaap_IntangibleAssetsNetExcludingGoodwill |
| Namespace Prefix: |
us-gaap_ |
| Data Type: |
xbrli:monetaryItemType |
| Balance Type: |
debit |
| Period Type: |
instant |
|
| X |
- DefinitionAmount after valuation and LIFO reserves of inventory expected to be sold, or consumed within one year or operating cycle, if longer. Reference 1: http://www.xbrl.org/2003/role/disclosureRef
-Publisher FASB
-Name Accounting Standards Codification
-Topic 210
-SubTopic 10
-Section S99
-Paragraph 1
-Subparagraph (SX 210.5-02(6))
-URI https://asc.fasb.org/extlink&oid=120391452&loc=d3e13212-122682
Reference 2: http://www.xbrl.org/2003/role/exampleRef
-Publisher FASB
-Name Accounting Standards Codification
-Topic 210
-SubTopic 10
-Section 45
-Paragraph 1
-Subparagraph (b)
-URI https://asc.fasb.org/extlink&oid=124098289&loc=d3e6676-107765
Reference 3: http://www.xbrl.org/2003/role/exampleRef
-Publisher FASB
-Name Accounting Standards Codification
-Topic 852
-SubTopic 10
-Section 55
-Paragraph 10
-URI https://asc.fasb.org/extlink&oid=84165509&loc=d3e56426-112766
| Name: |
us-gaap_InventoryNet |
| Namespace Prefix: |
us-gaap_ |
| Data Type: |
xbrli:monetaryItemType |
| Balance Type: |
debit |
| Period Type: |
instant |
|
| X |
- DefinitionSum of the carrying amounts as of the balance sheet date of all liabilities that are recognized. Liabilities are probable future sacrifices of economic benefits arising from present obligations of an entity to transfer assets or provide services to other entities in the future. Reference 1: http://fasb.org/us-gaap/role/ref/legacyRef
-Publisher FASB
-Name Accounting Standards Codification
-Topic 210
-SubTopic 10
-Section S99
-Paragraph 1
-Subparagraph (SX 210.5-02.19-26)
-URI https://asc.fasb.org/extlink&oid=120391452&loc=d3e13212-122682
Reference 2: http://www.xbrl.org/2009/role/commonPracticeRef
-Publisher FASB
-Name Accounting Standards Codification
-Topic 852
-SubTopic 10
-Section 50
-Paragraph 7
-Subparagraph (a)
-URI https://asc.fasb.org/extlink&oid=124433192&loc=SL2890621-112765
Reference 3: http://www.xbrl.org/2003/role/exampleRef
-Publisher FASB
-Name Accounting Standards Codification
-Topic 280
-SubTopic 10
-Section 50
-Paragraph 30
-Subparagraph (d)
-URI https://asc.fasb.org/extlink&oid=126901519&loc=d3e8906-108599
Reference 4: http://www.xbrl.org/2009/role/commonPracticeRef
-Publisher FASB
-Name Accounting Standards Codification
-Topic 852
-SubTopic 10
-Section 50
-Paragraph 7
-Subparagraph (b)
-URI https://asc.fasb.org/extlink&oid=124433192&loc=SL2890621-112765
Reference 5: http://www.xbrl.org/2003/role/disclosureRef
-Publisher FASB
-Name Accounting Standards Codification
-Topic 810
-SubTopic 10
-Section 45
-Paragraph 25
-Subparagraph (b)
-URI https://asc.fasb.org/extlink&oid=116870748&loc=SL6758485-165988
Reference 6: http://www.xbrl.org/2003/role/disclosureRef
-Publisher FASB
-Name Accounting Standards Codification
-Topic 470
-SubTopic 10
-Section S99
-Paragraph 1B
-Subparagraph (SX 210.13-02(a)(5))
-URI https://asc.fasb.org/extlink&oid=126975872&loc=SL124442552-122756
Reference 7: http://www.xbrl.org/2003/role/disclosureRef
-Publisher FASB
-Name Accounting Standards Codification
-Topic 825
-SubTopic 10
-Section 50
-Paragraph 28
-Subparagraph (f)
-URI https://asc.fasb.org/extlink&oid=123596393&loc=d3e14064-108612
Reference 8: http://www.xbrl.org/2003/role/disclosureRef
-Publisher FASB
-Name Accounting Standards Codification
-Topic 470
-SubTopic 10
-Section S99
-Paragraph 1B
-Subparagraph (SX 210.13-02(a)(4)(iv))
-URI https://asc.fasb.org/extlink&oid=126975872&loc=SL124442552-122756
Reference 9: http://www.xbrl.org/2003/role/disclosureRef
-Publisher FASB
-Name Accounting Standards Codification
-Topic 810
-SubTopic 10
-Section 50
-Paragraph 3
-Subparagraph (bb)
-URI https://asc.fasb.org/extlink&oid=123419778&loc=d3e5710-111685
Reference 10: http://www.xbrl.org/2003/role/disclosureRef
-Publisher FASB
-Name Accounting Standards Codification
-Topic 470
-SubTopic 10
-Section S99
-Paragraph 1B
-Subparagraph (SX 210.13-02(a)(4)(iii)(B))
-URI https://asc.fasb.org/extlink&oid=126975872&loc=SL124442552-122756
Reference 11: http://www.xbrl.org/2003/role/disclosureRef
-Publisher FASB
-Name Accounting Standards Codification
-Topic 470
-SubTopic 10
-Section S99
-Paragraph 1A
-Subparagraph (SX 210.13-01(a)(4)(iv))
-URI https://asc.fasb.org/extlink&oid=126975872&loc=SL124442526-122756
Reference 12: http://www.xbrl.org/2003/role/disclosureRef
-Publisher FASB
-Name Accounting Standards Codification
-Topic 810
-SubTopic 10
-Section 50
-Paragraph 3
-Subparagraph (c)
-URI https://asc.fasb.org/extlink&oid=123419778&loc=d3e5710-111685
Reference 13: http://www.xbrl.org/2003/role/disclosureRef
-Publisher FASB
-Name Accounting Standards Codification
-Topic 323
-SubTopic 10
-Section 50
-Paragraph 3
-Subparagraph (c)
-URI https://asc.fasb.org/extlink&oid=114001798&loc=d3e33918-111571
Reference 14: http://www.xbrl.org/2003/role/disclosureRef
-Publisher FASB
-Name Accounting Standards Codification
-Topic 470
-SubTopic 10
-Section S99
-Paragraph 1A
-Subparagraph (SX 210.13-01(a)(5))
-URI https://asc.fasb.org/extlink&oid=126975872&loc=SL124442526-122756
Reference 15: http://www.xbrl.org/2003/role/disclosureRef
-Publisher FASB
-Name Accounting Standards Codification
-Topic 470
-SubTopic 10
-Section S99
-Paragraph 1A
-Subparagraph (SX 210.13-01(a)(4)(iii)(A))
-URI https://asc.fasb.org/extlink&oid=126975872&loc=SL124442526-122756
Reference 16: http://www.xbrl.org/2003/role/disclosureRef
-Publisher FASB
-Name Accounting Standards Codification
-Topic 470
-SubTopic 10
-Section S99
-Paragraph 1B
-Subparagraph (SX 210.13-02(a)(4)(i))
-URI https://asc.fasb.org/extlink&oid=126975872&loc=SL124442552-122756
Reference 17: http://www.xbrl.org/2003/role/disclosureRef
-Publisher FASB
-Name Accounting Standards Codification
-Topic 470
-SubTopic 10
-Section S99
-Paragraph 1A
-Subparagraph (SX 210.13-01(a)(4)(i))
-URI https://asc.fasb.org/extlink&oid=126975872&loc=SL124442526-122756
Reference 18: http://www.xbrl.org/2003/role/disclosureRef
-Publisher FASB
-Name Accounting Standards Codification
-Topic 235
-SubTopic 10
-Section S99
-Paragraph 1
-Subparagraph (SX 210.4-08(g)(1)(ii))
-URI https://asc.fasb.org/extlink&oid=120395691&loc=d3e23780-122690
Reference 19: http://www.xbrl.org/2003/role/disclosureRef
-Publisher FASB
-Name Accounting Standards Codification
-Topic 470
-SubTopic 10
-Section S99
-Paragraph 1B
-Subparagraph (SX 210.13-02(a)(4)(iii)(A))
-URI https://asc.fasb.org/extlink&oid=126975872&loc=SL124442552-122756
Reference 20: http://www.xbrl.org/2009/role/commonPracticeRef
-Publisher FASB
-Name Accounting Standards Codification
-Topic 470
-SubTopic 10
-Section S99
-Paragraph 1A
-Subparagraph (SX 210.13-01(a)(4)(ii))
-URI https://asc.fasb.org/extlink&oid=126975872&loc=SL124442526-122756
| Name: |
us-gaap_Liabilities |
| Namespace Prefix: |
us-gaap_ |
| Data Type: |
xbrli:monetaryItemType |
| Balance Type: |
credit |
| Period Type: |
instant |
|
| X |
- DefinitionAmount of liabilities and equity items, including the portion of equity attributable to noncontrolling interests, if any. Reference 1: http://www.xbrl.org/2009/role/commonPracticeRef
-Publisher FASB
-Name Accounting Standards Codification
-Topic 323
-SubTopic 10
-Section 50
-Paragraph 3
-Subparagraph (c)
-URI https://asc.fasb.org/extlink&oid=114001798&loc=d3e33918-111571
Reference 2: http://www.xbrl.org/2003/role/exampleRef
-Publisher FASB
-Name Accounting Standards Codification
-Topic 852
-SubTopic 10
-Section 55
-Paragraph 10
-URI https://asc.fasb.org/extlink&oid=84165509&loc=d3e56426-112766
Reference 3: http://fasb.org/us-gaap/role/ref/legacyRef
-Publisher FASB
-Name Accounting Standards Codification
-Topic 942
-SubTopic 210
-Section S99
-Paragraph 1
-Subparagraph (SX 210.9-03(23))
-URI https://asc.fasb.org/extlink&oid=126897435&loc=d3e534808-122878
Reference 4: http://fasb.org/us-gaap/role/ref/legacyRef
-Publisher FASB
-Name Accounting Standards Codification
-Topic 944
-SubTopic 210
-Section S99
-Paragraph 1
-Subparagraph (SX 210.7-03(a)(25))
-URI https://asc.fasb.org/extlink&oid=126734703&loc=d3e572229-122910
Reference 5: http://www.xbrl.org/2009/role/commonPracticeRef
-Publisher FASB
-Name Accounting Standards Codification
-Topic 235
-SubTopic 10
-Section S99
-Paragraph 1
-Subparagraph (SX 210.4-08(g)(1)(ii))
-URI https://asc.fasb.org/extlink&oid=120395691&loc=d3e23780-122690
Reference 6: http://fasb.org/us-gaap/role/ref/legacyRef
-Publisher FASB
-Name Accounting Standards Codification
-Topic 210
-SubTopic 10
-Section S99
-Paragraph 1
-Subparagraph (SX 210.5-02(32))
-URI https://asc.fasb.org/extlink&oid=120391452&loc=d3e13212-122682
Reference 7: http://www.xbrl.org/2009/role/commonPracticeRef
-Publisher FASB
-Name Accounting Standards Codification
-Topic 825
-SubTopic 10
-Section 50
-Paragraph 28
-Subparagraph (f)
-URI https://asc.fasb.org/extlink&oid=123596393&loc=d3e14064-108612
| Name: |
us-gaap_LiabilitiesAndStockholdersEquity |
| Namespace Prefix: |
us-gaap_ |
| Data Type: |
xbrli:monetaryItemType |
| Balance Type: |
credit |
| Period Type: |
instant |
|
| X |
- DefinitionTotal obligations incurred as part of normal operations that are expected to be paid during the following twelve months or within one business cycle, if longer. Reference 1: http://www.xbrl.org/2003/role/exampleRef
-Publisher FASB
-Name Accounting Standards Codification
-Topic 852
-SubTopic 10
-Section 55
-Paragraph 10
-URI https://asc.fasb.org/extlink&oid=84165509&loc=d3e56426-112766
Reference 2: http://www.xbrl.org/2009/role/commonPracticeRef
-Publisher FASB
-Name Accounting Standards Codification
-Topic 852
-SubTopic 10
-Section 50
-Paragraph 7
-Subparagraph (a)
-URI https://asc.fasb.org/extlink&oid=124433192&loc=SL2890621-112765
Reference 3: http://www.xbrl.org/2003/role/disclosureRef
-Publisher FASB
-Name Accounting Standards Codification
-Topic 470
-SubTopic 10
-Section S99
-Paragraph 1B
-Subparagraph (SX 210.13-02(a)(4)(iii)(A))
-URI https://asc.fasb.org/extlink&oid=126975872&loc=SL124442552-122756
Reference 4: http://www.xbrl.org/2009/role/commonPracticeRef
-Publisher FASB
-Name Accounting Standards Codification
-Topic 852
-SubTopic 10
-Section 50
-Paragraph 7
-Subparagraph (b)
-URI https://asc.fasb.org/extlink&oid=124433192&loc=SL2890621-112765
Reference 5: http://www.xbrl.org/2003/role/disclosureRef
-Publisher FASB
-Name Accounting Standards Codification
-Topic 810
-SubTopic 10
-Section 45
-Paragraph 25
-Subparagraph (b)
-URI https://asc.fasb.org/extlink&oid=116870748&loc=SL6758485-165988
Reference 6: http://www.xbrl.org/2003/role/disclosureRef
-Publisher FASB
-Name Accounting Standards Codification
-Topic 235
-SubTopic 10
-Section S99
-Paragraph 1
-Subparagraph (SX 210.4-08(g)(1)(ii))
-URI https://asc.fasb.org/extlink&oid=120395691&loc=d3e23780-122690
Reference 7: http://www.xbrl.org/2009/role/commonPracticeRef
-Publisher FASB
-Name Accounting Standards Codification
-Topic 470
-SubTopic 10
-Section S99
-Paragraph 1A
-Subparagraph (SX 210.13-01(a)(4)(ii))
-URI https://asc.fasb.org/extlink&oid=126975872&loc=SL124442526-122756
Reference 8: http://www.xbrl.org/2003/role/disclosureRef
-Publisher FASB
-Name Accounting Standards Codification
-Topic 470
-SubTopic 10
-Section S99
-Paragraph 1B
-Subparagraph (SX 210.13-02(a)(4)(iv))
-URI https://asc.fasb.org/extlink&oid=126975872&loc=SL124442552-122756
Reference 9: http://www.xbrl.org/2003/role/disclosureRef
-Publisher FASB
-Name Accounting Standards Codification
-Topic 470
-SubTopic 10
-Section S99
-Paragraph 1B
-Subparagraph (SX 210.13-02(a)(4)(i))
-URI https://asc.fasb.org/extlink&oid=126975872&loc=SL124442552-122756
Reference 10: http://www.xbrl.org/2003/role/disclosureRef
-Publisher FASB
-Name Accounting Standards Codification
-Topic 810
-SubTopic 10
-Section 50
-Paragraph 3
-Subparagraph (c)
-URI https://asc.fasb.org/extlink&oid=123419778&loc=d3e5710-111685
Reference 11: http://www.xbrl.org/2003/role/disclosureRef
-Publisher FASB
-Name Accounting Standards Codification
-Topic 323
-SubTopic 10
-Section 50
-Paragraph 3
-Subparagraph (c)
-URI https://asc.fasb.org/extlink&oid=114001798&loc=d3e33918-111571
Reference 12: http://www.xbrl.org/2003/role/disclosureRef
-Publisher FASB
-Name Accounting Standards Codification
-Topic 470
-SubTopic 10
-Section S99
-Paragraph 1B
-Subparagraph (SX 210.13-02(a)(4)(iii)(B))
-URI https://asc.fasb.org/extlink&oid=126975872&loc=SL124442552-122756
Reference 13: http://www.xbrl.org/2003/role/disclosureRef
-Publisher FASB
-Name Accounting Standards Codification
-Topic 470
-SubTopic 10
-Section S99
-Paragraph 1A
-Subparagraph (SX 210.13-01(a)(5))
-URI https://asc.fasb.org/extlink&oid=126975872&loc=SL124442526-122756
Reference 14: http://www.xbrl.org/2003/role/disclosureRef
-Publisher FASB
-Name Accounting Standards Codification
-Topic 810
-SubTopic 10
-Section 50
-Paragraph 3
-Subparagraph (bb)
-URI https://asc.fasb.org/extlink&oid=123419778&loc=d3e5710-111685
Reference 15: http://www.xbrl.org/2003/role/disclosureRef
-Publisher FASB
-Name Accounting Standards Codification
-Topic 470
-SubTopic 10
-Section S99
-Paragraph 1B
-Subparagraph (SX 210.13-02(a)(5))
-URI https://asc.fasb.org/extlink&oid=126975872&loc=SL124442552-122756
Reference 16: http://www.xbrl.org/2003/role/disclosureRef
-Publisher FASB
-Name Accounting Standards Codification
-Topic 470
-SubTopic 10
-Section S99
-Paragraph 1A
-Subparagraph (SX 210.13-01(a)(4)(iii)(A))
-URI https://asc.fasb.org/extlink&oid=126975872&loc=SL124442526-122756
Reference 17: http://www.xbrl.org/2003/role/disclosureRef
-Publisher FASB
-Name Accounting Standards Codification
-Topic 470
-SubTopic 10
-Section S99
-Paragraph 1A
-Subparagraph (SX 210.13-01(a)(4)(i))
-URI https://asc.fasb.org/extlink&oid=126975872&loc=SL124442526-122756
Reference 18: http://www.xbrl.org/2003/role/disclosureRef
-Publisher FASB
-Name Accounting Standards Codification
-Topic 470
-SubTopic 10
-Section S99
-Paragraph 1A
-Subparagraph (SX 210.13-01(a)(4)(iv))
-URI https://asc.fasb.org/extlink&oid=126975872&loc=SL124442526-122756
Reference 19: http://www.xbrl.org/2003/role/disclosureRef
-Publisher FASB
-Name Accounting Standards Codification
-Topic 825
-SubTopic 10
-Section 50
-Paragraph 28
-Subparagraph (f)
-URI https://asc.fasb.org/extlink&oid=123596393&loc=d3e14064-108612
Reference 20: http://www.xbrl.org/2003/role/disclosureRef
-Publisher FASB
-Name Accounting Standards Codification
-Topic 210
-SubTopic 10
-Section 45
-Paragraph 5
-URI https://asc.fasb.org/extlink&oid=124098289&loc=d3e6904-107765
Reference 21: http://fasb.org/us-gaap/role/ref/legacyRef
-Publisher FASB
-Name Accounting Standards Codification
-Topic 210
-SubTopic 10
-Section S99
-Paragraph 1
-Subparagraph (SX 210.5-02.21)
-URI https://asc.fasb.org/extlink&oid=120391452&loc=d3e13212-122682
| Name: |
us-gaap_LiabilitiesCurrent |
| Namespace Prefix: |
us-gaap_ |
| Data Type: |
xbrli:monetaryItemType |
| Balance Type: |
credit |
| Period Type: |
instant |
|
| X |
- References
+ Details
| Name: |
us-gaap_LiabilitiesCurrentAbstract |
| Namespace Prefix: |
us-gaap_ |
| Data Type: |
xbrli:stringItemType |
| Balance Type: |
na |
| Period Type: |
duration |
|
| X |
- DefinitionCarrying value as of the balance sheet date of portion of long-term loans payable due within one year or the operating cycle if longer. Reference 1: http://fasb.org/us-gaap/role/ref/legacyRef
-Publisher FASB
-Name Accounting Standards Codification
-Topic 210
-SubTopic 10
-Section S99
-Paragraph 1
-Subparagraph (SX 210.5-02.20)
-URI https://asc.fasb.org/extlink&oid=120391452&loc=d3e13212-122682
| Name: |
us-gaap_LoansPayableCurrent |
| Namespace Prefix: |
us-gaap_ |
| Data Type: |
xbrli:monetaryItemType |
| Balance Type: |
credit |
| Period Type: |
instant |
|
| X |
- DefinitionCarrying value as of the balance sheet date of loans payable (with maturities initially due after one year or beyond the operating cycle if longer), excluding current portion. Reference 1: http://fasb.org/us-gaap/role/ref/legacyRef
-Publisher FASB
-Name Accounting Standards Codification
-Topic 210
-SubTopic 10
-Section S99
-Paragraph 1
-Subparagraph (SX 210.5-02.22)
-URI https://asc.fasb.org/extlink&oid=120391452&loc=d3e13212-122682
| Name: |
us-gaap_LongTermLoansPayable |
| Namespace Prefix: |
us-gaap_ |
| Data Type: |
xbrli:monetaryItemType |
| Balance Type: |
credit |
| Period Type: |
instant |
|
| X |
- DefinitionPresent value of lessee's discounted obligation for lease payments from operating lease, classified as current. Reference 1: http://www.xbrl.org/2003/role/disclosureRef
-Publisher FASB
-Name Accounting Standards Codification
-Topic 842
-SubTopic 20
-Section 45
-Paragraph 1
-Subparagraph (b)
-URI https://asc.fasb.org/extlink&oid=123391704&loc=SL77918627-209977
| Name: |
us-gaap_OperatingLeaseLiabilityCurrent |
| Namespace Prefix: |
us-gaap_ |
| Data Type: |
xbrli:monetaryItemType |
| Balance Type: |
credit |
| Period Type: |
instant |
|
| X |
- DefinitionPresent value of lessee's discounted obligation for lease payments from operating lease, classified as noncurrent. Reference 1: http://www.xbrl.org/2003/role/disclosureRef
-Publisher FASB
-Name Accounting Standards Codification
-Topic 842
-SubTopic 20
-Section 45
-Paragraph 1
-Subparagraph (b)
-URI https://asc.fasb.org/extlink&oid=123391704&loc=SL77918627-209977
| Name: |
us-gaap_OperatingLeaseLiabilityNoncurrent |
| Namespace Prefix: |
us-gaap_ |
| Data Type: |
xbrli:monetaryItemType |
| Balance Type: |
credit |
| Period Type: |
instant |
|
| X |
- DefinitionAmount of lessee's right to use underlying asset under operating lease. Reference 1: http://www.xbrl.org/2003/role/disclosureRef
-Publisher FASB
-Name Accounting Standards Codification
-Topic 842
-SubTopic 20
-Section 45
-Paragraph 1
-Subparagraph (a)
-URI https://asc.fasb.org/extlink&oid=123391704&loc=SL77918627-209977
| Name: |
us-gaap_OperatingLeaseRightOfUseAsset |
| Namespace Prefix: |
us-gaap_ |
| Data Type: |
xbrli:monetaryItemType |
| Balance Type: |
debit |
| Period Type: |
instant |
|
| X |
- DefinitionAggregate par or stated value of issued nonredeemable preferred stock (or preferred stock redeemable solely at the option of the issuer). This item includes treasury stock repurchased by the entity. Note: elements for number of nonredeemable preferred shares, par value and other disclosure concepts are in another section within stockholders' equity. Reference 1: http://fasb.org/us-gaap/role/ref/legacyRef
-Publisher FASB
-Name Accounting Standards Codification
-Topic 210
-SubTopic 10
-Section S99
-Paragraph 1
-Subparagraph (SX 210.5-02(28))
-URI https://asc.fasb.org/extlink&oid=120391452&loc=d3e13212-122682
Reference 2: http://www.xbrl.org/2003/role/exampleRef
-Publisher FASB
-Name Accounting Standards Codification
-Topic 852
-SubTopic 10
-Section 55
-Paragraph 10
-URI https://asc.fasb.org/extlink&oid=84165509&loc=d3e56426-112766
| Name: |
us-gaap_PreferredStockValue |
| Namespace Prefix: |
us-gaap_ |
| Data Type: |
xbrli:monetaryItemType |
| Balance Type: |
credit |
| Period Type: |
instant |
|
| X |
- DefinitionAmount of asset related to consideration paid in advance for costs that provide economic benefits in future periods, and amount of other assets that are expected to be realized or consumed within one year or the normal operating cycle, if longer. Reference 1: http://www.xbrl.org/2009/role/commonPracticeRef
-Publisher FASB
-Name Accounting Standards Codification
-Topic 210
-SubTopic 10
-Section S99
-Paragraph 1
-Subparagraph (SX 210.5-02(9))
-URI https://asc.fasb.org/extlink&oid=120391452&loc=d3e13212-122682
| Name: |
us-gaap_PrepaidExpenseAndOtherAssetsCurrent |
| Namespace Prefix: |
us-gaap_ |
| Data Type: |
xbrli:monetaryItemType |
| Balance Type: |
debit |
| Period Type: |
instant |
|
| X |
- DefinitionAmount after accumulated depreciation, depletion and amortization of physical assets used in the normal conduct of business to produce goods and services and not intended for resale. Examples include, but are not limited to, land, buildings, machinery and equipment, office equipment, and furniture and fixtures. Reference 1: http://fasb.org/us-gaap/role/ref/legacyRef
-Publisher FASB
-Name Accounting Standards Codification
-Topic 360
-SubTopic 10
-Section 50
-Paragraph 1
-URI https://asc.fasb.org/extlink&oid=6391035&loc=d3e2868-110229
Reference 2: http://fasb.org/us-gaap/role/ref/legacyRef
-Publisher FASB
-Name Accounting Standards Codification
-Topic 944
-SubTopic 210
-Section S99
-Paragraph 1
-Subparagraph (SX 210.7-03(a)(8))
-URI https://asc.fasb.org/extlink&oid=126734703&loc=d3e572229-122910
Reference 3: http://www.xbrl.org/2003/role/disclosureRef
-Publisher FASB
-Name Accounting Standards Codification
-Topic 942
-SubTopic 360
-Section 50
-Paragraph 1
-URI https://asc.fasb.org/extlink&oid=124429447&loc=SL124453093-239630
Reference 4: http://www.xbrl.org/2003/role/exampleRef
-Publisher FASB
-Name Accounting Standards Codification
-Topic 852
-SubTopic 10
-Section 55
-Paragraph 10
-URI https://asc.fasb.org/extlink&oid=84165509&loc=d3e56426-112766
| Name: |
us-gaap_PropertyPlantAndEquipmentNet |
| Namespace Prefix: |
us-gaap_ |
| Data Type: |
xbrli:monetaryItemType |
| Balance Type: |
debit |
| Period Type: |
instant |
|
| X |
- DefinitionAs of the reporting date, the carrying amount of noncontrolling interests which are redeemable by the (parent) entity (1) at a fixed or determinable price on a fixed or determinable date, (2) at the option of the holder of the noncontrolling interest, or (3) upon occurrence of an event that is not solely within the control of the (parent) entity. The noncontrolling interest holder's ownership (or holders' ownership) may be in the form of preferred shares (regardless of class), preferred partnership units (regardless of class), preferential membership interests, or any other form of preferred equity regardless of investee entity legal form. Reference 1: http://fasb.org/us-gaap/role/ref/legacyRef
-Publisher FASB
-Name Accounting Standards Codification
-Topic 480
-SubTopic 10
-Section S99
-Paragraph 3A
-Subparagraph 14
-URI https://asc.fasb.org/extlink&oid=122040564&loc=SL6540498-122764
Reference 2: http://fasb.org/us-gaap/role/ref/legacyRef
-Publisher FASB
-Name Accounting Standards Codification
-Topic 480
-SubTopic 10
-Section S99
-Paragraph 3A
-Subparagraph (12)(c)
-URI https://asc.fasb.org/extlink&oid=122040564&loc=SL6540498-122764
Reference 3: http://fasb.org/us-gaap/role/ref/legacyRef
-Publisher FASB
-Name Accounting Standards Codification
-Topic 480
-SubTopic 10
-Section S99
-Paragraph 3A
-Subparagraph 15
-URI https://asc.fasb.org/extlink&oid=122040564&loc=SL6540498-122764
Reference 4: http://fasb.org/us-gaap/role/ref/legacyRef
-Publisher FASB
-Name Accounting Standards Codification
-Topic 480
-SubTopic 10
-Section S99
-Paragraph 3A
-Subparagraph (16)(c)
-URI https://asc.fasb.org/extlink&oid=122040564&loc=SL6540498-122764
| Name: |
us-gaap_RedeemableNoncontrollingInterestEquityPreferredCarryingAmount |
| Namespace Prefix: |
us-gaap_ |
| Data Type: |
xbrli:monetaryItemType |
| Balance Type: |
credit |
| Period Type: |
instant |
|
| X |
- DefinitionThe cumulative amount of the reporting entity's undistributed earnings or deficit. Reference 1: http://fasb.org/us-gaap/role/ref/legacyRef
-Publisher FASB
-Name Accounting Standards Codification
-Topic 210
-SubTopic 10
-Section S99
-Paragraph 1
-Subparagraph (SX 210.5-02(30)(a)(3))
-URI https://asc.fasb.org/extlink&oid=120391452&loc=d3e13212-122682
Reference 2: http://www.xbrl.org/2003/role/exampleRef
-Publisher FASB
-Name Accounting Standards Codification
-Topic 852
-SubTopic 10
-Section 55
-Paragraph 10
-URI https://asc.fasb.org/extlink&oid=84165509&loc=d3e56426-112766
Reference 3: http://fasb.org/us-gaap/role/ref/legacyRef
-Publisher FASB
-Name Accounting Standards Codification
-Topic 944
-SubTopic 210
-Section S99
-Paragraph 1
-Subparagraph (SX 210.7-03(a)(23)(a)(4))
-URI https://asc.fasb.org/extlink&oid=126734703&loc=d3e572229-122910
Reference 4: http://www.xbrl.org/2003/role/disclosureRef
-Publisher FASB
-Name Accounting Standards Codification
-Topic 944
-SubTopic 40
-Section 65
-Paragraph 2
-Subparagraph (h)(2)
-URI https://asc.fasb.org/extlink&oid=124501264&loc=SL117420844-207641
Reference 5: http://fasb.org/us-gaap/role/ref/legacyRef
-Publisher FASB
-Name Accounting Standards Codification
-Topic 505
-SubTopic 10
-Section S99
-Paragraph 1
-Subparagraph (SX 210.3-04)
-URI https://asc.fasb.org/extlink&oid=120397183&loc=d3e187085-122770
Reference 6: http://www.xbrl.org/2003/role/disclosureRef
-Publisher FASB
-Name Accounting Standards Codification
-Topic 944
-SubTopic 40
-Section 65
-Paragraph 2
-Subparagraph (g)(2)(i)
-URI https://asc.fasb.org/extlink&oid=124501264&loc=SL117420844-207641
| Name: |
us-gaap_RetainedEarningsAccumulatedDeficit |
| Namespace Prefix: |
us-gaap_ |
| Data Type: |
xbrli:monetaryItemType |
| Balance Type: |
credit |
| Period Type: |
instant |
|
| X |
- References
+ Details
| Name: |
us-gaap_StockholdersEquityAbstract |
| Namespace Prefix: |
us-gaap_ |
| Data Type: |
xbrli:stringItemType |
| Balance Type: |
na |
| Period Type: |
duration |
|
| X |
- DefinitionAmount of stockholders' equity (deficit), net of receivables from officers, directors, owners, and affiliates of the entity, attributable to both the parent and noncontrolling interests. Amount excludes temporary equity. Alternate caption for the concept is permanent equity. Reference 1: http://www.xbrl.org/2003/role/disclosureRef
-Publisher FASB
-Name Accounting Standards Codification
-Topic 250
-SubTopic 10
-Section 45
-Paragraph 24
-URI https://asc.fasb.org/extlink&oid=124436220&loc=d3e21930-107793
Reference 2: http://www.xbrl.org/2003/role/disclosureRef
-Publisher FASB
-Name Accounting Standards Codification
-Topic 505
-SubTopic 10
-Section S99
-Paragraph 1
-Subparagraph (SX 210.3-04)
-URI https://asc.fasb.org/extlink&oid=120397183&loc=d3e187085-122770
Reference 3: http://www.xbrl.org/2003/role/disclosureRef
-Publisher FASB
-Name Accounting Standards Codification
-Topic 250
-SubTopic 10
-Section 45
-Paragraph 23
-Subparagraph (b)
-URI https://asc.fasb.org/extlink&oid=124436220&loc=d3e21914-107793
Reference 4: http://www.xbrl.org/2003/role/disclosureRef
-Publisher FASB
-Name Accounting Standards Codification
-Topic 250
-SubTopic 10
-Section 50
-Paragraph 7
-Subparagraph (b)
-URI https://asc.fasb.org/extlink&oid=124431687&loc=d3e22644-107794
Reference 5: http://www.xbrl.org/2003/role/disclosureRef
-Publisher FASB
-Name Accounting Standards Codification
-Topic 220
-SubTopic 10
-Section 50
-Paragraph 5
-URI https://asc.fasb.org/extlink&oid=124431353&loc=SL124442411-227067
Reference 6: http://www.xbrl.org/2003/role/disclosureRef
-Publisher FASB
-Name Accounting Standards Codification
-Topic 326
-SubTopic 10
-Section 65
-Paragraph 4
-Subparagraph (d)
-URI https://asc.fasb.org/extlink&oid=122640432&loc=SL121648383-210437
Reference 7: http://www.xbrl.org/2003/role/disclosureRef
-Publisher FASB
-Name Accounting Standards Codification
-Topic 105
-SubTopic 10
-Section 65
-Paragraph 6
-Subparagraph (c)
-URI https://asc.fasb.org/extlink&oid=126987489&loc=SL124442142-165695
Reference 8: http://www.xbrl.org/2003/role/disclosureRef
-Publisher FASB
-Name Accounting Standards Codification
-Topic 105
-SubTopic 10
-Section 65
-Paragraph 6
-Subparagraph (d)
-URI https://asc.fasb.org/extlink&oid=126987489&loc=SL124442142-165695
Reference 9: http://fasb.org/us-gaap/role/ref/legacyRef
-Publisher FASB
-Name Accounting Standards Codification
-Topic 810
-SubTopic 10
-Section 45
-Paragraph 16
-URI https://asc.fasb.org/extlink&oid=126929396&loc=SL4568740-111683
Reference 10: http://www.xbrl.org/2003/role/disclosureRef
-Publisher FASB
-Name Accounting Standards Codification
-Topic 815
-SubTopic 40
-Section 65
-Paragraph 1
-Subparagraph (e)(3)
-URI https://asc.fasb.org/extlink&oid=126732423&loc=SL123482106-238011
Reference 11: http://www.xbrl.org/2009/role/commonPracticeRef
-Publisher FASB
-Name Accounting Standards Codification
-Topic 825
-SubTopic 10
-Section 50
-Paragraph 28
-Subparagraph (f)
-URI https://asc.fasb.org/extlink&oid=123596393&loc=d3e14064-108612
Reference 12: http://www.xbrl.org/2003/role/disclosureRef
-Publisher FASB
-Name Accounting Standards Codification
-Topic 250
-SubTopic 10
-Section 45
-Paragraph 5
-Subparagraph (b)
-URI https://asc.fasb.org/extlink&oid=124436220&loc=d3e21711-107793
Reference 13: http://www.xbrl.org/2009/role/commonPracticeRef
-Publisher FASB
-Name Accounting Standards Codification
-Topic 323
-SubTopic 10
-Section 50
-Paragraph 3
-Subparagraph (c)
-URI https://asc.fasb.org/extlink&oid=114001798&loc=d3e33918-111571
Reference 14: http://www.xbrl.org/2009/role/commonPracticeRef
-Publisher FASB
-Name Accounting Standards Codification
-Topic 235
-SubTopic 10
-Section S99
-Paragraph 1
-Subparagraph (SX 210.4-08(g)(1)(ii))
-URI https://asc.fasb.org/extlink&oid=120395691&loc=d3e23780-122690
Reference 15: http://www.xbrl.org/2003/role/disclosureRef
-Publisher FASB
-Name Accounting Standards Codification
-Topic 830
-SubTopic 30
-Section 50
-Paragraph 1
-URI https://asc.fasb.org/extlink&oid=6450520&loc=d3e32583-110901
Reference 16: http://www.xbrl.org/2003/role/disclosureRef
-Publisher FASB
-Name Accounting Standards Codification
-Topic 740
-SubTopic 10
-Section 65
-Paragraph 8
-Subparagraph (d)(2)
-URI https://asc.fasb.org/extlink&oid=126983759&loc=SL121830611-158277
Reference 17: http://www.xbrl.org/2003/role/disclosureRef
-Publisher FASB
-Name Accounting Standards Codification
-Topic 848
-SubTopic 10
-Section 65
-Paragraph 2
-Subparagraph (a)(3)(iii)(03)
-URI https://asc.fasb.org/extlink&oid=125980421&loc=SL125981372-237846
Reference 18: http://www.xbrl.org/2003/role/disclosureRef
-Publisher FASB
-Name Accounting Standards Codification
-Topic 830
-SubTopic 30
-Section 45
-Paragraph 17
-URI https://asc.fasb.org/extlink&oid=118261656&loc=d3e32136-110900
Reference 19: http://www.xbrl.org/2003/role/disclosureRef
-Publisher FASB
-Name Accounting Standards Codification
-Topic 740
-SubTopic 10
-Section 65
-Paragraph 8
-Subparagraph (d)(3)
-URI https://asc.fasb.org/extlink&oid=126983759&loc=SL121830611-158277
Reference 20: http://www.xbrl.org/2003/role/disclosureRef
-Publisher FASB
-Name Accounting Standards Codification
-Topic 944
-SubTopic 40
-Section 65
-Paragraph 2
-Subparagraph (f)(2)
-URI https://asc.fasb.org/extlink&oid=124501264&loc=SL117420844-207641
Reference 21: http://www.xbrl.org/2003/role/disclosureRef
-Publisher FASB
-Name Accounting Standards Codification
-Topic 718
-SubTopic 10
-Section 65
-Paragraph 15
-Subparagraph (f)(2)
-URI https://asc.fasb.org/extlink&oid=128097895&loc=SL121327923-165333
Reference 22: http://fasb.org/us-gaap/role/ref/legacyRef
-Publisher FASB
-Name Accounting Standards Codification
-Topic 810
-SubTopic 10
-Section 55
-Paragraph 4I
-URI https://asc.fasb.org/extlink&oid=120409616&loc=SL4590271-111686
Reference 23: http://www.xbrl.org/2003/role/disclosureRef
-Publisher FASB
-Name Accounting Standards Codification
-Topic 944
-SubTopic 40
-Section 65
-Paragraph 2
-Subparagraph (f)(1)
-URI https://asc.fasb.org/extlink&oid=124501264&loc=SL117420844-207641
Reference 24: http://www.xbrl.org/2003/role/disclosureRef
-Publisher FASB
-Name Accounting Standards Codification
-Topic 830
-SubTopic 30
-Section 45
-Paragraph 20
-Subparagraph (a)
-URI https://asc.fasb.org/extlink&oid=118261656&loc=d3e32211-110900
Reference 25: http://fasb.org/us-gaap/role/ref/legacyRef
-Publisher FASB
-Name Accounting Standards Codification
-Topic 810
-SubTopic 10
-Section 45
-Paragraph 15
-URI https://asc.fasb.org/extlink&oid=126929396&loc=SL4568447-111683
Reference 26: http://www.xbrl.org/2003/role/disclosureRef
-Publisher FASB
-Name Accounting Standards Codification
-Topic 718
-SubTopic 10
-Section 65
-Paragraph 15
-Subparagraph (f)(1)
-URI https://asc.fasb.org/extlink&oid=128097895&loc=SL121327923-165333
Reference 27: http://www.xbrl.org/2003/role/disclosureRef
-Publisher FASB
-Name Accounting Standards Codification
-Topic 250
-SubTopic 10
-Section 50
-Paragraph 1
-Subparagraph (b)(3)
-URI https://asc.fasb.org/extlink&oid=124431687&loc=d3e22499-107794
Reference 28: http://www.xbrl.org/2003/role/disclosureRef
-Publisher FASB
-Name Accounting Standards Codification
-Topic 718
-SubTopic 10
-Section 65
-Paragraph 15
-Subparagraph (e)
-URI https://asc.fasb.org/extlink&oid=128097895&loc=SL121327923-165333
| Name: |
us-gaap_StockholdersEquityIncludingPortionAttributableToNoncontrollingInterest |
| Namespace Prefix: |
us-gaap_ |
| Data Type: |
xbrli:monetaryItemType |
| Balance Type: |
credit |
| Period Type: |
instant |
|
| X |
- References
+ Details
| Name: |
us-gaap_TemporaryEquityAbstract |
| Namespace Prefix: |
us-gaap_ |
| Data Type: |
xbrli:stringItemType |
| Balance Type: |
na |
| Period Type: |
duration |
|
v3.23.2
Consolidated Balance Sheets (Parenthetical) - $ / shares
|
Dec. 31, 2022 |
Dec. 31, 2021 |
| Statement of Financial Position [Abstract] |
|
|
| Redeemable preferred stock, par value |
$ 0.001
|
$ 0.001
|
| Redeemable preferred stock, shares authorized |
24,010,000
|
24,010,000
|
| Redeemable preferred stock, shares issued |
52,023
|
50,804
|
| Redeemable preferred stock, shares outstanding |
52,023
|
50,804
|
| Redeemable preferred stock, shares to be issued |
860
|
1,206
|
| Preferred stock, par value |
$ 0.001
|
$ 0.001
|
| Preferred stock, shares authorized |
3,010,000
|
3,010,000
|
| Preferred stock, shares issued |
200,780
|
200,454
|
| Preferred stock, shares outstanding |
200,780
|
200,454
|
| Common stock, par value |
$ 0.001
|
$ 0.001
|
| Common stock, shares authorized |
350,000,000
|
350,000,000
|
| Common stock, shares issued |
145,429,993
|
128,345,183
|
| Common stock, shares outstanding |
145,429,993
|
128,345,183
|
| X |
- DefinitionFace amount or stated value per share of common stock. Reference 1: http://fasb.org/us-gaap/role/ref/legacyRef
-Publisher FASB
-Name Accounting Standards Codification
-Topic 210
-SubTopic 10
-Section S99
-Paragraph 1
-Subparagraph (SX 210.5-02(29))
-URI https://asc.fasb.org/extlink&oid=120391452&loc=d3e13212-122682
| Name: |
us-gaap_CommonStockParOrStatedValuePerShare |
| Namespace Prefix: |
us-gaap_ |
| Data Type: |
dtr-types:perShareItemType |
| Balance Type: |
na |
| Period Type: |
instant |
|
| X |
- DefinitionThe maximum number of common shares permitted to be issued by an entity's charter and bylaws. Reference 1: http://fasb.org/us-gaap/role/ref/legacyRef
-Publisher FASB
-Name Accounting Standards Codification
-Topic 210
-SubTopic 10
-Section S99
-Paragraph 1
-Subparagraph (SX 210.5-02(29))
-URI https://asc.fasb.org/extlink&oid=120391452&loc=d3e13212-122682
| Name: |
us-gaap_CommonStockSharesAuthorized |
| Namespace Prefix: |
us-gaap_ |
| Data Type: |
xbrli:sharesItemType |
| Balance Type: |
na |
| Period Type: |
instant |
|
| X |
- DefinitionTotal number of common shares of an entity that have been sold or granted to shareholders (includes common shares that were issued, repurchased and remain in the treasury). These shares represent capital invested by the firm's shareholders and owners, and may be all or only a portion of the number of shares authorized. Shares issued include shares outstanding and shares held in the treasury. Reference 1: http://fasb.org/us-gaap/role/ref/legacyRef
-Publisher FASB
-Name Accounting Standards Codification
-Topic 210
-SubTopic 10
-Section S99
-Paragraph 1
-Subparagraph (SX 210.5-02(29))
-URI https://asc.fasb.org/extlink&oid=120391452&loc=d3e13212-122682
| Name: |
us-gaap_CommonStockSharesIssued |
| Namespace Prefix: |
us-gaap_ |
| Data Type: |
xbrli:sharesItemType |
| Balance Type: |
na |
| Period Type: |
instant |
|
| X |
- DefinitionNumber of shares of common stock outstanding. Common stock represent the ownership interest in a corporation. Reference 1: http://fasb.org/us-gaap/role/ref/legacyRef
-Publisher FASB
-Name Accounting Standards Codification
-Topic 505
-SubTopic 10
-Section 50
-Paragraph 2
-URI https://asc.fasb.org/extlink&oid=126973232&loc=d3e21463-112644
Reference 2: http://fasb.org/us-gaap/role/ref/legacyRef
-Publisher FASB
-Name Accounting Standards Codification
-Topic 210
-SubTopic 10
-Section S99
-Paragraph 1
-Subparagraph (SX 210.5-02(29))
-URI https://asc.fasb.org/extlink&oid=120391452&loc=d3e13212-122682
| Name: |
us-gaap_CommonStockSharesOutstanding |
| Namespace Prefix: |
us-gaap_ |
| Data Type: |
xbrli:sharesItemType |
| Balance Type: |
na |
| Period Type: |
instant |
|
| X |
- DefinitionFace amount or stated value per share of preferred stock nonredeemable or redeemable solely at the option of the issuer. Reference 1: http://fasb.org/us-gaap/role/ref/legacyRef
-Publisher FASB
-Name Accounting Standards Codification
-Topic 210
-SubTopic 10
-Section S99
-Paragraph 1
-Subparagraph (SX 210.5-02(28))
-URI https://asc.fasb.org/extlink&oid=120391452&loc=d3e13212-122682
Reference 2: http://www.xbrl.org/2003/role/disclosureRef
-Publisher FASB
-Name Accounting Standards Codification
-Topic 505
-SubTopic 10
-Section 50
-Paragraph 13
-Subparagraph (a)
-URI https://asc.fasb.org/extlink&oid=126973232&loc=SL123496158-112644
| Name: |
us-gaap_PreferredStockParOrStatedValuePerShare |
| Namespace Prefix: |
us-gaap_ |
| Data Type: |
dtr-types:perShareItemType |
| Balance Type: |
na |
| Period Type: |
instant |
|
| X |
- DefinitionThe maximum number of nonredeemable preferred shares (or preferred stock redeemable solely at the option of the issuer) permitted to be issued by an entity's charter and bylaws. Reference 1: http://fasb.org/us-gaap/role/ref/legacyRef
-Publisher FASB
-Name Accounting Standards Codification
-Topic 210
-SubTopic 10
-Section S99
-Paragraph 1
-Subparagraph (SX 210.5-02(28))
-URI https://asc.fasb.org/extlink&oid=120391452&loc=d3e13212-122682
| Name: |
us-gaap_PreferredStockSharesAuthorized |
| Namespace Prefix: |
us-gaap_ |
| Data Type: |
xbrli:sharesItemType |
| Balance Type: |
na |
| Period Type: |
instant |
|
| X |
- DefinitionTotal number of nonredeemable preferred shares (or preferred stock redeemable solely at the option of the issuer) issued to shareholders (includes related preferred shares that were issued, repurchased, and remain in the treasury). May be all or portion of the number of preferred shares authorized. Excludes preferred shares that are classified as debt. Reference 1: http://fasb.org/us-gaap/role/ref/legacyRef
-Publisher FASB
-Name Accounting Standards Codification
-Topic 210
-SubTopic 10
-Section S99
-Paragraph 1
-Subparagraph (SX 210.5-02(28))
-URI https://asc.fasb.org/extlink&oid=120391452&loc=d3e13212-122682
Reference 2: http://www.xbrl.org/2003/role/disclosureRef
-Publisher FASB
-Name Accounting Standards Codification
-Topic 505
-SubTopic 10
-Section 50
-Paragraph 13
-Subparagraph (a)
-URI https://asc.fasb.org/extlink&oid=126973232&loc=SL123496158-112644
| Name: |
us-gaap_PreferredStockSharesIssued |
| Namespace Prefix: |
us-gaap_ |
| Data Type: |
xbrli:sharesItemType |
| Balance Type: |
na |
| Period Type: |
instant |
|
| X |
- DefinitionAggregate share number for all nonredeemable preferred stock (or preferred stock redeemable solely at the option of the issuer) held by stockholders. Does not include preferred shares that have been repurchased. Reference 1: http://fasb.org/us-gaap/role/ref/legacyRef
-Publisher FASB
-Name Accounting Standards Codification
-Topic 210
-SubTopic 10
-Section S99
-Paragraph 1
-Subparagraph (SX 210.5-02(28))
-URI https://asc.fasb.org/extlink&oid=120391452&loc=d3e13212-122682
| Name: |
us-gaap_PreferredStockSharesOutstanding |
| Namespace Prefix: |
us-gaap_ |
| Data Type: |
xbrli:sharesItemType |
| Balance Type: |
na |
| Period Type: |
instant |
|
| X |
- References
+ Details
| Name: |
us-gaap_StatementOfFinancialPositionAbstract |
| Namespace Prefix: |
us-gaap_ |
| Data Type: |
xbrli:stringItemType |
| Balance Type: |
na |
| Period Type: |
duration |
|
| X |
- DefinitionPer share amount of par value or stated value of stock classified as temporary equity. Temporary equity is a security with redemption features that are outside the control of the issuer, is not classified as an asset or liability in conformity with GAAP, and is not mandatorily redeemable. Reference 1: http://fasb.org/us-gaap/role/ref/legacyRef
-Publisher FASB
-Name Accounting Standards Codification
-Topic 480
-SubTopic 10
-Section S99
-Paragraph 1
-URI https://asc.fasb.org/extlink&oid=122040564&loc=d3e177068-122764
Reference 2: http://fasb.org/us-gaap/role/ref/legacyRef
-Publisher FASB
-Name Accounting Standards Codification
-Topic 210
-SubTopic 10
-Section S99
-Paragraph 1
-Subparagraph (27)
-URI https://asc.fasb.org/extlink&oid=120391452&loc=d3e13212-122682
| Name: |
us-gaap_TemporaryEquityParOrStatedValuePerShare |
| Namespace Prefix: |
us-gaap_ |
| Data Type: |
dtr-types:perShareItemType |
| Balance Type: |
na |
| Period Type: |
instant |
|
| X |
- DefinitionThe maximum number of securities classified as temporary equity that are permitted to be issued by an entity's charter and bylaws. Temporary equity is a security with redemption features that are outside the control of the issuer, is not classified as an asset or liability in conformity with GAAP, and is not mandatorily redeemable. Includes any type of security that is redeemable at a fixed or determinable price or on a fixed or determinable date or dates, is redeemable at the option of the holder, or has conditions for redemption which are not solely within the control of the issuer. If convertible, the issuer does not control the actions or events necessary to issue the maximum number of shares that could be required to be delivered under the conversion option if the holder exercises the option to convert the stock to another class of equity. If the security is a warrant or a rights issue, the warrant or rights issue is considered to be temporary equity if the issuer cannot demonstrate that it would be able to deliver upon the exercise of the option by the holder in all cases. Includes stock with put option held by ESOP and stock redeemable by holder only in the event of a change in control of the issuer. Reference 1: http://fasb.org/us-gaap/role/ref/legacyRef
-Publisher FASB
-Name Accounting Standards Codification
-Topic 210
-SubTopic 10
-Section S99
-Paragraph 1
-Subparagraph (SX 210.5-02(27)(b))
-URI https://asc.fasb.org/extlink&oid=120391452&loc=d3e13212-122682
| Name: |
us-gaap_TemporaryEquitySharesAuthorized |
| Namespace Prefix: |
us-gaap_ |
| Data Type: |
xbrli:sharesItemType |
| Balance Type: |
na |
| Period Type: |
instant |
|
| X |
- DefinitionThe number of securities classified as temporary equity that have been sold (or granted) to the entity's shareholders. Securities issued include securities outstanding and securities held in treasury. Temporary equity is a security with redemption features that are outside the control of the issuer, is not classified as an asset or liability in conformity with GAAP, and is not mandatorily redeemable. Includes any type of security that is redeemable at a fixed or determinable price or on a fixed or determinable date or dates, is redeemable at the option of the holder, or has conditions for redemption which are not solely within the control of the issuer. If convertible, the issuer does not control the actions or events necessary to issue the maximum number of shares that could be required to be delivered under the conversion option if the holder exercises the option to convert the stock to another class of equity. If the security is a warrant or a rights issue, the warrant or rights issue is considered to be temporary equity if the issuer cannot demonstrate that it would be able to deliver upon the exercise of the option by the holder in all cases. Includes stock with put option held by ESOP and stock redeemable by holder only in the event of a change in control of the issuer. Reference 1: http://fasb.org/us-gaap/role/ref/legacyRef
-Publisher FASB
-Name Accounting Standards Codification
-Topic 210
-SubTopic 10
-Section S99
-Paragraph 1
-Subparagraph (SX 210.5-02(27)(b))
-URI https://asc.fasb.org/extlink&oid=120391452&loc=d3e13212-122682
| Name: |
us-gaap_TemporaryEquitySharesIssued |
| Namespace Prefix: |
us-gaap_ |
| Data Type: |
xbrli:sharesItemType |
| Balance Type: |
na |
| Period Type: |
instant |
|
| X |
- DefinitionThe number of securities classified as temporary equity that have been issued and are held by the entity's shareholders. Securities outstanding equals securities issued minus securities held in treasury. Temporary equity is a security with redemption features that are outside the control of the issuer, is not classified as an asset or liability in conformity with GAAP, and is not mandatorily redeemable. Includes any type of security that is redeemable at a fixed or determinable price or on a fixed or determinable date or dates, is redeemable at the option of the holder, or has conditions for redemption which are not solely within the control of the issuer. If convertible, the issuer does not control the actions or events necessary to issue the maximum number of shares that could be required to be delivered under the conversion option if the holder exercises the option to convert the stock to another class of equity. If the security is a warrant or a rights issue, the warrant or rights issue is considered to be temporary equity if the issuer cannot demonstrate that it would be able to deliver upon the exercise of the option by the holder in all cases. Includes stock with put option held by ESOP and stock redeemable by holder only in the event of a change in control of the issuer. Reference 1: http://fasb.org/us-gaap/role/ref/legacyRef
-Publisher FASB
-Name Accounting Standards Codification
-Topic 210
-SubTopic 10
-Section S99
-Paragraph 1
-Subparagraph (SX 210.5-02(27)(b))
-URI https://asc.fasb.org/extlink&oid=120391452&loc=d3e13212-122682
| Name: |
us-gaap_TemporaryEquitySharesOutstanding |
| Namespace Prefix: |
us-gaap_ |
| Data Type: |
xbrli:sharesItemType |
| Balance Type: |
na |
| Period Type: |
instant |
|
| X |
- DefinitionAmount of a new issue of securities classified as temporary equity that are allocated to investors for them to buy. When securities are sold on a subscription basis, the issuer does not initially receive the total proceeds. In general, the issuer does not issue the securities to the investor until it receives the entire proceeds. Temporary equity is a security with redemption features that are outside the control of the issuer, is not classified as an asset or liability in conformity with GAAP, and is not mandatorily redeemable. Includes any type of security that is redeemable at a fixed or determinable price or on a fixed or determinable date or dates, is redeemable at the option of the holder, or has conditions for redemption which are not solely within the control of the issuer. If convertible, the issuer does not control the actions or events necessary to issue the maximum number of shares that could be required to be delivered under the conversion option if the holder exercises the option to convert the stock to another class of equity. If the security is a warrant or a rights issue, the warrant or rights issue is considered to be temporary equity if the issuer cannot demonstrate that it would be able to deliver upon the exercise of the option by the holder in all cases. Includes stock with put option held by ESOP and stock redeemable by holder only in the event of a change in control of the issuer. Reference 1: http://fasb.org/us-gaap/role/ref/legacyRef
-Publisher FASB
-Name Accounting Standards Codification
-Topic 210
-SubTopic 10
-Section S99
-Paragraph 1
-Subparagraph (SX 210.5-02(27)(b))
-URI https://asc.fasb.org/extlink&oid=120391452&loc=d3e13212-122682
| Name: |
us-gaap_TemporaryEquitySharesSubscribedButUnissued |
| Namespace Prefix: |
us-gaap_ |
| Data Type: |
xbrli:sharesItemType |
| Balance Type: |
na |
| Period Type: |
instant |
|
v3.23.2
Consolidated Statements of Operations - USD ($)
|
12 Months Ended |
Dec. 31, 2022 |
Dec. 31, 2021 |
| Income Statement [Abstract] |
|
|
| Revenue |
$ 3,833,853
|
$ 2,092,819
|
| Cost of revenue |
2,082,968
|
1,110,698
|
| Gross profit |
1,750,885
|
982,121
|
| Operating expenses |
|
|
| Compensation expense |
3,534,816
|
3,017,181
|
| General and administration expense |
3,429,075
|
3,467,995
|
| Research and development |
52,344
|
388,035
|
| Bad debt expense (recovery) |
(29,389)
|
49,586
|
| Depreciation and amortization expense |
13,670
|
12,837
|
| Total operating expense |
7,000,516
|
6,935,634
|
| Loss from operations |
(5,249,631)
|
(5,953,513)
|
| Other income (expense) |
|
|
| Foreign currency exchange |
(28,241)
|
(59,793)
|
| Other (expense) income |
|
13,584
|
| Loss on sale of lease receivable |
(3,923)
|
|
| (Loss) Gain on extinguishment of debt |
40,355
|
35,169
|
| Gain on disposal |
3,960
|
|
| Interest on preferred shares |
(3,062)
|
|
| Finance costs |
(2,306,849)
|
(420,102)
|
| Total other income (expense) |
(2,297,760)
|
(431,142)
|
| Net loss |
$ (7,547,391)
|
$ (6,384,655)
|
| Net loss per share |
|
|
| Basic and diluted |
$ (0.06)
|
$ (0.06)
|
| Weighted average number of shares used in computing basic and diluted net loss per share: |
|
|
| Basic and diluted |
136,607,605
|
114,897,055
|
| X |
- DefinitionInterest on preferred shares.
| Name: |
DSGT_InterestOnPreferredShares |
| Namespace Prefix: |
DSGT_ |
| Data Type: |
xbrli:monetaryItemType |
| Balance Type: |
credit |
| Period Type: |
duration |
|
| X |
- DefinitionLoss on sale of lease receivable.
| Name: |
DSGT_LossOnSaleOfLeaseReceivable |
| Namespace Prefix: |
DSGT_ |
| Data Type: |
xbrli:monetaryItemType |
| Balance Type: |
debit |
| Period Type: |
duration |
|
| X |
- DefinitionAmount of amortization expense attributable to debt issuance costs. Reference 1: http://www.xbrl.org/2009/role/commonPracticeRef
-Publisher FASB
-Name Accounting Standards Codification
-Topic 230
-SubTopic 10
-Section 45
-Paragraph 28
-Subparagraph (b)
-URI https://asc.fasb.org/extlink&oid=126954810&loc=d3e3602-108585
Reference 2: http://fasb.org/us-gaap/role/ref/legacyRef
-Publisher FASB
-Name Accounting Standards Codification
-Topic 220
-SubTopic 10
-Section S99
-Paragraph 2
-Subparagraph (SX 210.5-03(8))
-URI https://asc.fasb.org/extlink&oid=126953954&loc=SL114868664-224227
Reference 3: http://www.xbrl.org/2003/role/disclosureRef
-Publisher FASB
-Name Accounting Standards Codification
-Topic 470
-SubTopic 20
-Section 50
-Paragraph 1F
-Subparagraph (b)(2)
-URI https://asc.fasb.org/extlink&oid=123466505&loc=SL123495355-112611
Reference 4: http://www.xbrl.org/2003/role/disclosureRef
-Publisher FASB
-Name Accounting Standards Codification
-Topic 835
-SubTopic 30
-Section 45
-Paragraph 3
-URI https://asc.fasb.org/extlink&oid=124435984&loc=d3e28555-108399
| Name: |
us-gaap_AmortizationOfFinancingCosts |
| Namespace Prefix: |
us-gaap_ |
| Data Type: |
xbrli:monetaryItemType |
| Balance Type: |
debit |
| Period Type: |
duration |
|
| X |
- DefinitionThe aggregate cost of goods produced and sold and services rendered during the reporting period. Reference 1: http://www.xbrl.org/2003/role/disclosureRef
-Publisher FASB
-Name Accounting Standards Codification
-Topic 470
-SubTopic 10
-Section S99
-Paragraph 1B
-Subparagraph (SX 210.13-02(a)(5))
-URI https://asc.fasb.org/extlink&oid=126975872&loc=SL124442552-122756
Reference 2: http://www.xbrl.org/2003/role/disclosureRef
-Publisher FASB
-Name Accounting Standards Codification
-Topic 825
-SubTopic 10
-Section 50
-Paragraph 28
-Subparagraph (f)
-URI https://asc.fasb.org/extlink&oid=123596393&loc=d3e14064-108612
Reference 3: http://www.xbrl.org/2003/role/disclosureRef
-Publisher FASB
-Name Accounting Standards Codification
-Topic 235
-SubTopic 10
-Section S99
-Paragraph 1
-Subparagraph (SX 210.4-08(g)(1)(ii))
-URI https://asc.fasb.org/extlink&oid=120395691&loc=d3e23780-122690
Reference 4: http://www.xbrl.org/2003/role/disclosureRef
-Publisher FASB
-Name Accounting Standards Codification
-Topic 470
-SubTopic 10
-Section S99
-Paragraph 1A
-Subparagraph (SX 210.13-01(a)(4)(iv))
-URI https://asc.fasb.org/extlink&oid=126975872&loc=SL124442526-122756
Reference 5: http://fasb.org/us-gaap/role/ref/legacyRef
-Publisher FASB
-Name Accounting Standards Codification
-Topic 220
-SubTopic 10
-Section S99
-Paragraph 2
-Subparagraph (SX 210.5-03.2)
-URI https://asc.fasb.org/extlink&oid=126953954&loc=SL114868664-224227
Reference 6: http://www.xbrl.org/2003/role/disclosureRef
-Publisher FASB
-Name Accounting Standards Codification
-Topic 323
-SubTopic 10
-Section 50
-Paragraph 3
-Subparagraph (c)
-URI https://asc.fasb.org/extlink&oid=114001798&loc=d3e33918-111571
Reference 7: http://www.xbrl.org/2003/role/disclosureRef
-Publisher FASB
-Name Accounting Standards Codification
-Topic 470
-SubTopic 10
-Section S99
-Paragraph 1A
-Subparagraph (SX 210.13-01(a)(5))
-URI https://asc.fasb.org/extlink&oid=126975872&loc=SL124442526-122756
Reference 8: http://www.xbrl.org/2003/role/disclosureRef
-Publisher FASB
-Name Accounting Standards Codification
-Topic 470
-SubTopic 10
-Section S99
-Paragraph 1B
-Subparagraph (SX 210.13-02(a)(4)(i))
-URI https://asc.fasb.org/extlink&oid=126975872&loc=SL124442552-122756
Reference 9: http://www.xbrl.org/2003/role/disclosureRef
-Publisher FASB
-Name Accounting Standards Codification
-Topic 470
-SubTopic 10
-Section S99
-Paragraph 1B
-Subparagraph (SX 210.13-02(a)(4)(iii)(B))
-URI https://asc.fasb.org/extlink&oid=126975872&loc=SL124442552-122756
Reference 10: http://www.xbrl.org/2003/role/disclosureRef
-Publisher FASB
-Name Accounting Standards Codification
-Topic 470
-SubTopic 10
-Section S99
-Paragraph 1B
-Subparagraph (SX 210.13-02(a)(4)(iii)(A))
-URI https://asc.fasb.org/extlink&oid=126975872&loc=SL124442552-122756
Reference 11: http://www.xbrl.org/2003/role/disclosureRef
-Publisher FASB
-Name Accounting Standards Codification
-Topic 470
-SubTopic 10
-Section S99
-Paragraph 1A
-Subparagraph (SX 210.13-01(a)(4)(i))
-URI https://asc.fasb.org/extlink&oid=126975872&loc=SL124442526-122756
Reference 12: http://www.xbrl.org/2003/role/disclosureRef
-Publisher FASB
-Name Accounting Standards Codification
-Topic 470
-SubTopic 10
-Section S99
-Paragraph 1A
-Subparagraph (SX 210.13-01(a)(4)(iii)(A))
-URI https://asc.fasb.org/extlink&oid=126975872&loc=SL124442526-122756
Reference 13: http://www.xbrl.org/2009/role/commonPracticeRef
-Publisher FASB
-Name Accounting Standards Codification
-Topic 470
-SubTopic 10
-Section S99
-Paragraph 1A
-Subparagraph (SX 210.13-01(a)(4)(ii))
-URI https://asc.fasb.org/extlink&oid=126975872&loc=SL124442526-122756
Reference 14: http://www.xbrl.org/2003/role/disclosureRef
-Publisher FASB
-Name Accounting Standards Codification
-Topic 470
-SubTopic 10
-Section S99
-Paragraph 1B
-Subparagraph (SX 210.13-02(a)(4)(iv))
-URI https://asc.fasb.org/extlink&oid=126975872&loc=SL124442552-122756
| Name: |
us-gaap_CostOfRevenue |
| Namespace Prefix: |
us-gaap_ |
| Data Type: |
xbrli:monetaryItemType |
| Balance Type: |
debit |
| Period Type: |
duration |
|
| X |
- DefinitionThe aggregate expense recognized in the current period that allocates the cost of tangible assets, intangible assets, or depleting assets to periods that benefit from use of the assets. Reference 1: http://www.xbrl.org/2003/role/disclosureRef
-Publisher FASB
-Name Accounting Standards Codification
-Topic 280
-SubTopic 10
-Section 50
-Paragraph 22
-Subparagraph (e)
-URI https://asc.fasb.org/extlink&oid=126901519&loc=d3e8736-108599
Reference 2: http://fasb.org/us-gaap/role/ref/legacyRef
-Publisher FASB
-Name Accounting Standards Codification
-Topic 230
-SubTopic 10
-Section 45
-Paragraph 28
-Subparagraph (b)
-URI https://asc.fasb.org/extlink&oid=126954810&loc=d3e3602-108585
| Name: |
us-gaap_DepreciationDepletionAndAmortization |
| Namespace Prefix: |
us-gaap_ |
| Data Type: |
xbrli:monetaryItemType |
| Balance Type: |
debit |
| Period Type: |
duration |
|
| X |
- References
+ Details
| Name: |
us-gaap_EarningsPerShareAbstract |
| Namespace Prefix: |
us-gaap_ |
| Data Type: |
xbrli:stringItemType |
| Balance Type: |
na |
| Period Type: |
duration |
|
| X |
- DefinitionThe amount of net income (loss) for the period per each share of common stock or unit outstanding during the reporting period. Reference 1: http://www.xbrl.org/2003/role/disclosureRef
-Publisher FASB
-Name Accounting Standards Codification
-Topic 815
-SubTopic 40
-Section 65
-Paragraph 1
-Subparagraph (e)(4)
-URI https://asc.fasb.org/extlink&oid=126732423&loc=SL123482106-238011
Reference 2: http://www.xbrl.org/2003/role/disclosureRef
-Publisher FASB
-Name Accounting Standards Codification
-Topic 250
-SubTopic 10
-Section 50
-Paragraph 3
-URI https://asc.fasb.org/extlink&oid=124431687&loc=d3e22583-107794
Reference 3: http://www.xbrl.org/2003/role/disclosureRef
-Publisher FASB
-Name Accounting Standards Codification
-Topic 250
-SubTopic 10
-Section 50
-Paragraph 11
-Subparagraph (b)
-URI https://asc.fasb.org/extlink&oid=124431687&loc=d3e22694-107794
Reference 4: http://www.xbrl.org/2003/role/disclosureRef
-Publisher FASB
-Name Accounting Standards Codification
-Topic 260
-SubTopic 10
-Section 45
-Paragraph 10
-URI https://asc.fasb.org/extlink&oid=126958026&loc=d3e1448-109256
Reference 5: http://www.xbrl.org/2003/role/disclosureRef
-Publisher FASB
-Name Accounting Standards Codification
-Topic 250
-SubTopic 10
-Section 50
-Paragraph 4
-URI https://asc.fasb.org/extlink&oid=124431687&loc=d3e22595-107794
Reference 6: http://www.xbrl.org/2003/role/disclosureRef
-Publisher FASB
-Name Accounting Standards Codification
-Topic 250
-SubTopic 10
-Section 50
-Paragraph 11
-Subparagraph (a)
-URI https://asc.fasb.org/extlink&oid=124431687&loc=d3e22694-107794
Reference 7: http://www.xbrl.org/2003/role/disclosureRef
-Publisher FASB
-Name Accounting Standards Codification
-Topic 260
-SubTopic 10
-Section 45
-Paragraph 7
-URI https://asc.fasb.org/extlink&oid=126958026&loc=d3e1337-109256
Reference 8: http://www.xbrl.org/2003/role/disclosureRef
-Publisher FASB
-Name Accounting Standards Codification
-Topic 815
-SubTopic 40
-Section 65
-Paragraph 1
-Subparagraph (f)
-URI https://asc.fasb.org/extlink&oid=126732423&loc=SL123482106-238011
Reference 9: http://www.xbrl.org/2003/role/exampleRef
-Publisher FASB
-Name Accounting Standards Codification
-Topic 260
-SubTopic 10
-Section 55
-Paragraph 52
-URI https://asc.fasb.org/extlink&oid=128363288&loc=d3e4984-109258
Reference 10: http://www.xbrl.org/2003/role/disclosureRef
-Publisher FASB
-Name Accounting Standards Codification
-Topic 944
-SubTopic 220
-Section S99
-Paragraph 1
-Subparagraph (SX 210.7-04(23))
-URI https://asc.fasb.org/extlink&oid=120400993&loc=SL114874131-224263
Reference 11: http://www.xbrl.org/2003/role/disclosureRef
-Publisher FASB
-Name Accounting Standards Codification
-Topic 260
-SubTopic 10
-Section 55
-Paragraph 15
-URI https://asc.fasb.org/extlink&oid=128363288&loc=d3e3842-109258
Reference 12: http://www.xbrl.org/2003/role/disclosureRef
-Publisher FASB
-Name Accounting Standards Codification
-Topic 250
-SubTopic 10
-Section 50
-Paragraph 7
-Subparagraph (a)
-URI https://asc.fasb.org/extlink&oid=124431687&loc=d3e22644-107794
Reference 13: http://www.xbrl.org/2003/role/disclosureRef
-Publisher FASB
-Name Accounting Standards Codification
-Topic 260
-SubTopic 10
-Section 50
-Paragraph 1
-Subparagraph (a)
-URI https://asc.fasb.org/extlink&oid=124432515&loc=d3e3550-109257
Reference 14: http://www.xbrl.org/2003/role/disclosureRef
-Publisher FASB
-Name Accounting Standards Codification
-Topic 220
-SubTopic 10
-Section S99
-Paragraph 2
-Subparagraph (SX 210.5-03(25))
-URI https://asc.fasb.org/extlink&oid=126953954&loc=SL114868664-224227
Reference 15: http://www.xbrl.org/2003/role/disclosureRef
-Publisher FASB
-Name Accounting Standards Codification
-Topic 260
-SubTopic 10
-Section 45
-Paragraph 2
-URI https://asc.fasb.org/extlink&oid=126958026&loc=d3e1252-109256
Reference 16: http://www.xbrl.org/2003/role/disclosureRef
-Publisher FASB
-Name Accounting Standards Codification
-Topic 260
-SubTopic 10
-Section 45
-Paragraph 60B
-Subparagraph (d)
-URI https://asc.fasb.org/extlink&oid=126958026&loc=SL5780133-109256
Reference 17: http://www.xbrl.org/2003/role/disclosureRef
-Publisher FASB
-Name Accounting Standards Codification
-Topic 942
-SubTopic 220
-Section S99
-Paragraph 1
-Subparagraph (SX 210.9-04(27))
-URI https://asc.fasb.org/extlink&oid=120399700&loc=SL114874048-224260
| Name: |
us-gaap_EarningsPerShareBasic |
| Namespace Prefix: |
us-gaap_ |
| Data Type: |
dtr-types:perShareItemType |
| Balance Type: |
na |
| Period Type: |
duration |
|
| X |
- DefinitionAmount before tax of foreign currency transaction realized and unrealized gain (loss) recognized in the income statement. Reference 1: http://www.xbrl.org/2003/role/disclosureRef
-Publisher FASB
-Name Accounting Standards Codification
-Topic 830
-SubTopic 20
-Section 45
-Paragraph 1
-URI https://asc.fasb.org/extlink&oid=125521441&loc=d3e30690-110894
Reference 2: http://www.xbrl.org/2003/role/disclosureRef
-Publisher FASB
-Name Accounting Standards Codification
-Topic 830
-SubTopic 20
-Section 35
-Paragraph 1
-URI https://asc.fasb.org/extlink&oid=123602790&loc=d3e30226-110892
Reference 3: http://www.xbrl.org/2003/role/disclosureRef
-Publisher FASB
-Name Accounting Standards Codification
-Topic 830
-SubTopic 10
-Section 45
-Paragraph 17
-URI https://asc.fasb.org/extlink&oid=126980362&loc=d3e28228-110885
Reference 4: http://www.xbrl.org/2003/role/disclosureRef
-Publisher FASB
-Name Accounting Standards Codification
-Topic 830
-SubTopic 20
-Section 50
-Paragraph 1
-URI https://asc.fasb.org/extlink&oid=124440516&loc=d3e30840-110895
| Name: |
us-gaap_ForeignCurrencyTransactionGainLossBeforeTax |
| Namespace Prefix: |
us-gaap_ |
| Data Type: |
xbrli:monetaryItemType |
| Balance Type: |
credit |
| Period Type: |
duration |
|
| X |
- DefinitionAmount of gain (loss) on sale or disposal of intangible assets. Reference 1: http://www.xbrl.org/2009/role/commonPracticeRef
-Publisher FASB
-Name Accounting Standards Codification
-Topic 230
-SubTopic 10
-Section 45
-Paragraph 28
-Subparagraph (b)
-URI https://asc.fasb.org/extlink&oid=126954810&loc=d3e3602-108585
| Name: |
us-gaap_GainLossOnDispositionOfIntangibleAssets |
| Namespace Prefix: |
us-gaap_ |
| Data Type: |
xbrli:monetaryItemType |
| Balance Type: |
credit |
| Period Type: |
duration |
|
| X |
- DefinitionDifference between the fair value of payments made and the carrying amount of debt which is extinguished prior to maturity. Reference 1: http://fasb.org/us-gaap/role/ref/legacyRef
-Publisher FASB
-Name Accounting Standards Codification
-Topic 470
-SubTopic 50
-Section 40
-Paragraph 4
-URI https://asc.fasb.org/extlink&oid=126972273&loc=d3e12355-112629
Reference 2: http://fasb.org/us-gaap/role/ref/legacyRef
-Publisher FASB
-Name Accounting Standards Codification
-Topic 470
-SubTopic 50
-Section 40
-Paragraph 2
-URI https://asc.fasb.org/extlink&oid=126972273&loc=d3e12317-112629
Reference 3: http://fasb.org/us-gaap/role/ref/legacyRef
-Publisher FASB
-Name Accounting Standards Codification
-Topic 230
-SubTopic 10
-Section 45
-Paragraph 28
-Subparagraph (b)
-URI https://asc.fasb.org/extlink&oid=126954810&loc=d3e3602-108585
| Name: |
us-gaap_GainsLossesOnExtinguishmentOfDebt |
| Namespace Prefix: |
us-gaap_ |
| Data Type: |
xbrli:monetaryItemType |
| Balance Type: |
credit |
| Period Type: |
duration |
|
| X |
- DefinitionThe aggregate total of expenses of managing and administering the affairs of an entity, including affiliates of the reporting entity, which are not directly or indirectly associated with the manufacture, sale or creation of a product or product line. Reference 1: http://fasb.org/us-gaap/role/ref/legacyRef
-Publisher FASB
-Name Accounting Standards Codification
-Topic 220
-SubTopic 10
-Section S99
-Paragraph 2
-Subparagraph (SX 210.5-03.4)
-URI https://asc.fasb.org/extlink&oid=126953954&loc=SL114868664-224227
| Name: |
us-gaap_GeneralAndAdministrativeExpense |
| Namespace Prefix: |
us-gaap_ |
| Data Type: |
xbrli:monetaryItemType |
| Balance Type: |
debit |
| Period Type: |
duration |
|
| X |
- DefinitionAggregate revenue less cost of goods and services sold or operating expenses directly attributable to the revenue generation activity. Reference 1: http://www.xbrl.org/2003/role/exampleRef
-Publisher FASB
-Name Accounting Standards Codification
-Topic 280
-SubTopic 10
-Section 50
-Paragraph 31
-URI https://asc.fasb.org/extlink&oid=126901519&loc=d3e8924-108599
Reference 2: http://www.xbrl.org/2003/role/disclosureRef
-Publisher FASB
-Name Accounting Standards Codification
-Topic 280
-SubTopic 10
-Section 50
-Paragraph 30
-Subparagraph (b)
-URI https://asc.fasb.org/extlink&oid=126901519&loc=d3e8906-108599
Reference 3: http://www.xbrl.org/2003/role/disclosureRef
-Publisher FASB
-Name Accounting Standards Codification
-Topic 280
-SubTopic 10
-Section 50
-Paragraph 22
-URI https://asc.fasb.org/extlink&oid=126901519&loc=d3e8736-108599
Reference 4: http://www.xbrl.org/2003/role/disclosureRef
-Publisher FASB
-Name Accounting Standards Codification
-Topic 280
-SubTopic 10
-Section 50
-Paragraph 32
-Subparagraph (f)
-URI https://asc.fasb.org/extlink&oid=126901519&loc=d3e8933-108599
Reference 5: http://www.xbrl.org/2003/role/disclosureRef
-Publisher FASB
-Name Accounting Standards Codification
-Topic 470
-SubTopic 10
-Section S99
-Paragraph 1A
-Subparagraph (SX 210.13-01(a)(4)(iv))
-URI https://asc.fasb.org/extlink&oid=126975872&loc=SL124442526-122756
Reference 6: http://www.xbrl.org/2003/role/disclosureRef
-Publisher FASB
-Name Accounting Standards Codification
-Topic 323
-SubTopic 10
-Section 50
-Paragraph 3
-Subparagraph (c)
-URI https://asc.fasb.org/extlink&oid=114001798&loc=d3e33918-111571
Reference 7: http://www.xbrl.org/2003/role/disclosureRef
-Publisher FASB
-Name Accounting Standards Codification
-Topic 470
-SubTopic 10
-Section S99
-Paragraph 1B
-Subparagraph (SX 210.13-02(a)(4)(iii)(A))
-URI https://asc.fasb.org/extlink&oid=126975872&loc=SL124442552-122756
Reference 8: http://www.xbrl.org/2003/role/disclosureRef
-Publisher FASB
-Name Accounting Standards Codification
-Topic 470
-SubTopic 10
-Section S99
-Paragraph 1B
-Subparagraph (SX 210.13-02(a)(4)(iii)(B))
-URI https://asc.fasb.org/extlink&oid=126975872&loc=SL124442552-122756
Reference 9: http://www.xbrl.org/2009/role/commonPracticeRef
-Publisher FASB
-Name Accounting Standards Codification
-Topic 470
-SubTopic 10
-Section S99
-Paragraph 1A
-Subparagraph (SX 210.13-01(a)(4)(ii))
-URI https://asc.fasb.org/extlink&oid=126975872&loc=SL124442526-122756
Reference 10: http://www.xbrl.org/2003/role/disclosureRef
-Publisher FASB
-Name Accounting Standards Codification
-Topic 235
-SubTopic 10
-Section S99
-Paragraph 1
-Subparagraph (SX 210.4-08(g)(1)(ii))
-URI https://asc.fasb.org/extlink&oid=120395691&loc=d3e23780-122690
Reference 11: http://www.xbrl.org/2003/role/disclosureRef
-Publisher FASB
-Name Accounting Standards Codification
-Topic 470
-SubTopic 10
-Section S99
-Paragraph 1A
-Subparagraph (SX 210.13-01(a)(4)(i))
-URI https://asc.fasb.org/extlink&oid=126975872&loc=SL124442526-122756
Reference 12: http://www.xbrl.org/2003/role/disclosureRef
-Publisher FASB
-Name Accounting Standards Codification
-Topic 470
-SubTopic 10
-Section S99
-Paragraph 1B
-Subparagraph (SX 210.13-02(a)(4)(i))
-URI https://asc.fasb.org/extlink&oid=126975872&loc=SL124442552-122756
Reference 13: http://www.xbrl.org/2003/role/disclosureRef
-Publisher FASB
-Name Accounting Standards Codification
-Topic 470
-SubTopic 10
-Section S99
-Paragraph 1A
-Subparagraph (SX 210.13-01(a)(4)(iii)(A))
-URI https://asc.fasb.org/extlink&oid=126975872&loc=SL124442526-122756
Reference 14: http://www.xbrl.org/2003/role/disclosureRef
-Publisher FASB
-Name Accounting Standards Codification
-Topic 825
-SubTopic 10
-Section 50
-Paragraph 28
-Subparagraph (f)
-URI https://asc.fasb.org/extlink&oid=123596393&loc=d3e14064-108612
Reference 15: http://www.xbrl.org/2003/role/disclosureRef
-Publisher FASB
-Name Accounting Standards Codification
-Topic 470
-SubTopic 10
-Section S99
-Paragraph 1A
-Subparagraph (SX 210.13-01(a)(5))
-URI https://asc.fasb.org/extlink&oid=126975872&loc=SL124442526-122756
Reference 16: http://www.xbrl.org/2003/role/disclosureRef
-Publisher FASB
-Name Accounting Standards Codification
-Topic 470
-SubTopic 10
-Section S99
-Paragraph 1B
-Subparagraph (SX 210.13-02(a)(4)(iv))
-URI https://asc.fasb.org/extlink&oid=126975872&loc=SL124442552-122756
Reference 17: http://www.xbrl.org/2003/role/disclosureRef
-Publisher FASB
-Name Accounting Standards Codification
-Topic 470
-SubTopic 10
-Section S99
-Paragraph 1B
-Subparagraph (SX 210.13-02(a)(5))
-URI https://asc.fasb.org/extlink&oid=126975872&loc=SL124442552-122756
Reference 18: http://fasb.org/us-gaap/role/ref/legacyRef
-Publisher FASB
-Name Accounting Standards Codification
-Topic 220
-SubTopic 10
-Section S99
-Paragraph 2
-Subparagraph (SX 210.5-03.1,2)
-URI https://asc.fasb.org/extlink&oid=126953954&loc=SL114868664-224227
Reference 19: http://www.xbrl.org/2003/role/disclosureRef
-Publisher FASB
-Name Accounting Standards Codification
-Topic 280
-SubTopic 10
-Section 50
-Paragraph 32
-Subparagraph (c)
-URI https://asc.fasb.org/extlink&oid=126901519&loc=d3e8933-108599
| Name: |
us-gaap_GrossProfit |
| Namespace Prefix: |
us-gaap_ |
| Data Type: |
xbrli:monetaryItemType |
| Balance Type: |
credit |
| Period Type: |
duration |
|
| X |
- References
+ Details
| Name: |
us-gaap_IncomeStatementAbstract |
| Namespace Prefix: |
us-gaap_ |
| Data Type: |
xbrli:stringItemType |
| Balance Type: |
na |
| Period Type: |
duration |
|
| X |
- DefinitionThe portion of profit or loss for the period, net of income taxes, which is attributable to the parent. Reference 1: http://fasb.org/us-gaap/role/ref/legacyRef
-Publisher FASB
-Name Accounting Standards Codification
-Topic 942
-SubTopic 220
-Section S99
-Paragraph 1
-Subparagraph (SX 210.9-04(22))
-URI https://asc.fasb.org/extlink&oid=120399700&loc=SL114874048-224260
Reference 2: http://www.xbrl.org/2003/role/disclosureRef
-Publisher FASB
-Name Accounting Standards Codification
-Topic 280
-SubTopic 10
-Section 50
-Paragraph 32
-Subparagraph (f)
-URI https://asc.fasb.org/extlink&oid=126901519&loc=d3e8933-108599
Reference 3: http://www.xbrl.org/2003/role/disclosureRef
-Publisher FASB
-Name Accounting Standards Codification
-Topic 250
-SubTopic 10
-Section 50
-Paragraph 4
-URI https://asc.fasb.org/extlink&oid=124431687&loc=d3e22595-107794
Reference 4: http://fasb.org/us-gaap/role/ref/legacyRef
-Publisher FASB
-Name Accounting Standards Codification
-Topic 944
-SubTopic 220
-Section S99
-Paragraph 1
-Subparagraph (SX 210.7-04(18))
-URI https://asc.fasb.org/extlink&oid=120400993&loc=SL114874131-224263
Reference 5: http://www.xbrl.org/2003/role/disclosureRef
-Publisher FASB
-Name Accounting Standards Codification
-Topic 815
-SubTopic 40
-Section 65
-Paragraph 1
-Subparagraph (f)
-URI https://asc.fasb.org/extlink&oid=126732423&loc=SL123482106-238011
Reference 6: http://www.xbrl.org/2003/role/disclosureRef
-Publisher FASB
-Name Accounting Standards Codification
-Topic 220
-SubTopic 10
-Section 50
-Paragraph 6
-URI https://asc.fasb.org/extlink&oid=124431353&loc=SL124452729-227067
Reference 7: http://www.xbrl.org/2003/role/disclosureRef
-Publisher FASB
-Name Accounting Standards Codification
-Topic 470
-SubTopic 10
-Section S99
-Paragraph 1B
-Subparagraph (SX 210.13-02(a)(5))
-URI https://asc.fasb.org/extlink&oid=126975872&loc=SL124442552-122756
Reference 8: http://fasb.org/us-gaap/role/ref/legacyRef
-Publisher FASB
-Name Accounting Standards Codification
-Topic 220
-SubTopic 10
-Section S99
-Paragraph 2
-Subparagraph (SX 210.5-03(20))
-URI https://asc.fasb.org/extlink&oid=126953954&loc=SL114868664-224227
Reference 9: http://fasb.org/us-gaap/role/ref/legacyRef
-Publisher FASB
-Name Accounting Standards Codification
-Topic 230
-SubTopic 10
-Section 45
-Paragraph 28
-URI https://asc.fasb.org/extlink&oid=126954810&loc=d3e3602-108585
Reference 10: http://www.xbrl.org/2003/role/disclosureRef
-Publisher FASB
-Name Accounting Standards Codification
-Topic 250
-SubTopic 10
-Section 50
-Paragraph 1
-Subparagraph (b)(2)
-URI https://asc.fasb.org/extlink&oid=124431687&loc=d3e22499-107794
Reference 11: http://www.xbrl.org/2003/role/disclosureRef
-Publisher FASB
-Name Accounting Standards Codification
-Topic 470
-SubTopic 10
-Section S99
-Paragraph 1A
-Subparagraph (SX 210.13-01(a)(4)(iv))
-URI https://asc.fasb.org/extlink&oid=126975872&loc=SL124442526-122756
Reference 12: http://www.xbrl.org/2003/role/disclosureRef
-Publisher FASB
-Name Accounting Standards Codification
-Topic 470
-SubTopic 10
-Section S99
-Paragraph 1A
-Subparagraph (SX 210.13-01(a)(4)(iii)(A))
-URI https://asc.fasb.org/extlink&oid=126975872&loc=SL124442526-122756
Reference 13: http://www.xbrl.org/2003/role/disclosureRef
-Publisher FASB
-Name Accounting Standards Codification
-Topic 470
-SubTopic 10
-Section S99
-Paragraph 1B
-Subparagraph (SX 210.13-02(a)(4)(i))
-URI https://asc.fasb.org/extlink&oid=126975872&loc=SL124442552-122756
Reference 14: http://www.xbrl.org/2003/role/disclosureRef
-Publisher FASB
-Name Accounting Standards Codification
-Topic 470
-SubTopic 10
-Section S99
-Paragraph 1A
-Subparagraph (SX 210.13-01(a)(4)(i))
-URI https://asc.fasb.org/extlink&oid=126975872&loc=SL124442526-122756
Reference 15: http://www.xbrl.org/2003/role/disclosureRef
-Publisher FASB
-Name Accounting Standards Codification
-Topic 250
-SubTopic 10
-Section 50
-Paragraph 9
-URI https://asc.fasb.org/extlink&oid=124431687&loc=d3e22663-107794
Reference 16: http://www.xbrl.org/2003/role/disclosureRef
-Publisher FASB
-Name Accounting Standards Codification
-Topic 470
-SubTopic 10
-Section S99
-Paragraph 1B
-Subparagraph (SX 210.13-02(a)(4)(iv))
-URI https://asc.fasb.org/extlink&oid=126975872&loc=SL124442552-122756
Reference 17: http://www.xbrl.org/2009/role/commonPracticeRef
-Publisher FASB
-Name Accounting Standards Codification
-Topic 470
-SubTopic 10
-Section S99
-Paragraph 1A
-Subparagraph (SX 210.13-01(a)(4)(ii))
-URI https://asc.fasb.org/extlink&oid=126975872&loc=SL124442526-122756
Reference 18: http://www.xbrl.org/2003/role/disclosureRef
-Publisher FASB
-Name Accounting Standards Codification
-Topic 825
-SubTopic 10
-Section 50
-Paragraph 28
-Subparagraph (f)
-URI https://asc.fasb.org/extlink&oid=123596393&loc=d3e14064-108612
Reference 19: http://www.xbrl.org/2003/role/disclosureRef
-Publisher FASB
-Name Accounting Standards Codification
-Topic 250
-SubTopic 10
-Section 50
-Paragraph 3
-URI https://asc.fasb.org/extlink&oid=124431687&loc=d3e22583-107794
Reference 20: http://www.xbrl.org/2003/role/disclosureRef
-Publisher FASB
-Name Accounting Standards Codification
-Topic 235
-SubTopic 10
-Section S99
-Paragraph 1
-Subparagraph (SX 210.4-08(g)(1)(ii))
-URI https://asc.fasb.org/extlink&oid=120395691&loc=d3e23780-122690
Reference 21: http://www.xbrl.org/2003/role/disclosureRef
-Publisher FASB
-Name Accounting Standards Codification
-Topic 260
-SubTopic 10
-Section 45
-Paragraph 60B
-Subparagraph (a)
-URI https://asc.fasb.org/extlink&oid=126958026&loc=SL5780133-109256
Reference 22: http://www.xbrl.org/2003/role/disclosureRef
-Publisher FASB
-Name Accounting Standards Codification
-Topic 323
-SubTopic 10
-Section 50
-Paragraph 3
-Subparagraph (c)
-URI https://asc.fasb.org/extlink&oid=114001798&loc=d3e33918-111571
Reference 23: http://www.xbrl.org/2003/role/disclosureRef
-Publisher FASB
-Name Accounting Standards Codification
-Topic 250
-SubTopic 10
-Section 50
-Paragraph 8
-URI https://asc.fasb.org/extlink&oid=124431687&loc=d3e22658-107794
Reference 24: http://www.xbrl.org/2003/role/disclosureRef
-Publisher FASB
-Name Accounting Standards Codification
-Topic 220
-SubTopic 10
-Section 45
-Paragraph 1A
-Subparagraph (a)
-URI https://asc.fasb.org/extlink&oid=126968391&loc=SL7669619-108580
Reference 25: http://www.xbrl.org/2003/role/exampleRef
-Publisher FASB
-Name Accounting Standards Codification
-Topic 280
-SubTopic 10
-Section 50
-Paragraph 31
-URI https://asc.fasb.org/extlink&oid=126901519&loc=d3e8924-108599
Reference 26: http://www.xbrl.org/2003/role/disclosureRef
-Publisher FASB
-Name Accounting Standards Codification
-Topic 250
-SubTopic 10
-Section 50
-Paragraph 11
-Subparagraph (b)
-URI https://asc.fasb.org/extlink&oid=124431687&loc=d3e22694-107794
Reference 27: http://www.xbrl.org/2003/role/disclosureRef
-Publisher FASB
-Name Accounting Standards Codification
-Topic 250
-SubTopic 10
-Section 50
-Paragraph 11
-Subparagraph (a)
-URI https://asc.fasb.org/extlink&oid=124431687&loc=d3e22694-107794
Reference 28: http://www.xbrl.org/2003/role/disclosureRef
-Publisher FASB
-Name Accounting Standards Codification
-Topic 205
-SubTopic 20
-Section 50
-Paragraph 7
-URI https://asc.fasb.org/extlink&oid=109222650&loc=SL51721683-107760
Reference 29: http://www.xbrl.org/2003/role/disclosureRef
-Publisher FASB
-Name Accounting Standards Codification
-Topic 220
-SubTopic 10
-Section 45
-Paragraph 1B
-Subparagraph (a)
-URI https://asc.fasb.org/extlink&oid=126968391&loc=SL7669625-108580
Reference 30: http://www.xbrl.org/2003/role/disclosureRef
-Publisher FASB
-Name Accounting Standards Codification
-Topic 280
-SubTopic 10
-Section 50
-Paragraph 22
-URI https://asc.fasb.org/extlink&oid=126901519&loc=d3e8736-108599
Reference 31: http://www.xbrl.org/2003/role/disclosureRef
-Publisher FASB
-Name Accounting Standards Codification
-Topic 470
-SubTopic 10
-Section S99
-Paragraph 1A
-Subparagraph (SX 210.13-01(a)(5))
-URI https://asc.fasb.org/extlink&oid=126975872&loc=SL124442526-122756
Reference 32: http://www.xbrl.org/2003/role/disclosureRef
-Publisher FASB
-Name Accounting Standards Codification
-Topic 470
-SubTopic 10
-Section S99
-Paragraph 1B
-Subparagraph (SX 210.13-02(a)(4)(iii)(B))
-URI https://asc.fasb.org/extlink&oid=126975872&loc=SL124442552-122756
Reference 33: http://www.xbrl.org/2003/role/disclosureRef
-Publisher FASB
-Name Accounting Standards Codification
-Topic 470
-SubTopic 10
-Section S99
-Paragraph 1B
-Subparagraph (SX 210.13-02(a)(4)(iii)(A))
-URI https://asc.fasb.org/extlink&oid=126975872&loc=SL124442552-122756
Reference 34: http://www.xbrl.org/2003/role/disclosureRef
-Publisher FASB
-Name Accounting Standards Codification
-Topic 280
-SubTopic 10
-Section 50
-Paragraph 30
-Subparagraph (b)
-URI https://asc.fasb.org/extlink&oid=126901519&loc=d3e8906-108599
Reference 35: http://www.xbrl.org/2003/role/disclosureRef
-Publisher FASB
-Name Accounting Standards Codification
-Topic 280
-SubTopic 10
-Section 50
-Paragraph 32
-Subparagraph (c)
-URI https://asc.fasb.org/extlink&oid=126901519&loc=d3e8933-108599
| Name: |
us-gaap_NetIncomeLoss |
| Namespace Prefix: |
us-gaap_ |
| Data Type: |
xbrli:monetaryItemType |
| Balance Type: |
credit |
| Period Type: |
duration |
|
| X |
- DefinitionThe aggregate amount of income or expense from ancillary business-related activities (that is to say, excluding major activities considered part of the normal operations of the business). Reference 1: http://fasb.org/us-gaap/role/ref/legacyRef
-Publisher FASB
-Name Accounting Standards Codification
-Topic 220
-SubTopic 10
-Section S99
-Paragraph 2
-Subparagraph (SX 210.5-03.7)
-URI https://asc.fasb.org/extlink&oid=126953954&loc=SL114868664-224227
| Name: |
us-gaap_NonoperatingIncomeExpense |
| Namespace Prefix: |
us-gaap_ |
| Data Type: |
xbrli:monetaryItemType |
| Balance Type: |
credit |
| Period Type: |
duration |
|
| X |
- References
+ Details
| Name: |
us-gaap_NonoperatingIncomeExpenseAbstract |
| Namespace Prefix: |
us-gaap_ |
| Data Type: |
xbrli:stringItemType |
| Balance Type: |
na |
| Period Type: |
duration |
|
| X |
- DefinitionGenerally recurring costs associated with normal operations except for the portion of these expenses which can be clearly related to production and included in cost of sales or services. Includes selling, general and administrative expense.
| Name: |
us-gaap_OperatingExpenses |
| Namespace Prefix: |
us-gaap_ |
| Data Type: |
xbrli:monetaryItemType |
| Balance Type: |
debit |
| Period Type: |
duration |
|
| X |
- References
+ Details
| Name: |
us-gaap_OperatingExpensesAbstract |
| Namespace Prefix: |
us-gaap_ |
| Data Type: |
xbrli:stringItemType |
| Balance Type: |
na |
| Period Type: |
duration |
|
| X |
- DefinitionThe net result for the period of deducting operating expenses from operating revenues. Reference 1: http://www.xbrl.org/2003/role/exampleRef
-Publisher FASB
-Name Accounting Standards Codification
-Topic 280
-SubTopic 10
-Section 50
-Paragraph 31
-URI https://asc.fasb.org/extlink&oid=126901519&loc=d3e8924-108599
Reference 2: http://www.xbrl.org/2003/role/disclosureRef
-Publisher FASB
-Name Accounting Standards Codification
-Topic 280
-SubTopic 10
-Section 50
-Paragraph 30
-Subparagraph (b)
-URI https://asc.fasb.org/extlink&oid=126901519&loc=d3e8906-108599
Reference 3: http://www.xbrl.org/2003/role/disclosureRef
-Publisher FASB
-Name Accounting Standards Codification
-Topic 280
-SubTopic 10
-Section 50
-Paragraph 32
-Subparagraph (c)
-URI https://asc.fasb.org/extlink&oid=126901519&loc=d3e8933-108599
Reference 4: http://www.xbrl.org/2003/role/disclosureRef
-Publisher FASB
-Name Accounting Standards Codification
-Topic 280
-SubTopic 10
-Section 50
-Paragraph 32
-Subparagraph (f)
-URI https://asc.fasb.org/extlink&oid=126901519&loc=d3e8933-108599
Reference 5: http://www.xbrl.org/2003/role/disclosureRef
-Publisher FASB
-Name Accounting Standards Codification
-Topic 280
-SubTopic 10
-Section 50
-Paragraph 22
-URI https://asc.fasb.org/extlink&oid=126901519&loc=d3e8736-108599
| Name: |
us-gaap_OperatingIncomeLoss |
| Namespace Prefix: |
us-gaap_ |
| Data Type: |
xbrli:monetaryItemType |
| Balance Type: |
credit |
| Period Type: |
duration |
|
| X |
- DefinitionAmount of income (expense) related to nonoperating activities, classified as other. Reference 1: http://fasb.org/us-gaap/role/ref/legacyRef
-Publisher FASB
-Name Accounting Standards Codification
-Topic 220
-SubTopic 10
-Section S99
-Paragraph 2
-Subparagraph (SX 210.5-03.9)
-URI https://asc.fasb.org/extlink&oid=126953954&loc=SL114868664-224227
| Name: |
us-gaap_OtherNonoperatingIncomeExpense |
| Namespace Prefix: |
us-gaap_ |
| Data Type: |
xbrli:monetaryItemType |
| Balance Type: |
credit |
| Period Type: |
duration |
|
| X |
- DefinitionAmount of expense (reversal of expense) for expected credit loss on accounts receivable. Reference 1: http://www.xbrl.org/2003/role/disclosureRef
-Publisher FASB
-Name Accounting Standards Codification
-Topic 326
-SubTopic 20
-Section 50
-Paragraph 13
-Subparagraph (b)
-URI https://asc.fasb.org/extlink&oid=124255953&loc=SL82919249-210447
Reference 2: http://www.xbrl.org/2003/role/disclosureRef
-Publisher FASB
-Name Accounting Standards Codification
-Topic 220
-SubTopic 10
-Section S99
-Paragraph 2
-Subparagraph (SX 210.5-03(5))
-URI https://asc.fasb.org/extlink&oid=126953954&loc=SL114868664-224227
| Name: |
us-gaap_ProvisionForDoubtfulAccounts |
| Namespace Prefix: |
us-gaap_ |
| Data Type: |
xbrli:monetaryItemType |
| Balance Type: |
debit |
| Period Type: |
duration |
|
| X |
- DefinitionThe aggregate costs incurred (1) in a planned search or critical investigation aimed at discovery of new knowledge with the hope that such knowledge will be useful in developing a new product or service, a new process or technique, or in bringing about a significant improvement to an existing product or process; or (2) to translate research findings or other knowledge into a plan or design for a new product or process or for a significant improvement to an existing product or process whether intended for sale or the entity's use, during the reporting period charged to research and development projects, including the costs of developing computer software up to the point in time of achieving technological feasibility, and costs allocated in accounting for a business combination to in-process projects deemed to have no alternative future use. Reference 1: http://www.xbrl.org/2009/role/commonPracticeRef
-Publisher FASB
-Name Accounting Standards Codification
-Topic 912
-SubTopic 730
-Section 25
-Paragraph 1
-URI https://asc.fasb.org/extlink&oid=6472174&loc=d3e58812-109433
Reference 2: http://fasb.org/us-gaap/role/ref/legacyRef
-Publisher FASB
-Name Accounting Standards Codification
-Topic 985
-SubTopic 20
-Section 50
-Paragraph 1
-URI https://asc.fasb.org/extlink&oid=6501960&loc=d3e128462-111756
Reference 3: http://fasb.org/us-gaap/role/ref/legacyRef
-Publisher FASB
-Name Accounting Standards Codification
-Topic 730
-SubTopic 10
-Section 50
-Paragraph 1
-URI https://asc.fasb.org/extlink&oid=6420194&loc=d3e21568-108373
| Name: |
us-gaap_ResearchAndDevelopmentExpense |
| Namespace Prefix: |
us-gaap_ |
| Data Type: |
xbrli:monetaryItemType |
| Balance Type: |
debit |
| Period Type: |
duration |
|
| X |
- DefinitionAmount, excluding tax collected from customer, of revenue from satisfaction of performance obligation by transferring promised good or service to customer. Tax collected from customer is tax assessed by governmental authority that is both imposed on and concurrent with specific revenue-producing transaction, including, but not limited to, sales, use, value added and excise. Reference 1: http://www.xbrl.org/2003/role/disclosureRef
-Publisher FASB
-Name Accounting Standards Codification
-Topic 280
-SubTopic 10
-Section 50
-Paragraph 30
-Subparagraph (a)
-URI https://asc.fasb.org/extlink&oid=126901519&loc=d3e8906-108599
Reference 2: http://www.xbrl.org/2003/role/disclosureRef
-Publisher FASB
-Name Accounting Standards Codification
-Topic 280
-SubTopic 10
-Section 50
-Paragraph 40
-URI https://asc.fasb.org/extlink&oid=126901519&loc=d3e9031-108599
Reference 3: http://www.xbrl.org/2003/role/disclosureRef
-Publisher FASB
-Name Accounting Standards Codification
-Topic 280
-SubTopic 10
-Section 50
-Paragraph 41
-Subparagraph (a)
-URI https://asc.fasb.org/extlink&oid=126901519&loc=d3e9038-108599
Reference 4: http://www.xbrl.org/2003/role/disclosureRef
-Publisher FASB
-Name Accounting Standards Codification
-Topic 280
-SubTopic 10
-Section 50
-Paragraph 32
-Subparagraph (b)
-URI https://asc.fasb.org/extlink&oid=126901519&loc=d3e8933-108599
Reference 5: http://www.xbrl.org/2003/role/disclosureRef
-Publisher FASB
-Name Accounting Standards Codification
-Topic 280
-SubTopic 10
-Section 50
-Paragraph 32
-Subparagraph (a)
-URI https://asc.fasb.org/extlink&oid=126901519&loc=d3e8933-108599
Reference 6: http://www.xbrl.org/2003/role/disclosureRef
-Publisher FASB
-Name Accounting Standards Codification
-Topic 606
-SubTopic 10
-Section 50
-Paragraph 4
-Subparagraph (a)
-URI https://asc.fasb.org/extlink&oid=126920106&loc=SL49130543-203045
Reference 7: http://www.xbrl.org/2003/role/disclosureRef
-Publisher FASB
-Name Accounting Standards Codification
-Topic 280
-SubTopic 10
-Section 50
-Paragraph 22
-Subparagraph (b)
-URI https://asc.fasb.org/extlink&oid=126901519&loc=d3e8736-108599
Reference 8: http://www.xbrl.org/2003/role/disclosureRef
-Publisher FASB
-Name Accounting Standards Codification
-Topic 280
-SubTopic 10
-Section 50
-Paragraph 22
-Subparagraph (a)
-URI https://asc.fasb.org/extlink&oid=126901519&loc=d3e8736-108599
Reference 9: http://www.xbrl.org/2003/role/disclosureRef
-Publisher FASB
-Name Accounting Standards Codification
-Topic 280
-SubTopic 10
-Section 50
-Paragraph 42
-URI https://asc.fasb.org/extlink&oid=126901519&loc=d3e9054-108599
Reference 10: http://www.xbrl.org/2003/role/disclosureRef
-Publisher FASB
-Name Accounting Standards Codification
-Topic 606
-SubTopic 10
-Section 50
-Paragraph 5
-URI https://asc.fasb.org/extlink&oid=126920106&loc=SL49130545-203045
Reference 11: http://www.xbrl.org/2003/role/disclosureRef
-Publisher FASB
-Name Accounting Standards Codification
-Topic 924
-SubTopic 10
-Section S99
-Paragraph 1
-Subparagraph (SAB Topic 11.L)
-URI https://asc.fasb.org/extlink&oid=6472922&loc=d3e499488-122856
| Name: |
us-gaap_RevenueFromContractWithCustomerExcludingAssessedTax |
| Namespace Prefix: |
us-gaap_ |
| Data Type: |
xbrli:monetaryItemType |
| Balance Type: |
credit |
| Period Type: |
duration |
|
| X |
- DefinitionAmount of noncash expense for share-based payment arrangement. Reference 1: http://fasb.org/us-gaap/role/ref/legacyRef
-Publisher FASB
-Name Accounting Standards Codification
-Topic 230
-SubTopic 10
-Section 45
-Paragraph 28
-Subparagraph (a)
-URI https://asc.fasb.org/extlink&oid=126954810&loc=d3e3602-108585
| Name: |
us-gaap_ShareBasedCompensation |
| Namespace Prefix: |
us-gaap_ |
| Data Type: |
xbrli:monetaryItemType |
| Balance Type: |
debit |
| Period Type: |
duration |
|
| X |
- References
+ Details
| Name: |
us-gaap_WeightedAverageNumberOfSharesOutstandingAbstract |
| Namespace Prefix: |
us-gaap_ |
| Data Type: |
xbrli:stringItemType |
| Balance Type: |
na |
| Period Type: |
duration |
|
| X |
- DefinitionNumber of [basic] shares or units, after adjustment for contingently issuable shares or units and other shares or units not deemed outstanding, determined by relating the portion of time within a reporting period that common shares or units have been outstanding to the total time in that period. Reference 1: http://www.xbrl.org/2003/role/disclosureRef
-Publisher FASB
-Name Accounting Standards Codification
-Topic 260
-SubTopic 10
-Section 50
-Paragraph 1
-Subparagraph (a)
-URI https://asc.fasb.org/extlink&oid=124432515&loc=d3e3550-109257
Reference 2: http://www.xbrl.org/2003/role/disclosureRef
-Publisher FASB
-Name Accounting Standards Codification
-Topic 260
-SubTopic 10
-Section 45
-Paragraph 10
-URI https://asc.fasb.org/extlink&oid=126958026&loc=d3e1448-109256
| Name: |
us-gaap_WeightedAverageNumberOfSharesOutstandingBasic |
| Namespace Prefix: |
us-gaap_ |
| Data Type: |
xbrli:sharesItemType |
| Balance Type: |
na |
| Period Type: |
duration |
|
v3.23.2
Consolidated Statements of Comprehensive Loss - USD ($)
|
12 Months Ended |
Dec. 31, 2022 |
Dec. 31, 2021 |
| Income Statement [Abstract] |
|
|
| Net loss |
$ (7,547,391)
|
$ (6,384,655)
|
| Other comprehensive income (loss) |
|
|
| Foreign currency translation adjustments |
56,029
|
37,477
|
| Comprehensive loss |
$ (7,491,362)
|
$ (6,347,178)
|
| X |
- DefinitionAmount after tax of increase (decrease) in equity from transactions and other events and circumstances from net income and other comprehensive income, attributable to parent entity. Excludes changes in equity resulting from investments by owners and distributions to owners. Reference 1: http://www.xbrl.org/2003/role/disclosureRef
-Publisher FASB
-Name Accounting Standards Codification
-Topic 944
-SubTopic 220
-Section S99
-Paragraph 1
-Subparagraph (SX 210.7-04(22))
-URI https://asc.fasb.org/extlink&oid=120400993&loc=SL114874131-224263
Reference 2: http://www.xbrl.org/2003/role/disclosureRef
-Publisher FASB
-Name Accounting Standards Codification
-Topic 220
-SubTopic 10
-Section S99
-Paragraph 2
-Subparagraph (SX 210.5-03(24))
-URI https://asc.fasb.org/extlink&oid=126953954&loc=SL114868664-224227
Reference 3: http://fasb.org/us-gaap/role/ref/legacyRef
-Publisher FASB
-Name Accounting Standards Codification
-Topic 220
-SubTopic 10
-Section 45
-Paragraph 5
-URI https://asc.fasb.org/extlink&oid=126968391&loc=d3e557-108580
Reference 4: http://www.xbrl.org/2003/role/disclosureRef
-Publisher FASB
-Name Accounting Standards Codification
-Topic 942
-SubTopic 220
-Section S99
-Paragraph 1
-Subparagraph (SX 210.9-04(26))
-URI https://asc.fasb.org/extlink&oid=120399700&loc=SL114874048-224260
Reference 5: http://www.xbrl.org/2003/role/disclosureRef
-Publisher FASB
-Name Accounting Standards Codification
-Topic 220
-SubTopic 10
-Section 45
-Paragraph 1B
-Subparagraph (b)
-URI https://asc.fasb.org/extlink&oid=126968391&loc=SL7669625-108580
Reference 6: http://www.xbrl.org/2003/role/disclosureRef
-Publisher FASB
-Name Accounting Standards Codification
-Topic 220
-SubTopic 10
-Section 45
-Paragraph 1A
-Subparagraph (c)
-URI https://asc.fasb.org/extlink&oid=126968391&loc=SL7669619-108580
| Name: |
us-gaap_ComprehensiveIncomeNetOfTax |
| Namespace Prefix: |
us-gaap_ |
| Data Type: |
xbrli:monetaryItemType |
| Balance Type: |
credit |
| Period Type: |
duration |
|
| X |
- References
+ Details
| Name: |
us-gaap_ComprehensiveIncomeNetOfTaxAbstract |
| Namespace Prefix: |
us-gaap_ |
| Data Type: |
xbrli:stringItemType |
| Balance Type: |
na |
| Period Type: |
duration |
|
| X |
- References
+ Details
| Name: |
us-gaap_IncomeStatementAbstract |
| Namespace Prefix: |
us-gaap_ |
| Data Type: |
xbrli:stringItemType |
| Balance Type: |
na |
| Period Type: |
duration |
|
| X |
- DefinitionThe portion of profit or loss for the period, net of income taxes, which is attributable to the parent. Reference 1: http://fasb.org/us-gaap/role/ref/legacyRef
-Publisher FASB
-Name Accounting Standards Codification
-Topic 942
-SubTopic 220
-Section S99
-Paragraph 1
-Subparagraph (SX 210.9-04(22))
-URI https://asc.fasb.org/extlink&oid=120399700&loc=SL114874048-224260
Reference 2: http://www.xbrl.org/2003/role/disclosureRef
-Publisher FASB
-Name Accounting Standards Codification
-Topic 280
-SubTopic 10
-Section 50
-Paragraph 32
-Subparagraph (f)
-URI https://asc.fasb.org/extlink&oid=126901519&loc=d3e8933-108599
Reference 3: http://www.xbrl.org/2003/role/disclosureRef
-Publisher FASB
-Name Accounting Standards Codification
-Topic 250
-SubTopic 10
-Section 50
-Paragraph 4
-URI https://asc.fasb.org/extlink&oid=124431687&loc=d3e22595-107794
Reference 4: http://fasb.org/us-gaap/role/ref/legacyRef
-Publisher FASB
-Name Accounting Standards Codification
-Topic 944
-SubTopic 220
-Section S99
-Paragraph 1
-Subparagraph (SX 210.7-04(18))
-URI https://asc.fasb.org/extlink&oid=120400993&loc=SL114874131-224263
Reference 5: http://www.xbrl.org/2003/role/disclosureRef
-Publisher FASB
-Name Accounting Standards Codification
-Topic 815
-SubTopic 40
-Section 65
-Paragraph 1
-Subparagraph (f)
-URI https://asc.fasb.org/extlink&oid=126732423&loc=SL123482106-238011
Reference 6: http://www.xbrl.org/2003/role/disclosureRef
-Publisher FASB
-Name Accounting Standards Codification
-Topic 220
-SubTopic 10
-Section 50
-Paragraph 6
-URI https://asc.fasb.org/extlink&oid=124431353&loc=SL124452729-227067
Reference 7: http://www.xbrl.org/2003/role/disclosureRef
-Publisher FASB
-Name Accounting Standards Codification
-Topic 470
-SubTopic 10
-Section S99
-Paragraph 1B
-Subparagraph (SX 210.13-02(a)(5))
-URI https://asc.fasb.org/extlink&oid=126975872&loc=SL124442552-122756
Reference 8: http://fasb.org/us-gaap/role/ref/legacyRef
-Publisher FASB
-Name Accounting Standards Codification
-Topic 220
-SubTopic 10
-Section S99
-Paragraph 2
-Subparagraph (SX 210.5-03(20))
-URI https://asc.fasb.org/extlink&oid=126953954&loc=SL114868664-224227
Reference 9: http://fasb.org/us-gaap/role/ref/legacyRef
-Publisher FASB
-Name Accounting Standards Codification
-Topic 230
-SubTopic 10
-Section 45
-Paragraph 28
-URI https://asc.fasb.org/extlink&oid=126954810&loc=d3e3602-108585
Reference 10: http://www.xbrl.org/2003/role/disclosureRef
-Publisher FASB
-Name Accounting Standards Codification
-Topic 250
-SubTopic 10
-Section 50
-Paragraph 1
-Subparagraph (b)(2)
-URI https://asc.fasb.org/extlink&oid=124431687&loc=d3e22499-107794
Reference 11: http://www.xbrl.org/2003/role/disclosureRef
-Publisher FASB
-Name Accounting Standards Codification
-Topic 470
-SubTopic 10
-Section S99
-Paragraph 1A
-Subparagraph (SX 210.13-01(a)(4)(iv))
-URI https://asc.fasb.org/extlink&oid=126975872&loc=SL124442526-122756
Reference 12: http://www.xbrl.org/2003/role/disclosureRef
-Publisher FASB
-Name Accounting Standards Codification
-Topic 470
-SubTopic 10
-Section S99
-Paragraph 1A
-Subparagraph (SX 210.13-01(a)(4)(iii)(A))
-URI https://asc.fasb.org/extlink&oid=126975872&loc=SL124442526-122756
Reference 13: http://www.xbrl.org/2003/role/disclosureRef
-Publisher FASB
-Name Accounting Standards Codification
-Topic 470
-SubTopic 10
-Section S99
-Paragraph 1B
-Subparagraph (SX 210.13-02(a)(4)(i))
-URI https://asc.fasb.org/extlink&oid=126975872&loc=SL124442552-122756
Reference 14: http://www.xbrl.org/2003/role/disclosureRef
-Publisher FASB
-Name Accounting Standards Codification
-Topic 470
-SubTopic 10
-Section S99
-Paragraph 1A
-Subparagraph (SX 210.13-01(a)(4)(i))
-URI https://asc.fasb.org/extlink&oid=126975872&loc=SL124442526-122756
Reference 15: http://www.xbrl.org/2003/role/disclosureRef
-Publisher FASB
-Name Accounting Standards Codification
-Topic 250
-SubTopic 10
-Section 50
-Paragraph 9
-URI https://asc.fasb.org/extlink&oid=124431687&loc=d3e22663-107794
Reference 16: http://www.xbrl.org/2003/role/disclosureRef
-Publisher FASB
-Name Accounting Standards Codification
-Topic 470
-SubTopic 10
-Section S99
-Paragraph 1B
-Subparagraph (SX 210.13-02(a)(4)(iv))
-URI https://asc.fasb.org/extlink&oid=126975872&loc=SL124442552-122756
Reference 17: http://www.xbrl.org/2009/role/commonPracticeRef
-Publisher FASB
-Name Accounting Standards Codification
-Topic 470
-SubTopic 10
-Section S99
-Paragraph 1A
-Subparagraph (SX 210.13-01(a)(4)(ii))
-URI https://asc.fasb.org/extlink&oid=126975872&loc=SL124442526-122756
Reference 18: http://www.xbrl.org/2003/role/disclosureRef
-Publisher FASB
-Name Accounting Standards Codification
-Topic 825
-SubTopic 10
-Section 50
-Paragraph 28
-Subparagraph (f)
-URI https://asc.fasb.org/extlink&oid=123596393&loc=d3e14064-108612
Reference 19: http://www.xbrl.org/2003/role/disclosureRef
-Publisher FASB
-Name Accounting Standards Codification
-Topic 250
-SubTopic 10
-Section 50
-Paragraph 3
-URI https://asc.fasb.org/extlink&oid=124431687&loc=d3e22583-107794
Reference 20: http://www.xbrl.org/2003/role/disclosureRef
-Publisher FASB
-Name Accounting Standards Codification
-Topic 235
-SubTopic 10
-Section S99
-Paragraph 1
-Subparagraph (SX 210.4-08(g)(1)(ii))
-URI https://asc.fasb.org/extlink&oid=120395691&loc=d3e23780-122690
Reference 21: http://www.xbrl.org/2003/role/disclosureRef
-Publisher FASB
-Name Accounting Standards Codification
-Topic 260
-SubTopic 10
-Section 45
-Paragraph 60B
-Subparagraph (a)
-URI https://asc.fasb.org/extlink&oid=126958026&loc=SL5780133-109256
Reference 22: http://www.xbrl.org/2003/role/disclosureRef
-Publisher FASB
-Name Accounting Standards Codification
-Topic 323
-SubTopic 10
-Section 50
-Paragraph 3
-Subparagraph (c)
-URI https://asc.fasb.org/extlink&oid=114001798&loc=d3e33918-111571
Reference 23: http://www.xbrl.org/2003/role/disclosureRef
-Publisher FASB
-Name Accounting Standards Codification
-Topic 250
-SubTopic 10
-Section 50
-Paragraph 8
-URI https://asc.fasb.org/extlink&oid=124431687&loc=d3e22658-107794
Reference 24: http://www.xbrl.org/2003/role/disclosureRef
-Publisher FASB
-Name Accounting Standards Codification
-Topic 220
-SubTopic 10
-Section 45
-Paragraph 1A
-Subparagraph (a)
-URI https://asc.fasb.org/extlink&oid=126968391&loc=SL7669619-108580
Reference 25: http://www.xbrl.org/2003/role/exampleRef
-Publisher FASB
-Name Accounting Standards Codification
-Topic 280
-SubTopic 10
-Section 50
-Paragraph 31
-URI https://asc.fasb.org/extlink&oid=126901519&loc=d3e8924-108599
Reference 26: http://www.xbrl.org/2003/role/disclosureRef
-Publisher FASB
-Name Accounting Standards Codification
-Topic 250
-SubTopic 10
-Section 50
-Paragraph 11
-Subparagraph (b)
-URI https://asc.fasb.org/extlink&oid=124431687&loc=d3e22694-107794
Reference 27: http://www.xbrl.org/2003/role/disclosureRef
-Publisher FASB
-Name Accounting Standards Codification
-Topic 250
-SubTopic 10
-Section 50
-Paragraph 11
-Subparagraph (a)
-URI https://asc.fasb.org/extlink&oid=124431687&loc=d3e22694-107794
Reference 28: http://www.xbrl.org/2003/role/disclosureRef
-Publisher FASB
-Name Accounting Standards Codification
-Topic 205
-SubTopic 20
-Section 50
-Paragraph 7
-URI https://asc.fasb.org/extlink&oid=109222650&loc=SL51721683-107760
Reference 29: http://www.xbrl.org/2003/role/disclosureRef
-Publisher FASB
-Name Accounting Standards Codification
-Topic 220
-SubTopic 10
-Section 45
-Paragraph 1B
-Subparagraph (a)
-URI https://asc.fasb.org/extlink&oid=126968391&loc=SL7669625-108580
Reference 30: http://www.xbrl.org/2003/role/disclosureRef
-Publisher FASB
-Name Accounting Standards Codification
-Topic 280
-SubTopic 10
-Section 50
-Paragraph 22
-URI https://asc.fasb.org/extlink&oid=126901519&loc=d3e8736-108599
Reference 31: http://www.xbrl.org/2003/role/disclosureRef
-Publisher FASB
-Name Accounting Standards Codification
-Topic 470
-SubTopic 10
-Section S99
-Paragraph 1A
-Subparagraph (SX 210.13-01(a)(5))
-URI https://asc.fasb.org/extlink&oid=126975872&loc=SL124442526-122756
Reference 32: http://www.xbrl.org/2003/role/disclosureRef
-Publisher FASB
-Name Accounting Standards Codification
-Topic 470
-SubTopic 10
-Section S99
-Paragraph 1B
-Subparagraph (SX 210.13-02(a)(4)(iii)(B))
-URI https://asc.fasb.org/extlink&oid=126975872&loc=SL124442552-122756
Reference 33: http://www.xbrl.org/2003/role/disclosureRef
-Publisher FASB
-Name Accounting Standards Codification
-Topic 470
-SubTopic 10
-Section S99
-Paragraph 1B
-Subparagraph (SX 210.13-02(a)(4)(iii)(A))
-URI https://asc.fasb.org/extlink&oid=126975872&loc=SL124442552-122756
Reference 34: http://www.xbrl.org/2003/role/disclosureRef
-Publisher FASB
-Name Accounting Standards Codification
-Topic 280
-SubTopic 10
-Section 50
-Paragraph 30
-Subparagraph (b)
-URI https://asc.fasb.org/extlink&oid=126901519&loc=d3e8906-108599
Reference 35: http://www.xbrl.org/2003/role/disclosureRef
-Publisher FASB
-Name Accounting Standards Codification
-Topic 280
-SubTopic 10
-Section 50
-Paragraph 32
-Subparagraph (c)
-URI https://asc.fasb.org/extlink&oid=126901519&loc=d3e8933-108599
| Name: |
us-gaap_NetIncomeLoss |
| Namespace Prefix: |
us-gaap_ |
| Data Type: |
xbrli:monetaryItemType |
| Balance Type: |
credit |
| Period Type: |
duration |
|
| X |
- DefinitionAmount after tax and reclassification adjustments of gain (loss) on foreign currency translation adjustments, foreign currency transactions designated and effective as economic hedges of a net investment in a foreign entity and intra-entity foreign currency transactions that are of a long-term-investment nature. Reference 1: http://fasb.org/us-gaap/role/ref/legacyRef
-Publisher FASB
-Name Accounting Standards Codification
-Topic 220
-SubTopic 10
-Section 45
-Paragraph 10A
-Subparagraph (a)
-URI https://asc.fasb.org/extlink&oid=126968391&loc=SL7669646-108580
| Name: |
us-gaap_OtherComprehensiveIncomeLossForeignCurrencyTransactionAndTranslationAdjustmentNetOfTax |
| Namespace Prefix: |
us-gaap_ |
| Data Type: |
xbrli:monetaryItemType |
| Balance Type: |
credit |
| Period Type: |
duration |
|
v3.23.2
Consolidated Statements of Stockholders' Deficit - USD ($)
|
Common Stock [Member] |
Additional Paid-in Capital [Member] |
Discount On Common Stock [Member] |
Common Stock To Be Issued [Member] |
Obligation To Issue Warrants [Member] |
Preferred Stock [Member] |
Preferred Stock Additional Paid In Capital [Member] |
Preferred Stock Equity To Be Issued [Member] |
AOCI Attributable to Parent [Member] |
Retained Earnings [Member] |
Total |
| Balance, value at Dec. 31, 2020 |
$ 94,018
|
$ 43,299,937
|
$ (69,838)
|
$ 1,436,044
|
$ 163,998
|
$ 200
|
$ 744,480
|
$ 1,340,000
|
$ 1,252,082
|
$ (51,310,040)
|
$ (3,049,119)
|
| Balance, shares at Dec. 31, 2020 |
95,765,736
|
|
|
|
|
200,508
|
|
|
|
|
|
| Shares issued for debt settlement |
$ 8,854
|
1,618,425
|
|
(1,436,044)
|
|
|
|
|
|
|
191,235
|
| Shares issued for debt settlement, shares |
8,968,975
|
|
|
|
|
|
|
|
|
|
|
| Shares and warrants issued for services |
$ 2,430
|
1,805,704
|
|
19,647
|
97,936
|
|
|
|
|
|
1,925,717
|
| Shares and warrants issued for services, shares |
2,430,000
|
|
|
|
|
|
|
|
|
|
|
| Cancellation of shares due to duplicate issuance |
|
|
|
|
|
|
|
|
|
|
|
| Cancellation of shares due to duplicate issuance, shares |
(1,866,288)
|
|
|
|
|
(45)
|
|
|
|
|
|
| Preferred shares issued for services |
|
|
|
|
|
|
2,189,600
|
(1,340,000)
|
|
|
849,600
|
| Preferred shares issued for services, shares |
|
|
|
|
|
116
|
|
|
|
|
|
| Shares issued on conversion of preferred shares |
$ 23,048
|
3,799,852
|
|
|
|
|
(1,734,800)
|
|
|
|
2,088,100
|
| Shares issued on conversion of preferred shares, shares |
23,046,760
|
|
|
|
|
(125)
|
|
|
|
|
|
| Dividends to be settled with preferred shares |
|
(455,500)
|
|
|
|
|
|
|
|
|
(455,500)
|
| Net loss for the period |
|
|
|
|
|
|
|
|
37,477
|
(6,384,655)
|
(6,347,178)
|
| Balance, value at Dec. 31, 2021 |
$ 128,350
|
50,068,418
|
(69,838)
|
19,647
|
261,934
|
$ 200
|
1,199,280
|
|
1,289,559
|
(57,694,695)
|
(4,797,145)
|
| Balance, shares at Dec. 31, 2021 |
128,345,183
|
|
|
|
|
200,454
|
|
|
|
|
|
| Shares and warrants issued for services |
$ 1,160
|
105,600
|
|
(19,647)
|
|
|
1,887,700
|
|
|
|
1,974,813
|
| Shares and warrants issued for services, shares |
1,160,000
|
|
|
|
|
326
|
|
|
|
|
|
| Shares issued on conversion of preferred shares |
$ 15,925
|
286,632
|
|
|
|
|
|
|
|
|
302,557
|
| Shares issued on conversion of preferred shares, shares |
15,924,810
|
|
|
|
|
|
|
|
|
|
|
| Net loss for the period |
|
|
|
|
|
|
|
|
56,029
|
(7,547,391)
|
(7,491,362)
|
| Dividends |
|
455,500
|
|
|
|
|
|
|
|
|
455,500
|
| Balance, value at Dec. 31, 2022 |
$ 145,435
|
$ 50,916,150
|
$ (69,838)
|
|
$ 261,934
|
$ 200
|
$ 3,086,980
|
|
$ 1,345,588
|
$ (65,242,086)
|
$ (9,555,637)
|
| Balance, shares at Dec. 31, 2022 |
145,429,993
|
|
|
|
|
200,780
|
|
|
|
|
|
| X |
- DefinitionDividends to be settled with preferred shares.
| Name: |
DSGT_DividendsToBeSettledWithPreferredShares |
| Namespace Prefix: |
DSGT_ |
| Data Type: |
xbrli:monetaryItemType |
| Balance Type: |
credit |
| Period Type: |
duration |
|
| X |
- DefinitionStock issued during period shares and warrants issued for services.
| Name: |
DSGT_StockIssuedDuringPeriodSharesAndWarrantsIssuedForServices |
| Namespace Prefix: |
DSGT_ |
| Data Type: |
xbrli:sharesItemType |
| Balance Type: |
na |
| Period Type: |
duration |
|
| X |
- DefinitionStock issued during period shares cancellation of shares due to duplicate issuance.
| Name: |
DSGT_StockIssuedDuringPeriodSharesCancellationOfSharesDueToDuplicateIssuance |
| Namespace Prefix: |
DSGT_ |
| Data Type: |
xbrli:sharesItemType |
| Balance Type: |
na |
| Period Type: |
duration |
|
| X |
- DefinitionStock issued during period value cancellation of shares due to duplicate issuance.
| Name: |
DSGT_StockIssuedDuringPeriodValueCancellationOfSharesDueToDuplicateIssuance |
| Namespace Prefix: |
DSGT_ |
| Data Type: |
xbrli:monetaryItemType |
| Balance Type: |
credit |
| Period Type: |
duration |
|
| X |
- DefinitionStock issued during period value shares and warrants issued for services.
| Name: |
DSGT_StockIssuedDuringPeriodValueSharesAndWarrantsIssuedForServices |
| Namespace Prefix: |
DSGT_ |
| Data Type: |
xbrli:monetaryItemType |
| Balance Type: |
credit |
| Period Type: |
duration |
|
| X |
- DefinitionAmount after tax of increase (decrease) in equity from transactions and other events and circumstances from net income and other comprehensive income, attributable to parent entity. Excludes changes in equity resulting from investments by owners and distributions to owners. Reference 1: http://www.xbrl.org/2003/role/disclosureRef
-Publisher FASB
-Name Accounting Standards Codification
-Topic 944
-SubTopic 220
-Section S99
-Paragraph 1
-Subparagraph (SX 210.7-04(22))
-URI https://asc.fasb.org/extlink&oid=120400993&loc=SL114874131-224263
Reference 2: http://www.xbrl.org/2003/role/disclosureRef
-Publisher FASB
-Name Accounting Standards Codification
-Topic 220
-SubTopic 10
-Section S99
-Paragraph 2
-Subparagraph (SX 210.5-03(24))
-URI https://asc.fasb.org/extlink&oid=126953954&loc=SL114868664-224227
Reference 3: http://fasb.org/us-gaap/role/ref/legacyRef
-Publisher FASB
-Name Accounting Standards Codification
-Topic 220
-SubTopic 10
-Section 45
-Paragraph 5
-URI https://asc.fasb.org/extlink&oid=126968391&loc=d3e557-108580
Reference 4: http://www.xbrl.org/2003/role/disclosureRef
-Publisher FASB
-Name Accounting Standards Codification
-Topic 942
-SubTopic 220
-Section S99
-Paragraph 1
-Subparagraph (SX 210.9-04(26))
-URI https://asc.fasb.org/extlink&oid=120399700&loc=SL114874048-224260
Reference 5: http://www.xbrl.org/2003/role/disclosureRef
-Publisher FASB
-Name Accounting Standards Codification
-Topic 220
-SubTopic 10
-Section 45
-Paragraph 1B
-Subparagraph (b)
-URI https://asc.fasb.org/extlink&oid=126968391&loc=SL7669625-108580
Reference 6: http://www.xbrl.org/2003/role/disclosureRef
-Publisher FASB
-Name Accounting Standards Codification
-Topic 220
-SubTopic 10
-Section 45
-Paragraph 1A
-Subparagraph (c)
-URI https://asc.fasb.org/extlink&oid=126968391&loc=SL7669619-108580
| Name: |
us-gaap_ComprehensiveIncomeNetOfTax |
| Namespace Prefix: |
us-gaap_ |
| Data Type: |
xbrli:monetaryItemType |
| Balance Type: |
credit |
| Period Type: |
duration |
|
| X |
- DefinitionNumber of shares issued which are neither cancelled nor held in the treasury.
| Name: |
us-gaap_SharesOutstanding |
| Namespace Prefix: |
us-gaap_ |
| Data Type: |
xbrli:sharesItemType |
| Balance Type: |
na |
| Period Type: |
instant |
|
| X |
- DefinitionNumber of shares issued during the period as a result of the conversion of convertible securities. Reference 1: http://fasb.org/us-gaap/role/ref/legacyRef
-Publisher FASB
-Name Accounting Standards Codification
-Topic 505
-SubTopic 10
-Section S99
-Paragraph 1
-Subparagraph (SX 210.3-04)
-URI https://asc.fasb.org/extlink&oid=120397183&loc=d3e187085-122770
Reference 2: http://fasb.org/us-gaap/role/ref/legacyRef
-Publisher FASB
-Name Accounting Standards Codification
-Topic 210
-SubTopic 10
-Section S99
-Paragraph 1
-Subparagraph (SX 210.5-02.29-30)
-URI https://asc.fasb.org/extlink&oid=120391452&loc=d3e13212-122682
Reference 3: http://www.xbrl.org/2003/role/disclosureRef
-Publisher FASB
-Name Accounting Standards Codification
-Topic 470
-SubTopic 20
-Section 50
-Paragraph 1E
-Subparagraph (c)
-URI https://asc.fasb.org/extlink&oid=123466505&loc=SL123495348-112611
Reference 4: http://fasb.org/us-gaap/role/ref/legacyRef
-Publisher FASB
-Name Accounting Standards Codification
-Topic 505
-SubTopic 10
-Section 50
-Paragraph 3
-URI https://asc.fasb.org/extlink&oid=126973232&loc=d3e21475-112644
Reference 5: http://fasb.org/us-gaap/role/ref/legacyRef
-Publisher FASB
-Name Accounting Standards Codification
-Topic 505
-SubTopic 10
-Section 50
-Paragraph 2
-URI https://asc.fasb.org/extlink&oid=126973232&loc=d3e21463-112644
| Name: |
us-gaap_StockIssuedDuringPeriodSharesConversionOfConvertibleSecurities |
| Namespace Prefix: |
us-gaap_ |
| Data Type: |
xbrli:sharesItemType |
| Balance Type: |
na |
| Period Type: |
duration |
|
| X |
- DefinitionNumber of shares issued in lieu of cash for services contributed to the entity. Number of shares includes, but is not limited to, shares issued for services contributed by vendors and founders.
| Name: |
us-gaap_StockIssuedDuringPeriodSharesIssuedForServices |
| Namespace Prefix: |
us-gaap_ |
| Data Type: |
xbrli:sharesItemType |
| Balance Type: |
na |
| Period Type: |
duration |
|
| X |
- DefinitionNumber of shares of stock issued attributable to transactions classified as other.
| Name: |
us-gaap_StockIssuedDuringPeriodSharesOther |
| Namespace Prefix: |
us-gaap_ |
| Data Type: |
xbrli:sharesItemType |
| Balance Type: |
na |
| Period Type: |
duration |
|
| X |
- DefinitionThe gross value of stock issued during the period upon the conversion of convertible securities. Reference 1: http://fasb.org/us-gaap/role/ref/legacyRef
-Publisher FASB
-Name Accounting Standards Codification
-Topic 505
-SubTopic 10
-Section 50
-Paragraph 2
-URI https://asc.fasb.org/extlink&oid=126973232&loc=d3e21463-112644
Reference 2: http://fasb.org/us-gaap/role/ref/legacyRef
-Publisher FASB
-Name Accounting Standards Codification
-Topic 505
-SubTopic 10
-Section S99
-Paragraph 1
-Subparagraph (SX 210.3-04)
-URI https://asc.fasb.org/extlink&oid=120397183&loc=d3e187085-122770
Reference 3: http://fasb.org/us-gaap/role/ref/legacyRef
-Publisher FASB
-Name Accounting Standards Codification
-Topic 210
-SubTopic 10
-Section S99
-Paragraph 1
-Subparagraph (SX 210.5-02.29-31)
-URI https://asc.fasb.org/extlink&oid=120391452&loc=d3e13212-122682
| Name: |
us-gaap_StockIssuedDuringPeriodValueConversionOfConvertibleSecurities |
| Namespace Prefix: |
us-gaap_ |
| Data Type: |
xbrli:monetaryItemType |
| Balance Type: |
credit |
| Period Type: |
duration |
|
| X |
- DefinitionValue of stock issued in lieu of cash for services contributed to the entity. Value of the stock issued includes, but is not limited to, services contributed by vendors and founders.
| Name: |
us-gaap_StockIssuedDuringPeriodValueIssuedForServices |
| Namespace Prefix: |
us-gaap_ |
| Data Type: |
xbrli:monetaryItemType |
| Balance Type: |
credit |
| Period Type: |
duration |
|
| X |
- DefinitionValue of shares of stock issued attributable to transactions classified as other.
| Name: |
us-gaap_StockIssuedDuringPeriodValueOther |
| Namespace Prefix: |
us-gaap_ |
| Data Type: |
xbrli:monetaryItemType |
| Balance Type: |
credit |
| Period Type: |
duration |
|
| X |
- DefinitionValue of stock issued to shareholders as a dividend during the period. Reference 1: http://fasb.org/us-gaap/role/ref/legacyRef
-Publisher FASB
-Name Accounting Standards Codification
-Topic 505
-SubTopic 10
-Section S99
-Paragraph 1
-Subparagraph (SX 210.3-04)
-URI https://asc.fasb.org/extlink&oid=120397183&loc=d3e187085-122770
Reference 2: http://fasb.org/us-gaap/role/ref/legacyRef
-Publisher FASB
-Name Accounting Standards Codification
-Topic 210
-SubTopic 10
-Section S99
-Paragraph 1
-Subparagraph (SX 210.5-02.29-31)
-URI https://asc.fasb.org/extlink&oid=120391452&loc=d3e13212-122682
Reference 3: http://fasb.org/us-gaap/role/ref/legacyRef
-Publisher FASB
-Name Accounting Standards Codification
-Topic 505
-SubTopic 10
-Section 50
-Paragraph 2
-URI https://asc.fasb.org/extlink&oid=126973232&loc=d3e21463-112644
| Name: |
us-gaap_StockIssuedDuringPeriodValueStockDividend |
| Namespace Prefix: |
us-gaap_ |
| Data Type: |
xbrli:monetaryItemType |
| Balance Type: |
credit |
| Period Type: |
duration |
|
| X |
- DefinitionAmount of stockholders' equity (deficit), net of receivables from officers, directors, owners, and affiliates of the entity, attributable to both the parent and noncontrolling interests. Amount excludes temporary equity. Alternate caption for the concept is permanent equity. Reference 1: http://www.xbrl.org/2003/role/disclosureRef
-Publisher FASB
-Name Accounting Standards Codification
-Topic 250
-SubTopic 10
-Section 45
-Paragraph 24
-URI https://asc.fasb.org/extlink&oid=124436220&loc=d3e21930-107793
Reference 2: http://www.xbrl.org/2003/role/disclosureRef
-Publisher FASB
-Name Accounting Standards Codification
-Topic 505
-SubTopic 10
-Section S99
-Paragraph 1
-Subparagraph (SX 210.3-04)
-URI https://asc.fasb.org/extlink&oid=120397183&loc=d3e187085-122770
Reference 3: http://www.xbrl.org/2003/role/disclosureRef
-Publisher FASB
-Name Accounting Standards Codification
-Topic 250
-SubTopic 10
-Section 45
-Paragraph 23
-Subparagraph (b)
-URI https://asc.fasb.org/extlink&oid=124436220&loc=d3e21914-107793
Reference 4: http://www.xbrl.org/2003/role/disclosureRef
-Publisher FASB
-Name Accounting Standards Codification
-Topic 250
-SubTopic 10
-Section 50
-Paragraph 7
-Subparagraph (b)
-URI https://asc.fasb.org/extlink&oid=124431687&loc=d3e22644-107794
Reference 5: http://www.xbrl.org/2003/role/disclosureRef
-Publisher FASB
-Name Accounting Standards Codification
-Topic 220
-SubTopic 10
-Section 50
-Paragraph 5
-URI https://asc.fasb.org/extlink&oid=124431353&loc=SL124442411-227067
Reference 6: http://www.xbrl.org/2003/role/disclosureRef
-Publisher FASB
-Name Accounting Standards Codification
-Topic 326
-SubTopic 10
-Section 65
-Paragraph 4
-Subparagraph (d)
-URI https://asc.fasb.org/extlink&oid=122640432&loc=SL121648383-210437
Reference 7: http://www.xbrl.org/2003/role/disclosureRef
-Publisher FASB
-Name Accounting Standards Codification
-Topic 105
-SubTopic 10
-Section 65
-Paragraph 6
-Subparagraph (c)
-URI https://asc.fasb.org/extlink&oid=126987489&loc=SL124442142-165695
Reference 8: http://www.xbrl.org/2003/role/disclosureRef
-Publisher FASB
-Name Accounting Standards Codification
-Topic 105
-SubTopic 10
-Section 65
-Paragraph 6
-Subparagraph (d)
-URI https://asc.fasb.org/extlink&oid=126987489&loc=SL124442142-165695
Reference 9: http://fasb.org/us-gaap/role/ref/legacyRef
-Publisher FASB
-Name Accounting Standards Codification
-Topic 810
-SubTopic 10
-Section 45
-Paragraph 16
-URI https://asc.fasb.org/extlink&oid=126929396&loc=SL4568740-111683
Reference 10: http://www.xbrl.org/2003/role/disclosureRef
-Publisher FASB
-Name Accounting Standards Codification
-Topic 815
-SubTopic 40
-Section 65
-Paragraph 1
-Subparagraph (e)(3)
-URI https://asc.fasb.org/extlink&oid=126732423&loc=SL123482106-238011
Reference 11: http://www.xbrl.org/2009/role/commonPracticeRef
-Publisher FASB
-Name Accounting Standards Codification
-Topic 825
-SubTopic 10
-Section 50
-Paragraph 28
-Subparagraph (f)
-URI https://asc.fasb.org/extlink&oid=123596393&loc=d3e14064-108612
Reference 12: http://www.xbrl.org/2003/role/disclosureRef
-Publisher FASB
-Name Accounting Standards Codification
-Topic 250
-SubTopic 10
-Section 45
-Paragraph 5
-Subparagraph (b)
-URI https://asc.fasb.org/extlink&oid=124436220&loc=d3e21711-107793
Reference 13: http://www.xbrl.org/2009/role/commonPracticeRef
-Publisher FASB
-Name Accounting Standards Codification
-Topic 323
-SubTopic 10
-Section 50
-Paragraph 3
-Subparagraph (c)
-URI https://asc.fasb.org/extlink&oid=114001798&loc=d3e33918-111571
Reference 14: http://www.xbrl.org/2009/role/commonPracticeRef
-Publisher FASB
-Name Accounting Standards Codification
-Topic 235
-SubTopic 10
-Section S99
-Paragraph 1
-Subparagraph (SX 210.4-08(g)(1)(ii))
-URI https://asc.fasb.org/extlink&oid=120395691&loc=d3e23780-122690
Reference 15: http://www.xbrl.org/2003/role/disclosureRef
-Publisher FASB
-Name Accounting Standards Codification
-Topic 830
-SubTopic 30
-Section 50
-Paragraph 1
-URI https://asc.fasb.org/extlink&oid=6450520&loc=d3e32583-110901
Reference 16: http://www.xbrl.org/2003/role/disclosureRef
-Publisher FASB
-Name Accounting Standards Codification
-Topic 740
-SubTopic 10
-Section 65
-Paragraph 8
-Subparagraph (d)(2)
-URI https://asc.fasb.org/extlink&oid=126983759&loc=SL121830611-158277
Reference 17: http://www.xbrl.org/2003/role/disclosureRef
-Publisher FASB
-Name Accounting Standards Codification
-Topic 848
-SubTopic 10
-Section 65
-Paragraph 2
-Subparagraph (a)(3)(iii)(03)
-URI https://asc.fasb.org/extlink&oid=125980421&loc=SL125981372-237846
Reference 18: http://www.xbrl.org/2003/role/disclosureRef
-Publisher FASB
-Name Accounting Standards Codification
-Topic 830
-SubTopic 30
-Section 45
-Paragraph 17
-URI https://asc.fasb.org/extlink&oid=118261656&loc=d3e32136-110900
Reference 19: http://www.xbrl.org/2003/role/disclosureRef
-Publisher FASB
-Name Accounting Standards Codification
-Topic 740
-SubTopic 10
-Section 65
-Paragraph 8
-Subparagraph (d)(3)
-URI https://asc.fasb.org/extlink&oid=126983759&loc=SL121830611-158277
Reference 20: http://www.xbrl.org/2003/role/disclosureRef
-Publisher FASB
-Name Accounting Standards Codification
-Topic 944
-SubTopic 40
-Section 65
-Paragraph 2
-Subparagraph (f)(2)
-URI https://asc.fasb.org/extlink&oid=124501264&loc=SL117420844-207641
Reference 21: http://www.xbrl.org/2003/role/disclosureRef
-Publisher FASB
-Name Accounting Standards Codification
-Topic 718
-SubTopic 10
-Section 65
-Paragraph 15
-Subparagraph (f)(2)
-URI https://asc.fasb.org/extlink&oid=128097895&loc=SL121327923-165333
Reference 22: http://fasb.org/us-gaap/role/ref/legacyRef
-Publisher FASB
-Name Accounting Standards Codification
-Topic 810
-SubTopic 10
-Section 55
-Paragraph 4I
-URI https://asc.fasb.org/extlink&oid=120409616&loc=SL4590271-111686
Reference 23: http://www.xbrl.org/2003/role/disclosureRef
-Publisher FASB
-Name Accounting Standards Codification
-Topic 944
-SubTopic 40
-Section 65
-Paragraph 2
-Subparagraph (f)(1)
-URI https://asc.fasb.org/extlink&oid=124501264&loc=SL117420844-207641
Reference 24: http://www.xbrl.org/2003/role/disclosureRef
-Publisher FASB
-Name Accounting Standards Codification
-Topic 830
-SubTopic 30
-Section 45
-Paragraph 20
-Subparagraph (a)
-URI https://asc.fasb.org/extlink&oid=118261656&loc=d3e32211-110900
Reference 25: http://fasb.org/us-gaap/role/ref/legacyRef
-Publisher FASB
-Name Accounting Standards Codification
-Topic 810
-SubTopic 10
-Section 45
-Paragraph 15
-URI https://asc.fasb.org/extlink&oid=126929396&loc=SL4568447-111683
Reference 26: http://www.xbrl.org/2003/role/disclosureRef
-Publisher FASB
-Name Accounting Standards Codification
-Topic 718
-SubTopic 10
-Section 65
-Paragraph 15
-Subparagraph (f)(1)
-URI https://asc.fasb.org/extlink&oid=128097895&loc=SL121327923-165333
Reference 27: http://www.xbrl.org/2003/role/disclosureRef
-Publisher FASB
-Name Accounting Standards Codification
-Topic 250
-SubTopic 10
-Section 50
-Paragraph 1
-Subparagraph (b)(3)
-URI https://asc.fasb.org/extlink&oid=124431687&loc=d3e22499-107794
Reference 28: http://www.xbrl.org/2003/role/disclosureRef
-Publisher FASB
-Name Accounting Standards Codification
-Topic 718
-SubTopic 10
-Section 65
-Paragraph 15
-Subparagraph (e)
-URI https://asc.fasb.org/extlink&oid=128097895&loc=SL121327923-165333
| Name: |
us-gaap_StockholdersEquityIncludingPortionAttributableToNoncontrollingInterest |
| Namespace Prefix: |
us-gaap_ |
| Data Type: |
xbrli:monetaryItemType |
| Balance Type: |
credit |
| Period Type: |
instant |
|
v3.23.2
Consolidated Statements of Cash Flows - USD ($)
|
12 Months Ended |
Dec. 31, 2022 |
Dec. 31, 2021 |
| Statement of Cash Flows [Abstract] |
|
|
| Net loss |
$ (7,547,391)
|
$ (6,384,655)
|
| Adjustments to reconcile net loss to net cash used in operating activities: |
|
|
| Depreciation and amortization |
13,670
|
130,059
|
| Change in ROU assets |
161,804
|
27,360
|
| Accretion of discounts on debt |
315,065
|
187,435
|
| Bad debt expense (recovery) |
(29,389)
|
49,586
|
| Loss on sale of lease receivable |
3,923
|
|
| Preferred shares issued for services |
1,887,700
|
849,600
|
| Common shares and warrants issued for services |
97,353
|
1,644,136
|
| Obligation to issue warrants |
|
19,647
|
| (Gain) loss on extinguishment of debt |
(40,355)
|
(35,169)
|
| Unrealized foreign exchange gain |
(2,304)
|
(1,857)
|
| Gain on asset disposal |
(3,960)
|
|
| Changes in non-cash working capital: |
|
|
| Trade receivables, net |
(499,031)
|
(259,437)
|
| Inventories |
(491,899)
|
(457,817)
|
| Prepaid expense and deposits |
195,439
|
(259,909)
|
| Lease receivable |
(19,545)
|
(763,592)
|
| Trade payables and accruals |
2,277,657
|
(362,792)
|
| Deferred revenue |
225,490
|
155,508
|
| Interest on mandatorily redeemable preferred shares |
3,062
|
|
| Lease liabilities |
(169,371)
|
(151,671)
|
| Net cash used in operating activities |
(3,622,082)
|
(5,613,568)
|
| Cash flows from investing activities |
|
|
| Purchase of equipment |
(8,892)
|
(26,541)
|
| Disposal of property and equipment |
10,225
|
|
| Net cash used in investing activities |
1,333
|
(26,541)
|
| Cash flows from financing activities |
|
|
| Proceeds from issuing preferred shares, and shares to be issued |
1,000,000
|
2,536,066
|
| Proceeds on warrants issued |
|
261,934
|
| Repayment on lease liabilities |
|
(4,704)
|
| Proceeds from sale of lease receivable |
863,527
|
|
| Proceeds from loans payable |
1,500,000
|
1,897,500
|
| Payments on loans payable |
(20,411)
|
(193,889)
|
| Net cash provided by financing activities |
3,343,116
|
4,496,907
|
| Effect of exchange rate changes on cash |
56,029
|
46,568
|
| Net increase in cash |
(221,604)
|
(1,096,633)
|
| Cash at beginning of year |
275,383
|
1,372,016
|
| Cash at the end of the year |
$ 53,779
|
$ 275,383
|
| X |
- DefinitionAccretion of discounts on debt.
| Name: |
DSGT_AccretionOfDiscountsOnDebt |
| Namespace Prefix: |
DSGT_ |
| Data Type: |
xbrli:monetaryItemType |
| Balance Type: |
debit |
| Period Type: |
duration |
|
| X |
- DefinitionGain loss in right of use asset.
| Name: |
DSGT_GainLossInRightOfUseAsset |
| Namespace Prefix: |
DSGT_ |
| Data Type: |
xbrli:monetaryItemType |
| Balance Type: |
debit |
| Period Type: |
duration |
|
| X |
- DefinitionIncrease (decrease) in interest on mandatorily redeemable preferred shares.
| Name: |
DSGT_IncreaseDecreaseInInterestOnMandatorilyRedeemablePreferredShares |
| Namespace Prefix: |
DSGT_ |
| Data Type: |
xbrli:monetaryItemType |
| Balance Type: |
debit |
| Period Type: |
duration |
|
| X |
- DefinitionIncrease decrease in lease receivable.
| Name: |
DSGT_IncreaseDecreaseInLeaseReceivable |
| Namespace Prefix: |
DSGT_ |
| Data Type: |
xbrli:monetaryItemType |
| Balance Type: |
credit |
| Period Type: |
duration |
|
| X |
- DefinitionObligations to issuance of warrants.
| Name: |
DSGT_ObligationsToIssuanceOfWarrants |
| Namespace Prefix: |
DSGT_ |
| Data Type: |
xbrli:monetaryItemType |
| Balance Type: |
debit |
| Period Type: |
duration |
|
| X |
- DefinitionPreferred shares issued for services.
| Name: |
DSGT_PreferredSharesIssuedForServices |
| Namespace Prefix: |
DSGT_ |
| Data Type: |
xbrli:monetaryItemType |
| Balance Type: |
debit |
| Period Type: |
duration |
|
| X |
- DefinitionProceeds from sale of lease receivable.
| Name: |
DSGT_ProceedsFromSaleOfLeaseReceivable |
| Namespace Prefix: |
DSGT_ |
| Data Type: |
xbrli:monetaryItemType |
| Balance Type: |
debit |
| Period Type: |
duration |
|
| X |
- DefinitionPayments on loans payable.
| Name: |
DSGT_RepaymentsOfLoansPayable |
| Namespace Prefix: |
DSGT_ |
| Data Type: |
xbrli:monetaryItemType |
| Balance Type: |
credit |
| Period Type: |
duration |
|
| X |
- References
+ Details
| Name: |
us-gaap_AdjustmentsToReconcileNetIncomeLossToCashProvidedByUsedInOperatingActivitiesAbstract |
| Namespace Prefix: |
us-gaap_ |
| Data Type: |
xbrli:stringItemType |
| Balance Type: |
na |
| Period Type: |
duration |
|
| X |
- DefinitionAmount of cash and cash equivalents, and cash and cash equivalents restricted to withdrawal or usage; including, but not limited to, disposal group and discontinued operations. Cash includes, but is not limited to, currency on hand, demand deposits with banks or financial institutions, and other accounts with general characteristics of demand deposits. Cash equivalents include, but are not limited to, short-term, highly liquid investments that are both readily convertible to known amounts of cash and so near their maturity that they present insignificant risk of changes in value because of changes in interest rates. Reference 1: http://fasb.org/us-gaap/role/ref/legacyRef
-Publisher FASB
-Name Accounting Standards Codification
-Topic 230
-SubTopic 10
-Section 50
-Paragraph 8
-URI https://asc.fasb.org/extlink&oid=126999549&loc=SL98516268-108586
Reference 2: http://fasb.org/us-gaap/role/ref/legacyRef
-Publisher FASB
-Name Accounting Standards Codification
-Topic 230
-SubTopic 10
-Section 45
-Paragraph 24
-URI https://asc.fasb.org/extlink&oid=126954810&loc=d3e3521-108585
Reference 3: http://fasb.org/us-gaap/role/ref/legacyRef
-Publisher FASB
-Name Accounting Standards Codification
-Topic 230
-SubTopic 10
-Section 45
-Paragraph 4
-URI https://asc.fasb.org/extlink&oid=126954810&loc=d3e3044-108585
| Name: |
us-gaap_CashCashEquivalentsRestrictedCashAndRestrictedCashEquivalentsIncludingDisposalGroupAndDiscontinuedOperations |
| Namespace Prefix: |
us-gaap_ |
| Data Type: |
xbrli:monetaryItemType |
| Balance Type: |
debit |
| Period Type: |
instant |
|
| X |
- DefinitionAmount of increase (decrease) in cash, cash equivalents, and cash and cash equivalents restricted to withdrawal or usage; including effect from exchange rate change. Cash includes, but is not limited to, currency on hand, demand deposits with banks or financial institutions, and other accounts with general characteristics of demand deposits. Cash equivalents include, but are not limited to, short-term, highly liquid investments that are both readily convertible to known amounts of cash and so near their maturity that they present insignificant risk of changes in value because of changes in interest rates. Reference 1: http://fasb.org/us-gaap/role/ref/legacyRef
-Publisher FASB
-Name Accounting Standards Codification
-Topic 830
-SubTopic 230
-Section 45
-Paragraph 1
-URI https://asc.fasb.org/extlink&oid=123444420&loc=d3e33268-110906
Reference 2: http://fasb.org/us-gaap/role/ref/legacyRef
-Publisher FASB
-Name Accounting Standards Codification
-Topic 230
-SubTopic 10
-Section 45
-Paragraph 24
-URI https://asc.fasb.org/extlink&oid=126954810&loc=d3e3521-108585
| Name: |
us-gaap_CashCashEquivalentsRestrictedCashAndRestrictedCashEquivalentsPeriodIncreaseDecreaseIncludingExchangeRateEffect |
| Namespace Prefix: |
us-gaap_ |
| Data Type: |
xbrli:monetaryItemType |
| Balance Type: |
debit |
| Period Type: |
duration |
|
| X |
- DefinitionThe current period expense charged against earnings on long-lived, physical assets not used in production, and which are not intended for resale, to allocate or recognize the cost of such assets over their useful lives; or to record the reduction in book value of an intangible asset over the benefit period of such asset; or to reflect consumption during the period of an asset that is not used in production. Reference 1: http://fasb.org/us-gaap/role/ref/legacyRef
-Publisher FASB
-Name Accounting Standards Codification
-Topic 360
-SubTopic 10
-Section 50
-Paragraph 1
-Subparagraph (a)
-URI https://asc.fasb.org/extlink&oid=6391035&loc=d3e2868-110229
Reference 2: http://fasb.org/us-gaap/role/ref/legacyRef
-Publisher FASB
-Name Accounting Standards Codification
-Topic 230
-SubTopic 10
-Section 45
-Paragraph 28
-Subparagraph (b)
-URI https://asc.fasb.org/extlink&oid=126954810&loc=d3e3602-108585
| Name: |
us-gaap_DepreciationAndAmortization |
| Namespace Prefix: |
us-gaap_ |
| Data Type: |
xbrli:monetaryItemType |
| Balance Type: |
debit |
| Period Type: |
duration |
|
| X |
- DefinitionAmount of increase (decrease) from effect of exchange rate changes on cash and cash equivalents, and cash and cash equivalents restricted to withdrawal or usage; held in foreign currencies; including, but not limited to, disposal group and discontinued operations. Cash includes, but is not limited to, currency on hand, demand deposits with banks or financial institutions, and other accounts with general characteristics of demand deposits. Cash equivalents include, but are not limited to, short-term, highly liquid investments that are both readily convertible to known amounts of cash and so near their maturity that they present insignificant risk of changes in value because of changes in interest rates. Reference 1: http://www.xbrl.org/2009/role/commonPracticeRef
-Publisher FASB
-Name Accounting Standards Codification
-Topic 830
-SubTopic 230
-Section 45
-Paragraph 1
-URI https://asc.fasb.org/extlink&oid=123444420&loc=d3e33268-110906
| Name: |
us-gaap_EffectOfExchangeRateOnCashCashEquivalentsRestrictedCashAndRestrictedCashEquivalentsIncludingDisposalGroupAndDiscontinuedOperations |
| Namespace Prefix: |
us-gaap_ |
| Data Type: |
xbrli:monetaryItemType |
| Balance Type: |
debit |
| Period Type: |
duration |
|
| X |
- DefinitionAmount of cash outflow for principal payment on finance lease. Reference 1: http://www.xbrl.org/2003/role/disclosureRef
-Publisher FASB
-Name Accounting Standards Codification
-Topic 842
-SubTopic 20
-Section 45
-Paragraph 5
-Subparagraph (a)
-URI https://asc.fasb.org/extlink&oid=123391704&loc=SL77918643-209977
Reference 2: http://www.xbrl.org/2003/role/disclosureRef
-Publisher FASB
-Name Accounting Standards Codification
-Topic 842
-SubTopic 20
-Section 50
-Paragraph 4
-Subparagraph (g)(1)
-URI https://asc.fasb.org/extlink&oid=128292326&loc=SL77918686-209980
| Name: |
us-gaap_FinanceLeasePrincipalPayments |
| Namespace Prefix: |
us-gaap_ |
| Data Type: |
xbrli:monetaryItemType |
| Balance Type: |
credit |
| Period Type: |
duration |
|
| X |
- DefinitionAmount before tax of foreign currency transaction unrealized gain (loss) recognized in the income statement. Reference 1: http://www.xbrl.org/2009/role/commonPracticeRef
-Publisher FASB
-Name Accounting Standards Codification
-Topic 830
-SubTopic 20
-Section 50
-Paragraph 1
-URI https://asc.fasb.org/extlink&oid=124440516&loc=d3e30840-110895
Reference 2: http://fasb.org/us-gaap/role/ref/legacyRef
-Publisher FASB
-Name Accounting Standards Codification
-Topic 230
-SubTopic 10
-Section 45
-Paragraph 28
-URI https://asc.fasb.org/extlink&oid=126954810&loc=d3e3602-108585
Reference 3: http://www.xbrl.org/2009/role/commonPracticeRef
-Publisher FASB
-Name Accounting Standards Codification
-Topic 830
-SubTopic 20
-Section 45
-Paragraph 1
-URI https://asc.fasb.org/extlink&oid=125521441&loc=d3e30690-110894
| Name: |
us-gaap_ForeignCurrencyTransactionGainLossUnrealized |
| Namespace Prefix: |
us-gaap_ |
| Data Type: |
xbrli:monetaryItemType |
| Balance Type: |
credit |
| Period Type: |
duration |
|
| X |
- DefinitionAmount of gain (loss) on sale or disposal of intangible assets. Reference 1: http://www.xbrl.org/2009/role/commonPracticeRef
-Publisher FASB
-Name Accounting Standards Codification
-Topic 230
-SubTopic 10
-Section 45
-Paragraph 28
-Subparagraph (b)
-URI https://asc.fasb.org/extlink&oid=126954810&loc=d3e3602-108585
| Name: |
us-gaap_GainLossOnDispositionOfIntangibleAssets |
| Namespace Prefix: |
us-gaap_ |
| Data Type: |
xbrli:monetaryItemType |
| Balance Type: |
credit |
| Period Type: |
duration |
|
| X |
- DefinitionThe gains (losses) included in earnings that represent the difference between the sale price and the carrying value of loans and leases that were sold during the reporting period. This element refers to the gain (loss) and not to the cash proceeds of the sales. This element is a noncash adjustment to net income when calculating net cash generated by operating activities using the indirect method. Reference 1: http://www.xbrl.org/2009/role/commonPracticeRef
-Publisher FASB
-Name Accounting Standards Codification
-Topic 230
-SubTopic 10
-Section 45
-Paragraph 28
-Subparagraph (b)
-URI https://asc.fasb.org/extlink&oid=126954810&loc=d3e3602-108585
| Name: |
us-gaap_GainLossOnSaleOfLoansAndLeases |
| Namespace Prefix: |
us-gaap_ |
| Data Type: |
xbrli:monetaryItemType |
| Balance Type: |
credit |
| Period Type: |
duration |
|
| X |
- DefinitionDifference between the fair value of payments made and the carrying amount of debt which is extinguished prior to maturity. Reference 1: http://fasb.org/us-gaap/role/ref/legacyRef
-Publisher FASB
-Name Accounting Standards Codification
-Topic 470
-SubTopic 50
-Section 40
-Paragraph 4
-URI https://asc.fasb.org/extlink&oid=126972273&loc=d3e12355-112629
Reference 2: http://fasb.org/us-gaap/role/ref/legacyRef
-Publisher FASB
-Name Accounting Standards Codification
-Topic 470
-SubTopic 50
-Section 40
-Paragraph 2
-URI https://asc.fasb.org/extlink&oid=126972273&loc=d3e12317-112629
Reference 3: http://fasb.org/us-gaap/role/ref/legacyRef
-Publisher FASB
-Name Accounting Standards Codification
-Topic 230
-SubTopic 10
-Section 45
-Paragraph 28
-Subparagraph (b)
-URI https://asc.fasb.org/extlink&oid=126954810&loc=d3e3602-108585
| Name: |
us-gaap_GainsLossesOnExtinguishmentOfDebt |
| Namespace Prefix: |
us-gaap_ |
| Data Type: |
xbrli:monetaryItemType |
| Balance Type: |
credit |
| Period Type: |
duration |
|
| X |
- DefinitionThe increase (decrease) during the reporting period in the aggregate amount of liabilities incurred (and for which invoices have typically been received) and payable to vendors for goods and services received that are used in an entity's business. Reference 1: http://fasb.org/us-gaap/role/ref/legacyRef
-Publisher FASB
-Name Accounting Standards Codification
-Topic 230
-SubTopic 10
-Section 45
-Paragraph 28
-Subparagraph (a)
-URI https://asc.fasb.org/extlink&oid=126954810&loc=d3e3602-108585
| Name: |
us-gaap_IncreaseDecreaseInAccountsPayable |
| Namespace Prefix: |
us-gaap_ |
| Data Type: |
xbrli:monetaryItemType |
| Balance Type: |
debit |
| Period Type: |
duration |
|
| X |
- DefinitionThe increase (decrease) during the reporting period in amount due within one year (or one business cycle) from customers for the credit sale of goods and services. Reference 1: http://fasb.org/us-gaap/role/ref/legacyRef
-Publisher FASB
-Name Accounting Standards Codification
-Topic 230
-SubTopic 10
-Section 45
-Paragraph 28
-Subparagraph (a)
-URI https://asc.fasb.org/extlink&oid=126954810&loc=d3e3602-108585
| Name: |
us-gaap_IncreaseDecreaseInAccountsReceivable |
| Namespace Prefix: |
us-gaap_ |
| Data Type: |
xbrli:monetaryItemType |
| Balance Type: |
credit |
| Period Type: |
duration |
|
| X |
- DefinitionAmount of increase (decrease) in deferred income and obligation to transfer product and service to customer for which consideration has been received or is receivable. Reference 1: http://www.xbrl.org/2003/role/exampleRef
-Publisher FASB
-Name Accounting Standards Codification
-Topic 230
-SubTopic 10
-Section 45
-Paragraph 28
-Subparagraph (a)
-URI https://asc.fasb.org/extlink&oid=126954810&loc=d3e3602-108585
| Name: |
us-gaap_IncreaseDecreaseInDeferredRevenue |
| Namespace Prefix: |
us-gaap_ |
| Data Type: |
xbrli:monetaryItemType |
| Balance Type: |
debit |
| Period Type: |
duration |
|
| X |
- DefinitionThe increase (decrease) during the reporting period in the aggregate value of all inventory held by the reporting entity, associated with underlying transactions that are classified as operating activities. Reference 1: http://fasb.org/us-gaap/role/ref/legacyRef
-Publisher FASB
-Name Accounting Standards Codification
-Topic 230
-SubTopic 10
-Section 45
-Paragraph 28
-Subparagraph (a)
-URI https://asc.fasb.org/extlink&oid=126954810&loc=d3e3602-108585
| Name: |
us-gaap_IncreaseDecreaseInInventories |
| Namespace Prefix: |
us-gaap_ |
| Data Type: |
xbrli:monetaryItemType |
| Balance Type: |
credit |
| Period Type: |
duration |
|
| X |
- References
+ Details
| Name: |
us-gaap_IncreaseDecreaseInOperatingAssetsAbstract |
| Namespace Prefix: |
us-gaap_ |
| Data Type: |
xbrli:stringItemType |
| Balance Type: |
na |
| Period Type: |
duration |
|
| X |
- DefinitionAmount of increase (decrease) in obligation for operating lease. Reference 1: http://www.xbrl.org/2009/role/commonPracticeRef
-Publisher FASB
-Name Accounting Standards Codification
-Topic 842
-SubTopic 20
-Section 50
-Paragraph 4
-Subparagraph (g)(1)
-URI https://asc.fasb.org/extlink&oid=128292326&loc=SL77918686-209980
Reference 2: http://www.xbrl.org/2009/role/commonPracticeRef
-Publisher FASB
-Name Accounting Standards Codification
-Topic 230
-SubTopic 10
-Section 45
-Paragraph 28
-Subparagraph (a)
-URI https://asc.fasb.org/extlink&oid=126954810&loc=d3e3602-108585
| Name: |
us-gaap_IncreaseDecreaseInOperatingLeaseLiability |
| Namespace Prefix: |
us-gaap_ |
| Data Type: |
xbrli:monetaryItemType |
| Balance Type: |
debit |
| Period Type: |
duration |
|
| X |
- DefinitionAmount of increase (decrease) in prepaid expenses, and assets classified as other. Reference 1: http://fasb.org/us-gaap/role/ref/legacyRef
-Publisher FASB
-Name Accounting Standards Codification
-Topic 230
-SubTopic 10
-Section 45
-Paragraph 28
-Subparagraph (a)
-URI https://asc.fasb.org/extlink&oid=126954810&loc=d3e3602-108585
| Name: |
us-gaap_IncreaseDecreaseInPrepaidDeferredExpenseAndOtherAssets |
| Namespace Prefix: |
us-gaap_ |
| Data Type: |
xbrli:monetaryItemType |
| Balance Type: |
credit |
| Period Type: |
duration |
|
| X |
- DefinitionFair value of share-based compensation granted to nonemployees as payment for services rendered or acknowledged claims. Reference 1: http://fasb.org/us-gaap/role/ref/legacyRef
-Publisher FASB
-Name Accounting Standards Codification
-Topic 230
-SubTopic 10
-Section 45
-Paragraph 28
-Subparagraph (b)
-URI https://asc.fasb.org/extlink&oid=126954810&loc=d3e3602-108585
| Name: |
us-gaap_IssuanceOfStockAndWarrantsForServicesOrClaims |
| Namespace Prefix: |
us-gaap_ |
| Data Type: |
xbrli:monetaryItemType |
| Balance Type: |
debit |
| Period Type: |
duration |
|
| X |
- DefinitionAmount of cash inflow (outflow) from financing activities, including discontinued operations. Financing activity cash flows include obtaining resources from owners and providing them with a return on, and a return of, their investment; borrowing money and repaying amounts borrowed, or settling the obligation; and obtaining and paying for other resources obtained from creditors on long-term credit. Reference 1: http://www.xbrl.org/2003/role/disclosureRef
-Publisher FASB
-Name Accounting Standards Codification
-Topic 230
-SubTopic 10
-Section 45
-Paragraph 24
-URI https://asc.fasb.org/extlink&oid=126954810&loc=d3e3521-108585
| Name: |
us-gaap_NetCashProvidedByUsedInFinancingActivities |
| Namespace Prefix: |
us-gaap_ |
| Data Type: |
xbrli:monetaryItemType |
| Balance Type: |
debit |
| Period Type: |
duration |
|
| X |
- References
+ Details
| Name: |
us-gaap_NetCashProvidedByUsedInFinancingActivitiesAbstract |
| Namespace Prefix: |
us-gaap_ |
| Data Type: |
xbrli:stringItemType |
| Balance Type: |
na |
| Period Type: |
duration |
|
| X |
- DefinitionAmount of cash inflow (outflow) from investing activities, including discontinued operations. Investing activity cash flows include making and collecting loans and acquiring and disposing of debt or equity instruments and property, plant, and equipment and other productive assets. Reference 1: http://www.xbrl.org/2003/role/disclosureRef
-Publisher FASB
-Name Accounting Standards Codification
-Topic 230
-SubTopic 10
-Section 45
-Paragraph 24
-URI https://asc.fasb.org/extlink&oid=126954810&loc=d3e3521-108585
| Name: |
us-gaap_NetCashProvidedByUsedInInvestingActivities |
| Namespace Prefix: |
us-gaap_ |
| Data Type: |
xbrli:monetaryItemType |
| Balance Type: |
debit |
| Period Type: |
duration |
|
| X |
- References
+ Details
| Name: |
us-gaap_NetCashProvidedByUsedInInvestingActivitiesAbstract |
| Namespace Prefix: |
us-gaap_ |
| Data Type: |
xbrli:stringItemType |
| Balance Type: |
na |
| Period Type: |
duration |
|
| X |
- DefinitionAmount of cash inflow (outflow) from operating activities, including discontinued operations. Operating activity cash flows include transactions, adjustments, and changes in value not defined as investing or financing activities. Reference 1: http://fasb.org/us-gaap/role/ref/legacyRef
-Publisher FASB
-Name Accounting Standards Codification
-Topic 230
-SubTopic 10
-Section 45
-Paragraph 25
-URI https://asc.fasb.org/extlink&oid=126954810&loc=d3e3536-108585
Reference 2: http://fasb.org/us-gaap/role/ref/legacyRef
-Publisher FASB
-Name Accounting Standards Codification
-Topic 230
-SubTopic 10
-Section 45
-Paragraph 24
-URI https://asc.fasb.org/extlink&oid=126954810&loc=d3e3521-108585
Reference 3: http://fasb.org/us-gaap/role/ref/legacyRef
-Publisher FASB
-Name Accounting Standards Codification
-Topic 230
-SubTopic 10
-Section 45
-Paragraph 28
-URI https://asc.fasb.org/extlink&oid=126954810&loc=d3e3602-108585
| Name: |
us-gaap_NetCashProvidedByUsedInOperatingActivities |
| Namespace Prefix: |
us-gaap_ |
| Data Type: |
xbrli:monetaryItemType |
| Balance Type: |
na |
| Period Type: |
duration |
|
| X |
- DefinitionThe portion of profit or loss for the period, net of income taxes, which is attributable to the parent. Reference 1: http://fasb.org/us-gaap/role/ref/legacyRef
-Publisher FASB
-Name Accounting Standards Codification
-Topic 942
-SubTopic 220
-Section S99
-Paragraph 1
-Subparagraph (SX 210.9-04(22))
-URI https://asc.fasb.org/extlink&oid=120399700&loc=SL114874048-224260
Reference 2: http://www.xbrl.org/2003/role/disclosureRef
-Publisher FASB
-Name Accounting Standards Codification
-Topic 280
-SubTopic 10
-Section 50
-Paragraph 32
-Subparagraph (f)
-URI https://asc.fasb.org/extlink&oid=126901519&loc=d3e8933-108599
Reference 3: http://www.xbrl.org/2003/role/disclosureRef
-Publisher FASB
-Name Accounting Standards Codification
-Topic 250
-SubTopic 10
-Section 50
-Paragraph 4
-URI https://asc.fasb.org/extlink&oid=124431687&loc=d3e22595-107794
Reference 4: http://fasb.org/us-gaap/role/ref/legacyRef
-Publisher FASB
-Name Accounting Standards Codification
-Topic 944
-SubTopic 220
-Section S99
-Paragraph 1
-Subparagraph (SX 210.7-04(18))
-URI https://asc.fasb.org/extlink&oid=120400993&loc=SL114874131-224263
Reference 5: http://www.xbrl.org/2003/role/disclosureRef
-Publisher FASB
-Name Accounting Standards Codification
-Topic 815
-SubTopic 40
-Section 65
-Paragraph 1
-Subparagraph (f)
-URI https://asc.fasb.org/extlink&oid=126732423&loc=SL123482106-238011
Reference 6: http://www.xbrl.org/2003/role/disclosureRef
-Publisher FASB
-Name Accounting Standards Codification
-Topic 220
-SubTopic 10
-Section 50
-Paragraph 6
-URI https://asc.fasb.org/extlink&oid=124431353&loc=SL124452729-227067
Reference 7: http://www.xbrl.org/2003/role/disclosureRef
-Publisher FASB
-Name Accounting Standards Codification
-Topic 470
-SubTopic 10
-Section S99
-Paragraph 1B
-Subparagraph (SX 210.13-02(a)(5))
-URI https://asc.fasb.org/extlink&oid=126975872&loc=SL124442552-122756
Reference 8: http://fasb.org/us-gaap/role/ref/legacyRef
-Publisher FASB
-Name Accounting Standards Codification
-Topic 220
-SubTopic 10
-Section S99
-Paragraph 2
-Subparagraph (SX 210.5-03(20))
-URI https://asc.fasb.org/extlink&oid=126953954&loc=SL114868664-224227
Reference 9: http://fasb.org/us-gaap/role/ref/legacyRef
-Publisher FASB
-Name Accounting Standards Codification
-Topic 230
-SubTopic 10
-Section 45
-Paragraph 28
-URI https://asc.fasb.org/extlink&oid=126954810&loc=d3e3602-108585
Reference 10: http://www.xbrl.org/2003/role/disclosureRef
-Publisher FASB
-Name Accounting Standards Codification
-Topic 250
-SubTopic 10
-Section 50
-Paragraph 1
-Subparagraph (b)(2)
-URI https://asc.fasb.org/extlink&oid=124431687&loc=d3e22499-107794
Reference 11: http://www.xbrl.org/2003/role/disclosureRef
-Publisher FASB
-Name Accounting Standards Codification
-Topic 470
-SubTopic 10
-Section S99
-Paragraph 1A
-Subparagraph (SX 210.13-01(a)(4)(iv))
-URI https://asc.fasb.org/extlink&oid=126975872&loc=SL124442526-122756
Reference 12: http://www.xbrl.org/2003/role/disclosureRef
-Publisher FASB
-Name Accounting Standards Codification
-Topic 470
-SubTopic 10
-Section S99
-Paragraph 1A
-Subparagraph (SX 210.13-01(a)(4)(iii)(A))
-URI https://asc.fasb.org/extlink&oid=126975872&loc=SL124442526-122756
Reference 13: http://www.xbrl.org/2003/role/disclosureRef
-Publisher FASB
-Name Accounting Standards Codification
-Topic 470
-SubTopic 10
-Section S99
-Paragraph 1B
-Subparagraph (SX 210.13-02(a)(4)(i))
-URI https://asc.fasb.org/extlink&oid=126975872&loc=SL124442552-122756
Reference 14: http://www.xbrl.org/2003/role/disclosureRef
-Publisher FASB
-Name Accounting Standards Codification
-Topic 470
-SubTopic 10
-Section S99
-Paragraph 1A
-Subparagraph (SX 210.13-01(a)(4)(i))
-URI https://asc.fasb.org/extlink&oid=126975872&loc=SL124442526-122756
Reference 15: http://www.xbrl.org/2003/role/disclosureRef
-Publisher FASB
-Name Accounting Standards Codification
-Topic 250
-SubTopic 10
-Section 50
-Paragraph 9
-URI https://asc.fasb.org/extlink&oid=124431687&loc=d3e22663-107794
Reference 16: http://www.xbrl.org/2003/role/disclosureRef
-Publisher FASB
-Name Accounting Standards Codification
-Topic 470
-SubTopic 10
-Section S99
-Paragraph 1B
-Subparagraph (SX 210.13-02(a)(4)(iv))
-URI https://asc.fasb.org/extlink&oid=126975872&loc=SL124442552-122756
Reference 17: http://www.xbrl.org/2009/role/commonPracticeRef
-Publisher FASB
-Name Accounting Standards Codification
-Topic 470
-SubTopic 10
-Section S99
-Paragraph 1A
-Subparagraph (SX 210.13-01(a)(4)(ii))
-URI https://asc.fasb.org/extlink&oid=126975872&loc=SL124442526-122756
Reference 18: http://www.xbrl.org/2003/role/disclosureRef
-Publisher FASB
-Name Accounting Standards Codification
-Topic 825
-SubTopic 10
-Section 50
-Paragraph 28
-Subparagraph (f)
-URI https://asc.fasb.org/extlink&oid=123596393&loc=d3e14064-108612
Reference 19: http://www.xbrl.org/2003/role/disclosureRef
-Publisher FASB
-Name Accounting Standards Codification
-Topic 250
-SubTopic 10
-Section 50
-Paragraph 3
-URI https://asc.fasb.org/extlink&oid=124431687&loc=d3e22583-107794
Reference 20: http://www.xbrl.org/2003/role/disclosureRef
-Publisher FASB
-Name Accounting Standards Codification
-Topic 235
-SubTopic 10
-Section S99
-Paragraph 1
-Subparagraph (SX 210.4-08(g)(1)(ii))
-URI https://asc.fasb.org/extlink&oid=120395691&loc=d3e23780-122690
Reference 21: http://www.xbrl.org/2003/role/disclosureRef
-Publisher FASB
-Name Accounting Standards Codification
-Topic 260
-SubTopic 10
-Section 45
-Paragraph 60B
-Subparagraph (a)
-URI https://asc.fasb.org/extlink&oid=126958026&loc=SL5780133-109256
Reference 22: http://www.xbrl.org/2003/role/disclosureRef
-Publisher FASB
-Name Accounting Standards Codification
-Topic 323
-SubTopic 10
-Section 50
-Paragraph 3
-Subparagraph (c)
-URI https://asc.fasb.org/extlink&oid=114001798&loc=d3e33918-111571
Reference 23: http://www.xbrl.org/2003/role/disclosureRef
-Publisher FASB
-Name Accounting Standards Codification
-Topic 250
-SubTopic 10
-Section 50
-Paragraph 8
-URI https://asc.fasb.org/extlink&oid=124431687&loc=d3e22658-107794
Reference 24: http://www.xbrl.org/2003/role/disclosureRef
-Publisher FASB
-Name Accounting Standards Codification
-Topic 220
-SubTopic 10
-Section 45
-Paragraph 1A
-Subparagraph (a)
-URI https://asc.fasb.org/extlink&oid=126968391&loc=SL7669619-108580
Reference 25: http://www.xbrl.org/2003/role/exampleRef
-Publisher FASB
-Name Accounting Standards Codification
-Topic 280
-SubTopic 10
-Section 50
-Paragraph 31
-URI https://asc.fasb.org/extlink&oid=126901519&loc=d3e8924-108599
Reference 26: http://www.xbrl.org/2003/role/disclosureRef
-Publisher FASB
-Name Accounting Standards Codification
-Topic 250
-SubTopic 10
-Section 50
-Paragraph 11
-Subparagraph (b)
-URI https://asc.fasb.org/extlink&oid=124431687&loc=d3e22694-107794
Reference 27: http://www.xbrl.org/2003/role/disclosureRef
-Publisher FASB
-Name Accounting Standards Codification
-Topic 250
-SubTopic 10
-Section 50
-Paragraph 11
-Subparagraph (a)
-URI https://asc.fasb.org/extlink&oid=124431687&loc=d3e22694-107794
Reference 28: http://www.xbrl.org/2003/role/disclosureRef
-Publisher FASB
-Name Accounting Standards Codification
-Topic 205
-SubTopic 20
-Section 50
-Paragraph 7
-URI https://asc.fasb.org/extlink&oid=109222650&loc=SL51721683-107760
Reference 29: http://www.xbrl.org/2003/role/disclosureRef
-Publisher FASB
-Name Accounting Standards Codification
-Topic 220
-SubTopic 10
-Section 45
-Paragraph 1B
-Subparagraph (a)
-URI https://asc.fasb.org/extlink&oid=126968391&loc=SL7669625-108580
Reference 30: http://www.xbrl.org/2003/role/disclosureRef
-Publisher FASB
-Name Accounting Standards Codification
-Topic 280
-SubTopic 10
-Section 50
-Paragraph 22
-URI https://asc.fasb.org/extlink&oid=126901519&loc=d3e8736-108599
Reference 31: http://www.xbrl.org/2003/role/disclosureRef
-Publisher FASB
-Name Accounting Standards Codification
-Topic 470
-SubTopic 10
-Section S99
-Paragraph 1A
-Subparagraph (SX 210.13-01(a)(5))
-URI https://asc.fasb.org/extlink&oid=126975872&loc=SL124442526-122756
Reference 32: http://www.xbrl.org/2003/role/disclosureRef
-Publisher FASB
-Name Accounting Standards Codification
-Topic 470
-SubTopic 10
-Section S99
-Paragraph 1B
-Subparagraph (SX 210.13-02(a)(4)(iii)(B))
-URI https://asc.fasb.org/extlink&oid=126975872&loc=SL124442552-122756
Reference 33: http://www.xbrl.org/2003/role/disclosureRef
-Publisher FASB
-Name Accounting Standards Codification
-Topic 470
-SubTopic 10
-Section S99
-Paragraph 1B
-Subparagraph (SX 210.13-02(a)(4)(iii)(A))
-URI https://asc.fasb.org/extlink&oid=126975872&loc=SL124442552-122756
Reference 34: http://www.xbrl.org/2003/role/disclosureRef
-Publisher FASB
-Name Accounting Standards Codification
-Topic 280
-SubTopic 10
-Section 50
-Paragraph 30
-Subparagraph (b)
-URI https://asc.fasb.org/extlink&oid=126901519&loc=d3e8906-108599
Reference 35: http://www.xbrl.org/2003/role/disclosureRef
-Publisher FASB
-Name Accounting Standards Codification
-Topic 280
-SubTopic 10
-Section 50
-Paragraph 32
-Subparagraph (c)
-URI https://asc.fasb.org/extlink&oid=126901519&loc=d3e8933-108599
| Name: |
us-gaap_NetIncomeLoss |
| Namespace Prefix: |
us-gaap_ |
| Data Type: |
xbrli:monetaryItemType |
| Balance Type: |
credit |
| Period Type: |
duration |
|
| X |
- DefinitionThe cash outflow associated with the acquisition of long-lived, physical assets that are used in the normal conduct of business to produce goods and services and not intended for resale; includes cash outflows to pay for construction of self-constructed assets. Reference 1: http://fasb.org/us-gaap/role/ref/legacyRef
-Publisher FASB
-Name Accounting Standards Codification
-Topic 230
-SubTopic 10
-Section 45
-Paragraph 13
-Subparagraph (c)
-URI https://asc.fasb.org/extlink&oid=126954810&loc=d3e3213-108585
| Name: |
us-gaap_PaymentsToAcquirePropertyPlantAndEquipment |
| Namespace Prefix: |
us-gaap_ |
| Data Type: |
xbrli:monetaryItemType |
| Balance Type: |
credit |
| Period Type: |
duration |
|
| X |
- DefinitionProceeds from issuance of capital stock which provides for a specific dividend that is paid to the shareholders before any dividends to common stockholders and which takes precedence over common stockholders in the event of liquidation. Reference 1: http://fasb.org/us-gaap/role/ref/legacyRef
-Publisher FASB
-Name Accounting Standards Codification
-Topic 230
-SubTopic 10
-Section 45
-Paragraph 14
-Subparagraph (a)
-URI https://asc.fasb.org/extlink&oid=126954810&loc=d3e3255-108585
| Name: |
us-gaap_ProceedsFromIssuanceOfPreferredStockAndPreferenceStock |
| Namespace Prefix: |
us-gaap_ |
| Data Type: |
xbrli:monetaryItemType |
| Balance Type: |
debit |
| Period Type: |
duration |
|
| X |
- DefinitionThe cash inflow from issuance of rights to purchase common shares at predetermined price (usually issued together with corporate debt). Reference 1: http://fasb.org/us-gaap/role/ref/legacyRef
-Publisher FASB
-Name Accounting Standards Codification
-Topic 230
-SubTopic 10
-Section 45
-Paragraph 14
-Subparagraph (a)
-URI https://asc.fasb.org/extlink&oid=126954810&loc=d3e3255-108585
| Name: |
us-gaap_ProceedsFromIssuanceOfWarrants |
| Namespace Prefix: |
us-gaap_ |
| Data Type: |
xbrli:monetaryItemType |
| Balance Type: |
debit |
| Period Type: |
duration |
|
| X |
- DefinitionThe cash inflow from a borrowing supported by a written promise to pay an obligation. Reference 1: http://fasb.org/us-gaap/role/ref/legacyRef
-Publisher FASB
-Name Accounting Standards Codification
-Topic 230
-SubTopic 10
-Section 45
-Paragraph 14
-Subparagraph (b)
-URI https://asc.fasb.org/extlink&oid=126954810&loc=d3e3255-108585
| Name: |
us-gaap_ProceedsFromNotesPayable |
| Namespace Prefix: |
us-gaap_ |
| Data Type: |
xbrli:monetaryItemType |
| Balance Type: |
debit |
| Period Type: |
duration |
|
| X |
- DefinitionThe cash inflow from the sale of long-lived, physical assets that are used in the normal conduct of business to produce goods and services and not intended for resale. Reference 1: http://fasb.org/us-gaap/role/ref/legacyRef
-Publisher FASB
-Name Accounting Standards Codification
-Topic 230
-SubTopic 10
-Section 45
-Paragraph 12
-Subparagraph (c)
-URI https://asc.fasb.org/extlink&oid=126954810&loc=d3e3179-108585
| Name: |
us-gaap_ProceedsFromSaleOfPropertyPlantAndEquipment |
| Namespace Prefix: |
us-gaap_ |
| Data Type: |
xbrli:monetaryItemType |
| Balance Type: |
debit |
| Period Type: |
duration |
|
| X |
- DefinitionAmount of expense (reversal of expense) for expected credit loss on accounts receivable. Reference 1: http://www.xbrl.org/2003/role/disclosureRef
-Publisher FASB
-Name Accounting Standards Codification
-Topic 326
-SubTopic 20
-Section 50
-Paragraph 13
-Subparagraph (b)
-URI https://asc.fasb.org/extlink&oid=124255953&loc=SL82919249-210447
Reference 2: http://www.xbrl.org/2003/role/disclosureRef
-Publisher FASB
-Name Accounting Standards Codification
-Topic 220
-SubTopic 10
-Section S99
-Paragraph 2
-Subparagraph (SX 210.5-03(5))
-URI https://asc.fasb.org/extlink&oid=126953954&loc=SL114868664-224227
| Name: |
us-gaap_ProvisionForDoubtfulAccounts |
| Namespace Prefix: |
us-gaap_ |
| Data Type: |
xbrli:monetaryItemType |
| Balance Type: |
debit |
| Period Type: |
duration |
|
| X |
- References
+ Details
| Name: |
us-gaap_StatementOfCashFlowsAbstract |
| Namespace Prefix: |
us-gaap_ |
| Data Type: |
xbrli:stringItemType |
| Balance Type: |
na |
| Period Type: |
duration |
|
v3.23.2
ORGANIZATION
|
12 Months Ended |
Dec. 31, 2022 |
|---|
| Organization, Consolidation and Presentation of Financial Statements [Abstract] |
|
| ORGANIZATION |
Note
1 –ORGANIZATION
DSG
Global, Inc. (the “Company”) was incorporated under the laws of the State of Nevada on September 24, 2007.
The
Company is a technology development company engaged in the design, manufacture, and marketing of fleet management solutions in the golf
industry. The Company’s principal activities are the sale and rental of GPS tracking devices and interfaces for golf vehicles and
related support services. Starting during the year ended December 31, 2021, the Company began to market low speed electric vehicles,
and e-bikes, recognizing its first sales in this space. See Note 16 for segmented reporting. The Company continued the homologation project
for electric vehicles .
On
August 12, 2021, the Company incorporated Imperium Motor of Canada Corporation (“Imperium Canada”), under the laws of British
Columbia, Canada, for which it subscribed to all authorized capital stock, 100 shares of Class A Voting Participating common shares,
at a price of $0.10 per share. Imperium Canada is a wholly owned subsidiary of the Company.
On
September 17, 2021, the Company incorporated AC Golf Carts Inc. (“AC Golf Carts”), under the laws of the Sate of
Nevada, for which it subscribed to all authorized stock, 100
common shares at a price of $0.001
par value per share. AC Golf Carts is a wholly owned subsidiary of the Company.
Subsequent to year end, on
January 5, 2023, Imperium Motor Corp. had its name changed to Liteborne Motor Corporation.
|
| X |
- References
+ Details
| Name: |
us-gaap_OrganizationConsolidationAndPresentationOfFinancialStatementsAbstract |
| Namespace Prefix: |
us-gaap_ |
| Data Type: |
xbrli:stringItemType |
| Balance Type: |
na |
| Period Type: |
duration |
|
| X |
- DefinitionThe entire disclosure for organization, consolidation and basis of presentation of financial statements disclosure. Reference 1: http://fasb.org/us-gaap/role/ref/legacyRef
-Publisher FASB
-Name Accounting Standards Codification
-Topic 205
-URI https://asc.fasb.org/topic&trid=2122149
Reference 2: http://fasb.org/us-gaap/role/ref/legacyRef
-Publisher FASB
-Name Accounting Standards Codification
-Topic 810
-URI https://asc.fasb.org/topic&trid=2197479
| Name: |
us-gaap_OrganizationConsolidationAndPresentationOfFinancialStatementsDisclosureTextBlock |
| Namespace Prefix: |
us-gaap_ |
| Data Type: |
dtr-types:textBlockItemType |
| Balance Type: |
na |
| Period Type: |
duration |
|
v3.23.2
GOING CONCERN
|
12 Months Ended |
Dec. 31, 2022 |
|---|
| Organization, Consolidation and Presentation of Financial Statements [Abstract] |
|
| GOING CONCERN |
Note
2 – GOING CONCERN
These
consolidated financial statements have been prepared on a going concern basis, which implies the Company will continue to realize its
assets and discharge its liabilities in the normal course of business. The continuation of the Company as a going concern is dependent
upon the continued financial support from its shareholders and note holders, the ability of the Company to obtain necessary equity financing
to continue operations, and ultimately the attainment of profitable operations.
The
outbreak of the coronavirus, also known as “COVID-19”, spread across the globe and has impacted worldwide economic activity.
During the year ended December 31, 2022, conditions surrounding the coronavirus continued to rapidly evolve and government authorities
implemented emergency measures to mitigate the spread of the virus. The outbreak and the related mitigation measures may have an adverse
impact on global economic conditions as well as on the Company’s business activities going forward. The extent to which the coronavirus
may impact the Company’s business activities will depend on future developments, such as the ultimate geographic spread of the
disease, the duration of the outbreak, travel restrictions, business disruptions, and the effectiveness of actions taken in Canada and
other countries to contain and treat the disease. These events are highly uncertain and as such, the Company cannot determine their financial
impact at this time. While certain restrictions are presently in the process of being relaxed, it is unclear when the world will return
to the previous normal, if ever. This may adversely impact the expected implementation of the Company’s plans moving forward.
As
at December 31, 2022, the Company has a working capital deficit of $6,846,711 and has an accumulated deficit of $65,242,086 since inception.
Furthermore, the Company incurred a net loss of $7,547,391 and used $3,622,082 of cash flows for operating activities during the twelve
months ended December 31, 2022. These factors raise substantial doubt regarding the Company’s ability to continue as a going concern.
These consolidated financial statements do not include any adjustments to the recoverability and classification of recorded
asset amounts and classification of liabilities that might be necessary should the Company be unable to continue as a going concern.
|
| X |
- References
+ Details
| Name: |
us-gaap_OrganizationConsolidationAndPresentationOfFinancialStatementsAbstract |
| Namespace Prefix: |
us-gaap_ |
| Data Type: |
xbrli:stringItemType |
| Balance Type: |
na |
| Period Type: |
duration |
|
| X |
- DefinitionThe entire disclosure when substantial doubt is raised about the ability to continue as a going concern. Includes, but is not limited to, principal conditions or events that raised substantial doubt about the ability to continue as a going concern, management's evaluation of the significance of those conditions or events in relation to the ability to meet its obligations, and management's plans that alleviated or are intended to mitigate the conditions or events that raise substantial doubt about the ability to continue as a going concern. Reference 1: http://fasb.org/us-gaap/role/ref/legacyRef
-Publisher FASB
-Name Accounting Standards Codification
-Topic 205
-SubTopic 40
-URI https://asc.fasb.org/subtopic&trid=51888271
| Name: |
us-gaap_SubstantialDoubtAboutGoingConcernTextBlock |
| Namespace Prefix: |
us-gaap_ |
| Data Type: |
dtr-types:textBlockItemType |
| Balance Type: |
na |
| Period Type: |
duration |
|
v3.23.2
SUMMARY OF SIGNIFICANT ACCOUNTING POLICIES
|
12 Months Ended |
Dec. 31, 2022 |
|---|
| Accounting Policies [Abstract] |
|
| SUMMARY OF SIGNIFICANT ACCOUNTING POLICIES |
Note
3 – SUMMARY OF SIGNIFICANT ACCOUNTING POLICIES
Basis
of Presentation
The
consolidated financial statements of the Company have been prepared in accordance with accounting principles generally accepted in the
United States (“U.S. GAAP”) and are expressed in U.S. dollars. These consolidated financial statements include the accounts
of the Company and its wholly owned subsidiaries. All significant intercompany accounts and transactions have been eliminated. Certain
comparative information has been reclassified to conform with the financial statement presentation adopted in the current year.
Principles
of Consolidation
The
consolidated financial statements include the accounts of DSG Global Inc. and its subsidiary VTS and its wholly owned subsidiaries
DSG UK, Imperium Canada, Imperium, AC Golf Carts, and Liteborne collectively referred to as the “Company”. All intercompany
accounts, transactions and profits were eliminated in the consolidated financial statements.
Use
of Estimates
The
preparation of consolidated financial statements in conformity with U.S. GAAP requires management to make estimates and assumptions that
affect the reported amounts of assets and liabilities and the disclosure of contingent assets and liabilities at the date of the financial
statements and the reported amounts of revenues and expenses during the reporting period. The Company regularly evaluates estimates and
assumptions related to revenue recognition, the collectability of accounts receivable, valuation of inventory, useful lives and recoverability
of long-lived assets, fair value derivative liabilities, the Company’s incremental borrowing rate, leases and deferred income tax
asset valuation allowances. The Company bases its estimates and assumptions on current facts, historical experience and various other
factors that it believes to be reasonable under the circumstances, the results of which form the basis for making judgments about the
carrying values of assets and liabilities and the accrual of costs and expenses that are not readily apparent from other sources. The
actual results experienced by the Company may differ materially and adversely from those estimates. Estimates and assumptions are reviewed
periodically, and the effects of revisions are reflected in the consolidated financial statements in the period they are determined.
The
Company’s policy for equipment requires judgment in determining whether the present value of future expected economic benefits
exceeds capitalized costs. The policy requires management to make certain estimates and assumptions about future economic benefits related
to its operations. Estimates and assumptions may change if new information becomes available. If information becomes available suggesting
that the recovery of capitalized cost is unlikely, the capitalized cost is written off to the consolidated statement of operations.
The
assessment of whether the going concern assumption is appropriate requires management to take into account all available information
about the future, which is at least, but is not limited to, 12 months from the date the financial statements are issued. The Company
is aware that material uncertainties related to events or conditions may cast substantial doubt upon the Company’s ability to continue
as a going concern.
Foreign
Currency Translation
The
Company’s functional and reporting currency is the U.S. dollar. The functional currency of VTS is the Canadian dollar. The functional
currency of DSG UK is the British pound. Monetary assets and liabilities denominated in foreign currencies are translated using the exchange
rate prevailing at the balance sheet date. Non-monetary assets, liabilities, and items recorded in income arising from transactions denominated
in foreign currencies are translated at rates of exchange in effect at the date of the transaction. Gains and losses arising on translation
or settlement of foreign currency denominated transactions or balances are included in the determination of income.
The
accounts of VTS and DSG UK are translated to U.S. dollars using the current rate method. Accordingly, assets and liabilities are translated
into U.S. dollars at the period-end exchange rate while revenues and expenses are translated at the average exchange rates during the
period. Related exchange gains and losses are included in a separate component of stockholders’ equity as accumulated other comprehensive
income (loss).
Reportable
Segments
The
Company has four reportable
segments: GPS Devices, those related to its sales and rentals of GPS tracking devices and interfaces for golf vehicles and related support
services; Golf Vehicles, the sale of golf vehicles; Electric Vehicles, the sale of electric vehicles, including e-bikes; and Administration,
those expenses related to the overall operations of the Company not associated with a specific revenue segment. The Company’s activities
are interrelated, and each activity is dependent upon and supportive of the other. Accordingly, all significant operating decisions are
based on analysis of financial products provided as a single global business.
Revenue
Recognition and Warranty Reserve
Revenue
from Contracts with Customers
The
Company recognizes revenue when it satisfies a performance obligation by transferring control over a product to a customer. Revenue is
measured based on the consideration the Company expects to receive in exchange for those products. In instances where final acceptance
of the product is specified by the customer, revenue is deferred until all acceptance criteria have been met. Revenues are recognized
under Topic 606 in a manner that reasonably reflects the delivery of its products and services to customers in return for expected
consideration and includes the following elements:
| |
● |
executed
contracts with the Company’s customers that it believes are legally enforceable; |
| |
● |
identification
of performance obligations in the respective contract; |
| |
● |
determination
of the transaction price for each performance obligation in the respective contract; |
| |
● |
allocation
the transaction price to each performance obligation; and |
| |
● |
recognition
of revenue only when the Company satisfies each performance obligation. |
Performance
Obligations and Signification Judgments
The
Company’s revenue streams can be categorized into the following performance obligations and recognition patterns:
| |
1. |
Sale,
delivery and installation of Tag, Text and Infinity products, along with digital mapping and customer training. The Company recognizes
revenue at a point in time when final sign-off on the installation is obtained from the General Manager and/or Director of Golf. |
| |
2. |
Provision
of internet connectivity, regular software updates, software maintenance and basic customer support service. The Company recognizes
revenue over time, evenly over the term of the service. |
| |
3. |
Sale
and delivery of Fairway Rider (golf carts) products. The Company recognizes revenue at a point in time when control transfers to the
customer. |
| |
4. |
Sale
and delivery of Electric Vehicles. The Company recognizes revenue at a point in time when control transfers to the customer. |
Transaction
prices for performance obligations are explicitly outlined in relevant agreements, therefore, the Company does not believe that significant
judgments are required with respect to the determination of the transaction price, including any variable consideration identified.
Warranty
Reserve
The
Company accrues for warranty costs, sales returns, and other allowances based on its historical experience. The Company matches its
warranty period for parts and products to that of the manufacturer’s warranty period. Therefore, any defect will result in a
warranty claim to the manufacturer and not the Company. During the years ended December 31, 2022 and 2021, the Company did not
provide a warranty for any of its products sold during those periods. The warranty reserve was $Nil
as at December 31, 2022 and 2021.
Research
and Development
Research
and development expenses include payroll, employee benefits, and other headcount-related expenses associated with product development.
Research and development expenses also include third-party development and programming costs, localization costs incurred to translate
software for international markets, and the amortization of purchased software code and services content. Such costs related to software
development are included in research and development expense until the point that technological feasibility is reached. Research and
development is expensed and is included in operating expenses.
Income
Taxes
The
Company accounts for income taxes using the asset and liability method in accordance with ASC 740, Income Taxes. The asset and liability
method provides that deferred income tax assets and liabilities are recognized for the expected future tax consequences of temporary
differences between the financial reporting and tax bases of assets and liabilities, and for operating loss and tax credit carryforwards.
Deferred income tax assets and liabilities are measured using the currently enacted tax rates and laws that will be in effect when the
differences are expected to reverse. The Company records a valuation allowance to reduce deferred income tax assets to the amount that
is believed more likely than not to be realized.
As
of December 31, 2022 and 2021, the Company did not have any amounts recorded pertaining to uncertain tax positions. The Company recognizes
interest and penalties related to uncertain tax positions in general and administrative expense. The Company did not incur any penalties
or interest during the years ended December 31, 2022 and 2021. On December 22, 2017, the U.S. enacted the Tax Cuts and Jobs Act (“the
Tax Act”) which significantly changed U.S. tax law. The Tax Act lowered the Company’s statutory federal income tax rate from
a maximum of 39% to a rate of 21% effective January 1, 2018. The Company has deferred tax losses and assets and they were adjusted as
a result of the change in tax law reducing the federal income tax rate. The Company’s tax years 2015 and forward remain open.
Concentration
of Credit Risk
Financial
instruments that potentially subject the Company to concentrations of credit risk are cash, and trade receivables arising from its normal
business activities. The Company places its cash in what it believes to be credit-worthy financial institutions. The Company has a diversified
customer base, most of which are in Canada, United States and the United Kingdom. The Company controls credit risk related to trade receivables
through credit approvals, credit limits and monitoring procedures. The Company routinely assesses the financial strength of its customers
and, based upon factors surrounding the credit risk, establishes an allowance, if required, for uncollectible accounts and, as a consequence,
believes that its accounts receivable credit risk exposure beyond such allowance is limited.
Risks
and Uncertainties
The
Company is subject to risks from, among other things, competition associated with the industry in general, other risks associated with
financing, liquidity requirements, rapidly changing customer requirements, limited operating history, foreign currency exchange rates
and the volatility of public markets.
Contingencies
Certain
conditions may exist as of the date the consolidated financial statements are issued, which may result in a loss to the Company, but
which will only be resolved when one or more future events occur or fail to occur. The Company’s management and legal counsel assess
such contingent liabilities, and such assessment inherently involves judgment. In assessing loss contingencies related to legal proceedings
that are pending against the Company or un-asserted claims that may result in such proceedings, the Company’s legal counsel evaluates
the perceived merits of any legal proceedings or un-asserted claims as well as the perceived merits of the amount of relief sought or
expected to be sought.
If
the assessment of a contingency indicates it is probable that a material loss has been incurred and the amount of the liability can be
estimated, then the estimated liability would be accrued in the Company’s consolidated financial statements. If the assessment
indicates that a potential material loss contingency is not probable but is reasonably possible, or is probable but cannot be estimated,
then the nature of the contingent liability, together with an estimate of the range of possible loss if determinable and material would
be disclosed. Loss contingencies considered to be remote by management are generally not disclosed unless they involve guarantees, in
which case the guarantee would be disclosed.
Cash
and Cash Equivalents
Cash
and equivalents include cash in hand and cash in demand deposits, certificates of deposit and all highly liquid debt instruments with
original maturities of three months or less. At December 31, 2022 and 2021, there were no uninsured balances for accounts in Canada,
the United States and the United Kingdom. The Company has not experienced any losses in such accounts and believes it is not exposed
to any risks on its cash in bank accounts. At December 31, 2022 and 2021, the Company did not hold any cash equivalents.
Accounts
Receivable
All
accounts receivable under standard terms are due thirty (30) days from the date billed. If the funds are not received within thirty (30)
days, the customer is contacted to arrange payment. Currently, the Company does not provide for an allowance for uncollectable
accounts receivable due to its history of not having any collectability issues from customers.
Financing
Receivables and Guarantees
The
Company provides financing arrangements, including operating leases and financed service contracts for certain qualified customers. Lease
receivables primarily represent sales-type and direct-financing leases. Leases typically have two- to three-year terms and are collateralized
by a security interest in the underlying assets. The Company makes an allowance for uncollectible financing receivables based on a variety
of factors, including the risk rating of the portfolio, macroeconomic conditions, historical experience, and other market factors. At
December 31, 2022 and 2021 management determined that there was no allowance necessary. The Company also provides financing guarantees,
which are generally for various third-party financing arrangements to channel partners and other customers. The Company could be called
upon to make payment under these guarantees in the event of non-payment to the third party. As at December 31, 2022 and 2021, no financing
receivables are outstanding.
Advertising
Costs
The
Company expenses all advertising costs as incurred. Advertising and marketing costs were $286,717 and $134,856 for the years ended December
31, 2022 and 2021, respectively.
Inventory
Inventories
are valued at the lower of cost or net realizable value. Cost is determined using the first-in-first-out basis for finished goods. Net
realizable value is determined on the basis of anticipated sales proceeds less the estimated selling expenses. Management compares the
cost of inventories with the net realizable value and an adjustment is made to write down inventories to net realizable value, if
lower.
Fixed
Assets and Equipment on Lease
Fixed
assets and equipment on lease are stated at cost less accumulated depreciation. Fixed assets and equipment on lease are depreciated using
the straight-line method over the shorter of the estimated useful life of the asset or the lease term. The estimated useful lives of
fixed assets are generally as follows:
SCHEDULE
OF ESTIMATED USEFUL LIVES OF EQUIPMENT
| Furniture
and equipment |
5-years
straight-line |
| Vehicles |
5-years
straight-line |
| Computer
equipment |
3-years
straight-line |
| Machinery |
5-years
straight-line |
| Equipment
on lease |
5-years
straight-line |
Intangible
Assets
Intangible
assets are stated at cost less accumulated amortization and are comprised of patents. The patents are amortized straight-line over the
estimated useful life of 20 years and are reviewed annually for impairment.
Impairment
of Long-Lived Assets
The
Company reviews long-lived assets such as equipment, equipment on lease, and intangible assets with finite useful lives for impairment
whenever events or changes in circumstance indicate that the carrying amount may not be recoverable. If the total of the expected undiscounted
future cash flows is less than the carrying value of the asset, a loss is recognized for the excess of the carrying amount over the fair
value of the asset.
Financial
Instruments and Fair Value Measurements
The
Company analyzes all financial instruments with features of both liabilities and equity under ASC 480, “Distinguishing Liabilities
from Equity,” and ASC 815 “Derivatives and Hedging”.
ASC
820, “Fair Value Measurements and Disclosures,” requires disclosure of the fair value of financial instruments held
by the Company. ASC 825, “Financial Instruments,” defines fair value, and establishes a three-level valuation hierarchy
for disclosures of fair value measurement that enhances disclosure requirements for fair value measures. The carrying amounts reported
in the consolidated balance sheets for receivables and current liabilities each qualify as financial instruments and are a reasonable
estimate of their fair values because of the short period of time between the origination of such instruments and their expected realization
and their current market rate of interest. The three levels of valuation hierarchy are defined as follows:
Level
1
Level
1 applies to assets or liabilities for which there are quoted prices in active markets for identical assets or liabilities.
Level
2
Level
2 applies to assets or liabilities for which there are inputs other than quoted prices that are observable for the asset or liability
such as quoted prices for similar assets or liabilities in active markets; quoted prices for identical assets or liabilities in markets
with insufficient volume or infrequent transactions (less active markets); or model-derived valuations in which significant inputs are
observable or can be derived principally from, or corroborated by, observable market data.
Level
3
Level
3 applies to assets or liabilities for which there are unobservable inputs to the valuation methodology that are significant to the measurement
of the fair value of the assets or liabilities.
The
Company’s financial instruments consist of cash, trade receivables, trade and other payables, lease liabilities, convertible note
payable to related party, loans payable, derivative liabilities and convertible notes payable. Except for cash, loans payable, and derivative
liabilities, the Company’s financial instruments’ carrying amounts, excluding any unamortized discounts, approximate their
fair values due to their short term to maturity. The fair value of long-term lease liabilities approximates their carrying value due
to minimal changes in interest rates and the Company’s credit risk since initial recognition. Cash and derivative liabilities are
measured and recognized at fair value based on level 1 and level 2 inputs, respectively, for all periods presented.
Government
Grants
Government
grants are recognized where there is reasonable assurance that the grant will be received, and all attached conditions will be complied
with. When the grant relates to an expense item, it is recognized as income over the period necessary to match the grant on a systematic
basis to the costs that it is intended to compensate. The Canadian Emergency Business Account (“CEBA”) are recognized as
government grants. See Note 8 (a) and (b).
Loss
per Share
The
Company computes net income (loss) per share in accordance with ASC 260, Earnings per Share. ASC 260 requires presentation of both basic
and diluted earnings per share (“EPS”) on the face of the consolidated statement of operations. Basic EPS is computed by
dividing net income (loss) available to common shareholders (numerator) by the weighted average number of shares outstanding (denominator)
during the period. Diluted EPS gives effect to all dilutive potential common shares outstanding during the period using the treasury
stock method and convertible preferred stock using the if-converted method. In computing diluted EPS, the average stock price for the
period is used in determining the number of shares assumed to be purchased from the exercise of stock options or warrants. Diluted EPS
excludes all dilutive potential shares if their effect is anti-dilutive.
Stock-Based
Compensation
The
Company records stock-based compensation in accordance with ASC 718, “Compensation – Stock Compensation”, using the
fair value method. All transactions in which goods or services are the consideration received for the issuance of equity instruments
are accounted for based on the fair value of the consideration received or the fair value of the equity instrument issued, whichever
is more reliably measurable.
The
Company uses the Black-Scholes option pricing model to calculate the fair value of stock-based awards. This model is affected by the
Company’s stock price as well as assumptions regarding a number of subjective variables. These subjective variables include but
are not limited to the Company’s expected stock price volatility over the term of the awards, and actual and projected employee
stock option exercise behaviors. The value of the portion of the award that is ultimately expected to vest is recognized as an expense
in the consolidated statement of operations over the requisite service period. During the years ended December 31, 2022, and 2021 there
was no stock-based compensation.
Leases
The
Company accounts for leases in accordance with ASC 842 “Leases”.
Lessee
Arrangements
The
Company determines if an arrangement is a lease at inception. Operating and financing right-of-use assets and lease liabilities are included
within fixed assets on the consolidated balance sheets. Right-of-use assets represent our right to use an underlying asset for the lease
term and lease liabilities represent our obligation to make lease payments arising from the lease. Right-of-use assets and liabilities
are recognized at commencement date based on the present value of lease payments over the lease term. The Company uses its incremental
borrowing rate, based on the information available at the commencement date, in determining the present value of future lease payments.
Right-of-use assets include any prepaid lease payments and exclude any lease incentives and initial direct costs incurred. Operating
lease expenses are recognized on a straight-line basis over the term of the lease, consisting of interest accrued on the lease liability
and depreciation of the right-of-use asset. The lease terms may include options to extend or terminate the lease if it is reasonably
certain the Company will exercise that option.
Lessor
Arrangements
The
Company determines if an arrangement is a lease at inception. The Company then determines whether to classify the lease as a sales-type
or direct financing lease. At commencement date, a lessor shall derecognize the underlying asset and recognize the net investment in
the lease, selling profit or loss arising from the lease, and initial direct directs as an expense if the fair value of the underlying
asset is different from it carrying amount. The lease receivable (or net investment in the lease) is included on the consolidated balance
sheets. The lease receivable amount is recognized based on the present value of lease payments over the lease term and the present value
of the unguaranteed residual asset, except when the lease is a direct financing lease, whereby the net investment in the lease should
be reduced by the amount of any selling profit. The unguaranteed residual asset is the amount the lessor expects to derive from the underlying
asset following the end of the lease term. The Company uses the rate implicit in the lease agreement at the date of commencement, in
determining the present value of the future lease payments and unguaranteed residual asset. Interest income is recognized over the term
of the lease and lease payments are recognized against the lease receivable balance when received. Currently, the Company only has sales-type
operating leases.
Recently
Issued Accounting Pronouncements
Applicable
for fiscal years beginning after December 15, 2022:
In
July 2022, FASB issued ASU 2022-03, Fair Value Measurement (Topic 820); Fair Value Measurement of Equity Securities Subject to Contractual
Sale Restrictions. The FASB issued final guidance to clarify that a contractual restriction on the sale of an equity security is
not considered part of the unit of account of the equity security and, therefore, is not considered when measuring fair value. Recognizing
a contractual sale restriction as a separate unit of account is not permitted. The guidance will be applied prospectively, with special
transition provisions for entities that qualify as investment companies under ASC 946. The guidance is effective in 2024 for calendar-year
public business entities and in 2025 for all other calendar-year companies. Early adoption is permitted.
In
October 3, 2022, FASB issued ASU 2022-04, Liabilities — Supplier Finance Programs (Subtopic 405-50): Disclosure of Supplier
Finance Program Obligations. The FASB issued final guidance that requires entities that use supplier finance programs in connection
with the purchase of goods and services to disclose the key terms of the programs and information about their obligations outstanding
at the end of the reporting period, including a rollforward of those obligations. The guidance does not affect the recognition, measurement
or financial statement presentation of supplier finance program obligations. The guidance should be applied retrospectively to all periods
in which a balance sheet is presented, except for the rollforward requirement, which should be applied prospectively. The guidance is
effective for all entities for fiscal years beginning after 15 December 2022, including interim periods within those fiscal years, except
for the rollforward requirement, which is effective for fiscal years beginning after 15 December 2023. Early adoption is permitted.
|
| X |
- References
+ Details
| Name: |
us-gaap_AccountingPoliciesAbstract |
| Namespace Prefix: |
us-gaap_ |
| Data Type: |
xbrli:stringItemType |
| Balance Type: |
na |
| Period Type: |
duration |
|
| X |
- DefinitionThe entire disclosure for all significant accounting policies of the reporting entity. Reference 1: http://www.xbrl.org/2003/role/disclosureRef
-Publisher FASB
-Name Accounting Standards Codification
-Topic 235
-SubTopic 10
-Section 50
-Paragraph 1
-URI https://asc.fasb.org/extlink&oid=126899994&loc=d3e18726-107790
Reference 2: http://fasb.org/us-gaap/role/ref/legacyRef
-Publisher FASB
-Name Accounting Standards Codification
-Topic 235
-URI https://asc.fasb.org/topic&trid=2122369
| Name: |
us-gaap_SignificantAccountingPoliciesTextBlock |
| Namespace Prefix: |
us-gaap_ |
| Data Type: |
dtr-types:textBlockItemType |
| Balance Type: |
na |
| Period Type: |
duration |
|
v3.23.2
TRADE RECEIVABLES
|
12 Months Ended |
Dec. 31, 2022 |
|---|
| Receivables [Abstract] |
|
| TRADE RECEIVABLES |
Note
4 – TRADE RECEIVABLES
As
of December 31, 2022 and 2021, trade receivables consist of the following:
SCHEDULE
OF TRADE RECEIVABLES
| | |
December 31, 2022 | | |
December 31, 2021 | |
| Accounts receivables | |
$ | 711,028 | | |
$ | 271,950 | |
| Allowance for doubtful accounts | |
| - | | |
| (32,128 | ) |
| Total trade receivables, net | |
$ | 711,028 | | |
$ | 239,822 | |
|
| X |
- DefinitionThe entire disclosure for claims held for amounts due a entity, excluding financing receivables. Examples include, but are not limited to, trade accounts receivables, notes receivables, loans receivables. Includes disclosure for allowance for credit losses. Reference 1: http://www.xbrl.org/2009/role/commonPracticeRef
-Publisher FASB
-Name Accounting Standards Codification
-Topic 310
-SubTopic 10
-URI https://asc.fasb.org/subtopic&trid=2196772
| Name: |
us-gaap_LoansNotesTradeAndOtherReceivablesDisclosureTextBlock |
| Namespace Prefix: |
us-gaap_ |
| Data Type: |
dtr-types:textBlockItemType |
| Balance Type: |
na |
| Period Type: |
duration |
|
| X |
- References
+ Details
| Name: |
us-gaap_ReceivablesAbstract |
| Namespace Prefix: |
us-gaap_ |
| Data Type: |
xbrli:stringItemType |
| Balance Type: |
na |
| Period Type: |
duration |
|
v3.23.2
INVENTORIES
|
12 Months Ended |
Dec. 31, 2022 |
|---|
| Inventory Disclosure [Abstract] |
|
| INVENTORIES |
Note
5 – INVENTORIES
As
of December 31, 2022, and December 31, 2021, inventories consist of the following:
SCHEDULE
OF INVENTORIES
| | |
December 31, 2022 | | |
December 31, 2021 | |
| Parts and accessories | |
$ | 217,582 | | |
$ | 226,230 | |
| Golf carts | |
| 799,035 | | |
| 158,588 | |
| E-bikes | |
| 123,280 | | |
| 35,060 | |
| Electric vehicles | |
| 64,680 | | |
| 292,800 | |
| Total inventories | |
$ | 1,204,577 | | |
$ | 712,678 | |
|
| X |
- References
+ Details
| Name: |
us-gaap_InventoryDisclosureAbstract |
| Namespace Prefix: |
us-gaap_ |
| Data Type: |
xbrli:stringItemType |
| Balance Type: |
na |
| Period Type: |
duration |
|
| X |
- DefinitionThe entire disclosure for inventory. Includes, but is not limited to, the basis of stating inventory, the method of determining inventory cost, the classes of inventory, and the nature of the cost elements included in inventory. Reference 1: http://www.xbrl.org/2003/role/disclosureRef
-Publisher FASB
-Name Accounting Standards Codification
-Topic 330
-URI https://asc.fasb.org/topic&trid=2126998
| Name: |
us-gaap_InventoryDisclosureTextBlock |
| Namespace Prefix: |
us-gaap_ |
| Data Type: |
dtr-types:textBlockItemType |
| Balance Type: |
na |
| Period Type: |
duration |
|
v3.23.2
FIXED ASSETS AND EQUIPMENT ON LEASE
|
12 Months Ended |
Dec. 31, 2022 |
|---|
| Property, Plant and Equipment [Abstract] |
|
| FIXED ASSETS AND EQUIPMENT ON LEASE |
Note
6 – FIXED ASSETS AND EQUIPMENT ON LEASE
As
of December 31, 2022 and 2021, fixed assets consisted of the following:
SCHEDULE OF FIXED ASSETS
| | |
December 31, 2022 | | |
December 31, 2021 | |
| Machinery | |
$ | 5,040 | | |
$ | 5,040 | |
| Furniture and equipment | |
| 2,587 | | |
| 2,350 | |
| Computer equipment | |
| 50,781 | | |
| 41,784 | |
| Vehicles | |
| 19,989 | | |
| 28,360 | |
| Fixed assets, gross | |
| 19,989 | | |
| 28,360 | |
| Accumulated depreciation | |
| (52,851 | ) | |
| (42,220 | ) |
| Fixed assets, net | |
$ | 25,546 | | |
$ | 35,314 | |
For
the year ended December 31, 2022, total depreciation expense for fixed assets and equipment on lease was $12,442 (2021 - $12,225) and
is included in general and administration expense. For the year ended December 31, 2022, total depreciation for right-of-use assets was
$111,465 (2021 - $117,386) and is included in general and administration expense as operating lease expense.
|
| X |
- References
+ Details
| Name: |
us-gaap_PropertyPlantAndEquipmentAbstract |
| Namespace Prefix: |
us-gaap_ |
| Data Type: |
xbrli:stringItemType |
| Balance Type: |
na |
| Period Type: |
duration |
|
| X |
- DefinitionThe entire disclosure for long-lived, physical asset used in normal conduct of business and not intended for resale. Includes, but is not limited to, work of art, historical treasure, and similar asset classified as collections. Reference 1: http://www.xbrl.org/2003/role/disclosureRef
-Publisher FASB
-Name Accounting Standards Codification
-Topic 958
-SubTopic 360
-Section 50
-Paragraph 6
-URI https://asc.fasb.org/extlink&oid=126982197&loc=d3e99893-112916
Reference 2: http://fasb.org/us-gaap/role/ref/legacyRef
-Publisher FASB
-Name Accounting Standards Codification
-Topic 360
-URI https://asc.fasb.org/topic&trid=2155823
Reference 3: http://www.xbrl.org/2003/role/disclosureRef
-Publisher FASB
-Name Accounting Standards Codification
-Topic 958
-SubTopic 360
-Section 50
-Paragraph 7
-URI https://asc.fasb.org/extlink&oid=126982197&loc=SL120174063-112916
Reference 4: http://www.xbrl.org/2003/role/disclosureRef
-Publisher FASB
-Name Accounting Standards Codification
-Topic 958
-SubTopic 360
-Section 50
-Paragraph 1
-Subparagraph (d)
-URI https://asc.fasb.org/extlink&oid=126982197&loc=d3e99779-112916
| Name: |
us-gaap_PropertyPlantAndEquipmentDisclosureTextBlock |
| Namespace Prefix: |
us-gaap_ |
| Data Type: |
dtr-types:textBlockItemType |
| Balance Type: |
na |
| Period Type: |
duration |
|
v3.23.2
INTANGIBLE ASSETS
|
12 Months Ended |
Dec. 31, 2022 |
|---|
| Goodwill and Intangible Assets Disclosure [Abstract] |
|
| INTANGIBLE ASSETS |
Note
7 – INTANGIBLE ASSETS
As
of December 31, 2022 and 2021, intangible assets consisted of the following:
SCHEDULE OF INTANGIBLE ASSETS
| | |
December 31, 2022 | | |
December 31, 2021 | |
| Intangible asset - Patents | |
$ | 22,353 | | |
$ | 22,353 | |
| Accumulated amortization | |
| (11,977 | ) | |
| (10,749 | ) |
| Intangible asset, net | |
$ | 10,376 | | |
$ | 11,604 | |
Patents
are amortized on a straight-line basis over their estimated useful life of 20 years. For the year ended December 31, 2022, total amortization
expense for intangible assets was $1,228 (2021 - $1,229).
|
| X |
- References
+ Details
| Name: |
us-gaap_GoodwillAndIntangibleAssetsDisclosureAbstract |
| Namespace Prefix: |
us-gaap_ |
| Data Type: |
xbrli:stringItemType |
| Balance Type: |
na |
| Period Type: |
duration |
|
| X |
- DefinitionThe entire disclosure for all or part of the information related to intangible assets. Reference 1: http://www.xbrl.org/2003/role/disclosureRef
-Publisher FASB
-Name Accounting Standards Codification
-Topic 350
-SubTopic 30
-URI https://asc.fasb.org/subtopic&trid=2144471
| Name: |
us-gaap_IntangibleAssetsDisclosureTextBlock |
| Namespace Prefix: |
us-gaap_ |
| Data Type: |
dtr-types:textBlockItemType |
| Balance Type: |
na |
| Period Type: |
duration |
|
v3.23.2
TRADE AND OTHER PAYABLES
|
12 Months Ended |
Dec. 31, 2022 |
|---|
| Payables and Accruals [Abstract] |
|
| TRADE AND OTHER PAYABLES |
Note
8 – TRADE AND OTHER PAYABLES
As
of December 31, 2022, and 2021, trade and other payables consist of the following:
SCHEDULE OF TRADE AND OTHER PAYABLES
| | |
December 31, 2022 | | |
December 31, 2021 | |
| Accounts payable and accrued expenses | |
$ | 1,462,557 | | |
$ | 949,937 | |
| Accrued interest | |
| 1,880,463 | | |
| 248,610 | |
| Other liabilities | |
| 13,236 | | |
| 4,051 | |
| Total trade and other payables | |
$ | 3,356,256 | | |
$ | 1,202,598 | |
|
| X |
- DefinitionThe entire disclosure for accounts payable and accrued liabilities at the end of the reporting period. Reference 1: http://fasb.org/us-gaap/role/ref/legacyRef
-Publisher FASB
-Name Accounting Standards Codification
-Topic 210
-SubTopic 10
-Section S99
-Paragraph 1
-Subparagraph (SX 210.5-02.19(a),20,24)
-URI https://asc.fasb.org/extlink&oid=120391452&loc=d3e13212-122682
| Name: |
us-gaap_AccountsPayableAndAccruedLiabilitiesDisclosureTextBlock |
| Namespace Prefix: |
us-gaap_ |
| Data Type: |
dtr-types:textBlockItemType |
| Balance Type: |
na |
| Period Type: |
duration |
|
| X |
- References
+ Details
| Name: |
us-gaap_PayablesAndAccrualsAbstract |
| Namespace Prefix: |
us-gaap_ |
| Data Type: |
xbrli:stringItemType |
| Balance Type: |
na |
| Period Type: |
duration |
|
v3.23.2
LOANS PAYABLE
|
12 Months Ended |
Dec. 31, 2022 |
|---|
| Debt Disclosure [Abstract] |
|
| LOANS PAYABLE |
Note
9 – LOANS PAYABLE
As
of December 31, 2022 and 2021, loans payable consisted of the following:
SCHEDULE OF LOANS PAYABLE
| | |
December 31, 2022 | | |
December 31, 2021 | |
| Unsecured loan payable in the amount of CDN$40,000, due on or before December 31, 2025(a) | |
$ | 29,520 | | |
| 31,449 | |
| Unsecured loan payable in the amount of CDN$40,000, due on or before December 31, 2025 (b) | |
| 29,520 | | |
| 31,449 | |
| Unsecured loan payable, due on May 21, 2022, interest at 1% per annum(c) | |
| - | | |
| 30,115 | |
| Secured loan payable, due on June 5, 2050, interest at 3.75% per annum(d) | |
| 150,000 | | |
| 150,000 | |
| Unsecured loan payable, due on June 20, 2022, interest at 9% per annum(e) | |
| - | | |
| 2,084,934 | |
| Unsecured loan payable, due on December
1, 2025, interest at 10%
per annum(f) | |
| 1,000,000 | | |
| - | |
| Preferred F series shares issued with mandatory redemption(g) | |
| 1,357,651 | | |
| - | |
| | |
| 2,566,692 | | |
| 2,327,947 | |
| Current portion | |
| (2,416,692 | ) | |
| (2,115,049 | ) |
| Loans payable, long-term portion | |
$ | 150,000 | | |
$ | 212,898 | |
| (a) |
On April 17, 2020, the
Company received a loan in the principal amount of $29,520 (CDN$40,000) under the Canada Emergency Business Account program. The
loan is non-interest bearing and eligible for CDN$10,000 forgiveness if repaid by December 31, 2022. If not repaid by December 31,
2022, the loan bears interest at 5% per annum and is due on December 31, 2025. |
| |
|
| (b) |
On April 21, 2020, the
Company received a loan in the principal amount of $29,520 (CDN$40,000) under the Canada Emergency Business Account program. The
loan is non-interest bearing and eligible for CDN$10,000 forgiveness if repaid by December 31, 2022. If not repaid by December 31,
2022, the loan bears interest at 5% per annum and is due on December 31, 2025. |
| |
|
| (c) |
On May 21, 2020, the Company
received a loan in the principal amount of $30,115 under the Paycheck Protection Program. The loan bears interest at 1% per annum
and is due on May 21, 2022, with payments deferred for the first six months of the term. This loan was forgiven and was recorded
to gain on debt extinguishment during the year ended December 31, 2022 |
| |
|
| (d) |
On June 5, 2020, the Company
received a loan in the principal amount of $150,000. The loan bears interest at 3.75% per annum and is due on June 5, 2050. The loan
is secured by all tangible and intangible assets of Company. Fixed payments of $731 are due monthly and begin 12 months from the
date of the loan. The payments are applied against any accrued interest before principal amounts are repaid. |
| (e) |
On
September 13, 2021, the Company entered into a securities purchase agreement with a non-related party. Pursuant to the agreement,
the Company received cash proceeds of $2,000,000
on September 13, 2021,
in exchange for the issuance of an unsecured promissory note in the principal amount of $2,400,000,
which was inclusive of a $400,000
original issue discount
and bears interest at 9%
per annum to the holder and matures June
20, 2022. If
the note is not paid in full before December 12, 2021, an additional $100,000 of guaranteed interest will be added to the note. An
additional $100,000 of guaranteed interest will be added to the note on the 12th day of each succeeding month during which
any portion of the note remains unpaid.
Any principal or interest on the note that is not paid when due or during any period of default bears interest at 24% per annum. |
| |
|
| |
In the event of a default,
the note is convertible at the price that is equal to a 40% discount to the lowest trading price of the Company’s common shares
during the 30-day trading period prior to the conversion date. |
| |
|
| |
During the year ended December
31, 2022, the Company recorded $1,918,065 in interest expense including $1,603,000 of additional interest. As at December 31, 2022,
the carrying value of the convertible promissory note was $2,400,000 (December 31, 2021 - $2,084,935). |
| |
|
| |
As
the note is in default, it has become convertible at the holder’s request. The fair value of the loan approximates carrying
value as it is now short term in nature, effectively due on demand. |
| |
|
| (f) |
On
December 1, 2022, the Company received a loan in the principal amount of $1,000,000.
The loan bears interest at 10%
per annum and is due on December 1, 2025. If not repaid by December 31, 2025, the loan bears interest at 18%
per annum. |
| |
|
| (g) |
On February 17, 2022, the
Company entered into a Waiver of Conditions (the “Waiver”) to the Share Purchase Agreement (the “SPA”) dated
December 13, 2021. The Company has received five payments in the amount of $250,000 on February 28, 2022, $250,000 on March 31, 2022,
$90,000 on July 29, 2022, $250,000 on August 29, 2022, $125,000 on September 15, 2022, $125,000 on October 18, 2022, and $285,000
on October 21, 2022, for 1,375 preferred series F shares in total. Under the Waiver, the Company agrees to repay these amounts, on
an ongoing basis, by remitting 20% of all gross sales back to the subscriber until such time that the 500 shares of the Series F
Preferred Stock issued pursuant to this Waiver agreement are redeemed in full. As these preferred F series shares subscribed for
under the Waiver are mandatorily redeemable, the total amounts of $1,375,000 were recorded as liabilities, as per ASC 480-10. Under
the original terms of the SPA, redemption of preferred F series shares requires a 15% premium payment on the face value. As such,
a total Redemption Premium of $75,000 will be paid on the redemption as part of the 20% gross sales remittance, and will be amortized
as the repayments are made. During the year ended December 31, 2022, $3,062 was recognized, and recorded as interest expense, included
as part of the loan. |
| |
|
| |
During the year ended December
31, 2022, the Company made required payments in the amount of $20,411, which was applied against the loan payable. |
|
| X |
- References
+ Details
| Name: |
us-gaap_DebtDisclosureAbstract |
| Namespace Prefix: |
us-gaap_ |
| Data Type: |
xbrli:stringItemType |
| Balance Type: |
na |
| Period Type: |
duration |
|
| X |
- DefinitionThe entire disclosure for long-term debt. Reference 1: http://fasb.org/us-gaap/role/ref/legacyRef
-Publisher FASB
-Name Accounting Standards Codification
-Topic 470
-URI https://asc.fasb.org/topic&trid=2208564
| Name: |
us-gaap_LongTermDebtTextBlock |
| Namespace Prefix: |
us-gaap_ |
| Data Type: |
dtr-types:textBlockItemType |
| Balance Type: |
na |
| Period Type: |
duration |
|
v3.23.2
CONVERTIBLE LOANS
|
12 Months Ended |
Dec. 31, 2022 |
|---|
| Debt Disclosure [Abstract] |
|
| CONVERTIBLE LOANS |
Note
10 – CONVERTIBLE LOANS
As
of December 31, 2022, and 2021, convertible loans payable consisted of the following:
Third
Party Convertible Notes Payable
| (a) |
On March 31, 2015, the Company issued a convertible
promissory note in the principal amount of $310,000 to a company owned by a former director of the Company for marketing services.
The note is unsecured, bears interest at 5% per annum, is convertible at $1.25 per common share, and is due on demand. As at December
31, 2022, the carrying value of the convertible promissory note was $310,000 (December 31, 2021 - $310,000). |
| |
|
| (b) |
On June 5, 2017, the Company issued a convertible promissory
note in the principal amount of $110,000. As at December 31, 2022, the carrying value of the note was $9,488 (December 31, 2021 -
$9,439), relating to an outstanding penalty. |
| |
|
| (c) |
As per Note 9 (e) above, the $2,400,000 convertible
note went into default, and therefore it has become convertible at the holder’s request. The fair value of the loan approximates
carrying value as it is now short term in nature, effectively due on demand. |
|
| X |
- References
+ Details
| Name: |
us-gaap_DebtDisclosureAbstract |
| Namespace Prefix: |
us-gaap_ |
| Data Type: |
xbrli:stringItemType |
| Balance Type: |
na |
| Period Type: |
duration |
|
| X |
- DefinitionThe entire disclosure for information about short-term and long-term debt arrangements, which includes amounts of borrowings under each line of credit, note payable, commercial paper issue, bonds indenture, debenture issue, own-share lending arrangements and any other contractual agreement to repay funds, and about the underlying arrangements, rationale for a classification as long-term, including repayment terms, interest rates, collateral provided, restrictions on use of assets and activities, whether or not in compliance with debt covenants, and other matters important to users of the financial statements, such as the effects of refinancing and noncompliance with debt covenants. Reference 1: http://fasb.org/us-gaap/role/ref/legacyRef
-Publisher FASB
-Name Accounting Standards Codification
-Topic 470
-URI https://asc.fasb.org/topic&trid=2208564
Reference 2: http://www.xbrl.org/2003/role/disclosureRef
-Publisher FASB
-Name Accounting Standards Codification
-Topic 470
-SubTopic 20
-Section 50
-Paragraph 1B
-Subparagraph (h)
-URI https://asc.fasb.org/extlink&oid=123466505&loc=SL123495323-112611
Reference 3: http://www.xbrl.org/2003/role/disclosureRef
-Publisher FASB
-Name Accounting Standards Codification
-Topic 470
-SubTopic 20
-Section 50
-Paragraph 1C
-Subparagraph (c)
-URI https://asc.fasb.org/extlink&oid=123466505&loc=SL123495334-112611
Reference 4: http://www.xbrl.org/2003/role/disclosureRef
-Publisher FASB
-Name Accounting Standards Codification
-Topic 470
-SubTopic 20
-Section 50
-Paragraph 1I
-Subparagraph (a)
-URI https://asc.fasb.org/extlink&oid=123466505&loc=SL123495371-112611
Reference 5: http://www.xbrl.org/2003/role/disclosureRef
-Publisher FASB
-Name Accounting Standards Codification
-Topic 470
-SubTopic 20
-Section 50
-Paragraph 1I
-Subparagraph (d)
-URI https://asc.fasb.org/extlink&oid=123466505&loc=SL123495371-112611
Reference 6: http://www.xbrl.org/2003/role/disclosureRef
-Publisher FASB
-Name Accounting Standards Codification
-Topic 235
-SubTopic 10
-Section S99
-Paragraph 1
-Subparagraph (SX 210.4-08(c))
-URI https://asc.fasb.org/extlink&oid=120395691&loc=d3e23780-122690
Reference 7: http://www.xbrl.org/2003/role/disclosureRef
-Publisher FASB
-Name Accounting Standards Codification
-Topic 470
-SubTopic 20
-Section 50
-Paragraph 1B
-Subparagraph (g)
-URI https://asc.fasb.org/extlink&oid=123466505&loc=SL123495323-112611
Reference 8: http://www.xbrl.org/2003/role/disclosureRef
-Publisher FASB
-Name Accounting Standards Codification
-Topic 470
-SubTopic 20
-Section 50
-Paragraph 1C
-Subparagraph (b)
-URI https://asc.fasb.org/extlink&oid=123466505&loc=SL123495334-112611
Reference 9: http://www.xbrl.org/2003/role/disclosureRef
-Publisher FASB
-Name Accounting Standards Codification
-Topic 470
-SubTopic 20
-Section 50
-Paragraph 1C
-Subparagraph (a)
-URI https://asc.fasb.org/extlink&oid=123466505&loc=SL123495334-112611
Reference 10: http://www.xbrl.org/2003/role/disclosureRef
-Publisher FASB
-Name Accounting Standards Codification
-Topic 470
-SubTopic 20
-Section 50
-Paragraph 1E
-Subparagraph (b)
-URI https://asc.fasb.org/extlink&oid=123466505&loc=SL123495348-112611
Reference 11: http://www.xbrl.org/2003/role/disclosureRef
-Publisher FASB
-Name Accounting Standards Codification
-Topic 470
-SubTopic 20
-Section 50
-Paragraph 1B
-URI https://asc.fasb.org/extlink&oid=123466505&loc=SL123495323-112611
Reference 12: http://www.xbrl.org/2003/role/disclosureRef
-Publisher FASB
-Name Accounting Standards Codification
-Topic 470
-SubTopic 20
-Section 50
-Paragraph 1I
-Subparagraph (b)
-URI https://asc.fasb.org/extlink&oid=123466505&loc=SL123495371-112611
Reference 13: http://www.xbrl.org/2003/role/disclosureRef
-Publisher FASB
-Name Accounting Standards Codification
-Topic 470
-SubTopic 20
-Section 50
-Paragraph 1B
-Subparagraph (i)
-URI https://asc.fasb.org/extlink&oid=123466505&loc=SL123495323-112611
| Name: |
us-gaap_DebtDisclosureTextBlock |
| Namespace Prefix: |
us-gaap_ |
| Data Type: |
dtr-types:textBlockItemType |
| Balance Type: |
na |
| Period Type: |
duration |
|
v3.23.2
LEASES
|
12 Months Ended |
Dec. 31, 2022 |
|---|
| Leases |
|
| LEASES |
Note
11 – LEASES
Lessor
During
the year ended December 31, 2020, the Company began financing the lease of certain assets under rental revenue contracts with its customers
and accounts for them in accordance with ASC 842 as outlined under “Leases” in Note 3 of the consolidated financial statements
for the year ended December 31, 2020.
During
the year ended December 31, 2022, the Company recognized new lease receivables of $143,630, net of the $nil of leases transferred to
third party management (December 31, 2021 - $817,619 net of $120,231 of leases transferred to third party management). The lease receivable
reflects lease payments expected to be received over the terms of the agreements and derecognized $12,240 (December 31, 2021 - $492,096)
in inventory related to the underlying assets, being recorded to cost of goods sold. During the year ended December 31, 2022, the Company
sold $867,450 of lease receivables to a third party for $863,527. As a result of the sale, the Company derecognized the carrying value
of $867,450 for the leases sold on the date of the transaction and recognized a loss of $3,923 in other income and expenses.
SCHEDULE OF LEASE RECEIVABLES RECOGNIZED
| Lease receivable | |
December 31, 2022 | | |
December 31, 2021 | |
| Balance, beginning of the period | |
$ | 810,236 | | |
$ | 42,856 | |
| Additions | |
| 143,630 | | |
| 937,850 | |
| Transfer to third party | |
| (867,450 | ) | |
| (120,231 | ) |
| Interest on lease receivables | |
| 20,841 | | |
| 19,452 | |
| Receipt of payments | |
| (81,979 | ) | |
| (60,445 | ) |
| Foreign exchange | |
| (5,733 | ) | |
| (9,246 | ) |
| Balance, end of the period | |
| 19,545 | | |
| 810,236 | |
| Current portion of lease receivables | |
| (3,627 | ) | |
| (87,020 | ) |
| Long term potion of lease receivables | |
$ | 15,918 | | |
$ | 723,216 | |
Lease
receivables are measured at the commencement date based on the present value of future lease payments less the present value of the unguaranteed
residual asset. The Company used the rate implicit in the rental revenue contracts to calculate the present value of future payments
and unguaranteed residual asset at the date of commencement.
Lessee
The
Company leases certain assets under lease agreements.
On
October 1, 2019, the Company entered into a 5-year lease agreement for a photocopier (the “Copier Lease”). Upon recognition
of the lease, the Company recognized right-of-use assets of $8,683 and lease liabilities of $8,683. As of December 31, 2022, the Copier
lease had a remaining term of 1.75 years.
On
July 10, 2020, the Company entered into a lease agreement for retail, showroom and warehouse space in Fairfield, CA (the “Fairfield
Lease”). Upon initial recognition of the lease, the Company recognized right-of-use assets of $164,114 and lease liabilities of
$156,364. The difference between the recorded operating lease assets and lease liabilities is due to prepaid rent deposits to be applied
to first months’ rent of $7,750. The lease included a rent-free period with rent payments commencing on October 1, 2020. On August
10, 2022, the lease ended.
On
July 14, 2020, the Company entered into a lease agreement for office space in Surrey, BC (the “Croydon Lease”). Upon initial
recognition of the lease, the Company recognized right-of-use assets of $133,825 and lease liabilities of $125,014. The difference between
the recorded operating lease assets and lease liabilities is due to prepaid rent deposits to be applied to first months’ rent of
$8,811 (CDN$11,948). The lease included a rent-free period with rent payments commencing on September 1, 2020. As of December 31, 2022,
the lease had a remaining term of 0.58 years.
On
April 1, 2021, the Company entered into a lease agreement for equipment (the “FD150 Lease”). Upon initial recognition of
the lease, the Company recognized right-of-use assets of $1,018 and lease liabilities of $1,018. As of December 31, 2022, the Copier
lease had a remaining term of 1.33 years.
On
June 2, 2021, the Company entered into a lease agreement for a trailer (the “Trailer Lease”). Upon initial recognition of
the lease, the Company recognized right-of-use assets of $8,886 and lease liabilities of $8,886. As of December 31, 2022, the Copier
lease had a remaining term of 2.42 years.
Right-of-use
assets have been included within fixed assets, net and lease liabilities have been included in lease liability on the Company’s
consolidated balance sheet.
SCHEDULE OF CONSOLIDATED BALANCE SHEET OF LEASE
| Right-of-use assets | |
December 31, 2022 | | |
December 31, 2021 | |
| Cost | |
$ | 312,318 | | |
$ | 312,318 | |
| Accumulated depreciation | |
| (282,251 | ) | |
| (170,530 | ) |
| Foreign exchange | |
| (506 | ) | |
| 29 | |
| Total right-of-use assets | |
$ | 29,561 | | |
$ | 141,880 | |
| Lease liability | |
December 31, 2022 | | |
December 31, 2021 | |
| Current portion | |
$ | 35,670 | | |
$ | 121,270 | |
| Long-term portion | |
| 4,982 | | |
| 38,696 | |
| Total lease liability | |
$ | 40,652 | | |
$ | 159,966 | |
Lease
liabilities are measured at the commencement date based on the present value of future lease payments. As the Company’s leases
did not provide an implicit rate, the Company used its incremental borrowing rate based on the information available at the commencement
date in determining the present value of future payments. The Company used a weighted average discount rate of 11.98% in determining
its lease liabilities. The discount rate was derived from the Company’s assessment of borrowings.
Right-of-use
assets include any prepaid lease payments and exclude any lease incentives and initial direct costs incurred. Lease expense for minimum
lease payments is recognized on a straight-line basis over the lease term. The lease terms may include options to extend or terminate
the lease if it is reasonably certain that the Company will exercise that option.
Lease
expense for the year ended December 31, 2022, was $118,843 (2021 - $144,758) and is recorded in general and administration expense.
Future
minimum lease payments to be paid by the Company as a lessee for leases as of December 31, 2022 for the next three years are as follows:
SCHEDULE OF FUTURE MINIMUM LEASE PAYMENTS
| Lease commitments and lease liability | |
December 31, 2022 | |
| 2023 | |
$ | 37,814 | |
| 2024 | |
| 4,300 | |
| 2025 | |
| 1,070 | |
| Total future minimum lease payments | |
| 43,184 | |
| Discount | |
| (2,532 | ) |
| Total | |
| 40,652 | |
| Current portion of lease liabilities | |
| (35,670 | ) |
| Long-term portion of lease liabilities | |
$ | 4,982 | |
|
| X |
- References
+ Details
| Name: |
DSGT_DisclosureLeasesAbstract |
| Namespace Prefix: |
DSGT_ |
| Data Type: |
xbrli:stringItemType |
| Balance Type: |
na |
| Period Type: |
duration |
|
| X |
- DefinitionThe entire disclosure for operating leases of lessee. Includes, but is not limited to, description of operating lease and maturity analysis of operating lease liability. Reference 1: http://www.xbrl.org/2003/role/disclosureRef
-Publisher FASB
-Name Accounting Standards Codification
-Topic 842
-SubTopic 20
-URI https://asc.fasb.org/subtopic&trid=77888251
| Name: |
us-gaap_LesseeOperatingLeasesTextBlock |
| Namespace Prefix: |
us-gaap_ |
| Data Type: |
dtr-types:textBlockItemType |
| Balance Type: |
na |
| Period Type: |
duration |
|
v3.23.2
MEZZANINE EQUITY
|
12 Months Ended |
Dec. 31, 2022 |
|---|
| Mezzanine Equity |
|
| MEZZANINE EQUITY |
Note
12 – MEZZANINE EQUITY
Authorized
5,000,000
shares of redeemable Series C preferred shares, authorized, each having a par value of $0.001 per share. Each share of Series C preferred
shares is convertible into shares of common stock at a conversion rate equal to the lowest traded price for the fifteen trading days
immediately preceding the date of conversion.
1,000,000
shares of redeemable Series D preferred shares, authorized, each having a par value of $0.001 per share. Each share of Series D preferred
shares is convertible into 5 shares of common stock.
5,000,000
shares of redeemable Series E preferred shares, authorized, each having a par value of $0.001 per share. Each share of Series E preferred
shares is convertible into 4 shares of common stock.
10,000
shares of redeemable Series F preferred shares, authorized, each having a par value of $0.001 per share. Each share of Series F preferred
shares is convertible into common stock at an amount equal to the lesser of (a) one hundred percent of the lowest traded price for the
Company’s stock for the fifteen trading days immediately preceding the relevant Conversion and (b) a twenty percent discount to
the price of the common stock in an offering with gross proceeds of at least $10,000,000.
The
following table summarizes the Company’s redeemable preferred share activities for the years ended December 31, 2022, and December
31, 2021.
SCHEDULE
OF REDEEMABLE PREFERRED SHARE ACTIVITIES
| | |
Shares | | |
Par | | |
Additional paid in capital | | |
To be issued | | |
Total | |
| Balance December 31, 2020 | |
| 49,230 | | |
$ | 49 | | |
$ | 1,007,895 | | |
$ | 1,265,799 | | |
$ | 2,273,743 | |
| Issuance | |
| 3,500 | | |
| 4 | | |
| 2,731,989 | | |
| (745,926 | ) | |
| 1,986,067 | |
| Converted for common shares | |
| (1,926 | ) | |
| (2 | ) | |
| (1,538,098 | ) | |
| - | | |
| (1,538,100 | ) |
| Accrued preferred stock dividends | |
| - | | |
| - | | |
| - | | |
| 455,500 | | |
| 455,500 | |
| Balance, December 31, 2021 | |
| 50,804 | | |
$ | 51 | | |
$ | 2,201,786 | | |
$ | 975,373 | | |
$ | 3,177,210 | |
| | |
| | | |
| | | |
| | | |
| | | |
| | |
| Balance December 31, 2021 | |
| 50,804 | | |
$ | 51 | | |
$ | 2,201,786 | | |
$ | 975,373 | | |
$ | 3,177,210 | |
| Balance | |
| 50,804 | | |
$ | 51 | | |
$ | 2,201,786 | | |
$ | 975,373 | | |
$ | 3,177,210 | |
| Issuance | |
| 1,839 | | |
| - | | |
| 714,000 | | |
| (464,000 | ) | |
| 250,000 | |
| Converted for common shares | |
| (620 | ) | |
| - | | |
| (302,556 | ) | |
| (33,808 | )(2) | |
| (336,364 | ) |
| Accrued preferred stock dividends(1) | |
| - | | |
| - | | |
| (838,064 | ) | |
| 382,563 | | |
| (455,501 | ) |
| Balance, December 31, 2022 | |
| 52,023 | | |
$ | 51 | | |
$ | 1,775,166 | | |
$ | 860,128 | | |
$ | 2,635,345 | |
| Balance | |
| 52,023 | | |
$ | 51 | | |
$ | 1,775,166 | | |
$ | 860,128 | | |
$ | 2,635,345 | |
| (1) |
The amount of $838,064
accrued against additional paid in capital includes the $455,500 of accrued dividends on redeemable preferred stock related to the
year ended December 31, 2021, and is the reclass described above in Note 3. |
| |
|
| (2) |
$33,808 was a balance
carried in the redeemable preferred shares to be issued from prior years, but does not relate to any shares that are required to
be issued. It should have been cleared out in fiscal 2019 when the Company completed its reverse stock split. It has been adjusted
in the year ended December 31, 2022. |
Mezzanine
Preferred Equity Transactions
During
the year ended December 31, 2022:
| |
● |
620 Series F Preferred Shares were converted into common
shares (see note 14). |
| |
|
|
| |
● |
On October 21, 2022, pursuant to the December 2021
Series F SPA, the Company received $410,000 for the subscription of 410 Series F preferred shares (see note 9(f)), as well as issued
96 Series F preferred shares to settle $96,000 in dividends payable. |
| |
|
|
| |
● |
On September 15, 2022, pursuant to the December 2021
Series F SPA, the Company received $125,000 for the subscription of 125 Series F preferred shares (see note 9(f)). The shares were
issued on October 18, 2022. |
| |
● |
On August 26, 2022, pursuant to the December 2021 Series
F SPA, the Company received $250,000 for the subscription of 250 Series F preferred shares (see note 9(f)). |
| |
|
|
| |
● |
On July 29, 2022, pursuant to the December 2021 Series
F SPA, the Company received $90,000 for the subscription of 90 Series F preferred shares, as well as issued 368 Series F preferred
shares to settle $368,000 in dividends payable. |
| |
|
|
| |
● |
On March 31, 2022, pursuant to the December 2021 Series
F SPA, the Company received $250,000 for the subscription of 250 Series F preferred shares (see note 9(f)). The shares were issued
on April 1, 2022. |
| |
|
|
| |
● |
On February 7, 2022, pursuant to the December 2021
Series F SPA, the Company received $250,000 for the subscription of 250 Series F preferred shares (see note 9(f)). |
| |
|
|
| |
● |
On January 4, 2022, pursuant to the December Series
2021 F SPA, the Company received $250,000 for the subscription of 250 Series F preferred shares (see note 9(f)). These shares were
issued April 1, 2022 and recorded as such. |
During
the year ended December 31, 2021:
| |
● |
1,512 Series C Preferred
Shares were converted into common shares, see note 14. |
| |
|
|
| |
● |
On November 6, 2020, the
Company received gross proceeds of $300,000 for 300 Series C Preferred Shares in lieu of the Second Closing for the Series C Share
Purchas Agreement (the “Series C SPA”). The shares were included in preferred shares to be issued at December 31, 2020.
The preferred shares were issued April 13, 2021. |
| |
|
|
| |
● |
On December 7, 2020, the
Company received gross proceeds of $200,000 for 200 Series C Preferred Shares in lieu of the Second Closing for the Series C SPA.
The shares are included in preferred shares to be issued as at December 31, 2020. The preferred shares were issued April 13, 2021.
|
| |
|
|
| |
● |
On
December 23, 2020, the Company entered into a Securities Purchase Agreement (the “Series F SPA”) whereby the Company
agreed to sell and the Purchaser agrees to purchase, in a series of closings (the “Closings”) of at least 1,000 Series
F preferred shares at a price of $1,000 per share. The First and Second Closings, will each be for 1,500 Preferred Shares at a purchase
price of $1,500,000, the Second Closing which will follow the filing of the Registration Statement. Any Additional Closings will
be for the purchase of at least 1,000 Series F preferred shares, every thirty calendar days, and shall follow the Registration Statement
being declared effective. The Company granted 3,000,000 warrants, with a relative fair value of $768,008, concurrently with the execution
of the Series F SPA and First Closing. The First Closing shares were included in preferred shares to be issued at December 31, 2020
with a relative fair value of $731,992. |
| |
|
|
| |
|
On February 4, 2021, the
Company issued 1,500 Series F preferred shares pursuant to the First Closing of the Series F SPA with a relative fair value of $731,992.
Additionally, the Company issued 1,500 Series F preferred shares pursuant to the Second Closing of the Series F SPA for gross proceeds
for $1,500,000. |
| |
|
|
| |
● |
On
June 10, 2021, pursuant to the Series F SPA, the Company received $350,000 for the subscription of an additional 350 Series F preferred
shares to be issued. |
| |
|
|
| |
● |
On
July 20, 2021, pursuant to another Securities Purchase Agreement (the “July Series F SPA”), the Company received $400,000
for the subscription of 400 Series F preferred shares with a relative fair value of $138,066 and 1,180,000 warrants with a relative
fair value of $261,934 valued on the agreement date which are recorded as obligation to issue shares and obligation to issue warrants
respectively at December 31, 2021, see note 14. |
| |
|
|
| |
● |
On
August 3, 2021, 275 Series F Preferred Shares were converted into common shares, see note 14. |
| |
● |
On
October 22, 2021, 210 Series F Preferred Shares were converted into common shares, see note 14. |
| |
|
|
| |
● |
On
November 30, 2021, 491 Series F Preferred Shares were converted into common shares, see note 14. |
| |
|
|
| |
● |
On
December 14, 2021, pursuant to another Securities Purchase Agreement (the “December Series F SPA”), the Company received
$312,000 for the subscription of 312 Series F preferred shares. $12,000 was incurred as share issuance costs. |
| |
|
|
| |
● |
On
December 31, 2021, pursuant to the December Series F SPA, the Company received $250,000 for the subscription of 250 Series F preferred
shares. |
Mezzanine
preferred equity, series C and series F, carry a dividend policy which entitles each preferred share to receive, and the Company to pay,
cumulative dividends of 10% per annum, payable quarterly, beginning on the original issuance date and ending on the date that such preferred
shares has been converted or redeemed. At the option of the Company, accrued dividends can be settled in preferred shares of the same
series, or in cash. Any dividends that are not paid quarterly on the dividend payment date shall entail a late fee, which must be paid
in cash at the rate of 18% per annum, which accrues and compounds daily from the dividend payment date, through to and including the
date of the actual payment in full. As at December 31, 2022 the Company recorded $382,563 in dividends to be settled in preferred shares,
and $107,081 in penalty interest.
|
| X |
- References
+ Details
| Name: |
DSGT_DisclosureMezzanineEquityAbstract |
| Namespace Prefix: |
DSGT_ |
| Data Type: |
xbrli:stringItemType |
| Balance Type: |
na |
| Period Type: |
duration |
|
| X |
- DefinitionTemporary equity [Text Block]
| Name: |
DSGT_TemporaryEquityTextBlock |
| Namespace Prefix: |
DSGT_ |
| Data Type: |
dtr-types:textBlockItemType |
| Balance Type: |
na |
| Period Type: |
duration |
|
v3.23.2
PREFERRED STOCK
|
12 Months Ended |
Dec. 31, 2022 |
|---|
| Equity [Abstract] |
|
| PREFERRED STOCK |
Note
13 – PREFERRED STOCK
Authorized
3,000,000
shares of Series A preferred shares authorized, each having a par value of $0.001 per share.
10,000
shares of Series B convertible preferred shares authorized, each having a par value of $0.001 per share. Each share of Series B convertible
preferred shares is convertible into 100,000 shares of common stock.
Preferred
Stock Transactions
During
the year ended December 31, 2022:
| |
● |
On November 3, 2022, the
Company issued 30 shares of Series B preferred shares to a consultant of the Company for services to be rendered. These preferred
shares were value at $213,000 based on the fair value of the underlying common stock. |
| |
|
|
| |
● |
On August 1, 2022, the
Company issued an aggregate of 191 shares of Series B preferred shares to the CEO of the Company for past services. These preferred
shares were value at $897,000 based on the fair value of the underlying common stock. |
| |
|
|
| |
● |
On June 27, 2022, the Company
issued an aggregate of 105 shares of Series B preferred shares to the Company’s board of directors for past services. These
preferred shares were value at $777,000 based on the fair value of the underlying common stock. |
During
the year ended December 31, 2021:
| |
● |
On October 26, 2020, the
Company agreed to issue Series B preferred shares that are convertible into 1,000,000 common shares and 1,000,000 warrants for investor
relations services. The preferred shares were valued at $1,340,000 based on the fair value of the underlying common stock and included
in preferred shares to be issued at December 31, 2020. On February 17, 2021, the Company issued 100 shares of Series B preferred
shares and 1,000,000 warrants, see note 14. 1 Series B preferred share is convertible into 100,000 shares of common stock, which
meant that only 10 shares of Series B preferred shares should have been issued. On May 26, 2021, 50 shares of Series B preferred
shares, instead of 5 shares of Series B preferred shares, were converted into 500,000 shares of common stock with a fair value of
$670,000. On September 16, 2021, the Company cancelled 45 shares of Series B preferred shares and 5 shares of Series B preferred
shares were converted into 500,000 shares of common stock with a fair value of $670,000. |
| |
● |
On March 4, 2021, the Company
issued an aggregate of 16 shares of Series B preferred shares to the Company’s board of directors for past services. These
preferred shares were valued at $849,600 based on the fair value of the underlying common stock. |
| |
|
|
| |
● |
125 Series B preferred
shares with a fair value of $1,734,800, were converted into common shares, inclusive of the conversion noted above, see note 14. |
|
| X |
- References
+ Details
| Name: |
us-gaap_EquityAbstract |
| Namespace Prefix: |
us-gaap_ |
| Data Type: |
xbrli:stringItemType |
| Balance Type: |
na |
| Period Type: |
duration |
|
| X |
- DefinitionThe entire disclosure for terms, amounts, nature of changes, rights and privileges, dividends, and other matters related to preferred stock. Reference 1: http://fasb.org/us-gaap/role/ref/legacyRef
-Publisher FASB
-Name Accounting Standards Codification
-Topic 505
-URI https://asc.fasb.org/topic&trid=2208762
| Name: |
us-gaap_PreferredStockTextBlock |
| Namespace Prefix: |
us-gaap_ |
| Data Type: |
dtr-types:textBlockItemType |
| Balance Type: |
na |
| Period Type: |
duration |
|
v3.23.2
COMMON STOCK AND ADDITIONAL PAID IN CAPITAL
|
12 Months Ended |
Dec. 31, 2022 |
|---|
| Equity [Abstract] |
|
| COMMON STOCK AND ADDITIONAL PAID IN CAPITAL |
Note
14 – COMMON STOCK AND ADDITIONAL PAID IN CAPITAL
Authorized
350,000,000
common shares, authorized, each having a par value of $0.001 per share.
Common
Stock Transactions
During
the year ended December 31, 2022:
| |
● |
The Company issued an aggregate
of 500,000 shares of common stock to satisfy shares to be issued for investor relations. The shares had a fair value of $46,000
of which $26,353 of expense was recognized during the year period ended December 31, 2022. $19,647 of expense was recorded during
the year ended December 31, 2021 and $26,353 was recorded as prepaid. |
| |
|
|
| |
● |
The Company issued 160,000
shares of common stock with a fair value of $13,760 for investor relations services. |
| |
|
|
| |
● |
The Company issued 500,000
shares of common stock with a fair value of $47,000 for legal services. |
| |
|
|
| |
● |
The Company issued 15,924,810
shares of common stock with a fair value of $302,557 for conversion of 470 Series F Preferred Shares. |
During
the year ended December 31, 2021:
| |
● |
The Company issued an aggregate
of 8,138,975 shares of common stock with a fair value of $1,436,044, to satisfy shares to be issued at December 31, 2020 for debt
settlement. |
| |
|
|
| |
● |
The Company issued 715,000
shares of common stock with a fair value of $191,235 pursuant to a legal settlement, see Note 18. |
| |
|
|
| |
● |
The Company issued 2,430,000
shares of common stock with a fair value of $565,250 for consulting services. |
| |
|
|
| |
● |
The Company issued 23,046,760
shares of common stock with a fair value of $3,822,829 and share issue costs of $2,000 for conversion of 125 Series B Preferred Shares
with a fair value of $1,734,800, conversion of 1,512 Series C Preferred Shares with a fair value of $1,462,296, and conversion of
976 Series F Preferred Shares with a fair value of $625,803. |
| |
|
|
| |
● |
The Company cancelled 1,751,288
shares of common stock which were returned to treasury due to a duplicated issuance for share settled debt during the year ended
December 31, 2020. |
Common
Stock to be Issued
Common
stock to be issued as at December 31, 2022 consists of:
None.
Common
stock to be issued as at December 31, 2021 consists of:
| |
● |
97,260 shares valued at
$19,647 to be issued pursuant to a service agreement. These were issued February 11, 2022. |
Warrants
During
the year ended December 31, 2022:
| |
● |
On December 31, 2022, 6,813,371
warrants of the Company expired. |
During
the year ended December 31, 2021:
| |
● |
The Company granted 1,000,000
warrants with a contractual life of three years and exercise price of $0.25 per share pursuant to an investor relations agreement
dated October 26, 2020. The warrants were valued at $163,998. |
| |
|
|
| |
● |
The Company granted 500,000
warrants with a contractual life of four years and exercise price of $1.00 per share. The warrants were valued at $668,461. |
| |
|
|
| |
● |
The Company granted 2,000,000
warrants with a contractual life of five years and exercise price of $0.35 per share. The warrants were valued at $410,425. |
| |
|
|
| |
● |
On July 20, 2021, pursuant
to the July Series F SPA, the Company is to issue 1,180,000 warrants with a relative fair value of $138,066 valued on the agreement
date, see note 12. The warrants have a contractual life of 5 years and exercise price of $0.30 per share. As at December 31, 2021,
these warrants have not been issued. |
The
fair values of the warrants were calculated using the following assumptions for the Black Scholes Option Pricing Model:
SCHEDULE OF WARRANTS ASSUMPTIONS
| |
|
December
31, 2022 |
|
|
December
31, 2021 |
|
| Risk-free interest rate |
|
|
0.18% - 0.82 |
% |
|
|
0.18% - 0.82 |
% |
| Expected life |
|
|
3.29 - 5.11 years |
|
|
|
3.29 - 5.11 years |
|
| Expected dividend rate |
|
|
0 |
% |
|
|
0 |
% |
| Expected volatility |
|
|
285.40 – 300.18 |
% |
|
|
285.40 – 300.18 |
% |
Continuity
of the Company’s common stock purchase warrants issued and outstanding is as follows:
SCHEDULE OF WARRANTS OUTSTANDING
| | |
Warrants | | |
Weighted average
exercise price | |
| Outstanding as at December 31, 2020 | |
| 12,939,813 | | |
$ | 0.60 | |
| Granted | |
| 3,500,000 | | |
| 0.41 | |
| Outstanding as at December 31, 2021 | |
| 16,439,813 | | |
$ | 0.56 | |
| Expired | |
| 6,813,371 | | |
| 0.78 | |
| Outstanding as at December 31, 2022 | |
| 9,626,442 | | |
$ | 0.40 | |
As
at December 31, 2022, the weighted average remaining contractual life of warrants outstanding was 2.61 years (2021 – 2.53 years)
with an intrinsic value of $nil (2021 - $nil).
|
| X |
- References
+ Details
| Name: |
us-gaap_EquityAbstract |
| Namespace Prefix: |
us-gaap_ |
| Data Type: |
xbrli:stringItemType |
| Balance Type: |
na |
| Period Type: |
duration |
|
| X |
- DefinitionThe entire disclosure for shareholders' equity comprised of portions attributable to the parent entity and noncontrolling interest, including other comprehensive income. Includes, but is not limited to, balances of common stock, preferred stock, additional paid-in capital, other capital and retained earnings, accumulated balance for each classification of other comprehensive income and amount of comprehensive income. Reference 1: http://fasb.org/us-gaap/role/ref/legacyRef
-Publisher FASB
-Name Accounting Standards Codification
-Topic 505
-URI https://asc.fasb.org/topic&trid=2208762
Reference 2: http://www.xbrl.org/2003/role/disclosureRef
-Publisher FASB
-Name Accounting Standards Codification
-Topic 505
-SubTopic 10
-Section 50
-Paragraph 13
-Subparagraph (b)
-URI https://asc.fasb.org/extlink&oid=126973232&loc=SL123496158-112644
Reference 3: http://www.xbrl.org/2003/role/disclosureRef
-Publisher FASB
-Name Accounting Standards Codification
-Topic 505
-SubTopic 10
-Section 50
-Paragraph 13
-URI https://asc.fasb.org/extlink&oid=126973232&loc=SL123496158-112644
Reference 4: http://www.xbrl.org/2003/role/disclosureRef
-Publisher FASB
-Name Accounting Standards Codification
-Topic 505
-SubTopic 10
-Section 50
-Paragraph 14
-Subparagraph (c)
-URI https://asc.fasb.org/extlink&oid=126973232&loc=SL123496171-112644
Reference 5: http://www.xbrl.org/2003/role/disclosureRef
-Publisher FASB
-Name Accounting Standards Codification
-Topic 505
-SubTopic 10
-Section 50
-Paragraph 14
-Subparagraph (b)
-URI https://asc.fasb.org/extlink&oid=126973232&loc=SL123496171-112644
Reference 6: http://www.xbrl.org/2003/role/disclosureRef
-Publisher FASB
-Name Accounting Standards Codification
-Topic 505
-SubTopic 10
-Section S99
-Paragraph 1
-Subparagraph (SX 210.3-04)
-URI https://asc.fasb.org/extlink&oid=120397183&loc=d3e187085-122770
Reference 7: http://www.xbrl.org/2003/role/disclosureRef
-Publisher FASB
-Name Accounting Standards Codification
-Topic 505
-SubTopic 10
-Section 50
-Paragraph 18
-Subparagraph (d)
-URI https://asc.fasb.org/extlink&oid=126973232&loc=SL123496189-112644
Reference 8: http://www.xbrl.org/2003/role/disclosureRef
-Publisher FASB
-Name Accounting Standards Codification
-Topic 505
-SubTopic 10
-Section 50
-Paragraph 13
-Subparagraph (g)
-URI https://asc.fasb.org/extlink&oid=126973232&loc=SL123496158-112644
Reference 9: http://www.xbrl.org/2003/role/disclosureRef
-Publisher FASB
-Name Accounting Standards Codification
-Topic 505
-SubTopic 10
-Section 50
-Paragraph 18
-Subparagraph (a)
-URI https://asc.fasb.org/extlink&oid=126973232&loc=SL123496189-112644
Reference 10: http://www.xbrl.org/2003/role/disclosureRef
-Publisher FASB
-Name Accounting Standards Codification
-Topic 505
-SubTopic 10
-Section 50
-Paragraph 13
-Subparagraph (h)
-URI https://asc.fasb.org/extlink&oid=126973232&loc=SL123496158-112644
Reference 11: http://www.xbrl.org/2003/role/disclosureRef
-Publisher FASB
-Name Accounting Standards Codification
-Topic 505
-SubTopic 10
-Section 50
-Paragraph 14
-Subparagraph (a)
-URI https://asc.fasb.org/extlink&oid=126973232&loc=SL123496171-112644
Reference 12: http://www.xbrl.org/2003/role/disclosureRef
-Publisher FASB
-Name Accounting Standards Codification
-Topic 505
-SubTopic 10
-Section 50
-Paragraph 18
-Subparagraph (b)
-URI https://asc.fasb.org/extlink&oid=126973232&loc=SL123496189-112644
Reference 13: http://www.xbrl.org/2003/role/disclosureRef
-Publisher FASB
-Name Accounting Standards Codification
-Topic 505
-SubTopic 10
-Section 50
-Paragraph 16
-Subparagraph (b)
-URI https://asc.fasb.org/extlink&oid=126973232&loc=SL123496180-112644
Reference 14: http://www.xbrl.org/2003/role/disclosureRef
-Publisher FASB
-Name Accounting Standards Codification
-Topic 505
-SubTopic 10
-Section 50
-Paragraph 13
-Subparagraph (i)
-URI https://asc.fasb.org/extlink&oid=126973232&loc=SL123496158-112644
Reference 15: http://www.xbrl.org/2003/role/disclosureRef
-Publisher FASB
-Name Accounting Standards Codification
-Topic 235
-SubTopic 10
-Section S99
-Paragraph 1
-Subparagraph (SX 210.4-08(e)(1))
-URI https://asc.fasb.org/extlink&oid=120395691&loc=d3e23780-122690
Reference 16: http://www.xbrl.org/2003/role/disclosureRef
-Publisher FASB
-Name Accounting Standards Codification
-Topic 815
-SubTopic 40
-Section 50
-Paragraph 6
-Subparagraph (a)
-URI https://asc.fasb.org/extlink&oid=126731327&loc=SL126733271-114008
| Name: |
us-gaap_StockholdersEquityNoteDisclosureTextBlock |
| Namespace Prefix: |
us-gaap_ |
| Data Type: |
dtr-types:textBlockItemType |
| Balance Type: |
na |
| Period Type: |
duration |
|
v3.23.2
RELATED PARTY TRANSACTIONS
|
12 Months Ended |
Dec. 31, 2022 |
|---|
| Related Party Transactions [Abstract] |
|
| RELATED PARTY TRANSACTIONS |
Note
15 – RELATED PARTY TRANSACTIONS
The
Company repaid $28,118
of management fees and salaries previously owing
to the President and CEO, of the Company from December 31, 2021 during the year ended December 31, 2022. As at December 31, 2022, the
Company owed $49,441
(December 31, 2021 - $28,118
($ 35,710
CDN)) to the President, CEO, and CFO of the Company
and to the President, CEOs, and CFOs of the Company’s subsidiaries for management fees and salaries. Amounts owed and owing are
unsecured, non-interest bearing, and due on demand.
On
March 4, 2021, the Company issued an aggregate of 16 shares of Series B convertible preferred shares to the Company’s board of
directors for past services. These preferred shares were valued at $849,600 based on the fair value of the underlying common stock. The
issuance is recorded under compensation expense.
On
May 21, 2020, the Company issued an aggregate of 136 shares of Series B convertible preferred shares to various parties for past services
to the Company, which included 122 issued to directors and employees and 2 issued to a former director of the Company. These preferred
shares were valued at $767,040, based on the fair value of the underlying common stock, discounted for the six months hold period before
the preferred shares can be converted. The issuance is recorded under compensation expense.
|
| X |
- DefinitionThe entire disclosure for related party transactions. Examples of related party transactions include transactions between (a) a parent company and its subsidiary; (b) subsidiaries of a common parent; (c) and entity and its principal owners; and (d) affiliates. Reference 1: http://www.xbrl.org/2003/role/disclosureRef
-Publisher FASB
-Name Accounting Standards Codification
-Topic 850
-SubTopic 10
-Section 50
-Paragraph 1
-Subparagraph (d)
-URI https://asc.fasb.org/extlink&oid=6457730&loc=d3e39549-107864
Reference 2: http://www.xbrl.org/2003/role/disclosureRef
-Publisher FASB
-Name Accounting Standards Codification
-Topic 850
-SubTopic 10
-Section 50
-Paragraph 1
-Subparagraph (b)
-URI https://asc.fasb.org/extlink&oid=6457730&loc=d3e39549-107864
Reference 3: http://www.xbrl.org/2003/role/disclosureRef
-Publisher FASB
-Name Accounting Standards Codification
-Topic 850
-SubTopic 10
-Section 50
-Paragraph 1
-Subparagraph (a)
-URI https://asc.fasb.org/extlink&oid=6457730&loc=d3e39549-107864
Reference 4: http://www.xbrl.org/2003/role/disclosureRef
-Publisher FASB
-Name Accounting Standards Codification
-Topic 850
-URI https://asc.fasb.org/topic&trid=2122745
Reference 5: http://www.xbrl.org/2003/role/disclosureRef
-Publisher FASB
-Name Accounting Standards Codification
-Topic 850
-SubTopic 10
-Section 50
-Paragraph 6
-URI https://asc.fasb.org/extlink&oid=6457730&loc=d3e39691-107864
| Name: |
us-gaap_RelatedPartyTransactionsDisclosureTextBlock |
| Namespace Prefix: |
us-gaap_ |
| Data Type: |
dtr-types:textBlockItemType |
| Balance Type: |
na |
| Period Type: |
duration |
|
v3.23.2
SEGMENT INFORMATION
|
12 Months Ended |
Dec. 31, 2022 |
|---|
| Segment Reporting [Abstract] |
|
| SEGMENT INFORMATION |
Note
16 – SEGMENT INFORMATION
During
the year ended December 31, 2022, the Company’s operations included revenue and costs from the sale and rental of GPS tracking
devices and interfaces for golf vehicles and related support services, the sale of golf vehicles, and the sale of electric vehicles
which includes e-bikes. The Company’s reporting segments are those associated with operating segments above, and the administration of the
Company.
SCHEDULE OF SEGMENT REPORTING INFORMATION
| | |
Administration | | |
Electric Vehicles | | |
Golf Carts | | |
GPS Units | | |
Total | |
| Revenue | |
$ | - | | |
$ | 221,567 | | |
$ | 1,394,964 | | |
$ | 2,217,322 | | |
$ | 3,833,853 | |
| Cost of revenue | |
| - | | |
| 191,367 | | |
| 827,299 | | |
| 1,064,302 | | |
| 2,082,968 | |
| Gross profit | |
| - | | |
| 30,200 | | |
| 567,665 | | |
| 1,153,020 | | |
| 1,750,885 | |
| | |
| | | |
| | | |
| | | |
| | | |
| | |
| Operating expenses | |
| | | |
| | | |
| | | |
| | | |
| | |
| Compensation expense | |
| 2,151,306 | | |
| 268,324 | | |
| 123,789 | | |
| 991,397 | | |
| 3,534,816 | |
| General and administration expense | |
| 1,765,303 | | |
| 362,924 | | |
| 891,777 | | |
| 409,071 | | |
| 3,429,075 | |
| Research and development | |
| - | | |
| 17,500 | | |
| 34,844 | | |
| - | | |
| 52,344 | |
| Bad debt expense (recovery) | |
| (29,389 | ) | |
| - | | |
| - | | |
| - | | |
| (29,389 | ) |
| Depreciation and amortization expense | |
| 13,670 | | |
| - | | |
| - | | |
| - | | |
| 13,670 | |
| Total operating expense | |
| 3,900,891 | | |
| 648,748 | | |
| 1,050,410 | | |
| 1,400,468 | | |
| 7,000,516 | |
| Loss from operations | |
| (3,900,891 | ) | |
| (618,548 | ) | |
| (482,745 | ) | |
| (247,448 | ) | |
| (5,249,631 | ) |
| | |
| | | |
| | | |
| | | |
| | | |
| | |
| Other income (expense) | |
| | | |
| | | |
| | | |
| | | |
| | |
| Foreign currency exchange | |
| (28,241 | ) | |
| - | | |
| - | | |
| - | | |
| (28,241 | ) |
| Loss on sale of lease receivable | |
| - | | |
| - | | |
| - | | |
| (3,923 | ) | |
| (3,923 | ) |
| (Loss) Gain on extinguishment of debt | |
| 40,355 | | |
| - | | |
| - | | |
| - | | |
| 40,355 | |
| Gain on disposal | |
| - | | |
| 3,960 | | |
| - | | |
| - | | |
| 3,960 | |
| Interest on preferred shares | |
| (3,062 | ) | |
| - | | |
| - | | |
| - | | |
| (3,062 | ) |
| Finance costs | |
| (2,055,801 | ) | |
| - | | |
| - | | |
| (251,048 | ) | |
| (2,306,849 | ) |
| Total other income (expense) | |
| (2,046,749 | ) | |
| 3,960 | | |
| - | | |
| (254,971 | ) | |
| (2,297,760 | ) |
| Net loss | |
$ | (5,947,640 | ) | |
$ | (614,588 | ) | |
$ | (482,745 | ) | |
$ | (502,419 | ) | |
$ | (7,547,391 | ) |
| | |
| | | |
| | | |
| | | |
| | | |
| | |
| Total Assets | |
$ | 164,567 | | |
$ | 351,561 | | |
$ | 1,007,916 | | |
$ | 720,252 | | |
$ | 2,244,296 | |
The
following table shows a breakdown of the geographic location where the Company’s assets as at December 31, 2022, are located.
SCHEDULE
OF ASSETS BY GEOGRAPHIC AREA
| | |
Canada | | |
USA | | |
UK | | |
Mexico | | |
Australia | | |
China | | |
Total | |
| Total
Assets | |
$ | 450,923 | | |
$ | 1,637,294 | | |
$ | 4,699 | | |
$ | 40,000 | | |
$ | 98,225 | | |
$ | 13,155 | | |
$ | 2,244,296 | |
|
| X |
- References
+ Details
| Name: |
us-gaap_SegmentReportingAbstract |
| Namespace Prefix: |
us-gaap_ |
| Data Type: |
xbrli:stringItemType |
| Balance Type: |
na |
| Period Type: |
duration |
|
| X |
- DefinitionThe entire disclosure for reporting segments including data and tables. Reportable segments include those that meet any of the following quantitative thresholds a) it's reported revenue, including sales to external customers and intersegment sales or transfers is 10 percent or more of the combined revenue, internal and external, of all operating segments b) the absolute amount of its reported profit or loss is 10 percent or more of the greater, in absolute amount of 1) the combined reported profit of all operating segments that did not report a loss or 2) the combined reported loss of all operating segments that did report a loss c) its assets are 10 percent or more of the combined assets of all operating segments. Reference 1: http://www.xbrl.org/2003/role/disclosureRef
-Publisher FASB
-Name Accounting Standards Codification
-Topic 280
-SubTopic 10
-Section 50
-Paragraph 31
-URI https://asc.fasb.org/extlink&oid=126901519&loc=d3e8924-108599
Reference 2: http://www.xbrl.org/2003/role/disclosureRef
-Publisher FASB
-Name Accounting Standards Codification
-Topic 280
-SubTopic 10
-Section 50
-Paragraph 34
-URI https://asc.fasb.org/extlink&oid=126901519&loc=d3e8981-108599
Reference 3: http://www.xbrl.org/2003/role/disclosureRef
-Publisher FASB
-Name Accounting Standards Codification
-Topic 280
-SubTopic 10
-Section 50
-Paragraph 21
-Subparagraph (a)
-URI https://asc.fasb.org/extlink&oid=126901519&loc=d3e8721-108599
Reference 4: http://www.xbrl.org/2003/role/disclosureRef
-Publisher FASB
-Name Accounting Standards Codification
-Topic 280
-SubTopic 10
-Section 50
-Paragraph 40
-URI https://asc.fasb.org/extlink&oid=126901519&loc=d3e9031-108599
Reference 5: http://www.xbrl.org/2003/role/disclosureRef
-Publisher FASB
-Name Accounting Standards Codification
-Topic 280
-SubTopic 10
-Section 50
-Paragraph 32
-Subparagraph (f)
-URI https://asc.fasb.org/extlink&oid=126901519&loc=d3e8933-108599
Reference 6: http://www.xbrl.org/2003/role/disclosureRef
-Publisher FASB
-Name Accounting Standards Codification
-Topic 280
-SubTopic 10
-Section 50
-Paragraph 32
-Subparagraph (e)
-URI https://asc.fasb.org/extlink&oid=126901519&loc=d3e8933-108599
Reference 7: http://www.xbrl.org/2003/role/disclosureRef
-Publisher FASB
-Name Accounting Standards Codification
-Topic 280
-SubTopic 10
-Section 50
-Paragraph 26
-URI https://asc.fasb.org/extlink&oid=126901519&loc=d3e8844-108599
Reference 8: http://www.xbrl.org/2003/role/disclosureRef
-Publisher FASB
-Name Accounting Standards Codification
-Topic 280
-SubTopic 10
-Section 50
-Paragraph 41
-URI https://asc.fasb.org/extlink&oid=126901519&loc=d3e9038-108599
Reference 9: http://www.xbrl.org/2003/role/disclosureRef
-Publisher FASB
-Name Accounting Standards Codification
-Topic 280
-SubTopic 10
-Section 50
-Paragraph 32
-Subparagraph (d)
-URI https://asc.fasb.org/extlink&oid=126901519&loc=d3e8933-108599
Reference 10: http://www.xbrl.org/2003/role/disclosureRef
-Publisher FASB
-Name Accounting Standards Codification
-Topic 280
-SubTopic 10
-Section 50
-Paragraph 22
-URI https://asc.fasb.org/extlink&oid=126901519&loc=d3e8736-108599
Reference 11: http://www.xbrl.org/2003/role/disclosureRef
-Publisher FASB
-Name Accounting Standards Codification
-Topic 280
-SubTopic 10
-Section 50
-Paragraph 42
-URI https://asc.fasb.org/extlink&oid=126901519&loc=d3e9054-108599
Reference 12: http://www.xbrl.org/2003/role/disclosureRef
-Publisher FASB
-Name Accounting Standards Codification
-Topic 280
-SubTopic 10
-Section 50
-Paragraph 15
-URI https://asc.fasb.org/extlink&oid=126901519&loc=d3e8657-108599
Reference 13: http://www.xbrl.org/2003/role/disclosureRef
-Publisher FASB
-Name Accounting Standards Codification
-Topic 280
-SubTopic 10
-Section 50
-Paragraph 21
-Subparagraph (b)
-URI https://asc.fasb.org/extlink&oid=126901519&loc=d3e8721-108599
Reference 14: http://www.xbrl.org/2003/role/disclosureRef
-Publisher FASB
-Name Accounting Standards Codification
-Topic 280
-URI https://asc.fasb.org/topic&trid=2134510
| Name: |
us-gaap_SegmentReportingDisclosureTextBlock |
| Namespace Prefix: |
us-gaap_ |
| Data Type: |
dtr-types:textBlockItemType |
| Balance Type: |
na |
| Period Type: |
duration |
|
v3.23.2
COMMITMENTS
|
12 Months Ended |
Dec. 31, 2022 |
|---|
| Commitments and Contingencies Disclosure [Abstract] |
|
| COMMITMENTS |
Note
17 – COMMITMENTS
Product
Warranties
The
Company’s warranty policy generally covers a period of two years which is also covered by the manufacturer warranty. Thus, any
warranty costs incurred by the Company are immaterial .
Indemnifications
In
the normal course of business, the Company indemnifies other parties, including customers, lessors, and parties to other transactions
with the Company, with respect to certain matters. The Company has agreed to hold the other parties harmless against losses arising from
a breach of representations or covenants, or out of intellectual property infringement or other claims made against certain parties.
These agreements may limit the time within which an indemnification claim can be made and the amount of the claim. In addition, the Company
has entered into indemnification agreements with its officers and directors, and the Company’s bylaws contain similar indemnification
obligations to the Company’s agents. It is not possible to determine the maximum potential amount under these indemnification agreements
due to the Company’s limited history with prior indemnification claims and the unique facts and circumstances involved in each
particular agreement. Historically, payments made by the Company under these agreements have not had a material effect on the Company’s
operating results, financial position, or cash flows.
|
| X |
- References
+ Details
| Name: |
us-gaap_CommitmentsAndContingenciesDisclosureAbstract |
| Namespace Prefix: |
us-gaap_ |
| Data Type: |
xbrli:stringItemType |
| Balance Type: |
na |
| Period Type: |
duration |
|
| X |
- DefinitionThe entire disclosure for significant arrangements with third parties, which includes operating lease arrangements and arrangements in which the entity has agreed to expend funds to procure goods or services, or has agreed to commit resources to supply goods or services, and operating lease arrangements. Descriptions may include identification of the specific goods and services, period of time covered, minimum quantities and amounts, and cancellation rights. Reference 1: http://fasb.org/us-gaap/role/ref/legacyRef
-Publisher FASB
-Name Accounting Standards Codification
-Topic 440
-URI https://asc.fasb.org/topic&trid=2144648
| Name: |
us-gaap_CommitmentsDisclosureTextBlock |
| Namespace Prefix: |
us-gaap_ |
| Data Type: |
dtr-types:textBlockItemType |
| Balance Type: |
na |
| Period Type: |
duration |
|
v3.23.2
INCOME TAX
|
12 Months Ended |
Dec. 31, 2022 |
|---|
| Commitments and Contingencies Disclosure [Abstract] |
|
| INCOME TAX |
Note
18 – INCOME TAX
The
Company is subject to income taxes in Canada and the US. The statutory income tax rates were 27% in Canada and 27.5% in the US. A reconciliation
of the expected income tax recovery is as follows:
SCHEDULE
OF RECONCILIATION OF INCOME TAX EXPENSE
| | |
December 31, 2022 | | |
December 31, 2021 | |
| | |
Year Ended | |
| | |
December 31, 2022 | | |
December 31, 2021 | |
| | |
$ | | |
$ | |
| Income tax rate | |
| 27.00 | % | |
| 27.00 | % |
| Income tax recovery calculated using statutory rate | |
| (2,038,000 | ) | |
| (1,733,000 | ) |
| Increase (decrease) in income taxes resulting from: | |
| | | |
| | |
| Non-deductible (taxable) items | |
| 88,000 | | |
| 54,000 | |
| Effect of tax rate change | |
| (17,000 | ) | |
| (2,000 | ) |
| Effect of different tax jurisdiction rates | |
| 24,000 | | |
| 68,000 | |
| Change in tax assets not recognized | |
| 1,926,000 | | |
| 1,613,000 | |
| Income tax expense (recovery) | |
| - | | |
| - | |
The
nature and tax effect of the temporary difference giving rise to the deferred tax assets and liabilities at December 31, 2022 and 2021,
are summarized as follows:
SCHEDULE OF DEFERRED TAX ASSETS AND LIABILITIES
| | |
December 31, 2022 | | |
December 31, 2021 | |
| | |
Year Ended | |
| | |
December 31, 2022 | | |
December 31, 2021 | |
| | |
$ | | |
$ | |
| Deferred tax assets | |
| | | |
| | |
| Capital assets | |
| 20,000 | | |
| 16,000 | |
| ROU assets | |
| 31,000 | | |
| 5,000 | |
| Non-capital losses | |
| 17,317,000 | | |
| 15,426,000 | |
| Capital leases | |
| 9,000 | | |
| 24,000 | |
| Accounts receivable | |
| 29,000 | | |
| 9,000 | |
| Total deferred tax assets | |
| 17,406,000 | | |
| 15,480,000 | |
| Unrecognized benefit from income tax losses | |
| (17,406,000 | ) | |
| (15,480,000 | ) |
| Net deferred tax assets | |
| - | | |
| - | |
Deferred
income taxes arise from temporary differences between the tax and financial statement recognition of revenue and expense. In evaluating
the ability to recover the deferred tax assets within the jurisdiction from which they arise, the Company considered all available positive
and negative evidence, including scheduled reversals of deferred tax liabilities, projected future taxable income, tax planning strategies
and recent financial operations. In projecting future taxable income, the Company began with historical results adjusted for changes
in accounting policies and incorporates assumptions including the amount of future pretax operating income, the reversal of temporary
differences, and the implementation of feasible and prudent tax planning strategies. These assumptions require significant judgment about
the forecasts of future taxable income and are consistent with the plans and estimate the Company are using to manage the underlying
businesses. In evaluating the objective evidence that historical results provide, the Company consider three years of cumulative operating
income (loss).
As
of December 31, 2022, the Company had aggregate net operating losses of $65,242,086 (2021 - $57,694,695) to offset future taxable income
in the United States and the United Kingdom. The deferred tax assets at December 31, 2022 were fully reserved. Management believes it
is more likely than not that these assets will not be realized in the near future.
|
| X |
- References
+ Details
| Name: |
us-gaap_CommitmentsAndContingenciesDisclosureAbstract |
| Namespace Prefix: |
us-gaap_ |
| Data Type: |
xbrli:stringItemType |
| Balance Type: |
na |
| Period Type: |
duration |
|
| X |
- DefinitionThe entire disclosure for legal proceedings, legal contingencies, litigation, regulatory and environmental matters and other contingencies. Reference 1: http://fasb.org/us-gaap/role/ref/legacyRef
-Publisher FASB
-Name Accounting Standards Codification
-Topic 450
-URI https://asc.fasb.org/topic&trid=2127136
| Name: |
us-gaap_LegalMattersAndContingenciesTextBlock |
| Namespace Prefix: |
us-gaap_ |
| Data Type: |
dtr-types:textBlockItemType |
| Balance Type: |
na |
| Period Type: |
duration |
|
v3.23.2
SUPPLEMENTAL CASH FLOW INFORMATION
|
12 Months Ended |
Dec. 31, 2022 |
|---|
| Supplemental Cash Flow Elements [Abstract] |
|
| SUPPLEMENTAL CASH FLOW INFORMATION |
Note
19 – SUPPLEMENTAL CASH FLOW INFORMATION
SCHEDULE OF SUPPLEMENTAL CASH FLOW INFORMATION
| | |
December 31, 2022 | | |
December 31, 2021 | |
| | |
Year Ended | |
| | |
December 31, 2022 | | |
December 31, 2021 | |
| | |
| | |
| |
| Cash paid during the period for: | |
| | | |
| | |
| Income tax payments | |
$ | - | | |
$ | - | |
| Interest payments | |
| 11,222 | | |
| 57,111 | |
| | |
| | | |
| | |
| Non-cash investing and financing transactions: | |
| | | |
| | |
| Shares issued for debt settlement | |
$ | - | | |
$ | 191,235 | |
| Shares issued on conversion of preferred shares | |
$ | 302,557 | | |
$ | 2,088,100 | |
| Dividends payable with preferred shares to be issued | |
| 382,563 | | |
| 455,500 | |
| Initial recognition of lease assets | |
$ | 143,630 | | |
$ | 9,904 | |
| Initial recognition of lease liabilities | |
$ | 143,630 | | |
$ | 9,904 | |
|
| X |
- DefinitionThe entire disclosure for supplemental cash flow activities, including cash, noncash, and part noncash transactions, for the period. Noncash is defined as information about all investing and financing activities of an enterprise during a period that affect recognized assets or liabilities but that do not result in cash receipts or cash payments in the period. "Part noncash" refers to that portion of the transaction not resulting in cash receipts or cash payments in the period. Reference 1: http://fasb.org/us-gaap/role/ref/legacyRef
-Publisher FASB
-Name Accounting Standards Codification
-Topic 230
-URI https://asc.fasb.org/topic&trid=2134446
| Name: |
us-gaap_CashFlowSupplementalDisclosuresTextBlock |
| Namespace Prefix: |
us-gaap_ |
| Data Type: |
dtr-types:textBlockItemType |
| Balance Type: |
na |
| Period Type: |
duration |
|
| X |
- References
+ Details
| Name: |
us-gaap_SupplementalCashFlowElementsAbstract |
| Namespace Prefix: |
us-gaap_ |
| Data Type: |
xbrli:stringItemType |
| Balance Type: |
na |
| Period Type: |
duration |
|
v3.23.2
SUBSEQUENT EVENTS
|
12 Months Ended |
Dec. 31, 2022 |
|---|
| Subsequent Events [Abstract] |
|
| SUBSEQUENT EVENTS |
Note
20 – SUBSEQUENT EVENTS
Management
has evaluated events subsequent to the year ended for transactions and other events that may require adjustment of and/or disclosure
in such consolidated financial statements.
Subsequent
to December 31, 2022:
| |
● |
On
January 4, 2023, 3,000,000 shares of common stock were issued for conversion of 30 Series B Preferred Shares. |
| |
|
|
| |
● |
On
January 12, 2023, pursuant to the December Series F SPA, the Company received $312,000 for the subscription of 312 Series F preferred
shares. These shares were issued on January 18, 2023. |
| |
|
|
| |
● |
On
January 18, 2023, pursuant to the December Series F SPA, the Company received $300,000 for the subscription of 300 Series F preferred
shares. |
| |
|
|
| |
● |
On January 13, 2023, 2,991,098
shares of common stock were issued for conversion of 84
Series F Preferred Shares with an aggregate carrying value of $40,991. |
| |
|
|
| |
● |
On February 17, 2023, 2,992,519
shares of common stock were issued for conversion of 100
Series F Preferred Shares with an aggregate carrying value of $48,799. |
| |
|
|
| |
● |
On January 18, 2023, the
Company received approval to increase the number of common stock authorized from 350,000,000 to 1,000,000,000. |
|
| X |
- References
+ Details
| Name: |
us-gaap_SubsequentEventsAbstract |
| Namespace Prefix: |
us-gaap_ |
| Data Type: |
xbrli:stringItemType |
| Balance Type: |
na |
| Period Type: |
duration |
|
| X |
- DefinitionThe entire disclosure for significant events or transactions that occurred after the balance sheet date through the date the financial statements were issued or the date the financial statements were available to be issued. Examples include: the sale of a capital stock issue, purchase of a business, settlement of litigation, catastrophic loss, significant foreign exchange rate changes, loans to insiders or affiliates, and transactions not in the ordinary course of business. Reference 1: http://www.xbrl.org/2003/role/disclosureRef
-Publisher FASB
-Name Accounting Standards Codification
-Topic 855
-URI https://asc.fasb.org/topic&trid=2122774
Reference 2: http://www.xbrl.org/2003/role/disclosureRef
-Publisher FASB
-Name Accounting Standards Codification
-Topic 855
-SubTopic 10
-Section 50
-Paragraph 2
-Subparagraph (a)
-URI https://asc.fasb.org/extlink&oid=6842918&loc=SL6314017-165662
| Name: |
us-gaap_SubsequentEventsTextBlock |
| Namespace Prefix: |
us-gaap_ |
| Data Type: |
dtr-types:textBlockItemType |
| Balance Type: |
na |
| Period Type: |
duration |
|
v3.23.2
SUMMARY OF SIGNIFICANT ACCOUNTING POLICIES (Policies)
|
12 Months Ended |
Dec. 31, 2022 |
|---|
| Accounting Policies [Abstract] |
|
| Basis of Presentation |
Basis
of Presentation
The
consolidated financial statements of the Company have been prepared in accordance with accounting principles generally accepted in the
United States (“U.S. GAAP”) and are expressed in U.S. dollars. These consolidated financial statements include the accounts
of the Company and its wholly owned subsidiaries. All significant intercompany accounts and transactions have been eliminated. Certain
comparative information has been reclassified to conform with the financial statement presentation adopted in the current year.
|
| Principles of Consolidation |
Principles
of Consolidation
The
consolidated financial statements include the accounts of DSG Global Inc. and its subsidiary VTS and its wholly owned subsidiaries
DSG UK, Imperium Canada, Imperium, AC Golf Carts, and Liteborne collectively referred to as the “Company”. All intercompany
accounts, transactions and profits were eliminated in the consolidated financial statements.
|
| Use of Estimates |
Use
of Estimates
The
preparation of consolidated financial statements in conformity with U.S. GAAP requires management to make estimates and assumptions that
affect the reported amounts of assets and liabilities and the disclosure of contingent assets and liabilities at the date of the financial
statements and the reported amounts of revenues and expenses during the reporting period. The Company regularly evaluates estimates and
assumptions related to revenue recognition, the collectability of accounts receivable, valuation of inventory, useful lives and recoverability
of long-lived assets, fair value derivative liabilities, the Company’s incremental borrowing rate, leases and deferred income tax
asset valuation allowances. The Company bases its estimates and assumptions on current facts, historical experience and various other
factors that it believes to be reasonable under the circumstances, the results of which form the basis for making judgments about the
carrying values of assets and liabilities and the accrual of costs and expenses that are not readily apparent from other sources. The
actual results experienced by the Company may differ materially and adversely from those estimates. Estimates and assumptions are reviewed
periodically, and the effects of revisions are reflected in the consolidated financial statements in the period they are determined.
The
Company’s policy for equipment requires judgment in determining whether the present value of future expected economic benefits
exceeds capitalized costs. The policy requires management to make certain estimates and assumptions about future economic benefits related
to its operations. Estimates and assumptions may change if new information becomes available. If information becomes available suggesting
that the recovery of capitalized cost is unlikely, the capitalized cost is written off to the consolidated statement of operations.
The
assessment of whether the going concern assumption is appropriate requires management to take into account all available information
about the future, which is at least, but is not limited to, 12 months from the date the financial statements are issued. The Company
is aware that material uncertainties related to events or conditions may cast substantial doubt upon the Company’s ability to continue
as a going concern.
|
| Foreign Currency Translation |
Foreign
Currency Translation
The
Company’s functional and reporting currency is the U.S. dollar. The functional currency of VTS is the Canadian dollar. The functional
currency of DSG UK is the British pound. Monetary assets and liabilities denominated in foreign currencies are translated using the exchange
rate prevailing at the balance sheet date. Non-monetary assets, liabilities, and items recorded in income arising from transactions denominated
in foreign currencies are translated at rates of exchange in effect at the date of the transaction. Gains and losses arising on translation
or settlement of foreign currency denominated transactions or balances are included in the determination of income.
The
accounts of VTS and DSG UK are translated to U.S. dollars using the current rate method. Accordingly, assets and liabilities are translated
into U.S. dollars at the period-end exchange rate while revenues and expenses are translated at the average exchange rates during the
period. Related exchange gains and losses are included in a separate component of stockholders’ equity as accumulated other comprehensive
income (loss).
|
| Reportable Segments |
Reportable
Segments
The
Company has four reportable
segments: GPS Devices, those related to its sales and rentals of GPS tracking devices and interfaces for golf vehicles and related support
services; Golf Vehicles, the sale of golf vehicles; Electric Vehicles, the sale of electric vehicles, including e-bikes; and Administration,
those expenses related to the overall operations of the Company not associated with a specific revenue segment. The Company’s activities
are interrelated, and each activity is dependent upon and supportive of the other. Accordingly, all significant operating decisions are
based on analysis of financial products provided as a single global business.
|
| Revenue Recognition and Warranty Reserve |
Revenue
Recognition and Warranty Reserve
Revenue
from Contracts with Customers
The
Company recognizes revenue when it satisfies a performance obligation by transferring control over a product to a customer. Revenue is
measured based on the consideration the Company expects to receive in exchange for those products. In instances where final acceptance
of the product is specified by the customer, revenue is deferred until all acceptance criteria have been met. Revenues are recognized
under Topic 606 in a manner that reasonably reflects the delivery of its products and services to customers in return for expected
consideration and includes the following elements:
| |
● |
executed
contracts with the Company’s customers that it believes are legally enforceable; |
| |
● |
identification
of performance obligations in the respective contract; |
| |
● |
determination
of the transaction price for each performance obligation in the respective contract; |
| |
● |
allocation
the transaction price to each performance obligation; and |
| |
● |
recognition
of revenue only when the Company satisfies each performance obligation. |
Performance
Obligations and Signification Judgments
The
Company’s revenue streams can be categorized into the following performance obligations and recognition patterns:
| |
1. |
Sale,
delivery and installation of Tag, Text and Infinity products, along with digital mapping and customer training. The Company recognizes
revenue at a point in time when final sign-off on the installation is obtained from the General Manager and/or Director of Golf. |
| |
2. |
Provision
of internet connectivity, regular software updates, software maintenance and basic customer support service. The Company recognizes
revenue over time, evenly over the term of the service. |
| |
3. |
Sale
and delivery of Fairway Rider (golf carts) products. The Company recognizes revenue at a point in time when control transfers to the
customer. |
| |
4. |
Sale
and delivery of Electric Vehicles. The Company recognizes revenue at a point in time when control transfers to the customer. |
Transaction
prices for performance obligations are explicitly outlined in relevant agreements, therefore, the Company does not believe that significant
judgments are required with respect to the determination of the transaction price, including any variable consideration identified.
Warranty
Reserve
The
Company accrues for warranty costs, sales returns, and other allowances based on its historical experience. The Company matches its
warranty period for parts and products to that of the manufacturer’s warranty period. Therefore, any defect will result in a
warranty claim to the manufacturer and not the Company. During the years ended December 31, 2022 and 2021, the Company did not
provide a warranty for any of its products sold during those periods. The warranty reserve was $Nil
as at December 31, 2022 and 2021.
|
| Research and Development |
Research
and Development
Research
and development expenses include payroll, employee benefits, and other headcount-related expenses associated with product development.
Research and development expenses also include third-party development and programming costs, localization costs incurred to translate
software for international markets, and the amortization of purchased software code and services content. Such costs related to software
development are included in research and development expense until the point that technological feasibility is reached. Research and
development is expensed and is included in operating expenses.
|
| Income Taxes |
Income
Taxes
The
Company accounts for income taxes using the asset and liability method in accordance with ASC 740, Income Taxes. The asset and liability
method provides that deferred income tax assets and liabilities are recognized for the expected future tax consequences of temporary
differences between the financial reporting and tax bases of assets and liabilities, and for operating loss and tax credit carryforwards.
Deferred income tax assets and liabilities are measured using the currently enacted tax rates and laws that will be in effect when the
differences are expected to reverse. The Company records a valuation allowance to reduce deferred income tax assets to the amount that
is believed more likely than not to be realized.
As
of December 31, 2022 and 2021, the Company did not have any amounts recorded pertaining to uncertain tax positions. The Company recognizes
interest and penalties related to uncertain tax positions in general and administrative expense. The Company did not incur any penalties
or interest during the years ended December 31, 2022 and 2021. On December 22, 2017, the U.S. enacted the Tax Cuts and Jobs Act (“the
Tax Act”) which significantly changed U.S. tax law. The Tax Act lowered the Company’s statutory federal income tax rate from
a maximum of 39% to a rate of 21% effective January 1, 2018. The Company has deferred tax losses and assets and they were adjusted as
a result of the change in tax law reducing the federal income tax rate. The Company’s tax years 2015 and forward remain open.
|
| Concentration of Credit Risk |
Concentration
of Credit Risk
Financial
instruments that potentially subject the Company to concentrations of credit risk are cash, and trade receivables arising from its normal
business activities. The Company places its cash in what it believes to be credit-worthy financial institutions. The Company has a diversified
customer base, most of which are in Canada, United States and the United Kingdom. The Company controls credit risk related to trade receivables
through credit approvals, credit limits and monitoring procedures. The Company routinely assesses the financial strength of its customers
and, based upon factors surrounding the credit risk, establishes an allowance, if required, for uncollectible accounts and, as a consequence,
believes that its accounts receivable credit risk exposure beyond such allowance is limited.
|
| Risks and Uncertainties |
Risks
and Uncertainties
The
Company is subject to risks from, among other things, competition associated with the industry in general, other risks associated with
financing, liquidity requirements, rapidly changing customer requirements, limited operating history, foreign currency exchange rates
and the volatility of public markets.
|
| Contingencies |
Contingencies
Certain
conditions may exist as of the date the consolidated financial statements are issued, which may result in a loss to the Company, but
which will only be resolved when one or more future events occur or fail to occur. The Company’s management and legal counsel assess
such contingent liabilities, and such assessment inherently involves judgment. In assessing loss contingencies related to legal proceedings
that are pending against the Company or un-asserted claims that may result in such proceedings, the Company’s legal counsel evaluates
the perceived merits of any legal proceedings or un-asserted claims as well as the perceived merits of the amount of relief sought or
expected to be sought.
If
the assessment of a contingency indicates it is probable that a material loss has been incurred and the amount of the liability can be
estimated, then the estimated liability would be accrued in the Company’s consolidated financial statements. If the assessment
indicates that a potential material loss contingency is not probable but is reasonably possible, or is probable but cannot be estimated,
then the nature of the contingent liability, together with an estimate of the range of possible loss if determinable and material would
be disclosed. Loss contingencies considered to be remote by management are generally not disclosed unless they involve guarantees, in
which case the guarantee would be disclosed.
|
| Cash and Cash Equivalents |
Cash
and Cash Equivalents
Cash
and equivalents include cash in hand and cash in demand deposits, certificates of deposit and all highly liquid debt instruments with
original maturities of three months or less. At December 31, 2022 and 2021, there were no uninsured balances for accounts in Canada,
the United States and the United Kingdom. The Company has not experienced any losses in such accounts and believes it is not exposed
to any risks on its cash in bank accounts. At December 31, 2022 and 2021, the Company did not hold any cash equivalents.
|
| Accounts Receivable |
Accounts
Receivable
All
accounts receivable under standard terms are due thirty (30) days from the date billed. If the funds are not received within thirty (30)
days, the customer is contacted to arrange payment. Currently, the Company does not provide for an allowance for uncollectable
accounts receivable due to its history of not having any collectability issues from customers.
|
| Financing Receivables and Guarantees |
Financing
Receivables and Guarantees
The
Company provides financing arrangements, including operating leases and financed service contracts for certain qualified customers. Lease
receivables primarily represent sales-type and direct-financing leases. Leases typically have two- to three-year terms and are collateralized
by a security interest in the underlying assets. The Company makes an allowance for uncollectible financing receivables based on a variety
of factors, including the risk rating of the portfolio, macroeconomic conditions, historical experience, and other market factors. At
December 31, 2022 and 2021 management determined that there was no allowance necessary. The Company also provides financing guarantees,
which are generally for various third-party financing arrangements to channel partners and other customers. The Company could be called
upon to make payment under these guarantees in the event of non-payment to the third party. As at December 31, 2022 and 2021, no financing
receivables are outstanding.
|
| Advertising Costs |
Advertising
Costs
The
Company expenses all advertising costs as incurred. Advertising and marketing costs were $286,717 and $134,856 for the years ended December
31, 2022 and 2021, respectively.
|
| Inventory |
Inventory
Inventories
are valued at the lower of cost or net realizable value. Cost is determined using the first-in-first-out basis for finished goods. Net
realizable value is determined on the basis of anticipated sales proceeds less the estimated selling expenses. Management compares the
cost of inventories with the net realizable value and an adjustment is made to write down inventories to net realizable value, if
lower.
|
| Fixed Assets and Equipment on Lease |
Fixed
Assets and Equipment on Lease
Fixed
assets and equipment on lease are stated at cost less accumulated depreciation. Fixed assets and equipment on lease are depreciated using
the straight-line method over the shorter of the estimated useful life of the asset or the lease term. The estimated useful lives of
fixed assets are generally as follows:
SCHEDULE
OF ESTIMATED USEFUL LIVES OF EQUIPMENT
| Furniture
and equipment |
5-years
straight-line |
| Vehicles |
5-years
straight-line |
| Computer
equipment |
3-years
straight-line |
| Machinery |
5-years
straight-line |
| Equipment
on lease |
5-years
straight-line |
|
| Intangible Assets |
Intangible
Assets
Intangible
assets are stated at cost less accumulated amortization and are comprised of patents. The patents are amortized straight-line over the
estimated useful life of 20 years and are reviewed annually for impairment.
|
| Impairment of Long-Lived Assets |
Impairment
of Long-Lived Assets
The
Company reviews long-lived assets such as equipment, equipment on lease, and intangible assets with finite useful lives for impairment
whenever events or changes in circumstance indicate that the carrying amount may not be recoverable. If the total of the expected undiscounted
future cash flows is less than the carrying value of the asset, a loss is recognized for the excess of the carrying amount over the fair
value of the asset.
|
| Financial Instruments and Fair Value Measurements |
Financial
Instruments and Fair Value Measurements
The
Company analyzes all financial instruments with features of both liabilities and equity under ASC 480, “Distinguishing Liabilities
from Equity,” and ASC 815 “Derivatives and Hedging”.
ASC
820, “Fair Value Measurements and Disclosures,” requires disclosure of the fair value of financial instruments held
by the Company. ASC 825, “Financial Instruments,” defines fair value, and establishes a three-level valuation hierarchy
for disclosures of fair value measurement that enhances disclosure requirements for fair value measures. The carrying amounts reported
in the consolidated balance sheets for receivables and current liabilities each qualify as financial instruments and are a reasonable
estimate of their fair values because of the short period of time between the origination of such instruments and their expected realization
and their current market rate of interest. The three levels of valuation hierarchy are defined as follows:
Level
1
Level
1 applies to assets or liabilities for which there are quoted prices in active markets for identical assets or liabilities.
Level
2
Level
2 applies to assets or liabilities for which there are inputs other than quoted prices that are observable for the asset or liability
such as quoted prices for similar assets or liabilities in active markets; quoted prices for identical assets or liabilities in markets
with insufficient volume or infrequent transactions (less active markets); or model-derived valuations in which significant inputs are
observable or can be derived principally from, or corroborated by, observable market data.
Level
3
Level
3 applies to assets or liabilities for which there are unobservable inputs to the valuation methodology that are significant to the measurement
of the fair value of the assets or liabilities.
The
Company’s financial instruments consist of cash, trade receivables, trade and other payables, lease liabilities, convertible note
payable to related party, loans payable, derivative liabilities and convertible notes payable. Except for cash, loans payable, and derivative
liabilities, the Company’s financial instruments’ carrying amounts, excluding any unamortized discounts, approximate their
fair values due to their short term to maturity. The fair value of long-term lease liabilities approximates their carrying value due
to minimal changes in interest rates and the Company’s credit risk since initial recognition. Cash and derivative liabilities are
measured and recognized at fair value based on level 1 and level 2 inputs, respectively, for all periods presented.
|
| Government Grants |
Government
Grants
Government
grants are recognized where there is reasonable assurance that the grant will be received, and all attached conditions will be complied
with. When the grant relates to an expense item, it is recognized as income over the period necessary to match the grant on a systematic
basis to the costs that it is intended to compensate. The Canadian Emergency Business Account (“CEBA”) are recognized as
government grants. See Note 8 (a) and (b).
|
| Loss per Share |
Loss
per Share
The
Company computes net income (loss) per share in accordance with ASC 260, Earnings per Share. ASC 260 requires presentation of both basic
and diluted earnings per share (“EPS”) on the face of the consolidated statement of operations. Basic EPS is computed by
dividing net income (loss) available to common shareholders (numerator) by the weighted average number of shares outstanding (denominator)
during the period. Diluted EPS gives effect to all dilutive potential common shares outstanding during the period using the treasury
stock method and convertible preferred stock using the if-converted method. In computing diluted EPS, the average stock price for the
period is used in determining the number of shares assumed to be purchased from the exercise of stock options or warrants. Diluted EPS
excludes all dilutive potential shares if their effect is anti-dilutive.
|
| Stock-Based Compensation |
Stock-Based
Compensation
The
Company records stock-based compensation in accordance with ASC 718, “Compensation – Stock Compensation”, using the
fair value method. All transactions in which goods or services are the consideration received for the issuance of equity instruments
are accounted for based on the fair value of the consideration received or the fair value of the equity instrument issued, whichever
is more reliably measurable.
The
Company uses the Black-Scholes option pricing model to calculate the fair value of stock-based awards. This model is affected by the
Company’s stock price as well as assumptions regarding a number of subjective variables. These subjective variables include but
are not limited to the Company’s expected stock price volatility over the term of the awards, and actual and projected employee
stock option exercise behaviors. The value of the portion of the award that is ultimately expected to vest is recognized as an expense
in the consolidated statement of operations over the requisite service period. During the years ended December 31, 2022, and 2021 there
was no stock-based compensation.
|
| Leases |
Leases
The
Company accounts for leases in accordance with ASC 842 “Leases”.
Lessee
Arrangements
The
Company determines if an arrangement is a lease at inception. Operating and financing right-of-use assets and lease liabilities are included
within fixed assets on the consolidated balance sheets. Right-of-use assets represent our right to use an underlying asset for the lease
term and lease liabilities represent our obligation to make lease payments arising from the lease. Right-of-use assets and liabilities
are recognized at commencement date based on the present value of lease payments over the lease term. The Company uses its incremental
borrowing rate, based on the information available at the commencement date, in determining the present value of future lease payments.
Right-of-use assets include any prepaid lease payments and exclude any lease incentives and initial direct costs incurred. Operating
lease expenses are recognized on a straight-line basis over the term of the lease, consisting of interest accrued on the lease liability
and depreciation of the right-of-use asset. The lease terms may include options to extend or terminate the lease if it is reasonably
certain the Company will exercise that option.
Lessor
Arrangements
The
Company determines if an arrangement is a lease at inception. The Company then determines whether to classify the lease as a sales-type
or direct financing lease. At commencement date, a lessor shall derecognize the underlying asset and recognize the net investment in
the lease, selling profit or loss arising from the lease, and initial direct directs as an expense if the fair value of the underlying
asset is different from it carrying amount. The lease receivable (or net investment in the lease) is included on the consolidated balance
sheets. The lease receivable amount is recognized based on the present value of lease payments over the lease term and the present value
of the unguaranteed residual asset, except when the lease is a direct financing lease, whereby the net investment in the lease should
be reduced by the amount of any selling profit. The unguaranteed residual asset is the amount the lessor expects to derive from the underlying
asset following the end of the lease term. The Company uses the rate implicit in the lease agreement at the date of commencement, in
determining the present value of the future lease payments and unguaranteed residual asset. Interest income is recognized over the term
of the lease and lease payments are recognized against the lease receivable balance when received. Currently, the Company only has sales-type
operating leases.
|
| Recently Issued Accounting Pronouncements |
Recently
Issued Accounting Pronouncements
Applicable
for fiscal years beginning after December 15, 2022:
In
July 2022, FASB issued ASU 2022-03, Fair Value Measurement (Topic 820); Fair Value Measurement of Equity Securities Subject to Contractual
Sale Restrictions. The FASB issued final guidance to clarify that a contractual restriction on the sale of an equity security is
not considered part of the unit of account of the equity security and, therefore, is not considered when measuring fair value. Recognizing
a contractual sale restriction as a separate unit of account is not permitted. The guidance will be applied prospectively, with special
transition provisions for entities that qualify as investment companies under ASC 946. The guidance is effective in 2024 for calendar-year
public business entities and in 2025 for all other calendar-year companies. Early adoption is permitted.
In
October 3, 2022, FASB issued ASU 2022-04, Liabilities — Supplier Finance Programs (Subtopic 405-50): Disclosure of Supplier
Finance Program Obligations. The FASB issued final guidance that requires entities that use supplier finance programs in connection
with the purchase of goods and services to disclose the key terms of the programs and information about their obligations outstanding
at the end of the reporting period, including a rollforward of those obligations. The guidance does not affect the recognition, measurement
or financial statement presentation of supplier finance program obligations. The guidance should be applied retrospectively to all periods
in which a balance sheet is presented, except for the rollforward requirement, which should be applied prospectively. The guidance is
effective for all entities for fiscal years beginning after 15 December 2022, including interim periods within those fiscal years, except
for the rollforward requirement, which is effective for fiscal years beginning after 15 December 2023. Early adoption is permitted.
|
| X |
- DefinitionGovernment grants [Ploicy Text Block]
| Name: |
DSGT_GovernmentGrantsPloicyTextBlock |
| Namespace Prefix: |
DSGT_ |
| Data Type: |
dtr-types:textBlockItemType |
| Balance Type: |
na |
| Period Type: |
duration |
|
| X |
- DefinitionRisks and Uncertainties [Policy Text Block]
| Name: |
DSGT_RisksAndUncertaintiesPolicyTextBlock |
| Namespace Prefix: |
DSGT_ |
| Data Type: |
dtr-types:textBlockItemType |
| Balance Type: |
na |
| Period Type: |
duration |
|
| X |
- References
+ Details
| Name: |
us-gaap_AccountingPoliciesAbstract |
| Namespace Prefix: |
us-gaap_ |
| Data Type: |
xbrli:stringItemType |
| Balance Type: |
na |
| Period Type: |
duration |
|
| X |
- DefinitionDisclosure of accounting policy for advertising cost. Reference 1: http://www.xbrl.org/2003/role/disclosureRef
-Publisher FASB
-Name Accounting Standards Codification
-Topic 720
-SubTopic 35
-Section 50
-Paragraph 1
-Subparagraph (a)
-URI https://asc.fasb.org/extlink&oid=6420018&loc=d3e36677-107848
| Name: |
us-gaap_AdvertisingCostsPolicyTextBlock |
| Namespace Prefix: |
us-gaap_ |
| Data Type: |
dtr-types:textBlockItemType |
| Balance Type: |
na |
| Period Type: |
duration |
|
| X |
- DefinitionDisclosure of accounting policy for basis of accounting, or basis of presentation, used to prepare the financial statements (for example, US Generally Accepted Accounting Principles, Other Comprehensive Basis of Accounting, IFRS).
| Name: |
us-gaap_BasisOfAccountingPolicyPolicyTextBlock |
| Namespace Prefix: |
us-gaap_ |
| Data Type: |
dtr-types:textBlockItemType |
| Balance Type: |
na |
| Period Type: |
duration |
|
| X |
- DefinitionDisclosure of accounting policy for cash and cash equivalents, including the policy for determining which items are treated as cash equivalents. Other information that may be disclosed includes (1) the nature of any restrictions on the entity's use of its cash and cash equivalents, (2) whether the entity's cash and cash equivalents are insured or expose the entity to credit risk, (3) the classification of any negative balance accounts (overdrafts), and (4) the carrying basis of cash equivalents (for example, at cost) and whether the carrying amount of cash equivalents approximates fair value. Reference 1: http://fasb.org/us-gaap/role/ref/legacyRef
-Publisher FASB
-Name Accounting Standards Codification
-Topic 230
-SubTopic 10
-Section 50
-Paragraph 1
-URI https://asc.fasb.org/extlink&oid=126999549&loc=d3e4273-108586
| Name: |
us-gaap_CashAndCashEquivalentsPolicyTextBlock |
| Namespace Prefix: |
us-gaap_ |
| Data Type: |
dtr-types:textBlockItemType |
| Balance Type: |
na |
| Period Type: |
duration |
|
| X |
- DefinitionDisclosure of accounting policy for commitments and contingencies, which may include policies for recognizing and measuring loss and gain contingencies. Reference 1: http://fasb.org/us-gaap/role/ref/legacyRef
-Publisher FASB
-Name Accounting Standards Codification
-Topic 460
-SubTopic 10
-Section 50
-Paragraph 8
-Subparagraph (b)
-URI https://asc.fasb.org/extlink&oid=126907703&loc=d3e12565-110249
Reference 2: http://www.xbrl.org/2003/role/disclosureRef
-Publisher FASB
-Name Accounting Standards Codification
-Topic 954
-SubTopic 450
-Section 50
-Paragraph 1
-URI https://asc.fasb.org/extlink&oid=6491354&loc=d3e6049-115624
| Name: |
us-gaap_CommitmentsAndContingenciesPolicyTextBlock |
| Namespace Prefix: |
us-gaap_ |
| Data Type: |
dtr-types:textBlockItemType |
| Balance Type: |
na |
| Period Type: |
duration |
|
| X |
- DefinitionDisclosure of accounting policy for salaries, bonuses, incentive awards, postretirement and postemployment benefits granted to employees, including equity-based arrangements; discloses methodologies for measurement, and the bases for recognizing related assets and liabilities and recognizing and reporting compensation expense. Reference 1: http://fasb.org/us-gaap/role/ref/legacyRef
-Publisher FASB
-Name Accounting Standards Codification
-Topic 718
-SubTopic 10
-Section 50
-Paragraph 2
-Subparagraph (b),(f(1))
-URI https://asc.fasb.org/extlink&oid=128089324&loc=d3e5070-113901
| Name: |
us-gaap_CompensationRelatedCostsPolicyTextBlock |
| Namespace Prefix: |
us-gaap_ |
| Data Type: |
dtr-types:textBlockItemType |
| Balance Type: |
na |
| Period Type: |
duration |
|
| X |
- DefinitionDisclosure of accounting policy for credit risk. Reference 1: http://www.xbrl.org/2003/role/disclosureRef
-Publisher FASB
-Name Accounting Standards Codification
-Topic 275
-SubTopic 10
-Section 50
-Paragraph 1
-Subparagraph (d)
-URI https://asc.fasb.org/extlink&oid=99393423&loc=d3e5967-108592
Reference 2: http://fasb.org/us-gaap/role/ref/legacyRef
-Publisher FASB
-Name Accounting Standards Codification
-Topic 942
-SubTopic 825
-Section 50
-Paragraph 1
-URI https://asc.fasb.org/extlink&oid=126941378&loc=d3e61044-112788
| Name: |
us-gaap_ConcentrationRiskCreditRisk |
| Namespace Prefix: |
us-gaap_ |
| Data Type: |
dtr-types:textBlockItemType |
| Balance Type: |
na |
| Period Type: |
duration |
|
| X |
- DefinitionDisclosure of accounting policy regarding (1) the principles it follows in consolidating or combining the separate financial statements, including the principles followed in determining the inclusion or exclusion of subsidiaries or other entities in the consolidated or combined financial statements and (2) its treatment of interests (for example, common stock, a partnership interest or other means of exerting influence) in other entities, for example consolidation or use of the equity or cost methods of accounting. The accounting policy may also address the accounting treatment for intercompany accounts and transactions, noncontrolling interest, and the income statement treatment in consolidation for issuances of stock by a subsidiary. Reference 1: http://www.xbrl.org/2003/role/exampleRef
-Publisher FASB
-Name Accounting Standards Codification
-Topic 235
-SubTopic 10
-Section 50
-Paragraph 4
-Subparagraph (a)
-URI https://asc.fasb.org/extlink&oid=126899994&loc=d3e18823-107790
Reference 2: http://fasb.org/us-gaap/role/ref/legacyRef
-Publisher FASB
-Name Accounting Standards Codification
-Topic 810
-SubTopic 10
-Section 50
-Paragraph 1
-URI https://asc.fasb.org/extlink&oid=109239629&loc=d3e5614-111684
| Name: |
us-gaap_ConsolidationPolicyTextBlock |
| Namespace Prefix: |
us-gaap_ |
| Data Type: |
dtr-types:textBlockItemType |
| Balance Type: |
na |
| Period Type: |
duration |
|
| X |
- DefinitionDisclosure of accounting policy for computing basic and diluted earnings or loss per share for each class of common stock and participating security. Addresses all significant policy factors, including any antidilutive items that have been excluded from the computation and takes into account stock dividends, splits and reverse splits that occur after the balance sheet date of the latest reporting period but before the issuance of the financial statements. Reference 1: http://fasb.org/us-gaap/role/ref/legacyRef
-Publisher FASB
-Name Accounting Standards Codification
-Topic 260
-SubTopic 10
-Section 50
-Paragraph 1
-Subparagraph (c)
-URI https://asc.fasb.org/extlink&oid=124432515&loc=d3e3550-109257
Reference 2: http://fasb.org/us-gaap/role/ref/legacyRef
-Publisher FASB
-Name Accounting Standards Codification
-Topic 260
-SubTopic 10
-Section 50
-Paragraph 2
-URI https://asc.fasb.org/extlink&oid=124432515&loc=d3e3630-109257
| Name: |
us-gaap_EarningsPerSharePolicyTextBlock |
| Namespace Prefix: |
us-gaap_ |
| Data Type: |
dtr-types:textBlockItemType |
| Balance Type: |
na |
| Period Type: |
duration |
|
| X |
- DefinitionDisclosure of accounting policy for determining the fair value of financial instruments. Reference 1: http://fasb.org/us-gaap/role/ref/legacyRef
-Publisher FASB
-Name Accounting Standards Codification
-Topic 820
-SubTopic 10
-Section 60
-Paragraph 1
-URI https://asc.fasb.org/extlink&oid=7493716&loc=d3e21868-110260
Reference 2: http://fasb.org/us-gaap/role/ref/legacyRef
-Publisher FASB
-Name Accounting Standards Codification
-Topic 825
-SubTopic 10
-Section 50
-Paragraph 1
-URI https://asc.fasb.org/extlink&oid=123594938&loc=d3e13279-108611
| Name: |
us-gaap_FairValueOfFinancialInstrumentsPolicy |
| Namespace Prefix: |
us-gaap_ |
| Data Type: |
dtr-types:textBlockItemType |
| Balance Type: |
na |
| Period Type: |
duration |
|
| X |
- DefinitionDisclosure of accounting policy for (1) transactions denominated in a currency other than the reporting enterprise's functional currency, (2) translating foreign currency financial statements that are incorporated into the financial statements of the reporting enterprise by consolidation, combination, or the equity method of accounting, and (3) remeasurement of the financial statements of a foreign reporting enterprise in a hyperinflationary economy. Reference 1: http://www.xbrl.org/2003/role/disclosureRef
-Publisher FASB
-Name Accounting Standards Codification
-Topic 830
-URI https://asc.fasb.org/topic&trid=2175825
| Name: |
us-gaap_ForeignCurrencyTransactionsAndTranslationsPolicyTextBlock |
| Namespace Prefix: |
us-gaap_ |
| Data Type: |
dtr-types:textBlockItemType |
| Balance Type: |
na |
| Period Type: |
duration |
|
| X |
- DefinitionDisclosure of accounting policy for recognizing and measuring the impairment of long-lived assets. An entity also may disclose its accounting policy for long-lived assets to be sold. This policy excludes goodwill and intangible assets. Reference 1: http://fasb.org/us-gaap/role/ref/legacyRef
-Publisher FASB
-Name Accounting Standards Codification
-Topic 360
-SubTopic 10
-Section 05
-Paragraph 4
-URI https://asc.fasb.org/extlink&oid=109226317&loc=d3e202-110218
Reference 2: http://fasb.org/us-gaap/role/ref/legacyRef
-Publisher FASB
-Name Accounting Standards Codification
-Topic 360
-SubTopic 10
-Section S99
-Paragraph 2
-Subparagraph (SAB Topic 5.CC)
-URI https://asc.fasb.org/extlink&oid=27011434&loc=d3e125687-122742
| Name: |
us-gaap_ImpairmentOrDisposalOfLongLivedAssetsPolicyTextBlock |
| Namespace Prefix: |
us-gaap_ |
| Data Type: |
dtr-types:textBlockItemType |
| Balance Type: |
na |
| Period Type: |
duration |
|
| X |
- DefinitionDisclosure of accounting policy for income taxes, which may include its accounting policies for recognizing and measuring deferred tax assets and liabilities and related valuation allowances, recognizing investment tax credits, operating loss carryforwards, tax credit carryforwards, and other carryforwards, methodologies for determining its effective income tax rate and the characterization of interest and penalties in the financial statements. Reference 1: http://www.xbrl.org/2003/role/disclosureRef
-Publisher FASB
-Name Accounting Standards Codification
-Topic 740
-SubTopic 10
-Section 45
-Paragraph 25
-URI https://asc.fasb.org/extlink&oid=123427490&loc=d3e32247-109318
Reference 2: http://www.xbrl.org/2003/role/disclosureRef
-Publisher FASB
-Name Accounting Standards Codification
-Topic 740
-SubTopic 10
-Section 50
-Paragraph 20
-URI https://asc.fasb.org/extlink&oid=121826272&loc=d3e32847-109319
Reference 3: http://www.xbrl.org/2003/role/disclosureRef
-Publisher FASB
-Name Accounting Standards Codification
-Topic 740
-SubTopic 10
-Section 50
-Paragraph 19
-URI https://asc.fasb.org/extlink&oid=121826272&loc=d3e32840-109319
Reference 4: http://www.xbrl.org/2003/role/disclosureRef
-Publisher FASB
-Name Accounting Standards Codification
-Topic 220
-SubTopic 10
-Section 50
-Paragraph 1
-URI https://asc.fasb.org/extlink&oid=124431353&loc=SL116659661-227067
Reference 5: http://www.xbrl.org/2003/role/disclosureRef
-Publisher FASB
-Name Accounting Standards Codification
-Topic 740
-SubTopic 10
-Section 50
-Paragraph 9
-URI https://asc.fasb.org/extlink&oid=121826272&loc=d3e32639-109319
Reference 6: http://www.xbrl.org/2003/role/disclosureRef
-Publisher FASB
-Name Accounting Standards Codification
-Topic 740
-SubTopic 10
-Section 45
-Paragraph 28
-URI https://asc.fasb.org/extlink&oid=123427490&loc=d3e32280-109318
Reference 7: http://www.xbrl.org/2003/role/disclosureRef
-Publisher FASB
-Name Accounting Standards Codification
-Topic 740
-SubTopic 10
-Section 50
-Paragraph 17
-Subparagraph (b)
-URI https://asc.fasb.org/extlink&oid=121826272&loc=d3e32809-109319
| Name: |
us-gaap_IncomeTaxPolicyTextBlock |
| Namespace Prefix: |
us-gaap_ |
| Data Type: |
dtr-types:textBlockItemType |
| Balance Type: |
na |
| Period Type: |
duration |
|
| X |
- DefinitionDisclosure of accounting policy for finite-lived intangible assets. This accounting policy also might address: (1) the amortization method used; (2) the useful lives of such assets; and (3) how the entity assesses and measures impairment of such assets. Reference 1: http://www.xbrl.org/2003/role/disclosureRef
-Publisher FASB
-Name Accounting Standards Codification
-Topic 926
-SubTopic 20
-Section 50
-Paragraph 5
-URI https://asc.fasb.org/extlink&oid=120154696&loc=d3e54445-107959
Reference 2: http://fasb.org/us-gaap/role/ref/legacyRef
-Publisher FASB
-Name Accounting Standards Codification
-Topic 350
-SubTopic 30
-Section 50
-Paragraph 2
-Subparagraph (a)
-URI https://asc.fasb.org/extlink&oid=66006027&loc=d3e16323-109275
Reference 3: http://www.xbrl.org/2003/role/disclosureRef
-Publisher FASB
-Name Accounting Standards Codification
-Topic 920
-SubTopic 350
-Section 50
-Paragraph 4
-Subparagraph (a)
-URI https://asc.fasb.org/extlink&oid=120155617&loc=SL120155638-234783
Reference 4: http://www.xbrl.org/2003/role/exampleRef
-Publisher FASB
-Name Accounting Standards Codification
-Topic 235
-SubTopic 10
-Section 50
-Paragraph 4
-Subparagraph (c)
-URI https://asc.fasb.org/extlink&oid=126899994&loc=d3e18823-107790
Reference 5: http://www.xbrl.org/2003/role/disclosureRef
-Publisher FASB
-Name Accounting Standards Codification
-Topic 920
-SubTopic 350
-Section 50
-Paragraph 1
-Subparagraph (a)
-URI https://asc.fasb.org/extlink&oid=120155617&loc=SL120155628-234783
Reference 6: http://www.xbrl.org/2003/role/disclosureRef
-Publisher FASB
-Name Accounting Standards Codification
-Topic 920
-SubTopic 350
-Section 50
-Paragraph 1
-Subparagraph (b)
-URI https://asc.fasb.org/extlink&oid=120155617&loc=SL120155628-234783
| Name: |
us-gaap_IntangibleAssetsFiniteLivedPolicy |
| Namespace Prefix: |
us-gaap_ |
| Data Type: |
dtr-types:textBlockItemType |
| Balance Type: |
na |
| Period Type: |
duration |
|
| X |
- DefinitionDisclosure of inventory accounting policy for inventory classes, including, but not limited to, basis for determining inventory amounts, methods by which amounts are added and removed from inventory classes, loss recognition on impairment of inventories, and situations in which inventories are stated above cost. Reference 1: http://www.xbrl.org/2003/role/disclosureRef
-Publisher FASB
-Name Accounting Standards Codification
-Topic 330
-SubTopic 10
-Section 50
-Paragraph 4
-URI https://asc.fasb.org/extlink&oid=116847112&loc=d3e4556-108314
Reference 2: http://www.xbrl.org/2003/role/disclosureRef
-Publisher FASB
-Name Accounting Standards Codification
-Topic 330
-URI https://asc.fasb.org/topic&trid=2126998
Reference 3: http://www.xbrl.org/2003/role/disclosureRef
-Publisher FASB
-Name Accounting Standards Codification
-Topic 210
-SubTopic 10
-Section S99
-Paragraph 1
-Subparagraph (SX 210.5-02(6)(b))
-URI https://asc.fasb.org/extlink&oid=120391452&loc=d3e13212-122682
Reference 4: http://www.xbrl.org/2003/role/disclosureRef
-Publisher FASB
-Name Accounting Standards Codification
-Topic 912
-SubTopic 330
-Section 50
-Paragraph 1
-URI https://asc.fasb.org/extlink&oid=6471895&loc=d3e55923-109411
Reference 5: http://www.xbrl.org/2003/role/disclosureRef
-Publisher FASB
-Name Accounting Standards Codification
-Topic 330
-SubTopic 10
-Section 50
-Paragraph 1
-URI https://asc.fasb.org/extlink&oid=116847112&loc=d3e4492-108314
Reference 6: http://www.xbrl.org/2003/role/disclosureRef
-Publisher FASB
-Name Accounting Standards Codification
-Topic 270
-SubTopic 10
-Section 45
-Paragraph 6
-Subparagraph (a)
-URI https://asc.fasb.org/extlink&oid=126900757&loc=d3e543-108305
Reference 7: http://www.xbrl.org/2003/role/exampleRef
-Publisher FASB
-Name Accounting Standards Codification
-Topic 235
-SubTopic 10
-Section 50
-Paragraph 4
-Subparagraph (d)
-URI https://asc.fasb.org/extlink&oid=126899994&loc=d3e18823-107790
Reference 8: http://www.xbrl.org/2003/role/disclosureRef
-Publisher FASB
-Name Accounting Standards Codification
-Topic 210
-SubTopic 10
-Section 50
-Paragraph 1
-URI https://asc.fasb.org/extlink&oid=6361739&loc=d3e7789-107766
| Name: |
us-gaap_InventoryPolicyTextBlock |
| Namespace Prefix: |
us-gaap_ |
| Data Type: |
dtr-types:textBlockItemType |
| Balance Type: |
na |
| Period Type: |
duration |
|
| X |
- DefinitionDisclosure of accounting policy for leasing arrangement entered into by lessee. Reference 1: http://www.xbrl.org/2003/role/disclosureRef
-Publisher FASB
-Name Accounting Standards Codification
-Topic 842
-SubTopic 20
-Section 50
-Paragraph 1
-Subparagraph (b)
-URI https://asc.fasb.org/extlink&oid=128292326&loc=SL77918666-209980
| Name: |
us-gaap_LesseeLeasesPolicyTextBlock |
| Namespace Prefix: |
us-gaap_ |
| Data Type: |
dtr-types:textBlockItemType |
| Balance Type: |
na |
| Period Type: |
duration |
|
| X |
- DefinitionDisclosure of accounting policy pertaining to new accounting pronouncements that may impact the entity's financial reporting. Includes, but is not limited to, quantification of the expected or actual impact.
| Name: |
us-gaap_NewAccountingPronouncementsPolicyPolicyTextBlock |
| Namespace Prefix: |
us-gaap_ |
| Data Type: |
dtr-types:textBlockItemType |
| Balance Type: |
na |
| Period Type: |
duration |
|
| X |
- DefinitionDisclosure of accounting policy for long-lived, physical asset used in normal conduct of business and not intended for resale. Includes, but is not limited to, work of art, historical treasure, and similar asset classified as collections. Reference 1: http://www.xbrl.org/2003/role/disclosureRef
-Publisher FASB
-Name Accounting Standards Codification
-Topic 958
-SubTopic 360
-Section 50
-Paragraph 1
-Subparagraph (d)
-URI https://asc.fasb.org/extlink&oid=126982197&loc=d3e99779-112916
Reference 2: http://www.xbrl.org/2003/role/disclosureRef
-Publisher FASB
-Name Accounting Standards Codification
-Topic 958
-SubTopic 360
-Section 50
-Paragraph 6
-URI https://asc.fasb.org/extlink&oid=126982197&loc=d3e99893-112916
Reference 3: http://fasb.org/us-gaap/role/ref/legacyRef
-Publisher FASB
-Name Accounting Standards Codification
-Topic 360
-SubTopic 10
-Section 50
-Paragraph 1
-URI https://asc.fasb.org/extlink&oid=6391035&loc=d3e2868-110229
| Name: |
us-gaap_PropertyPlantAndEquipmentPolicyTextBlock |
| Namespace Prefix: |
us-gaap_ |
| Data Type: |
dtr-types:textBlockItemType |
| Balance Type: |
na |
| Period Type: |
duration |
|
| X |
- DefinitionDisclosure of accounting policy for receivable. Includes, but is not limited to, accounts receivable and financing receivable. Reference 1: http://www.xbrl.org/2009/role/commonPracticeRef
-Publisher FASB
-Name Accounting Standards Codification
-Topic 310
-SubTopic 10
-Section 50
-Paragraph 2
-URI https://asc.fasb.org/extlink&oid=123577603&loc=d3e5033-111524
Reference 2: http://www.xbrl.org/2009/role/commonPracticeRef
-Publisher FASB
-Name Accounting Standards Codification
-Topic 310
-SubTopic 20
-Section 50
-Paragraph 4
-URI https://asc.fasb.org/extlink&oid=84159169&loc=d3e10178-111534
Reference 3: http://www.xbrl.org/2009/role/commonPracticeRef
-Publisher FASB
-Name Accounting Standards Codification
-Topic 310
-SubTopic 20
-Section 50
-Paragraph 2
-URI https://asc.fasb.org/extlink&oid=84159169&loc=d3e10149-111534
Reference 4: http://www.xbrl.org/2009/role/commonPracticeRef
-Publisher FASB
-Name Accounting Standards Codification
-Topic 310
-SubTopic 20
-Section 50
-Paragraph 1
-URI https://asc.fasb.org/extlink&oid=84159169&loc=d3e10133-111534
| Name: |
us-gaap_ReceivablesPolicyTextBlock |
| Namespace Prefix: |
us-gaap_ |
| Data Type: |
dtr-types:textBlockItemType |
| Balance Type: |
na |
| Period Type: |
duration |
|
| X |
- DefinitionDisclosure of accounting policy for costs it has incurred (1) in a planned search or critical investigation aimed at discovery of new knowledge with the hope that such knowledge will be useful in developing a new product or service, a new process or technique, or in bringing about a significant improvement to an existing product or process; or (2) to translate research findings or other knowledge into a plan or design for a new product or process or for a significant improvement to an existing product or process. Reference 1: http://fasb.org/us-gaap/role/ref/legacyRef
-Publisher FASB
-Name Accounting Standards Codification
-Topic 730
-SubTopic 10
-Section 50
-Paragraph 1
-URI https://asc.fasb.org/extlink&oid=6420194&loc=d3e21568-108373
| Name: |
us-gaap_ResearchAndDevelopmentExpensePolicy |
| Namespace Prefix: |
us-gaap_ |
| Data Type: |
dtr-types:textBlockItemType |
| Balance Type: |
na |
| Period Type: |
duration |
|
| X |
- DefinitionDisclosure of accounting policy for revenue. Includes revenue from contract with customer and from other sources. Reference 1: http://www.xbrl.org/2003/role/exampleRef
-Publisher FASB
-Name Accounting Standards Codification
-Topic 235
-SubTopic 10
-Section 50
-Paragraph 4
-Subparagraph (e)
-URI https://asc.fasb.org/extlink&oid=126899994&loc=d3e18823-107790
Reference 2: http://www.xbrl.org/2003/role/exampleRef
-Publisher FASB
-Name Accounting Standards Codification
-Topic 235
-SubTopic 10
-Section 50
-Paragraph 4
-Subparagraph (f)
-URI https://asc.fasb.org/extlink&oid=126899994&loc=d3e18823-107790
| Name: |
us-gaap_RevenueRecognitionPolicyTextBlock |
| Namespace Prefix: |
us-gaap_ |
| Data Type: |
dtr-types:textBlockItemType |
| Balance Type: |
na |
| Period Type: |
duration |
|
| X |
- DefinitionDisclosure of accounting policy for segment reporting. Reference 1: http://www.xbrl.org/2003/role/disclosureRef
-Publisher FASB
-Name Accounting Standards Codification
-Topic 280
-SubTopic 10
-Section 50
-Paragraph 29
-Subparagraph (e)
-URI https://asc.fasb.org/extlink&oid=126901519&loc=d3e8864-108599
Reference 2: http://www.xbrl.org/2003/role/disclosureRef
-Publisher FASB
-Name Accounting Standards Codification
-Topic 280
-SubTopic 10
-Section 50
-Paragraph 29
-Subparagraph (a)
-URI https://asc.fasb.org/extlink&oid=126901519&loc=d3e8864-108599
Reference 3: http://www.xbrl.org/2003/role/disclosureRef
-Publisher FASB
-Name Accounting Standards Codification
-Topic 280
-SubTopic 10
-Section 50
-Paragraph 41
-Subparagraph (a)
-URI https://asc.fasb.org/extlink&oid=126901519&loc=d3e9038-108599
Reference 4: http://www.xbrl.org/2003/role/disclosureRef
-Publisher FASB
-Name Accounting Standards Codification
-Topic 280
-SubTopic 10
-Section 50
-Paragraph 29
-Subparagraph (c)
-URI https://asc.fasb.org/extlink&oid=126901519&loc=d3e8864-108599
Reference 5: http://www.xbrl.org/2003/role/disclosureRef
-Publisher FASB
-Name Accounting Standards Codification
-Topic 280
-SubTopic 10
-Section 50
-Paragraph 29
-Subparagraph (b)
-URI https://asc.fasb.org/extlink&oid=126901519&loc=d3e8864-108599
Reference 6: http://www.xbrl.org/2003/role/disclosureRef
-Publisher FASB
-Name Accounting Standards Codification
-Topic 280
-SubTopic 10
-Section 50
-Paragraph 29
-URI https://asc.fasb.org/extlink&oid=126901519&loc=d3e8864-108599
Reference 7: http://www.xbrl.org/2003/role/disclosureRef
-Publisher FASB
-Name Accounting Standards Codification
-Topic 280
-SubTopic 10
-Section 50
-Paragraph 29
-Subparagraph (d)
-URI https://asc.fasb.org/extlink&oid=126901519&loc=d3e8864-108599
| Name: |
us-gaap_SegmentReportingPolicyPolicyTextBlock |
| Namespace Prefix: |
us-gaap_ |
| Data Type: |
dtr-types:textBlockItemType |
| Balance Type: |
na |
| Period Type: |
duration |
|
| X |
- DefinitionDisclosure of accounting policy for accounts receivable. Reference 1: http://www.xbrl.org/2003/role/disclosureRef
-Publisher FASB
-Name Accounting Standards Codification
-Topic 310
-SubTopic 10
-Section 50
-Paragraph 1
-Subparagraph (a)
-URI https://asc.fasb.org/extlink&oid=123577603&loc=d3e4975-111524
Reference 2: http://fasb.org/us-gaap/role/ref/otherTransitionRef
-Publisher FASB
-Name Accounting Standards Codification
-Topic 310
-SubTopic 10
-Section 50
-Paragraph 15
-Subparagraph (d)
-URI https://asc.fasb.org/extlink&oid=123577603&loc=d3e5212-111524
Reference 3: http://fasb.org/us-gaap/role/ref/otherTransitionRef
-Publisher FASB
-Name Accounting Standards Codification
-Topic 310
-SubTopic 10
-Section 50
-Paragraph 11B
-Subparagraph (b)
-URI https://asc.fasb.org/extlink&oid=123577603&loc=SL6953423-111524
Reference 4: http://fasb.org/us-gaap/role/ref/otherTransitionRef
-Publisher FASB
-Name Accounting Standards Codification
-Topic 310
-SubTopic 10
-Section 50
-Paragraph 6
-URI https://asc.fasb.org/extlink&oid=123577603&loc=d3e5093-111524
Reference 5: http://www.xbrl.org/2003/role/disclosureRef
-Publisher FASB
-Name Accounting Standards Codification
-Topic 310
-SubTopic 10
-Section 50
-Paragraph 2
-URI https://asc.fasb.org/extlink&oid=123577603&loc=d3e5033-111524
Reference 6: http://www.xbrl.org/2003/role/disclosureRef
-Publisher FASB
-Name Accounting Standards Codification
-Topic 310
-SubTopic 20
-Section 50
-Paragraph 1
-URI https://asc.fasb.org/extlink&oid=84159169&loc=d3e10133-111534
| Name: |
us-gaap_TradeAndOtherAccountsReceivablePolicy |
| Namespace Prefix: |
us-gaap_ |
| Data Type: |
dtr-types:textBlockItemType |
| Balance Type: |
na |
| Period Type: |
duration |
|
| X |
- DefinitionDisclosure of accounting policy for the use of estimates in the preparation of financial statements in conformity with generally accepted accounting principles. Reference 1: http://www.xbrl.org/2003/role/disclosureRef
-Publisher FASB
-Name Accounting Standards Codification
-Topic 275
-SubTopic 10
-Section 50
-Paragraph 12
-URI https://asc.fasb.org/extlink&oid=99393423&loc=d3e6191-108592
Reference 2: http://www.xbrl.org/2003/role/disclosureRef
-Publisher FASB
-Name Accounting Standards Codification
-Topic 275
-SubTopic 10
-Section 50
-Paragraph 11
-URI https://asc.fasb.org/extlink&oid=99393423&loc=d3e6161-108592
Reference 3: http://fasb.org/us-gaap/role/ref/legacyRef
-Publisher FASB
-Name Accounting Standards Codification
-Topic 275
-SubTopic 10
-Section 50
-Paragraph 9
-URI https://asc.fasb.org/extlink&oid=99393423&loc=d3e6143-108592
Reference 4: http://www.xbrl.org/2003/role/disclosureRef
-Publisher FASB
-Name Accounting Standards Codification
-Topic 275
-SubTopic 10
-Section 50
-Paragraph 1
-Subparagraph (b)
-URI https://asc.fasb.org/extlink&oid=99393423&loc=d3e5967-108592
Reference 5: http://fasb.org/us-gaap/role/ref/legacyRef
-Publisher FASB
-Name Accounting Standards Codification
-Topic 275
-SubTopic 10
-Section 50
-Paragraph 4
-URI https://asc.fasb.org/extlink&oid=99393423&loc=d3e6061-108592
Reference 6: http://fasb.org/us-gaap/role/ref/legacyRef
-Publisher FASB
-Name Accounting Standards Codification
-Topic 275
-SubTopic 10
-Section 50
-Paragraph 8
-URI https://asc.fasb.org/extlink&oid=99393423&loc=d3e6132-108592
Reference 7: http://www.xbrl.org/2003/role/disclosureRef
-Publisher FASB
-Name Accounting Standards Codification
-Topic 275
-SubTopic 10
-Section 50
-Paragraph 1
-Subparagraph (c)
-URI https://asc.fasb.org/extlink&oid=99393423&loc=d3e5967-108592
| Name: |
us-gaap_UseOfEstimates |
| Namespace Prefix: |
us-gaap_ |
| Data Type: |
dtr-types:textBlockItemType |
| Balance Type: |
na |
| Period Type: |
duration |
|
v3.23.2
SUMMARY OF SIGNIFICANT ACCOUNTING POLICIES (Tables)
|
12 Months Ended |
Dec. 31, 2022 |
|---|
| Accounting Policies [Abstract] |
|
| SCHEDULE OF ESTIMATED USEFUL LIVES OF EQUIPMENT |
SCHEDULE
OF ESTIMATED USEFUL LIVES OF EQUIPMENT
| Furniture
and equipment |
5-years
straight-line |
| Vehicles |
5-years
straight-line |
| Computer
equipment |
3-years
straight-line |
| Machinery |
5-years
straight-line |
| Equipment
on lease |
5-years
straight-line |
|
| X |
- DefinitionSchedule of estimated useful lives of equipment [Table text block]
| Name: |
DSGT_ScheduleOfEstimatedUsefulLivesOfEquipmentTableTextBlock |
| Namespace Prefix: |
DSGT_ |
| Data Type: |
dtr-types:textBlockItemType |
| Balance Type: |
na |
| Period Type: |
duration |
|
| X |
- References
+ Details
| Name: |
us-gaap_AccountingPoliciesAbstract |
| Namespace Prefix: |
us-gaap_ |
| Data Type: |
xbrli:stringItemType |
| Balance Type: |
na |
| Period Type: |
duration |
|
v3.23.2
TRADE RECEIVABLES (Tables)
|
12 Months Ended |
Dec. 31, 2022 |
|---|
| Receivables [Abstract] |
|
| SCHEDULE OF TRADE RECEIVABLES |
As
of December 31, 2022 and 2021, trade receivables consist of the following:
SCHEDULE
OF TRADE RECEIVABLES
| | |
December 31, 2022 | | |
December 31, 2021 | |
| Accounts receivables | |
$ | 711,028 | | |
$ | 271,950 | |
| Allowance for doubtful accounts | |
| - | | |
| (32,128 | ) |
| Total trade receivables, net | |
$ | 711,028 | | |
$ | 239,822 | |
|
| X |
- References
+ Details
| Name: |
us-gaap_ReceivablesAbstract |
| Namespace Prefix: |
us-gaap_ |
| Data Type: |
xbrli:stringItemType |
| Balance Type: |
na |
| Period Type: |
duration |
|
| X |
- DefinitionTabular disclosure of the various types of trade accounts and notes receivable and for each the gross carrying value, allowance, and net carrying value as of the balance sheet date. Presentation is categorized by current, noncurrent and unclassified receivables. Reference 1: http://fasb.org/us-gaap/role/ref/legacyRef
-Publisher FASB
-Name Accounting Standards Codification
-Topic 210
-SubTopic 10
-Section S99
-Paragraph 1
-Subparagraph (SX 210.5-02.3,4)
-URI https://asc.fasb.org/extlink&oid=120391452&loc=d3e13212-122682
| Name: |
us-gaap_ScheduleOfAccountsNotesLoansAndFinancingReceivableTextBlock |
| Namespace Prefix: |
us-gaap_ |
| Data Type: |
dtr-types:textBlockItemType |
| Balance Type: |
na |
| Period Type: |
duration |
|
v3.23.2
INVENTORIES (Tables)
|
12 Months Ended |
Dec. 31, 2022 |
|---|
| Inventory Disclosure [Abstract] |
|
| SCHEDULE OF INVENTORIES |
As
of December 31, 2022, and December 31, 2021, inventories consist of the following:
SCHEDULE
OF INVENTORIES
| | |
December 31, 2022 | | |
December 31, 2021 | |
| Parts and accessories | |
$ | 217,582 | | |
$ | 226,230 | |
| Golf carts | |
| 799,035 | | |
| 158,588 | |
| E-bikes | |
| 123,280 | | |
| 35,060 | |
| Electric vehicles | |
| 64,680 | | |
| 292,800 | |
| Total inventories | |
$ | 1,204,577 | | |
$ | 712,678 | |
|
| X |
- References
+ Details
| Name: |
us-gaap_InventoryDisclosureAbstract |
| Namespace Prefix: |
us-gaap_ |
| Data Type: |
xbrli:stringItemType |
| Balance Type: |
na |
| Period Type: |
duration |
|
| X |
- DefinitionTabular disclosure of the carrying amount as of the balance sheet date of merchandise, goods, commodities, or supplies held for future sale or to be used in manufacturing, servicing or production process. Reference 1: http://fasb.org/us-gaap/role/ref/legacyRef
-Publisher FASB
-Name Accounting Standards Codification
-Topic 210
-SubTopic 10
-Section S99
-Paragraph 1
-Subparagraph (SX 210.5-02(6)(c))
-URI https://asc.fasb.org/extlink&oid=120391452&loc=d3e13212-122682
Reference 2: http://fasb.org/us-gaap/role/ref/legacyRef
-Publisher FASB
-Name Accounting Standards Codification
-Topic 210
-SubTopic 10
-Section S99
-Paragraph 1
-Subparagraph (SX 210.5-02(6)(b))
-URI https://asc.fasb.org/extlink&oid=120391452&loc=d3e13212-122682
Reference 3: http://fasb.org/us-gaap/role/ref/legacyRef
-Publisher FASB
-Name Accounting Standards Codification
-Topic 210
-SubTopic 10
-Section S99
-Paragraph 1
-Subparagraph (SX 210.5-02(6)(a))
-URI https://asc.fasb.org/extlink&oid=120391452&loc=d3e13212-122682
Reference 4: http://fasb.org/us-gaap/role/ref/legacyRef
-Publisher FASB
-Name Accounting Standards Codification
-Topic 210
-SubTopic 10
-Section 50
-Paragraph 1
-URI https://asc.fasb.org/extlink&oid=6361739&loc=d3e7789-107766
| Name: |
us-gaap_ScheduleOfInventoryCurrentTableTextBlock |
| Namespace Prefix: |
us-gaap_ |
| Data Type: |
dtr-types:textBlockItemType |
| Balance Type: |
na |
| Period Type: |
duration |
|
v3.23.2
FIXED ASSETS AND EQUIPMENT ON LEASE (Tables)
|
12 Months Ended |
Dec. 31, 2022 |
|---|
| Property, Plant and Equipment [Abstract] |
|
| SCHEDULE OF FIXED ASSETS |
As
of December 31, 2022 and 2021, fixed assets consisted of the following:
SCHEDULE OF FIXED ASSETS
| | |
December 31, 2022 | | |
December 31, 2021 | |
| Machinery | |
$ | 5,040 | | |
$ | 5,040 | |
| Furniture and equipment | |
| 2,587 | | |
| 2,350 | |
| Computer equipment | |
| 50,781 | | |
| 41,784 | |
| Vehicles | |
| 19,989 | | |
| 28,360 | |
| Fixed assets, gross | |
| 19,989 | | |
| 28,360 | |
| Accumulated depreciation | |
| (52,851 | ) | |
| (42,220 | ) |
| Fixed assets, net | |
$ | 25,546 | | |
$ | 35,314 | |
|
| X |
- References
+ Details
| Name: |
us-gaap_PropertyPlantAndEquipmentAbstract |
| Namespace Prefix: |
us-gaap_ |
| Data Type: |
xbrli:stringItemType |
| Balance Type: |
na |
| Period Type: |
duration |
|
| X |
- DefinitionTabular disclosure of physical assets used in the normal conduct of business and not intended for resale. Includes, but is not limited to, balances by class of assets, depreciation and depletion expense and method used, including composite depreciation, and accumulated deprecation. Reference 1: http://fasb.org/us-gaap/role/ref/legacyRef
-Publisher FASB
-Name Accounting Standards Codification
-Topic 360
-SubTopic 10
-Section 50
-Paragraph 1
-URI https://asc.fasb.org/extlink&oid=6391035&loc=d3e2868-110229
| Name: |
us-gaap_PropertyPlantAndEquipmentTextBlock |
| Namespace Prefix: |
us-gaap_ |
| Data Type: |
dtr-types:textBlockItemType |
| Balance Type: |
na |
| Period Type: |
duration |
|
v3.23.2
INTANGIBLE ASSETS (Tables)
|
12 Months Ended |
Dec. 31, 2022 |
|---|
| Goodwill and Intangible Assets Disclosure [Abstract] |
|
| SCHEDULE OF INTANGIBLE ASSETS |
As
of December 31, 2022 and 2021, intangible assets consisted of the following:
SCHEDULE OF INTANGIBLE ASSETS
| | |
December 31, 2022 | | |
December 31, 2021 | |
| Intangible asset - Patents | |
$ | 22,353 | | |
$ | 22,353 | |
| Accumulated amortization | |
| (11,977 | ) | |
| (10,749 | ) |
| Intangible asset, net | |
$ | 10,376 | | |
$ | 11,604 | |
|
| X |
- References
+ Details
| Name: |
us-gaap_GoodwillAndIntangibleAssetsDisclosureAbstract |
| Namespace Prefix: |
us-gaap_ |
| Data Type: |
xbrli:stringItemType |
| Balance Type: |
na |
| Period Type: |
duration |
|
| X |
- DefinitionTabular disclosure of assets, excluding financial assets and goodwill, lacking physical substance and exist in perpetuity, by either major class or business segment. Reference 1: http://fasb.org/us-gaap/role/ref/legacyRef
-Publisher FASB
-Name Accounting Standards Codification
-Topic 350
-SubTopic 30
-Section 50
-Paragraph 3
-Subparagraph (b),(d)
-URI https://asc.fasb.org/extlink&oid=66006027&loc=d3e16373-109275
Reference 2: http://fasb.org/us-gaap/role/ref/legacyRef
-Publisher FASB
-Name Accounting Standards Codification
-Topic 350
-SubTopic 30
-Section 50
-Paragraph 2
-Subparagraph (b)
-URI https://asc.fasb.org/extlink&oid=66006027&loc=d3e16323-109275
| Name: |
us-gaap_ScheduleOfIndefiniteLivedIntangibleAssetsTableTextBlock |
| Namespace Prefix: |
us-gaap_ |
| Data Type: |
dtr-types:textBlockItemType |
| Balance Type: |
na |
| Period Type: |
duration |
|
v3.23.2
TRADE AND OTHER PAYABLES (Tables)
|
12 Months Ended |
Dec. 31, 2022 |
|---|
| Payables and Accruals [Abstract] |
|
| SCHEDULE OF TRADE AND OTHER PAYABLES |
As
of December 31, 2022, and 2021, trade and other payables consist of the following:
SCHEDULE OF TRADE AND OTHER PAYABLES
| | |
December 31, 2022 | | |
December 31, 2021 | |
| Accounts payable and accrued expenses | |
$ | 1,462,557 | | |
$ | 949,937 | |
| Accrued interest | |
| 1,880,463 | | |
| 248,610 | |
| Other liabilities | |
| 13,236 | | |
| 4,051 | |
| Total trade and other payables | |
$ | 3,356,256 | | |
$ | 1,202,598 | |
|
| X |
- References
+ Details
| Name: |
us-gaap_PayablesAndAccrualsAbstract |
| Namespace Prefix: |
us-gaap_ |
| Data Type: |
xbrli:stringItemType |
| Balance Type: |
na |
| Period Type: |
duration |
|
| X |
- DefinitionTabular disclosure of the (a) carrying value as of the balance sheet date of liabilities incurred (and for which invoices have typically been received) and payable to vendors for goods and services received that are used in an entity's business (accounts payable); (b) other payables; and (c) accrued liabilities. Examples include taxes, interest, rent and utilities. Used to reflect the current portion of the liabilities (due within one year or within the normal operating cycle if longer). An alternative caption includes accrued expenses.
| Name: |
us-gaap_ScheduleOfAccountsPayableAndAccruedLiabilitiesTableTextBlock |
| Namespace Prefix: |
us-gaap_ |
| Data Type: |
dtr-types:textBlockItemType |
| Balance Type: |
na |
| Period Type: |
duration |
|
v3.23.2
LOANS PAYABLE (Tables)
|
12 Months Ended |
Dec. 31, 2022 |
|---|
| Debt Disclosure [Abstract] |
|
| SCHEDULE OF LOANS PAYABLE |
As
of December 31, 2022 and 2021, loans payable consisted of the following:
SCHEDULE OF LOANS PAYABLE
| | |
December 31, 2022 | | |
December 31, 2021 | |
| Unsecured loan payable in the amount of CDN$40,000, due on or before December 31, 2025(a) | |
$ | 29,520 | | |
| 31,449 | |
| Unsecured loan payable in the amount of CDN$40,000, due on or before December 31, 2025 (b) | |
| 29,520 | | |
| 31,449 | |
| Unsecured loan payable, due on May 21, 2022, interest at 1% per annum(c) | |
| - | | |
| 30,115 | |
| Secured loan payable, due on June 5, 2050, interest at 3.75% per annum(d) | |
| 150,000 | | |
| 150,000 | |
| Unsecured loan payable, due on June 20, 2022, interest at 9% per annum(e) | |
| - | | |
| 2,084,934 | |
| Unsecured loan payable, due on December
1, 2025, interest at 10%
per annum(f) | |
| 1,000,000 | | |
| - | |
| Preferred F series shares issued with mandatory redemption(g) | |
| 1,357,651 | | |
| - | |
| | |
| 2,566,692 | | |
| 2,327,947 | |
| Current portion | |
| (2,416,692 | ) | |
| (2,115,049 | ) |
| Loans payable, long-term portion | |
$ | 150,000 | | |
$ | 212,898 | |
| (a) |
On April 17, 2020, the
Company received a loan in the principal amount of $29,520 (CDN$40,000) under the Canada Emergency Business Account program. The
loan is non-interest bearing and eligible for CDN$10,000 forgiveness if repaid by December 31, 2022. If not repaid by December 31,
2022, the loan bears interest at 5% per annum and is due on December 31, 2025. |
| |
|
| (b) |
On April 21, 2020, the
Company received a loan in the principal amount of $29,520 (CDN$40,000) under the Canada Emergency Business Account program. The
loan is non-interest bearing and eligible for CDN$10,000 forgiveness if repaid by December 31, 2022. If not repaid by December 31,
2022, the loan bears interest at 5% per annum and is due on December 31, 2025. |
| |
|
| (c) |
On May 21, 2020, the Company
received a loan in the principal amount of $30,115 under the Paycheck Protection Program. The loan bears interest at 1% per annum
and is due on May 21, 2022, with payments deferred for the first six months of the term. This loan was forgiven and was recorded
to gain on debt extinguishment during the year ended December 31, 2022 |
| |
|
| (d) |
On June 5, 2020, the Company
received a loan in the principal amount of $150,000. The loan bears interest at 3.75% per annum and is due on June 5, 2050. The loan
is secured by all tangible and intangible assets of Company. Fixed payments of $731 are due monthly and begin 12 months from the
date of the loan. The payments are applied against any accrued interest before principal amounts are repaid. |
| (e) |
On
September 13, 2021, the Company entered into a securities purchase agreement with a non-related party. Pursuant to the agreement,
the Company received cash proceeds of $2,000,000
on September 13, 2021,
in exchange for the issuance of an unsecured promissory note in the principal amount of $2,400,000,
which was inclusive of a $400,000
original issue discount
and bears interest at 9%
per annum to the holder and matures June
20, 2022. If
the note is not paid in full before December 12, 2021, an additional $100,000 of guaranteed interest will be added to the note. An
additional $100,000 of guaranteed interest will be added to the note on the 12th day of each succeeding month during which
any portion of the note remains unpaid.
Any principal or interest on the note that is not paid when due or during any period of default bears interest at 24% per annum. |
| |
|
| |
In the event of a default,
the note is convertible at the price that is equal to a 40% discount to the lowest trading price of the Company’s common shares
during the 30-day trading period prior to the conversion date. |
| |
|
| |
During the year ended December
31, 2022, the Company recorded $1,918,065 in interest expense including $1,603,000 of additional interest. As at December 31, 2022,
the carrying value of the convertible promissory note was $2,400,000 (December 31, 2021 - $2,084,935). |
| |
|
| |
As
the note is in default, it has become convertible at the holder’s request. The fair value of the loan approximates carrying
value as it is now short term in nature, effectively due on demand. |
| |
|
| (f) |
On
December 1, 2022, the Company received a loan in the principal amount of $1,000,000.
The loan bears interest at 10%
per annum and is due on December 1, 2025. If not repaid by December 31, 2025, the loan bears interest at 18%
per annum. |
| |
|
| (g) |
On February 17, 2022, the
Company entered into a Waiver of Conditions (the “Waiver”) to the Share Purchase Agreement (the “SPA”) dated
December 13, 2021. The Company has received five payments in the amount of $250,000 on February 28, 2022, $250,000 on March 31, 2022,
$90,000 on July 29, 2022, $250,000 on August 29, 2022, $125,000 on September 15, 2022, $125,000 on October 18, 2022, and $285,000
on October 21, 2022, for 1,375 preferred series F shares in total. Under the Waiver, the Company agrees to repay these amounts, on
an ongoing basis, by remitting 20% of all gross sales back to the subscriber until such time that the 500 shares of the Series F
Preferred Stock issued pursuant to this Waiver agreement are redeemed in full. As these preferred F series shares subscribed for
under the Waiver are mandatorily redeemable, the total amounts of $1,375,000 were recorded as liabilities, as per ASC 480-10. Under
the original terms of the SPA, redemption of preferred F series shares requires a 15% premium payment on the face value. As such,
a total Redemption Premium of $75,000 will be paid on the redemption as part of the 20% gross sales remittance, and will be amortized
as the repayments are made. During the year ended December 31, 2022, $3,062 was recognized, and recorded as interest expense, included
as part of the loan. |
| |
|
| |
During the year ended December
31, 2022, the Company made required payments in the amount of $20,411, which was applied against the loan payable. |
|
| X |
- References
+ Details
| Name: |
us-gaap_DebtDisclosureAbstract |
| Namespace Prefix: |
us-gaap_ |
| Data Type: |
xbrli:stringItemType |
| Balance Type: |
na |
| Period Type: |
duration |
|
| X |
- DefinitionTabular disclosure of long-debt instruments or arrangements, including identification, terms, features, collateral requirements and other information necessary to a fair presentation. These are debt arrangements that originally required repayment more than twelve months after issuance or greater than the normal operating cycle of the entity, if longer. Reference 1: http://fasb.org/us-gaap/role/ref/legacyRef
-Publisher FASB
-Name Accounting Standards Codification
-Topic 210
-SubTopic 10
-Section S99
-Paragraph 1
-Subparagraph (SX 210.5-02.22)
-URI https://asc.fasb.org/extlink&oid=120391452&loc=d3e13212-122682
Reference 2: http://www.xbrl.org/2009/role/commonPracticeRef
-Publisher FASB
-Name Accounting Standards Codification
-Topic 235
-SubTopic 10
-Section S99
-Paragraph 3
-Subparagraph (SX 210.12-04(a))
-URI https://asc.fasb.org/extlink&oid=120395691&loc=d3e24072-122690
Reference 3: http://fasb.org/us-gaap/role/ref/legacyRef
-Publisher FASB
-Name Accounting Standards Codification
-Topic 835
-SubTopic 30
-Section 45
-Paragraph 1A
-URI https://asc.fasb.org/extlink&oid=124435984&loc=d3e28541-108399
Reference 4: http://fasb.org/us-gaap/role/ref/legacyRef
-Publisher FASB
-Name Accounting Standards Codification
-Topic 505
-SubTopic 10
-Section 50
-Paragraph 6
-URI https://asc.fasb.org/extlink&oid=126973232&loc=d3e21506-112644
Reference 5: http://www.xbrl.org/2003/role/exampleRef
-Publisher FASB
-Name Accounting Standards Codification
-Topic 470
-SubTopic 20
-Section 55
-Paragraph 69B
-URI https://asc.fasb.org/extlink&oid=123466577&loc=SL123495735-112612
Reference 6: http://fasb.org/us-gaap/role/ref/legacyRef
-Publisher FASB
-Name Accounting Standards Codification
-Topic 835
-SubTopic 30
-Section 45
-Paragraph 2
-URI https://asc.fasb.org/extlink&oid=124435984&loc=d3e28551-108399
Reference 7: http://www.xbrl.org/2003/role/exampleRef
-Publisher FASB
-Name Accounting Standards Codification
-Topic 470
-SubTopic 20
-Section 55
-Paragraph 69E
-URI https://asc.fasb.org/extlink&oid=123466577&loc=SL123495743-112612
Reference 8: http://fasb.org/us-gaap/role/ref/legacyRef
-Publisher FASB
-Name Accounting Standards Codification
-Topic 505
-SubTopic 10
-Section 50
-Paragraph 7
-URI https://asc.fasb.org/extlink&oid=126973232&loc=d3e21521-112644
Reference 9: http://fasb.org/us-gaap/role/ref/legacyRef
-Publisher FASB
-Name Accounting Standards Codification
-Topic 505
-SubTopic 10
-Section 50
-Paragraph 8
-URI https://asc.fasb.org/extlink&oid=126973232&loc=d3e21538-112644
Reference 10: http://fasb.org/us-gaap/role/ref/legacyRef
-Publisher FASB
-Name Accounting Standards Codification
-Topic 942
-SubTopic 470
-Section 50
-Paragraph 3
-URI https://asc.fasb.org/extlink&oid=123599511&loc=d3e64711-112823
Reference 11: http://fasb.org/us-gaap/role/ref/legacyRef
-Publisher FASB
-Name Accounting Standards Codification
-Topic 835
-SubTopic 30
-Section 55
-Paragraph 8
-URI https://asc.fasb.org/extlink&oid=114775985&loc=d3e28878-108400
Reference 12: http://fasb.org/us-gaap/role/ref/legacyRef
-Publisher FASB
-Name Accounting Standards Codification
-Topic 505
-SubTopic 10
-Section 50
-Paragraph 3
-URI https://asc.fasb.org/extlink&oid=126973232&loc=d3e21475-112644
| Name: |
us-gaap_ScheduleOfDebtInstrumentsTextBlock |
| Namespace Prefix: |
us-gaap_ |
| Data Type: |
dtr-types:textBlockItemType |
| Balance Type: |
na |
| Period Type: |
duration |
|
v3.23.2
LEASES (Tables)
|
12 Months Ended |
Dec. 31, 2022 |
|---|
| Leases |
|
| SCHEDULE OF LEASE RECEIVABLES RECOGNIZED |
SCHEDULE OF LEASE RECEIVABLES RECOGNIZED
| Lease receivable | |
December 31, 2022 | | |
December 31, 2021 | |
| Balance, beginning of the period | |
$ | 810,236 | | |
$ | 42,856 | |
| Additions | |
| 143,630 | | |
| 937,850 | |
| Transfer to third party | |
| (867,450 | ) | |
| (120,231 | ) |
| Interest on lease receivables | |
| 20,841 | | |
| 19,452 | |
| Receipt of payments | |
| (81,979 | ) | |
| (60,445 | ) |
| Foreign exchange | |
| (5,733 | ) | |
| (9,246 | ) |
| Balance, end of the period | |
| 19,545 | | |
| 810,236 | |
| Current portion of lease receivables | |
| (3,627 | ) | |
| (87,020 | ) |
| Long term potion of lease receivables | |
$ | 15,918 | | |
$ | 723,216 | |
|
| SCHEDULE OF CONSOLIDATED BALANCE SHEET OF LEASE |
Right-of-use
assets have been included within fixed assets, net and lease liabilities have been included in lease liability on the Company’s
consolidated balance sheet.
SCHEDULE OF CONSOLIDATED BALANCE SHEET OF LEASE
| Right-of-use assets | |
December 31, 2022 | | |
December 31, 2021 | |
| Cost | |
$ | 312,318 | | |
$ | 312,318 | |
| Accumulated depreciation | |
| (282,251 | ) | |
| (170,530 | ) |
| Foreign exchange | |
| (506 | ) | |
| 29 | |
| Total right-of-use assets | |
$ | 29,561 | | |
$ | 141,880 | |
| Lease liability | |
December 31, 2022 | | |
December 31, 2021 | |
| Current portion | |
$ | 35,670 | | |
$ | 121,270 | |
| Long-term portion | |
| 4,982 | | |
| 38,696 | |
| Total lease liability | |
$ | 40,652 | | |
$ | 159,966 | |
|
| SCHEDULE OF FUTURE MINIMUM LEASE PAYMENTS |
Future
minimum lease payments to be paid by the Company as a lessee for leases as of December 31, 2022 for the next three years are as follows:
SCHEDULE OF FUTURE MINIMUM LEASE PAYMENTS
| Lease commitments and lease liability | |
December 31, 2022 | |
| 2023 | |
$ | 37,814 | |
| 2024 | |
| 4,300 | |
| 2025 | |
| 1,070 | |
| Total future minimum lease payments | |
| 43,184 | |
| Discount | |
| (2,532 | ) |
| Total | |
| 40,652 | |
| Current portion of lease liabilities | |
| (35,670 | ) |
| Long-term portion of lease liabilities | |
$ | 4,982 | |
|
| X |
- References
+ Details
| Name: |
DSGT_DisclosureLeasesAbstract |
| Namespace Prefix: |
DSGT_ |
| Data Type: |
xbrli:stringItemType |
| Balance Type: |
na |
| Period Type: |
duration |
|
| X |
- DefinitionSchedule Of Interim Condensed Consolidated Balance Sheet For Lease [Table Text Block]
| Name: |
DSGT_ScheduleOfInterimCondensedConsolidatedBalanceSheetForLeaseTableTextBlock |
| Namespace Prefix: |
DSGT_ |
| Data Type: |
dtr-types:textBlockItemType |
| Balance Type: |
na |
| Period Type: |
duration |
|
| X |
- DefinitionSchedule Of Recognized Lease Receivables [Table Text Block]
| Name: |
DSGT_ScheduleOfRecognizedLeaseReceivablesTableTextBlock |
| Namespace Prefix: |
DSGT_ |
| Data Type: |
dtr-types:textBlockItemType |
| Balance Type: |
na |
| Period Type: |
duration |
|
| X |
- DefinitionTabular disclosure of undiscounted cash flows of lessee's operating lease liability. Includes, but is not limited to, reconciliation of undiscounted cash flows to operating lease liability recognized in statement of financial position. Reference 1: http://www.xbrl.org/2009/role/commonPracticeRef
-Publisher FASB
-Name Accounting Standards Codification
-Topic 842
-SubTopic 20
-Section 50
-Paragraph 6
-URI https://asc.fasb.org/extlink&oid=128292326&loc=SL77918701-209980
| Name: |
us-gaap_LesseeOperatingLeaseLiabilityMaturityTableTextBlock |
| Namespace Prefix: |
us-gaap_ |
| Data Type: |
dtr-types:textBlockItemType |
| Balance Type: |
na |
| Period Type: |
duration |
|
v3.23.2
MEZZANINE EQUITY (Tables)
|
12 Months Ended |
Dec. 31, 2022 |
|---|
| Mezzanine Equity |
|
| SCHEDULE OF REDEEMABLE PREFERRED SHARE ACTIVITIES |
The
following table summarizes the Company’s redeemable preferred share activities for the years ended December 31, 2022, and December
31, 2021.
SCHEDULE
OF REDEEMABLE PREFERRED SHARE ACTIVITIES
| | |
Shares | | |
Par | | |
Additional paid in capital | | |
To be issued | | |
Total | |
| Balance December 31, 2020 | |
| 49,230 | | |
$ | 49 | | |
$ | 1,007,895 | | |
$ | 1,265,799 | | |
$ | 2,273,743 | |
| Issuance | |
| 3,500 | | |
| 4 | | |
| 2,731,989 | | |
| (745,926 | ) | |
| 1,986,067 | |
| Converted for common shares | |
| (1,926 | ) | |
| (2 | ) | |
| (1,538,098 | ) | |
| - | | |
| (1,538,100 | ) |
| Accrued preferred stock dividends | |
| - | | |
| - | | |
| - | | |
| 455,500 | | |
| 455,500 | |
| Balance, December 31, 2021 | |
| 50,804 | | |
$ | 51 | | |
$ | 2,201,786 | | |
$ | 975,373 | | |
$ | 3,177,210 | |
| | |
| | | |
| | | |
| | | |
| | | |
| | |
| Balance December 31, 2021 | |
| 50,804 | | |
$ | 51 | | |
$ | 2,201,786 | | |
$ | 975,373 | | |
$ | 3,177,210 | |
| Balance | |
| 50,804 | | |
$ | 51 | | |
$ | 2,201,786 | | |
$ | 975,373 | | |
$ | 3,177,210 | |
| Issuance | |
| 1,839 | | |
| - | | |
| 714,000 | | |
| (464,000 | ) | |
| 250,000 | |
| Converted for common shares | |
| (620 | ) | |
| - | | |
| (302,556 | ) | |
| (33,808 | )(2) | |
| (336,364 | ) |
| Accrued preferred stock dividends(1) | |
| - | | |
| - | | |
| (838,064 | ) | |
| 382,563 | | |
| (455,501 | ) |
| Balance, December 31, 2022 | |
| 52,023 | | |
$ | 51 | | |
$ | 1,775,166 | | |
$ | 860,128 | | |
$ | 2,635,345 | |
| Balance | |
| 52,023 | | |
$ | 51 | | |
$ | 1,775,166 | | |
$ | 860,128 | | |
$ | 2,635,345 | |
| (1) |
The amount of $838,064
accrued against additional paid in capital includes the $455,500 of accrued dividends on redeemable preferred stock related to the
year ended December 31, 2021, and is the reclass described above in Note 3. |
| |
|
| (2) |
$33,808 was a balance
carried in the redeemable preferred shares to be issued from prior years, but does not relate to any shares that are required to
be issued. It should have been cleared out in fiscal 2019 when the Company completed its reverse stock split. It has been adjusted
in the year ended December 31, 2022. |
|
| X |
- References
+ Details
| Name: |
DSGT_DisclosureMezzanineEquityAbstract |
| Namespace Prefix: |
DSGT_ |
| Data Type: |
xbrli:stringItemType |
| Balance Type: |
na |
| Period Type: |
duration |
|
| X |
- DefinitionTabular disclosure of temporary equity. Temporary equity is a security with redemption features that are outside the control of the issuer, is not classified as an asset or liability in conformity with GAAP, and is not mandatorily redeemable. Includes any type of security that is redeemable at a fixed or determinable price or on a fixed or determinable date or dates, is redeemable at the option of the holder, or has conditions for redemption which are not solely within the control of the issuer. If convertible, the issuer does not control the actions or events necessary to issue the maximum number of shares that could be required to be delivered under the conversion option if the holder exercises the option to convert the stock to another class of equity. If the security is a warrant or a rights issue, the warrant or rights issue is considered to be temporary equity if the issuer cannot demonstrate that it would be able to deliver upon the exercise of the option by the holder in all cases. Includes stock with put option held by ESOP and stock redeemable by holder only in the event of a change in control of the issuer. Reference 1: http://fasb.org/us-gaap/role/ref/legacyRef
-Publisher FASB
-Name Accounting Standards Codification
-Topic 210
-SubTopic 10
-Section S99
-Paragraph 1
-Subparagraph (27)
-URI https://asc.fasb.org/extlink&oid=120391452&loc=d3e13212-122682
Reference 2: http://fasb.org/us-gaap/role/ref/legacyRef
-Publisher FASB
-Name Accounting Standards Codification
-Topic 480
-SubTopic 10
-Section S99
-Paragraph 1
-URI https://asc.fasb.org/extlink&oid=122040564&loc=d3e177068-122764
| Name: |
us-gaap_TemporaryEquityTableTextBlock |
| Namespace Prefix: |
us-gaap_ |
| Data Type: |
dtr-types:textBlockItemType |
| Balance Type: |
na |
| Period Type: |
duration |
|
v3.23.2
COMMON STOCK AND ADDITIONAL PAID IN CAPITAL (Tables)
|
12 Months Ended |
Dec. 31, 2022 |
|---|
| Equity [Abstract] |
|
| SCHEDULE OF WARRANTS ASSUMPTIONS |
The
fair values of the warrants were calculated using the following assumptions for the Black Scholes Option Pricing Model:
SCHEDULE OF WARRANTS ASSUMPTIONS
| |
|
December
31, 2022 |
|
|
December
31, 2021 |
|
| Risk-free interest rate |
|
|
0.18% - 0.82 |
% |
|
|
0.18% - 0.82 |
% |
| Expected life |
|
|
3.29 - 5.11 years |
|
|
|
3.29 - 5.11 years |
|
| Expected dividend rate |
|
|
0 |
% |
|
|
0 |
% |
| Expected volatility |
|
|
285.40 – 300.18 |
% |
|
|
285.40 – 300.18 |
% |
|
| SCHEDULE OF WARRANTS OUTSTANDING |
Continuity
of the Company’s common stock purchase warrants issued and outstanding is as follows:
SCHEDULE OF WARRANTS OUTSTANDING
| | |
Warrants | | |
Weighted average
exercise price | |
| Outstanding as at December 31, 2020 | |
| 12,939,813 | | |
$ | 0.60 | |
| Granted | |
| 3,500,000 | | |
| 0.41 | |
| Outstanding as at December 31, 2021 | |
| 16,439,813 | | |
$ | 0.56 | |
| Expired | |
| 6,813,371 | | |
| 0.78 | |
| Outstanding as at December 31, 2022 | |
| 9,626,442 | | |
$ | 0.40 | |
|
| X |
- DefinitionSchedule of Warrants Assumptions [Table Text Block]
| Name: |
DSGT_ScheduleOfWarrantsAssumptionsTableTextBlock |
| Namespace Prefix: |
DSGT_ |
| Data Type: |
dtr-types:textBlockItemType |
| Balance Type: |
na |
| Period Type: |
duration |
|
| X |
- References
+ Details
| Name: |
us-gaap_EquityAbstract |
| Namespace Prefix: |
us-gaap_ |
| Data Type: |
xbrli:stringItemType |
| Balance Type: |
na |
| Period Type: |
duration |
|
| X |
- DefinitionTabular disclosure of warrants or rights issued. Warrants and rights outstanding are derivative securities that give the holder the right to purchase securities (usually equity) from the issuer at a specific price within a certain time frame. Warrants are often included in a new debt issue to entice investors by a higher return potential. The main difference between warrants and call options is that warrants are issued and guaranteed by the company, whereas options are exchange instruments and are not issued by the company. Also, the lifetime of a warrant is often measured in years, while the lifetime of a typical option is measured in months. Disclose the title of issue of securities called for by warrants and rights outstanding, the aggregate amount of securities called for by warrants and rights outstanding, the date from which the warrants or rights are exercisable, and the price at which the warrant or right is exercisable. Reference 1: http://fasb.org/us-gaap/role/ref/legacyRef
-Publisher FASB
-Name Accounting Standards Codification
-Topic 718
-SubTopic 10
-Section 50
-Paragraph 1
-Subparagraph (a)
-URI https://asc.fasb.org/extlink&oid=128089324&loc=d3e5047-113901
Reference 2: http://fasb.org/us-gaap/role/ref/legacyRef
-Publisher FASB
-Name Accounting Standards Codification
-Topic 505
-SubTopic 50
-Section S99
-Paragraph 1
-URI https://asc.fasb.org/extlink&oid=6784392&loc=d3e188667-122775
| Name: |
us-gaap_ScheduleOfStockholdersEquityNoteWarrantsOrRightsTextBlock |
| Namespace Prefix: |
us-gaap_ |
| Data Type: |
dtr-types:textBlockItemType |
| Balance Type: |
na |
| Period Type: |
duration |
|
v3.23.2
SEGMENT INFORMATION (Tables)
|
12 Months Ended |
Dec. 31, 2022 |
|---|
| Segment Reporting [Abstract] |
|
| SCHEDULE OF SEGMENT REPORTING INFORMATION |
SCHEDULE OF SEGMENT REPORTING INFORMATION
| | |
Administration | | |
Electric Vehicles | | |
Golf Carts | | |
GPS Units | | |
Total | |
| Revenue | |
$ | - | | |
$ | 221,567 | | |
$ | 1,394,964 | | |
$ | 2,217,322 | | |
$ | 3,833,853 | |
| Cost of revenue | |
| - | | |
| 191,367 | | |
| 827,299 | | |
| 1,064,302 | | |
| 2,082,968 | |
| Gross profit | |
| - | | |
| 30,200 | | |
| 567,665 | | |
| 1,153,020 | | |
| 1,750,885 | |
| | |
| | | |
| | | |
| | | |
| | | |
| | |
| Operating expenses | |
| | | |
| | | |
| | | |
| | | |
| | |
| Compensation expense | |
| 2,151,306 | | |
| 268,324 | | |
| 123,789 | | |
| 991,397 | | |
| 3,534,816 | |
| General and administration expense | |
| 1,765,303 | | |
| 362,924 | | |
| 891,777 | | |
| 409,071 | | |
| 3,429,075 | |
| Research and development | |
| - | | |
| 17,500 | | |
| 34,844 | | |
| - | | |
| 52,344 | |
| Bad debt expense (recovery) | |
| (29,389 | ) | |
| - | | |
| - | | |
| - | | |
| (29,389 | ) |
| Depreciation and amortization expense | |
| 13,670 | | |
| - | | |
| - | | |
| - | | |
| 13,670 | |
| Total operating expense | |
| 3,900,891 | | |
| 648,748 | | |
| 1,050,410 | | |
| 1,400,468 | | |
| 7,000,516 | |
| Loss from operations | |
| (3,900,891 | ) | |
| (618,548 | ) | |
| (482,745 | ) | |
| (247,448 | ) | |
| (5,249,631 | ) |
| | |
| | | |
| | | |
| | | |
| | | |
| | |
| Other income (expense) | |
| | | |
| | | |
| | | |
| | | |
| | |
| Foreign currency exchange | |
| (28,241 | ) | |
| - | | |
| - | | |
| - | | |
| (28,241 | ) |
| Loss on sale of lease receivable | |
| - | | |
| - | | |
| - | | |
| (3,923 | ) | |
| (3,923 | ) |
| (Loss) Gain on extinguishment of debt | |
| 40,355 | | |
| - | | |
| - | | |
| - | | |
| 40,355 | |
| Gain on disposal | |
| - | | |
| 3,960 | | |
| - | | |
| - | | |
| 3,960 | |
| Interest on preferred shares | |
| (3,062 | ) | |
| - | | |
| - | | |
| - | | |
| (3,062 | ) |
| Finance costs | |
| (2,055,801 | ) | |
| - | | |
| - | | |
| (251,048 | ) | |
| (2,306,849 | ) |
| Total other income (expense) | |
| (2,046,749 | ) | |
| 3,960 | | |
| - | | |
| (254,971 | ) | |
| (2,297,760 | ) |
| Net loss | |
$ | (5,947,640 | ) | |
$ | (614,588 | ) | |
$ | (482,745 | ) | |
$ | (502,419 | ) | |
$ | (7,547,391 | ) |
| | |
| | | |
| | | |
| | | |
| | | |
| | |
| Total Assets | |
$ | 164,567 | | |
$ | 351,561 | | |
$ | 1,007,916 | | |
$ | 720,252 | | |
$ | 2,244,296 | |
|
| SCHEDULE OF ASSETS BY GEOGRAPHIC AREA |
The
following table shows a breakdown of the geographic location where the Company’s assets as at December 31, 2022, are located.
SCHEDULE
OF ASSETS BY GEOGRAPHIC AREA
| | |
Canada | | |
USA | | |
UK | | |
Mexico | | |
Australia | | |
China | | |
Total | |
| Total
Assets | |
$ | 450,923 | | |
$ | 1,637,294 | | |
$ | 4,699 | | |
$ | 40,000 | | |
$ | 98,225 | | |
$ | 13,155 | | |
$ | 2,244,296 | |
|
| X |
- DefinitionTabular disclosure of long-lived assets, excluding financial instruments, long-term customer relationships of a financial institution, mortgage rights, deferred policy acquisition costs, and deferred tax assets, by geographic areas located in the entity's country of domicile and foreign countries in which the entity holds assets. Reference 1: http://fasb.org/us-gaap/role/ref/legacyRef
-Publisher FASB
-Name Accounting Standards Codification
-Topic 280
-SubTopic 10
-Section 50
-Paragraph 41
-Subparagraph b
-URI https://asc.fasb.org/extlink&oid=126901519&loc=d3e9038-108599
| Name: |
us-gaap_LongLivedAssetsByGeographicAreasTableTextBlock |
| Namespace Prefix: |
us-gaap_ |
| Data Type: |
dtr-types:textBlockItemType |
| Balance Type: |
na |
| Period Type: |
duration |
|
| X |
- DefinitionTabular disclosure of the profit or loss and total assets for each reportable segment. An entity discloses certain information on each reportable segment if the amounts (a) are included in the measure of segment profit or loss reviewed by the chief operating decision maker or (b) are otherwise regularly provided to the chief operating decision maker, even if not included in that measure of segment profit or loss. Reference 1: http://fasb.org/us-gaap/role/ref/legacyRef
-Publisher FASB
-Name Accounting Standards Codification
-Topic 280
-SubTopic 10
-Section 50
-Paragraph 22
-URI https://asc.fasb.org/extlink&oid=126901519&loc=d3e8736-108599
Reference 2: http://fasb.org/us-gaap/role/ref/legacyRef
-Publisher FASB
-Name Accounting Standards Codification
-Topic 280
-SubTopic 10
-Section 50
-Paragraph 25
-URI https://asc.fasb.org/extlink&oid=126901519&loc=d3e8813-108599
Reference 3: http://fasb.org/us-gaap/role/ref/legacyRef
-Publisher FASB
-Name Accounting Standards Codification
-Topic 350
-SubTopic 20
-Section 50
-Paragraph 1
-URI https://asc.fasb.org/extlink&oid=121556970&loc=d3e13816-109267
Reference 4: http://fasb.org/us-gaap/role/ref/legacyRef
-Publisher FASB
-Name Accounting Standards Codification
-Topic 280
-SubTopic 10
-Section 50
-Paragraph 30
-URI https://asc.fasb.org/extlink&oid=126901519&loc=d3e8906-108599
| Name: |
us-gaap_ScheduleOfSegmentReportingInformationBySegmentTextBlock |
| Namespace Prefix: |
us-gaap_ |
| Data Type: |
dtr-types:textBlockItemType |
| Balance Type: |
na |
| Period Type: |
duration |
|
| X |
- References
+ Details
| Name: |
us-gaap_SegmentReportingAbstract |
| Namespace Prefix: |
us-gaap_ |
| Data Type: |
xbrli:stringItemType |
| Balance Type: |
na |
| Period Type: |
duration |
|
v3.23.2
INCOME TAX (Tables)
|
12 Months Ended |
Dec. 31, 2022 |
|---|
| Commitments and Contingencies Disclosure [Abstract] |
|
| SCHEDULE OF RECONCILIATION OF INCOME TAX EXPENSE |
The
Company is subject to income taxes in Canada and the US. The statutory income tax rates were 27% in Canada and 27.5% in the US. A reconciliation
of the expected income tax recovery is as follows:
SCHEDULE
OF RECONCILIATION OF INCOME TAX EXPENSE
| | |
December 31, 2022 | | |
December 31, 2021 | |
| | |
Year Ended | |
| | |
December 31, 2022 | | |
December 31, 2021 | |
| | |
$ | | |
$ | |
| Income tax rate | |
| 27.00 | % | |
| 27.00 | % |
| Income tax recovery calculated using statutory rate | |
| (2,038,000 | ) | |
| (1,733,000 | ) |
| Increase (decrease) in income taxes resulting from: | |
| | | |
| | |
| Non-deductible (taxable) items | |
| 88,000 | | |
| 54,000 | |
| Effect of tax rate change | |
| (17,000 | ) | |
| (2,000 | ) |
| Effect of different tax jurisdiction rates | |
| 24,000 | | |
| 68,000 | |
| Change in tax assets not recognized | |
| 1,926,000 | | |
| 1,613,000 | |
| Income tax expense (recovery) | |
| - | | |
| - | |
|
| SCHEDULE OF DEFERRED TAX ASSETS AND LIABILITIES |
The
nature and tax effect of the temporary difference giving rise to the deferred tax assets and liabilities at December 31, 2022 and 2021,
are summarized as follows:
SCHEDULE OF DEFERRED TAX ASSETS AND LIABILITIES
| | |
December 31, 2022 | | |
December 31, 2021 | |
| | |
Year Ended | |
| | |
December 31, 2022 | | |
December 31, 2021 | |
| | |
$ | | |
$ | |
| Deferred tax assets | |
| | | |
| | |
| Capital assets | |
| 20,000 | | |
| 16,000 | |
| ROU assets | |
| 31,000 | | |
| 5,000 | |
| Non-capital losses | |
| 17,317,000 | | |
| 15,426,000 | |
| Capital leases | |
| 9,000 | | |
| 24,000 | |
| Accounts receivable | |
| 29,000 | | |
| 9,000 | |
| Total deferred tax assets | |
| 17,406,000 | | |
| 15,480,000 | |
| Unrecognized benefit from income tax losses | |
| (17,406,000 | ) | |
| (15,480,000 | ) |
| Net deferred tax assets | |
| - | | |
| - | |
|
| X |
- References
+ Details
| Name: |
us-gaap_CommitmentsAndContingenciesDisclosureAbstract |
| Namespace Prefix: |
us-gaap_ |
| Data Type: |
xbrli:stringItemType |
| Balance Type: |
na |
| Period Type: |
duration |
|
| X |
- DefinitionTabular disclosure of the components of net deferred tax asset or liability recognized in an entity's statement of financial position, including the following: the total of all deferred tax liabilities, the total of all deferred tax assets, the total valuation allowance recognized for deferred tax assets. Reference 1: http://fasb.org/us-gaap/role/ref/legacyRef
-Publisher FASB
-Name Accounting Standards Codification
-Topic 740
-SubTopic 10
-Section 50
-Paragraph 2
-URI https://asc.fasb.org/extlink&oid=121826272&loc=d3e32537-109319
| Name: |
us-gaap_ScheduleOfDeferredTaxAssetsAndLiabilitiesTableTextBlock |
| Namespace Prefix: |
us-gaap_ |
| Data Type: |
dtr-types:textBlockItemType |
| Balance Type: |
na |
| Period Type: |
duration |
|
| X |
- DefinitionTabular disclosure of the reconciliation using percentage or dollar amounts of the reported amount of income tax expense attributable to continuing operations for the year to the amount of income tax expense that would result from applying domestic federal statutory tax rates to pretax income from continuing operations. Reference 1: http://fasb.org/us-gaap/role/ref/legacyRef
-Publisher FASB
-Name Accounting Standards Codification
-Topic 740
-SubTopic 10
-Section 50
-Paragraph 12
-URI https://asc.fasb.org/extlink&oid=121826272&loc=d3e32687-109319
| Name: |
us-gaap_ScheduleOfEffectiveIncomeTaxRateReconciliationTableTextBlock |
| Namespace Prefix: |
us-gaap_ |
| Data Type: |
dtr-types:textBlockItemType |
| Balance Type: |
na |
| Period Type: |
duration |
|
v3.23.2
SUPPLEMENTAL CASH FLOW INFORMATION (Tables)
|
12 Months Ended |
Dec. 31, 2022 |
|---|
| Supplemental Cash Flow Elements [Abstract] |
|
| SCHEDULE OF SUPPLEMENTAL CASH FLOW INFORMATION |
SCHEDULE OF SUPPLEMENTAL CASH FLOW INFORMATION
| | |
December 31, 2022 | | |
December 31, 2021 | |
| | |
Year Ended | |
| | |
December 31, 2022 | | |
December 31, 2021 | |
| | |
| | |
| |
| Cash paid during the period for: | |
| | | |
| | |
| Income tax payments | |
$ | - | | |
$ | - | |
| Interest payments | |
| 11,222 | | |
| 57,111 | |
| | |
| | | |
| | |
| Non-cash investing and financing transactions: | |
| | | |
| | |
| Shares issued for debt settlement | |
$ | - | | |
$ | 191,235 | |
| Shares issued on conversion of preferred shares | |
$ | 302,557 | | |
$ | 2,088,100 | |
| Dividends payable with preferred shares to be issued | |
| 382,563 | | |
| 455,500 | |
| Initial recognition of lease assets | |
$ | 143,630 | | |
$ | 9,904 | |
| Initial recognition of lease liabilities | |
$ | 143,630 | | |
$ | 9,904 | |
|
| X |
- DefinitionTabular disclosure of supplemental cash flow information for the periods presented.
| Name: |
us-gaap_ScheduleOfCashFlowSupplementalDisclosuresTableTextBlock |
| Namespace Prefix: |
us-gaap_ |
| Data Type: |
dtr-types:textBlockItemType |
| Balance Type: |
na |
| Period Type: |
duration |
|
| X |
- References
+ Details
| Name: |
us-gaap_SupplementalCashFlowElementsAbstract |
| Namespace Prefix: |
us-gaap_ |
| Data Type: |
xbrli:stringItemType |
| Balance Type: |
na |
| Period Type: |
duration |
|
v3.23.2
| X |
- DefinitionNumber of shares of equity interests issued or issuable to acquire entity. Reference 1: http://fasb.org/us-gaap/role/ref/legacyRef
-Publisher FASB
-Name Accounting Standards Codification
-Topic 805
-SubTopic 30
-Section 50
-Paragraph 1
-Subparagraph (b)(4)
-URI https://asc.fasb.org/extlink&oid=126975305&loc=d3e6927-128479
| Name: |
us-gaap_BusinessAcquisitionEquityInterestsIssuedOrIssuableNumberOfSharesIssued |
| Namespace Prefix: |
us-gaap_ |
| Data Type: |
xbrli:sharesItemType |
| Balance Type: |
na |
| Period Type: |
duration |
|
| X |
- DefinitionPrice of a single share of a number of saleable stocks paid or offered to be paid in a business combination.
| Name: |
us-gaap_BusinessAcquisitionSharePrice |
| Namespace Prefix: |
us-gaap_ |
| Data Type: |
dtr-types:perShareItemType |
| Balance Type: |
na |
| Period Type: |
instant |
|
| X |
- DefinitionLine items represent financial concepts included in a table. These concepts are used to disclose reportable information associated with domain members defined in one or many axes to the table.
| Name: |
us-gaap_RestructuringCostAndReserveLineItems |
| Namespace Prefix: |
us-gaap_ |
| Data Type: |
xbrli:stringItemType |
| Balance Type: |
na |
| Period Type: |
duration |
|
| X |
- Details
| Name: |
us-gaap_BusinessAcquisitionAxis=DSGT_ImperiumCanadaMember |
| Namespace Prefix: |
|
| Data Type: |
na |
| Balance Type: |
|
| Period Type: |
|
|
| X |
- Details
| Name: |
us-gaap_StatementClassOfStockAxis=DSGT_ClassAVotingParticipatingCommonSharesMember |
| Namespace Prefix: |
|
| Data Type: |
na |
| Balance Type: |
|
| Period Type: |
|
|
| X |
- Details
| Name: |
us-gaap_BusinessAcquisitionAxis=DSGT_ACGolfCartsIncMember |
| Namespace Prefix: |
|
| Data Type: |
na |
| Balance Type: |
|
| Period Type: |
|
|
| X |
- Details
| Name: |
us-gaap_StatementClassOfStockAxis=us-gaap_CommonStockMember |
| Namespace Prefix: |
|
| Data Type: |
na |
| Balance Type: |
|
| Period Type: |
|
|
v3.23.2
GOING CONCERN (Details Narrative) - USD ($)
|
12 Months Ended |
Dec. 31, 2022 |
Dec. 31, 2021 |
| Organization, Consolidation and Presentation of Financial Statements [Abstract] |
|
|
| Working capital deficit |
$ 6,846,711
|
|
| Accumulated deficit |
65,242,086
|
$ 57,694,695
|
| Net loss |
7,547,391
|
6,384,655
|
| Net cash provided by (used in) operating activities |
$ 3,622,082
|
$ 5,613,568
|
| X |
- Definition
+ References
+ Details
| Name: |
DSGT_WorkingCapitalDeficit |
| Namespace Prefix: |
DSGT_ |
| Data Type: |
xbrli:monetaryItemType |
| Balance Type: |
credit |
| Period Type: |
instant |
|
| X |
- DefinitionAmount of cash inflow (outflow) from operating activities, including discontinued operations. Operating activity cash flows include transactions, adjustments, and changes in value not defined as investing or financing activities. Reference 1: http://fasb.org/us-gaap/role/ref/legacyRef
-Publisher FASB
-Name Accounting Standards Codification
-Topic 230
-SubTopic 10
-Section 45
-Paragraph 25
-URI https://asc.fasb.org/extlink&oid=126954810&loc=d3e3536-108585
Reference 2: http://fasb.org/us-gaap/role/ref/legacyRef
-Publisher FASB
-Name Accounting Standards Codification
-Topic 230
-SubTopic 10
-Section 45
-Paragraph 24
-URI https://asc.fasb.org/extlink&oid=126954810&loc=d3e3521-108585
Reference 3: http://fasb.org/us-gaap/role/ref/legacyRef
-Publisher FASB
-Name Accounting Standards Codification
-Topic 230
-SubTopic 10
-Section 45
-Paragraph 28
-URI https://asc.fasb.org/extlink&oid=126954810&loc=d3e3602-108585
| Name: |
us-gaap_NetCashProvidedByUsedInOperatingActivities |
| Namespace Prefix: |
us-gaap_ |
| Data Type: |
xbrli:monetaryItemType |
| Balance Type: |
na |
| Period Type: |
duration |
|
| X |
- DefinitionThe portion of profit or loss for the period, net of income taxes, which is attributable to the parent. Reference 1: http://fasb.org/us-gaap/role/ref/legacyRef
-Publisher FASB
-Name Accounting Standards Codification
-Topic 942
-SubTopic 220
-Section S99
-Paragraph 1
-Subparagraph (SX 210.9-04(22))
-URI https://asc.fasb.org/extlink&oid=120399700&loc=SL114874048-224260
Reference 2: http://www.xbrl.org/2003/role/disclosureRef
-Publisher FASB
-Name Accounting Standards Codification
-Topic 280
-SubTopic 10
-Section 50
-Paragraph 32
-Subparagraph (f)
-URI https://asc.fasb.org/extlink&oid=126901519&loc=d3e8933-108599
Reference 3: http://www.xbrl.org/2003/role/disclosureRef
-Publisher FASB
-Name Accounting Standards Codification
-Topic 250
-SubTopic 10
-Section 50
-Paragraph 4
-URI https://asc.fasb.org/extlink&oid=124431687&loc=d3e22595-107794
Reference 4: http://fasb.org/us-gaap/role/ref/legacyRef
-Publisher FASB
-Name Accounting Standards Codification
-Topic 944
-SubTopic 220
-Section S99
-Paragraph 1
-Subparagraph (SX 210.7-04(18))
-URI https://asc.fasb.org/extlink&oid=120400993&loc=SL114874131-224263
Reference 5: http://www.xbrl.org/2003/role/disclosureRef
-Publisher FASB
-Name Accounting Standards Codification
-Topic 815
-SubTopic 40
-Section 65
-Paragraph 1
-Subparagraph (f)
-URI https://asc.fasb.org/extlink&oid=126732423&loc=SL123482106-238011
Reference 6: http://www.xbrl.org/2003/role/disclosureRef
-Publisher FASB
-Name Accounting Standards Codification
-Topic 220
-SubTopic 10
-Section 50
-Paragraph 6
-URI https://asc.fasb.org/extlink&oid=124431353&loc=SL124452729-227067
Reference 7: http://www.xbrl.org/2003/role/disclosureRef
-Publisher FASB
-Name Accounting Standards Codification
-Topic 470
-SubTopic 10
-Section S99
-Paragraph 1B
-Subparagraph (SX 210.13-02(a)(5))
-URI https://asc.fasb.org/extlink&oid=126975872&loc=SL124442552-122756
Reference 8: http://fasb.org/us-gaap/role/ref/legacyRef
-Publisher FASB
-Name Accounting Standards Codification
-Topic 220
-SubTopic 10
-Section S99
-Paragraph 2
-Subparagraph (SX 210.5-03(20))
-URI https://asc.fasb.org/extlink&oid=126953954&loc=SL114868664-224227
Reference 9: http://fasb.org/us-gaap/role/ref/legacyRef
-Publisher FASB
-Name Accounting Standards Codification
-Topic 230
-SubTopic 10
-Section 45
-Paragraph 28
-URI https://asc.fasb.org/extlink&oid=126954810&loc=d3e3602-108585
Reference 10: http://www.xbrl.org/2003/role/disclosureRef
-Publisher FASB
-Name Accounting Standards Codification
-Topic 250
-SubTopic 10
-Section 50
-Paragraph 1
-Subparagraph (b)(2)
-URI https://asc.fasb.org/extlink&oid=124431687&loc=d3e22499-107794
Reference 11: http://www.xbrl.org/2003/role/disclosureRef
-Publisher FASB
-Name Accounting Standards Codification
-Topic 470
-SubTopic 10
-Section S99
-Paragraph 1A
-Subparagraph (SX 210.13-01(a)(4)(iv))
-URI https://asc.fasb.org/extlink&oid=126975872&loc=SL124442526-122756
Reference 12: http://www.xbrl.org/2003/role/disclosureRef
-Publisher FASB
-Name Accounting Standards Codification
-Topic 470
-SubTopic 10
-Section S99
-Paragraph 1A
-Subparagraph (SX 210.13-01(a)(4)(iii)(A))
-URI https://asc.fasb.org/extlink&oid=126975872&loc=SL124442526-122756
Reference 13: http://www.xbrl.org/2003/role/disclosureRef
-Publisher FASB
-Name Accounting Standards Codification
-Topic 470
-SubTopic 10
-Section S99
-Paragraph 1B
-Subparagraph (SX 210.13-02(a)(4)(i))
-URI https://asc.fasb.org/extlink&oid=126975872&loc=SL124442552-122756
Reference 14: http://www.xbrl.org/2003/role/disclosureRef
-Publisher FASB
-Name Accounting Standards Codification
-Topic 470
-SubTopic 10
-Section S99
-Paragraph 1A
-Subparagraph (SX 210.13-01(a)(4)(i))
-URI https://asc.fasb.org/extlink&oid=126975872&loc=SL124442526-122756
Reference 15: http://www.xbrl.org/2003/role/disclosureRef
-Publisher FASB
-Name Accounting Standards Codification
-Topic 250
-SubTopic 10
-Section 50
-Paragraph 9
-URI https://asc.fasb.org/extlink&oid=124431687&loc=d3e22663-107794
Reference 16: http://www.xbrl.org/2003/role/disclosureRef
-Publisher FASB
-Name Accounting Standards Codification
-Topic 470
-SubTopic 10
-Section S99
-Paragraph 1B
-Subparagraph (SX 210.13-02(a)(4)(iv))
-URI https://asc.fasb.org/extlink&oid=126975872&loc=SL124442552-122756
Reference 17: http://www.xbrl.org/2009/role/commonPracticeRef
-Publisher FASB
-Name Accounting Standards Codification
-Topic 470
-SubTopic 10
-Section S99
-Paragraph 1A
-Subparagraph (SX 210.13-01(a)(4)(ii))
-URI https://asc.fasb.org/extlink&oid=126975872&loc=SL124442526-122756
Reference 18: http://www.xbrl.org/2003/role/disclosureRef
-Publisher FASB
-Name Accounting Standards Codification
-Topic 825
-SubTopic 10
-Section 50
-Paragraph 28
-Subparagraph (f)
-URI https://asc.fasb.org/extlink&oid=123596393&loc=d3e14064-108612
Reference 19: http://www.xbrl.org/2003/role/disclosureRef
-Publisher FASB
-Name Accounting Standards Codification
-Topic 250
-SubTopic 10
-Section 50
-Paragraph 3
-URI https://asc.fasb.org/extlink&oid=124431687&loc=d3e22583-107794
Reference 20: http://www.xbrl.org/2003/role/disclosureRef
-Publisher FASB
-Name Accounting Standards Codification
-Topic 235
-SubTopic 10
-Section S99
-Paragraph 1
-Subparagraph (SX 210.4-08(g)(1)(ii))
-URI https://asc.fasb.org/extlink&oid=120395691&loc=d3e23780-122690
Reference 21: http://www.xbrl.org/2003/role/disclosureRef
-Publisher FASB
-Name Accounting Standards Codification
-Topic 260
-SubTopic 10
-Section 45
-Paragraph 60B
-Subparagraph (a)
-URI https://asc.fasb.org/extlink&oid=126958026&loc=SL5780133-109256
Reference 22: http://www.xbrl.org/2003/role/disclosureRef
-Publisher FASB
-Name Accounting Standards Codification
-Topic 323
-SubTopic 10
-Section 50
-Paragraph 3
-Subparagraph (c)
-URI https://asc.fasb.org/extlink&oid=114001798&loc=d3e33918-111571
Reference 23: http://www.xbrl.org/2003/role/disclosureRef
-Publisher FASB
-Name Accounting Standards Codification
-Topic 250
-SubTopic 10
-Section 50
-Paragraph 8
-URI https://asc.fasb.org/extlink&oid=124431687&loc=d3e22658-107794
Reference 24: http://www.xbrl.org/2003/role/disclosureRef
-Publisher FASB
-Name Accounting Standards Codification
-Topic 220
-SubTopic 10
-Section 45
-Paragraph 1A
-Subparagraph (a)
-URI https://asc.fasb.org/extlink&oid=126968391&loc=SL7669619-108580
Reference 25: http://www.xbrl.org/2003/role/exampleRef
-Publisher FASB
-Name Accounting Standards Codification
-Topic 280
-SubTopic 10
-Section 50
-Paragraph 31
-URI https://asc.fasb.org/extlink&oid=126901519&loc=d3e8924-108599
Reference 26: http://www.xbrl.org/2003/role/disclosureRef
-Publisher FASB
-Name Accounting Standards Codification
-Topic 250
-SubTopic 10
-Section 50
-Paragraph 11
-Subparagraph (b)
-URI https://asc.fasb.org/extlink&oid=124431687&loc=d3e22694-107794
Reference 27: http://www.xbrl.org/2003/role/disclosureRef
-Publisher FASB
-Name Accounting Standards Codification
-Topic 250
-SubTopic 10
-Section 50
-Paragraph 11
-Subparagraph (a)
-URI https://asc.fasb.org/extlink&oid=124431687&loc=d3e22694-107794
Reference 28: http://www.xbrl.org/2003/role/disclosureRef
-Publisher FASB
-Name Accounting Standards Codification
-Topic 205
-SubTopic 20
-Section 50
-Paragraph 7
-URI https://asc.fasb.org/extlink&oid=109222650&loc=SL51721683-107760
Reference 29: http://www.xbrl.org/2003/role/disclosureRef
-Publisher FASB
-Name Accounting Standards Codification
-Topic 220
-SubTopic 10
-Section 45
-Paragraph 1B
-Subparagraph (a)
-URI https://asc.fasb.org/extlink&oid=126968391&loc=SL7669625-108580
Reference 30: http://www.xbrl.org/2003/role/disclosureRef
-Publisher FASB
-Name Accounting Standards Codification
-Topic 280
-SubTopic 10
-Section 50
-Paragraph 22
-URI https://asc.fasb.org/extlink&oid=126901519&loc=d3e8736-108599
Reference 31: http://www.xbrl.org/2003/role/disclosureRef
-Publisher FASB
-Name Accounting Standards Codification
-Topic 470
-SubTopic 10
-Section S99
-Paragraph 1A
-Subparagraph (SX 210.13-01(a)(5))
-URI https://asc.fasb.org/extlink&oid=126975872&loc=SL124442526-122756
Reference 32: http://www.xbrl.org/2003/role/disclosureRef
-Publisher FASB
-Name Accounting Standards Codification
-Topic 470
-SubTopic 10
-Section S99
-Paragraph 1B
-Subparagraph (SX 210.13-02(a)(4)(iii)(B))
-URI https://asc.fasb.org/extlink&oid=126975872&loc=SL124442552-122756
Reference 33: http://www.xbrl.org/2003/role/disclosureRef
-Publisher FASB
-Name Accounting Standards Codification
-Topic 470
-SubTopic 10
-Section S99
-Paragraph 1B
-Subparagraph (SX 210.13-02(a)(4)(iii)(A))
-URI https://asc.fasb.org/extlink&oid=126975872&loc=SL124442552-122756
Reference 34: http://www.xbrl.org/2003/role/disclosureRef
-Publisher FASB
-Name Accounting Standards Codification
-Topic 280
-SubTopic 10
-Section 50
-Paragraph 30
-Subparagraph (b)
-URI https://asc.fasb.org/extlink&oid=126901519&loc=d3e8906-108599
Reference 35: http://www.xbrl.org/2003/role/disclosureRef
-Publisher FASB
-Name Accounting Standards Codification
-Topic 280
-SubTopic 10
-Section 50
-Paragraph 32
-Subparagraph (c)
-URI https://asc.fasb.org/extlink&oid=126901519&loc=d3e8933-108599
| Name: |
us-gaap_NetIncomeLoss |
| Namespace Prefix: |
us-gaap_ |
| Data Type: |
xbrli:monetaryItemType |
| Balance Type: |
credit |
| Period Type: |
duration |
|
| X |
- References
+ Details
| Name: |
us-gaap_OrganizationConsolidationAndPresentationOfFinancialStatementsAbstract |
| Namespace Prefix: |
us-gaap_ |
| Data Type: |
xbrli:stringItemType |
| Balance Type: |
na |
| Period Type: |
duration |
|
| X |
- DefinitionThe cumulative amount of the reporting entity's undistributed earnings or deficit. Reference 1: http://fasb.org/us-gaap/role/ref/legacyRef
-Publisher FASB
-Name Accounting Standards Codification
-Topic 210
-SubTopic 10
-Section S99
-Paragraph 1
-Subparagraph (SX 210.5-02(30)(a)(3))
-URI https://asc.fasb.org/extlink&oid=120391452&loc=d3e13212-122682
Reference 2: http://www.xbrl.org/2003/role/exampleRef
-Publisher FASB
-Name Accounting Standards Codification
-Topic 852
-SubTopic 10
-Section 55
-Paragraph 10
-URI https://asc.fasb.org/extlink&oid=84165509&loc=d3e56426-112766
Reference 3: http://fasb.org/us-gaap/role/ref/legacyRef
-Publisher FASB
-Name Accounting Standards Codification
-Topic 944
-SubTopic 210
-Section S99
-Paragraph 1
-Subparagraph (SX 210.7-03(a)(23)(a)(4))
-URI https://asc.fasb.org/extlink&oid=126734703&loc=d3e572229-122910
Reference 4: http://www.xbrl.org/2003/role/disclosureRef
-Publisher FASB
-Name Accounting Standards Codification
-Topic 944
-SubTopic 40
-Section 65
-Paragraph 2
-Subparagraph (h)(2)
-URI https://asc.fasb.org/extlink&oid=124501264&loc=SL117420844-207641
Reference 5: http://fasb.org/us-gaap/role/ref/legacyRef
-Publisher FASB
-Name Accounting Standards Codification
-Topic 505
-SubTopic 10
-Section S99
-Paragraph 1
-Subparagraph (SX 210.3-04)
-URI https://asc.fasb.org/extlink&oid=120397183&loc=d3e187085-122770
Reference 6: http://www.xbrl.org/2003/role/disclosureRef
-Publisher FASB
-Name Accounting Standards Codification
-Topic 944
-SubTopic 40
-Section 65
-Paragraph 2
-Subparagraph (g)(2)(i)
-URI https://asc.fasb.org/extlink&oid=124501264&loc=SL117420844-207641
| Name: |
us-gaap_RetainedEarningsAccumulatedDeficit |
| Namespace Prefix: |
us-gaap_ |
| Data Type: |
xbrli:monetaryItemType |
| Balance Type: |
credit |
| Period Type: |
instant |
|
v3.23.2
SCHEDULE OF ESTIMATED USEFUL LIVES OF EQUIPMENT (Details)
|
12 Months Ended |
Dec. 31, 2022 |
|---|
| Furniture and Equipment [Member] |
|
| Property, Plant and Equipment [Line Items] |
|
| Property plant and equipment estimated useful lives, description |
5-years
|
| Vehicles [Member] |
|
| Property, Plant and Equipment [Line Items] |
|
| Property plant and equipment estimated useful lives, description |
5-years
|
| Computer Equipment [Member] |
|
| Property, Plant and Equipment [Line Items] |
|
| Property plant and equipment estimated useful lives, description |
3-years
|
| Machinery [Member] |
|
| Property, Plant and Equipment [Line Items] |
|
| Property plant and equipment estimated useful lives, description |
5-years
|
| Equipment on Lease [Member] |
|
| Property, Plant and Equipment [Line Items] |
|
| Property plant and equipment estimated useful lives, description |
5-years
|
| X |
- DefinitionDescribes the periods of time over which an entity anticipates to receive utility from its property, plant and equipment (that is, the periods of time over which an entity allocates the initial cost of its property, plant and equipment). Reference 1: http://fasb.org/us-gaap/role/ref/legacyRef
-Publisher FASB
-Name Accounting Standards Codification
-Topic 360
-SubTopic 10
-Section 35
-Paragraph 4
-URI https://asc.fasb.org/extlink&oid=126905813&loc=d3e1205-110223
| Name: |
us-gaap_PropertyPlantAndEquipmentEstimatedUsefulLives |
| Namespace Prefix: |
us-gaap_ |
| Data Type: |
xbrli:stringItemType |
| Balance Type: |
na |
| Period Type: |
duration |
|
| X |
- DefinitionLine items represent financial concepts included in a table. These concepts are used to disclose reportable information associated with domain members defined in one or many axes to the table.
| Name: |
us-gaap_PropertyPlantAndEquipmentLineItems |
| Namespace Prefix: |
us-gaap_ |
| Data Type: |
xbrli:stringItemType |
| Balance Type: |
na |
| Period Type: |
duration |
|
| X |
- Details
| Name: |
us-gaap_PropertyPlantAndEquipmentByTypeAxis=DSGT_FurnitureAndEquipmentMember |
| Namespace Prefix: |
|
| Data Type: |
na |
| Balance Type: |
|
| Period Type: |
|
|
| X |
- Details
| Name: |
us-gaap_PropertyPlantAndEquipmentByTypeAxis=us-gaap_VehiclesMember |
| Namespace Prefix: |
|
| Data Type: |
na |
| Balance Type: |
|
| Period Type: |
|
|
| X |
- Details
| Name: |
us-gaap_PropertyPlantAndEquipmentByTypeAxis=us-gaap_ComputerEquipmentMember |
| Namespace Prefix: |
|
| Data Type: |
na |
| Balance Type: |
|
| Period Type: |
|
|
| X |
- Details
| Name: |
us-gaap_PropertyPlantAndEquipmentByTypeAxis=DSGT_MachineryMember |
| Namespace Prefix: |
|
| Data Type: |
na |
| Balance Type: |
|
| Period Type: |
|
|
| X |
- Details
| Name: |
us-gaap_PropertyPlantAndEquipmentByTypeAxis=DSGT_EquipmentOnLeaseMember |
| Namespace Prefix: |
|
| Data Type: |
na |
| Balance Type: |
|
| Period Type: |
|
|
v3.23.2
| X |
- References
+ Details
| Name: |
us-gaap_AccountingPoliciesAbstract |
| Namespace Prefix: |
us-gaap_ |
| Data Type: |
xbrli:stringItemType |
| Balance Type: |
na |
| Period Type: |
duration |
|
| X |
- DefinitionAmount charged to advertising expense for the period, which are expenses incurred with the objective of increasing revenue for a specified brand, product or product line. Reference 1: http://www.xbrl.org/2003/role/disclosureRef
-Publisher FASB
-Name Accounting Standards Codification
-Topic 720
-SubTopic 35
-Section 50
-Paragraph 1
-Subparagraph (b)
-URI https://asc.fasb.org/extlink&oid=6420018&loc=d3e36677-107848
| Name: |
us-gaap_AdvertisingExpense |
| Namespace Prefix: |
us-gaap_ |
| Data Type: |
xbrli:monetaryItemType |
| Balance Type: |
debit |
| Period Type: |
duration |
|
| X |
- DefinitionUseful life of finite-lived intangible assets, in 'PnYnMnDTnHnMnS' format, for example, 'P1Y5M13D' represents the reported fact of one year, five months, and thirteen days.
| Name: |
us-gaap_FiniteLivedIntangibleAssetUsefulLife |
| Namespace Prefix: |
us-gaap_ |
| Data Type: |
xbrli:durationItemType |
| Balance Type: |
na |
| Period Type: |
duration |
|
| X |
- DefinitionNumber of segments reported by the entity. A reportable segment is a component of an entity for which there is an accounting requirement to report separate financial information on that component in the entity's financial statements. Reference 1: http://www.xbrl.org/2009/role/commonPracticeRef
-Publisher FASB
-Name Accounting Standards Codification
-Topic 280
-SubTopic 10
-Section 50
-Paragraph 18
-URI https://asc.fasb.org/extlink&oid=126901519&loc=d3e8672-108599
| Name: |
us-gaap_NumberOfReportableSegments |
| Namespace Prefix: |
us-gaap_ |
| Data Type: |
xbrli:integerItemType |
| Balance Type: |
na |
| Period Type: |
duration |
|
| X |
- DefinitionCarrying value as of the balance sheet date of obligations incurred through that date and payable for estimated claims under standard and extended warranty protection rights granted to customers. For classified balance sheets, represents the current portion of the liabilities (due within one year or within the normal operating cycle if longer). Reference 1: http://fasb.org/us-gaap/role/ref/legacyRef
-Publisher FASB
-Name Accounting Standards Codification
-Topic 460
-SubTopic 10
-Section 50
-Paragraph 7
-URI https://asc.fasb.org/extlink&oid=126907703&loc=d3e12524-110249
Reference 2: http://fasb.org/us-gaap/role/ref/legacyRef
-Publisher FASB
-Name Accounting Standards Codification
-Topic 210
-SubTopic 10
-Section S99
-Paragraph 1
-Subparagraph (SX 210.5-02.20)
-URI https://asc.fasb.org/extlink&oid=120391452&loc=d3e13212-122682
Reference 3: http://fasb.org/us-gaap/role/ref/legacyRef
-Publisher FASB
-Name Accounting Standards Codification
-Topic 460
-SubTopic 10
-Section 25
-Paragraph 5
-URI https://asc.fasb.org/extlink&oid=126907644&loc=d3e11281-110244
| Name: |
us-gaap_ProductWarrantyAccrualClassifiedCurrent |
| Namespace Prefix: |
us-gaap_ |
| Data Type: |
xbrli:monetaryItemType |
| Balance Type: |
credit |
| Period Type: |
instant |
|
v3.23.2
| X |
- DefinitionAmount, before allowance for credit loss, of right to consideration from customer for product sold and service rendered in normal course of business, classified as current. Reference 1: http://www.xbrl.org/2003/role/disclosureRef
-Publisher FASB
-Name Accounting Standards Codification
-Topic 310
-SubTopic 10
-Section 45
-Paragraph 2
-URI https://asc.fasb.org/extlink&oid=124259787&loc=d3e4428-111522
Reference 2: http://www.xbrl.org/2003/role/exampleRef
-Publisher FASB
-Name Accounting Standards Codification
-Topic 210
-SubTopic 10
-Section 45
-Paragraph 1
-Subparagraph (c)
-URI https://asc.fasb.org/extlink&oid=124098289&loc=d3e6676-107765
Reference 3: http://www.xbrl.org/2003/role/disclosureRef
-Publisher FASB
-Name Accounting Standards Codification
-Topic 310
-SubTopic 10
-Section 45
-Paragraph 9
-URI https://asc.fasb.org/extlink&oid=124259787&loc=d3e4531-111522
Reference 4: http://www.xbrl.org/2003/role/disclosureRef
-Publisher FASB
-Name Accounting Standards Codification
-Topic 210
-SubTopic 10
-Section S99
-Paragraph 1
-Subparagraph (SX 210.5-02(3)(a)(1))
-URI https://asc.fasb.org/extlink&oid=120391452&loc=d3e13212-122682
| Name: |
us-gaap_AccountsReceivableGrossCurrent |
| Namespace Prefix: |
us-gaap_ |
| Data Type: |
xbrli:monetaryItemType |
| Balance Type: |
debit |
| Period Type: |
instant |
|
| X |
- DefinitionAmount, after allowance for credit loss, of right to consideration from customer for product sold and service rendered in normal course of business, classified as current. Reference 1: http://www.xbrl.org/2003/role/disclosureRef
-Publisher FASB
-Name Accounting Standards Codification
-Topic 310
-SubTopic 10
-Section 45
-Paragraph 2
-URI https://asc.fasb.org/extlink&oid=124259787&loc=d3e4428-111522
Reference 2: http://www.xbrl.org/2003/role/disclosureRef
-Publisher FASB
-Name Accounting Standards Codification
-Topic 310
-SubTopic 10
-Section 45
-Paragraph 9
-URI https://asc.fasb.org/extlink&oid=124259787&loc=d3e4531-111522
| Name: |
us-gaap_AccountsReceivableNetCurrent |
| Namespace Prefix: |
us-gaap_ |
| Data Type: |
xbrli:monetaryItemType |
| Balance Type: |
debit |
| Period Type: |
instant |
|
| X |
- DefinitionAmount of allowance for credit loss on accounts receivable, classified as current. Reference 1: http://www.xbrl.org/2003/role/disclosureRef
-Publisher FASB
-Name Accounting Standards Codification
-Topic 310
-SubTopic 10
-Section 50
-Paragraph 4
-URI https://asc.fasb.org/extlink&oid=123577603&loc=d3e5074-111524
Reference 2: http://www.xbrl.org/2003/role/disclosureRef
-Publisher FASB
-Name Accounting Standards Codification
-Topic 326
-SubTopic 20
-Section 45
-Paragraph 1
-URI https://asc.fasb.org/extlink&oid=124255206&loc=SL82895884-210446
Reference 3: http://www.xbrl.org/2003/role/disclosureRef
-Publisher FASB
-Name Accounting Standards Codification
-Topic 210
-SubTopic 10
-Section S99
-Paragraph 1
-Subparagraph (SX 210.5-02(4))
-URI https://asc.fasb.org/extlink&oid=120391452&loc=d3e13212-122682
| Name: |
us-gaap_AllowanceForDoubtfulAccountsReceivableCurrent |
| Namespace Prefix: |
us-gaap_ |
| Data Type: |
xbrli:monetaryItemType |
| Balance Type: |
credit |
| Period Type: |
instant |
|
| X |
- References
+ Details
| Name: |
us-gaap_ReceivablesAbstract |
| Namespace Prefix: |
us-gaap_ |
| Data Type: |
xbrli:stringItemType |
| Balance Type: |
na |
| Period Type: |
duration |
|
v3.23.2
SCHEDULE OF INVENTORIES (Details) - USD ($)
|
Dec. 31, 2022 |
Dec. 31, 2021 |
| Inventory [Line Items] |
|
|
| Total inventories |
$ 1,204,577
|
$ 712,678
|
| Parts and Accessories [Member] |
|
|
| Inventory [Line Items] |
|
|
| Total inventories |
217,582
|
226,230
|
| Golf Carts [Member] |
|
|
| Inventory [Line Items] |
|
|
| Total inventories |
799,035
|
158,588
|
| E Bikes [Member] |
|
|
| Inventory [Line Items] |
|
|
| Total inventories |
123,280
|
35,060
|
| Electric Vehicles [Member] |
|
|
| Inventory [Line Items] |
|
|
| Total inventories |
$ 64,680
|
$ 292,800
|
| X |
- DefinitionLine items represent financial concepts included in a table. These concepts are used to disclose reportable information associated with domain members defined in one or many axes to the table.
| Name: |
us-gaap_InventoryLineItems |
| Namespace Prefix: |
us-gaap_ |
| Data Type: |
xbrli:stringItemType |
| Balance Type: |
na |
| Period Type: |
duration |
|
| X |
- DefinitionAmount after valuation and LIFO reserves of inventory expected to be sold, or consumed within one year or operating cycle, if longer. Reference 1: http://www.xbrl.org/2003/role/disclosureRef
-Publisher FASB
-Name Accounting Standards Codification
-Topic 210
-SubTopic 10
-Section S99
-Paragraph 1
-Subparagraph (SX 210.5-02(6))
-URI https://asc.fasb.org/extlink&oid=120391452&loc=d3e13212-122682
Reference 2: http://www.xbrl.org/2003/role/exampleRef
-Publisher FASB
-Name Accounting Standards Codification
-Topic 210
-SubTopic 10
-Section 45
-Paragraph 1
-Subparagraph (b)
-URI https://asc.fasb.org/extlink&oid=124098289&loc=d3e6676-107765
Reference 3: http://www.xbrl.org/2003/role/exampleRef
-Publisher FASB
-Name Accounting Standards Codification
-Topic 852
-SubTopic 10
-Section 55
-Paragraph 10
-URI https://asc.fasb.org/extlink&oid=84165509&loc=d3e56426-112766
| Name: |
us-gaap_InventoryNet |
| Namespace Prefix: |
us-gaap_ |
| Data Type: |
xbrli:monetaryItemType |
| Balance Type: |
debit |
| Period Type: |
instant |
|
| X |
- Details
| Name: |
us-gaap_PublicUtilitiesInventoryAxis=DSGT_PartsAndAccessoriesMember |
| Namespace Prefix: |
|
| Data Type: |
na |
| Balance Type: |
|
| Period Type: |
|
|
| X |
- Details
| Name: |
us-gaap_PublicUtilitiesInventoryAxis=DSGT_GolfCartsMember |
| Namespace Prefix: |
|
| Data Type: |
na |
| Balance Type: |
|
| Period Type: |
|
|
| X |
- Details
| Name: |
us-gaap_PublicUtilitiesInventoryAxis=DSGT_EBikesMember |
| Namespace Prefix: |
|
| Data Type: |
na |
| Balance Type: |
|
| Period Type: |
|
|
| X |
- Details
| Name: |
us-gaap_PublicUtilitiesInventoryAxis=DSGT_ElectricVehiclesMember |
| Namespace Prefix: |
|
| Data Type: |
na |
| Balance Type: |
|
| Period Type: |
|
|
v3.23.2
SCHEDULE OF FIXED ASSETS (Details) - USD ($)
|
Dec. 31, 2022 |
Dec. 31, 2021 |
| Property, Plant and Equipment [Line Items] |
|
|
| Accumulated depreciation |
$ (52,851)
|
$ (42,220)
|
| Fixed assets, net |
25,546
|
35,314
|
| Machinery and Equipment [Member] |
|
|
| Property, Plant and Equipment [Line Items] |
|
|
| Fixed assets, gross |
5,040
|
5,040
|
| Furniture and Equipment [Member] |
|
|
| Property, Plant and Equipment [Line Items] |
|
|
| Fixed assets, gross |
2,587
|
2,350
|
| Computer Equipment [Member] |
|
|
| Property, Plant and Equipment [Line Items] |
|
|
| Fixed assets, gross |
50,781
|
41,784
|
| Vehicles [Member] |
|
|
| Property, Plant and Equipment [Line Items] |
|
|
| Fixed assets, gross |
$ 19,989
|
$ 28,360
|
| X |
- DefinitionAmount of accumulated amortization of right-of-use asset from finance lease. Reference 1: http://www.xbrl.org/2009/role/commonPracticeRef
-Publisher FASB
-Name Accounting Standards Codification
-Topic 842
-SubTopic 20
-Section 50
-Paragraph 4
-Subparagraph (a)
-URI https://asc.fasb.org/extlink&oid=128292326&loc=SL77918686-209980
Reference 2: http://www.xbrl.org/2009/role/commonPracticeRef
-Publisher FASB
-Name Accounting Standards Codification
-Topic 842
-SubTopic 20
-Section 45
-Paragraph 4
-Subparagraph (a)
-URI https://asc.fasb.org/extlink&oid=123391704&loc=SL77918638-209977
| Name: |
us-gaap_FinanceLeaseRightOfUseAssetAccumulatedAmortization |
| Namespace Prefix: |
us-gaap_ |
| Data Type: |
xbrli:monetaryItemType |
| Balance Type: |
credit |
| Period Type: |
instant |
|
| X |
- DefinitionAmount before accumulated depreciation, depletion and amortization of physical assets used in the normal conduct of business and not intended for resale. Examples include, but are not limited to, land, buildings, machinery and equipment, office equipment, and furniture and fixtures. Reference 1: http://www.xbrl.org/2003/role/disclosureRef
-Publisher FASB
-Name Accounting Standards Codification
-Topic 210
-SubTopic 10
-Section S99
-Paragraph 1
-Subparagraph (SX 210.5-02(13))
-URI https://asc.fasb.org/extlink&oid=120391452&loc=d3e13212-122682
Reference 2: http://fasb.org/us-gaap/role/ref/legacyRef
-Publisher FASB
-Name Accounting Standards Codification
-Topic 360
-SubTopic 10
-Section 50
-Paragraph 1
-Subparagraph (b)
-URI https://asc.fasb.org/extlink&oid=6391035&loc=d3e2868-110229
| Name: |
us-gaap_PropertyPlantAndEquipmentGross |
| Namespace Prefix: |
us-gaap_ |
| Data Type: |
xbrli:monetaryItemType |
| Balance Type: |
debit |
| Period Type: |
instant |
|
| X |
- DefinitionLine items represent financial concepts included in a table. These concepts are used to disclose reportable information associated with domain members defined in one or many axes to the table.
| Name: |
us-gaap_PropertyPlantAndEquipmentLineItems |
| Namespace Prefix: |
us-gaap_ |
| Data Type: |
xbrli:stringItemType |
| Balance Type: |
na |
| Period Type: |
duration |
|
| X |
- DefinitionAmount after accumulated depreciation, depletion and amortization of physical assets used in the normal conduct of business to produce goods and services and not intended for resale. Examples include, but are not limited to, land, buildings, machinery and equipment, office equipment, and furniture and fixtures. Reference 1: http://fasb.org/us-gaap/role/ref/legacyRef
-Publisher FASB
-Name Accounting Standards Codification
-Topic 360
-SubTopic 10
-Section 50
-Paragraph 1
-URI https://asc.fasb.org/extlink&oid=6391035&loc=d3e2868-110229
Reference 2: http://fasb.org/us-gaap/role/ref/legacyRef
-Publisher FASB
-Name Accounting Standards Codification
-Topic 944
-SubTopic 210
-Section S99
-Paragraph 1
-Subparagraph (SX 210.7-03(a)(8))
-URI https://asc.fasb.org/extlink&oid=126734703&loc=d3e572229-122910
Reference 3: http://www.xbrl.org/2003/role/disclosureRef
-Publisher FASB
-Name Accounting Standards Codification
-Topic 942
-SubTopic 360
-Section 50
-Paragraph 1
-URI https://asc.fasb.org/extlink&oid=124429447&loc=SL124453093-239630
Reference 4: http://www.xbrl.org/2003/role/exampleRef
-Publisher FASB
-Name Accounting Standards Codification
-Topic 852
-SubTopic 10
-Section 55
-Paragraph 10
-URI https://asc.fasb.org/extlink&oid=84165509&loc=d3e56426-112766
| Name: |
us-gaap_PropertyPlantAndEquipmentNet |
| Namespace Prefix: |
us-gaap_ |
| Data Type: |
xbrli:monetaryItemType |
| Balance Type: |
debit |
| Period Type: |
instant |
|
| X |
- Details
| Name: |
us-gaap_PropertyPlantAndEquipmentByTypeAxis=us-gaap_MachineryAndEquipmentMember |
| Namespace Prefix: |
|
| Data Type: |
na |
| Balance Type: |
|
| Period Type: |
|
|
| X |
- Details
| Name: |
us-gaap_PropertyPlantAndEquipmentByTypeAxis=DSGT_FurnitureAndEquipmentMember |
| Namespace Prefix: |
|
| Data Type: |
na |
| Balance Type: |
|
| Period Type: |
|
|
| X |
- Details
| Name: |
us-gaap_PropertyPlantAndEquipmentByTypeAxis=us-gaap_ComputerEquipmentMember |
| Namespace Prefix: |
|
| Data Type: |
na |
| Balance Type: |
|
| Period Type: |
|
|
| X |
- Details
| Name: |
us-gaap_PropertyPlantAndEquipmentByTypeAxis=us-gaap_VehiclesMember |
| Namespace Prefix: |
|
| Data Type: |
na |
| Balance Type: |
|
| Period Type: |
|
|
v3.23.2
| X |
- DefinitionDepreciation for right-of-use assets.
| Name: |
DSGT_DepreciationForRightofuseAssets |
| Namespace Prefix: |
DSGT_ |
| Data Type: |
xbrli:monetaryItemType |
| Balance Type: |
debit |
| Period Type: |
duration |
|
| X |
- DefinitionThe amount of expense recognized in the current period that reflects the allocation of the cost of tangible assets over the assets' useful lives. Includes production and non-production related depreciation. Reference 1: http://fasb.org/us-gaap/role/ref/legacyRef
-Publisher FASB
-Name Accounting Standards Codification
-Topic 360
-SubTopic 10
-Section 50
-Paragraph 1
-Subparagraph (a)
-URI https://asc.fasb.org/extlink&oid=6391035&loc=d3e2868-110229
Reference 2: http://fasb.org/us-gaap/role/ref/legacyRef
-Publisher FASB
-Name Accounting Standards Codification
-Topic 230
-SubTopic 10
-Section 45
-Paragraph 28
-Subparagraph (b)
-URI https://asc.fasb.org/extlink&oid=126954810&loc=d3e3602-108585
| Name: |
us-gaap_Depreciation |
| Namespace Prefix: |
us-gaap_ |
| Data Type: |
xbrli:monetaryItemType |
| Balance Type: |
debit |
| Period Type: |
duration |
|
| X |
- References
+ Details
| Name: |
us-gaap_PropertyPlantAndEquipmentAbstract |
| Namespace Prefix: |
us-gaap_ |
| Data Type: |
xbrli:stringItemType |
| Balance Type: |
na |
| Period Type: |
duration |
|
v3.23.2
| X |
- DefinitionAccumulated amount of amortization of assets, excluding financial assets and goodwill, lacking physical substance with a finite life. Reference 1: http://www.xbrl.org/2003/role/disclosureRef
-Publisher FASB
-Name Accounting Standards Codification
-Topic 350
-SubTopic 30
-Section 50
-Paragraph 2
-Subparagraph (a)(1)
-URI https://asc.fasb.org/extlink&oid=66006027&loc=d3e16323-109275
Reference 2: http://www.xbrl.org/2003/role/disclosureRef
-Publisher FASB
-Name Accounting Standards Codification
-Topic 210
-SubTopic 10
-Section S99
-Paragraph 1
-Subparagraph (SX 210.5-02(16))
-URI https://asc.fasb.org/extlink&oid=120391452&loc=d3e13212-122682
| Name: |
us-gaap_FiniteLivedIntangibleAssetsAccumulatedAmortization |
| Namespace Prefix: |
us-gaap_ |
| Data Type: |
xbrli:monetaryItemType |
| Balance Type: |
credit |
| Period Type: |
instant |
|
| X |
- DefinitionAmount after amortization of assets, excluding financial assets and goodwill, lacking physical substance with a finite life. Reference 1: http://www.xbrl.org/2003/role/disclosureRef
-Publisher FASB
-Name Accounting Standards Codification
-Topic 926
-SubTopic 20
-Section 50
-Paragraph 5
-URI https://asc.fasb.org/extlink&oid=120154696&loc=d3e54445-107959
Reference 2: http://fasb.org/us-gaap/role/ref/legacyRef
-Publisher FASB
-Name Accounting Standards Codification
-Topic 350
-SubTopic 30
-Section 50
-Paragraph 2
-Subparagraph (a)(1)
-URI https://asc.fasb.org/extlink&oid=66006027&loc=d3e16323-109275
| Name: |
us-gaap_FiniteLivedIntangibleAssetsNet |
| Namespace Prefix: |
us-gaap_ |
| Data Type: |
xbrli:monetaryItemType |
| Balance Type: |
debit |
| Period Type: |
instant |
|
| X |
- DefinitionGross carrying amount before accumulated amortization as of the balance sheet date of the costs pertaining to the exclusive legal rights granted to the owner of the patent to exploit an invention or a process for a period of time specified by law. Such costs may have been expended to directly apply and receive patent rights, or to acquire such rights. Reference 1: http://fasb.org/us-gaap/role/ref/legacyRef
-Publisher FASB
-Name Accounting Standards Codification
-Topic 350
-SubTopic 30
-Section 50
-Paragraph 2
-Subparagraph (a)(1)
-URI https://asc.fasb.org/extlink&oid=66006027&loc=d3e16323-109275
| Name: |
us-gaap_FiniteLivedPatentsGross |
| Namespace Prefix: |
us-gaap_ |
| Data Type: |
xbrli:monetaryItemType |
| Balance Type: |
debit |
| Period Type: |
instant |
|
| X |
- References
+ Details
| Name: |
us-gaap_GoodwillAndIntangibleAssetsDisclosureAbstract |
| Namespace Prefix: |
us-gaap_ |
| Data Type: |
xbrli:stringItemType |
| Balance Type: |
na |
| Period Type: |
duration |
|
v3.23.2
| X |
- DefinitionThe aggregate expense charged against earnings to allocate the cost of intangible assets (nonphysical assets not used in production) in a systematic and rational manner to the periods expected to benefit from such assets. As a noncash expense, this element is added back to net income when calculating cash provided by or used in operations using the indirect method. Reference 1: http://fasb.org/us-gaap/role/ref/legacyRef
-Publisher FASB
-Name Accounting Standards Codification
-Topic 230
-SubTopic 10
-Section 45
-Paragraph 28
-Subparagraph (b)
-URI https://asc.fasb.org/extlink&oid=126954810&loc=d3e3602-108585
Reference 2: http://fasb.org/us-gaap/role/ref/legacyRef
-Publisher FASB
-Name Accounting Standards Codification
-Topic 350
-SubTopic 30
-Section 50
-Paragraph 2
-Subparagraph (a)(2)
-URI https://asc.fasb.org/extlink&oid=66006027&loc=d3e16323-109275
Reference 3: http://fasb.org/us-gaap/role/ref/legacyRef
-Publisher FASB
-Name Accounting Standards Codification
-Topic 350
-SubTopic 30
-Section 45
-Paragraph 2
-URI https://asc.fasb.org/extlink&oid=6388964&loc=d3e16225-109274
| Name: |
us-gaap_AmortizationOfIntangibleAssets |
| Namespace Prefix: |
us-gaap_ |
| Data Type: |
xbrli:monetaryItemType |
| Balance Type: |
debit |
| Period Type: |
duration |
|
| X |
- DefinitionUseful life of finite-lived intangible assets, in 'PnYnMnDTnHnMnS' format, for example, 'P1Y5M13D' represents the reported fact of one year, five months, and thirteen days.
| Name: |
us-gaap_FiniteLivedIntangibleAssetUsefulLife |
| Namespace Prefix: |
us-gaap_ |
| Data Type: |
xbrli:durationItemType |
| Balance Type: |
na |
| Period Type: |
duration |
|
| X |
- References
+ Details
| Name: |
us-gaap_GoodwillAndIntangibleAssetsDisclosureAbstract |
| Namespace Prefix: |
us-gaap_ |
| Data Type: |
xbrli:stringItemType |
| Balance Type: |
na |
| Period Type: |
duration |
|
v3.23.2
SCHEDULE OF TRADE AND OTHER PAYABLES (Details) - USD ($)
|
Dec. 31, 2022 |
Dec. 31, 2021 |
| Payables and Accruals [Abstract] |
|
|
| Accounts payable and accrued expenses |
$ 1,462,557
|
$ 949,937
|
| Accrued interest |
1,880,463
|
248,610
|
| Other liabilities |
13,236
|
4,051
|
| Total trade and other payables |
$ 3,356,256
|
$ 1,202,598
|
| X |
- DefinitionSum of the carrying values as of the balance sheet date of obligations incurred through that date and due within one year (or the operating cycle, if longer), including liabilities incurred (and for which invoices have typically been received) and payable to vendors for goods and services received, taxes, interest, rent and utilities, accrued salaries and bonuses, payroll taxes and fringe benefits.
| Name: |
DSGT_AccountsPayableAndAccruedExpensesCurrent |
| Namespace Prefix: |
DSGT_ |
| Data Type: |
xbrli:monetaryItemType |
| Balance Type: |
credit |
| Period Type: |
instant |
|
| X |
- DefinitionAccounts payables and accrued liabilities current.
| Name: |
DSGT_AccountsPayablesAndAccruedLiabilitiesCurrent |
| Namespace Prefix: |
DSGT_ |
| Data Type: |
xbrli:monetaryItemType |
| Balance Type: |
credit |
| Period Type: |
instant |
|
| X |
- DefinitionCarrying value as of the balance sheet date of [accrued] interest payable on all forms of debt, including trade payables, that has been incurred and is unpaid. Used to reflect the current portion of the liabilities (due within one year or within the normal operating cycle if longer). Reference 1: http://fasb.org/us-gaap/role/ref/legacyRef
-Publisher FASB
-Name Accounting Standards Codification
-Topic 210
-SubTopic 10
-Section S99
-Paragraph 1
-Subparagraph (SX 210.5-02.20)
-URI https://asc.fasb.org/extlink&oid=120391452&loc=d3e13212-122682
| Name: |
us-gaap_InterestPayableCurrent |
| Namespace Prefix: |
us-gaap_ |
| Data Type: |
xbrli:monetaryItemType |
| Balance Type: |
credit |
| Period Type: |
instant |
|
| X |
- DefinitionAmount of expenses incurred but not yet paid classified as other, due within one year or the normal operating cycle, if longer. Reference 1: http://fasb.org/us-gaap/role/ref/legacyRef
-Publisher FASB
-Name Accounting Standards Codification
-Topic 210
-SubTopic 10
-Section S99
-Paragraph 1
-Subparagraph (SX 210.5-02.20)
-URI https://asc.fasb.org/extlink&oid=120391452&loc=d3e13212-122682
| Name: |
us-gaap_OtherAccruedLiabilitiesCurrent |
| Namespace Prefix: |
us-gaap_ |
| Data Type: |
xbrli:monetaryItemType |
| Balance Type: |
credit |
| Period Type: |
instant |
|
| X |
- References
+ Details
| Name: |
us-gaap_PayablesAndAccrualsAbstract |
| Namespace Prefix: |
us-gaap_ |
| Data Type: |
xbrli:stringItemType |
| Balance Type: |
na |
| Period Type: |
duration |
|
v3.23.2
SCHEDULE OF LOANS PAYABLE (Details) (Parenthetical)
|
|
|
|
|
|
|
|
|
|
|
|
|
|
12 Months Ended |
|
|
|
|
|
|
Oct. 21, 2022
USD ($)
|
Oct. 18, 2022
USD ($)
|
Sep. 15, 2022
USD ($)
|
Aug. 29, 2022
USD ($)
|
Jul. 29, 2022
USD ($)
|
Mar. 31, 2022
USD ($)
|
Feb. 28, 2022
USD ($)
shares
|
Feb. 17, 2022
USD ($)
shares
|
Sep. 13, 2021
USD ($)
|
Jun. 05, 2020
USD ($)
|
May 21, 2020
USD ($)
|
Apr. 21, 2020
CAD ($)
|
Apr. 17, 2020
CAD ($)
|
Dec. 31, 2022
USD ($)
|
Dec. 31, 2021
USD ($)
|
Dec. 31, 2022
CAD ($)
|
Dec. 01, 2022
USD ($)
|
Dec. 31, 2021
CAD ($)
|
Apr. 21, 2020
USD ($)
|
Apr. 21, 2020
CAD ($)
|
Apr. 17, 2020
USD ($)
|
Apr. 17, 2020
CAD ($)
|
| Short-Term Debt [Line Items] |
|
|
|
|
|
|
|
|
|
|
|
|
|
|
|
|
|
|
|
|
|
|
| Debt, due date |
|
|
|
|
|
|
|
|
|
Jun. 05, 2050
|
|
|
|
|
|
|
|
|
|
|
|
|
| Debt instrument, interest rate |
|
|
|
|
|
|
|
|
|
3.75%
|
|
|
|
|
|
|
|
|
|
|
|
|
| Loan payable principal amount |
|
|
|
|
|
|
|
|
|
$ 150,000
|
|
|
|
|
|
|
$ 1,000,000
|
|
|
|
|
|
| Repayments of debt |
|
|
|
|
|
|
|
|
|
$ 731
|
|
|
|
|
|
|
|
|
|
|
|
|
| Proceeds from Notes Payable |
|
|
|
|
|
|
|
|
|
|
|
|
|
$ 1,500,000
|
$ 1,897,500
|
|
|
|
|
|
|
|
| Interest expense |
|
|
|
|
|
|
|
|
|
|
|
|
|
1,918,065
|
|
|
|
|
|
|
|
|
| Additional interest expense |
|
|
|
|
|
|
|
|
|
|
|
|
|
1,603,000
|
|
|
|
|
|
|
|
|
| Interest expense, debt |
|
|
|
|
|
|
|
|
|
|
|
|
|
3,062
|
|
|
|
|
|
|
|
|
| Share Purchase Agreement [Member] |
|
|
|
|
|
|
|
|
|
|
|
|
|
|
|
|
|
|
|
|
|
|
| Short-Term Debt [Line Items] |
|
|
|
|
|
|
|
|
|
|
|
|
|
|
|
|
|
|
|
|
|
|
| Debt instrument, interest rate |
|
|
|
|
|
|
|
15.00%
|
|
|
|
|
|
|
|
|
|
|
|
|
|
|
| Proceeds from Notes Payable |
$ 285,000
|
$ 125,000
|
$ 125,000
|
$ 250,000
|
$ 90,000
|
$ 250,000
|
$ 250,000
|
|
|
|
|
|
|
|
|
|
|
|
|
|
|
|
| Stock issued during period, shares, new issues | shares |
|
|
|
|
|
|
1,375
|
500
|
|
|
|
|
|
|
|
|
|
|
|
|
|
|
| Percentage of gross sales remittance |
|
|
|
|
|
|
|
20.00%
|
|
|
|
|
|
|
|
|
|
|
|
|
|
|
| Distributions on mandatorily redeemable securities |
|
|
|
|
|
|
|
$ 1,375,000
|
|
|
|
|
|
|
|
|
|
|
|
|
|
|
| Redemption premium |
|
|
|
|
|
|
|
$ 75,000
|
|
|
|
|
|
|
|
|
|
|
|
|
|
|
| Repayments of notes payable |
|
|
|
|
|
|
|
|
|
|
|
|
|
20,411
|
|
|
|
|
|
|
|
|
| Minimum [Member] |
|
|
|
|
|
|
|
|
|
|
|
|
|
|
|
|
|
|
|
|
|
|
| Short-Term Debt [Line Items] |
|
|
|
|
|
|
|
|
|
|
|
|
|
|
|
|
|
|
|
|
|
|
| Debt instrument, interest rate |
|
|
|
|
|
|
|
|
|
|
|
|
|
|
|
|
10.00%
|
|
|
|
|
|
| Maximum [Member] |
|
|
|
|
|
|
|
|
|
|
|
|
|
|
|
|
|
|
|
|
|
|
| Short-Term Debt [Line Items] |
|
|
|
|
|
|
|
|
|
|
|
|
|
|
|
|
|
|
|
|
|
|
| Debt instrument, interest rate |
|
|
|
|
|
|
|
|
|
|
|
|
|
|
|
|
18.00%
|
|
|
|
|
|
| Convertible Promissory Notes [Member] |
|
|
|
|
|
|
|
|
|
|
|
|
|
|
|
|
|
|
|
|
|
|
| Short-Term Debt [Line Items] |
|
|
|
|
|
|
|
|
|
|
|
|
|
|
|
|
|
|
|
|
|
|
| Convertible notes payable |
|
|
|
|
|
|
|
|
|
|
|
|
|
$ 2,400,000
|
$ 2,084,935
|
|
|
|
|
|
|
|
| Non-related Party [Member] |
|
|
|
|
|
|
|
|
|
|
|
|
|
|
|
|
|
|
|
|
|
|
| Short-Term Debt [Line Items] |
|
|
|
|
|
|
|
|
|
|
|
|
|
|
|
|
|
|
|
|
|
|
| Debt, due date |
|
|
|
|
|
|
|
|
Jun. 20, 2022
|
|
|
|
|
|
|
|
|
|
|
|
|
|
| Debt instrument, interest rate |
|
|
|
|
|
|
|
|
9.00%
|
|
|
|
|
|
|
|
|
|
|
|
|
|
| Loan payable principal amount |
|
|
|
|
|
|
|
|
$ 2,400,000
|
|
|
|
|
|
|
|
|
|
|
|
|
|
| Proceeds from Notes Payable |
|
|
|
|
|
|
|
|
2,000,000
|
|
|
|
|
|
|
|
|
|
|
|
|
|
| Debt instrument, unamortized discount |
|
|
|
|
|
|
|
|
$ 400,000
|
|
|
|
|
|
|
|
|
|
|
|
|
|
| Debt instrument, covenant description |
|
|
|
|
|
|
|
|
If
the note is not paid in full before December 12, 2021, an additional $100,000 of guaranteed interest will be added to the note. An
additional $100,000 of guaranteed interest will be added to the note on the 12th day of each succeeding month during which
any portion of the note remains unpaid
|
|
|
|
|
|
|
|
|
|
|
|
|
|
| Default interest rate |
|
|
|
|
|
|
|
|
24.00%
|
|
|
|
|
|
|
|
|
|
|
|
|
|
| Canada Emergency Business Account Program [Member] |
|
|
|
|
|
|
|
|
|
|
|
|
|
|
|
|
|
|
|
|
|
|
| Short-Term Debt [Line Items] |
|
|
|
|
|
|
|
|
|
|
|
|
|
|
|
|
|
|
|
|
|
|
| Debt, due date |
|
|
|
|
|
|
|
|
|
|
|
|
Dec. 31, 2025
|
|
|
|
|
|
|
|
|
|
| Debt instrument, interest rate |
|
|
|
|
|
|
|
|
|
|
|
|
|
|
|
|
|
|
5.00%
|
5.00%
|
5.00%
|
5.00%
|
| Loan payable principal amount |
|
|
|
|
|
|
|
|
|
|
|
|
|
|
|
|
|
|
$ 29,520
|
$ 40,000
|
$ 29,520
|
$ 40,000
|
| Debt instrument forgiveness |
|
|
|
|
|
|
|
|
|
|
|
$ 10,000
|
$ 10,000
|
|
|
|
|
|
|
|
|
|
| Paycheck Protection Program [Member] |
|
|
|
|
|
|
|
|
|
|
|
|
|
|
|
|
|
|
|
|
|
|
| Short-Term Debt [Line Items] |
|
|
|
|
|
|
|
|
|
|
|
|
|
|
|
|
|
|
|
|
|
|
| Debt, due date |
|
|
|
|
|
|
|
|
|
|
May 21, 2022
|
|
|
|
|
|
|
|
|
|
|
|
| Debt instrument, interest rate |
|
|
|
|
|
|
|
|
|
|
1.00%
|
|
|
|
|
|
|
|
|
|
|
|
| Loan payable principal amount |
|
|
|
|
|
|
|
|
|
|
$ 30,115
|
|
|
|
|
|
|
|
|
|
|
|
| Loans Payable [Member] |
|
|
|
|
|
|
|
|
|
|
|
|
|
|
|
|
|
|
|
|
|
|
| Short-Term Debt [Line Items] |
|
|
|
|
|
|
|
|
|
|
|
|
|
|
|
|
|
|
|
|
|
|
| Unsecured debt |
|
|
|
|
|
|
|
|
|
|
|
|
|
|
|
$ 40,000
|
|
$ 40,000
|
|
|
|
|
| Debt, due date |
|
|
|
|
|
|
|
|
|
|
|
|
|
Dec. 31, 2025
|
Dec. 31, 2025
|
|
|
|
|
|
|
|
| Loans Payable One [Member] |
|
|
|
|
|
|
|
|
|
|
|
|
|
|
|
|
|
|
|
|
|
|
| Short-Term Debt [Line Items] |
|
|
|
|
|
|
|
|
|
|
|
|
|
|
|
|
|
|
|
|
|
|
| Unsecured debt |
|
|
|
|
|
|
|
|
|
|
|
|
|
|
|
$ 40,000
|
|
$ 40,000
|
|
|
|
|
| Debt, due date |
|
|
|
|
|
|
|
|
|
|
|
|
|
Dec. 31, 2025
|
Dec. 31, 2025
|
|
|
|
|
|
|
|
| Loans Payable Two [Member] |
|
|
|
|
|
|
|
|
|
|
|
|
|
|
|
|
|
|
|
|
|
|
| Short-Term Debt [Line Items] |
|
|
|
|
|
|
|
|
|
|
|
|
|
|
|
|
|
|
|
|
|
|
| Debt, due date |
|
|
|
|
|
|
|
|
|
|
|
|
|
May 21, 2022
|
May 21, 2022
|
|
|
|
|
|
|
|
| Debt instrument, interest rate |
|
|
|
|
|
|
|
|
|
|
|
|
|
1.00%
|
1.00%
|
1.00%
|
|
1.00%
|
|
|
|
|
| Loans Payable Three [Member] |
|
|
|
|
|
|
|
|
|
|
|
|
|
|
|
|
|
|
|
|
|
|
| Short-Term Debt [Line Items] |
|
|
|
|
|
|
|
|
|
|
|
|
|
|
|
|
|
|
|
|
|
|
| Debt, due date |
|
|
|
|
|
|
|
|
|
|
|
|
|
Jun. 05, 2050
|
Jun. 05, 2050
|
|
|
|
|
|
|
|
| Debt instrument, interest rate |
|
|
|
|
|
|
|
|
|
|
|
|
|
3.75%
|
3.75%
|
3.75%
|
|
3.75%
|
|
|
|
|
| Loans Payable Four [Member] |
|
|
|
|
|
|
|
|
|
|
|
|
|
|
|
|
|
|
|
|
|
|
| Short-Term Debt [Line Items] |
|
|
|
|
|
|
|
|
|
|
|
|
|
|
|
|
|
|
|
|
|
|
| Debt, due date |
|
|
|
|
|
|
|
|
|
|
|
|
|
Jun. 20, 2022
|
Jun. 20, 2022
|
|
|
|
|
|
|
|
| Debt instrument, interest rate |
|
|
|
|
|
|
|
|
|
|
|
|
|
9.00%
|
9.00%
|
9.00%
|
|
9.00%
|
|
|
|
|
| Loans Payable Five [Member] |
|
|
|
|
|
|
|
|
|
|
|
|
|
|
|
|
|
|
|
|
|
|
| Short-Term Debt [Line Items] |
|
|
|
|
|
|
|
|
|
|
|
|
|
|
|
|
|
|
|
|
|
|
| Debt, due date |
|
|
|
|
|
|
|
|
|
|
|
|
|
|
Dec. 01, 2025
|
|
|
|
|
|
|
|
| Debt instrument, interest rate |
|
|
|
|
|
|
|
|
|
|
|
|
|
|
10.00%
|
|
|
10.00%
|
|
|
|
|
| X |
- DefinitionAdditional interest expense.
| Name: |
DSGT_AdditionalInterestExpense |
| Namespace Prefix: |
DSGT_ |
| Data Type: |
xbrli:monetaryItemType |
| Balance Type: |
debit |
| Period Type: |
duration |
|
| X |
- DefinitionPercentage of gross sale remittance.
| Name: |
DSGT_PercentageOfGrossSalesRemittance |
| Namespace Prefix: |
DSGT_ |
| Data Type: |
dtr-types:percentItemType |
| Balance Type: |
na |
| Period Type: |
duration |
|
| X |
- DefinitionIncluding the current and noncurrent portions, carrying value as of the balance sheet date of a written promise to pay a note, initially due after one year or beyond the operating cycle if longer, which can be exchanged for a specified amount of one or more securities (typically common stock), at the option of the issuer or the holder. Reference 1: http://fasb.org/us-gaap/role/ref/legacyRef
-Publisher FASB
-Name Accounting Standards Codification
-Topic 942
-SubTopic 210
-Section S99
-Paragraph 1
-Subparagraph (SX 210.9-03(16))
-URI https://asc.fasb.org/extlink&oid=126897435&loc=d3e534808-122878
Reference 2: http://fasb.org/us-gaap/role/ref/legacyRef
-Publisher FASB
-Name Accounting Standards Codification
-Topic 946
-SubTopic 210
-Section S99
-Paragraph 1
-Subparagraph (SX 210.6-04(13))
-URI https://asc.fasb.org/extlink&oid=120401414&loc=d3e603758-122996
Reference 3: http://fasb.org/us-gaap/role/ref/legacyRef
-Publisher FASB
-Name Accounting Standards Codification
-Topic 210
-SubTopic 10
-Section S99
-Paragraph 1
-Subparagraph (SX 210.5-02(22))
-URI https://asc.fasb.org/extlink&oid=120391452&loc=d3e13212-122682
Reference 4: http://fasb.org/us-gaap/role/ref/legacyRef
-Publisher FASB
-Name Accounting Standards Codification
-Topic 944
-SubTopic 210
-Section S99
-Paragraph 1
-Subparagraph (SX 210.7-03(a)(16)(a))
-URI https://asc.fasb.org/extlink&oid=126734703&loc=d3e572229-122910
| Name: |
us-gaap_ConvertibleNotesPayable |
| Namespace Prefix: |
us-gaap_ |
| Data Type: |
xbrli:monetaryItemType |
| Balance Type: |
credit |
| Period Type: |
instant |
|
| X |
- DefinitionDescription of minimum financial levels (for example, tangible net worth and working capital) and achievement of certain financial ratios (for example, working capital ratio and debt service coverage ratio), and adherence to certain clauses which generally require or restrict certain actions (for example, entering into a debt arrangement with equal or greater seniority, and selling or discontinuing a certain business segment or material subsidiary) to be in compliance with the covenant clauses of the debt agreement. May also include a discussion of the adverse consequences that would result if the entity violates or fails to satisfy the covenants. Reference 1: http://fasb.org/us-gaap/role/ref/legacyRef
-Publisher FASB
-Name Accounting Standards Codification
-Topic 210
-SubTopic 10
-Section S99
-Paragraph 1
-Subparagraph (SX 210.5-02(22))
-URI https://asc.fasb.org/extlink&oid=120391452&loc=d3e13212-122682
Reference 2: http://fasb.org/us-gaap/role/ref/legacyRef
-Publisher FASB
-Name Accounting Standards Codification
-Topic 942
-SubTopic 470
-Section 50
-Paragraph 3
-Subparagraph (g)
-URI https://asc.fasb.org/extlink&oid=123599511&loc=d3e64711-112823
| Name: |
us-gaap_DebtInstrumentCovenantDescription |
| Namespace Prefix: |
us-gaap_ |
| Data Type: |
xbrli:stringItemType |
| Balance Type: |
na |
| Period Type: |
duration |
|
| X |
- DefinitionDecrease for amounts of indebtedness forgiven by the holder of the debt instrument. Reference 1: http://www.xbrl.org/2009/role/commonPracticeRef
-Publisher FASB
-Name Accounting Standards Codification
-Topic 235
-SubTopic 10
-Section S99
-Paragraph 1
-Subparagraph (SX 210.4-08(f))
-URI https://asc.fasb.org/extlink&oid=120395691&loc=d3e23780-122690
| Name: |
us-gaap_DebtInstrumentDecreaseForgiveness |
| Namespace Prefix: |
us-gaap_ |
| Data Type: |
xbrli:monetaryItemType |
| Balance Type: |
debit |
| Period Type: |
duration |
|
| X |
- DefinitionFace (par) amount of debt instrument at time of issuance. Reference 1: http://www.xbrl.org/2003/role/disclosureRef
-Publisher FASB
-Name Accounting Standards Codification
-Topic 470
-SubTopic 20
-Section 50
-Paragraph 1B
-Subparagraph (a)
-URI https://asc.fasb.org/extlink&oid=123466505&loc=SL123495323-112611
Reference 2: http://fasb.org/us-gaap/role/ref/legacyRef
-Publisher FASB
-Name Accounting Standards Codification
-Topic 835
-SubTopic 30
-Section 45
-Paragraph 2
-URI https://asc.fasb.org/extlink&oid=124435984&loc=d3e28551-108399
Reference 3: http://fasb.org/us-gaap/role/ref/legacyRef
-Publisher FASB
-Name Accounting Standards Codification
-Topic 835
-SubTopic 30
-Section 55
-Paragraph 8
-URI https://asc.fasb.org/extlink&oid=114775985&loc=d3e28878-108400
Reference 4: http://www.xbrl.org/2003/role/disclosureRef
-Publisher FASB
-Name Accounting Standards Codification
-Topic 835
-SubTopic 30
-Section 50
-Paragraph 1
-URI https://asc.fasb.org/extlink&oid=124429444&loc=SL124452920-239629
Reference 5: http://www.xbrl.org/2003/role/exampleRef
-Publisher FASB
-Name Accounting Standards Codification
-Topic 470
-SubTopic 20
-Section 55
-Paragraph 69C
-URI https://asc.fasb.org/extlink&oid=123466577&loc=SL123495737-112612
Reference 6: http://www.xbrl.org/2003/role/exampleRef
-Publisher FASB
-Name Accounting Standards Codification
-Topic 470
-SubTopic 20
-Section 55
-Paragraph 69B
-URI https://asc.fasb.org/extlink&oid=123466577&loc=SL123495735-112612
| Name: |
us-gaap_DebtInstrumentFaceAmount |
| Namespace Prefix: |
us-gaap_ |
| Data Type: |
xbrli:monetaryItemType |
| Balance Type: |
credit |
| Period Type: |
instant |
|
| X |
- DefinitionContractual interest rate for funds borrowed, under the debt agreement. Reference 1: http://www.xbrl.org/2003/role/disclosureRef
-Publisher FASB
-Name Accounting Standards Codification
-Topic 470
-SubTopic 20
-Section 50
-Paragraph 1B
-Subparagraph (b)
-URI https://asc.fasb.org/extlink&oid=123466505&loc=SL123495323-112611
Reference 2: http://fasb.org/us-gaap/role/ref/legacyRef
-Publisher FASB
-Name Accounting Standards Codification
-Topic 210
-SubTopic 10
-Section S99
-Paragraph 1
-Subparagraph (SX 210.5-02.22(a)(1))
-URI https://asc.fasb.org/extlink&oid=120391452&loc=d3e13212-122682
| Name: |
us-gaap_DebtInstrumentInterestRateStatedPercentage |
| Namespace Prefix: |
us-gaap_ |
| Data Type: |
dtr-types:percentItemType |
| Balance Type: |
na |
| Period Type: |
instant |
|
| X |
- DefinitionDate when the debt instrument is scheduled to be fully repaid, in YYYY-MM-DD format. Reference 1: http://www.xbrl.org/2003/role/disclosureRef
-Publisher FASB
-Name Accounting Standards Codification
-Topic 210
-SubTopic 10
-Section S99
-Paragraph 1
-Subparagraph (SX 210.5-02.22(a)(2))
-URI https://asc.fasb.org/extlink&oid=120391452&loc=d3e13212-122682
Reference 2: http://www.xbrl.org/2003/role/exampleRef
-Publisher FASB
-Name Accounting Standards Codification
-Topic 470
-SubTopic 20
-Section 50
-Paragraph 1B
-Subparagraph (d)
-URI https://asc.fasb.org/extlink&oid=123466505&loc=SL123495323-112611
Reference 3: http://www.xbrl.org/2009/role/commonPracticeRef
-Publisher FASB
-Name Accounting Standards Codification
-Topic 820
-SubTopic 10
-Section 50
-Paragraph 2
-Subparagraph (bbb)(2)
-URI https://asc.fasb.org/extlink&oid=126976982&loc=d3e19207-110258
| Name: |
us-gaap_DebtInstrumentMaturityDate |
| Namespace Prefix: |
us-gaap_ |
| Data Type: |
xbrli:dateItemType |
| Balance Type: |
na |
| Period Type: |
duration |
|
| X |
- DefinitionAmount, after accumulated amortization, of debt discount. Reference 1: http://fasb.org/us-gaap/role/ref/legacyRef
-Publisher FASB
-Name Accounting Standards Codification
-Topic 835
-SubTopic 30
-Section 45
-Paragraph 1A
-URI https://asc.fasb.org/extlink&oid=124435984&loc=d3e28541-108399
Reference 2: http://fasb.org/us-gaap/role/ref/legacyRef
-Publisher FASB
-Name Accounting Standards Codification
-Topic 835
-SubTopic 30
-Section 55
-Paragraph 8
-URI https://asc.fasb.org/extlink&oid=114775985&loc=d3e28878-108400
Reference 3: http://www.xbrl.org/2009/role/commonPracticeRef
-Publisher FASB
-Name Accounting Standards Codification
-Topic 470
-SubTopic 20
-Section 50
-Paragraph 1D
-Subparagraph (a)
-URI https://asc.fasb.org/extlink&oid=123466505&loc=SL123495340-112611
| Name: |
us-gaap_DebtInstrumentUnamortizedDiscount |
| Namespace Prefix: |
us-gaap_ |
| Data Type: |
xbrli:monetaryItemType |
| Balance Type: |
debit |
| Period Type: |
instant |
|
| X |
- DefinitionAmount of distributions during the period on mandatorily redeemable securities. Reference 1: http://fasb.org/us-gaap/role/ref/legacyRef
-Publisher FASB
-Name Accounting Standards Codification
-Topic 480
-SubTopic 10
-Section 45
-Paragraph 2
-URI https://asc.fasb.org/extlink&oid=118255708&loc=d3e21951-110878
| Name: |
us-gaap_DistributionsOnMandatorilyRedeemableSecurities |
| Namespace Prefix: |
us-gaap_ |
| Data Type: |
xbrli:monetaryItemType |
| Balance Type: |
credit |
| Period Type: |
duration |
|
| X |
- DefinitionAmount of the cost of borrowed funds accounted for as interest expense. Reference 1: http://www.xbrl.org/2003/role/disclosureRef
-Publisher FASB
-Name Accounting Standards Codification
-Topic 835
-SubTopic 20
-Section 50
-Paragraph 1
-Subparagraph (a)
-URI https://asc.fasb.org/extlink&oid=6450988&loc=d3e26243-108391
Reference 2: http://fasb.org/us-gaap/role/ref/legacyRef
-Publisher FASB
-Name Accounting Standards Codification
-Topic 835
-SubTopic 30
-Section 45
-Paragraph 3
-URI https://asc.fasb.org/extlink&oid=124435984&loc=d3e28555-108399
Reference 3: http://www.xbrl.org/2003/role/disclosureRef
-Publisher FASB
-Name Accounting Standards Codification
-Topic 280
-SubTopic 10
-Section 50
-Paragraph 22
-Subparagraph (d)
-URI https://asc.fasb.org/extlink&oid=126901519&loc=d3e8736-108599
Reference 4: http://www.xbrl.org/2003/role/disclosureRef
-Publisher FASB
-Name Accounting Standards Codification
-Topic 220
-SubTopic 10
-Section S99
-Paragraph 2
-Subparagraph (210.5-03(11))
-URI https://asc.fasb.org/extlink&oid=126953954&loc=SL114868664-224227
Reference 5: http://fasb.org/us-gaap/role/ref/legacyRef
-Publisher FASB
-Name Accounting Standards Codification
-Topic 942
-SubTopic 220
-Section S99
-Paragraph 1
-Subparagraph (SX 210.9-04.9)
-URI https://asc.fasb.org/extlink&oid=120399700&loc=SL114874048-224260
| Name: |
us-gaap_InterestExpense |
| Namespace Prefix: |
us-gaap_ |
| Data Type: |
xbrli:monetaryItemType |
| Balance Type: |
debit |
| Period Type: |
duration |
|
| X |
- DefinitionAmount of the cost of borrowed funds accounted for as interest expense for debt. Reference 1: http://www.xbrl.org/2003/role/disclosureRef
-Publisher FASB
-Name Accounting Standards Codification
-Topic 470
-SubTopic 20
-Section 50
-Paragraph 6
-Subparagraph (b)
-URI https://asc.fasb.org/extlink&oid=123466204&loc=SL6036836-161870
Reference 2: http://fasb.org/us-gaap/role/ref/legacyRef
-Publisher FASB
-Name Accounting Standards Codification
-Topic 220
-SubTopic 10
-Section S99
-Paragraph 2
-Subparagraph (SX 210.5-03.8)
-URI https://asc.fasb.org/extlink&oid=126953954&loc=SL114868664-224227
Reference 3: http://www.xbrl.org/2003/role/exampleRef
-Publisher FASB
-Name Accounting Standards Codification
-Topic 470
-SubTopic 20
-Section 55
-Paragraph 69F
-URI https://asc.fasb.org/extlink&oid=123466577&loc=SL123495745-112612
Reference 4: http://www.xbrl.org/2003/role/exampleRef
-Publisher FASB
-Name Accounting Standards Codification
-Topic 470
-SubTopic 20
-Section 55
-Paragraph 69E
-URI https://asc.fasb.org/extlink&oid=123466577&loc=SL123495743-112612
Reference 5: http://www.xbrl.org/2003/role/disclosureRef
-Publisher FASB
-Name Accounting Standards Codification
-Topic 470
-SubTopic 20
-Section 50
-Paragraph 1F
-Subparagraph (b)
-URI https://asc.fasb.org/extlink&oid=123466505&loc=SL123495355-112611
| Name: |
us-gaap_InterestExpenseDebt |
| Namespace Prefix: |
us-gaap_ |
| Data Type: |
xbrli:monetaryItemType |
| Balance Type: |
debit |
| Period Type: |
duration |
|
| X |
- DefinitionThe interest rate applicable to the portion of the carrying amount of long-term borrowings outstanding as of the balance sheet date, including current maturities, which accrues interest at a set, unchanging rate. Reference 1: http://fasb.org/us-gaap/role/ref/legacyRef
-Publisher FASB
-Name Accounting Standards Codification
-Topic 210
-SubTopic 10
-Section S99
-Paragraph 1
-Subparagraph (SX 210.5-02.22(a)(1))
-URI https://asc.fasb.org/extlink&oid=120391452&loc=d3e13212-122682
| Name: |
us-gaap_LongTermDebtPercentageBearingFixedInterestRate |
| Namespace Prefix: |
us-gaap_ |
| Data Type: |
dtr-types:percentItemType |
| Balance Type: |
na |
| Period Type: |
instant |
|
| X |
- DefinitionThe cash inflow from a borrowing supported by a written promise to pay an obligation. Reference 1: http://fasb.org/us-gaap/role/ref/legacyRef
-Publisher FASB
-Name Accounting Standards Codification
-Topic 230
-SubTopic 10
-Section 45
-Paragraph 14
-Subparagraph (b)
-URI https://asc.fasb.org/extlink&oid=126954810&loc=d3e3255-108585
| Name: |
us-gaap_ProceedsFromNotesPayable |
| Namespace Prefix: |
us-gaap_ |
| Data Type: |
xbrli:monetaryItemType |
| Balance Type: |
debit |
| Period Type: |
duration |
|
| X |
- DefinitionThe excess of the (1) fair value of consideration transferred to the holders of a security in excess of (2) the carrying amount of the security reported on the registrant's balance sheet, which will be deducted from net earnings to derive net earnings available to common shareholders. This amount is generally an adjustment considered in the computation of earnings per share.
| Name: |
us-gaap_RedemptionPremium |
| Namespace Prefix: |
us-gaap_ |
| Data Type: |
xbrli:monetaryItemType |
| Balance Type: |
debit |
| Period Type: |
duration |
|
| X |
- DefinitionThe cash outflow during the period from the repayment of aggregate short-term and long-term debt. Excludes payment of capital lease obligations. Reference 1: http://www.xbrl.org/2009/role/commonPracticeRef
-Publisher FASB
-Name Accounting Standards Codification
-Topic 230
-SubTopic 10
-Section 45
-Paragraph 15
-Subparagraph (b)
-URI https://asc.fasb.org/extlink&oid=126954810&loc=d3e3291-108585
| Name: |
us-gaap_RepaymentsOfDebt |
| Namespace Prefix: |
us-gaap_ |
| Data Type: |
xbrli:monetaryItemType |
| Balance Type: |
credit |
| Period Type: |
duration |
|
| X |
- DefinitionThe cash outflow for a borrowing supported by a written promise to pay an obligation. Reference 1: http://fasb.org/us-gaap/role/ref/legacyRef
-Publisher FASB
-Name Accounting Standards Codification
-Topic 230
-SubTopic 10
-Section 45
-Paragraph 15
-Subparagraph (b)
-URI https://asc.fasb.org/extlink&oid=126954810&loc=d3e3291-108585
| Name: |
us-gaap_RepaymentsOfNotesPayable |
| Namespace Prefix: |
us-gaap_ |
| Data Type: |
xbrli:monetaryItemType |
| Balance Type: |
credit |
| Period Type: |
duration |
|
| X |
- DefinitionLine items represent financial concepts included in a table. These concepts are used to disclose reportable information associated with domain members defined in one or many axes to the table.
| Name: |
us-gaap_ShortTermDebtLineItems |
| Namespace Prefix: |
us-gaap_ |
| Data Type: |
xbrli:stringItemType |
| Balance Type: |
na |
| Period Type: |
duration |
|
| X |
- DefinitionNumber of new stock issued during the period. Reference 1: http://fasb.org/us-gaap/role/ref/legacyRef
-Publisher FASB
-Name Accounting Standards Codification
-Topic 210
-SubTopic 10
-Section S99
-Paragraph 1
-Subparagraph (SX 210.5-02(29))
-URI https://asc.fasb.org/extlink&oid=120391452&loc=d3e13212-122682
Reference 2: http://fasb.org/us-gaap/role/ref/legacyRef
-Publisher FASB
-Name Accounting Standards Codification
-Topic 505
-SubTopic 10
-Section 50
-Paragraph 2
-URI https://asc.fasb.org/extlink&oid=126973232&loc=d3e21463-112644
Reference 3: http://fasb.org/us-gaap/role/ref/legacyRef
-Publisher FASB
-Name Accounting Standards Codification
-Topic 505
-SubTopic 10
-Section S99
-Paragraph 1
-Subparagraph (SX 210.3-04)
-URI https://asc.fasb.org/extlink&oid=120397183&loc=d3e187085-122770
Reference 4: http://fasb.org/us-gaap/role/ref/legacyRef
-Publisher FASB
-Name Accounting Standards Codification
-Topic 210
-SubTopic 10
-Section S99
-Paragraph 1
-Subparagraph (SX 210.5-02(28))
-URI https://asc.fasb.org/extlink&oid=120391452&loc=d3e13212-122682
| Name: |
us-gaap_StockIssuedDuringPeriodSharesNewIssues |
| Namespace Prefix: |
us-gaap_ |
| Data Type: |
xbrli:sharesItemType |
| Balance Type: |
na |
| Period Type: |
duration |
|
| X |
- DefinitionIncluding the current and noncurrent portions, carrying value as of the balance sheet date of uncollateralized debt obligations (with maturities initially due after one year or beyond the operating cycle if longer). Reference 1: http://fasb.org/us-gaap/role/ref/legacyRef
-Publisher FASB
-Name Accounting Standards Codification
-Topic 210
-SubTopic 10
-Section S99
-Paragraph 1
-Subparagraph (SX 210.5-02(22))
-URI https://asc.fasb.org/extlink&oid=120391452&loc=d3e13212-122682
Reference 2: http://fasb.org/us-gaap/role/ref/legacyRef
-Publisher FASB
-Name Accounting Standards Codification
-Topic 942
-SubTopic 210
-Section S99
-Paragraph 1
-Subparagraph (SX 210.9-03(16))
-URI https://asc.fasb.org/extlink&oid=126897435&loc=d3e534808-122878
Reference 3: http://fasb.org/us-gaap/role/ref/legacyRef
-Publisher FASB
-Name Accounting Standards Codification
-Topic 944
-SubTopic 210
-Section S99
-Paragraph 1
-Subparagraph (SX 210.7-03(a)(16))
-URI https://asc.fasb.org/extlink&oid=126734703&loc=d3e572229-122910
| Name: |
us-gaap_UnsecuredDebt |
| Namespace Prefix: |
us-gaap_ |
| Data Type: |
xbrli:monetaryItemType |
| Balance Type: |
credit |
| Period Type: |
instant |
|
| X |
- Details
| Name: |
us-gaap_TypeOfArrangementAxis=DSGT_SharePurchaseAgreementMember |
| Namespace Prefix: |
|
| Data Type: |
na |
| Balance Type: |
|
| Period Type: |
|
|
| X |
- Details
| Name: |
srt_RangeAxis=srt_MinimumMember |
| Namespace Prefix: |
|
| Data Type: |
na |
| Balance Type: |
|
| Period Type: |
|
|
| X |
- Details
| Name: |
srt_RangeAxis=srt_MaximumMember |
| Namespace Prefix: |
|
| Data Type: |
na |
| Balance Type: |
|
| Period Type: |
|
|
| X |
- Details
| Name: |
us-gaap_ShortTermDebtTypeAxis=DSGT_ConvertiblePomissoryNotesMember |
| Namespace Prefix: |
|
| Data Type: |
na |
| Balance Type: |
|
| Period Type: |
|
|
| X |
- Details
| Name: |
us-gaap_DebtInstrumentAxis=DSGT_CanadaEmergencyBusinessAccountProgramMember |
| Namespace Prefix: |
|
| Data Type: |
na |
| Balance Type: |
|
| Period Type: |
|
|
| X |
- Details
| Name: |
us-gaap_DebtInstrumentAxis=DSGT_PaycheckProtectionProgramMember |
| Namespace Prefix: |
|
| Data Type: |
na |
| Balance Type: |
|
| Period Type: |
|
|
| X |
- Details
| Name: |
us-gaap_UnderlyingAssetClassAxis=us-gaap_LoansPayableMember |
| Namespace Prefix: |
|
| Data Type: |
na |
| Balance Type: |
|
| Period Type: |
|
|
| X |
- Details
| Name: |
us-gaap_UnderlyingAssetClassAxis=DSGT_LoansPayableOneMember |
| Namespace Prefix: |
|
| Data Type: |
na |
| Balance Type: |
|
| Period Type: |
|
|
| X |
- Details
| Name: |
us-gaap_UnderlyingAssetClassAxis=DSGT_LoansPayableTwoMember |
| Namespace Prefix: |
|
| Data Type: |
na |
| Balance Type: |
|
| Period Type: |
|
|
| X |
- Details
| Name: |
us-gaap_UnderlyingAssetClassAxis=DSGT_LoansPayableThreeMember |
| Namespace Prefix: |
|
| Data Type: |
na |
| Balance Type: |
|
| Period Type: |
|
|
| X |
- Details
| Name: |
us-gaap_UnderlyingAssetClassAxis=DSGT_LoansPayableFourMember |
| Namespace Prefix: |
|
| Data Type: |
na |
| Balance Type: |
|
| Period Type: |
|
|
| X |
- Details
| Name: |
us-gaap_UnderlyingAssetClassAxis=DSGT_LoansPayableFiveMember |
| Namespace Prefix: |
|
| Data Type: |
na |
| Balance Type: |
|
| Period Type: |
|
|
v3.23.2
SCHEDULE OF LOANS PAYABLE (Details) - USD ($)
|
Dec. 31, 2022 |
Dec. 31, 2021 |
| Guarantor Obligations [Line Items] |
|
|
|
| Loans payable |
|
$ 2,566,692
|
$ 2,327,947
|
| Current portion |
|
(2,416,692)
|
(2,115,049)
|
| Loans payable |
|
150,000
|
212,898
|
| Loans Payable [Member] |
|
|
|
| Guarantor Obligations [Line Items] |
|
|
|
| Loans payable |
[1] |
29,520
|
31,449
|
| Loans Payable One [Member] |
|
|
|
| Guarantor Obligations [Line Items] |
|
|
|
| Loans payable |
[2] |
29,520
|
31,449
|
| Loans Payable Two [Member] |
|
|
|
| Guarantor Obligations [Line Items] |
|
|
|
| Loans payable |
[3] |
|
30,115
|
| Loans Payable Three [Member] |
|
|
|
| Guarantor Obligations [Line Items] |
|
|
|
| Loans payable |
[4] |
150,000
|
150,000
|
| Loans Payable Four [Member] |
|
|
|
| Guarantor Obligations [Line Items] |
|
|
|
| Loans payable |
[5] |
|
2,084,934
|
| Loans Payable Five [Member] |
|
|
|
| Guarantor Obligations [Line Items] |
|
|
|
| Loans payable |
[6] |
1,000,000
|
|
| Loans Payable Six [Member] |
|
|
|
| Guarantor Obligations [Line Items] |
|
|
|
| Loans payable |
[7] |
$ 1,357,651
|
|
|
|
| X |
- DefinitionLine items represent financial concepts included in a table. These concepts are used to disclose reportable information associated with domain members defined in one or many axes to the table.
| Name: |
us-gaap_GuaranteeObligationsLineItems |
| Namespace Prefix: |
us-gaap_ |
| Data Type: |
xbrli:stringItemType |
| Balance Type: |
na |
| Period Type: |
duration |
|
| X |
- DefinitionIncluding the current and noncurrent portions, aggregate carrying value as of the balance sheet date of loans payable (with maturities initially due after one year or beyond the operating cycle if longer). Reference 1: http://fasb.org/us-gaap/role/ref/legacyRef
-Publisher FASB
-Name Accounting Standards Codification
-Topic 942
-SubTopic 210
-Section S99
-Paragraph 1
-Subparagraph (SX 210.9-03(16))
-URI https://asc.fasb.org/extlink&oid=126897435&loc=d3e534808-122878
Reference 2: http://fasb.org/us-gaap/role/ref/legacyRef
-Publisher FASB
-Name Accounting Standards Codification
-Topic 210
-SubTopic 10
-Section S99
-Paragraph 1
-Subparagraph (SX 210.5-02(22))
-URI https://asc.fasb.org/extlink&oid=120391452&loc=d3e13212-122682
Reference 3: http://fasb.org/us-gaap/role/ref/legacyRef
-Publisher FASB
-Name Accounting Standards Codification
-Topic 944
-SubTopic 210
-Section S99
-Paragraph 1
-Subparagraph (SX 210.7-03(16)(a)(2))
-URI https://asc.fasb.org/extlink&oid=126734703&loc=d3e572229-122910
| Name: |
us-gaap_LoansPayable |
| Namespace Prefix: |
us-gaap_ |
| Data Type: |
xbrli:monetaryItemType |
| Balance Type: |
credit |
| Period Type: |
instant |
|
| X |
- DefinitionCarrying value as of the balance sheet date of portion of long-term loans payable due within one year or the operating cycle if longer. Reference 1: http://fasb.org/us-gaap/role/ref/legacyRef
-Publisher FASB
-Name Accounting Standards Codification
-Topic 210
-SubTopic 10
-Section S99
-Paragraph 1
-Subparagraph (SX 210.5-02.20)
-URI https://asc.fasb.org/extlink&oid=120391452&loc=d3e13212-122682
| Name: |
us-gaap_LoansPayableCurrent |
| Namespace Prefix: |
us-gaap_ |
| Data Type: |
xbrli:monetaryItemType |
| Balance Type: |
credit |
| Period Type: |
instant |
|
| X |
- DefinitionCarrying value as of the balance sheet date of loans payable (with maturities initially due after one year or beyond the operating cycle if longer), excluding current portion. Reference 1: http://fasb.org/us-gaap/role/ref/legacyRef
-Publisher FASB
-Name Accounting Standards Codification
-Topic 210
-SubTopic 10
-Section S99
-Paragraph 1
-Subparagraph (SX 210.5-02.22)
-URI https://asc.fasb.org/extlink&oid=120391452&loc=d3e13212-122682
| Name: |
us-gaap_LongTermLoansPayable |
| Namespace Prefix: |
us-gaap_ |
| Data Type: |
xbrli:monetaryItemType |
| Balance Type: |
credit |
| Period Type: |
instant |
|
| X |
- Details
| Name: |
us-gaap_UnderlyingAssetClassAxis=us-gaap_LoansPayableMember |
| Namespace Prefix: |
|
| Data Type: |
na |
| Balance Type: |
|
| Period Type: |
|
|
| X |
- Details
| Name: |
us-gaap_UnderlyingAssetClassAxis=DSGT_LoansPayableOneMember |
| Namespace Prefix: |
|
| Data Type: |
na |
| Balance Type: |
|
| Period Type: |
|
|
| X |
- Details
| Name: |
us-gaap_UnderlyingAssetClassAxis=DSGT_LoansPayableTwoMember |
| Namespace Prefix: |
|
| Data Type: |
na |
| Balance Type: |
|
| Period Type: |
|
|
| X |
- Details
| Name: |
us-gaap_UnderlyingAssetClassAxis=DSGT_LoansPayableThreeMember |
| Namespace Prefix: |
|
| Data Type: |
na |
| Balance Type: |
|
| Period Type: |
|
|
| X |
- Details
| Name: |
us-gaap_UnderlyingAssetClassAxis=DSGT_LoansPayableFourMember |
| Namespace Prefix: |
|
| Data Type: |
na |
| Balance Type: |
|
| Period Type: |
|
|
| X |
- Details
| Name: |
us-gaap_UnderlyingAssetClassAxis=DSGT_LoansPayableFiveMember |
| Namespace Prefix: |
|
| Data Type: |
na |
| Balance Type: |
|
| Period Type: |
|
|
| X |
- Details
| Name: |
us-gaap_UnderlyingAssetClassAxis=DSGT_LoansPayableSixMember |
| Namespace Prefix: |
|
| Data Type: |
na |
| Balance Type: |
|
| Period Type: |
|
|
v3.23.2
CONVERTIBLE LOANS (Details Narrative) - USD ($)
|
Dec. 31, 2022 |
Dec. 01, 2022 |
Dec. 31, 2021 |
Jun. 05, 2020 |
Jun. 05, 2017 |
Mar. 31, 2015 |
| Short-Term Debt [Line Items] |
|
|
|
|
|
|
| Debt instrument face value |
|
$ 1,000,000
|
|
$ 150,000
|
|
|
| Debt instrument interest rate |
|
|
|
3.75%
|
|
|
| Convertible promissory note carrying amount |
$ 2,400,000
|
|
|
|
|
|
| Convertible Promissory Note [Member] |
|
|
|
|
|
|
| Short-Term Debt [Line Items] |
|
|
|
|
|
|
| Debt instrument face value |
|
|
|
|
$ 110,000
|
|
| Convertible debt |
9,488
|
|
$ 9,439
|
|
|
|
| Director [Member] |
|
|
|
|
|
|
| Short-Term Debt [Line Items] |
|
|
|
|
|
|
| Debt instrument face value |
$ 310,000
|
|
$ 310,000
|
|
|
$ 310,000
|
| Debt instrument interest rate |
|
|
|
|
|
5.00%
|
| Debt conversion price per share |
|
|
|
|
|
$ 1.25
|
| X |
- DefinitionIncluding the current and noncurrent portions, carrying amount of debt identified as being convertible into another form of financial instrument (typically the entity's common stock) as of the balance sheet date, which originally required full repayment more than twelve months after issuance or greater than the normal operating cycle of the company. Reference 1: http://fasb.org/us-gaap/role/ref/legacyRef
-Publisher FASB
-Name Accounting Standards Codification
-Topic 944
-SubTopic 210
-Section S99
-Paragraph 1
-Subparagraph (SX 210.7-03(a)(16))
-URI https://asc.fasb.org/extlink&oid=126734703&loc=d3e572229-122910
Reference 2: http://fasb.org/us-gaap/role/ref/legacyRef
-Publisher FASB
-Name Accounting Standards Codification
-Topic 210
-SubTopic 10
-Section S99
-Paragraph 1
-Subparagraph (SX 210.5-02(22))
-URI https://asc.fasb.org/extlink&oid=120391452&loc=d3e13212-122682
Reference 3: http://fasb.org/us-gaap/role/ref/legacyRef
-Publisher FASB
-Name Accounting Standards Codification
-Topic 942
-SubTopic 210
-Section S99
-Paragraph 1
-Subparagraph (SX 210.9-03(16))
-URI https://asc.fasb.org/extlink&oid=126897435&loc=d3e534808-122878
| Name: |
us-gaap_ConvertibleDebt |
| Namespace Prefix: |
us-gaap_ |
| Data Type: |
xbrli:monetaryItemType |
| Balance Type: |
credit |
| Period Type: |
instant |
|
| X |
- DefinitionAmount, before unamortized (discount) premium and debt issuance costs, of long-term debt. Includes, but is not limited to, notes payable, bonds payable, commercial loans, mortgage loans, convertible debt, subordinated debt and other types of debt. Reference 1: http://www.xbrl.org/2003/role/disclosureRef
-Publisher FASB
-Name Accounting Standards Codification
-Topic 470
-SubTopic 20
-Section 50
-Paragraph 4
-Subparagraph (b)(1)
-URI https://asc.fasb.org/extlink&oid=123466204&loc=SL6031897-161870
Reference 2: http://fasb.org/us-gaap/role/ref/legacyRef
-Publisher FASB
-Name Accounting Standards Codification
-Topic 944
-SubTopic 210
-Section S99
-Paragraph 1
-Subparagraph (SX 210.7-03(16))
-URI https://asc.fasb.org/extlink&oid=126734703&loc=d3e572229-122910
Reference 3: http://fasb.org/us-gaap/role/ref/legacyRef
-Publisher FASB
-Name Accounting Standards Codification
-Topic 210
-SubTopic 10
-Section S99
-Paragraph 1
-Subparagraph (SX 210.5-02(22))
-URI https://asc.fasb.org/extlink&oid=120391452&loc=d3e13212-122682
Reference 4: http://fasb.org/us-gaap/role/ref/legacyRef
-Publisher FASB
-Name Accounting Standards Codification
-Topic 942
-SubTopic 210
-Section S99
-Paragraph 1
-Subparagraph (SX 210.9-03(16))
-URI https://asc.fasb.org/extlink&oid=126897435&loc=d3e534808-122878
| Name: |
us-gaap_DebtInstrumentCarryingAmount |
| Namespace Prefix: |
us-gaap_ |
| Data Type: |
xbrli:monetaryItemType |
| Balance Type: |
credit |
| Period Type: |
instant |
|
| X |
- DefinitionThe price per share of the conversion feature embedded in the debt instrument. Reference 1: http://fasb.org/us-gaap/role/ref/legacyRef
-Publisher FASB
-Name Accounting Standards Codification
-Topic 470
-SubTopic 20
-Section 50
-Paragraph 5
-Subparagraph (b)
-URI https://asc.fasb.org/extlink&oid=123466204&loc=SL6031898-161870
Reference 2: http://www.xbrl.org/2003/role/disclosureRef
-Publisher FASB
-Name Accounting Standards Codification
-Topic 470
-SubTopic 20
-Section 50
-Paragraph 1B
-Subparagraph (c)
-URI https://asc.fasb.org/extlink&oid=123466505&loc=SL123495323-112611
| Name: |
us-gaap_DebtInstrumentConvertibleConversionPrice1 |
| Namespace Prefix: |
us-gaap_ |
| Data Type: |
dtr-types:perShareItemType |
| Balance Type: |
na |
| Period Type: |
instant |
|
| X |
- DefinitionFace (par) amount of debt instrument at time of issuance. Reference 1: http://www.xbrl.org/2003/role/disclosureRef
-Publisher FASB
-Name Accounting Standards Codification
-Topic 470
-SubTopic 20
-Section 50
-Paragraph 1B
-Subparagraph (a)
-URI https://asc.fasb.org/extlink&oid=123466505&loc=SL123495323-112611
Reference 2: http://fasb.org/us-gaap/role/ref/legacyRef
-Publisher FASB
-Name Accounting Standards Codification
-Topic 835
-SubTopic 30
-Section 45
-Paragraph 2
-URI https://asc.fasb.org/extlink&oid=124435984&loc=d3e28551-108399
Reference 3: http://fasb.org/us-gaap/role/ref/legacyRef
-Publisher FASB
-Name Accounting Standards Codification
-Topic 835
-SubTopic 30
-Section 55
-Paragraph 8
-URI https://asc.fasb.org/extlink&oid=114775985&loc=d3e28878-108400
Reference 4: http://www.xbrl.org/2003/role/disclosureRef
-Publisher FASB
-Name Accounting Standards Codification
-Topic 835
-SubTopic 30
-Section 50
-Paragraph 1
-URI https://asc.fasb.org/extlink&oid=124429444&loc=SL124452920-239629
Reference 5: http://www.xbrl.org/2003/role/exampleRef
-Publisher FASB
-Name Accounting Standards Codification
-Topic 470
-SubTopic 20
-Section 55
-Paragraph 69C
-URI https://asc.fasb.org/extlink&oid=123466577&loc=SL123495737-112612
Reference 6: http://www.xbrl.org/2003/role/exampleRef
-Publisher FASB
-Name Accounting Standards Codification
-Topic 470
-SubTopic 20
-Section 55
-Paragraph 69B
-URI https://asc.fasb.org/extlink&oid=123466577&loc=SL123495735-112612
| Name: |
us-gaap_DebtInstrumentFaceAmount |
| Namespace Prefix: |
us-gaap_ |
| Data Type: |
xbrli:monetaryItemType |
| Balance Type: |
credit |
| Period Type: |
instant |
|
| X |
- DefinitionContractual interest rate for funds borrowed, under the debt agreement. Reference 1: http://www.xbrl.org/2003/role/disclosureRef
-Publisher FASB
-Name Accounting Standards Codification
-Topic 470
-SubTopic 20
-Section 50
-Paragraph 1B
-Subparagraph (b)
-URI https://asc.fasb.org/extlink&oid=123466505&loc=SL123495323-112611
Reference 2: http://fasb.org/us-gaap/role/ref/legacyRef
-Publisher FASB
-Name Accounting Standards Codification
-Topic 210
-SubTopic 10
-Section S99
-Paragraph 1
-Subparagraph (SX 210.5-02.22(a)(1))
-URI https://asc.fasb.org/extlink&oid=120391452&loc=d3e13212-122682
| Name: |
us-gaap_DebtInstrumentInterestRateStatedPercentage |
| Namespace Prefix: |
us-gaap_ |
| Data Type: |
dtr-types:percentItemType |
| Balance Type: |
na |
| Period Type: |
instant |
|
| X |
- DefinitionLine items represent financial concepts included in a table. These concepts are used to disclose reportable information associated with domain members defined in one or many axes to the table.
| Name: |
us-gaap_ShortTermDebtLineItems |
| Namespace Prefix: |
us-gaap_ |
| Data Type: |
xbrli:stringItemType |
| Balance Type: |
na |
| Period Type: |
duration |
|
| X |
- Details
| Name: |
us-gaap_DebtInstrumentAxis=DSGT_ConvertiblePromissoryNoteMember |
| Namespace Prefix: |
|
| Data Type: |
na |
| Balance Type: |
|
| Period Type: |
|
|
| X |
- Details
| Name: |
srt_TitleOfIndividualAxis=srt_DirectorMember |
| Namespace Prefix: |
|
| Data Type: |
na |
| Balance Type: |
|
| Period Type: |
|
|
v3.23.2
SCHEDULE OF LEASE RECEIVABLES RECOGNIZED (Details) - USD ($)
|
12 Months Ended |
Dec. 31, 2022 |
Dec. 31, 2021 |
| Leases |
|
|
| Balance, beginning of the period |
$ 810,236
|
$ 42,856
|
| Additions |
143,630
|
937,850
|
| Transfer to third party |
(867,450)
|
(120,231)
|
| Interest on lease receivables |
20,841
|
19,452
|
| Receipt of payments |
(81,979)
|
(60,445)
|
| Foreign exchange |
(5,733)
|
(9,246)
|
| Balance, end of the period |
19,545
|
810,236
|
| Current portion of lease receivables |
(3,627)
|
(87,020)
|
| Long term potion of lease receivables |
$ 15,918
|
$ 723,216
|
| X |
- References
+ Details
| Name: |
DSGT_DisclosureLeasesAbstract |
| Namespace Prefix: |
DSGT_ |
| Data Type: |
xbrli:stringItemType |
| Balance Type: |
na |
| Period Type: |
duration |
|
| X |
- Definition
+ References
+ Details
| Name: |
DSGT_SalesTypeLeaseAdditions |
| Namespace Prefix: |
DSGT_ |
| Data Type: |
xbrli:monetaryItemType |
| Balance Type: |
debit |
| Period Type: |
duration |
|
| X |
- DefinitionSales type lease foreign exchange.
| Name: |
DSGT_SalesTypeLeaseForeignExchange |
| Namespace Prefix: |
DSGT_ |
| Data Type: |
xbrli:monetaryItemType |
| Balance Type: |
credit |
| Period Type: |
duration |
|
| X |
- DefinitionSales type lease interest on lease receivables.
| Name: |
DSGT_SalesTypeLeaseInterestOnLeaseReceivables |
| Namespace Prefix: |
DSGT_ |
| Data Type: |
xbrli:monetaryItemType |
| Balance Type: |
debit |
| Period Type: |
duration |
|
| X |
- DefinitionSales type lease transfer to third party.
| Name: |
DSGT_SalesTypeLeaseTransferToThirdParty |
| Namespace Prefix: |
DSGT_ |
| Data Type: |
xbrli:monetaryItemType |
| Balance Type: |
credit |
| Period Type: |
duration |
|
| X |
- DefinitionAmount, before allowance for credit loss, of net investment in sales-type and direct financing leases, classified as current. Reference 1: http://www.xbrl.org/2003/role/disclosureRef
-Publisher FASB
-Name Accounting Standards Codification
-Topic 842
-SubTopic 30
-Section 45
-Paragraph 1
-URI https://asc.fasb.org/extlink&oid=123420820&loc=SL77919306-209978
Reference 2: http://www.xbrl.org/2003/role/disclosureRef
-Publisher FASB
-Name Accounting Standards Codification
-Topic 842
-SubTopic 30
-Section 45
-Paragraph 2
-URI https://asc.fasb.org/extlink&oid=123420820&loc=SL77919308-209978
Reference 3: http://www.xbrl.org/2009/role/commonPracticeRef
-Publisher FASB
-Name Accounting Standards Codification
-Topic 326
-SubTopic 20
-Section 45
-Paragraph 1
-URI https://asc.fasb.org/extlink&oid=124255206&loc=SL82895884-210446
| Name: |
us-gaap_NetInvestmentInLeaseCurrent |
| Namespace Prefix: |
us-gaap_ |
| Data Type: |
xbrli:monetaryItemType |
| Balance Type: |
debit |
| Period Type: |
instant |
|
| X |
- DefinitionAmount, before allowance for credit loss, of net investment in sales-type and direct financing leases, classified as noncurrent. Reference 1: http://www.xbrl.org/2003/role/disclosureRef
-Publisher FASB
-Name Accounting Standards Codification
-Topic 842
-SubTopic 30
-Section 45
-Paragraph 1
-URI https://asc.fasb.org/extlink&oid=123420820&loc=SL77919306-209978
Reference 2: http://www.xbrl.org/2009/role/commonPracticeRef
-Publisher FASB
-Name Accounting Standards Codification
-Topic 326
-SubTopic 20
-Section 45
-Paragraph 1
-URI https://asc.fasb.org/extlink&oid=124255206&loc=SL82895884-210446
Reference 3: http://www.xbrl.org/2003/role/disclosureRef
-Publisher FASB
-Name Accounting Standards Codification
-Topic 842
-SubTopic 30
-Section 45
-Paragraph 2
-URI https://asc.fasb.org/extlink&oid=123420820&loc=SL77919308-209978
| Name: |
us-gaap_NetInvestmentInLeaseNoncurrent |
| Namespace Prefix: |
us-gaap_ |
| Data Type: |
xbrli:monetaryItemType |
| Balance Type: |
debit |
| Period Type: |
instant |
|
| X |
- DefinitionPresent value of lease payments not yet received by lessor and amount expected to be derived from underlying asset, following end of lease term guaranteed by lessee or other third party unrelated to lessor, from sales-type lease. Reference 1: http://www.xbrl.org/2003/role/disclosureRef
-Publisher FASB
-Name Accounting Standards Codification
-Topic 842
-SubTopic 30
-Section 50
-Paragraph 6
-URI https://asc.fasb.org/extlink&oid=124258985&loc=SL77919379-209981
| Name: |
us-gaap_SalesTypeLeaseLeaseReceivable |
| Namespace Prefix: |
us-gaap_ |
| Data Type: |
xbrli:monetaryItemType |
| Balance Type: |
debit |
| Period Type: |
instant |
|
v3.23.2
SCHEDULE OF CONSOLIDATED BALANCE SHEET OF LEASE (Details) - USD ($)
|
Dec. 31, 2022 |
Dec. 31, 2021 |
| Leases |
|
|
| Cost |
$ 312,318
|
$ 312,318
|
| Accumulated depreciation |
(282,251)
|
(170,530)
|
| Foreign exchange |
(506)
|
29
|
| Total right-of-use assets |
29,561
|
141,880
|
| Current portion |
35,670
|
121,270
|
| Long-term portion |
4,982
|
38,696
|
| Total lease liability |
$ 40,652
|
$ 159,966
|
| X |
- References
+ Details
| Name: |
DSGT_DisclosureLeasesAbstract |
| Namespace Prefix: |
DSGT_ |
| Data Type: |
xbrli:stringItemType |
| Balance Type: |
na |
| Period Type: |
duration |
|
| X |
- DefinitionAccumulated amortization of operating lease right of use asset.
| Name: |
DSGT_OperatingLeaseRightOfUseAssetAmortization |
| Namespace Prefix: |
DSGT_ |
| Data Type: |
xbrli:monetaryItemType |
| Balance Type: |
credit |
| Period Type: |
instant |
|
| X |
- DefinitionCost of operating lease right of use asset.
| Name: |
DSGT_OperatingLeaseRightOfUseAssetCost |
| Namespace Prefix: |
DSGT_ |
| Data Type: |
xbrli:monetaryItemType |
| Balance Type: |
debit |
| Period Type: |
instant |
|
| X |
- Definition
+ References
+ Details
| Name: |
DSGT_OperatingLeaseRightOfUseAssetForeignExchange |
| Namespace Prefix: |
DSGT_ |
| Data Type: |
xbrli:monetaryItemType |
| Balance Type: |
debit |
| Period Type: |
instant |
|
| X |
- DefinitionPresent value of lessee's discounted obligation for lease payments from operating lease. Reference 1: http://www.xbrl.org/2003/role/disclosureRef
-Publisher FASB
-Name Accounting Standards Codification
-Topic 842
-SubTopic 20
-Section 45
-Paragraph 1
-Subparagraph (b)
-URI https://asc.fasb.org/extlink&oid=123391704&loc=SL77918627-209977
| Name: |
us-gaap_OperatingLeaseLiability |
| Namespace Prefix: |
us-gaap_ |
| Data Type: |
xbrli:monetaryItemType |
| Balance Type: |
credit |
| Period Type: |
instant |
|
| X |
- DefinitionPresent value of lessee's discounted obligation for lease payments from operating lease, classified as current. Reference 1: http://www.xbrl.org/2003/role/disclosureRef
-Publisher FASB
-Name Accounting Standards Codification
-Topic 842
-SubTopic 20
-Section 45
-Paragraph 1
-Subparagraph (b)
-URI https://asc.fasb.org/extlink&oid=123391704&loc=SL77918627-209977
| Name: |
us-gaap_OperatingLeaseLiabilityCurrent |
| Namespace Prefix: |
us-gaap_ |
| Data Type: |
xbrli:monetaryItemType |
| Balance Type: |
credit |
| Period Type: |
instant |
|
| X |
- DefinitionPresent value of lessee's discounted obligation for lease payments from operating lease, classified as noncurrent. Reference 1: http://www.xbrl.org/2003/role/disclosureRef
-Publisher FASB
-Name Accounting Standards Codification
-Topic 842
-SubTopic 20
-Section 45
-Paragraph 1
-Subparagraph (b)
-URI https://asc.fasb.org/extlink&oid=123391704&loc=SL77918627-209977
| Name: |
us-gaap_OperatingLeaseLiabilityNoncurrent |
| Namespace Prefix: |
us-gaap_ |
| Data Type: |
xbrli:monetaryItemType |
| Balance Type: |
credit |
| Period Type: |
instant |
|
| X |
- DefinitionAmount of lessee's right to use underlying asset under operating lease. Reference 1: http://www.xbrl.org/2003/role/disclosureRef
-Publisher FASB
-Name Accounting Standards Codification
-Topic 842
-SubTopic 20
-Section 45
-Paragraph 1
-Subparagraph (a)
-URI https://asc.fasb.org/extlink&oid=123391704&loc=SL77918627-209977
| Name: |
us-gaap_OperatingLeaseRightOfUseAsset |
| Namespace Prefix: |
us-gaap_ |
| Data Type: |
xbrli:monetaryItemType |
| Balance Type: |
debit |
| Period Type: |
instant |
|
v3.23.2
SCHEDULE OF FUTURE MINIMUM LEASE PAYMENTS (Details) - USD ($)
|
Dec. 31, 2022 |
Dec. 31, 2021 |
| Leases |
|
|
| 2023 |
$ 37,814
|
|
| 2024 |
4,300
|
|
| 2025 |
1,070
|
|
| Total future minimum lease payments |
43,184
|
|
| Discount |
(2,532)
|
|
| Total |
40,652
|
$ 159,966
|
| Current portion of lease liabilities |
(35,670)
|
(121,270)
|
| Long-term portion of lease liabilities |
$ 4,982
|
$ 38,696
|
| X |
- References
+ Details
| Name: |
DSGT_DisclosureLeasesAbstract |
| Namespace Prefix: |
DSGT_ |
| Data Type: |
xbrli:stringItemType |
| Balance Type: |
na |
| Period Type: |
duration |
|
| X |
- DefinitionAmount of lessee's undiscounted obligation for lease payment for operating lease. Reference 1: http://www.xbrl.org/2003/role/disclosureRef
-Publisher FASB
-Name Accounting Standards Codification
-Topic 842
-SubTopic 20
-Section 50
-Paragraph 6
-URI https://asc.fasb.org/extlink&oid=128292326&loc=SL77918701-209980
| Name: |
us-gaap_LesseeOperatingLeaseLiabilityPaymentsDue |
| Namespace Prefix: |
us-gaap_ |
| Data Type: |
xbrli:monetaryItemType |
| Balance Type: |
credit |
| Period Type: |
instant |
|
| X |
- DefinitionAmount of lessee's undiscounted obligation for lease payment for operating lease to be paid in next fiscal year following current fiscal year. Excludes interim and annual periods when interim periods are reported from current statement of financial position date (rolling approach). Reference 1: http://www.xbrl.org/2003/role/disclosureRef
-Publisher FASB
-Name Accounting Standards Codification
-Topic 842
-SubTopic 20
-Section 50
-Paragraph 6
-URI https://asc.fasb.org/extlink&oid=128292326&loc=SL77918701-209980
| Name: |
us-gaap_LesseeOperatingLeaseLiabilityPaymentsDueNextTwelveMonths |
| Namespace Prefix: |
us-gaap_ |
| Data Type: |
xbrli:monetaryItemType |
| Balance Type: |
credit |
| Period Type: |
instant |
|
| X |
- DefinitionAmount of lessee's undiscounted obligation for lease payment for operating lease to be paid in third fiscal year following current fiscal year. Excludes interim and annual periods when interim periods are reported from current statement of financial position date (rolling approach). Reference 1: http://www.xbrl.org/2003/role/disclosureRef
-Publisher FASB
-Name Accounting Standards Codification
-Topic 842
-SubTopic 20
-Section 50
-Paragraph 6
-URI https://asc.fasb.org/extlink&oid=128292326&loc=SL77918701-209980
| Name: |
us-gaap_LesseeOperatingLeaseLiabilityPaymentsDueYearThree |
| Namespace Prefix: |
us-gaap_ |
| Data Type: |
xbrli:monetaryItemType |
| Balance Type: |
credit |
| Period Type: |
instant |
|
| X |
- DefinitionAmount of lessee's undiscounted obligation for lease payment for operating lease to be paid in second fiscal year following current fiscal year. Excludes interim and annual periods when interim periods are reported from current statement of financial position date (rolling approach). Reference 1: http://www.xbrl.org/2003/role/disclosureRef
-Publisher FASB
-Name Accounting Standards Codification
-Topic 842
-SubTopic 20
-Section 50
-Paragraph 6
-URI https://asc.fasb.org/extlink&oid=128292326&loc=SL77918701-209980
| Name: |
us-gaap_LesseeOperatingLeaseLiabilityPaymentsDueYearTwo |
| Namespace Prefix: |
us-gaap_ |
| Data Type: |
xbrli:monetaryItemType |
| Balance Type: |
credit |
| Period Type: |
instant |
|
| X |
- DefinitionAmount of lessee's undiscounted obligation for lease payments in excess of discounted obligation for lease payments for operating lease. Reference 1: http://www.xbrl.org/2003/role/disclosureRef
-Publisher FASB
-Name Accounting Standards Codification
-Topic 842
-SubTopic 20
-Section 50
-Paragraph 6
-URI https://asc.fasb.org/extlink&oid=128292326&loc=SL77918701-209980
| Name: |
us-gaap_LesseeOperatingLeaseLiabilityUndiscountedExcessAmount |
| Namespace Prefix: |
us-gaap_ |
| Data Type: |
xbrli:monetaryItemType |
| Balance Type: |
credit |
| Period Type: |
instant |
|
| X |
- DefinitionPresent value of lessee's discounted obligation for lease payments from operating lease. Reference 1: http://www.xbrl.org/2003/role/disclosureRef
-Publisher FASB
-Name Accounting Standards Codification
-Topic 842
-SubTopic 20
-Section 45
-Paragraph 1
-Subparagraph (b)
-URI https://asc.fasb.org/extlink&oid=123391704&loc=SL77918627-209977
| Name: |
us-gaap_OperatingLeaseLiability |
| Namespace Prefix: |
us-gaap_ |
| Data Type: |
xbrli:monetaryItemType |
| Balance Type: |
credit |
| Period Type: |
instant |
|
| X |
- DefinitionPresent value of lessee's discounted obligation for lease payments from operating lease, classified as current. Reference 1: http://www.xbrl.org/2003/role/disclosureRef
-Publisher FASB
-Name Accounting Standards Codification
-Topic 842
-SubTopic 20
-Section 45
-Paragraph 1
-Subparagraph (b)
-URI https://asc.fasb.org/extlink&oid=123391704&loc=SL77918627-209977
| Name: |
us-gaap_OperatingLeaseLiabilityCurrent |
| Namespace Prefix: |
us-gaap_ |
| Data Type: |
xbrli:monetaryItemType |
| Balance Type: |
credit |
| Period Type: |
instant |
|
| X |
- DefinitionPresent value of lessee's discounted obligation for lease payments from operating lease, classified as noncurrent. Reference 1: http://www.xbrl.org/2003/role/disclosureRef
-Publisher FASB
-Name Accounting Standards Codification
-Topic 842
-SubTopic 20
-Section 45
-Paragraph 1
-Subparagraph (b)
-URI https://asc.fasb.org/extlink&oid=123391704&loc=SL77918627-209977
| Name: |
us-gaap_OperatingLeaseLiabilityNoncurrent |
| Namespace Prefix: |
us-gaap_ |
| Data Type: |
xbrli:monetaryItemType |
| Balance Type: |
credit |
| Period Type: |
instant |
|
v3.23.2
LEASES (Details Narrative)
|
12 Months Ended |
|
|
|
|
|
|
Dec. 31, 2022
USD ($)
|
Dec. 31, 2021
USD ($)
|
Jun. 02, 2021
USD ($)
|
Apr. 01, 2021
USD ($)
|
Jul. 14, 2020
USD ($)
|
Jul. 14, 2020
CAD ($)
|
Jul. 10, 2020
USD ($)
|
Oct. 01, 2019
USD ($)
|
| Lessee, Lease, Description [Line Items] |
|
|
|
|
|
|
|
|
| Sales lease receivables |
$ 143,630
|
$ 817,619
|
|
|
|
|
|
|
| Transfer to third party |
|
120,231
|
|
|
|
|
|
|
| Inventory |
12,240
|
492,096
|
|
|
|
|
|
|
| Lease receivables |
867,450
|
|
|
|
|
|
|
|
| Lease receivables, third parties |
863,527
|
|
|
|
|
|
|
|
| Lease sold |
867,450
|
|
|
|
|
|
|
|
| Other income and expenses |
3,923
|
|
|
|
|
|
|
|
| Operating lease, right-of-use asset |
29,561
|
141,880
|
|
|
|
|
|
|
| Operating lease liability |
$ 40,652
|
159,966
|
|
|
|
|
|
|
| Weighted average discount rate, percent |
11.98%
|
|
|
|
|
|
|
|
| General and administration, expense |
$ 118,843
|
$ 144,758
|
|
|
|
|
|
|
| FD150 Lease Agreement [Member] |
|
|
|
|
|
|
|
|
| Lessee, Lease, Description [Line Items] |
|
|
|
|
|
|
|
|
| Operating lease, right-of-use asset |
|
|
|
$ 1,018
|
|
|
|
|
| Operating lease liability |
|
|
|
$ 1,018
|
|
|
|
|
| Operating lease term |
1 year 3 months 29 days
|
|
|
|
|
|
|
|
| Trailer Lease Agreement [Member] |
|
|
|
|
|
|
|
|
| Lessee, Lease, Description [Line Items] |
|
|
|
|
|
|
|
|
| Operating lease, right-of-use asset |
|
|
$ 8,886
|
|
|
|
|
|
| Operating lease liability |
|
|
$ 8,886
|
|
|
|
|
|
| Operating lease term |
2 years 5 months 1 day
|
|
|
|
|
|
|
|
| CALIFORNIA |
|
|
|
|
|
|
|
|
| Lessee, Lease, Description [Line Items] |
|
|
|
|
|
|
|
|
| Operating lease, right-of-use asset |
|
|
|
|
|
|
$ 164,114
|
|
| Operating lease liability |
|
|
|
|
|
|
156,364
|
|
| Prepaid rent |
|
|
|
|
|
|
$ 7,750
|
|
| Surrey, BC [Member] |
|
|
|
|
|
|
|
|
| Lessee, Lease, Description [Line Items] |
|
|
|
|
|
|
|
|
| Operating lease, right-of-use asset |
|
|
|
|
$ 133,825
|
|
|
|
| Operating lease liability |
|
|
|
|
125,014
|
|
|
|
| Operating lease term |
6 months 29 days
|
|
|
|
|
|
|
|
| Prepaid rent |
|
|
|
|
$ 8,811
|
$ 11,948
|
|
|
| Copier Lease [Member] |
|
|
|
|
|
|
|
|
| Lessee, Lease, Description [Line Items] |
|
|
|
|
|
|
|
|
| Lease agreement term |
|
|
|
|
|
|
|
5 years
|
| Operating lease, right-of-use asset |
|
|
|
|
|
|
|
$ 8,683
|
| Operating lease liability |
|
|
|
|
|
|
|
$ 8,683
|
| Operating lease term |
1 year 9 months
|
|
|
|
|
|
|
|
| X |
- DefinitionIncrease decrease operating lease
| Name: |
DSGT_IncreaseDecreaseOperatingLease |
| Namespace Prefix: |
DSGT_ |
| Data Type: |
xbrli:monetaryItemType |
| Balance Type: |
credit |
| Period Type: |
duration |
|
| X |
- Definition
+ References
+ Details
| Name: |
DSGT_LeaseTransferToThirdParty |
| Namespace Prefix: |
DSGT_ |
| Data Type: |
xbrli:monetaryItemType |
| Balance Type: |
credit |
| Period Type: |
duration |
|
| X |
- DefinitionGross amount, as of the balance sheet date, of merchandise, goods, commodities, or supplies held for future sale or to be used in manufacturing, servicing or production process. Reference 1: http://www.xbrl.org/2009/role/commonPracticeRef
-Publisher FASB
-Name Accounting Standards Codification
-Topic 210
-SubTopic 10
-Section S99
-Paragraph 1
-Subparagraph (SX 210.5-02(6))
-URI https://asc.fasb.org/extlink&oid=120391452&loc=d3e13212-122682
| Name: |
us-gaap_InventoryGross |
| Namespace Prefix: |
us-gaap_ |
| Data Type: |
xbrli:monetaryItemType |
| Balance Type: |
debit |
| Period Type: |
instant |
|
| X |
- DefinitionLine items represent financial concepts included in a table. These concepts are used to disclose reportable information associated with domain members defined in one or many axes to the table.
| Name: |
us-gaap_LesseeLeaseDescriptionLineItems |
| Namespace Prefix: |
us-gaap_ |
| Data Type: |
xbrli:stringItemType |
| Balance Type: |
na |
| Period Type: |
duration |
|
| X |
- DefinitionRemaining lease term of operating lease, in 'PnYnMnDTnHnMnS' format, for example, 'P1Y5M13D' represents reported fact of one year, five months, and thirteen days. Reference 1: http://www.xbrl.org/2009/role/commonPracticeRef
-Publisher FASB
-Name Accounting Standards Codification
-Topic 842
-SubTopic 20
-Section 50
-Paragraph 3
-Subparagraph (a)(1)
-URI https://asc.fasb.org/extlink&oid=128292326&loc=SL77918673-209980
| Name: |
us-gaap_LesseeOperatingLeaseRemainingLeaseTerm |
| Namespace Prefix: |
us-gaap_ |
| Data Type: |
xbrli:durationItemType |
| Balance Type: |
na |
| Period Type: |
instant |
|
| X |
- DefinitionTerm of lessee's operating lease, in 'PnYnMnDTnHnMnS' format, for example, 'P1Y5M13D' represents reported fact of one year, five months, and thirteen days. Reference 1: http://www.xbrl.org/2009/role/commonPracticeRef
-Publisher FASB
-Name Accounting Standards Codification
-Topic 842
-SubTopic 20
-Section 50
-Paragraph 3
-Subparagraph (a)(3)
-URI https://asc.fasb.org/extlink&oid=128292326&loc=SL77918673-209980
| Name: |
us-gaap_LesseeOperatingLeaseTermOfContract |
| Namespace Prefix: |
us-gaap_ |
| Data Type: |
xbrli:durationItemType |
| Balance Type: |
na |
| Period Type: |
instant |
|
| X |
- DefinitionAmount of operating lease expense. Excludes sublease income. Reference 1: http://www.xbrl.org/2009/role/commonPracticeRef
-Publisher FASB
-Name Accounting Standards Codification
-Topic 842
-SubTopic 20
-Section 45
-Paragraph 4
-Subparagraph (b)
-URI https://asc.fasb.org/extlink&oid=123391704&loc=SL77918638-209977
| Name: |
us-gaap_OperatingLeaseExpense |
| Namespace Prefix: |
us-gaap_ |
| Data Type: |
xbrli:monetaryItemType |
| Balance Type: |
debit |
| Period Type: |
duration |
|
| X |
- DefinitionPresent value of lessee's discounted obligation for lease payments from operating lease. Reference 1: http://www.xbrl.org/2003/role/disclosureRef
-Publisher FASB
-Name Accounting Standards Codification
-Topic 842
-SubTopic 20
-Section 45
-Paragraph 1
-Subparagraph (b)
-URI https://asc.fasb.org/extlink&oid=123391704&loc=SL77918627-209977
| Name: |
us-gaap_OperatingLeaseLiability |
| Namespace Prefix: |
us-gaap_ |
| Data Type: |
xbrli:monetaryItemType |
| Balance Type: |
credit |
| Period Type: |
instant |
|
| X |
- DefinitionAmount of lessee's right to use underlying asset under operating lease. Reference 1: http://www.xbrl.org/2003/role/disclosureRef
-Publisher FASB
-Name Accounting Standards Codification
-Topic 842
-SubTopic 20
-Section 45
-Paragraph 1
-Subparagraph (a)
-URI https://asc.fasb.org/extlink&oid=123391704&loc=SL77918627-209977
| Name: |
us-gaap_OperatingLeaseRightOfUseAsset |
| Namespace Prefix: |
us-gaap_ |
| Data Type: |
xbrli:monetaryItemType |
| Balance Type: |
debit |
| Period Type: |
instant |
|
| X |
- DefinitionWeighted average discount rate for operating lease calculated at point in time. Reference 1: http://www.xbrl.org/2003/role/disclosureRef
-Publisher FASB
-Name Accounting Standards Codification
-Topic 842
-SubTopic 20
-Section 50
-Paragraph 4
-Subparagraph (g)(4)
-URI https://asc.fasb.org/extlink&oid=128292326&loc=SL77918686-209980
Reference 2: http://www.xbrl.org/2003/role/exampleRef
-Publisher FASB
-Name Accounting Standards Codification
-Topic 842
-SubTopic 20
-Section 55
-Paragraph 53
-URI https://asc.fasb.org/extlink&oid=123414884&loc=SL77918982-209971
| Name: |
us-gaap_OperatingLeaseWeightedAverageDiscountRatePercent |
| Namespace Prefix: |
us-gaap_ |
| Data Type: |
dtr-types:percentItemType |
| Balance Type: |
na |
| Period Type: |
instant |
|
| X |
- DefinitionAmount of asset related to consideration paid in advance for rent that provides economic benefits within a future period of one year or the normal operating cycle, if longer. Reference 1: http://www.xbrl.org/2003/role/exampleRef
-Publisher FASB
-Name Accounting Standards Codification
-Topic 340
-SubTopic 10
-Section 05
-Paragraph 5
-Subparagraph (c)
-URI https://asc.fasb.org/extlink&oid=126905020&loc=d3e5879-108316
Reference 2: http://www.xbrl.org/2009/role/commonPracticeRef
-Publisher FASB
-Name Accounting Standards Codification
-Topic 340
-SubTopic 10
-Section 45
-Paragraph 1
-URI https://asc.fasb.org/extlink&oid=6387103&loc=d3e6435-108320
Reference 3: http://www.xbrl.org/2003/role/exampleRef
-Publisher FASB
-Name Accounting Standards Codification
-Topic 210
-SubTopic 10
-Section 45
-Paragraph 1
-Subparagraph (g)(3)
-URI https://asc.fasb.org/extlink&oid=124098289&loc=d3e6676-107765
| Name: |
us-gaap_PrepaidRent |
| Namespace Prefix: |
us-gaap_ |
| Data Type: |
xbrli:monetaryItemType |
| Balance Type: |
debit |
| Period Type: |
instant |
|
| X |
- DefinitionAmount of undiscounted cash flows to be received by lessor for sales-type and direct financing leases. Reference 1: http://www.xbrl.org/2003/role/disclosureRef
-Publisher FASB
-Name Accounting Standards Codification
-Topic 842
-SubTopic 30
-Section 50
-Paragraph 10
-URI https://asc.fasb.org/extlink&oid=124258985&loc=SL77919391-209981
| Name: |
us-gaap_SalesTypeAndDirectFinancingLeasesLeaseReceivablePaymentsToBeReceived |
| Namespace Prefix: |
us-gaap_ |
| Data Type: |
xbrli:monetaryItemType |
| Balance Type: |
debit |
| Period Type: |
instant |
|
| X |
- Details
| Name: |
us-gaap_TypeOfArrangementAxis=DSGT_FD150LeaseAgreementMember |
| Namespace Prefix: |
|
| Data Type: |
na |
| Balance Type: |
|
| Period Type: |
|
|
| X |
- Details
| Name: |
us-gaap_TypeOfArrangementAxis=DSGT_TrailerLeaseAgreementMember |
| Namespace Prefix: |
|
| Data Type: |
na |
| Balance Type: |
|
| Period Type: |
|
|
| X |
- Details
| Name: |
srt_StatementGeographicalAxis=stpr_CA |
| Namespace Prefix: |
|
| Data Type: |
na |
| Balance Type: |
|
| Period Type: |
|
|
| X |
- Details
| Name: |
srt_StatementGeographicalAxis=DSGT_CABCMember |
| Namespace Prefix: |
|
| Data Type: |
na |
| Balance Type: |
|
| Period Type: |
|
|
| X |
- Details
| Name: |
us-gaap_LeaseContractualTermAxis=DSGT_CopierLeaseMember |
| Namespace Prefix: |
|
| Data Type: |
na |
| Balance Type: |
|
| Period Type: |
|
|
v3.23.2
SCHEDULE OF REDEEMABLE PREFERRED SHARE ACTIVITIES (Details) - USD ($)
|
12 Months Ended |
Dec. 31, 2022 |
Dec. 31, 2021 |
| Balance |
$ 3,177,210
|
|
$ 2,273,743
|
| Balance, shares |
50,804
|
|
|
| Issuance |
$ 250,000
|
|
1,986,067
|
| Converted for common shares |
(336,364)
|
|
(1,538,100)
|
| Accrued preferred stock dividends |
(455,501)
|
[1] |
455,500
|
| Balance |
$ 2,635,345
|
|
$ 3,177,210
|
| Balance, shares |
52,023
|
|
50,804
|
| Redeemable Preferred Stock [Member] |
|
|
|
| Converted for common shares |
$ 33,808
|
|
|
| Accrued preferred stock dividends |
|
|
$ 455,500
|
| Preferred Stock [Member] | Redeemable Preferred Stock [Member] |
|
|
|
| Balance |
$ 51
|
|
$ 49
|
| Balance, shares |
50,804
|
|
49,230
|
| Issuance |
|
|
$ 4
|
| Balance, shares |
1,839
|
|
3,500
|
| Converted for common shares |
|
|
$ (2)
|
| Balance, shares |
(620)
|
|
(1,926)
|
| Accrued preferred stock dividends |
|
[1] |
|
| Balance |
$ 51
|
|
$ 51
|
| Balance, shares |
52,023
|
|
50,804
|
| Additional Paid-in Capital [Member] |
|
|
|
| Balance |
$ 2,201,786
|
|
$ 1,007,895
|
| Issuance |
714,000
|
|
2,731,989
|
| Converted for common shares |
(302,556)
|
|
(1,538,098)
|
| Accrued preferred stock dividends |
(838,064)
|
[1] |
|
| Balance |
1,775,166
|
|
2,201,786
|
| Stock To be Issued [Member] |
|
|
|
| Balance |
975,373
|
|
1,265,799
|
| Issuance |
(464,000)
|
|
(745,926)
|
| Converted for common shares |
(33,808)
|
[2] |
|
| Accrued preferred stock dividends |
382,563
|
[1] |
455,500
|
| Balance |
$ 860,128
|
|
$ 975,373
|
|
|
| X |
- DefinitionTemporary equity accrued preferred stock dividends.
| Name: |
DSGT_TemporaryEquityAccruedPreferredStockDividends |
| Namespace Prefix: |
DSGT_ |
| Data Type: |
xbrli:monetaryItemType |
| Balance Type: |
credit |
| Period Type: |
duration |
|
| X |
- DefinitionTemporary equity converted for common shares.
| Name: |
DSGT_TemporaryEquityConvertedForCommonShares |
| Namespace Prefix: |
DSGT_ |
| Data Type: |
xbrli:monetaryItemType |
| Balance Type: |
credit |
| Period Type: |
duration |
|
| X |
- DefinitionTemporary equity stock converted during period shares new issues.
| Name: |
DSGT_TemporaryEquityStockConvertedDuringPeriodSharesNewIssues |
| Namespace Prefix: |
DSGT_ |
| Data Type: |
xbrli:sharesItemType |
| Balance Type: |
na |
| Period Type: |
duration |
|
| X |
- DefinitionTemporary equity stock issued during period shares new issues.
| Name: |
DSGT_TemporaryEquityStockIssuedDuringPeriodSharesNewIssues |
| Namespace Prefix: |
DSGT_ |
| Data Type: |
xbrli:sharesItemType |
| Balance Type: |
na |
| Period Type: |
duration |
|
| X |
- DefinitionCarrying amount, attributable to parent, of an entity's issued and outstanding stock which is not included within permanent equity. Temporary equity is a security with redemption features that are outside the control of the issuer, is not classified as an asset or liability in conformity with GAAP, and is not mandatorily redeemable. Includes any type of security that is redeemable at a fixed or determinable price or on a fixed or determinable date or dates, is redeemable at the option of the holder, or has conditions for redemption which are not solely within the control of the issuer. Includes stock with a put option held by an ESOP and stock redeemable by a holder only in the event of a change in control of the issuer. Reference 1: http://www.xbrl.org/2003/role/disclosureRef
-Publisher FASB
-Name Accounting Standards Codification
-Topic 470
-SubTopic 10
-Section S99
-Paragraph 1A
-Subparagraph (SX 210.13-01(a)(4)(i))
-URI https://asc.fasb.org/extlink&oid=126975872&loc=SL124442526-122756
Reference 2: http://www.xbrl.org/2003/role/disclosureRef
-Publisher FASB
-Name Accounting Standards Codification
-Topic 470
-SubTopic 10
-Section S99
-Paragraph 1A
-Subparagraph (SX 210.13-01(a)(5))
-URI https://asc.fasb.org/extlink&oid=126975872&loc=SL124442526-122756
Reference 3: http://www.xbrl.org/2003/role/disclosureRef
-Publisher FASB
-Name Accounting Standards Codification
-Topic 470
-SubTopic 10
-Section S99
-Paragraph 1A
-Subparagraph (SX 210.13-01(a)(4)(iv))
-URI https://asc.fasb.org/extlink&oid=126975872&loc=SL124442526-122756
Reference 4: http://www.xbrl.org/2003/role/disclosureRef
-Publisher FASB
-Name Accounting Standards Codification
-Topic 470
-SubTopic 10
-Section S99
-Paragraph 1B
-Subparagraph (SX 210.13-02(a)(5))
-URI https://asc.fasb.org/extlink&oid=126975872&loc=SL124442552-122756
Reference 5: http://www.xbrl.org/2003/role/disclosureRef
-Publisher FASB
-Name Accounting Standards Codification
-Topic 470
-SubTopic 10
-Section S99
-Paragraph 1B
-Subparagraph (SX 210.13-02(a)(4)(i))
-URI https://asc.fasb.org/extlink&oid=126975872&loc=SL124442552-122756
Reference 6: http://www.xbrl.org/2003/role/disclosureRef
-Publisher FASB
-Name Accounting Standards Codification
-Topic 470
-SubTopic 10
-Section S99
-Paragraph 1B
-Subparagraph (SX 210.13-02(a)(4)(iv))
-URI https://asc.fasb.org/extlink&oid=126975872&loc=SL124442552-122756
| Name: |
us-gaap_TemporaryEquityCarryingAmountAttributableToParent |
| Namespace Prefix: |
us-gaap_ |
| Data Type: |
xbrli:monetaryItemType |
| Balance Type: |
credit |
| Period Type: |
instant |
|
| X |
- DefinitionThe number of securities classified as temporary equity that have been issued and are held by the entity's shareholders. Securities outstanding equals securities issued minus securities held in treasury. Temporary equity is a security with redemption features that are outside the control of the issuer, is not classified as an asset or liability in conformity with GAAP, and is not mandatorily redeemable. Includes any type of security that is redeemable at a fixed or determinable price or on a fixed or determinable date or dates, is redeemable at the option of the holder, or has conditions for redemption which are not solely within the control of the issuer. If convertible, the issuer does not control the actions or events necessary to issue the maximum number of shares that could be required to be delivered under the conversion option if the holder exercises the option to convert the stock to another class of equity. If the security is a warrant or a rights issue, the warrant or rights issue is considered to be temporary equity if the issuer cannot demonstrate that it would be able to deliver upon the exercise of the option by the holder in all cases. Includes stock with put option held by ESOP and stock redeemable by holder only in the event of a change in control of the issuer. Reference 1: http://fasb.org/us-gaap/role/ref/legacyRef
-Publisher FASB
-Name Accounting Standards Codification
-Topic 210
-SubTopic 10
-Section S99
-Paragraph 1
-Subparagraph (SX 210.5-02(27)(b))
-URI https://asc.fasb.org/extlink&oid=120391452&loc=d3e13212-122682
| Name: |
us-gaap_TemporaryEquitySharesOutstanding |
| Namespace Prefix: |
us-gaap_ |
| Data Type: |
xbrli:sharesItemType |
| Balance Type: |
na |
| Period Type: |
instant |
|
| X |
- DefinitionValue of new stock classified as temporary equity issued during the period.
| Name: |
us-gaap_TemporaryEquityStockIssuedDuringPeriodValueNewIssues |
| Namespace Prefix: |
us-gaap_ |
| Data Type: |
xbrli:monetaryItemType |
| Balance Type: |
credit |
| Period Type: |
duration |
|
| X |
- Details
| Name: |
us-gaap_StatementClassOfStockAxis=us-gaap_RedeemablePreferredStockMember |
| Namespace Prefix: |
|
| Data Type: |
na |
| Balance Type: |
|
| Period Type: |
|
|
| X |
- Details
| Name: |
us-gaap_StatementEquityComponentsAxis=us-gaap_PreferredStockMember |
| Namespace Prefix: |
|
| Data Type: |
na |
| Balance Type: |
|
| Period Type: |
|
|
| X |
- Details
| Name: |
us-gaap_StatementEquityComponentsAxis=us-gaap_AdditionalPaidInCapitalMember |
| Namespace Prefix: |
|
| Data Type: |
na |
| Balance Type: |
|
| Period Type: |
|
|
| X |
- Details
| Name: |
us-gaap_StatementEquityComponentsAxis=DSGT_StockToBeIssuedMember |
| Namespace Prefix: |
|
| Data Type: |
na |
| Balance Type: |
|
| Period Type: |
|
|
v3.23.2
SCHEDULE OF REDEEMABLE PREFERRED SHARE ACTIVITIES (Details) (Parenthetical) - USD ($)
|
12 Months Ended |
Dec. 31, 2022 |
Dec. 31, 2021 |
| Accrued against additional paid in capital |
$ 838,064
|
|
|
| Accrued dividends |
(455,501)
|
[1] |
$ 455,500
|
| Redeemable preferred shares issued |
(336,364)
|
|
(1,538,100)
|
| Redeemable Preferred Stock [Member] |
|
|
|
| Accrued dividends |
|
|
$ 455,500
|
| Redeemable preferred shares issued |
$ 33,808
|
|
|
|
|
| X |
- DefinitionTemporary equity accrued against additional paid in capital amount.
| Name: |
DSGT_TemporaryEquityAccruedAgainstAdditionalPaidInCapitalAmount |
| Namespace Prefix: |
DSGT_ |
| Data Type: |
xbrli:monetaryItemType |
| Balance Type: |
credit |
| Period Type: |
duration |
|
| X |
- DefinitionTemporary equity accrued preferred stock dividends.
| Name: |
DSGT_TemporaryEquityAccruedPreferredStockDividends |
| Namespace Prefix: |
DSGT_ |
| Data Type: |
xbrli:monetaryItemType |
| Balance Type: |
credit |
| Period Type: |
duration |
|
| X |
- DefinitionTemporary equity converted for common shares.
| Name: |
DSGT_TemporaryEquityConvertedForCommonShares |
| Namespace Prefix: |
DSGT_ |
| Data Type: |
xbrli:monetaryItemType |
| Balance Type: |
credit |
| Period Type: |
duration |
|
| X |
- Details
| Name: |
us-gaap_StatementClassOfStockAxis=us-gaap_RedeemablePreferredStockMember |
| Namespace Prefix: |
|
| Data Type: |
na |
| Balance Type: |
|
| Period Type: |
|
|
v3.23.2
MEZZANINE EQUITY (Details Narrative) - USD ($)
|
|
|
|
|
|
|
|
|
|
|
|
|
|
|
|
|
|
|
12 Months Ended |
Oct. 21, 2022 |
Sep. 15, 2022 |
Aug. 26, 2022 |
Jul. 29, 2022 |
Mar. 31, 2022 |
Feb. 07, 2022 |
Jan. 04, 2022 |
Dec. 31, 2021 |
Dec. 14, 2021 |
Nov. 30, 2021 |
Oct. 22, 2021 |
Aug. 03, 2021 |
Jul. 20, 2021 |
Jun. 10, 2021 |
Feb. 04, 2021 |
Dec. 23, 2020 |
Dec. 07, 2020 |
Nov. 06, 2020 |
Dec. 31, 2022 |
Dec. 31, 2021 |
Dec. 31, 2020 |
| Preferred stock, shares authorized |
|
|
|
|
|
|
|
24,010,000
|
|
|
|
|
|
|
|
|
|
|
24,010,000
|
24,010,000
|
|
| Preferred stock, par value |
|
|
|
|
|
|
|
$ 0.001
|
|
|
|
|
|
|
|
|
|
|
$ 0.001
|
$ 0.001
|
|
| Proceeds from issuance of preferred shares |
|
|
|
|
|
|
|
|
|
|
|
|
|
|
|
|
|
|
$ 1,000,000
|
$ 2,536,066
|
|
| Warrants granted |
|
|
|
|
|
|
|
|
|
|
|
|
|
|
|
|
|
|
|
3,500,000
|
|
| Securities Purchase Agreement [Member] | Warrant [Member] |
|
|
|
|
|
|
|
|
|
|
|
|
|
|
|
|
|
|
|
|
|
| Warrants granted |
|
|
|
|
|
|
|
|
|
|
|
|
1,180,000
|
|
|
3,000,000
|
|
|
|
|
|
| Fair value of warrants |
|
|
|
|
|
|
|
|
|
|
|
|
$ 261,934
|
|
|
$ 768,008
|
|
|
|
|
|
| Redeemable Series C Preferred Stock [Member] |
|
|
|
|
|
|
|
|
|
|
|
|
|
|
|
|
|
|
|
|
|
| Preferred stock, shares authorized |
|
|
|
|
|
|
|
|
|
|
|
|
|
|
|
|
|
|
5,000,000
|
|
|
| Preferred stock, par value |
|
|
|
|
|
|
|
|
|
|
|
|
|
|
|
|
|
|
$ 0.001
|
|
|
| Redeemable Series D Preferred Stock [Member] |
|
|
|
|
|
|
|
|
|
|
|
|
|
|
|
|
|
|
|
|
|
| Preferred stock, shares authorized |
|
|
|
|
|
|
|
|
|
|
|
|
|
|
|
|
|
|
1,000,000
|
|
|
| Preferred stock, par value |
|
|
|
|
|
|
|
|
|
|
|
|
|
|
|
|
|
|
$ 0.001
|
|
|
| Conversion of convertible preferred stock into common stock |
|
|
|
|
|
|
|
|
|
|
|
|
|
|
|
|
|
|
5
|
|
|
| Redeemable Series E Preferred Stock [Member] |
|
|
|
|
|
|
|
|
|
|
|
|
|
|
|
|
|
|
|
|
|
| Preferred stock, shares authorized |
|
|
|
|
|
|
|
|
|
|
|
|
|
|
|
|
|
|
5,000,000
|
|
|
| Preferred stock, par value |
|
|
|
|
|
|
|
|
|
|
|
|
|
|
|
|
|
|
$ 0.001
|
|
|
| Conversion of convertible preferred stock into common stock |
|
|
|
|
|
|
|
|
|
|
|
|
|
|
|
|
|
|
4
|
|
|
| Redeemable Series F Preferred Stock [Member] |
|
|
|
|
|
|
|
|
|
|
|
|
|
|
|
|
|
|
|
|
|
| Preferred stock, shares authorized |
|
|
|
|
|
|
|
|
|
|
|
|
|
|
|
|
|
|
10,000
|
|
|
| Preferred stock, par value |
|
|
|
|
|
|
|
|
|
|
|
|
|
|
|
|
|
|
$ 0.001
|
|
|
| Convertible preferred stock, description |
|
|
|
|
|
|
|
|
|
|
|
|
|
|
|
|
|
|
Each share of Series F preferred
shares is convertible into common stock at an amount equal to the lesser of (a) one hundred percent of the lowest traded price for the
Company’s stock for the fifteen trading days immediately preceding the relevant Conversion and (b) a twenty percent discount to
the price of the common stock in an offering with gross proceeds of at least $10,000,000.
|
|
|
| Series F Preferred Stock [Member] |
|
|
|
|
|
|
|
|
|
|
|
|
|
|
|
|
|
|
|
|
|
| Conversion of convertible preferred stock into common stock |
|
|
|
|
|
|
|
|
|
491
|
210
|
275
|
|
|
|
|
|
|
620
|
|
|
| Series F Preferred Stock [Member] | Securities Purchase Agreement [Member] |
|
|
|
|
|
|
|
|
|
|
|
|
|
|
|
|
|
|
|
|
|
| Subscription receivable amount |
$ 410,000
|
$ 125,000
|
$ 250,000
|
$ 90,000
|
$ 250,000
|
$ 250,000
|
$ 250,000
|
$ 250,000
|
$ 312,000
|
|
|
|
|
|
|
|
|
|
|
|
|
| Preferred stock, shares subscribed |
410
|
|
|
90
|
|
|
|
|
|
|
|
|
|
|
|
|
|
|
|
|
|
| Number of shares issued, shares |
96
|
125
|
250
|
|
250
|
250
|
250
|
250
|
312
|
|
|
|
|
350
|
|
1,000
|
|
|
|
|
|
| Dividends to be settled with preferred shares |
$ 96,000
|
|
|
$ 368,000
|
|
|
|
|
|
|
|
|
|
|
|
|
|
|
|
|
|
| Sale of stock, per share |
|
|
|
|
|
|
|
|
|
|
|
|
|
|
|
$ 1,000
|
|
|
|
|
|
| Sale of stock, value |
|
|
|
|
|
|
|
|
|
|
|
|
$ 400,000
|
|
|
|
|
|
|
|
|
| Sale of stock ,shares issued |
|
|
|
|
|
|
|
|
|
|
|
|
400
|
|
|
|
|
|
|
|
|
| Number of shares issued, value |
|
|
|
|
|
|
|
|
|
|
|
|
$ 138,066
|
$ 350,000
|
|
|
|
|
|
|
|
| Subscription incurred issuance cost |
|
|
|
|
|
|
|
|
$ 12,000
|
|
|
|
|
|
|
|
|
|
|
|
|
| Series F Preferred Stock [Member] | Securities Purchase Agreement [Member] | Second Closing [Member] |
|
|
|
|
|
|
|
|
|
|
|
|
|
|
|
|
|
|
|
|
|
| Number of shares issued, shares |
|
|
|
|
|
|
|
|
|
|
|
|
|
|
1,500
|
|
|
|
|
|
|
| Proceeds from issuance of preferred shares |
|
|
|
|
|
|
|
|
|
|
|
|
|
|
$ 1,500,000
|
|
|
|
|
|
|
| Series F Preferred Stock [Member] | Securities Purchase Agreement [Member] | First and Second Closing [Member] |
|
|
|
|
|
|
|
|
|
|
|
|
|
|
|
|
|
|
|
|
|
| Number of shares issued, shares |
|
|
|
|
|
|
|
|
|
|
|
|
|
|
|
1,500
|
|
|
|
|
|
| Sale of stock, value |
|
|
|
|
|
|
|
|
|
|
|
|
|
|
|
$ 1,500,000
|
|
|
|
|
|
| Series F Preferred Stock [Member] | Securities Purchase Agreement [Member] | Additional Closing [Member] |
|
|
|
|
|
|
|
|
|
|
|
|
|
|
|
|
|
|
|
|
|
| Sale of stock ,shares issued |
|
|
|
|
|
|
|
|
|
|
|
|
|
|
|
1,000
|
|
|
|
|
|
| Series F Preferred Stock [Member] | Securities Purchase Agreement [Member] | First Closing [Member] |
|
|
|
|
|
|
|
|
|
|
|
|
|
|
|
|
|
|
|
|
|
| Number of shares issued, shares |
|
|
|
|
|
|
|
|
|
|
|
|
|
|
1,500
|
|
|
|
|
|
|
| Sale of stock, value |
|
|
|
|
|
|
|
|
|
|
|
|
|
|
|
|
|
|
|
|
$ 731,992
|
| Number of shares issued, value |
|
|
|
|
|
|
|
|
|
|
|
|
|
|
$ 731,992
|
|
|
|
|
|
|
| Series C Preferred Stock [Member] |
|
|
|
|
|
|
|
|
|
|
|
|
|
|
|
|
|
|
|
|
|
| Conversion of convertible preferred stock into common stock |
|
|
|
|
|
|
|
1,512
|
|
|
|
|
|
|
|
|
|
|
|
1,512
|
|
| Series C Preferred Stock [Member] | Second Closing [Member] |
|
|
|
|
|
|
|
|
|
|
|
|
|
|
|
|
|
|
|
|
|
| Number of shares issued, shares |
|
|
|
|
|
|
|
|
|
|
|
|
|
|
|
|
200
|
300
|
|
|
|
| Proceeds from issuance of preferred shares |
|
|
|
|
|
|
|
|
|
|
|
|
|
|
|
|
$ 200,000
|
$ 300,000
|
|
|
|
| Mezzanine Preferred Equity Series C And Series F [Member] |
|
|
|
|
|
|
|
|
|
|
|
|
|
|
|
|
|
|
|
|
|
| Dividends to be settled with preferred shares |
|
|
|
|
|
|
|
|
|
|
|
|
|
|
|
|
|
|
$ 382,563
|
|
|
| Description of dividend payable rate |
|
|
|
|
|
|
|
|
|
|
|
|
|
|
|
|
|
|
Mezzanine
preferred equity, series C and series F, carry a dividend policy which entitles each preferred share to receive, and the Company to pay,
cumulative dividends of 10% per annum, payable quarterly, beginning on the original issuance date and ending on the date that such preferred
shares has been converted or redeemed. At the option of the Company, accrued dividends can be settled in preferred shares of the same
series, or in cash. Any dividends that are not paid quarterly on the dividend payment date shall entail a late fee, which must be paid
in cash at the rate of 18% per annum, which accrues and compounds daily from the dividend payment date, through to and including the
date of the actual payment in full.
|
|
|
| Preferred stock dividend rate, percentage |
|
|
|
|
|
|
|
|
|
|
|
|
|
|
|
|
|
|
10.00%
|
|
|
| Penalty interest |
|
|
|
|
|
|
|
|
|
|
|
|
|
|
|
|
|
|
$ 107,081
|
|
|
| X |
- DefinitionPreferred stock dividend rate payment description.
| Name: |
DSGT_PreferredStockDividendRatePaymentDescription |
| Namespace Prefix: |
DSGT_ |
| Data Type: |
xbrli:stringItemType |
| Balance Type: |
na |
| Period Type: |
duration |
|
| X |
- DefinitionSubscription incurred issuance cost.
| Name: |
DSGT_SubscriptionIncurredIssuanceCost |
| Namespace Prefix: |
DSGT_ |
| Data Type: |
xbrli:monetaryItemType |
| Balance Type: |
debit |
| Period Type: |
duration |
|
| X |
- DefinitionSubscription receivable amount.
| Name: |
DSGT_SubscriptionReceivableAmount |
| Namespace Prefix: |
DSGT_ |
| Data Type: |
xbrli:monetaryItemType |
| Balance Type: |
debit |
| Period Type: |
duration |
|
| X |
- DefinitionThe number of shares converted in a noncash (or part noncash) transaction. Noncash is defined as transactions during a period that do not result in cash receipts or cash payments in the period. "Part noncash" refers to that portion of the transaction not resulting in cash receipts or cash payments in the period. Reference 1: http://fasb.org/us-gaap/role/ref/legacyRef
-Publisher FASB
-Name Accounting Standards Codification
-Topic 230
-SubTopic 10
-Section 50
-Paragraph 4
-URI https://asc.fasb.org/extlink&oid=126999549&loc=d3e4313-108586
Reference 2: http://fasb.org/us-gaap/role/ref/legacyRef
-Publisher FASB
-Name Accounting Standards Codification
-Topic 230
-SubTopic 10
-Section 50
-Paragraph 3
-URI https://asc.fasb.org/extlink&oid=126999549&loc=d3e4304-108586
Reference 3: http://fasb.org/us-gaap/role/ref/legacyRef
-Publisher FASB
-Name Accounting Standards Codification
-Topic 230
-SubTopic 10
-Section 50
-Paragraph 5
-URI https://asc.fasb.org/extlink&oid=126999549&loc=d3e4332-108586
| Name: |
us-gaap_ConversionOfStockSharesConverted1 |
| Namespace Prefix: |
us-gaap_ |
| Data Type: |
xbrli:sharesItemType |
| Balance Type: |
na |
| Period Type: |
duration |
|
| X |
- DefinitionNumber of shares issued for each share of convertible preferred stock that is converted. Reference 1: http://fasb.org/us-gaap/role/ref/legacyRef
-Publisher FASB
-Name Accounting Standards Codification
-Topic 210
-SubTopic 10
-Section S99
-Paragraph 1
-Subparagraph (SX 210.5-02(27))
-URI https://asc.fasb.org/extlink&oid=120391452&loc=d3e13212-122682
Reference 2: http://fasb.org/us-gaap/role/ref/legacyRef
-Publisher FASB
-Name Accounting Standards Codification
-Topic 210
-SubTopic 10
-Section S99
-Paragraph 1
-Subparagraph (SX 210.5-02(28))
-URI https://asc.fasb.org/extlink&oid=120391452&loc=d3e13212-122682
Reference 3: http://fasb.org/us-gaap/role/ref/legacyRef
-Publisher FASB
-Name Accounting Standards Codification
-Topic 505
-SubTopic 10
-Section 50
-Paragraph 3
-URI https://asc.fasb.org/extlink&oid=126973232&loc=d3e21475-112644
Reference 4: http://www.xbrl.org/2003/role/disclosureRef
-Publisher FASB
-Name Accounting Standards Codification
-Topic 505
-SubTopic 10
-Section 50
-Paragraph 16
-Subparagraph (c)
-URI https://asc.fasb.org/extlink&oid=126973232&loc=SL123496180-112644
Reference 5: http://fasb.org/us-gaap/role/ref/legacyRef
-Publisher FASB
-Name Accounting Standards Codification
-Topic 505
-SubTopic 10
-Section 50
-Paragraph 6
-Subparagraph (b)
-URI https://asc.fasb.org/extlink&oid=126973232&loc=d3e21506-112644
| Name: |
us-gaap_ConvertiblePreferredStockSharesIssuedUponConversion |
| Namespace Prefix: |
us-gaap_ |
| Data Type: |
xbrli:sharesItemType |
| Balance Type: |
na |
| Period Type: |
instant |
|
| X |
- DefinitionDescription of conversion terms for preferred stock. Reference 1: http://fasb.org/us-gaap/role/ref/legacyRef
-Publisher FASB
-Name Accounting Standards Codification
-Topic 505
-SubTopic 10
-Section 50
-Paragraph 8
-URI https://asc.fasb.org/extlink&oid=126973232&loc=d3e21538-112644
Reference 2: http://fasb.org/us-gaap/role/ref/legacyRef
-Publisher FASB
-Name Accounting Standards Codification
-Topic 210
-SubTopic 10
-Section S99
-Paragraph 1
-Subparagraph (SX 210.5-02(28))
-URI https://asc.fasb.org/extlink&oid=120391452&loc=d3e13212-122682
Reference 3: http://fasb.org/us-gaap/role/ref/legacyRef
-Publisher FASB
-Name Accounting Standards Codification
-Topic 505
-SubTopic 10
-Section 50
-Paragraph 7
-URI https://asc.fasb.org/extlink&oid=126973232&loc=d3e21521-112644
Reference 4: http://fasb.org/us-gaap/role/ref/legacyRef
-Publisher FASB
-Name Accounting Standards Codification
-Topic 210
-SubTopic 10
-Section S99
-Paragraph 1
-Subparagraph (SX 210.5-02(27))
-URI https://asc.fasb.org/extlink&oid=120391452&loc=d3e13212-122682
Reference 5: http://fasb.org/us-gaap/role/ref/legacyRef
-Publisher FASB
-Name Accounting Standards Codification
-Topic 505
-SubTopic 10
-Section 50
-Paragraph 6
-URI https://asc.fasb.org/extlink&oid=126973232&loc=d3e21506-112644
Reference 6: http://fasb.org/us-gaap/role/ref/legacyRef
-Publisher FASB
-Name Accounting Standards Codification
-Topic 505
-SubTopic 10
-Section 50
-Paragraph 3
-URI https://asc.fasb.org/extlink&oid=126973232&loc=d3e21475-112644
| Name: |
us-gaap_ConvertiblePreferredStockTermsOfConversion |
| Namespace Prefix: |
us-gaap_ |
| Data Type: |
xbrli:stringItemType |
| Balance Type: |
na |
| Period Type: |
duration |
|
| X |
- DefinitionAmount of paid and unpaid preferred stock dividends declared with the form of settlement in cash, stock and payment-in-kind (PIK). Reference 1: http://fasb.org/us-gaap/role/ref/legacyRef
-Publisher FASB
-Name Accounting Standards Codification
-Topic 505
-SubTopic 10
-Section S99
-Paragraph 1
-Subparagraph (SX 210.3-04)
-URI https://asc.fasb.org/extlink&oid=120397183&loc=d3e187085-122770
Reference 2: http://fasb.org/us-gaap/role/ref/legacyRef
-Publisher FASB
-Name Accounting Standards Codification
-Topic 942
-SubTopic 405
-Section 45
-Paragraph 2
-URI https://asc.fasb.org/extlink&oid=6957935&loc=d3e64057-112817
| Name: |
us-gaap_DividendsPreferredStock |
| Namespace Prefix: |
us-gaap_ |
| Data Type: |
xbrli:monetaryItemType |
| Balance Type: |
debit |
| Period Type: |
duration |
|
| X |
- DefinitionAmount of expense (income) related to adjustment to fair value of warrant liability. Reference 1: http://fasb.org/us-gaap/role/ref/legacyRef
-Publisher FASB
-Name Accounting Standards Codification
-Topic 230
-SubTopic 10
-Section 45
-Paragraph 28
-Subparagraph (b)
-URI https://asc.fasb.org/extlink&oid=126954810&loc=d3e3602-108585
Reference 2: http://fasb.org/us-gaap/role/ref/legacyRef
-Publisher FASB
-Name Accounting Standards Codification
-Topic 480
-SubTopic 10
-Section 25
-Paragraph 13
-URI https://asc.fasb.org/extlink&oid=109262497&loc=d3e20148-110875
| Name: |
us-gaap_FairValueAdjustmentOfWarrants |
| Namespace Prefix: |
us-gaap_ |
| Data Type: |
xbrli:monetaryItemType |
| Balance Type: |
debit |
| Period Type: |
duration |
|
| X |
- DefinitionThe percentage rate used to calculate dividend payments on preferred stock. Reference 1: http://www.xbrl.org/2003/role/disclosureRef
-Publisher FASB
-Name Accounting Standards Codification
-Topic 505
-SubTopic 10
-Section 50
-Paragraph 13
-Subparagraph (b)
-URI https://asc.fasb.org/extlink&oid=126973232&loc=SL123496158-112644
| Name: |
us-gaap_PreferredStockDividendRatePercentage |
| Namespace Prefix: |
us-gaap_ |
| Data Type: |
dtr-types:percentItemType |
| Balance Type: |
na |
| Period Type: |
duration |
|
| X |
- DefinitionThe number of nonredeemable preferred stock (shares) (or preferred stock redeemable solely at the option of the issuer) allocated to investors to buy shares of a new issue of preferred stock before they are offered to the public. When stock is sold on a subscription basis, the issuer does not initially receive the total proceeds. In general, the issuer does not issue the shares to the investor until it receives the entire proceeds. Reference 1: http://fasb.org/us-gaap/role/ref/legacyRef
-Publisher FASB
-Name Accounting Standards Codification
-Topic 210
-SubTopic 10
-Section S99
-Paragraph 1
-Subparagraph (SX 210.5-02(28))
-URI https://asc.fasb.org/extlink&oid=120391452&loc=d3e13212-122682
| Name: |
us-gaap_PreferredStockShareSubscriptions |
| Namespace Prefix: |
us-gaap_ |
| Data Type: |
xbrli:sharesItemType |
| Balance Type: |
na |
| Period Type: |
instant |
|
| X |
- DefinitionProceeds from issuance of capital stock which provides for a specific dividend that is paid to the shareholders before any dividends to common stockholders and which takes precedence over common stockholders in the event of liquidation. Reference 1: http://fasb.org/us-gaap/role/ref/legacyRef
-Publisher FASB
-Name Accounting Standards Codification
-Topic 230
-SubTopic 10
-Section 45
-Paragraph 14
-Subparagraph (a)
-URI https://asc.fasb.org/extlink&oid=126954810&loc=d3e3255-108585
| Name: |
us-gaap_ProceedsFromIssuanceOfPreferredStockAndPreferenceStock |
| Namespace Prefix: |
us-gaap_ |
| Data Type: |
xbrli:monetaryItemType |
| Balance Type: |
debit |
| Period Type: |
duration |
|
| X |
- DefinitionCash received on stock transaction after deduction of issuance costs.
| Name: |
us-gaap_SaleOfStockConsiderationReceivedOnTransaction |
| Namespace Prefix: |
us-gaap_ |
| Data Type: |
xbrli:monetaryItemType |
| Balance Type: |
debit |
| Period Type: |
duration |
|
| X |
- DefinitionThe number of shares issued or sold by the subsidiary or equity method investee per stock transaction.
| Name: |
us-gaap_SaleOfStockNumberOfSharesIssuedInTransaction |
| Namespace Prefix: |
us-gaap_ |
| Data Type: |
xbrli:sharesItemType |
| Balance Type: |
na |
| Period Type: |
duration |
|
| X |
- DefinitionPer share amount received by subsidiary or equity investee for each share of common stock issued or sold in the stock transaction.
| Name: |
us-gaap_SaleOfStockPricePerShare |
| Namespace Prefix: |
us-gaap_ |
| Data Type: |
dtr-types:perShareItemType |
| Balance Type: |
na |
| Period Type: |
instant |
|
| X |
- DefinitionNet number of non-option equity instruments granted to participants. Reference 1: http://fasb.org/us-gaap/role/ref/legacyRef
-Publisher FASB
-Name Accounting Standards Codification
-Topic 718
-SubTopic 10
-Section 50
-Paragraph 2
-Subparagraph (c)(1)(iv)(1)
-URI https://asc.fasb.org/extlink&oid=128089324&loc=d3e5070-113901
| Name: |
us-gaap_ShareBasedCompensationArrangementByShareBasedPaymentAwardNonOptionEquityInstrumentsGranted |
| Namespace Prefix: |
us-gaap_ |
| Data Type: |
xbrli:sharesItemType |
| Balance Type: |
na |
| Period Type: |
duration |
|
| X |
- DefinitionNumber of new stock issued during the period. Reference 1: http://fasb.org/us-gaap/role/ref/legacyRef
-Publisher FASB
-Name Accounting Standards Codification
-Topic 210
-SubTopic 10
-Section S99
-Paragraph 1
-Subparagraph (SX 210.5-02(29))
-URI https://asc.fasb.org/extlink&oid=120391452&loc=d3e13212-122682
Reference 2: http://fasb.org/us-gaap/role/ref/legacyRef
-Publisher FASB
-Name Accounting Standards Codification
-Topic 505
-SubTopic 10
-Section 50
-Paragraph 2
-URI https://asc.fasb.org/extlink&oid=126973232&loc=d3e21463-112644
Reference 3: http://fasb.org/us-gaap/role/ref/legacyRef
-Publisher FASB
-Name Accounting Standards Codification
-Topic 505
-SubTopic 10
-Section S99
-Paragraph 1
-Subparagraph (SX 210.3-04)
-URI https://asc.fasb.org/extlink&oid=120397183&loc=d3e187085-122770
Reference 4: http://fasb.org/us-gaap/role/ref/legacyRef
-Publisher FASB
-Name Accounting Standards Codification
-Topic 210
-SubTopic 10
-Section S99
-Paragraph 1
-Subparagraph (SX 210.5-02(28))
-URI https://asc.fasb.org/extlink&oid=120391452&loc=d3e13212-122682
| Name: |
us-gaap_StockIssuedDuringPeriodSharesNewIssues |
| Namespace Prefix: |
us-gaap_ |
| Data Type: |
xbrli:sharesItemType |
| Balance Type: |
na |
| Period Type: |
duration |
|
| X |
- DefinitionEquity impact of the value of new stock issued during the period. Includes shares issued in an initial public offering or a secondary public offering. Reference 1: http://fasb.org/us-gaap/role/ref/legacyRef
-Publisher FASB
-Name Accounting Standards Codification
-Topic 505
-SubTopic 10
-Section S99
-Paragraph 1
-Subparagraph (SX 210.3-04)
-URI https://asc.fasb.org/extlink&oid=120397183&loc=d3e187085-122770
Reference 2: http://fasb.org/us-gaap/role/ref/legacyRef
-Publisher FASB
-Name Accounting Standards Codification
-Topic 505
-SubTopic 10
-Section 50
-Paragraph 2
-URI https://asc.fasb.org/extlink&oid=126973232&loc=d3e21463-112644
Reference 3: http://fasb.org/us-gaap/role/ref/legacyRef
-Publisher FASB
-Name Accounting Standards Codification
-Topic 210
-SubTopic 10
-Section S99
-Paragraph 1
-Subparagraph (SX 210.5-02(29))
-URI https://asc.fasb.org/extlink&oid=120391452&loc=d3e13212-122682
Reference 4: http://fasb.org/us-gaap/role/ref/legacyRef
-Publisher FASB
-Name Accounting Standards Codification
-Topic 210
-SubTopic 10
-Section S99
-Paragraph 1
-Subparagraph (SX 210.5-02(28))
-URI https://asc.fasb.org/extlink&oid=120391452&loc=d3e13212-122682
| Name: |
us-gaap_StockIssuedDuringPeriodValueNewIssues |
| Namespace Prefix: |
us-gaap_ |
| Data Type: |
xbrli:monetaryItemType |
| Balance Type: |
credit |
| Period Type: |
duration |
|
| X |
- DefinitionPer share amount of par value or stated value of stock classified as temporary equity. Temporary equity is a security with redemption features that are outside the control of the issuer, is not classified as an asset or liability in conformity with GAAP, and is not mandatorily redeemable. Reference 1: http://fasb.org/us-gaap/role/ref/legacyRef
-Publisher FASB
-Name Accounting Standards Codification
-Topic 480
-SubTopic 10
-Section S99
-Paragraph 1
-URI https://asc.fasb.org/extlink&oid=122040564&loc=d3e177068-122764
Reference 2: http://fasb.org/us-gaap/role/ref/legacyRef
-Publisher FASB
-Name Accounting Standards Codification
-Topic 210
-SubTopic 10
-Section S99
-Paragraph 1
-Subparagraph (27)
-URI https://asc.fasb.org/extlink&oid=120391452&loc=d3e13212-122682
| Name: |
us-gaap_TemporaryEquityParOrStatedValuePerShare |
| Namespace Prefix: |
us-gaap_ |
| Data Type: |
dtr-types:perShareItemType |
| Balance Type: |
na |
| Period Type: |
instant |
|
| X |
- DefinitionThe maximum number of securities classified as temporary equity that are permitted to be issued by an entity's charter and bylaws. Temporary equity is a security with redemption features that are outside the control of the issuer, is not classified as an asset or liability in conformity with GAAP, and is not mandatorily redeemable. Includes any type of security that is redeemable at a fixed or determinable price or on a fixed or determinable date or dates, is redeemable at the option of the holder, or has conditions for redemption which are not solely within the control of the issuer. If convertible, the issuer does not control the actions or events necessary to issue the maximum number of shares that could be required to be delivered under the conversion option if the holder exercises the option to convert the stock to another class of equity. If the security is a warrant or a rights issue, the warrant or rights issue is considered to be temporary equity if the issuer cannot demonstrate that it would be able to deliver upon the exercise of the option by the holder in all cases. Includes stock with put option held by ESOP and stock redeemable by holder only in the event of a change in control of the issuer. Reference 1: http://fasb.org/us-gaap/role/ref/legacyRef
-Publisher FASB
-Name Accounting Standards Codification
-Topic 210
-SubTopic 10
-Section S99
-Paragraph 1
-Subparagraph (SX 210.5-02(27)(b))
-URI https://asc.fasb.org/extlink&oid=120391452&loc=d3e13212-122682
| Name: |
us-gaap_TemporaryEquitySharesAuthorized |
| Namespace Prefix: |
us-gaap_ |
| Data Type: |
xbrli:sharesItemType |
| Balance Type: |
na |
| Period Type: |
instant |
|
| X |
- Details
| Name: |
us-gaap_TypeOfArrangementAxis=DSGT_SecuritiesPurchaseAgreementMember |
| Namespace Prefix: |
|
| Data Type: |
na |
| Balance Type: |
|
| Period Type: |
|
|
| X |
- Details
| Name: |
us-gaap_StatementEquityComponentsAxis=us-gaap_WarrantMember |
| Namespace Prefix: |
|
| Data Type: |
na |
| Balance Type: |
|
| Period Type: |
|
|
| X |
- Details
| Name: |
us-gaap_StatementClassOfStockAxis=DSGT_RedeemableSeriesCPreferredStockMember |
| Namespace Prefix: |
|
| Data Type: |
na |
| Balance Type: |
|
| Period Type: |
|
|
| X |
- Details
| Name: |
us-gaap_StatementClassOfStockAxis=DSGT_RedeemableSeriesDPreferredStockMember |
| Namespace Prefix: |
|
| Data Type: |
na |
| Balance Type: |
|
| Period Type: |
|
|
| X |
- Details
| Name: |
us-gaap_StatementClassOfStockAxis=DSGT_RedeemableSeriesEPreferredStockMember |
| Namespace Prefix: |
|
| Data Type: |
na |
| Balance Type: |
|
| Period Type: |
|
|
| X |
- Details
| Name: |
us-gaap_StatementClassOfStockAxis=DSGT_RedeemableSeriesFPreferredStockMember |
| Namespace Prefix: |
|
| Data Type: |
na |
| Balance Type: |
|
| Period Type: |
|
|
| X |
- Details
| Name: |
us-gaap_StatementClassOfStockAxis=us-gaap_SeriesFPreferredStockMember |
| Namespace Prefix: |
|
| Data Type: |
na |
| Balance Type: |
|
| Period Type: |
|
|
| X |
- Details
| Name: |
srt_StatementScenarioAxis=DSGT_SecondClosingMember |
| Namespace Prefix: |
|
| Data Type: |
na |
| Balance Type: |
|
| Period Type: |
|
|
| X |
- Details
| Name: |
srt_StatementScenarioAxis=DSGT_FirstAndSecondClosingMember |
| Namespace Prefix: |
|
| Data Type: |
na |
| Balance Type: |
|
| Period Type: |
|
|
| X |
- Details
| Name: |
srt_StatementScenarioAxis=DSGT_AdditionalClosingMember |
| Namespace Prefix: |
|
| Data Type: |
na |
| Balance Type: |
|
| Period Type: |
|
|
| X |
- Details
| Name: |
srt_StatementScenarioAxis=DSGT_FirstClosingMember |
| Namespace Prefix: |
|
| Data Type: |
na |
| Balance Type: |
|
| Period Type: |
|
|
| X |
- Details
| Name: |
us-gaap_StatementClassOfStockAxis=us-gaap_SeriesCPreferredStockMember |
| Namespace Prefix: |
|
| Data Type: |
na |
| Balance Type: |
|
| Period Type: |
|
|
| X |
- Details
| Name: |
us-gaap_StatementClassOfStockAxis=DSGT_MezzaninePreferredEquitySeriesCAndSeriesFMember |
| Namespace Prefix: |
|
| Data Type: |
na |
| Balance Type: |
|
| Period Type: |
|
|
v3.23.2
PREFERRED STOCK (Details Narrative) - USD ($)
|
|
|
|
|
|
|
|
|
|
12 Months Ended |
|
Nov. 03, 2022 |
Aug. 01, 2022 |
Jun. 27, 2022 |
Sep. 16, 2021 |
May 26, 2021 |
Mar. 04, 2021 |
Feb. 17, 2021 |
Oct. 26, 2020 |
May 21, 2020 |
Dec. 31, 2021 |
Dec. 31, 2022 |
| Class of Stock [Line Items] |
|
|
|
|
|
|
|
|
|
|
|
| Preferred stock, shares authorized |
|
|
|
|
|
|
|
|
|
3,010,000
|
3,010,000
|
| Preferred stock par value |
|
|
|
|
|
|
|
|
|
$ 0.001
|
$ 0.001
|
| Preferred stock issued |
|
|
|
|
|
|
|
|
|
200,454
|
200,780
|
| Number of share issued for services, value |
|
|
|
|
|
|
|
|
|
$ 849,600
|
|
| Consultant [Member] |
|
|
|
|
|
|
|
|
|
|
|
| Class of Stock [Line Items] |
|
|
|
|
|
|
|
|
|
|
|
| Number of share issued for services |
|
|
|
|
|
|
|
|
|
2,430,000
|
|
| Number of share issued for services, value |
|
|
|
|
|
|
|
|
|
$ 565,250
|
|
| Series A Preferred Stock [Member] |
|
|
|
|
|
|
|
|
|
|
|
| Class of Stock [Line Items] |
|
|
|
|
|
|
|
|
|
|
|
| Preferred stock, shares authorized |
|
|
|
|
|
|
|
|
|
|
3,000,000
|
| Preferred stock par value |
|
|
|
|
|
|
|
|
|
|
$ 0.001
|
| Series B Convertible Preferred Stock [Member] |
|
|
|
|
|
|
|
|
|
|
|
| Class of Stock [Line Items] |
|
|
|
|
|
|
|
|
|
|
|
| Preferred stock, shares authorized |
|
|
|
|
|
|
|
|
|
|
10,000
|
| Preferred stock par value |
|
|
|
|
|
|
|
|
|
|
$ 0.001
|
| Conversion of convertible preferred stock into common stock |
|
|
|
|
|
|
|
|
|
|
100,000
|
| Series B Preferred Stock [Member] |
|
|
|
|
|
|
|
|
|
|
|
| Class of Stock [Line Items] |
|
|
|
|
|
|
|
|
|
|
|
| Number of share issued, shares |
|
|
|
|
|
|
100
|
|
|
|
|
| Conversion of stock shares issued |
|
|
|
500,000
|
500,000
|
|
100,000
|
1,000,000
|
|
|
|
| Number of warrants issued |
|
|
|
|
|
|
|
1,000,000
|
|
|
|
| Conversion of stock amount issued |
|
|
|
$ 670,000
|
$ 670,000
|
|
|
$ 1,340,000
|
|
|
|
| Warrant issued |
|
|
|
|
|
|
1,000,000
|
|
|
|
|
| Conversion of stock, share converted |
|
|
|
5
|
5
|
|
|
|
|
125
|
|
| Preferred stock issued |
|
|
|
|
50
|
|
|
|
|
|
|
| Shares cancelled |
|
|
|
45
|
|
|
|
|
|
|
|
| Number of share issued for services |
|
|
|
|
|
16
|
|
|
136
|
|
|
| Number of share issued for services, value |
|
|
|
|
|
$ 849,600
|
|
|
|
|
|
| Conversion of stock, amount converted |
|
|
|
|
|
|
|
|
|
$ 1,734,800
|
|
| Series B Preferred Stock [Member] | Consultant [Member] |
|
|
|
|
|
|
|
|
|
|
|
| Class of Stock [Line Items] |
|
|
|
|
|
|
|
|
|
|
|
| Number of share issued, shares |
30
|
|
|
|
|
|
|
|
|
|
|
| Stock issued during period, value, new issues |
$ 213,000
|
|
|
|
|
|
|
|
|
|
|
| Series B Preferred Stock [Member] | Chief Executive Officer [Member] |
|
|
|
|
|
|
|
|
|
|
|
| Class of Stock [Line Items] |
|
|
|
|
|
|
|
|
|
|
|
| Number of share issued, shares |
|
191
|
|
|
|
|
|
|
|
|
|
| Stock issued during period, value, new issues |
|
$ 897,000
|
|
|
|
|
|
|
|
|
|
| Series B Preferred Stock [Member] | Director [Member] |
|
|
|
|
|
|
|
|
|
|
|
| Class of Stock [Line Items] |
|
|
|
|
|
|
|
|
|
|
|
| Number of share issued, shares |
|
|
105
|
|
|
|
|
|
|
|
|
| Stock issued during period, value, new issues |
|
|
$ 777,000
|
|
|
|
|
|
|
|
|
| Common Stock [Member] |
|
|
|
|
|
|
|
|
|
|
|
| Class of Stock [Line Items] |
|
|
|
|
|
|
|
|
|
|
|
| Conversion of stock, share converted |
|
|
|
|
|
|
1
|
|
|
|
|
| Preferred stock issued |
|
|
|
|
|
|
10
|
|
|
|
|
| X |
- DefinitionLine items represent financial concepts included in a table. These concepts are used to disclose reportable information associated with domain members defined in one or many axes to the table.
| Name: |
us-gaap_ClassOfStockLineItems |
| Namespace Prefix: |
us-gaap_ |
| Data Type: |
xbrli:stringItemType |
| Balance Type: |
na |
| Period Type: |
duration |
|
| X |
- DefinitionNumber of securities into which each warrant or right may be converted. For example, but not limited to, each warrant may be converted into two shares.
| Name: |
us-gaap_ClassOfWarrantOrRightNumberOfSecuritiesCalledByEachWarrantOrRight |
| Namespace Prefix: |
us-gaap_ |
| Data Type: |
xbrli:sharesItemType |
| Balance Type: |
na |
| Period Type: |
instant |
|
| X |
- DefinitionNumber of securities into which the class of warrant or right may be converted. For example, but not limited to, 500,000 warrants may be converted into 1,000,000 shares. Reference 1: http://www.xbrl.org/2003/role/disclosureRef
-Publisher FASB
-Name Accounting Standards Codification
-Topic 505
-SubTopic 10
-Section 50
-Paragraph 3
-URI https://asc.fasb.org/extlink&oid=126973232&loc=d3e21475-112644
| Name: |
us-gaap_ClassOfWarrantOrRightNumberOfSecuritiesCalledByWarrantsOrRights |
| Namespace Prefix: |
us-gaap_ |
| Data Type: |
xbrli:sharesItemType |
| Balance Type: |
na |
| Period Type: |
instant |
|
| X |
- DefinitionThe value of the stock converted in a noncash (or part noncash) transaction. Noncash is defined as transactions during a period that do not result in cash receipts or cash payments in the period. "Part noncash" refers to that portion of the transaction not resulting in cash receipts or cash payments in the period. Reference 1: http://fasb.org/us-gaap/role/ref/legacyRef
-Publisher FASB
-Name Accounting Standards Codification
-Topic 230
-SubTopic 10
-Section 50
-Paragraph 4
-URI https://asc.fasb.org/extlink&oid=126999549&loc=d3e4313-108586
Reference 2: http://fasb.org/us-gaap/role/ref/legacyRef
-Publisher FASB
-Name Accounting Standards Codification
-Topic 230
-SubTopic 10
-Section 50
-Paragraph 5
-URI https://asc.fasb.org/extlink&oid=126999549&loc=d3e4332-108586
Reference 3: http://fasb.org/us-gaap/role/ref/legacyRef
-Publisher FASB
-Name Accounting Standards Codification
-Topic 230
-SubTopic 10
-Section 50
-Paragraph 3
-URI https://asc.fasb.org/extlink&oid=126999549&loc=d3e4304-108586
| Name: |
us-gaap_ConversionOfStockAmountConverted1 |
| Namespace Prefix: |
us-gaap_ |
| Data Type: |
xbrli:monetaryItemType |
| Balance Type: |
debit |
| Period Type: |
duration |
|
| X |
- DefinitionThe value of the financial instrument issued [noncash or part noncash] in the conversion of stock. Noncash is defined as transactions during a period that do not result in cash receipts or cash payments in the period. "Part noncash" refers to that portion of the transaction not resulting in cash receipts or cash payments in the period. Reference 1: http://fasb.org/us-gaap/role/ref/legacyRef
-Publisher FASB
-Name Accounting Standards Codification
-Topic 230
-SubTopic 10
-Section 50
-Paragraph 3
-URI https://asc.fasb.org/extlink&oid=126999549&loc=d3e4304-108586
Reference 2: http://fasb.org/us-gaap/role/ref/legacyRef
-Publisher FASB
-Name Accounting Standards Codification
-Topic 230
-SubTopic 10
-Section 50
-Paragraph 4
-URI https://asc.fasb.org/extlink&oid=126999549&loc=d3e4313-108586
Reference 3: http://fasb.org/us-gaap/role/ref/legacyRef
-Publisher FASB
-Name Accounting Standards Codification
-Topic 230
-SubTopic 10
-Section 50
-Paragraph 5
-URI https://asc.fasb.org/extlink&oid=126999549&loc=d3e4332-108586
| Name: |
us-gaap_ConversionOfStockAmountIssued1 |
| Namespace Prefix: |
us-gaap_ |
| Data Type: |
xbrli:monetaryItemType |
| Balance Type: |
credit |
| Period Type: |
duration |
|
| X |
- DefinitionThe number of shares converted in a noncash (or part noncash) transaction. Noncash is defined as transactions during a period that do not result in cash receipts or cash payments in the period. "Part noncash" refers to that portion of the transaction not resulting in cash receipts or cash payments in the period. Reference 1: http://fasb.org/us-gaap/role/ref/legacyRef
-Publisher FASB
-Name Accounting Standards Codification
-Topic 230
-SubTopic 10
-Section 50
-Paragraph 4
-URI https://asc.fasb.org/extlink&oid=126999549&loc=d3e4313-108586
Reference 2: http://fasb.org/us-gaap/role/ref/legacyRef
-Publisher FASB
-Name Accounting Standards Codification
-Topic 230
-SubTopic 10
-Section 50
-Paragraph 3
-URI https://asc.fasb.org/extlink&oid=126999549&loc=d3e4304-108586
Reference 3: http://fasb.org/us-gaap/role/ref/legacyRef
-Publisher FASB
-Name Accounting Standards Codification
-Topic 230
-SubTopic 10
-Section 50
-Paragraph 5
-URI https://asc.fasb.org/extlink&oid=126999549&loc=d3e4332-108586
| Name: |
us-gaap_ConversionOfStockSharesConverted1 |
| Namespace Prefix: |
us-gaap_ |
| Data Type: |
xbrli:sharesItemType |
| Balance Type: |
na |
| Period Type: |
duration |
|
| X |
- DefinitionNumber of shares issued for each share of convertible preferred stock that is converted. Reference 1: http://fasb.org/us-gaap/role/ref/legacyRef
-Publisher FASB
-Name Accounting Standards Codification
-Topic 210
-SubTopic 10
-Section S99
-Paragraph 1
-Subparagraph (SX 210.5-02(27))
-URI https://asc.fasb.org/extlink&oid=120391452&loc=d3e13212-122682
Reference 2: http://fasb.org/us-gaap/role/ref/legacyRef
-Publisher FASB
-Name Accounting Standards Codification
-Topic 210
-SubTopic 10
-Section S99
-Paragraph 1
-Subparagraph (SX 210.5-02(28))
-URI https://asc.fasb.org/extlink&oid=120391452&loc=d3e13212-122682
Reference 3: http://fasb.org/us-gaap/role/ref/legacyRef
-Publisher FASB
-Name Accounting Standards Codification
-Topic 505
-SubTopic 10
-Section 50
-Paragraph 3
-URI https://asc.fasb.org/extlink&oid=126973232&loc=d3e21475-112644
Reference 4: http://www.xbrl.org/2003/role/disclosureRef
-Publisher FASB
-Name Accounting Standards Codification
-Topic 505
-SubTopic 10
-Section 50
-Paragraph 16
-Subparagraph (c)
-URI https://asc.fasb.org/extlink&oid=126973232&loc=SL123496180-112644
Reference 5: http://fasb.org/us-gaap/role/ref/legacyRef
-Publisher FASB
-Name Accounting Standards Codification
-Topic 505
-SubTopic 10
-Section 50
-Paragraph 6
-Subparagraph (b)
-URI https://asc.fasb.org/extlink&oid=126973232&loc=d3e21506-112644
| Name: |
us-gaap_ConvertiblePreferredStockSharesIssuedUponConversion |
| Namespace Prefix: |
us-gaap_ |
| Data Type: |
xbrli:sharesItemType |
| Balance Type: |
na |
| Period Type: |
instant |
|
| X |
- DefinitionNumber of common shares issuable upon conversion of preferred stock. Reference 1: http://www.xbrl.org/2003/role/disclosureRef
-Publisher FASB
-Name Accounting Standards Codification
-Topic 505
-SubTopic 10
-Section 50
-Paragraph 13
-Subparagraph (c)
-URI https://asc.fasb.org/extlink&oid=126973232&loc=SL123496158-112644
| Name: |
us-gaap_PreferredStockConvertibleSharesIssuable |
| Namespace Prefix: |
us-gaap_ |
| Data Type: |
xbrli:sharesItemType |
| Balance Type: |
na |
| Period Type: |
instant |
|
| X |
- DefinitionFace amount or stated value per share of preferred stock nonredeemable or redeemable solely at the option of the issuer. Reference 1: http://fasb.org/us-gaap/role/ref/legacyRef
-Publisher FASB
-Name Accounting Standards Codification
-Topic 210
-SubTopic 10
-Section S99
-Paragraph 1
-Subparagraph (SX 210.5-02(28))
-URI https://asc.fasb.org/extlink&oid=120391452&loc=d3e13212-122682
Reference 2: http://www.xbrl.org/2003/role/disclosureRef
-Publisher FASB
-Name Accounting Standards Codification
-Topic 505
-SubTopic 10
-Section 50
-Paragraph 13
-Subparagraph (a)
-URI https://asc.fasb.org/extlink&oid=126973232&loc=SL123496158-112644
| Name: |
us-gaap_PreferredStockParOrStatedValuePerShare |
| Namespace Prefix: |
us-gaap_ |
| Data Type: |
dtr-types:perShareItemType |
| Balance Type: |
na |
| Period Type: |
instant |
|
| X |
- DefinitionThe maximum number of nonredeemable preferred shares (or preferred stock redeemable solely at the option of the issuer) permitted to be issued by an entity's charter and bylaws. Reference 1: http://fasb.org/us-gaap/role/ref/legacyRef
-Publisher FASB
-Name Accounting Standards Codification
-Topic 210
-SubTopic 10
-Section S99
-Paragraph 1
-Subparagraph (SX 210.5-02(28))
-URI https://asc.fasb.org/extlink&oid=120391452&loc=d3e13212-122682
| Name: |
us-gaap_PreferredStockSharesAuthorized |
| Namespace Prefix: |
us-gaap_ |
| Data Type: |
xbrli:sharesItemType |
| Balance Type: |
na |
| Period Type: |
instant |
|
| X |
- DefinitionTotal number of nonredeemable preferred shares (or preferred stock redeemable solely at the option of the issuer) issued to shareholders (includes related preferred shares that were issued, repurchased, and remain in the treasury). May be all or portion of the number of preferred shares authorized. Excludes preferred shares that are classified as debt. Reference 1: http://fasb.org/us-gaap/role/ref/legacyRef
-Publisher FASB
-Name Accounting Standards Codification
-Topic 210
-SubTopic 10
-Section S99
-Paragraph 1
-Subparagraph (SX 210.5-02(28))
-URI https://asc.fasb.org/extlink&oid=120391452&loc=d3e13212-122682
Reference 2: http://www.xbrl.org/2003/role/disclosureRef
-Publisher FASB
-Name Accounting Standards Codification
-Topic 505
-SubTopic 10
-Section 50
-Paragraph 13
-Subparagraph (a)
-URI https://asc.fasb.org/extlink&oid=126973232&loc=SL123496158-112644
| Name: |
us-gaap_PreferredStockSharesIssued |
| Namespace Prefix: |
us-gaap_ |
| Data Type: |
xbrli:sharesItemType |
| Balance Type: |
na |
| Period Type: |
instant |
|
| X |
- DefinitionNumber of shares issued in lieu of cash for services contributed to the entity. Number of shares includes, but is not limited to, shares issued for services contributed by vendors and founders.
| Name: |
us-gaap_StockIssuedDuringPeriodSharesIssuedForServices |
| Namespace Prefix: |
us-gaap_ |
| Data Type: |
xbrli:sharesItemType |
| Balance Type: |
na |
| Period Type: |
duration |
|
| X |
- DefinitionNumber of new stock issued during the period. Reference 1: http://fasb.org/us-gaap/role/ref/legacyRef
-Publisher FASB
-Name Accounting Standards Codification
-Topic 210
-SubTopic 10
-Section S99
-Paragraph 1
-Subparagraph (SX 210.5-02(29))
-URI https://asc.fasb.org/extlink&oid=120391452&loc=d3e13212-122682
Reference 2: http://fasb.org/us-gaap/role/ref/legacyRef
-Publisher FASB
-Name Accounting Standards Codification
-Topic 505
-SubTopic 10
-Section 50
-Paragraph 2
-URI https://asc.fasb.org/extlink&oid=126973232&loc=d3e21463-112644
Reference 3: http://fasb.org/us-gaap/role/ref/legacyRef
-Publisher FASB
-Name Accounting Standards Codification
-Topic 505
-SubTopic 10
-Section S99
-Paragraph 1
-Subparagraph (SX 210.3-04)
-URI https://asc.fasb.org/extlink&oid=120397183&loc=d3e187085-122770
Reference 4: http://fasb.org/us-gaap/role/ref/legacyRef
-Publisher FASB
-Name Accounting Standards Codification
-Topic 210
-SubTopic 10
-Section S99
-Paragraph 1
-Subparagraph (SX 210.5-02(28))
-URI https://asc.fasb.org/extlink&oid=120391452&loc=d3e13212-122682
| Name: |
us-gaap_StockIssuedDuringPeriodSharesNewIssues |
| Namespace Prefix: |
us-gaap_ |
| Data Type: |
xbrli:sharesItemType |
| Balance Type: |
na |
| Period Type: |
duration |
|
| X |
- DefinitionNumber of shares (or other type of equity) forfeited during the period.
| Name: |
us-gaap_StockIssuedDuringPeriodSharesShareBasedCompensationForfeited |
| Namespace Prefix: |
us-gaap_ |
| Data Type: |
xbrli:sharesItemType |
| Balance Type: |
na |
| Period Type: |
duration |
|
| X |
- DefinitionValue of stock issued in lieu of cash for services contributed to the entity. Value of the stock issued includes, but is not limited to, services contributed by vendors and founders.
| Name: |
us-gaap_StockIssuedDuringPeriodValueIssuedForServices |
| Namespace Prefix: |
us-gaap_ |
| Data Type: |
xbrli:monetaryItemType |
| Balance Type: |
credit |
| Period Type: |
duration |
|
| X |
- DefinitionEquity impact of the value of new stock issued during the period. Includes shares issued in an initial public offering or a secondary public offering. Reference 1: http://fasb.org/us-gaap/role/ref/legacyRef
-Publisher FASB
-Name Accounting Standards Codification
-Topic 505
-SubTopic 10
-Section S99
-Paragraph 1
-Subparagraph (SX 210.3-04)
-URI https://asc.fasb.org/extlink&oid=120397183&loc=d3e187085-122770
Reference 2: http://fasb.org/us-gaap/role/ref/legacyRef
-Publisher FASB
-Name Accounting Standards Codification
-Topic 505
-SubTopic 10
-Section 50
-Paragraph 2
-URI https://asc.fasb.org/extlink&oid=126973232&loc=d3e21463-112644
Reference 3: http://fasb.org/us-gaap/role/ref/legacyRef
-Publisher FASB
-Name Accounting Standards Codification
-Topic 210
-SubTopic 10
-Section S99
-Paragraph 1
-Subparagraph (SX 210.5-02(29))
-URI https://asc.fasb.org/extlink&oid=120391452&loc=d3e13212-122682
Reference 4: http://fasb.org/us-gaap/role/ref/legacyRef
-Publisher FASB
-Name Accounting Standards Codification
-Topic 210
-SubTopic 10
-Section S99
-Paragraph 1
-Subparagraph (SX 210.5-02(28))
-URI https://asc.fasb.org/extlink&oid=120391452&loc=d3e13212-122682
| Name: |
us-gaap_StockIssuedDuringPeriodValueNewIssues |
| Namespace Prefix: |
us-gaap_ |
| Data Type: |
xbrli:monetaryItemType |
| Balance Type: |
credit |
| Period Type: |
duration |
|
| X |
- Details
| Name: |
srt_TitleOfIndividualAxis=DSGT_ConsultantMember |
| Namespace Prefix: |
|
| Data Type: |
na |
| Balance Type: |
|
| Period Type: |
|
|
| X |
- Details
| Name: |
us-gaap_StatementClassOfStockAxis=us-gaap_SeriesAPreferredStockMember |
| Namespace Prefix: |
|
| Data Type: |
na |
| Balance Type: |
|
| Period Type: |
|
|
| X |
- Details
| Name: |
us-gaap_StatementClassOfStockAxis=DSGT_SeriesBConvertiblePreferredStockMember |
| Namespace Prefix: |
|
| Data Type: |
na |
| Balance Type: |
|
| Period Type: |
|
|
| X |
- Details
| Name: |
us-gaap_StatementClassOfStockAxis=us-gaap_SeriesBPreferredStockMember |
| Namespace Prefix: |
|
| Data Type: |
na |
| Balance Type: |
|
| Period Type: |
|
|
| X |
- Details
| Name: |
srt_TitleOfIndividualAxis=srt_ChiefExecutiveOfficerMember |
| Namespace Prefix: |
|
| Data Type: |
na |
| Balance Type: |
|
| Period Type: |
|
|
| X |
- Details
| Name: |
srt_TitleOfIndividualAxis=srt_DirectorMember |
| Namespace Prefix: |
|
| Data Type: |
na |
| Balance Type: |
|
| Period Type: |
|
|
| X |
- Details
| Name: |
us-gaap_StatementClassOfStockAxis=us-gaap_CommonStockMember |
| Namespace Prefix: |
|
| Data Type: |
na |
| Balance Type: |
|
| Period Type: |
|
|
v3.23.2
SCHEDULE OF WARRANTS ASSUMPTIONS (Details)
|
Dec. 31, 2022 |
Dec. 31, 2021 |
| Measurement Input, Risk Free Interest Rate [Member] | Minimum [Member] |
|
|
| Fair Value Measurement Inputs and Valuation Techniques [Line Items] |
|
|
| Warrants and rights outstanding, measurement input |
0.18
|
0.18
|
| Measurement Input, Risk Free Interest Rate [Member] | Maximum [Member] |
|
|
| Fair Value Measurement Inputs and Valuation Techniques [Line Items] |
|
|
| Warrants and rights outstanding, measurement input |
0.82
|
0.82
|
| Measurement Input, Expected Term [Member] | Minimum [Member] |
|
|
| Fair Value Measurement Inputs and Valuation Techniques [Line Items] |
|
|
| Warrants and rights outstanding, measurement input |
3 years 3 months 14 days
|
3 years 3 months 14 days
|
| Measurement Input, Expected Term [Member] | Maximum [Member] |
|
|
| Fair Value Measurement Inputs and Valuation Techniques [Line Items] |
|
|
| Warrants and rights outstanding, measurement input |
5 years 1 month 9 days
|
5 years 1 month 9 days
|
| Measurement Input, Expected Dividend Rate [Member] |
|
|
| Fair Value Measurement Inputs and Valuation Techniques [Line Items] |
|
|
| Warrants and rights outstanding, measurement input |
0
|
0
|
| Measurement Input, Price Volatility [Member] | Minimum [Member] |
|
|
| Fair Value Measurement Inputs and Valuation Techniques [Line Items] |
|
|
| Warrants and rights outstanding, measurement input |
285.40
|
285.40
|
| Measurement Input, Price Volatility [Member] | Maximum [Member] |
|
|
| Fair Value Measurement Inputs and Valuation Techniques [Line Items] |
|
|
| Warrants and rights outstanding, measurement input |
300.18
|
300.18
|
| X |
- DefinitionLine items represent financial concepts included in a table. These concepts are used to disclose reportable information associated with domain members defined in one or many axes to the table.
| Name: |
us-gaap_FairValueAssetsAndLiabilitiesMeasuredOnRecurringAndNonrecurringBasisValuationTechniquesLineItems |
| Namespace Prefix: |
us-gaap_ |
| Data Type: |
xbrli:stringItemType |
| Balance Type: |
na |
| Period Type: |
duration |
|
| X |
- DefinitionPeriod between issuance and expiration of outstanding warrant and right embodying unconditional obligation requiring redemption by transferring asset at specified or determinable date or upon event certain to occur, in 'PnYnMnDTnHnMnS' format, for example, 'P1Y5M13D' represents reported fact of one year, five months, and thirteen days. Reference 1: http://www.xbrl.org/2009/role/commonPracticeRef
-Publisher FASB
-Name Accounting Standards Codification
-Topic 820
-SubTopic 10
-Section 50
-Paragraph 2
-Subparagraph (bbb)(2)
-URI https://asc.fasb.org/extlink&oid=126976982&loc=d3e19207-110258
| Name: |
us-gaap_WarrantsAndRightsOutstandingTerm |
| Namespace Prefix: |
us-gaap_ |
| Data Type: |
xbrli:durationItemType |
| Balance Type: |
na |
| Period Type: |
instant |
|
| X |
- Details
| Name: |
srt_RangeAxis=srt_MinimumMember |
| Namespace Prefix: |
|
| Data Type: |
na |
| Balance Type: |
|
| Period Type: |
|
|
| X |
- Details
| Name: |
srt_RangeAxis=srt_MaximumMember |
| Namespace Prefix: |
|
| Data Type: |
na |
| Balance Type: |
|
| Period Type: |
|
|
v3.23.2
SCHEDULE OF WARRANTS OUTSTANDING (Details) - $ / shares
|
12 Months Ended |
Dec. 31, 2022 |
Dec. 31, 2021 |
| Equity [Abstract] |
|
|
| Warrants Outstanding, Balance, shares |
16,439,813
|
12,939,813
|
| Weighted average exercise price, outstanding, balance, share |
$ 0.56
|
$ 0.60
|
| Warrants, Granted |
|
3,500,000
|
| Weighted average exercise price, granted |
|
$ 0.41
|
| Warrants, Expired |
6,813,371
|
|
| Weighted average exercise price, expired |
$ 0.78
|
|
| Warrants Outstanding, Balance, shares |
9,626,442
|
16,439,813
|
| Weighted average exercise price, outstanding, balance, share |
$ 0.40
|
$ 0.56
|
| X |
- DefinitionShare-based compensation arrangement by share-based payment award, non-options, outstanding, weighted average exercise price
| Name: |
DSGT_ShareBasedCompensationArrangementByShareBasedPaymentAwardNonOptionsOutstandingWeightedAverageExercisePrice |
| Namespace Prefix: |
DSGT_ |
| Data Type: |
dtr-types:perShareItemType |
| Balance Type: |
na |
| Period Type: |
instant |
|
| X |
- DefinitionShare based compensation arrangements by share based payment award non options expire in period weighted average exercise price.
| Name: |
DSGT_ShareBasedCompensationArrangementsByShareBasedPaymentAwardNonOptionsExpireInPeriodWeightedAverageExercisePrice |
| Namespace Prefix: |
DSGT_ |
| Data Type: |
dtr-types:perShareItemType |
| Balance Type: |
na |
| Period Type: |
duration |
|
| X |
- DefinitionShare-based compensation arrangements by share-based payment award, non-options, grants in period, weighted average exercise price.
| Name: |
DSGT_ShareBasedCompensationArrangementsByShareBasedPaymentAwardNonOptionsGrantsInPeriodWeightedAverageExercisePrice |
| Namespace Prefix: |
DSGT_ |
| Data Type: |
dtr-types:perShareItemType |
| Balance Type: |
na |
| Period Type: |
duration |
|
| X |
- References
+ Details
| Name: |
us-gaap_EquityAbstract |
| Namespace Prefix: |
us-gaap_ |
| Data Type: |
xbrli:stringItemType |
| Balance Type: |
na |
| Period Type: |
duration |
|
| X |
- DefinitionNumber of non-option equity instruments exercised by participants. Reference 1: http://fasb.org/us-gaap/role/ref/legacyRef
-Publisher FASB
-Name Accounting Standards Codification
-Topic 718
-SubTopic 10
-Section 50
-Paragraph 2
-Subparagraph (c)(1)(iv)(2)
-URI https://asc.fasb.org/extlink&oid=128089324&loc=d3e5070-113901
| Name: |
us-gaap_ShareBasedCompensationArrangementByShareBasedPaymentAwardNonOptionEquityInstrumentsExercised |
| Namespace Prefix: |
us-gaap_ |
| Data Type: |
xbrli:sharesItemType |
| Balance Type: |
na |
| Period Type: |
duration |
|
| X |
- DefinitionNet number of non-option equity instruments granted to participants. Reference 1: http://fasb.org/us-gaap/role/ref/legacyRef
-Publisher FASB
-Name Accounting Standards Codification
-Topic 718
-SubTopic 10
-Section 50
-Paragraph 2
-Subparagraph (c)(1)(iv)(1)
-URI https://asc.fasb.org/extlink&oid=128089324&loc=d3e5070-113901
| Name: |
us-gaap_ShareBasedCompensationArrangementByShareBasedPaymentAwardNonOptionEquityInstrumentsGranted |
| Namespace Prefix: |
us-gaap_ |
| Data Type: |
xbrli:sharesItemType |
| Balance Type: |
na |
| Period Type: |
duration |
|
| X |
- DefinitionNumber of equity instruments other than options outstanding, including both vested and non-vested instruments. Reference 1: http://fasb.org/us-gaap/role/ref/legacyRef
-Publisher FASB
-Name Accounting Standards Codification
-Topic 718
-SubTopic 10
-Section 50
-Paragraph 2
-Subparagraph (c)(1)(ii)
-URI https://asc.fasb.org/extlink&oid=128089324&loc=d3e5070-113901
Reference 2: http://fasb.org/us-gaap/role/ref/legacyRef
-Publisher FASB
-Name Accounting Standards Codification
-Topic 718
-SubTopic 10
-Section 50
-Paragraph 2
-Subparagraph (c)(1)(i)
-URI https://asc.fasb.org/extlink&oid=128089324&loc=d3e5070-113901
| Name: |
us-gaap_ShareBasedCompensationArrangementByShareBasedPaymentAwardNonOptionEquityInstrumentsOutstandingNumber |
| Namespace Prefix: |
us-gaap_ |
| Data Type: |
xbrli:sharesItemType |
| Balance Type: |
na |
| Period Type: |
instant |
|
v3.23.2
COMMON STOCK AND ADDITIONAL PAID IN CAPITAL (Details Narrative) - USD ($)
|
|
|
|
|
|
|
|
|
|
|
|
|
|
|
|
12 Months Ended |
|
|
Nov. 03, 2022 |
Oct. 21, 2022 |
Sep. 15, 2022 |
Aug. 26, 2022 |
Mar. 31, 2022 |
Feb. 07, 2022 |
Jan. 04, 2022 |
Dec. 31, 2021 |
Dec. 14, 2021 |
Jul. 20, 2021 |
Jun. 10, 2021 |
Mar. 04, 2021 |
Feb. 17, 2021 |
Dec. 23, 2020 |
May 21, 2020 |
Dec. 31, 2022 |
Dec. 31, 2021 |
Dec. 31, 2020 |
Oct. 26, 2020 |
| Accumulated Other Comprehensive Income (Loss) [Line Items] |
|
|
|
|
|
|
|
|
|
|
|
|
|
|
|
|
|
|
|
| Common stock, shares authorized |
|
|
|
|
|
|
|
350,000,000
|
|
|
|
|
|
|
|
350,000,000
|
350,000,000
|
|
|
| Common stock, par value |
|
|
|
|
|
|
|
$ 0.001
|
|
|
|
|
|
|
|
$ 0.001
|
$ 0.001
|
|
|
| Issuance common stock expenses |
|
|
|
|
|
|
|
|
|
|
|
|
|
|
|
|
$ 19,647
|
|
|
| Prepaid expenses |
|
|
|
|
|
|
|
$ 26,353
|
|
|
|
|
|
|
|
|
26,353
|
|
|
| Common stock shares issued for services |
|
|
|
|
|
|
|
|
|
|
|
|
|
|
|
|
849,600
|
|
|
| Shares issued on conversion of preferred shares, value |
|
|
|
|
|
|
|
|
|
|
|
|
|
|
|
$ 302,557
|
$ 2,088,100
|
|
|
| Consultant [Member] |
|
|
|
|
|
|
|
|
|
|
|
|
|
|
|
|
|
|
|
| Accumulated Other Comprehensive Income (Loss) [Line Items] |
|
|
|
|
|
|
|
|
|
|
|
|
|
|
|
|
|
|
|
| common stock shares issued for services |
|
|
|
|
|
|
|
|
|
|
|
|
|
|
|
|
2,430,000
|
|
|
| Common stock shares issued for services |
|
|
|
|
|
|
|
|
|
|
|
|
|
|
|
|
$ 565,250
|
|
|
| Series F Preferred Stock [Member] |
|
|
|
|
|
|
|
|
|
|
|
|
|
|
|
|
|
|
|
| Accumulated Other Comprehensive Income (Loss) [Line Items] |
|
|
|
|
|
|
|
|
|
|
|
|
|
|
|
|
|
|
|
| Shares issued on conversion of preferred shares, value |
|
|
|
|
|
|
|
|
|
|
|
|
|
|
|
$ 302,557
|
$ 625,803
|
|
|
| Shares conversion |
|
|
|
|
|
|
|
|
|
|
|
|
|
|
|
470
|
976
|
|
|
| Series B Preferred Stock [Member] |
|
|
|
|
|
|
|
|
|
|
|
|
|
|
|
|
|
|
|
| Accumulated Other Comprehensive Income (Loss) [Line Items] |
|
|
|
|
|
|
|
|
|
|
|
|
|
|
|
|
|
|
|
| Stock issued during period, shares, new issues |
|
|
|
|
|
|
|
|
|
|
|
|
100
|
|
|
|
|
|
|
| common stock shares issued for services |
|
|
|
|
|
|
|
|
|
|
|
16
|
|
|
136
|
|
|
|
|
| Common stock shares issued for services |
|
|
|
|
|
|
|
|
|
|
|
$ 849,600
|
|
|
|
|
|
|
|
| Shares issued on conversion of preferred shares, value |
|
|
|
|
|
|
|
|
|
|
|
|
|
|
|
|
$ 1,734,800
|
|
|
| Shares conversion |
|
|
|
|
|
|
|
|
|
|
|
|
|
|
|
|
125
|
|
|
| Number of warrants issued |
|
|
|
|
|
|
|
|
|
|
|
|
|
|
|
|
|
|
1,000,000
|
| Series B Preferred Stock [Member] | Consultant [Member] |
|
|
|
|
|
|
|
|
|
|
|
|
|
|
|
|
|
|
|
| Accumulated Other Comprehensive Income (Loss) [Line Items] |
|
|
|
|
|
|
|
|
|
|
|
|
|
|
|
|
|
|
|
| Stock issued during period, shares, new issues |
30
|
|
|
|
|
|
|
|
|
|
|
|
|
|
|
|
|
|
|
| Stock issued during period, value, new issues |
$ 213,000
|
|
|
|
|
|
|
|
|
|
|
|
|
|
|
|
|
|
|
| Series C Preferred Stock [Member] |
|
|
|
|
|
|
|
|
|
|
|
|
|
|
|
|
|
|
|
| Accumulated Other Comprehensive Income (Loss) [Line Items] |
|
|
|
|
|
|
|
|
|
|
|
|
|
|
|
|
|
|
|
| Shares issued on conversion of preferred shares, value |
|
|
|
|
|
|
|
|
|
|
|
|
|
|
|
|
$ 1,462,296
|
|
|
| Shares conversion |
|
|
|
|
|
|
|
|
|
|
|
|
|
|
|
|
1,512
|
|
|
| Common Stock [Member] |
|
|
|
|
|
|
|
|
|
|
|
|
|
|
|
|
|
|
|
| Accumulated Other Comprehensive Income (Loss) [Line Items] |
|
|
|
|
|
|
|
|
|
|
|
|
|
|
|
|
|
|
|
| Common stock shares issued for services |
|
|
|
|
|
|
|
|
|
|
|
|
|
|
|
|
|
|
|
| Shares issued on conversion of preferred shares, value |
|
|
|
|
|
|
|
|
|
|
|
|
|
|
|
$ 15,925
|
$ 23,048
|
|
|
| Shares conversion |
|
|
|
|
|
|
|
|
|
|
|
|
|
|
|
15,924,810
|
23,046,760
|
|
|
| Common Stock [Member] | Series F Preferred Stock [Member] |
|
|
|
|
|
|
|
|
|
|
|
|
|
|
|
|
|
|
|
| Accumulated Other Comprehensive Income (Loss) [Line Items] |
|
|
|
|
|
|
|
|
|
|
|
|
|
|
|
|
|
|
|
| Stock issued during period, shares, new issues |
|
|
|
|
|
|
|
|
|
|
|
|
|
|
|
15,924,810
|
|
|
|
| Common Stock [Member] | Series B Preferred Stock [Member] |
|
|
|
|
|
|
|
|
|
|
|
|
|
|
|
|
|
|
|
| Accumulated Other Comprehensive Income (Loss) [Line Items] |
|
|
|
|
|
|
|
|
|
|
|
|
|
|
|
|
|
|
|
| Stock issued during period, shares, new issues |
|
|
|
|
|
|
|
|
|
|
|
|
|
|
|
|
23,046,760
|
|
|
| Stock issued during period, value, new issues |
|
|
|
|
|
|
|
|
|
|
|
|
|
|
|
|
$ 3,822,829
|
|
|
| Payments for stock issuance costs |
|
|
|
|
|
|
|
|
|
|
|
|
|
|
|
|
2,000
|
|
|
| Common Stock To Be Issued [Member] |
|
|
|
|
|
|
|
|
|
|
|
|
|
|
|
|
|
|
|
| Accumulated Other Comprehensive Income (Loss) [Line Items] |
|
|
|
|
|
|
|
|
|
|
|
|
|
|
|
|
|
|
|
| Common stock shares issued for services |
|
|
|
|
|
|
|
|
|
|
|
|
|
|
|
|
|
|
|
| Shares issued on conversion of preferred shares, value |
|
|
|
|
|
|
|
|
|
|
|
|
|
|
|
|
|
|
|
| Warrant [Member] |
|
|
|
|
|
|
|
|
|
|
|
|
|
|
|
|
|
|
|
| Accumulated Other Comprehensive Income (Loss) [Line Items] |
|
|
|
|
|
|
|
|
|
|
|
|
|
|
|
|
|
|
|
| Number of warrants expired |
|
|
|
|
|
|
|
|
|
|
|
|
|
|
|
6,813,371
|
|
|
|
| Number of warrants issued |
|
|
|
|
|
|
|
1,000,000
|
|
|
|
|
|
|
|
|
1,000,000
|
|
|
| Warrants term |
|
|
|
|
|
|
|
3 years
|
|
|
|
|
|
|
|
|
3 years
|
|
|
| Class of warrant or right, exercise price of warrants or rights |
|
|
|
|
|
|
|
$ 0.25
|
|
|
|
|
|
|
|
|
$ 0.25
|
|
|
| Warrants and rights outstanding |
|
|
|
|
|
|
|
$ 163,998
|
|
|
|
|
|
|
|
|
$ 163,998
|
|
|
| Warrants weighted average remaining contractual life |
|
|
|
|
|
|
|
|
|
|
|
|
|
|
|
2 years 7 months 9 days
|
2 years 6 months 10 days
|
|
|
| Warrants intrinsic value |
|
|
|
|
|
|
|
|
|
|
|
|
|
|
|
|
|
|
|
| Warrant One [Member] |
|
|
|
|
|
|
|
|
|
|
|
|
|
|
|
|
|
|
|
| Accumulated Other Comprehensive Income (Loss) [Line Items] |
|
|
|
|
|
|
|
|
|
|
|
|
|
|
|
|
|
|
|
| Number of warrants issued |
|
|
|
|
|
|
|
500,000
|
|
|
|
|
|
|
|
|
500,000
|
|
|
| Warrants term |
|
|
|
|
|
|
|
4 years
|
|
|
|
|
|
|
|
|
4 years
|
|
|
| Class of warrant or right, exercise price of warrants or rights |
|
|
|
|
|
|
|
$ 1.00
|
|
|
|
|
|
|
|
|
$ 1.00
|
|
|
| Warrants and rights outstanding |
|
|
|
|
|
|
|
$ 668,461
|
|
|
|
|
|
|
|
|
$ 668,461
|
|
|
| Warrant Two [Member] |
|
|
|
|
|
|
|
|
|
|
|
|
|
|
|
|
|
|
|
| Accumulated Other Comprehensive Income (Loss) [Line Items] |
|
|
|
|
|
|
|
|
|
|
|
|
|
|
|
|
|
|
|
| Number of warrants issued |
|
|
|
|
|
|
|
2,000,000
|
|
|
|
|
|
|
|
|
2,000,000
|
|
|
| Warrants term |
|
|
|
|
|
|
|
5 years
|
|
|
|
|
|
|
|
|
5 years
|
|
|
| Class of warrant or right, exercise price of warrants or rights |
|
|
|
|
|
|
|
$ 0.35
|
|
|
|
|
|
|
|
|
$ 0.35
|
|
|
| Warrants and rights outstanding |
|
|
|
|
|
|
|
$ 410,425
|
|
|
|
|
|
|
|
|
$ 410,425
|
|
|
| Investor Relations [Member] |
|
|
|
|
|
|
|
|
|
|
|
|
|
|
|
|
|
|
|
| Accumulated Other Comprehensive Income (Loss) [Line Items] |
|
|
|
|
|
|
|
|
|
|
|
|
|
|
|
|
|
|
|
| Stock issued during period, shares, new issues |
|
|
|
|
|
|
|
|
|
|
|
|
|
|
|
500,000
|
|
|
|
| Stock issued during period, value, new issues |
|
|
|
|
|
|
|
|
|
|
|
|
|
|
|
$ 46,000
|
|
|
|
| Compensation expense |
|
|
|
|
|
|
|
|
|
|
|
|
|
|
|
$ 26,353
|
|
|
|
| Investor Relations [Member] | Common Stock [Member] |
|
|
|
|
|
|
|
|
|
|
|
|
|
|
|
|
|
|
|
| Accumulated Other Comprehensive Income (Loss) [Line Items] |
|
|
|
|
|
|
|
|
|
|
|
|
|
|
|
|
|
|
|
| Stock issued during period, shares, new issues |
|
|
|
|
|
|
|
|
|
|
|
|
|
|
|
160,000
|
|
|
|
| Stock issued during period, value, new issues |
|
|
|
|
|
|
|
|
|
|
|
|
|
|
|
$ 13,760
|
|
|
|
| Prepaid Legal Service [Member] | Common Stock [Member] |
|
|
|
|
|
|
|
|
|
|
|
|
|
|
|
|
|
|
|
| Accumulated Other Comprehensive Income (Loss) [Line Items] |
|
|
|
|
|
|
|
|
|
|
|
|
|
|
|
|
|
|
|
| common stock shares issued for services |
|
|
|
|
|
|
|
|
|
|
|
|
|
|
|
500,000
|
|
|
|
| Common stock shares issued for services |
|
|
|
|
|
|
|
|
|
|
|
|
|
|
|
$ 47,000
|
|
|
|
| Debt Settlement [Member] |
|
|
|
|
|
|
|
|
|
|
|
|
|
|
|
|
|
|
|
| Accumulated Other Comprehensive Income (Loss) [Line Items] |
|
|
|
|
|
|
|
|
|
|
|
|
|
|
|
|
|
|
|
| Stock issued during period, shares, new issues |
|
|
|
|
|
|
|
|
|
|
|
|
|
|
|
|
8,138,975
|
|
|
| Stock issued during period, value, new issues |
|
|
|
|
|
|
|
|
|
|
|
|
|
|
|
|
$ 1,436,044
|
|
|
| Treasury stock, common, shares |
|
|
|
|
|
|
|
|
|
|
|
|
|
|
|
|
|
1,751,288
|
|
| Legal Settlement [Member] | Common Stock [Member] |
|
|
|
|
|
|
|
|
|
|
|
|
|
|
|
|
|
|
|
| Accumulated Other Comprehensive Income (Loss) [Line Items] |
|
|
|
|
|
|
|
|
|
|
|
|
|
|
|
|
|
|
|
| Stock issued during period, shares, new issues |
|
|
|
|
|
|
|
|
|
|
|
|
|
|
|
|
715,000
|
|
|
| Stock issued during period, value, new issues |
|
|
|
|
|
|
|
|
|
|
|
|
|
|
|
|
$ 191,235
|
|
|
| Service Agreement [Member] | Common Stock To Be Issued [Member] |
|
|
|
|
|
|
|
|
|
|
|
|
|
|
|
|
|
|
|
| Accumulated Other Comprehensive Income (Loss) [Line Items] |
|
|
|
|
|
|
|
|
|
|
|
|
|
|
|
|
|
|
|
| Stock issued during period, shares, new issues |
|
|
|
|
|
|
|
|
|
|
|
|
|
|
|
|
97,260
|
|
|
| Stock issued during period, value, new issues |
|
|
|
|
|
|
|
|
|
|
|
|
|
|
|
|
$ 19,647
|
|
|
| Securities Purchase Agreement [Member] | Series F Preferred Stock [Member] |
|
|
|
|
|
|
|
|
|
|
|
|
|
|
|
|
|
|
|
| Accumulated Other Comprehensive Income (Loss) [Line Items] |
|
|
|
|
|
|
|
|
|
|
|
|
|
|
|
|
|
|
|
| Stock issued during period, shares, new issues |
|
96
|
125
|
250
|
250
|
250
|
250
|
250
|
312
|
|
350
|
|
|
1,000
|
|
|
|
|
|
| Stock issued during period, value, new issues |
|
|
|
|
|
|
|
|
|
$ 138,066
|
$ 350,000
|
|
|
|
|
|
|
|
|
| Securities Purchase Agreement [Member] | Warrant [Member] | Series F Preferred Stock [Member] |
|
|
|
|
|
|
|
|
|
|
|
|
|
|
|
|
|
|
|
| Accumulated Other Comprehensive Income (Loss) [Line Items] |
|
|
|
|
|
|
|
|
|
|
|
|
|
|
|
|
|
|
|
| Number of warrants issued |
|
|
|
|
|
|
|
|
|
1,180,000
|
|
|
|
|
|
|
|
|
|
| Warrants term |
|
|
|
|
|
|
|
|
|
5 years
|
|
|
|
|
|
|
|
|
|
| Class of warrant or right, exercise price of warrants or rights |
|
|
|
|
|
|
|
|
|
$ 0.30
|
|
|
|
|
|
|
|
|
|
| Warrants and rights outstanding |
|
|
|
|
|
|
|
|
|
$ 138,066
|
|
|
|
|
|
|
|
|
|
| X |
- DefinitionExpenses Recognized for Issuance of Stock.
| Name: |
DSGT_ExpensesRecognizedForIssuanceOfStock |
| Namespace Prefix: |
DSGT_ |
| Data Type: |
xbrli:monetaryItemType |
| Balance Type: |
debit |
| Period Type: |
duration |
|
| X |
- DefinitionWarrants weighted average remaining contractual life.
| Name: |
DSGT_WarrantsWeightedAverageRemainingContractualLife |
| Namespace Prefix: |
DSGT_ |
| Data Type: |
xbrli:durationItemType |
| Balance Type: |
na |
| Period Type: |
duration |
|
| X |
- DefinitionLine items represent financial concepts included in a table. These concepts are used to disclose reportable information associated with domain members defined in one or many axes to the table.
| Name: |
us-gaap_AccumulatedOtherComprehensiveIncomeLossLineItems |
| Namespace Prefix: |
us-gaap_ |
| Data Type: |
xbrli:stringItemType |
| Balance Type: |
na |
| Period Type: |
duration |
|
| X |
- DefinitionAmount of expense for award under share-based payment arrangement. Excludes amount capitalized. Reference 1: http://www.xbrl.org/2003/role/disclosureRef
-Publisher FASB
-Name Accounting Standards Codification
-Topic 718
-SubTopic 10
-Section 50
-Paragraph 2
-Subparagraph (h)(1)(i)
-URI https://asc.fasb.org/extlink&oid=128089324&loc=d3e5070-113901
| Name: |
us-gaap_AllocatedShareBasedCompensationExpense |
| Namespace Prefix: |
us-gaap_ |
| Data Type: |
xbrli:monetaryItemType |
| Balance Type: |
debit |
| Period Type: |
duration |
|
| X |
- DefinitionExercise price per share or per unit of warrants or rights outstanding. Reference 1: http://www.xbrl.org/2003/role/disclosureRef
-Publisher FASB
-Name Accounting Standards Codification
-Topic 505
-SubTopic 10
-Section 50
-Paragraph 3
-URI https://asc.fasb.org/extlink&oid=126973232&loc=d3e21475-112644
| Name: |
us-gaap_ClassOfWarrantOrRightExercisePriceOfWarrantsOrRights1 |
| Namespace Prefix: |
us-gaap_ |
| Data Type: |
dtr-types:perShareItemType |
| Balance Type: |
na |
| Period Type: |
instant |
|
| X |
- DefinitionNumber of securities into which the class of warrant or right may be converted. For example, but not limited to, 500,000 warrants may be converted into 1,000,000 shares. Reference 1: http://www.xbrl.org/2003/role/disclosureRef
-Publisher FASB
-Name Accounting Standards Codification
-Topic 505
-SubTopic 10
-Section 50
-Paragraph 3
-URI https://asc.fasb.org/extlink&oid=126973232&loc=d3e21475-112644
| Name: |
us-gaap_ClassOfWarrantOrRightNumberOfSecuritiesCalledByWarrantsOrRights |
| Namespace Prefix: |
us-gaap_ |
| Data Type: |
xbrli:sharesItemType |
| Balance Type: |
na |
| Period Type: |
instant |
|
| X |
- DefinitionFace amount or stated value per share of common stock. Reference 1: http://fasb.org/us-gaap/role/ref/legacyRef
-Publisher FASB
-Name Accounting Standards Codification
-Topic 210
-SubTopic 10
-Section S99
-Paragraph 1
-Subparagraph (SX 210.5-02(29))
-URI https://asc.fasb.org/extlink&oid=120391452&loc=d3e13212-122682
| Name: |
us-gaap_CommonStockParOrStatedValuePerShare |
| Namespace Prefix: |
us-gaap_ |
| Data Type: |
dtr-types:perShareItemType |
| Balance Type: |
na |
| Period Type: |
instant |
|
| X |
- DefinitionThe maximum number of common shares permitted to be issued by an entity's charter and bylaws. Reference 1: http://fasb.org/us-gaap/role/ref/legacyRef
-Publisher FASB
-Name Accounting Standards Codification
-Topic 210
-SubTopic 10
-Section S99
-Paragraph 1
-Subparagraph (SX 210.5-02(29))
-URI https://asc.fasb.org/extlink&oid=120391452&loc=d3e13212-122682
| Name: |
us-gaap_CommonStockSharesAuthorized |
| Namespace Prefix: |
us-gaap_ |
| Data Type: |
xbrli:sharesItemType |
| Balance Type: |
na |
| Period Type: |
instant |
|
| X |
- DefinitionThe cash outflow for cost incurred directly with the issuance of an equity security. Reference 1: http://fasb.org/us-gaap/role/ref/legacyRef
-Publisher FASB
-Name Accounting Standards Codification
-Topic 230
-SubTopic 10
-Section 45
-Paragraph 15
-URI https://asc.fasb.org/extlink&oid=126954810&loc=d3e3291-108585
| Name: |
us-gaap_PaymentsOfStockIssuanceCosts |
| Namespace Prefix: |
us-gaap_ |
| Data Type: |
xbrli:monetaryItemType |
| Balance Type: |
credit |
| Period Type: |
duration |
|
| X |
- DefinitionCarrying amount as of the balance sheet date of expenditures made in advance of when the economic benefit of the cost will be realized, and which will be expensed in future periods with the passage of time or when a triggering event occurs. Reference 1: http://www.xbrl.org/2003/role/disclosureRef
-Publisher FASB
-Name Accounting Standards Codification
-Topic 210
-SubTopic 10
-Section S99
-Paragraph 1
-Subparagraph (SX 210.5-02(7))
-URI https://asc.fasb.org/extlink&oid=120391452&loc=d3e13212-122682
Reference 2: http://fasb.org/us-gaap/role/ref/legacyRef
-Publisher FASB
-Name Accounting Standards Codification
-Topic 942
-SubTopic 210
-Section S99
-Paragraph 1
-Subparagraph (SX 210.9-03.10)
-URI https://asc.fasb.org/extlink&oid=126897435&loc=d3e534808-122878
Reference 3: http://fasb.org/us-gaap/role/ref/legacyRef
-Publisher FASB
-Name Accounting Standards Codification
-Topic 944
-SubTopic 210
-Section S99
-Paragraph 1
-Subparagraph (SX 210.7-03.10)
-URI https://asc.fasb.org/extlink&oid=126734703&loc=d3e572229-122910
| Name: |
us-gaap_PrepaidExpenseCurrentAndNoncurrent |
| Namespace Prefix: |
us-gaap_ |
| Data Type: |
xbrli:monetaryItemType |
| Balance Type: |
debit |
| Period Type: |
instant |
|
| X |
- DefinitionFor presentations that combine terminations, the number of shares under options that were cancelled during the reporting period as a result of occurrence of a terminating event specified in contractual agreements pertaining to the stock option plan or that expired. Reference 1: http://www.xbrl.org/2009/role/commonPracticeRef
-Publisher FASB
-Name Accounting Standards Codification
-Topic 718
-SubTopic 10
-Section 50
-Paragraph 2
-Subparagraph (c)(1)(iv)
-URI https://asc.fasb.org/extlink&oid=128089324&loc=d3e5070-113901
| Name: |
us-gaap_ShareBasedCompensationArrangementByShareBasedPaymentAwardOptionsForfeituresAndExpirationsInPeriod |
| Namespace Prefix: |
us-gaap_ |
| Data Type: |
xbrli:sharesItemType |
| Balance Type: |
na |
| Period Type: |
duration |
|
| X |
- DefinitionIntrinsic value of outstanding award under share-based payment arrangement. Excludes share and unit options.
| Name: |
us-gaap_SharebasedCompensationArrangementBySharebasedPaymentAwardEquityInstrumentsOtherThanOptionsAggregateIntrinsicValueOutstanding |
| Namespace Prefix: |
us-gaap_ |
| Data Type: |
xbrli:monetaryItemType |
| Balance Type: |
debit |
| Period Type: |
instant |
|
| X |
- DefinitionNumber of shares issued during the period as a result of the conversion of convertible securities. Reference 1: http://fasb.org/us-gaap/role/ref/legacyRef
-Publisher FASB
-Name Accounting Standards Codification
-Topic 505
-SubTopic 10
-Section S99
-Paragraph 1
-Subparagraph (SX 210.3-04)
-URI https://asc.fasb.org/extlink&oid=120397183&loc=d3e187085-122770
Reference 2: http://fasb.org/us-gaap/role/ref/legacyRef
-Publisher FASB
-Name Accounting Standards Codification
-Topic 210
-SubTopic 10
-Section S99
-Paragraph 1
-Subparagraph (SX 210.5-02.29-30)
-URI https://asc.fasb.org/extlink&oid=120391452&loc=d3e13212-122682
Reference 3: http://www.xbrl.org/2003/role/disclosureRef
-Publisher FASB
-Name Accounting Standards Codification
-Topic 470
-SubTopic 20
-Section 50
-Paragraph 1E
-Subparagraph (c)
-URI https://asc.fasb.org/extlink&oid=123466505&loc=SL123495348-112611
Reference 4: http://fasb.org/us-gaap/role/ref/legacyRef
-Publisher FASB
-Name Accounting Standards Codification
-Topic 505
-SubTopic 10
-Section 50
-Paragraph 3
-URI https://asc.fasb.org/extlink&oid=126973232&loc=d3e21475-112644
Reference 5: http://fasb.org/us-gaap/role/ref/legacyRef
-Publisher FASB
-Name Accounting Standards Codification
-Topic 505
-SubTopic 10
-Section 50
-Paragraph 2
-URI https://asc.fasb.org/extlink&oid=126973232&loc=d3e21463-112644
| Name: |
us-gaap_StockIssuedDuringPeriodSharesConversionOfConvertibleSecurities |
| Namespace Prefix: |
us-gaap_ |
| Data Type: |
xbrli:sharesItemType |
| Balance Type: |
na |
| Period Type: |
duration |
|
| X |
- DefinitionNumber of shares issued in lieu of cash for services contributed to the entity. Number of shares includes, but is not limited to, shares issued for services contributed by vendors and founders.
| Name: |
us-gaap_StockIssuedDuringPeriodSharesIssuedForServices |
| Namespace Prefix: |
us-gaap_ |
| Data Type: |
xbrli:sharesItemType |
| Balance Type: |
na |
| Period Type: |
duration |
|
| X |
- DefinitionNumber of new stock issued during the period. Reference 1: http://fasb.org/us-gaap/role/ref/legacyRef
-Publisher FASB
-Name Accounting Standards Codification
-Topic 210
-SubTopic 10
-Section S99
-Paragraph 1
-Subparagraph (SX 210.5-02(29))
-URI https://asc.fasb.org/extlink&oid=120391452&loc=d3e13212-122682
Reference 2: http://fasb.org/us-gaap/role/ref/legacyRef
-Publisher FASB
-Name Accounting Standards Codification
-Topic 505
-SubTopic 10
-Section 50
-Paragraph 2
-URI https://asc.fasb.org/extlink&oid=126973232&loc=d3e21463-112644
Reference 3: http://fasb.org/us-gaap/role/ref/legacyRef
-Publisher FASB
-Name Accounting Standards Codification
-Topic 505
-SubTopic 10
-Section S99
-Paragraph 1
-Subparagraph (SX 210.3-04)
-URI https://asc.fasb.org/extlink&oid=120397183&loc=d3e187085-122770
Reference 4: http://fasb.org/us-gaap/role/ref/legacyRef
-Publisher FASB
-Name Accounting Standards Codification
-Topic 210
-SubTopic 10
-Section S99
-Paragraph 1
-Subparagraph (SX 210.5-02(28))
-URI https://asc.fasb.org/extlink&oid=120391452&loc=d3e13212-122682
| Name: |
us-gaap_StockIssuedDuringPeriodSharesNewIssues |
| Namespace Prefix: |
us-gaap_ |
| Data Type: |
xbrli:sharesItemType |
| Balance Type: |
na |
| Period Type: |
duration |
|
| X |
- DefinitionThe gross value of stock issued during the period upon the conversion of convertible securities. Reference 1: http://fasb.org/us-gaap/role/ref/legacyRef
-Publisher FASB
-Name Accounting Standards Codification
-Topic 505
-SubTopic 10
-Section 50
-Paragraph 2
-URI https://asc.fasb.org/extlink&oid=126973232&loc=d3e21463-112644
Reference 2: http://fasb.org/us-gaap/role/ref/legacyRef
-Publisher FASB
-Name Accounting Standards Codification
-Topic 505
-SubTopic 10
-Section S99
-Paragraph 1
-Subparagraph (SX 210.3-04)
-URI https://asc.fasb.org/extlink&oid=120397183&loc=d3e187085-122770
Reference 3: http://fasb.org/us-gaap/role/ref/legacyRef
-Publisher FASB
-Name Accounting Standards Codification
-Topic 210
-SubTopic 10
-Section S99
-Paragraph 1
-Subparagraph (SX 210.5-02.29-31)
-URI https://asc.fasb.org/extlink&oid=120391452&loc=d3e13212-122682
| Name: |
us-gaap_StockIssuedDuringPeriodValueConversionOfConvertibleSecurities |
| Namespace Prefix: |
us-gaap_ |
| Data Type: |
xbrli:monetaryItemType |
| Balance Type: |
credit |
| Period Type: |
duration |
|
| X |
- DefinitionValue of stock issued in lieu of cash for services contributed to the entity. Value of the stock issued includes, but is not limited to, services contributed by vendors and founders.
| Name: |
us-gaap_StockIssuedDuringPeriodValueIssuedForServices |
| Namespace Prefix: |
us-gaap_ |
| Data Type: |
xbrli:monetaryItemType |
| Balance Type: |
credit |
| Period Type: |
duration |
|
| X |
- DefinitionEquity impact of the value of new stock issued during the period. Includes shares issued in an initial public offering or a secondary public offering. Reference 1: http://fasb.org/us-gaap/role/ref/legacyRef
-Publisher FASB
-Name Accounting Standards Codification
-Topic 505
-SubTopic 10
-Section S99
-Paragraph 1
-Subparagraph (SX 210.3-04)
-URI https://asc.fasb.org/extlink&oid=120397183&loc=d3e187085-122770
Reference 2: http://fasb.org/us-gaap/role/ref/legacyRef
-Publisher FASB
-Name Accounting Standards Codification
-Topic 505
-SubTopic 10
-Section 50
-Paragraph 2
-URI https://asc.fasb.org/extlink&oid=126973232&loc=d3e21463-112644
Reference 3: http://fasb.org/us-gaap/role/ref/legacyRef
-Publisher FASB
-Name Accounting Standards Codification
-Topic 210
-SubTopic 10
-Section S99
-Paragraph 1
-Subparagraph (SX 210.5-02(29))
-URI https://asc.fasb.org/extlink&oid=120391452&loc=d3e13212-122682
Reference 4: http://fasb.org/us-gaap/role/ref/legacyRef
-Publisher FASB
-Name Accounting Standards Codification
-Topic 210
-SubTopic 10
-Section S99
-Paragraph 1
-Subparagraph (SX 210.5-02(28))
-URI https://asc.fasb.org/extlink&oid=120391452&loc=d3e13212-122682
| Name: |
us-gaap_StockIssuedDuringPeriodValueNewIssues |
| Namespace Prefix: |
us-gaap_ |
| Data Type: |
xbrli:monetaryItemType |
| Balance Type: |
credit |
| Period Type: |
duration |
|
| X |
- DefinitionNumber of previously issued common shares repurchased by the issuing entity and held in treasury. Reference 1: http://fasb.org/us-gaap/role/ref/legacyRef
-Publisher FASB
-Name Accounting Standards Codification
-Topic 505
-SubTopic 30
-Section 45
-Paragraph 1
-URI https://asc.fasb.org/extlink&oid=6405813&loc=d3e23239-112655
| Name: |
us-gaap_TreasuryStockCommonShares |
| Namespace Prefix: |
us-gaap_ |
| Data Type: |
xbrli:sharesItemType |
| Balance Type: |
na |
| Period Type: |
instant |
|
| X |
- DefinitionValue of outstanding derivative securities that permit the holder the right to purchase securities (usually equity) from the issuer at a specified price.
| Name: |
us-gaap_WarrantsAndRightsOutstanding |
| Namespace Prefix: |
us-gaap_ |
| Data Type: |
xbrli:monetaryItemType |
| Balance Type: |
credit |
| Period Type: |
instant |
|
| X |
- DefinitionPeriod between issuance and expiration of outstanding warrant and right embodying unconditional obligation requiring redemption by transferring asset at specified or determinable date or upon event certain to occur, in 'PnYnMnDTnHnMnS' format, for example, 'P1Y5M13D' represents reported fact of one year, five months, and thirteen days. Reference 1: http://www.xbrl.org/2009/role/commonPracticeRef
-Publisher FASB
-Name Accounting Standards Codification
-Topic 820
-SubTopic 10
-Section 50
-Paragraph 2
-Subparagraph (bbb)(2)
-URI https://asc.fasb.org/extlink&oid=126976982&loc=d3e19207-110258
| Name: |
us-gaap_WarrantsAndRightsOutstandingTerm |
| Namespace Prefix: |
us-gaap_ |
| Data Type: |
xbrli:durationItemType |
| Balance Type: |
na |
| Period Type: |
instant |
|
| X |
- Details
| Name: |
srt_TitleOfIndividualAxis=DSGT_ConsultantMember |
| Namespace Prefix: |
|
| Data Type: |
na |
| Balance Type: |
|
| Period Type: |
|
|
| X |
- Details
| Name: |
us-gaap_StatementClassOfStockAxis=us-gaap_SeriesFPreferredStockMember |
| Namespace Prefix: |
|
| Data Type: |
na |
| Balance Type: |
|
| Period Type: |
|
|
| X |
- Details
| Name: |
us-gaap_StatementClassOfStockAxis=us-gaap_SeriesBPreferredStockMember |
| Namespace Prefix: |
|
| Data Type: |
na |
| Balance Type: |
|
| Period Type: |
|
|
| X |
- Details
| Name: |
us-gaap_StatementClassOfStockAxis=us-gaap_SeriesCPreferredStockMember |
| Namespace Prefix: |
|
| Data Type: |
na |
| Balance Type: |
|
| Period Type: |
|
|
| X |
- Details
| Name: |
us-gaap_StatementEquityComponentsAxis=us-gaap_CommonStockMember |
| Namespace Prefix: |
|
| Data Type: |
na |
| Balance Type: |
|
| Period Type: |
|
|
| X |
- Details
| Name: |
us-gaap_StatementEquityComponentsAxis=DSGT_CommonStockToBeIssuedMember |
| Namespace Prefix: |
|
| Data Type: |
na |
| Balance Type: |
|
| Period Type: |
|
|
| X |
- Details
| Name: |
us-gaap_StatementEquityComponentsAxis=us-gaap_WarrantMember |
| Namespace Prefix: |
|
| Data Type: |
na |
| Balance Type: |
|
| Period Type: |
|
|
| X |
- Details
| Name: |
us-gaap_StatementEquityComponentsAxis=DSGT_WarrantOneMember |
| Namespace Prefix: |
|
| Data Type: |
na |
| Balance Type: |
|
| Period Type: |
|
|
| X |
- Details
| Name: |
us-gaap_StatementEquityComponentsAxis=DSGT_WarrantTwoMember |
| Namespace Prefix: |
|
| Data Type: |
na |
| Balance Type: |
|
| Period Type: |
|
|
| X |
- Details
| Name: |
us-gaap_TypeOfArrangementAxis=DSGT_InvestorRelationsMember |
| Namespace Prefix: |
|
| Data Type: |
na |
| Balance Type: |
|
| Period Type: |
|
|
| X |
- Details
| Name: |
us-gaap_TypeOfArrangementAxis=DSGT_PrepaidLegalServiceMember |
| Namespace Prefix: |
|
| Data Type: |
na |
| Balance Type: |
|
| Period Type: |
|
|
| X |
- Details
| Name: |
us-gaap_TypeOfArrangementAxis=DSGT_DebtSettlementMember |
| Namespace Prefix: |
|
| Data Type: |
na |
| Balance Type: |
|
| Period Type: |
|
|
| X |
- Details
| Name: |
us-gaap_TypeOfArrangementAxis=DSGT_LegalSettlementMember |
| Namespace Prefix: |
|
| Data Type: |
na |
| Balance Type: |
|
| Period Type: |
|
|
| X |
- Details
| Name: |
us-gaap_TypeOfArrangementAxis=DSGT_ServiceAgreementMember |
| Namespace Prefix: |
|
| Data Type: |
na |
| Balance Type: |
|
| Period Type: |
|
|
| X |
- Details
| Name: |
us-gaap_TypeOfArrangementAxis=DSGT_SecuritiesPurchaseAgreementMember |
| Namespace Prefix: |
|
| Data Type: |
na |
| Balance Type: |
|
| Period Type: |
|
|
v3.23.2
RELATED PARTY TRANSACTIONS (Details Narrative)
|
|
|
12 Months Ended |
|
|
Mar. 04, 2021
USD ($)
shares
|
May 21, 2020
USD ($)
shares
|
Dec. 31, 2022
USD ($)
|
Dec. 31, 2021
USD ($)
|
Dec. 31, 2021
CAD ($)
|
| Related Party Transaction [Line Items] |
|
|
|
|
|
| Preferred shares issued for services |
|
|
|
$ 849,600
|
|
| Series B Preferred Stock [Member] |
|
|
|
|
|
| Related Party Transaction [Line Items] |
|
|
|
|
|
| Preferred shares issued for services, shares | shares |
16
|
136
|
|
|
|
| Preferred shares issued for services |
$ 849,600
|
|
|
|
|
| SeriesB Convertible Preferred Shares [Member] |
|
|
|
|
|
| Related Party Transaction [Line Items] |
|
|
|
|
|
| Preferred shares issued for services |
|
$ 767,040
|
|
|
|
| SeriesB Convertible Preferred Shares [Member] | Director [Member] |
|
|
|
|
|
| Related Party Transaction [Line Items] |
|
|
|
|
|
| Preferred shares issued for services, shares | shares |
|
2
|
|
|
|
| President, CEO and CFO [Member] |
|
|
|
|
|
| Related Party Transaction [Line Items] |
|
|
|
|
|
| Repayments of Related Party Debt |
|
|
$ 28,118
|
|
|
| Due to Related Parties |
|
|
$ 49,441
|
$ 28,118
|
$ 35,710
|
| Directors And Employees [Member] | SeriesB Convertible Preferred Shares [Member] |
|
|
|
|
|
| Related Party Transaction [Line Items] |
|
|
|
|
|
| Preferred shares issued for services, shares | shares |
|
122
|
|
|
|
| X |
- DefinitionNumber of shares issued in lieu of cash for services contributed to the entity. Number of shares includes, but is not limited to, shares issued for services contributed by vendors and founders.
| Name: |
us-gaap_StockIssuedDuringPeriodSharesIssuedForServices |
| Namespace Prefix: |
us-gaap_ |
| Data Type: |
xbrli:sharesItemType |
| Balance Type: |
na |
| Period Type: |
duration |
|
| X |
- DefinitionValue of stock issued in lieu of cash for services contributed to the entity. Value of the stock issued includes, but is not limited to, services contributed by vendors and founders.
| Name: |
us-gaap_StockIssuedDuringPeriodValueIssuedForServices |
| Namespace Prefix: |
us-gaap_ |
| Data Type: |
xbrli:monetaryItemType |
| Balance Type: |
credit |
| Period Type: |
duration |
|
| X |
- Details
| Name: |
us-gaap_StatementClassOfStockAxis=us-gaap_SeriesBPreferredStockMember |
| Namespace Prefix: |
|
| Data Type: |
na |
| Balance Type: |
|
| Period Type: |
|
|
| X |
- Details
| Name: |
us-gaap_StatementClassOfStockAxis=DSGT_SeriesBConvertiblePreferredSharesMember |
| Namespace Prefix: |
|
| Data Type: |
na |
| Balance Type: |
|
| Period Type: |
|
|
| X |
- Details
| Name: |
srt_TitleOfIndividualAxis=srt_DirectorMember |
| Namespace Prefix: |
|
| Data Type: |
na |
| Balance Type: |
|
| Period Type: |
|
|
v3.23.2
SCHEDULE OF SEGMENT REPORTING INFORMATION (Details) - USD ($)
|
12 Months Ended |
Dec. 31, 2022 |
Dec. 31, 2021 |
| Revenue from External Customer [Line Items] |
|
|
| Revenue |
$ 3,833,853
|
|
| Cost of revenue |
2,082,968
|
$ 1,110,698
|
| Gross profit |
1,750,885
|
982,121
|
| Operating expenses |
|
|
| Compensation expense |
3,534,816
|
3,017,181
|
| General and administration expense |
3,429,075
|
3,467,995
|
| Research and development |
52,344
|
388,035
|
| Bad debt expense (recovery) |
(29,389)
|
49,586
|
| Depreciation and amortization expense |
13,670
|
12,837
|
| Total operating expense |
7,000,516
|
6,935,634
|
| Loss from operations |
(5,249,631)
|
(5,953,513)
|
| Other income (expense) |
|
|
| Foreign currency exchange |
(28,241)
|
(59,793)
|
| Loss on sale of lease receivable |
(3,923)
|
|
| (Loss) Gain on extinguishment of debt |
40,355
|
35,169
|
| Gain on disposal |
3,960
|
|
| Interest on preferred shares |
(3,062)
|
|
| Finance costs |
(2,306,849)
|
(420,102)
|
| Total other income (expense) |
(2,297,760)
|
(431,142)
|
| Net loss |
(7,547,391)
|
(6,384,655)
|
| Total Assets |
2,244,296
|
$ 2,612,240
|
| Administrative Service [Member] |
|
|
| Revenue from External Customer [Line Items] |
|
|
| Revenue |
|
|
| Cost of revenue |
|
|
| Gross profit |
|
|
| Operating expenses |
|
|
| Compensation expense |
2,151,306
|
|
| General and administration expense |
1,765,303
|
|
| Research and development |
|
|
| Bad debt expense (recovery) |
(29,389)
|
|
| Depreciation and amortization expense |
13,670
|
|
| Total operating expense |
3,900,891
|
|
| Loss from operations |
(3,900,891)
|
|
| Other income (expense) |
|
|
| Foreign currency exchange |
(28,241)
|
|
| Loss on sale of lease receivable |
|
|
| (Loss) Gain on extinguishment of debt |
40,355
|
|
| Gain on disposal |
|
|
| Interest on preferred shares |
(3,062)
|
|
| Finance costs |
(2,055,801)
|
|
| Total other income (expense) |
(2,046,749)
|
|
| Net loss |
(5,947,640)
|
|
| Total Assets |
164,567
|
|
| Electric Vehicles [Member] |
|
|
| Revenue from External Customer [Line Items] |
|
|
| Revenue |
221,567
|
|
| Cost of revenue |
191,367
|
|
| Gross profit |
30,200
|
|
| Operating expenses |
|
|
| Compensation expense |
268,324
|
|
| General and administration expense |
362,924
|
|
| Research and development |
17,500
|
|
| Bad debt expense (recovery) |
|
|
| Depreciation and amortization expense |
|
|
| Total operating expense |
648,748
|
|
| Loss from operations |
(618,548)
|
|
| Other income (expense) |
|
|
| Foreign currency exchange |
|
|
| Loss on sale of lease receivable |
|
|
| (Loss) Gain on extinguishment of debt |
|
|
| Gain on disposal |
3,960
|
|
| Interest on preferred shares |
|
|
| Finance costs |
|
|
| Total other income (expense) |
3,960
|
|
| Net loss |
(614,588)
|
|
| Total Assets |
351,561
|
|
| Golf Carts [Member] |
|
|
| Revenue from External Customer [Line Items] |
|
|
| Revenue |
1,394,964
|
|
| Cost of revenue |
827,299
|
|
| Gross profit |
567,665
|
|
| Operating expenses |
|
|
| Compensation expense |
123,789
|
|
| General and administration expense |
891,777
|
|
| Research and development |
34,844
|
|
| Bad debt expense (recovery) |
|
|
| Depreciation and amortization expense |
|
|
| Total operating expense |
1,050,410
|
|
| Loss from operations |
(482,745)
|
|
| Other income (expense) |
|
|
| Foreign currency exchange |
|
|
| Loss on sale of lease receivable |
|
|
| (Loss) Gain on extinguishment of debt |
|
|
| Gain on disposal |
|
|
| Interest on preferred shares |
|
|
| Finance costs |
|
|
| Total other income (expense) |
|
|
| Net loss |
(482,745)
|
|
| Total Assets |
1,007,916
|
|
| GPS Units [Member] |
|
|
| Revenue from External Customer [Line Items] |
|
|
| Revenue |
2,217,322
|
|
| Cost of revenue |
1,064,302
|
|
| Gross profit |
1,153,020
|
|
| Operating expenses |
|
|
| Compensation expense |
991,397
|
|
| General and administration expense |
409,071
|
|
| Research and development |
|
|
| Bad debt expense (recovery) |
|
|
| Depreciation and amortization expense |
|
|
| Total operating expense |
1,400,468
|
|
| Loss from operations |
(247,448)
|
|
| Other income (expense) |
|
|
| Foreign currency exchange |
|
|
| Loss on sale of lease receivable |
(3,923)
|
|
| (Loss) Gain on extinguishment of debt |
|
|
| Gain on disposal |
|
|
| Interest on preferred shares |
|
|
| Finance costs |
(251,048)
|
|
| Total other income (expense) |
(254,971)
|
|
| Net loss |
(502,419)
|
|
| Total Assets |
$ 720,252
|
|
| X |
- DefinitionInterest on preferred shares.
| Name: |
DSGT_InterestOnPreferredShares |
| Namespace Prefix: |
DSGT_ |
| Data Type: |
xbrli:monetaryItemType |
| Balance Type: |
credit |
| Period Type: |
duration |
|
| X |
- DefinitionLoss on sale of lease receivable.
| Name: |
DSGT_LossOnSaleOfLeaseReceivable |
| Namespace Prefix: |
DSGT_ |
| Data Type: |
xbrli:monetaryItemType |
| Balance Type: |
debit |
| Period Type: |
duration |
|
| X |
- DefinitionAmount of amortization expense attributable to debt issuance costs. Reference 1: http://www.xbrl.org/2009/role/commonPracticeRef
-Publisher FASB
-Name Accounting Standards Codification
-Topic 230
-SubTopic 10
-Section 45
-Paragraph 28
-Subparagraph (b)
-URI https://asc.fasb.org/extlink&oid=126954810&loc=d3e3602-108585
Reference 2: http://fasb.org/us-gaap/role/ref/legacyRef
-Publisher FASB
-Name Accounting Standards Codification
-Topic 220
-SubTopic 10
-Section S99
-Paragraph 2
-Subparagraph (SX 210.5-03(8))
-URI https://asc.fasb.org/extlink&oid=126953954&loc=SL114868664-224227
Reference 3: http://www.xbrl.org/2003/role/disclosureRef
-Publisher FASB
-Name Accounting Standards Codification
-Topic 470
-SubTopic 20
-Section 50
-Paragraph 1F
-Subparagraph (b)(2)
-URI https://asc.fasb.org/extlink&oid=123466505&loc=SL123495355-112611
Reference 4: http://www.xbrl.org/2003/role/disclosureRef
-Publisher FASB
-Name Accounting Standards Codification
-Topic 835
-SubTopic 30
-Section 45
-Paragraph 3
-URI https://asc.fasb.org/extlink&oid=124435984&loc=d3e28555-108399
| Name: |
us-gaap_AmortizationOfFinancingCosts |
| Namespace Prefix: |
us-gaap_ |
| Data Type: |
xbrli:monetaryItemType |
| Balance Type: |
debit |
| Period Type: |
duration |
|
| X |
- DefinitionSum of the carrying amounts as of the balance sheet date of all assets that are recognized. Assets are probable future economic benefits obtained or controlled by an entity as a result of past transactions or events. Reference 1: http://fasb.org/us-gaap/role/ref/legacyRef
-Publisher FASB
-Name Accounting Standards Codification
-Topic 942
-SubTopic 210
-Section S99
-Paragraph 1
-Subparagraph (SX 210.9-03(11))
-URI https://asc.fasb.org/extlink&oid=126897435&loc=d3e534808-122878
Reference 2: http://www.xbrl.org/2003/role/exampleRef
-Publisher FASB
-Name Accounting Standards Codification
-Topic 852
-SubTopic 10
-Section 55
-Paragraph 10
-URI https://asc.fasb.org/extlink&oid=84165509&loc=d3e56426-112766
Reference 3: http://www.xbrl.org/2003/role/disclosureRef
-Publisher FASB
-Name Accounting Standards Codification
-Topic 470
-SubTopic 10
-Section S99
-Paragraph 1B
-Subparagraph (SX 210.13-02(a)(4)(iii)(A))
-URI https://asc.fasb.org/extlink&oid=126975872&loc=SL124442552-122756
Reference 4: http://www.xbrl.org/2003/role/disclosureRef
-Publisher FASB
-Name Accounting Standards Codification
-Topic 280
-SubTopic 10
-Section 50
-Paragraph 22
-URI https://asc.fasb.org/extlink&oid=126901519&loc=d3e8736-108599
Reference 5: http://www.xbrl.org/2003/role/disclosureRef
-Publisher FASB
-Name Accounting Standards Codification
-Topic 470
-SubTopic 10
-Section S99
-Paragraph 1A
-Subparagraph (SX 210.13-01(a)(4)(iv))
-URI https://asc.fasb.org/extlink&oid=126975872&loc=SL124442526-122756
Reference 6: http://fasb.org/us-gaap/role/ref/legacyRef
-Publisher FASB
-Name Accounting Standards Codification
-Topic 944
-SubTopic 210
-Section S99
-Paragraph 1
-Subparagraph (SX 210.7-03(a)(12))
-URI https://asc.fasb.org/extlink&oid=126734703&loc=d3e572229-122910
Reference 7: http://www.xbrl.org/2009/role/commonPracticeRef
-Publisher FASB
-Name Accounting Standards Codification
-Topic 852
-SubTopic 10
-Section 50
-Paragraph 7
-Subparagraph (a)
-URI https://asc.fasb.org/extlink&oid=124433192&loc=SL2890621-112765
Reference 8: http://www.xbrl.org/2003/role/disclosureRef
-Publisher FASB
-Name Accounting Standards Codification
-Topic 470
-SubTopic 10
-Section S99
-Paragraph 1B
-Subparagraph (SX 210.13-02(a)(4)(i))
-URI https://asc.fasb.org/extlink&oid=126975872&loc=SL124442552-122756
Reference 9: http://www.xbrl.org/2009/role/commonPracticeRef
-Publisher FASB
-Name Accounting Standards Codification
-Topic 470
-SubTopic 10
-Section S99
-Paragraph 1A
-Subparagraph (SX 210.13-01(a)(4)(ii))
-URI https://asc.fasb.org/extlink&oid=126975872&loc=SL124442526-122756
Reference 10: http://www.xbrl.org/2003/role/disclosureRef
-Publisher FASB
-Name Accounting Standards Codification
-Topic 470
-SubTopic 10
-Section S99
-Paragraph 1A
-Subparagraph (SX 210.13-01(a)(5))
-URI https://asc.fasb.org/extlink&oid=126975872&loc=SL124442526-122756
Reference 11: http://www.xbrl.org/2003/role/disclosureRef
-Publisher FASB
-Name Accounting Standards Codification
-Topic 470
-SubTopic 10
-Section S99
-Paragraph 1A
-Subparagraph (SX 210.13-01(a)(4)(iii)(A))
-URI https://asc.fasb.org/extlink&oid=126975872&loc=SL124442526-122756
Reference 12: http://www.xbrl.org/2003/role/disclosureRef
-Publisher FASB
-Name Accounting Standards Codification
-Topic 470
-SubTopic 10
-Section S99
-Paragraph 1A
-Subparagraph (SX 210.13-01(a)(4)(i))
-URI https://asc.fasb.org/extlink&oid=126975872&loc=SL124442526-122756
Reference 13: http://www.xbrl.org/2003/role/disclosureRef
-Publisher FASB
-Name Accounting Standards Codification
-Topic 235
-SubTopic 10
-Section S99
-Paragraph 1
-Subparagraph (SX 210.4-08(g)(1)(ii))
-URI https://asc.fasb.org/extlink&oid=120395691&loc=d3e23780-122690
Reference 14: http://www.xbrl.org/2009/role/commonPracticeRef
-Publisher FASB
-Name Accounting Standards Codification
-Topic 470
-SubTopic 10
-Section S99
-Paragraph 1A
-Subparagraph (SX 210.13-01(a)(4)(iii))
-URI https://asc.fasb.org/extlink&oid=126975872&loc=SL124442526-122756
Reference 15: http://www.xbrl.org/2003/role/disclosureRef
-Publisher FASB
-Name Accounting Standards Codification
-Topic 825
-SubTopic 10
-Section 50
-Paragraph 28
-Subparagraph (f)
-URI https://asc.fasb.org/extlink&oid=123596393&loc=d3e14064-108612
Reference 16: http://www.xbrl.org/2003/role/disclosureRef
-Publisher FASB
-Name Accounting Standards Codification
-Topic 470
-SubTopic 10
-Section S99
-Paragraph 1B
-Subparagraph (SX 210.13-02(a)(4)(iii)(B))
-URI https://asc.fasb.org/extlink&oid=126975872&loc=SL124442552-122756
Reference 17: http://www.xbrl.org/2003/role/disclosureRef
-Publisher FASB
-Name Accounting Standards Codification
-Topic 810
-SubTopic 10
-Section 50
-Paragraph 3
-Subparagraph (bb)
-URI https://asc.fasb.org/extlink&oid=123419778&loc=d3e5710-111685
Reference 18: http://www.xbrl.org/2003/role/disclosureRef
-Publisher FASB
-Name Accounting Standards Codification
-Topic 470
-SubTopic 10
-Section S99
-Paragraph 1B
-Subparagraph (SX 210.13-02(a)(5))
-URI https://asc.fasb.org/extlink&oid=126975872&loc=SL124442552-122756
Reference 19: http://www.xbrl.org/2003/role/disclosureRef
-Publisher FASB
-Name Accounting Standards Codification
-Topic 280
-SubTopic 10
-Section 50
-Paragraph 32
-Subparagraph (d)
-URI https://asc.fasb.org/extlink&oid=126901519&loc=d3e8933-108599
Reference 20: http://www.xbrl.org/2003/role/disclosureRef
-Publisher FASB
-Name Accounting Standards Codification
-Topic 810
-SubTopic 10
-Section 45
-Paragraph 25
-Subparagraph (a)
-URI https://asc.fasb.org/extlink&oid=116870748&loc=SL6758485-165988
Reference 21: http://www.xbrl.org/2003/role/disclosureRef
-Publisher FASB
-Name Accounting Standards Codification
-Topic 470
-SubTopic 10
-Section S99
-Paragraph 1B
-Subparagraph (SX 210.13-02(a)(4)(iv))
-URI https://asc.fasb.org/extlink&oid=126975872&loc=SL124442552-122756
Reference 22: http://www.xbrl.org/2003/role/disclosureRef
-Publisher FASB
-Name Accounting Standards Codification
-Topic 210
-SubTopic 10
-Section S99
-Paragraph 1
-Subparagraph (SX 210.5-02(18))
-URI https://asc.fasb.org/extlink&oid=120391452&loc=d3e13212-122682
Reference 23: http://www.xbrl.org/2003/role/disclosureRef
-Publisher FASB
-Name Accounting Standards Codification
-Topic 323
-SubTopic 10
-Section 50
-Paragraph 3
-Subparagraph (c)
-URI https://asc.fasb.org/extlink&oid=114001798&loc=d3e33918-111571
Reference 24: http://www.xbrl.org/2003/role/disclosureRef
-Publisher FASB
-Name Accounting Standards Codification
-Topic 280
-SubTopic 10
-Section 50
-Paragraph 30
-Subparagraph (c)
-URI https://asc.fasb.org/extlink&oid=126901519&loc=d3e8906-108599
| Name: |
us-gaap_Assets |
| Namespace Prefix: |
us-gaap_ |
| Data Type: |
xbrli:monetaryItemType |
| Balance Type: |
debit |
| Period Type: |
instant |
|
| X |
- DefinitionThe aggregate cost of goods produced and sold and services rendered during the reporting period. Reference 1: http://www.xbrl.org/2003/role/disclosureRef
-Publisher FASB
-Name Accounting Standards Codification
-Topic 470
-SubTopic 10
-Section S99
-Paragraph 1B
-Subparagraph (SX 210.13-02(a)(5))
-URI https://asc.fasb.org/extlink&oid=126975872&loc=SL124442552-122756
Reference 2: http://www.xbrl.org/2003/role/disclosureRef
-Publisher FASB
-Name Accounting Standards Codification
-Topic 825
-SubTopic 10
-Section 50
-Paragraph 28
-Subparagraph (f)
-URI https://asc.fasb.org/extlink&oid=123596393&loc=d3e14064-108612
Reference 3: http://www.xbrl.org/2003/role/disclosureRef
-Publisher FASB
-Name Accounting Standards Codification
-Topic 235
-SubTopic 10
-Section S99
-Paragraph 1
-Subparagraph (SX 210.4-08(g)(1)(ii))
-URI https://asc.fasb.org/extlink&oid=120395691&loc=d3e23780-122690
Reference 4: http://www.xbrl.org/2003/role/disclosureRef
-Publisher FASB
-Name Accounting Standards Codification
-Topic 470
-SubTopic 10
-Section S99
-Paragraph 1A
-Subparagraph (SX 210.13-01(a)(4)(iv))
-URI https://asc.fasb.org/extlink&oid=126975872&loc=SL124442526-122756
Reference 5: http://fasb.org/us-gaap/role/ref/legacyRef
-Publisher FASB
-Name Accounting Standards Codification
-Topic 220
-SubTopic 10
-Section S99
-Paragraph 2
-Subparagraph (SX 210.5-03.2)
-URI https://asc.fasb.org/extlink&oid=126953954&loc=SL114868664-224227
Reference 6: http://www.xbrl.org/2003/role/disclosureRef
-Publisher FASB
-Name Accounting Standards Codification
-Topic 323
-SubTopic 10
-Section 50
-Paragraph 3
-Subparagraph (c)
-URI https://asc.fasb.org/extlink&oid=114001798&loc=d3e33918-111571
Reference 7: http://www.xbrl.org/2003/role/disclosureRef
-Publisher FASB
-Name Accounting Standards Codification
-Topic 470
-SubTopic 10
-Section S99
-Paragraph 1A
-Subparagraph (SX 210.13-01(a)(5))
-URI https://asc.fasb.org/extlink&oid=126975872&loc=SL124442526-122756
Reference 8: http://www.xbrl.org/2003/role/disclosureRef
-Publisher FASB
-Name Accounting Standards Codification
-Topic 470
-SubTopic 10
-Section S99
-Paragraph 1B
-Subparagraph (SX 210.13-02(a)(4)(i))
-URI https://asc.fasb.org/extlink&oid=126975872&loc=SL124442552-122756
Reference 9: http://www.xbrl.org/2003/role/disclosureRef
-Publisher FASB
-Name Accounting Standards Codification
-Topic 470
-SubTopic 10
-Section S99
-Paragraph 1B
-Subparagraph (SX 210.13-02(a)(4)(iii)(B))
-URI https://asc.fasb.org/extlink&oid=126975872&loc=SL124442552-122756
Reference 10: http://www.xbrl.org/2003/role/disclosureRef
-Publisher FASB
-Name Accounting Standards Codification
-Topic 470
-SubTopic 10
-Section S99
-Paragraph 1B
-Subparagraph (SX 210.13-02(a)(4)(iii)(A))
-URI https://asc.fasb.org/extlink&oid=126975872&loc=SL124442552-122756
Reference 11: http://www.xbrl.org/2003/role/disclosureRef
-Publisher FASB
-Name Accounting Standards Codification
-Topic 470
-SubTopic 10
-Section S99
-Paragraph 1A
-Subparagraph (SX 210.13-01(a)(4)(i))
-URI https://asc.fasb.org/extlink&oid=126975872&loc=SL124442526-122756
Reference 12: http://www.xbrl.org/2003/role/disclosureRef
-Publisher FASB
-Name Accounting Standards Codification
-Topic 470
-SubTopic 10
-Section S99
-Paragraph 1A
-Subparagraph (SX 210.13-01(a)(4)(iii)(A))
-URI https://asc.fasb.org/extlink&oid=126975872&loc=SL124442526-122756
Reference 13: http://www.xbrl.org/2009/role/commonPracticeRef
-Publisher FASB
-Name Accounting Standards Codification
-Topic 470
-SubTopic 10
-Section S99
-Paragraph 1A
-Subparagraph (SX 210.13-01(a)(4)(ii))
-URI https://asc.fasb.org/extlink&oid=126975872&loc=SL124442526-122756
Reference 14: http://www.xbrl.org/2003/role/disclosureRef
-Publisher FASB
-Name Accounting Standards Codification
-Topic 470
-SubTopic 10
-Section S99
-Paragraph 1B
-Subparagraph (SX 210.13-02(a)(4)(iv))
-URI https://asc.fasb.org/extlink&oid=126975872&loc=SL124442552-122756
| Name: |
us-gaap_CostOfRevenue |
| Namespace Prefix: |
us-gaap_ |
| Data Type: |
xbrli:monetaryItemType |
| Balance Type: |
debit |
| Period Type: |
duration |
|
| X |
- DefinitionThe aggregate expense recognized in the current period that allocates the cost of tangible assets, intangible assets, or depleting assets to periods that benefit from use of the assets. Reference 1: http://www.xbrl.org/2003/role/disclosureRef
-Publisher FASB
-Name Accounting Standards Codification
-Topic 280
-SubTopic 10
-Section 50
-Paragraph 22
-Subparagraph (e)
-URI https://asc.fasb.org/extlink&oid=126901519&loc=d3e8736-108599
Reference 2: http://fasb.org/us-gaap/role/ref/legacyRef
-Publisher FASB
-Name Accounting Standards Codification
-Topic 230
-SubTopic 10
-Section 45
-Paragraph 28
-Subparagraph (b)
-URI https://asc.fasb.org/extlink&oid=126954810&loc=d3e3602-108585
| Name: |
us-gaap_DepreciationDepletionAndAmortization |
| Namespace Prefix: |
us-gaap_ |
| Data Type: |
xbrli:monetaryItemType |
| Balance Type: |
debit |
| Period Type: |
duration |
|
| X |
- DefinitionAmount before tax of foreign currency transaction realized and unrealized gain (loss) recognized in the income statement. Reference 1: http://www.xbrl.org/2003/role/disclosureRef
-Publisher FASB
-Name Accounting Standards Codification
-Topic 830
-SubTopic 20
-Section 45
-Paragraph 1
-URI https://asc.fasb.org/extlink&oid=125521441&loc=d3e30690-110894
Reference 2: http://www.xbrl.org/2003/role/disclosureRef
-Publisher FASB
-Name Accounting Standards Codification
-Topic 830
-SubTopic 20
-Section 35
-Paragraph 1
-URI https://asc.fasb.org/extlink&oid=123602790&loc=d3e30226-110892
Reference 3: http://www.xbrl.org/2003/role/disclosureRef
-Publisher FASB
-Name Accounting Standards Codification
-Topic 830
-SubTopic 10
-Section 45
-Paragraph 17
-URI https://asc.fasb.org/extlink&oid=126980362&loc=d3e28228-110885
Reference 4: http://www.xbrl.org/2003/role/disclosureRef
-Publisher FASB
-Name Accounting Standards Codification
-Topic 830
-SubTopic 20
-Section 50
-Paragraph 1
-URI https://asc.fasb.org/extlink&oid=124440516&loc=d3e30840-110895
| Name: |
us-gaap_ForeignCurrencyTransactionGainLossBeforeTax |
| Namespace Prefix: |
us-gaap_ |
| Data Type: |
xbrli:monetaryItemType |
| Balance Type: |
credit |
| Period Type: |
duration |
|
| X |
- DefinitionAmount of gain (loss) on sale or disposal of intangible assets. Reference 1: http://www.xbrl.org/2009/role/commonPracticeRef
-Publisher FASB
-Name Accounting Standards Codification
-Topic 230
-SubTopic 10
-Section 45
-Paragraph 28
-Subparagraph (b)
-URI https://asc.fasb.org/extlink&oid=126954810&loc=d3e3602-108585
| Name: |
us-gaap_GainLossOnDispositionOfIntangibleAssets |
| Namespace Prefix: |
us-gaap_ |
| Data Type: |
xbrli:monetaryItemType |
| Balance Type: |
credit |
| Period Type: |
duration |
|
| X |
- DefinitionDifference between the fair value of payments made and the carrying amount of debt which is extinguished prior to maturity. Reference 1: http://fasb.org/us-gaap/role/ref/legacyRef
-Publisher FASB
-Name Accounting Standards Codification
-Topic 470
-SubTopic 50
-Section 40
-Paragraph 4
-URI https://asc.fasb.org/extlink&oid=126972273&loc=d3e12355-112629
Reference 2: http://fasb.org/us-gaap/role/ref/legacyRef
-Publisher FASB
-Name Accounting Standards Codification
-Topic 470
-SubTopic 50
-Section 40
-Paragraph 2
-URI https://asc.fasb.org/extlink&oid=126972273&loc=d3e12317-112629
Reference 3: http://fasb.org/us-gaap/role/ref/legacyRef
-Publisher FASB
-Name Accounting Standards Codification
-Topic 230
-SubTopic 10
-Section 45
-Paragraph 28
-Subparagraph (b)
-URI https://asc.fasb.org/extlink&oid=126954810&loc=d3e3602-108585
| Name: |
us-gaap_GainsLossesOnExtinguishmentOfDebt |
| Namespace Prefix: |
us-gaap_ |
| Data Type: |
xbrli:monetaryItemType |
| Balance Type: |
credit |
| Period Type: |
duration |
|
| X |
- DefinitionThe aggregate total of expenses of managing and administering the affairs of an entity, including affiliates of the reporting entity, which are not directly or indirectly associated with the manufacture, sale or creation of a product or product line. Reference 1: http://fasb.org/us-gaap/role/ref/legacyRef
-Publisher FASB
-Name Accounting Standards Codification
-Topic 220
-SubTopic 10
-Section S99
-Paragraph 2
-Subparagraph (SX 210.5-03.4)
-URI https://asc.fasb.org/extlink&oid=126953954&loc=SL114868664-224227
| Name: |
us-gaap_GeneralAndAdministrativeExpense |
| Namespace Prefix: |
us-gaap_ |
| Data Type: |
xbrli:monetaryItemType |
| Balance Type: |
debit |
| Period Type: |
duration |
|
| X |
- DefinitionAggregate revenue less cost of goods and services sold or operating expenses directly attributable to the revenue generation activity. Reference 1: http://www.xbrl.org/2003/role/exampleRef
-Publisher FASB
-Name Accounting Standards Codification
-Topic 280
-SubTopic 10
-Section 50
-Paragraph 31
-URI https://asc.fasb.org/extlink&oid=126901519&loc=d3e8924-108599
Reference 2: http://www.xbrl.org/2003/role/disclosureRef
-Publisher FASB
-Name Accounting Standards Codification
-Topic 280
-SubTopic 10
-Section 50
-Paragraph 30
-Subparagraph (b)
-URI https://asc.fasb.org/extlink&oid=126901519&loc=d3e8906-108599
Reference 3: http://www.xbrl.org/2003/role/disclosureRef
-Publisher FASB
-Name Accounting Standards Codification
-Topic 280
-SubTopic 10
-Section 50
-Paragraph 22
-URI https://asc.fasb.org/extlink&oid=126901519&loc=d3e8736-108599
Reference 4: http://www.xbrl.org/2003/role/disclosureRef
-Publisher FASB
-Name Accounting Standards Codification
-Topic 280
-SubTopic 10
-Section 50
-Paragraph 32
-Subparagraph (f)
-URI https://asc.fasb.org/extlink&oid=126901519&loc=d3e8933-108599
Reference 5: http://www.xbrl.org/2003/role/disclosureRef
-Publisher FASB
-Name Accounting Standards Codification
-Topic 470
-SubTopic 10
-Section S99
-Paragraph 1A
-Subparagraph (SX 210.13-01(a)(4)(iv))
-URI https://asc.fasb.org/extlink&oid=126975872&loc=SL124442526-122756
Reference 6: http://www.xbrl.org/2003/role/disclosureRef
-Publisher FASB
-Name Accounting Standards Codification
-Topic 323
-SubTopic 10
-Section 50
-Paragraph 3
-Subparagraph (c)
-URI https://asc.fasb.org/extlink&oid=114001798&loc=d3e33918-111571
Reference 7: http://www.xbrl.org/2003/role/disclosureRef
-Publisher FASB
-Name Accounting Standards Codification
-Topic 470
-SubTopic 10
-Section S99
-Paragraph 1B
-Subparagraph (SX 210.13-02(a)(4)(iii)(A))
-URI https://asc.fasb.org/extlink&oid=126975872&loc=SL124442552-122756
Reference 8: http://www.xbrl.org/2003/role/disclosureRef
-Publisher FASB
-Name Accounting Standards Codification
-Topic 470
-SubTopic 10
-Section S99
-Paragraph 1B
-Subparagraph (SX 210.13-02(a)(4)(iii)(B))
-URI https://asc.fasb.org/extlink&oid=126975872&loc=SL124442552-122756
Reference 9: http://www.xbrl.org/2009/role/commonPracticeRef
-Publisher FASB
-Name Accounting Standards Codification
-Topic 470
-SubTopic 10
-Section S99
-Paragraph 1A
-Subparagraph (SX 210.13-01(a)(4)(ii))
-URI https://asc.fasb.org/extlink&oid=126975872&loc=SL124442526-122756
Reference 10: http://www.xbrl.org/2003/role/disclosureRef
-Publisher FASB
-Name Accounting Standards Codification
-Topic 235
-SubTopic 10
-Section S99
-Paragraph 1
-Subparagraph (SX 210.4-08(g)(1)(ii))
-URI https://asc.fasb.org/extlink&oid=120395691&loc=d3e23780-122690
Reference 11: http://www.xbrl.org/2003/role/disclosureRef
-Publisher FASB
-Name Accounting Standards Codification
-Topic 470
-SubTopic 10
-Section S99
-Paragraph 1A
-Subparagraph (SX 210.13-01(a)(4)(i))
-URI https://asc.fasb.org/extlink&oid=126975872&loc=SL124442526-122756
Reference 12: http://www.xbrl.org/2003/role/disclosureRef
-Publisher FASB
-Name Accounting Standards Codification
-Topic 470
-SubTopic 10
-Section S99
-Paragraph 1B
-Subparagraph (SX 210.13-02(a)(4)(i))
-URI https://asc.fasb.org/extlink&oid=126975872&loc=SL124442552-122756
Reference 13: http://www.xbrl.org/2003/role/disclosureRef
-Publisher FASB
-Name Accounting Standards Codification
-Topic 470
-SubTopic 10
-Section S99
-Paragraph 1A
-Subparagraph (SX 210.13-01(a)(4)(iii)(A))
-URI https://asc.fasb.org/extlink&oid=126975872&loc=SL124442526-122756
Reference 14: http://www.xbrl.org/2003/role/disclosureRef
-Publisher FASB
-Name Accounting Standards Codification
-Topic 825
-SubTopic 10
-Section 50
-Paragraph 28
-Subparagraph (f)
-URI https://asc.fasb.org/extlink&oid=123596393&loc=d3e14064-108612
Reference 15: http://www.xbrl.org/2003/role/disclosureRef
-Publisher FASB
-Name Accounting Standards Codification
-Topic 470
-SubTopic 10
-Section S99
-Paragraph 1A
-Subparagraph (SX 210.13-01(a)(5))
-URI https://asc.fasb.org/extlink&oid=126975872&loc=SL124442526-122756
Reference 16: http://www.xbrl.org/2003/role/disclosureRef
-Publisher FASB
-Name Accounting Standards Codification
-Topic 470
-SubTopic 10
-Section S99
-Paragraph 1B
-Subparagraph (SX 210.13-02(a)(4)(iv))
-URI https://asc.fasb.org/extlink&oid=126975872&loc=SL124442552-122756
Reference 17: http://www.xbrl.org/2003/role/disclosureRef
-Publisher FASB
-Name Accounting Standards Codification
-Topic 470
-SubTopic 10
-Section S99
-Paragraph 1B
-Subparagraph (SX 210.13-02(a)(5))
-URI https://asc.fasb.org/extlink&oid=126975872&loc=SL124442552-122756
Reference 18: http://fasb.org/us-gaap/role/ref/legacyRef
-Publisher FASB
-Name Accounting Standards Codification
-Topic 220
-SubTopic 10
-Section S99
-Paragraph 2
-Subparagraph (SX 210.5-03.1,2)
-URI https://asc.fasb.org/extlink&oid=126953954&loc=SL114868664-224227
Reference 19: http://www.xbrl.org/2003/role/disclosureRef
-Publisher FASB
-Name Accounting Standards Codification
-Topic 280
-SubTopic 10
-Section 50
-Paragraph 32
-Subparagraph (c)
-URI https://asc.fasb.org/extlink&oid=126901519&loc=d3e8933-108599
| Name: |
us-gaap_GrossProfit |
| Namespace Prefix: |
us-gaap_ |
| Data Type: |
xbrli:monetaryItemType |
| Balance Type: |
credit |
| Period Type: |
duration |
|
| X |
- DefinitionThe portion of profit or loss for the period, net of income taxes, which is attributable to the parent. Reference 1: http://fasb.org/us-gaap/role/ref/legacyRef
-Publisher FASB
-Name Accounting Standards Codification
-Topic 942
-SubTopic 220
-Section S99
-Paragraph 1
-Subparagraph (SX 210.9-04(22))
-URI https://asc.fasb.org/extlink&oid=120399700&loc=SL114874048-224260
Reference 2: http://www.xbrl.org/2003/role/disclosureRef
-Publisher FASB
-Name Accounting Standards Codification
-Topic 280
-SubTopic 10
-Section 50
-Paragraph 32
-Subparagraph (f)
-URI https://asc.fasb.org/extlink&oid=126901519&loc=d3e8933-108599
Reference 3: http://www.xbrl.org/2003/role/disclosureRef
-Publisher FASB
-Name Accounting Standards Codification
-Topic 250
-SubTopic 10
-Section 50
-Paragraph 4
-URI https://asc.fasb.org/extlink&oid=124431687&loc=d3e22595-107794
Reference 4: http://fasb.org/us-gaap/role/ref/legacyRef
-Publisher FASB
-Name Accounting Standards Codification
-Topic 944
-SubTopic 220
-Section S99
-Paragraph 1
-Subparagraph (SX 210.7-04(18))
-URI https://asc.fasb.org/extlink&oid=120400993&loc=SL114874131-224263
Reference 5: http://www.xbrl.org/2003/role/disclosureRef
-Publisher FASB
-Name Accounting Standards Codification
-Topic 815
-SubTopic 40
-Section 65
-Paragraph 1
-Subparagraph (f)
-URI https://asc.fasb.org/extlink&oid=126732423&loc=SL123482106-238011
Reference 6: http://www.xbrl.org/2003/role/disclosureRef
-Publisher FASB
-Name Accounting Standards Codification
-Topic 220
-SubTopic 10
-Section 50
-Paragraph 6
-URI https://asc.fasb.org/extlink&oid=124431353&loc=SL124452729-227067
Reference 7: http://www.xbrl.org/2003/role/disclosureRef
-Publisher FASB
-Name Accounting Standards Codification
-Topic 470
-SubTopic 10
-Section S99
-Paragraph 1B
-Subparagraph (SX 210.13-02(a)(5))
-URI https://asc.fasb.org/extlink&oid=126975872&loc=SL124442552-122756
Reference 8: http://fasb.org/us-gaap/role/ref/legacyRef
-Publisher FASB
-Name Accounting Standards Codification
-Topic 220
-SubTopic 10
-Section S99
-Paragraph 2
-Subparagraph (SX 210.5-03(20))
-URI https://asc.fasb.org/extlink&oid=126953954&loc=SL114868664-224227
Reference 9: http://fasb.org/us-gaap/role/ref/legacyRef
-Publisher FASB
-Name Accounting Standards Codification
-Topic 230
-SubTopic 10
-Section 45
-Paragraph 28
-URI https://asc.fasb.org/extlink&oid=126954810&loc=d3e3602-108585
Reference 10: http://www.xbrl.org/2003/role/disclosureRef
-Publisher FASB
-Name Accounting Standards Codification
-Topic 250
-SubTopic 10
-Section 50
-Paragraph 1
-Subparagraph (b)(2)
-URI https://asc.fasb.org/extlink&oid=124431687&loc=d3e22499-107794
Reference 11: http://www.xbrl.org/2003/role/disclosureRef
-Publisher FASB
-Name Accounting Standards Codification
-Topic 470
-SubTopic 10
-Section S99
-Paragraph 1A
-Subparagraph (SX 210.13-01(a)(4)(iv))
-URI https://asc.fasb.org/extlink&oid=126975872&loc=SL124442526-122756
Reference 12: http://www.xbrl.org/2003/role/disclosureRef
-Publisher FASB
-Name Accounting Standards Codification
-Topic 470
-SubTopic 10
-Section S99
-Paragraph 1A
-Subparagraph (SX 210.13-01(a)(4)(iii)(A))
-URI https://asc.fasb.org/extlink&oid=126975872&loc=SL124442526-122756
Reference 13: http://www.xbrl.org/2003/role/disclosureRef
-Publisher FASB
-Name Accounting Standards Codification
-Topic 470
-SubTopic 10
-Section S99
-Paragraph 1B
-Subparagraph (SX 210.13-02(a)(4)(i))
-URI https://asc.fasb.org/extlink&oid=126975872&loc=SL124442552-122756
Reference 14: http://www.xbrl.org/2003/role/disclosureRef
-Publisher FASB
-Name Accounting Standards Codification
-Topic 470
-SubTopic 10
-Section S99
-Paragraph 1A
-Subparagraph (SX 210.13-01(a)(4)(i))
-URI https://asc.fasb.org/extlink&oid=126975872&loc=SL124442526-122756
Reference 15: http://www.xbrl.org/2003/role/disclosureRef
-Publisher FASB
-Name Accounting Standards Codification
-Topic 250
-SubTopic 10
-Section 50
-Paragraph 9
-URI https://asc.fasb.org/extlink&oid=124431687&loc=d3e22663-107794
Reference 16: http://www.xbrl.org/2003/role/disclosureRef
-Publisher FASB
-Name Accounting Standards Codification
-Topic 470
-SubTopic 10
-Section S99
-Paragraph 1B
-Subparagraph (SX 210.13-02(a)(4)(iv))
-URI https://asc.fasb.org/extlink&oid=126975872&loc=SL124442552-122756
Reference 17: http://www.xbrl.org/2009/role/commonPracticeRef
-Publisher FASB
-Name Accounting Standards Codification
-Topic 470
-SubTopic 10
-Section S99
-Paragraph 1A
-Subparagraph (SX 210.13-01(a)(4)(ii))
-URI https://asc.fasb.org/extlink&oid=126975872&loc=SL124442526-122756
Reference 18: http://www.xbrl.org/2003/role/disclosureRef
-Publisher FASB
-Name Accounting Standards Codification
-Topic 825
-SubTopic 10
-Section 50
-Paragraph 28
-Subparagraph (f)
-URI https://asc.fasb.org/extlink&oid=123596393&loc=d3e14064-108612
Reference 19: http://www.xbrl.org/2003/role/disclosureRef
-Publisher FASB
-Name Accounting Standards Codification
-Topic 250
-SubTopic 10
-Section 50
-Paragraph 3
-URI https://asc.fasb.org/extlink&oid=124431687&loc=d3e22583-107794
Reference 20: http://www.xbrl.org/2003/role/disclosureRef
-Publisher FASB
-Name Accounting Standards Codification
-Topic 235
-SubTopic 10
-Section S99
-Paragraph 1
-Subparagraph (SX 210.4-08(g)(1)(ii))
-URI https://asc.fasb.org/extlink&oid=120395691&loc=d3e23780-122690
Reference 21: http://www.xbrl.org/2003/role/disclosureRef
-Publisher FASB
-Name Accounting Standards Codification
-Topic 260
-SubTopic 10
-Section 45
-Paragraph 60B
-Subparagraph (a)
-URI https://asc.fasb.org/extlink&oid=126958026&loc=SL5780133-109256
Reference 22: http://www.xbrl.org/2003/role/disclosureRef
-Publisher FASB
-Name Accounting Standards Codification
-Topic 323
-SubTopic 10
-Section 50
-Paragraph 3
-Subparagraph (c)
-URI https://asc.fasb.org/extlink&oid=114001798&loc=d3e33918-111571
Reference 23: http://www.xbrl.org/2003/role/disclosureRef
-Publisher FASB
-Name Accounting Standards Codification
-Topic 250
-SubTopic 10
-Section 50
-Paragraph 8
-URI https://asc.fasb.org/extlink&oid=124431687&loc=d3e22658-107794
Reference 24: http://www.xbrl.org/2003/role/disclosureRef
-Publisher FASB
-Name Accounting Standards Codification
-Topic 220
-SubTopic 10
-Section 45
-Paragraph 1A
-Subparagraph (a)
-URI https://asc.fasb.org/extlink&oid=126968391&loc=SL7669619-108580
Reference 25: http://www.xbrl.org/2003/role/exampleRef
-Publisher FASB
-Name Accounting Standards Codification
-Topic 280
-SubTopic 10
-Section 50
-Paragraph 31
-URI https://asc.fasb.org/extlink&oid=126901519&loc=d3e8924-108599
Reference 26: http://www.xbrl.org/2003/role/disclosureRef
-Publisher FASB
-Name Accounting Standards Codification
-Topic 250
-SubTopic 10
-Section 50
-Paragraph 11
-Subparagraph (b)
-URI https://asc.fasb.org/extlink&oid=124431687&loc=d3e22694-107794
Reference 27: http://www.xbrl.org/2003/role/disclosureRef
-Publisher FASB
-Name Accounting Standards Codification
-Topic 250
-SubTopic 10
-Section 50
-Paragraph 11
-Subparagraph (a)
-URI https://asc.fasb.org/extlink&oid=124431687&loc=d3e22694-107794
Reference 28: http://www.xbrl.org/2003/role/disclosureRef
-Publisher FASB
-Name Accounting Standards Codification
-Topic 205
-SubTopic 20
-Section 50
-Paragraph 7
-URI https://asc.fasb.org/extlink&oid=109222650&loc=SL51721683-107760
Reference 29: http://www.xbrl.org/2003/role/disclosureRef
-Publisher FASB
-Name Accounting Standards Codification
-Topic 220
-SubTopic 10
-Section 45
-Paragraph 1B
-Subparagraph (a)
-URI https://asc.fasb.org/extlink&oid=126968391&loc=SL7669625-108580
Reference 30: http://www.xbrl.org/2003/role/disclosureRef
-Publisher FASB
-Name Accounting Standards Codification
-Topic 280
-SubTopic 10
-Section 50
-Paragraph 22
-URI https://asc.fasb.org/extlink&oid=126901519&loc=d3e8736-108599
Reference 31: http://www.xbrl.org/2003/role/disclosureRef
-Publisher FASB
-Name Accounting Standards Codification
-Topic 470
-SubTopic 10
-Section S99
-Paragraph 1A
-Subparagraph (SX 210.13-01(a)(5))
-URI https://asc.fasb.org/extlink&oid=126975872&loc=SL124442526-122756
Reference 32: http://www.xbrl.org/2003/role/disclosureRef
-Publisher FASB
-Name Accounting Standards Codification
-Topic 470
-SubTopic 10
-Section S99
-Paragraph 1B
-Subparagraph (SX 210.13-02(a)(4)(iii)(B))
-URI https://asc.fasb.org/extlink&oid=126975872&loc=SL124442552-122756
Reference 33: http://www.xbrl.org/2003/role/disclosureRef
-Publisher FASB
-Name Accounting Standards Codification
-Topic 470
-SubTopic 10
-Section S99
-Paragraph 1B
-Subparagraph (SX 210.13-02(a)(4)(iii)(A))
-URI https://asc.fasb.org/extlink&oid=126975872&loc=SL124442552-122756
Reference 34: http://www.xbrl.org/2003/role/disclosureRef
-Publisher FASB
-Name Accounting Standards Codification
-Topic 280
-SubTopic 10
-Section 50
-Paragraph 30
-Subparagraph (b)
-URI https://asc.fasb.org/extlink&oid=126901519&loc=d3e8906-108599
Reference 35: http://www.xbrl.org/2003/role/disclosureRef
-Publisher FASB
-Name Accounting Standards Codification
-Topic 280
-SubTopic 10
-Section 50
-Paragraph 32
-Subparagraph (c)
-URI https://asc.fasb.org/extlink&oid=126901519&loc=d3e8933-108599
| Name: |
us-gaap_NetIncomeLoss |
| Namespace Prefix: |
us-gaap_ |
| Data Type: |
xbrli:monetaryItemType |
| Balance Type: |
credit |
| Period Type: |
duration |
|
| X |
- DefinitionThe aggregate amount of income or expense from ancillary business-related activities (that is to say, excluding major activities considered part of the normal operations of the business). Reference 1: http://fasb.org/us-gaap/role/ref/legacyRef
-Publisher FASB
-Name Accounting Standards Codification
-Topic 220
-SubTopic 10
-Section S99
-Paragraph 2
-Subparagraph (SX 210.5-03.7)
-URI https://asc.fasb.org/extlink&oid=126953954&loc=SL114868664-224227
| Name: |
us-gaap_NonoperatingIncomeExpense |
| Namespace Prefix: |
us-gaap_ |
| Data Type: |
xbrli:monetaryItemType |
| Balance Type: |
credit |
| Period Type: |
duration |
|
| X |
- References
+ Details
| Name: |
us-gaap_NonoperatingIncomeExpenseAbstract |
| Namespace Prefix: |
us-gaap_ |
| Data Type: |
xbrli:stringItemType |
| Balance Type: |
na |
| Period Type: |
duration |
|
| X |
- DefinitionGenerally recurring costs associated with normal operations except for the portion of these expenses which can be clearly related to production and included in cost of sales or services. Includes selling, general and administrative expense.
| Name: |
us-gaap_OperatingExpenses |
| Namespace Prefix: |
us-gaap_ |
| Data Type: |
xbrli:monetaryItemType |
| Balance Type: |
debit |
| Period Type: |
duration |
|
| X |
- References
+ Details
| Name: |
us-gaap_OperatingExpensesAbstract |
| Namespace Prefix: |
us-gaap_ |
| Data Type: |
xbrli:stringItemType |
| Balance Type: |
na |
| Period Type: |
duration |
|
| X |
- DefinitionThe net result for the period of deducting operating expenses from operating revenues. Reference 1: http://www.xbrl.org/2003/role/exampleRef
-Publisher FASB
-Name Accounting Standards Codification
-Topic 280
-SubTopic 10
-Section 50
-Paragraph 31
-URI https://asc.fasb.org/extlink&oid=126901519&loc=d3e8924-108599
Reference 2: http://www.xbrl.org/2003/role/disclosureRef
-Publisher FASB
-Name Accounting Standards Codification
-Topic 280
-SubTopic 10
-Section 50
-Paragraph 30
-Subparagraph (b)
-URI https://asc.fasb.org/extlink&oid=126901519&loc=d3e8906-108599
Reference 3: http://www.xbrl.org/2003/role/disclosureRef
-Publisher FASB
-Name Accounting Standards Codification
-Topic 280
-SubTopic 10
-Section 50
-Paragraph 32
-Subparagraph (c)
-URI https://asc.fasb.org/extlink&oid=126901519&loc=d3e8933-108599
Reference 4: http://www.xbrl.org/2003/role/disclosureRef
-Publisher FASB
-Name Accounting Standards Codification
-Topic 280
-SubTopic 10
-Section 50
-Paragraph 32
-Subparagraph (f)
-URI https://asc.fasb.org/extlink&oid=126901519&loc=d3e8933-108599
Reference 5: http://www.xbrl.org/2003/role/disclosureRef
-Publisher FASB
-Name Accounting Standards Codification
-Topic 280
-SubTopic 10
-Section 50
-Paragraph 22
-URI https://asc.fasb.org/extlink&oid=126901519&loc=d3e8736-108599
| Name: |
us-gaap_OperatingIncomeLoss |
| Namespace Prefix: |
us-gaap_ |
| Data Type: |
xbrli:monetaryItemType |
| Balance Type: |
credit |
| Period Type: |
duration |
|
| X |
- DefinitionAmount of expense (reversal of expense) for expected credit loss on accounts receivable. Reference 1: http://www.xbrl.org/2003/role/disclosureRef
-Publisher FASB
-Name Accounting Standards Codification
-Topic 326
-SubTopic 20
-Section 50
-Paragraph 13
-Subparagraph (b)
-URI https://asc.fasb.org/extlink&oid=124255953&loc=SL82919249-210447
Reference 2: http://www.xbrl.org/2003/role/disclosureRef
-Publisher FASB
-Name Accounting Standards Codification
-Topic 220
-SubTopic 10
-Section S99
-Paragraph 2
-Subparagraph (SX 210.5-03(5))
-URI https://asc.fasb.org/extlink&oid=126953954&loc=SL114868664-224227
| Name: |
us-gaap_ProvisionForDoubtfulAccounts |
| Namespace Prefix: |
us-gaap_ |
| Data Type: |
xbrli:monetaryItemType |
| Balance Type: |
debit |
| Period Type: |
duration |
|
| X |
- DefinitionThe aggregate costs incurred (1) in a planned search or critical investigation aimed at discovery of new knowledge with the hope that such knowledge will be useful in developing a new product or service, a new process or technique, or in bringing about a significant improvement to an existing product or process; or (2) to translate research findings or other knowledge into a plan or design for a new product or process or for a significant improvement to an existing product or process whether intended for sale or the entity's use, during the reporting period charged to research and development projects, including the costs of developing computer software up to the point in time of achieving technological feasibility, and costs allocated in accounting for a business combination to in-process projects deemed to have no alternative future use. Reference 1: http://www.xbrl.org/2009/role/commonPracticeRef
-Publisher FASB
-Name Accounting Standards Codification
-Topic 912
-SubTopic 730
-Section 25
-Paragraph 1
-URI https://asc.fasb.org/extlink&oid=6472174&loc=d3e58812-109433
Reference 2: http://fasb.org/us-gaap/role/ref/legacyRef
-Publisher FASB
-Name Accounting Standards Codification
-Topic 985
-SubTopic 20
-Section 50
-Paragraph 1
-URI https://asc.fasb.org/extlink&oid=6501960&loc=d3e128462-111756
Reference 3: http://fasb.org/us-gaap/role/ref/legacyRef
-Publisher FASB
-Name Accounting Standards Codification
-Topic 730
-SubTopic 10
-Section 50
-Paragraph 1
-URI https://asc.fasb.org/extlink&oid=6420194&loc=d3e21568-108373
| Name: |
us-gaap_ResearchAndDevelopmentExpense |
| Namespace Prefix: |
us-gaap_ |
| Data Type: |
xbrli:monetaryItemType |
| Balance Type: |
debit |
| Period Type: |
duration |
|
| X |
- DefinitionAmount of revenue recognized from goods sold, services rendered, insurance premiums, or other activities that constitute an earning process. Includes, but is not limited to, investment and interest income before deduction of interest expense when recognized as a component of revenue, and sales and trading gain (loss). Reference 1: http://www.xbrl.org/2003/role/disclosureRef
-Publisher FASB
-Name Accounting Standards Codification
-Topic 280
-SubTopic 10
-Section 50
-Paragraph 22
-Subparagraph (a)
-URI https://asc.fasb.org/extlink&oid=126901519&loc=d3e8736-108599
Reference 2: http://www.xbrl.org/2003/role/disclosureRef
-Publisher FASB
-Name Accounting Standards Codification
-Topic 323
-SubTopic 10
-Section 50
-Paragraph 3
-Subparagraph (c)
-URI https://asc.fasb.org/extlink&oid=114001798&loc=d3e33918-111571
Reference 3: http://www.xbrl.org/2003/role/disclosureRef
-Publisher FASB
-Name Accounting Standards Codification
-Topic 825
-SubTopic 10
-Section 50
-Paragraph 28
-Subparagraph (f)
-URI https://asc.fasb.org/extlink&oid=123596393&loc=d3e14064-108612
Reference 4: http://www.xbrl.org/2003/role/disclosureRef
-Publisher FASB
-Name Accounting Standards Codification
-Topic 280
-SubTopic 10
-Section 50
-Paragraph 32
-Subparagraph (b)
-URI https://asc.fasb.org/extlink&oid=126901519&loc=d3e8933-108599
Reference 5: http://www.xbrl.org/2003/role/disclosureRef
-Publisher FASB
-Name Accounting Standards Codification
-Topic 280
-SubTopic 10
-Section 50
-Paragraph 32
-Subparagraph (a)
-URI https://asc.fasb.org/extlink&oid=126901519&loc=d3e8933-108599
Reference 6: http://www.xbrl.org/2003/role/disclosureRef
-Publisher FASB
-Name Accounting Standards Codification
-Topic 470
-SubTopic 10
-Section S99
-Paragraph 1B
-Subparagraph (SX 210.13-02(a)(4)(iv))
-URI https://asc.fasb.org/extlink&oid=126975872&loc=SL124442552-122756
Reference 7: http://www.xbrl.org/2003/role/disclosureRef
-Publisher FASB
-Name Accounting Standards Codification
-Topic 280
-SubTopic 10
-Section 50
-Paragraph 22
-Subparagraph (b)
-URI https://asc.fasb.org/extlink&oid=126901519&loc=d3e8736-108599
Reference 8: http://www.xbrl.org/2003/role/disclosureRef
-Publisher FASB
-Name Accounting Standards Codification
-Topic 470
-SubTopic 10
-Section S99
-Paragraph 1A
-Subparagraph (SX 210.13-01(a)(4)(iv))
-URI https://asc.fasb.org/extlink&oid=126975872&loc=SL124442526-122756
Reference 9: http://www.xbrl.org/2003/role/disclosureRef
-Publisher FASB
-Name Accounting Standards Codification
-Topic 470
-SubTopic 10
-Section S99
-Paragraph 1B
-Subparagraph (SX 210.13-02(a)(4)(iii)(A))
-URI https://asc.fasb.org/extlink&oid=126975872&loc=SL124442552-122756
Reference 10: http://www.xbrl.org/2003/role/disclosureRef
-Publisher FASB
-Name Accounting Standards Codification
-Topic 280
-SubTopic 10
-Section 50
-Paragraph 40
-URI https://asc.fasb.org/extlink&oid=126901519&loc=d3e9031-108599
Reference 11: http://www.xbrl.org/2003/role/disclosureRef
-Publisher FASB
-Name Accounting Standards Codification
-Topic 470
-SubTopic 10
-Section S99
-Paragraph 1A
-Subparagraph (SX 210.13-01(a)(4)(i))
-URI https://asc.fasb.org/extlink&oid=126975872&loc=SL124442526-122756
Reference 12: http://www.xbrl.org/2003/role/disclosureRef
-Publisher FASB
-Name Accounting Standards Codification
-Topic 470
-SubTopic 10
-Section S99
-Paragraph 1B
-Subparagraph (SX 210.13-02(a)(4)(i))
-URI https://asc.fasb.org/extlink&oid=126975872&loc=SL124442552-122756
Reference 13: http://www.xbrl.org/2003/role/disclosureRef
-Publisher FASB
-Name Accounting Standards Codification
-Topic 280
-SubTopic 10
-Section 50
-Paragraph 30
-Subparagraph (a)
-URI https://asc.fasb.org/extlink&oid=126901519&loc=d3e8906-108599
Reference 14: http://www.xbrl.org/2003/role/disclosureRef
-Publisher FASB
-Name Accounting Standards Codification
-Topic 470
-SubTopic 10
-Section S99
-Paragraph 1B
-Subparagraph (SX 210.13-02(a)(5))
-URI https://asc.fasb.org/extlink&oid=126975872&loc=SL124442552-122756
Reference 15: http://www.xbrl.org/2003/role/disclosureRef
-Publisher FASB
-Name Accounting Standards Codification
-Topic 280
-SubTopic 10
-Section 50
-Paragraph 41
-Subparagraph (a)
-URI https://asc.fasb.org/extlink&oid=126901519&loc=d3e9038-108599
Reference 16: http://www.xbrl.org/2003/role/disclosureRef
-Publisher FASB
-Name Accounting Standards Codification
-Topic 470
-SubTopic 10
-Section S99
-Paragraph 1A
-Subparagraph (SX 210.13-01(a)(4)(iii)(A))
-URI https://asc.fasb.org/extlink&oid=126975872&loc=SL124442526-122756
Reference 17: http://www.xbrl.org/2003/role/disclosureRef
-Publisher FASB
-Name Accounting Standards Codification
-Topic 470
-SubTopic 10
-Section S99
-Paragraph 1A
-Subparagraph (SX 210.13-01(a)(5))
-URI https://asc.fasb.org/extlink&oid=126975872&loc=SL124442526-122756
Reference 18: http://www.xbrl.org/2003/role/disclosureRef
-Publisher FASB
-Name Accounting Standards Codification
-Topic 280
-SubTopic 10
-Section 50
-Paragraph 42
-URI https://asc.fasb.org/extlink&oid=126901519&loc=d3e9054-108599
Reference 19: http://www.xbrl.org/2003/role/disclosureRef
-Publisher FASB
-Name Accounting Standards Codification
-Topic 235
-SubTopic 10
-Section S99
-Paragraph 1
-Subparagraph (SX 210.4-08(g)(1)(ii))
-URI https://asc.fasb.org/extlink&oid=120395691&loc=d3e23780-122690
Reference 20: http://www.xbrl.org/2003/role/disclosureRef
-Publisher FASB
-Name Accounting Standards Codification
-Topic 942
-SubTopic 235
-Section S99
-Paragraph 1
-Subparagraph (SX 210.9-05(b)(2))
-URI https://asc.fasb.org/extlink&oid=120399901&loc=d3e537907-122884
Reference 21: http://www.xbrl.org/2003/role/disclosureRef
-Publisher FASB
-Name Accounting Standards Codification
-Topic 470
-SubTopic 10
-Section S99
-Paragraph 1B
-Subparagraph (SX 210.13-02(a)(4)(iii)(B))
-URI https://asc.fasb.org/extlink&oid=126975872&loc=SL124442552-122756
Reference 22: http://www.xbrl.org/2009/role/commonPracticeRef
-Publisher FASB
-Name Accounting Standards Codification
-Topic 470
-SubTopic 10
-Section S99
-Paragraph 1A
-Subparagraph (SX 210.13-01(a)(4)(ii))
-URI https://asc.fasb.org/extlink&oid=126975872&loc=SL124442526-122756
Reference 23: http://www.xbrl.org/2003/role/disclosureRef
-Publisher FASB
-Name Accounting Standards Codification
-Topic 220
-SubTopic 10
-Section S99
-Paragraph 2
-Subparagraph (SX 210.5-03(1))
-URI https://asc.fasb.org/extlink&oid=126953954&loc=SL114868664-224227
| Name: |
us-gaap_Revenues |
| Namespace Prefix: |
us-gaap_ |
| Data Type: |
xbrli:monetaryItemType |
| Balance Type: |
credit |
| Period Type: |
duration |
|
| X |
- DefinitionAmount of noncash expense for share-based payment arrangement. Reference 1: http://fasb.org/us-gaap/role/ref/legacyRef
-Publisher FASB
-Name Accounting Standards Codification
-Topic 230
-SubTopic 10
-Section 45
-Paragraph 28
-Subparagraph (a)
-URI https://asc.fasb.org/extlink&oid=126954810&loc=d3e3602-108585
| Name: |
us-gaap_ShareBasedCompensation |
| Namespace Prefix: |
us-gaap_ |
| Data Type: |
xbrli:monetaryItemType |
| Balance Type: |
debit |
| Period Type: |
duration |
|
| X |
- Details
| Name: |
srt_ProductOrServiceAxis=us-gaap_AdministrativeServiceMember |
| Namespace Prefix: |
|
| Data Type: |
na |
| Balance Type: |
|
| Period Type: |
|
|
| X |
- Details
| Name: |
srt_ProductOrServiceAxis=DSGT_ElectricVehiclesMember |
| Namespace Prefix: |
|
| Data Type: |
na |
| Balance Type: |
|
| Period Type: |
|
|
| X |
- Details
| Name: |
srt_ProductOrServiceAxis=DSGT_GolfCartsMember |
| Namespace Prefix: |
|
| Data Type: |
na |
| Balance Type: |
|
| Period Type: |
|
|
| X |
- Details
| Name: |
srt_ProductOrServiceAxis=DSGT_GPSUnitsMember |
| Namespace Prefix: |
|
| Data Type: |
na |
| Balance Type: |
|
| Period Type: |
|
|
v3.23.2
SCHEDULE OF ASSETS BY GEOGRAPHIC AREA (Details) - USD ($)
|
Dec. 31, 2022 |
Dec. 31, 2021 |
| Revenues from External Customers and Long-Lived Assets [Line Items] |
|
|
| Total Assets |
$ 2,244,296
|
$ 2,612,240
|
| CANADA |
|
|
| Revenues from External Customers and Long-Lived Assets [Line Items] |
|
|
| Total Assets |
450,923
|
|
| UNITED STATES |
|
|
| Revenues from External Customers and Long-Lived Assets [Line Items] |
|
|
| Total Assets |
1,637,294
|
|
| UNITED KINGDOM |
|
|
| Revenues from External Customers and Long-Lived Assets [Line Items] |
|
|
| Total Assets |
4,699
|
|
| MEXICO |
|
|
| Revenues from External Customers and Long-Lived Assets [Line Items] |
|
|
| Total Assets |
40,000
|
|
| AUSTRALIA |
|
|
| Revenues from External Customers and Long-Lived Assets [Line Items] |
|
|
| Total Assets |
98,225
|
|
| CHINA |
|
|
| Revenues from External Customers and Long-Lived Assets [Line Items] |
|
|
| Total Assets |
$ 13,155
|
|
| X |
- DefinitionSum of the carrying amounts as of the balance sheet date of all assets that are recognized. Assets are probable future economic benefits obtained or controlled by an entity as a result of past transactions or events. Reference 1: http://fasb.org/us-gaap/role/ref/legacyRef
-Publisher FASB
-Name Accounting Standards Codification
-Topic 942
-SubTopic 210
-Section S99
-Paragraph 1
-Subparagraph (SX 210.9-03(11))
-URI https://asc.fasb.org/extlink&oid=126897435&loc=d3e534808-122878
Reference 2: http://www.xbrl.org/2003/role/exampleRef
-Publisher FASB
-Name Accounting Standards Codification
-Topic 852
-SubTopic 10
-Section 55
-Paragraph 10
-URI https://asc.fasb.org/extlink&oid=84165509&loc=d3e56426-112766
Reference 3: http://www.xbrl.org/2003/role/disclosureRef
-Publisher FASB
-Name Accounting Standards Codification
-Topic 470
-SubTopic 10
-Section S99
-Paragraph 1B
-Subparagraph (SX 210.13-02(a)(4)(iii)(A))
-URI https://asc.fasb.org/extlink&oid=126975872&loc=SL124442552-122756
Reference 4: http://www.xbrl.org/2003/role/disclosureRef
-Publisher FASB
-Name Accounting Standards Codification
-Topic 280
-SubTopic 10
-Section 50
-Paragraph 22
-URI https://asc.fasb.org/extlink&oid=126901519&loc=d3e8736-108599
Reference 5: http://www.xbrl.org/2003/role/disclosureRef
-Publisher FASB
-Name Accounting Standards Codification
-Topic 470
-SubTopic 10
-Section S99
-Paragraph 1A
-Subparagraph (SX 210.13-01(a)(4)(iv))
-URI https://asc.fasb.org/extlink&oid=126975872&loc=SL124442526-122756
Reference 6: http://fasb.org/us-gaap/role/ref/legacyRef
-Publisher FASB
-Name Accounting Standards Codification
-Topic 944
-SubTopic 210
-Section S99
-Paragraph 1
-Subparagraph (SX 210.7-03(a)(12))
-URI https://asc.fasb.org/extlink&oid=126734703&loc=d3e572229-122910
Reference 7: http://www.xbrl.org/2009/role/commonPracticeRef
-Publisher FASB
-Name Accounting Standards Codification
-Topic 852
-SubTopic 10
-Section 50
-Paragraph 7
-Subparagraph (a)
-URI https://asc.fasb.org/extlink&oid=124433192&loc=SL2890621-112765
Reference 8: http://www.xbrl.org/2003/role/disclosureRef
-Publisher FASB
-Name Accounting Standards Codification
-Topic 470
-SubTopic 10
-Section S99
-Paragraph 1B
-Subparagraph (SX 210.13-02(a)(4)(i))
-URI https://asc.fasb.org/extlink&oid=126975872&loc=SL124442552-122756
Reference 9: http://www.xbrl.org/2009/role/commonPracticeRef
-Publisher FASB
-Name Accounting Standards Codification
-Topic 470
-SubTopic 10
-Section S99
-Paragraph 1A
-Subparagraph (SX 210.13-01(a)(4)(ii))
-URI https://asc.fasb.org/extlink&oid=126975872&loc=SL124442526-122756
Reference 10: http://www.xbrl.org/2003/role/disclosureRef
-Publisher FASB
-Name Accounting Standards Codification
-Topic 470
-SubTopic 10
-Section S99
-Paragraph 1A
-Subparagraph (SX 210.13-01(a)(5))
-URI https://asc.fasb.org/extlink&oid=126975872&loc=SL124442526-122756
Reference 11: http://www.xbrl.org/2003/role/disclosureRef
-Publisher FASB
-Name Accounting Standards Codification
-Topic 470
-SubTopic 10
-Section S99
-Paragraph 1A
-Subparagraph (SX 210.13-01(a)(4)(iii)(A))
-URI https://asc.fasb.org/extlink&oid=126975872&loc=SL124442526-122756
Reference 12: http://www.xbrl.org/2003/role/disclosureRef
-Publisher FASB
-Name Accounting Standards Codification
-Topic 470
-SubTopic 10
-Section S99
-Paragraph 1A
-Subparagraph (SX 210.13-01(a)(4)(i))
-URI https://asc.fasb.org/extlink&oid=126975872&loc=SL124442526-122756
Reference 13: http://www.xbrl.org/2003/role/disclosureRef
-Publisher FASB
-Name Accounting Standards Codification
-Topic 235
-SubTopic 10
-Section S99
-Paragraph 1
-Subparagraph (SX 210.4-08(g)(1)(ii))
-URI https://asc.fasb.org/extlink&oid=120395691&loc=d3e23780-122690
Reference 14: http://www.xbrl.org/2009/role/commonPracticeRef
-Publisher FASB
-Name Accounting Standards Codification
-Topic 470
-SubTopic 10
-Section S99
-Paragraph 1A
-Subparagraph (SX 210.13-01(a)(4)(iii))
-URI https://asc.fasb.org/extlink&oid=126975872&loc=SL124442526-122756
Reference 15: http://www.xbrl.org/2003/role/disclosureRef
-Publisher FASB
-Name Accounting Standards Codification
-Topic 825
-SubTopic 10
-Section 50
-Paragraph 28
-Subparagraph (f)
-URI https://asc.fasb.org/extlink&oid=123596393&loc=d3e14064-108612
Reference 16: http://www.xbrl.org/2003/role/disclosureRef
-Publisher FASB
-Name Accounting Standards Codification
-Topic 470
-SubTopic 10
-Section S99
-Paragraph 1B
-Subparagraph (SX 210.13-02(a)(4)(iii)(B))
-URI https://asc.fasb.org/extlink&oid=126975872&loc=SL124442552-122756
Reference 17: http://www.xbrl.org/2003/role/disclosureRef
-Publisher FASB
-Name Accounting Standards Codification
-Topic 810
-SubTopic 10
-Section 50
-Paragraph 3
-Subparagraph (bb)
-URI https://asc.fasb.org/extlink&oid=123419778&loc=d3e5710-111685
Reference 18: http://www.xbrl.org/2003/role/disclosureRef
-Publisher FASB
-Name Accounting Standards Codification
-Topic 470
-SubTopic 10
-Section S99
-Paragraph 1B
-Subparagraph (SX 210.13-02(a)(5))
-URI https://asc.fasb.org/extlink&oid=126975872&loc=SL124442552-122756
Reference 19: http://www.xbrl.org/2003/role/disclosureRef
-Publisher FASB
-Name Accounting Standards Codification
-Topic 280
-SubTopic 10
-Section 50
-Paragraph 32
-Subparagraph (d)
-URI https://asc.fasb.org/extlink&oid=126901519&loc=d3e8933-108599
Reference 20: http://www.xbrl.org/2003/role/disclosureRef
-Publisher FASB
-Name Accounting Standards Codification
-Topic 810
-SubTopic 10
-Section 45
-Paragraph 25
-Subparagraph (a)
-URI https://asc.fasb.org/extlink&oid=116870748&loc=SL6758485-165988
Reference 21: http://www.xbrl.org/2003/role/disclosureRef
-Publisher FASB
-Name Accounting Standards Codification
-Topic 470
-SubTopic 10
-Section S99
-Paragraph 1B
-Subparagraph (SX 210.13-02(a)(4)(iv))
-URI https://asc.fasb.org/extlink&oid=126975872&loc=SL124442552-122756
Reference 22: http://www.xbrl.org/2003/role/disclosureRef
-Publisher FASB
-Name Accounting Standards Codification
-Topic 210
-SubTopic 10
-Section S99
-Paragraph 1
-Subparagraph (SX 210.5-02(18))
-URI https://asc.fasb.org/extlink&oid=120391452&loc=d3e13212-122682
Reference 23: http://www.xbrl.org/2003/role/disclosureRef
-Publisher FASB
-Name Accounting Standards Codification
-Topic 323
-SubTopic 10
-Section 50
-Paragraph 3
-Subparagraph (c)
-URI https://asc.fasb.org/extlink&oid=114001798&loc=d3e33918-111571
Reference 24: http://www.xbrl.org/2003/role/disclosureRef
-Publisher FASB
-Name Accounting Standards Codification
-Topic 280
-SubTopic 10
-Section 50
-Paragraph 30
-Subparagraph (c)
-URI https://asc.fasb.org/extlink&oid=126901519&loc=d3e8906-108599
| Name: |
us-gaap_Assets |
| Namespace Prefix: |
us-gaap_ |
| Data Type: |
xbrli:monetaryItemType |
| Balance Type: |
debit |
| Period Type: |
instant |
|
| X |
- DefinitionLine items represent financial concepts included in a table. These concepts are used to disclose reportable information associated with domain members defined in one or many axes to the table.
| Name: |
us-gaap_RevenuesFromExternalCustomersAndLongLivedAssetsLineItems |
| Namespace Prefix: |
us-gaap_ |
| Data Type: |
xbrli:stringItemType |
| Balance Type: |
na |
| Period Type: |
duration |
|
| X |
- Details
| Name: |
srt_StatementGeographicalAxis=country_CA |
| Namespace Prefix: |
|
| Data Type: |
na |
| Balance Type: |
|
| Period Type: |
|
|
| X |
- Details
| Name: |
srt_StatementGeographicalAxis=country_US |
| Namespace Prefix: |
|
| Data Type: |
na |
| Balance Type: |
|
| Period Type: |
|
|
| X |
- Details
| Name: |
srt_StatementGeographicalAxis=country_GB |
| Namespace Prefix: |
|
| Data Type: |
na |
| Balance Type: |
|
| Period Type: |
|
|
| X |
- Details
| Name: |
srt_StatementGeographicalAxis=country_MX |
| Namespace Prefix: |
|
| Data Type: |
na |
| Balance Type: |
|
| Period Type: |
|
|
| X |
- Details
| Name: |
srt_StatementGeographicalAxis=country_AU |
| Namespace Prefix: |
|
| Data Type: |
na |
| Balance Type: |
|
| Period Type: |
|
|
| X |
- Details
| Name: |
srt_StatementGeographicalAxis=country_CN |
| Namespace Prefix: |
|
| Data Type: |
na |
| Balance Type: |
|
| Period Type: |
|
|
v3.23.2
SCHEDULE OF RECONCILIATION OF INCOME TAX EXPENSE (Details) - USD ($)
|
12 Months Ended |
Dec. 31, 2022 |
Dec. 31, 2021 |
| Product Liability Contingency [Line Items] |
|
|
| Income tax rate |
27.00%
|
27.00%
|
| Loss before income taxes |
$ (7,547,000)
|
$ (6,419,000)
|
| Income tax recovery calculated using statutory rate |
(2,038,000)
|
(1,733,000)
|
| Non-deductible (taxable) items |
88,000
|
54,000
|
| Effect of tax rate change |
(17,000)
|
(2,000)
|
| Effect of different tax jurisdiction rates |
24,000
|
68,000
|
| Change in tax assets not recognized |
1,926,000
|
1,613,000
|
| Income tax expense (recovery) |
|
|
| CANADA |
|
|
| Product Liability Contingency [Line Items] |
|
|
| Income tax rate |
27.00%
|
|
| UNITED STATES |
|
|
| Product Liability Contingency [Line Items] |
|
|
| Income tax rate |
27.50%
|
|
| X |
- DefinitionLine items represent financial concepts included in a table. These concepts are used to disclose reportable information associated with domain members defined in one or many axes to the table.
| Name: |
us-gaap_ProductLiabilityContingencyLineItems |
| Namespace Prefix: |
us-gaap_ |
| Data Type: |
xbrli:stringItemType |
| Balance Type: |
na |
| Period Type: |
duration |
|
| X |
- Details
| Name: |
srt_StatementGeographicalAxis=country_CA |
| Namespace Prefix: |
|
| Data Type: |
na |
| Balance Type: |
|
| Period Type: |
|
|
| X |
- Details
| Name: |
srt_StatementGeographicalAxis=country_US |
| Namespace Prefix: |
|
| Data Type: |
na |
| Balance Type: |
|
| Period Type: |
|
|
v3.23.2
SCHEDULE OF DEFERRED TAX ASSETS AND LIABILITIES (Details) - USD ($)
|
Dec. 31, 2022 |
Dec. 31, 2021 |
| Commitments and Contingencies Disclosure [Abstract] |
|
|
| Capital assets |
$ 20,000
|
$ 16,000
|
| ROU assets |
31,000
|
5,000
|
| Non-capital losses |
17,317,000
|
15,426,000
|
| Capital leases |
9,000
|
24,000
|
| Accounts receivable |
29,000
|
9,000
|
| Total deferred tax assets |
17,406,000
|
15,480,000
|
| Unrecognized benefit from income tax losses |
(17,406,000)
|
(15,480,000)
|
| Net deferred tax assets |
|
|
| X |
- DefinitionDeferred tax assets accounts receivable
| Name: |
DSGT_DeferredTaxAssetsAccountsReceivable |
| Namespace Prefix: |
DSGT_ |
| Data Type: |
xbrli:monetaryItemType |
| Balance Type: |
debit |
| Period Type: |
instant |
|
| X |
- DefinitionDeferred tax assets capital assets
| Name: |
DSGT_DeferredTaxAssetsCapitalAssets |
| Namespace Prefix: |
DSGT_ |
| Data Type: |
xbrli:monetaryItemType |
| Balance Type: |
debit |
| Period Type: |
instant |
|
| X |
- DefinitionDeferred tax assets capital leases
| Name: |
DSGT_DeferredTaxAssetsCapitalLeases |
| Namespace Prefix: |
DSGT_ |
| Data Type: |
xbrli:monetaryItemType |
| Balance Type: |
debit |
| Period Type: |
instant |
|
| X |
- DefinitionDeferred tax assets noncapital losses
| Name: |
DSGT_DeferredTaxAssetsNoncapitalLosses |
| Namespace Prefix: |
DSGT_ |
| Data Type: |
xbrli:monetaryItemType |
| Balance Type: |
debit |
| Period Type: |
instant |
|
| X |
- DefinitionDeferred tax assets right of use asset
| Name: |
DSGT_DeferredTaxAssetsRightOfUseAsset |
| Namespace Prefix: |
DSGT_ |
| Data Type: |
xbrli:monetaryItemType |
| Balance Type: |
debit |
| Period Type: |
instant |
|
| X |
- References
+ Details
| Name: |
us-gaap_CommitmentsAndContingenciesDisclosureAbstract |
| Namespace Prefix: |
us-gaap_ |
| Data Type: |
xbrli:stringItemType |
| Balance Type: |
na |
| Period Type: |
duration |
|
| X |
- DefinitionAmount before allocation of valuation allowances of deferred tax asset attributable to deductible temporary differences and carryforwards. Reference 1: http://www.xbrl.org/2003/role/disclosureRef
-Publisher FASB
-Name Accounting Standards Codification
-Topic 740
-SubTopic 10
-Section 50
-Paragraph 2
-Subparagraph (b)
-URI https://asc.fasb.org/extlink&oid=121826272&loc=d3e32537-109319
| Name: |
us-gaap_DeferredTaxAssetsGross |
| Namespace Prefix: |
us-gaap_ |
| Data Type: |
xbrli:monetaryItemType |
| Balance Type: |
debit |
| Period Type: |
instant |
|
| X |
- DefinitionAmount, after allocation of valuation allowances and deferred tax liability, of deferred tax asset attributable to deductible differences and carryforwards, without jurisdictional netting. Reference 1: http://www.xbrl.org/2009/role/commonPracticeRef
-Publisher FASB
-Name Accounting Standards Codification
-Topic 740
-SubTopic 10
-Section 50
-Paragraph 2
-URI https://asc.fasb.org/extlink&oid=121826272&loc=d3e32537-109319
| Name: |
us-gaap_DeferredTaxAssetsLiabilitiesNet |
| Namespace Prefix: |
us-gaap_ |
| Data Type: |
xbrli:monetaryItemType |
| Balance Type: |
debit |
| Period Type: |
instant |
|
| X |
- DefinitionAmount of deferred tax assets for which it is more likely than not that a tax benefit will not be realized. Reference 1: http://www.xbrl.org/2003/role/disclosureRef
-Publisher FASB
-Name Accounting Standards Codification
-Topic 740
-SubTopic 10
-Section 50
-Paragraph 2
-Subparagraph (c)
-URI https://asc.fasb.org/extlink&oid=121826272&loc=d3e32537-109319
| Name: |
us-gaap_DeferredTaxAssetsValuationAllowance |
| Namespace Prefix: |
us-gaap_ |
| Data Type: |
xbrli:monetaryItemType |
| Balance Type: |
credit |
| Period Type: |
instant |
|
v3.23.2
| X |
- References
+ Details
| Name: |
us-gaap_CommitmentsAndContingenciesDisclosureAbstract |
| Namespace Prefix: |
us-gaap_ |
| Data Type: |
xbrli:stringItemType |
| Balance Type: |
na |
| Period Type: |
duration |
|
| X |
- DefinitionAmount of operating loss carryforward, before tax effects, available to reduce future taxable income under enacted tax laws. Reference 1: http://fasb.org/us-gaap/role/ref/legacyRef
-Publisher FASB
-Name Accounting Standards Codification
-Topic 740
-SubTopic 10
-Section 50
-Paragraph 3
-Subparagraph (a)
-URI https://asc.fasb.org/extlink&oid=121826272&loc=d3e32559-109319
| Name: |
us-gaap_OperatingLossCarryforwards |
| Namespace Prefix: |
us-gaap_ |
| Data Type: |
xbrli:monetaryItemType |
| Balance Type: |
debit |
| Period Type: |
instant |
|
v3.23.2
SCHEDULE OF SUPPLEMENTAL CASH FLOW INFORMATION (Details) - USD ($)
|
12 Months Ended |
Dec. 31, 2022 |
Dec. 31, 2021 |
| Supplemental Cash Flow Elements [Abstract] |
|
|
| Income tax payments |
|
|
| Interest payments |
11,222
|
57,111
|
| Shares issued for debt settlement |
|
191,235
|
| Shares issued on conversion of preferred shares |
302,557
|
2,088,100
|
| Dividends payable with preferred shares to be issued |
382,563
|
455,500
|
| Initial recognition of lease assets |
143,630
|
9,904
|
| Initial recognition of lease liabilities |
$ 143,630
|
$ 9,904
|
| X |
- DefinitionDividends payable with preferred shares to be issued.
| Name: |
DSGT_DividendsPayableWithPreferredSharesToBeIssued |
| Namespace Prefix: |
DSGT_ |
| Data Type: |
xbrli:monetaryItemType |
| Balance Type: |
credit |
| Period Type: |
duration |
|
| X |
- DefinitionInitial recognition of lease assets.
| Name: |
DSGT_InitialRecognitionOfLeaseAssets |
| Namespace Prefix: |
DSGT_ |
| Data Type: |
xbrli:monetaryItemType |
| Balance Type: |
credit |
| Period Type: |
duration |
|
| X |
- DefinitionInitial recognition of lease liabilities.
| Name: |
DSGT_InitialRecognitionOfLeaseLiabilities |
| Namespace Prefix: |
DSGT_ |
| Data Type: |
xbrli:monetaryItemType |
| Balance Type: |
credit |
| Period Type: |
duration |
|
| X |
- DefinitionShares issued and to be issued for share-settled debt.
| Name: |
DSGT_SharesIssuedAndToBeIssuedForSharesettledDebt |
| Namespace Prefix: |
DSGT_ |
| Data Type: |
xbrli:monetaryItemType |
| Balance Type: |
credit |
| Period Type: |
duration |
|
| X |
- DefinitionShares issued on conversion of preferred shares.
| Name: |
DSGT_SharesIssuedOnConversionOfPreferredShares |
| Namespace Prefix: |
DSGT_ |
| Data Type: |
xbrli:monetaryItemType |
| Balance Type: |
credit |
| Period Type: |
duration |
|
| X |
- DefinitionAmount of cash paid for interest, excluding capitalized interest, classified as operating activity. Includes, but is not limited to, payment to settle zero-coupon bond for accreted interest of debt discount and debt instrument with insignificant coupon interest rate in relation to effective interest rate of borrowing attributable to accreted interest of debt discount. Reference 1: http://www.xbrl.org/2003/role/disclosureRef
-Publisher FASB
-Name Accounting Standards Codification
-Topic 230
-SubTopic 10
-Section 50
-Paragraph 2
-URI https://asc.fasb.org/extlink&oid=126999549&loc=d3e4297-108586
Reference 2: http://www.xbrl.org/2003/role/disclosureRef
-Publisher FASB
-Name Accounting Standards Codification
-Topic 230
-SubTopic 10
-Section 45
-Paragraph 17
-Subparagraph (d)
-URI https://asc.fasb.org/extlink&oid=126954810&loc=d3e3367-108585
Reference 3: http://www.xbrl.org/2003/role/disclosureRef
-Publisher FASB
-Name Accounting Standards Codification
-Topic 230
-SubTopic 10
-Section 45
-Paragraph 25
-Subparagraph (e)
-URI https://asc.fasb.org/extlink&oid=126954810&loc=d3e3536-108585
| Name: |
us-gaap_InterestPaidNet |
| Namespace Prefix: |
us-gaap_ |
| Data Type: |
xbrli:monetaryItemType |
| Balance Type: |
credit |
| Period Type: |
duration |
|
| X |
- References
+ Details
| Name: |
us-gaap_SupplementalCashFlowElementsAbstract |
| Namespace Prefix: |
us-gaap_ |
| Data Type: |
xbrli:stringItemType |
| Balance Type: |
na |
| Period Type: |
duration |
|
v3.23.2
SUBSEQUENT EVENTS (Details Narrative) - USD ($)
|
|
|
|
|
|
|
|
|
|
|
|
|
|
|
|
|
|
|
|
|
|
|
12 Months Ended |
Jan. 18, 2023 |
Jan. 17, 2023 |
Jan. 13, 2023 |
Jan. 12, 2023 |
Jan. 04, 2023 |
Oct. 21, 2022 |
Sep. 15, 2022 |
Aug. 26, 2022 |
Jul. 29, 2022 |
Mar. 31, 2022 |
Feb. 07, 2022 |
Jan. 04, 2022 |
Dec. 31, 2021 |
Dec. 14, 2021 |
Nov. 30, 2021 |
Oct. 22, 2021 |
Sep. 16, 2021 |
Aug. 03, 2021 |
Jun. 10, 2021 |
May 26, 2021 |
Feb. 17, 2021 |
Dec. 23, 2020 |
Dec. 31, 2022 |
Dec. 31, 2021 |
| Subsequent Event [Line Items] |
|
|
|
|
|
|
|
|
|
|
|
|
|
|
|
|
|
|
|
|
|
|
|
|
| Common stock, shares authorized |
|
|
|
|
|
|
|
|
|
|
|
|
350,000,000
|
|
|
|
|
|
|
|
|
|
350,000,000
|
350,000,000
|
| Series B Preferred Stock [Member] |
|
|
|
|
|
|
|
|
|
|
|
|
|
|
|
|
|
|
|
|
|
|
|
|
| Subsequent Event [Line Items] |
|
|
|
|
|
|
|
|
|
|
|
|
|
|
|
|
|
|
|
|
|
|
|
|
| Conversion of share |
|
|
|
|
|
|
|
|
|
|
|
|
|
|
|
|
5
|
|
|
5
|
|
|
|
125
|
| Stock issued during period, shares, new issues |
|
|
|
|
|
|
|
|
|
|
|
|
|
|
|
|
|
|
|
|
100
|
|
|
|
| Conversion of share, value |
|
|
|
|
|
|
|
|
|
|
|
|
|
|
|
|
|
|
|
|
|
|
|
$ 1,734,800
|
| Series F Preferred Stock [Member] |
|
|
|
|
|
|
|
|
|
|
|
|
|
|
|
|
|
|
|
|
|
|
|
|
| Subsequent Event [Line Items] |
|
|
|
|
|
|
|
|
|
|
|
|
|
|
|
|
|
|
|
|
|
|
|
|
| Conversion of share |
|
|
|
|
|
|
|
|
|
|
|
|
|
|
491
|
210
|
|
275
|
|
|
|
|
620
|
|
| Series F Preferred Stock [Member] | Securities Purchase Agreement [Member] |
|
|
|
|
|
|
|
|
|
|
|
|
|
|
|
|
|
|
|
|
|
|
|
|
| Subsequent Event [Line Items] |
|
|
|
|
|
|
|
|
|
|
|
|
|
|
|
|
|
|
|
|
|
|
|
|
| Subscription receivable, amount |
|
|
|
|
|
$ 410,000
|
$ 125,000
|
$ 250,000
|
$ 90,000
|
$ 250,000
|
$ 250,000
|
$ 250,000
|
$ 250,000
|
$ 312,000
|
|
|
|
|
|
|
|
|
|
|
| Stock issued during period, shares, new issues |
|
|
|
|
|
96
|
125
|
250
|
|
250
|
250
|
250
|
250
|
312
|
|
|
|
|
350
|
|
|
1,000
|
|
|
| Subsequent Event [Member] |
|
|
|
|
|
|
|
|
|
|
|
|
|
|
|
|
|
|
|
|
|
|
|
|
| Subsequent Event [Line Items] |
|
|
|
|
|
|
|
|
|
|
|
|
|
|
|
|
|
|
|
|
|
|
|
|
| Common stock, shares authorized |
1,000,000,000
|
350,000,000
|
|
|
|
|
|
|
|
|
|
|
|
|
|
|
|
|
|
|
|
|
|
|
| Subsequent Event [Member] | Series B Preferred Stock [Member] |
|
|
|
|
|
|
|
|
|
|
|
|
|
|
|
|
|
|
|
|
|
|
|
|
| Subsequent Event [Line Items] |
|
|
|
|
|
|
|
|
|
|
|
|
|
|
|
|
|
|
|
|
|
|
|
|
| Conversion of share |
|
|
|
|
30
|
|
|
|
|
|
|
|
|
|
|
|
|
|
|
|
|
|
|
|
| Subsequent Event [Member] | Series F Preferred Stock [Member] |
|
|
|
|
|
|
|
|
|
|
|
|
|
|
|
|
|
|
|
|
|
|
|
|
| Subsequent Event [Line Items] |
|
|
|
|
|
|
|
|
|
|
|
|
|
|
|
|
|
|
|
|
|
|
|
|
| Conversion of share |
|
|
84
|
|
|
|
|
|
|
|
|
|
|
|
|
|
|
|
|
|
|
|
|
|
| Conversion of share, value |
|
|
$ 40,991
|
|
|
|
|
|
|
|
|
|
|
|
|
|
|
|
|
|
|
|
|
|
| Subsequent Event [Member] | Series F Preferred Stock [Member] | Securities Purchase Agreement [Member] |
|
|
|
|
|
|
|
|
|
|
|
|
|
|
|
|
|
|
|
|
|
|
|
|
| Subsequent Event [Line Items] |
|
|
|
|
|
|
|
|
|
|
|
|
|
|
|
|
|
|
|
|
|
|
|
|
| Subscription receivable, amount |
$ 300,000
|
|
|
$ 312,000
|
|
|
|
|
|
|
|
|
|
|
|
|
|
|
|
|
|
|
|
|
| Stock issued during period, shares, new issues |
300
|
|
|
312
|
|
|
|
|
|
|
|
|
|
|
|
|
|
|
|
|
|
|
|
|
| Subsequent Event [Member] | Series F Preferred Stock One [Member] |
|
|
|
|
|
|
|
|
|
|
|
|
|
|
|
|
|
|
|
|
|
|
|
|
| Subsequent Event [Line Items] |
|
|
|
|
|
|
|
|
|
|
|
|
|
|
|
|
|
|
|
|
|
|
|
|
| Conversion of share |
|
100
|
|
|
|
|
|
|
|
|
|
|
|
|
|
|
|
|
|
|
|
|
|
|
| Conversion of share, value |
|
$ 48,799
|
|
|
|
|
|
|
|
|
|
|
|
|
|
|
|
|
|
|
|
|
|
|
| Common Stock [Member] | Series B Preferred Stock [Member] |
|
|
|
|
|
|
|
|
|
|
|
|
|
|
|
|
|
|
|
|
|
|
|
|
| Subsequent Event [Line Items] |
|
|
|
|
|
|
|
|
|
|
|
|
|
|
|
|
|
|
|
|
|
|
|
|
| Stock issued during period, shares, new issues |
|
|
|
|
|
|
|
|
|
|
|
|
|
|
|
|
|
|
|
|
|
|
|
23,046,760
|
| Common Stock [Member] | Series F Preferred Stock [Member] |
|
|
|
|
|
|
|
|
|
|
|
|
|
|
|
|
|
|
|
|
|
|
|
|
| Subsequent Event [Line Items] |
|
|
|
|
|
|
|
|
|
|
|
|
|
|
|
|
|
|
|
|
|
|
|
|
| Stock issued during period, shares, new issues |
|
|
|
|
|
|
|
|
|
|
|
|
|
|
|
|
|
|
|
|
|
|
15,924,810
|
|
| Common Stock [Member] | Subsequent Event [Member] | Series B Preferred Stock [Member] |
|
|
|
|
|
|
|
|
|
|
|
|
|
|
|
|
|
|
|
|
|
|
|
|
| Subsequent Event [Line Items] |
|
|
|
|
|
|
|
|
|
|
|
|
|
|
|
|
|
|
|
|
|
|
|
|
| Conversion of share |
|
|
|
|
3,000,000
|
|
|
|
|
|
|
|
|
|
|
|
|
|
|
|
|
|
|
|
| Common Stock [Member] | Subsequent Event [Member] | Series F Preferred Stock [Member] |
|
|
|
|
|
|
|
|
|
|
|
|
|
|
|
|
|
|
|
|
|
|
|
|
| Subsequent Event [Line Items] |
|
|
|
|
|
|
|
|
|
|
|
|
|
|
|
|
|
|
|
|
|
|
|
|
| Conversion of share |
|
|
2,991,098
|
|
|
|
|
|
|
|
|
|
|
|
|
|
|
|
|
|
|
|
|
|
| Common Stock One [Member] | Subsequent Event [Member] | Series F Preferred Stock One [Member] |
|
|
|
|
|
|
|
|
|
|
|
|
|
|
|
|
|
|
|
|
|
|
|
|
| Subsequent Event [Line Items] |
|
|
|
|
|
|
|
|
|
|
|
|
|
|
|
|
|
|
|
|
|
|
|
|
| Conversion of share |
|
2,992,519
|
|
|
|
|
|
|
|
|
|
|
|
|
|
|
|
|
|
|
|
|
|
|
| X |
- DefinitionSubscription receivable amount.
| Name: |
DSGT_SubscriptionReceivableAmount |
| Namespace Prefix: |
DSGT_ |
| Data Type: |
xbrli:monetaryItemType |
| Balance Type: |
debit |
| Period Type: |
duration |
|
| X |
- DefinitionThe maximum number of common shares permitted to be issued by an entity's charter and bylaws. Reference 1: http://fasb.org/us-gaap/role/ref/legacyRef
-Publisher FASB
-Name Accounting Standards Codification
-Topic 210
-SubTopic 10
-Section S99
-Paragraph 1
-Subparagraph (SX 210.5-02(29))
-URI https://asc.fasb.org/extlink&oid=120391452&loc=d3e13212-122682
| Name: |
us-gaap_CommonStockSharesAuthorized |
| Namespace Prefix: |
us-gaap_ |
| Data Type: |
xbrli:sharesItemType |
| Balance Type: |
na |
| Period Type: |
instant |
|
| X |
- DefinitionThe value of the stock converted in a noncash (or part noncash) transaction. Noncash is defined as transactions during a period that do not result in cash receipts or cash payments in the period. "Part noncash" refers to that portion of the transaction not resulting in cash receipts or cash payments in the period. Reference 1: http://fasb.org/us-gaap/role/ref/legacyRef
-Publisher FASB
-Name Accounting Standards Codification
-Topic 230
-SubTopic 10
-Section 50
-Paragraph 4
-URI https://asc.fasb.org/extlink&oid=126999549&loc=d3e4313-108586
Reference 2: http://fasb.org/us-gaap/role/ref/legacyRef
-Publisher FASB
-Name Accounting Standards Codification
-Topic 230
-SubTopic 10
-Section 50
-Paragraph 5
-URI https://asc.fasb.org/extlink&oid=126999549&loc=d3e4332-108586
Reference 3: http://fasb.org/us-gaap/role/ref/legacyRef
-Publisher FASB
-Name Accounting Standards Codification
-Topic 230
-SubTopic 10
-Section 50
-Paragraph 3
-URI https://asc.fasb.org/extlink&oid=126999549&loc=d3e4304-108586
| Name: |
us-gaap_ConversionOfStockAmountConverted1 |
| Namespace Prefix: |
us-gaap_ |
| Data Type: |
xbrli:monetaryItemType |
| Balance Type: |
debit |
| Period Type: |
duration |
|
| X |
- DefinitionThe number of shares converted in a noncash (or part noncash) transaction. Noncash is defined as transactions during a period that do not result in cash receipts or cash payments in the period. "Part noncash" refers to that portion of the transaction not resulting in cash receipts or cash payments in the period. Reference 1: http://fasb.org/us-gaap/role/ref/legacyRef
-Publisher FASB
-Name Accounting Standards Codification
-Topic 230
-SubTopic 10
-Section 50
-Paragraph 4
-URI https://asc.fasb.org/extlink&oid=126999549&loc=d3e4313-108586
Reference 2: http://fasb.org/us-gaap/role/ref/legacyRef
-Publisher FASB
-Name Accounting Standards Codification
-Topic 230
-SubTopic 10
-Section 50
-Paragraph 3
-URI https://asc.fasb.org/extlink&oid=126999549&loc=d3e4304-108586
Reference 3: http://fasb.org/us-gaap/role/ref/legacyRef
-Publisher FASB
-Name Accounting Standards Codification
-Topic 230
-SubTopic 10
-Section 50
-Paragraph 5
-URI https://asc.fasb.org/extlink&oid=126999549&loc=d3e4332-108586
| Name: |
us-gaap_ConversionOfStockSharesConverted1 |
| Namespace Prefix: |
us-gaap_ |
| Data Type: |
xbrli:sharesItemType |
| Balance Type: |
na |
| Period Type: |
duration |
|
| X |
- DefinitionNumber of new stock issued during the period. Reference 1: http://fasb.org/us-gaap/role/ref/legacyRef
-Publisher FASB
-Name Accounting Standards Codification
-Topic 210
-SubTopic 10
-Section S99
-Paragraph 1
-Subparagraph (SX 210.5-02(29))
-URI https://asc.fasb.org/extlink&oid=120391452&loc=d3e13212-122682
Reference 2: http://fasb.org/us-gaap/role/ref/legacyRef
-Publisher FASB
-Name Accounting Standards Codification
-Topic 505
-SubTopic 10
-Section 50
-Paragraph 2
-URI https://asc.fasb.org/extlink&oid=126973232&loc=d3e21463-112644
Reference 3: http://fasb.org/us-gaap/role/ref/legacyRef
-Publisher FASB
-Name Accounting Standards Codification
-Topic 505
-SubTopic 10
-Section S99
-Paragraph 1
-Subparagraph (SX 210.3-04)
-URI https://asc.fasb.org/extlink&oid=120397183&loc=d3e187085-122770
Reference 4: http://fasb.org/us-gaap/role/ref/legacyRef
-Publisher FASB
-Name Accounting Standards Codification
-Topic 210
-SubTopic 10
-Section S99
-Paragraph 1
-Subparagraph (SX 210.5-02(28))
-URI https://asc.fasb.org/extlink&oid=120391452&loc=d3e13212-122682
| Name: |
us-gaap_StockIssuedDuringPeriodSharesNewIssues |
| Namespace Prefix: |
us-gaap_ |
| Data Type: |
xbrli:sharesItemType |
| Balance Type: |
na |
| Period Type: |
duration |
|
| X |
- DefinitionDetail information of subsequent event by type. User is expected to use existing line items from elsewhere in the taxonomy as the primary line items for this disclosure, which is further associated with dimension and member elements pertaining to a subsequent event.
| Name: |
us-gaap_SubsequentEventLineItems |
| Namespace Prefix: |
us-gaap_ |
| Data Type: |
xbrli:stringItemType |
| Balance Type: |
na |
| Period Type: |
duration |
|
| X |
- Details
| Name: |
us-gaap_StatementClassOfStockAxis=us-gaap_SeriesBPreferredStockMember |
| Namespace Prefix: |
|
| Data Type: |
na |
| Balance Type: |
|
| Period Type: |
|
|
| X |
- Details
| Name: |
us-gaap_StatementClassOfStockAxis=us-gaap_SeriesFPreferredStockMember |
| Namespace Prefix: |
|
| Data Type: |
na |
| Balance Type: |
|
| Period Type: |
|
|
| X |
- Details
| Name: |
us-gaap_TypeOfArrangementAxis=DSGT_SecuritiesPurchaseAgreementMember |
| Namespace Prefix: |
|
| Data Type: |
na |
| Balance Type: |
|
| Period Type: |
|
|
| X |
- Details
| Name: |
us-gaap_SubsequentEventTypeAxis=us-gaap_SubsequentEventMember |
| Namespace Prefix: |
|
| Data Type: |
na |
| Balance Type: |
|
| Period Type: |
|
|
| X |
- Details
| Name: |
us-gaap_StatementClassOfStockAxis=DSGT_SeriesFPreferredStockOneMember |
| Namespace Prefix: |
|
| Data Type: |
na |
| Balance Type: |
|
| Period Type: |
|
|
| X |
- Details
| Name: |
us-gaap_StatementEquityComponentsAxis=us-gaap_CommonStockMember |
| Namespace Prefix: |
|
| Data Type: |
na |
| Balance Type: |
|
| Period Type: |
|
|
| X |
- Details
| Name: |
us-gaap_StatementEquityComponentsAxis=DSGT_CommonStockOneMember |
| Namespace Prefix: |
|
| Data Type: |
na |
| Balance Type: |
|
| Period Type: |
|
|
DSG Global (CE) (USOTC:DSGT)
Historical Stock Chart
From Mar 2024 to Apr 2024
 Charts.")
DSG Global (CE) (USOTC:DSGT)
Historical Stock Chart
From Apr 2023 to Apr 2024
 Charts.")