Key Resistance Levels: 111.000, 112.000, 113.000
Key Support Levels: 104.000, 103.000, 102.000
USD/JPY Price Long-term Trend: Bullish
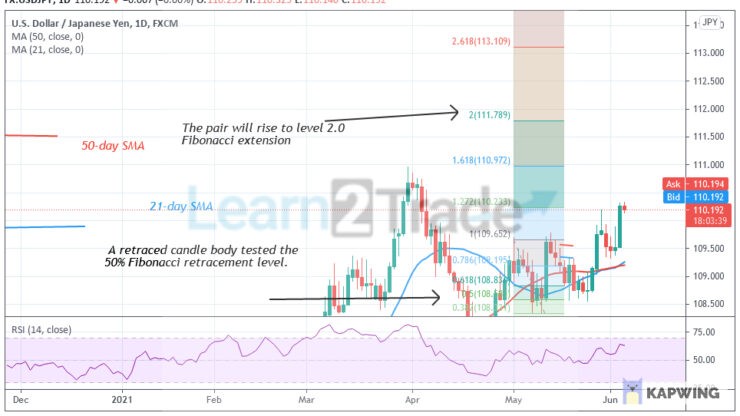
Today, the Yen has broken the previous price level to reach the high of $110.78. On May 3 uptrend, a retraced candle body tested the 50% Fibonacci retracement level. The retracement indicates that the pair will rise to level 2.0 Fibonacci extension or level 111.78.
Daily Chart Indicators Reading:
The pair has risen to level 64 of the Relative Strength Index period 14. It implies that the Yen is in the uptrend zone. However, it has no enough room to rally on the upside. The 21-day and 50-day SMAs are sloping upward. The currency price has broken above the SMAs. The pair will rise if the bullish momentum is sustained.
USD/JPY Medium-term Trend: Bullish
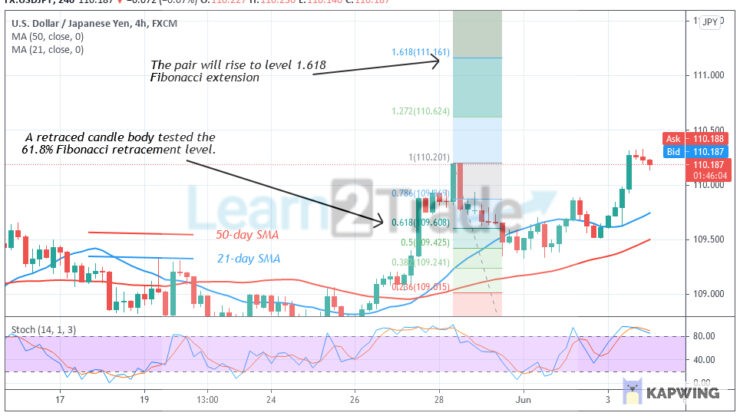
On the 4-hour chart, the Yen is in an uptrend above level 109.800. The pair has broken above level 110.00. On May 28 uptrend, a retraced candle body tested the 61.8% Fibonacci retracement level. The retracement indicates that the pair will rise to level 1.618 Fibonacci extension or level 111.16.
4-hour Chart Indicators Reading
USD/JPY pair is above the 80% range of the daily stochastic. It indicates that the pair is now in the overbought region of the market. Sellers are likely to emerge. The 21-day and 50-day SMAs are sloping upward indicating an uptrend.
General Outlook for USD/JPY
USD/JPY is in an uptrend and has broken above the resistance at level 109.80. The Yen is currently approaching the high of level 110.50. However, the upward move of Yen is doubtful as it is trading in the overbought region of the market.
Source: https://learn2.trade