Rathbone Brothers Rathbone Brothers Plc - 3rd Quarter Results
October 17 2018 - 2:00AM
UK Regulatory
TIDMRAT

   Third quarter funds under management increased to GBP47.3 billion
following completion of acquisition

   Rathbone Brothers Plc ("Rathbones") announces a trading update for the
three months ended 30 September 2018.

   Philip Howell, Chief Executive of Rathbone Brothers Plc, said:

   "Our continuing growth and the acquisition of Speirs & Jeffrey on 31
August 2018 helped our total funds under management increase to GBP47.3
billion at 30 September 2018.  This increase in scale places us in a
strong position to continue to improve our service to clients and,
mindful of recent volatility in investment markets, to maintain our
disciplined investment in the business."

   Financial highlights:


   -- On 31 August 2018 we completed the acquisition of Speirs & Jeffrey for an
      initial consideration of GBP104 million. This consisted of GBP79 million
      of cash ("initial cash consideration") and the issue of 1,006,522 new
      ordinary Rathbones shares ("initial consideration shares") to Speirs &
      Jeffrey shareholders. As previously announced, further contingent
      consideration and earn-out payments may also be payable depending upon
      the achievement of certain targets.

   -- Total funds under management, including GBP6.7 billion from Speirs &
      Jeffrey, were GBP47.3 billion at 30 September 2018; up 18.5% from GBP39.9
      billion at 30 June 2018 or up 1.8% excluding the impact from the Speirs &
      Jeffrey acquisition. This compared to a decrease of 1.7% in the FTSE 100
      Index and an increase of 1.0% in the MSCI WMA Private Investor Balanced
      Index in the three months ended 30 September 2018. Underlying net
      operating income was GBP80.3 million for the three months ended 30
      September 2018, up 13.9% from GBP70.5 million in the third quarter of
      2017.

   -- The net annualised growth in funds under management for Investment
      Management, excluding the acquisition of Speirs & Jeffrey, in the three
      month period was 2.8% (2017: 3.5%). Net organic growth in the third
      quarter represents an annualised growth rate of 2.6% (2017: 2.6%)
      contributing to a 2.3% net organic growth rate for the nine month period
      to 30 September 2018 (2017: 2.9%).

   -- Net operating income of GBP70.8 million in Investment Management for the
      three months ended 30 September 2018 was 13.3% higher than the GBP62.5
      million for the comparable period in 2017. The value of the FTSE 100
      Index on the third quarter charging date was 7510 compared with 7373 a
      year ago. The MSCI WMA Private Investor Balanced Index was 1612 and 1545
      on the equivalent dates.

   -- Funds under management in Unit Trusts at 30 September 2018 were GBP6.0
      billion, up 3.4% from GBP5.8 billion at 30 June 2018. Net inflows for the
      quarter were GBP121 million compared to GBP342 million a year ago,
      reflecting a more difficult trading environment for asset management
      generally. Net operating income of GBP9.5 million for the three months
      ended 30 September 2018 was 18.8% higher than the GBP8.0 million for the
      comparable period in 2017.


   Net operating income


                           3 months ended 30    9 months ended 30
                               September         September
                         2018   2017   Change    2018   2017   Change
                         GBPm   GBPm      %      GBPm   GBPm     %
Investment Management
- Fees                    51.9   47.7      8.8   150.3  140.2     7.2
- Commissions              9.8    8.2     19.5    30.8   30.1     2.3
- Net interest
 income                    4.0    2.9     37.9    10.9    8.5    28.2
- Fees from advisory
 services(1) and
 other income              5.1    3.7     37.8    14.1   11.2    25.9
                          70.8   62.5     13.3   206.1  190.0     8.5
Unit Trusts                9.5    8.0     18.8    27.4   22.9    19.7
Underlying net
 operating income         80.3   70.5     13.9   233.5  212.9     9.7
Average FTSE 100
 Index on principal
 charging dates(2)        7510   7373      1.9    7449   7339     1.5
Average MSCI WMA
 Balanced Index
 on principal charging
 dates(2)                 1612   1545      4.3    1582   1538     2.9


   1. Including income from trust, tax, pension advisory services and Vision
      Independent Financial Planning.

   2. The principal charging dates for Investment Management clients are 5
      April, 30 June, 30 September and 31 December. Unit Trust income accrues
      on daily levels of funds under management.


   Funds under management


                                  3 months ended      9 months ended
                                   30 September        30 September
                               2018        2017        2018        2017
                                 GBPm        GBPm        GBPm     GBPm
 (i) Investment Management
Opening FUM (1 July/1
 January)                     34,140      31,981      33,780      30,184
Inflows                        7,508         809       9,262       2,542
 Organic new business            800         742       2,493       2,311
 Acquired new business         6,708          67       6,769         231

Outflows                        (582)       (532)     (1,922)     (1,663)
Market adjustment                208         277         154       1,472
Closing FUM (30 September)    41,274      32,535      41,274      32,535

Underlying annualised
 rate of net organic growth      2.6%        2.6%        2.3%        2.9%
Annualised rate of net
 inflows(3)                      2.8%        3.5%        2.6%        3.9%

(ii) Unit Trusts
Opening FUM (1 July/1
 January)                      5,776       4,634       5,367       4,051
Inflows                          459         521       1,432       1,254
Outflows                        (338)       (179)     (1,012)       (643)
Market adjustment                109           6         219         320
Closing FUM (30 September)     6,006       4,982       6,006       4,982

Total FUM (30 September)(4,
 5)                           47,280      37,517      47,280      37,517

Net fund inflows
Investment Management          6,926         277       7,340         879
Unit Trusts                      121         342         420         611
Total                          7,047         619       7,760       1,490


   1. Annualised rate of net inflows excludes the GBP6.7 billion acquired in
      relation to Speirs & Jeffrey.

   2. Includes GBP2.3 billion (30 September 2017: GBP1.0 billion) of execution
      only funds, Greenbank funds of GBP1.2 billion (30 September 2017: GBP1.0
      billion) and funds managed with a charitable mandate of GBP5.7 billion
      (30 September 2017: GBP4.5 billion).

   3. Cash in client portfolios was GBP2.3 billion (2017 average: GBP2.3
      billion). Loans and advances to customers were GBP131.1 million at 30
      September 2018, up 6.7% on the GBP122.9 million at 30 June 2018.


   The FTSE 100 Index closed at 7059 on 16 October 2018, a decrease of 6.0%
since 30 September 2018. Investment Management fee income in the fourth
quarter is dependent upon the value of funds under management at 31
December 2018.

   Speirs and Jeffrey

   The initial cash consideration of GBP79 million has been capitalised.
The initial consideration shares are contingent on the continued
employment of the recipients; therefore, the value of these will be
charged to profit or loss over the three years post completion to August
2021 in accordance with IFRS 3.

   The additional contingent share consideration of 0.6 million new
Rathbones shares is also conditional on certain operational performance
targets and the continued employment of the recipient and therefore will
be charged to profit and loss over the period post completion until
performance conditions are met. The award is payable no earlier than six
months post completion. Any earn-out awards must satisfy the same
employment conditions as above and will be charged to profit and loss
over the period to December 2021.

   17 October 2018

   For further information contact:

   Rathbone Brothers Plc

   Tel: 020 7399 0000

   Email: shelly.patel@rathbones.com

   Philip Howell, Chief Executive

   Paul Stockton, Group Finance Director/Managing Director, Rathbone
Investment Management

   Shelly Patel, Head of Investor Relations

   Camarco (Communications adviser to Rathbones)

   Tel: 020 3757 4984

   Email: ed.gascoigne-pees@camarco.co.uk

   Ed Gascoigne-Pees

   Hazel Stevenson

   Rathbone Brothers Plc

   Rathbone Brothers Plc ("Rathbones"), through its subsidiaries, is a
leading provider of high-quality, personalised investment and wealth
management services for private clients, charities and trustees. Our
services include discretionary investment management, unit trusts,
banking and loan services, financial planning, unitised portfolio
services, and UK trust, legal, estate and tax advice.

   Rathbones has over 1,400 staff in 15 UK locations and Jersey; its
headquarters is 8 Finsbury Circus, London.

   https://www.globenewswire.com/Tracker?data=7tRV4ZqNVP0x6xW9hjs66IfwB03W6Kko2Ux6YBMDaOCjdH3CXzjG5iOlkAyQ6KnW6tSykEg3mBbPlIukSdfxmQ==
rathbones.com
(END) Dow Jones Newswires
October 17, 2018 02:00 ET (06:00 GMT)
Copyright (c) 2018 Dow Jones & Company, Inc.
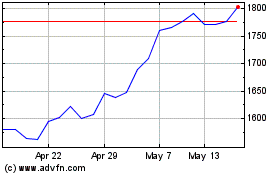
Rathbones (LSE:RAT)
Historical Stock Chart
From Jun 2024 to Jul 2024

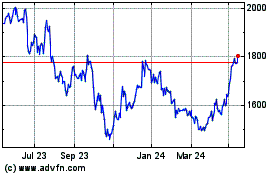
Rathbones (LSE:RAT)
Historical Stock Chart
From Jul 2023 to Jul 2024
