  profit/(loss) (1)             51,020      12,436         1,389       (6,211)         58,634
=========================  ===========  ==========  ============  ============  =============
 Segmental financial
  position
 Investments at fair
  value                        525,060     187,104        41,659        90,559        844,382
 Current assets                 97,293           -             -             -         97,293
=========================  ===========  ==========  ============  ============  =============
 Total assets                  622,353     187,104        41,659        90,559        941,675
 Total liabilities             (6,284)           -             -             -        (6,284)
=========================  ===========  ==========  ============  ============  =============
 Net assets                    616,069     187,104        41,659        90,559        935,391
=========================  ===========  ==========  ============  ============  =============
(1) Reporting segment results are stated net of operational
costs including management fees.
(2) North American segment currently relates entirely to projects in Canada.
Revenue from investments which represents more than 10% of the
Group's interest and dividend income approximates GBP17.0 million
(2013: GBP18.04 million).
4. Investment Income
Accounting policy
Interest Income
Interest income is recognised when it is probable that the
economic benefits will flow to the Group and the amount of income
can be measured reliably. Interest income is accrued on a
time-apportioned basis, using the effective interest rate of the
instrument concerned as calculated at the acquisition or
origination date. Interest income is recognised gross of
withholding tax, if any.
The effective interest rate is the rate that exactly discounts
the estimated future cash payments and receipts through the
expected life of the financial instrument (or, when appropriate, a
shorter period). When calculating the effective interest rate, the
Group estimates future cash flows considering all contractual terms
of the financial instrument, but not future credit losses.
Dividend Income
Dividend income is recognised gross of withholding tax in the
Consolidated Statement of Comprehensive Income on the date the
right to receive payment is established. This is the date when the
directors of the underlying project entity approve the payment of a
dividend.
Net Gain from Financial Instruments at Fair Value through Profit
or Loss
Net gain from financial instruments at fair value through profit
or loss includes all realised and unrealised fair value changes
(including foreign exchange movements) other than interest and
dividend income recognised separately.
                                                     Year ended    Year ended
                                                    31 December   31 December
                                                           2014          2013
                                                       GBP'000s      GBP'000s
=================================================  ============  ============
Interest income
Interest on investments                                  31,862        28,309
Interest on bank deposits                                   338           549
=================================================  ============  ============
Total interest income                                    32,200        28,858
=================================================  ============  ============

Dividend income                                          23,605        17,669
    Net change in fair value of financial assets
     at fair value through profit or loss                32,187        30,697
ReRealised gain on disposal of investments
 (see note 5)                                             2,104             -
=================================================  ============  ============
Total investment income                                  90,096        77,224
=================================================  ============  ============
All dividend and interest income has resulted from transactions
with unconsolidated subsidiary entities. Gains on investments at
fair value through profit or loss are also recognised on the
Group's investments in unconsolidated subsidiaries.
5. Gain on Disposal of Investments
During the year, the Group disposed of a number of non-strategic
minority investments where there was no realistic scope to increase
the investment in the future. The divestments predominantly relate
to a small number of minority interests in the Group's Building
Schools for the Future (BSF) project portfolio. The aggregate gains
realised in the period are shown in the table below:
                              Fair value   Cash received        Net Realised
                           of investment     at disposal    gain on disposal
                             at disposal        GBP'000s            GBP'000s
 Divestment                     GBP'000s
=======================  ===============  ==============  ==================
 Aggregate divestments            20,228          22,332               2,104
=======================  ===============  ==============  ==================
No disposals were carried out by the group during the year ended
31 December 2013.
   6.         Other Operating expense/(income)

                                                  Year ended    Year ended
                                                 31 December   31 December
                                                        2014          2013
                                                    GBP'000s      GBP'000s
Fair value loss/(gain) on foreign exchange
 contracts                                               716       (3,833)
Unrealised gain on foreign exchange movements          (117)         (310)
==============================================  ============  ============
Total operating expense/(income)                         599       (4,143)
==============================================  ============  ============

   7.         Management Costs

                           Year ended    Year ended
                          31 December   31 December
                                 2014          2013
                             GBP'000s      GBP'000s
=======================  ============  ============
Recurring
Base fee                       11,608        10,702
Non recurring
Incentive fee                       -        10,973
=======================  ============  ============
Total management costs         11,608        21,675
=======================  ============  ============
In 2013, the Investment Adviser was entitled to an additional
incentive fee. This was the final incentive fee paid following the
amendments made to the Investment Advisory Agreement and
Partnership Deed on 28 August 2013.
   8.         Transaction Costs

                                 Year ended    Year ended
                                31 December   31 December
                                       2014          2013
                                   GBP'000s      GBP'000s
=============================  ============  ============
Investment advisory costs             2,818           548
Legal and professional costs             56            48
=============================  ============  ============
Total transaction costs               2,874           596
=============================  ============  ============
Details of investment advisory costs paid are provided in note
19.
   9.         Auditor's Remuneration

                                                                  Year ended    Year ended
                                                                 31 December   31 December
                                                                        2014          2013
                                                                    GBP'000s      GBP'000s
==============================================================  ============  ============
Fees payable to the Group's auditor for the
 audit of the Group's financial statements                                93           148
Fees payable to the Group's auditor and their
 associates for other services to the Group

    *    The audit of the Group's consolidated subsidiaries                9             7

    *    The audit of the Group's unconsolidated subsidiaries            339           438

    *    Audit related assurance services                                 20            20
==============================================================  ============  ============
Total audit fees                                                         461           613
==============================================================  ============  ============
Other fees

    *    Regulatory reporting                                             49            55

    *    Other services                                                    9            18
==============================================================  ============  ============
Total non-audit fees                                                      58            73
==============================================================  ============  ============

   10.       Finance Costs
Accounting policy
Borrowing costs are recognised in the Consolidated Statement of
Comprehensive Income in the period in which they are incurred using
the effective interest rate method. Arrangement fees are amortised
over the term of the corporate borrowing facility.
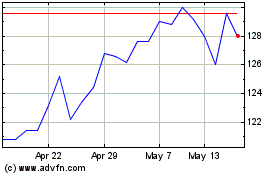
International Public Par... (LSE:INPP)
Historical Stock Chart
From Jun 2024 to Jul 2024

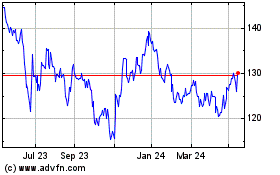
International Public Par... (LSE:INPP)
Historical Stock Chart
From Jul 2023 to Jul 2024
