International Public Partnership Ld Full Year -28-
March 26 2015 - 3:01AM
UK Regulatory
All income is attributable to the equity holders of the parent.
There are no non-controlling interests within the consolidated
group.
There are no other Comprehensive Income items in the current
year (2013: nil). The profit for the year represents the Total
Comprehensive Income for the year.
                                                                   Other
                                                           distributable      Retained
                               Notes   Share capital             reserve      earnings          Total
                                            GBP'000s            GBP'000s      GBP'000s       GBP'000s
============================  ======  ==============  ==================  ============  =============
 Balance at 31 December
  2013                                       524,393             182,481       228,517        935,391
============================  ======  ==============  ==================  ============  =============

 Total comprehensive income                        -                   -        73,211         73,211

 Issue of Ordinary Shares       17           101,688                   -             -        101,688
 Issue fees applied to new
  shares                        17             (792)                   -             -          (792)
 Distributions in the year      17                 -                   -      (47,430)       (47,430)
============================  ======  ==============  ==================  ============  =============
 Balance at 31 December
  2014                                       625,289             182,481       254,298      1,062,068
============================  ======  ==============  ==================  ============  =============
As at 31 December 2013
                                                                   Other
                                                           distributable      Retained
                               Notes   Share capital             reserve      earnings         Total
                                            GBP'000s            GBP'000s      GBP'000s      GBP'000s
============================  ======  ==============  ==================  ============  ============
 Balance at 31 December
  2012                                       463,054             182,481       215,419       860,954

 Total comprehensive income                        -                   -        58,634        58,634

 Issue of Ordinary Shares       17            61,754                   -             -        61,754
 Issue fees applied to new
  shares                        17             (415)                   -             -         (415)
 Distributions in the year      17                 -                   -      (45,536)      (45,536)
============================  ======  ==============  ==================  ============  ============
 Balance at 31 December
  2013                                       524,393             182,481       228,517       935,391
============================  ======  ==============  ==================  ============  ============


                                             31 December  31 December
                                                    2014         2013
                                      Notes     GBP'000s     GBP'000s
==================================  =======  ===========  ===========
Non-current assets
Investments at fair value through
 profit or loss                          13   1,032,941     844,382
==================================  =======  ===========  ===========
Total non-current assets                      1,032,941     844,382
==================================  =======  ===========  ===========
Current assets
Trade and other receivables              15    19,529       13,020
Cash and cash equivalents                13    29,391       80,609
Derivative financial instruments         13     2,948        3,664
==================================  =======  ===========  ===========
Total current assets                           51,868       97,293
==================================  =======  ===========  ===========
Total assets                                  1,084,809     941,675
==================================  =======  ===========  ===========

Current liabilities
Trade and other payables                 16     6,414        6,284
==================================  =======  ===========  ===========
Total current liabilities                       6,414        6,284
==================================  =======  ===========  ===========


Non-current liabilities
Bank loans                            10,13    16,327          -
==================================  =======  ===========  ===========
Total non-current liabilities                  16,327          -
==================================  =======  ===========  ===========
Total liabilities                              22,741        6,284
==================================  =======  ===========  ===========
Net assets                                    1,062,068     935,391
==================================  =======  ===========  ===========

Equity
Share capital                            17    625,289      524,393
Other distributable reserve              17    182,481      182,481
Retained earnings                        17    254,298      228,517
==================================  =======  ===========  ===========
Equity attributable to equity
 holders of the parent                        1,062,068     935,391
==================================  =======  ===========  ===========
Net assets per share (pence per
 share)                                  18     127.0        123.0
==================================  =======  ===========  ===========
The financial statements were approved by the Board of Directors
on 25 March 2015.
They were signed on its behalf by:
Rupert Dorey John Whittle
25 March 2015 25 March 2015
Chairman Director
                                                                    Year ended     Year ended
                                                                   31 December    31 December
                                                                          2014           2013
                                                        Notes         GBP'000s       GBP'000s
===================================================  ==========  =============  =============
 Profit from operations                                                 73,211         58,634
 Adjusted for:
 Gain on investments at fair value through
  profit or loss                                           4          (32,187)       (30,697)
 Unrealised exchange (loss)/gain                                         (528)             45
 Share settled performance fee                             19                -          6,584
 Finance costs                                             10            2,668          1,390
 Net income tax credit                                     11          (2,042)        (2,551)
 Fair value movement on derivative financial
  instruments                                              13              716        (3,950)
 Realised gain on disposal of investments                  5           (2,104)              -
 Working capital adjustments
 Increase in receivables                                               (5,830)          (564)
 Increase /(decrease) in payables                                           80          (257)
===================================================  ==========  =============  =============
                                                                        33,984         28,634
 Income tax received(1)                                                  1,033          1,049
===================================================  ==========  =============  =============
 Net cash inflow from operations                                        35,017         29,683
===================================================  ==========  =============  =============

 Investing Activities
 Acquisition of investments at fair value
  through profit or loss                                   14        (188,228)       (36,476)
 Net repayments from investments at fair
  value through profit or loss                                          11,628         13,455
 Cash received from disposal of investments                5            22,332              -
===================================================  ==========  =============  =============

 Net cash outflow from investing activities                          (154,268)       (23,021)
===================================================  ==========  =============  =============

 Financing Activities
 Proceeds from issue of shares net of issue
  costs                                                    17           94,208         46,080
 Dividends paid                                            17         (40,742)       (36,860)
 Finance costs paid                                                    (1,879)        (1,005)
 Net loan drawdowns                                       10,13         16,327              -
===================================================  ==========  =============  =============
 Net cash provided by financing activities                              67,914          8,215
===================================================  ==========  =============  =============


 Net (decrease)/increase in cash and cash
  equivalents                                                         (51,337)         14,877
 Cash and cash equivalents at beginning
  of year                                                               80,609         65,776
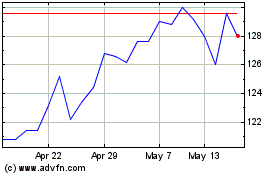
International Public Par... (LSE:INPP)
Historical Stock Chart
From Jun 2024 to Jul 2024

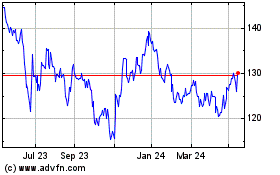
International Public Par... (LSE:INPP)
Historical Stock Chart
From Jul 2023 to Jul 2024
