Helios Underwriting Plc Syndicate Forecasts (9010H)
December 03 2015 - 6:34AM
UK Regulatory
TIDMHUW
RNS Number : 9010H
Helios Underwriting Plc
03 December 2015
3 December 2015
Helios Underwriting plc
("HUW" or the "Company")
Syndicate Forecasts
Set out below are the aggregated 2013 and 2014 underwriting year
of account (YOA) forecasts of syndicate profits for HUW's portfolio
of syndicate participations:
2013 and 2014 open year of account forecasts
 YOA     HUW syndicate        Previous forecast              Current forecast
            capacity         of syndicate profit            of syndicate profit
            (GBP000)             30 June 2015                30 September 2015
------  --------------  -----------------------------  -----------------------------
                            Mid      Mid      Range        Mid      Mid      Range
                           point     point      (%)       point     point      (%)
                          (GBP000)    (%)                (GBP000)    (%)
------  --------------  ----------  ------  ---------  ----------  ------  ---------
                                               7.84                           8.24
 2013       27,032         2,963    10.96     - 14.09     3,048    11.28     - 14.31
------  --------------  ----------  ------  ---------  ----------  ------  ---------
                                               3.28                           3.88
 2014       29,174         2,168     7.43     - 11.58     2,339     8.02     - 12.16
------  --------------  ----------  ------  ---------  ----------  ------  ---------
Source: Syndicate data; Hampden Agencies Limited and HUW
analysis
Explanatory notes:
The table above shows the gross aggregated estimated profits at
syndicate level (before members' agent fees payable by HUW and its
subsidiaries) for the syndicates in which the Company participates
on a three year underwriting year of account (YOA) basis. The
figures are also before HUW's quota share and stop loss reinsurance
arrangements. The forecast YOA syndicate profit for HUW is obtained
by applying the mid-point of the relevant estimated profit range to
each of HUW's syndicate participations. The information presented
above is prepared on a three year YOA basis and should not be
considered as indicative of the Group's annually accounted
financial results prepared in accordance with International
Financial Reporting Standards. Further details, including quarterly
progression for all years and syndicate results for closed years,
will shortly be available on HUW's website at www.huwplc.com.
HUW syndicate participation
HUW's syndicate participations, on which YOA information is
based, is presented below and is also available on the Company's
website:
                   2013               2014               2015
----------  -----------------  -----------------  -----------------
 Syndicate   GBP'000       %*   GBP'000       %*   GBP'000       %*
----------  --------  -------  --------  -------  --------  -------
    33         2,121     7.8%     2,276     7.8%     2,277     8.5%
----------  --------  -------  --------  -------  --------  -------
    218        1,343     5.0%     1,343     4.6%     1,074     4.0%
----------  --------  -------  --------  -------  --------  -------
    308           70     0.3%        85     0.3%        85     0.3%
----------  --------  -------  --------  -------  --------  -------
    386          813     3.0%       840     2.9%       717     2.7%
----------  --------  -------  --------  -------  --------  -------
    510        4,493    16.6%     4,444    15.2%     4,494    16.8%
----------  --------  -------  --------  -------  --------  -------
    557          546     2.0%       516     1.8%       516     1.9%
----------  --------  -------  --------  -------  --------  -------
    609        2,528     9.4%     2,533     8.7%     2,586     9.7%
----------  --------  -------  --------  -------  --------  -------
    623        2,943    10.9%     3,179    10.9%     2,963    11.1%
----------  --------  -------  --------  -------  --------  -------
    727          660     2.4%       661     2.3%       686     2.6%
----------  --------  -------  --------  -------  --------  -------
    779           20     0.1%         -        -         -        -
----------  --------  -------  --------  -------  --------  -------
    958          897     3.3%       714     2.4%       210     0.8%
----------  --------  -------  --------  -------  --------  -------
   1176          474     1.8%       476     1.6%       476     1.8%
----------  --------  -------  --------  -------  --------  -------
   1200          160     0.6%       160     0.5%        95     0.4%
----------  --------  -------  --------  -------  --------  -------
   1729            -        -       107     0.4%        69     0.3%
----------  --------  -------  --------  -------  --------  -------
   2010          919     3.4%       919     3.1%       804     3.0%
----------  --------  -------  --------  -------  --------  -------
   2014            -        -       327     1.1%     1,185     4.4%
----------  --------  -------  --------  -------  --------  -------
   2121          120     0.4%       160     0.5%       260     1.0%
----------  --------  -------  --------  -------  --------  -------
   2525          141     0.5%       141     0.5%       141     0.5%
----------  --------  -------  --------  -------  --------  -------
   2526           60     0.2%         -     0.0%         -     0.0%
----------  --------  -------  --------  -------  --------  -------
   2791        4,388    16.2%     3,864    13.2%     3,412    12.7%
----------  --------  -------  --------  -------  --------  -------
   4242          177     0.7%       177     0.6%       200     0.7%
----------  --------  -------  --------  -------  --------  -------
   5820          224     0.8%       220     0.8%       160     0.6%
----------  --------  -------  --------  -------  --------  -------
   6103          550     2.0%       521     1.8%       210     0.8%
----------  --------  -------  --------  -------  --------  -------
   6104          611     2.3%     1,088     3.7%     1,088     4.1%
----------  --------  -------  --------  -------  --------  -------
   6105          115     0.4%       502     1.7%       517     1.9%
----------  --------  -------  --------  -------  --------  -------
   6106          362     1.3%         -        -         -        -
----------  --------  -------  --------  -------  --------  -------
   6107           33     0.1%       373     1.3%       373     1.4%
----------  --------  -------  --------  -------  --------  -------
   6110        1,073     4.0%       925     3.2%         -        -
----------  --------  -------  --------  -------  --------  -------
   6111        1,122     4.2%     1,385     4.7%     1,395     5.2%
----------  --------  -------  --------  -------  --------  -------
   6113           67     0.2%        67     0.2%         -        -
----------  --------  -------  --------  -------  --------  -------
   6117            -        -     1,171     4.0%       773     2.9%
----------  --------  -------  --------  -------  --------  -------
   7227            -        -         -        -         3     0.0%
----------  --------  -------  --------  -------  --------  -------

     Total    27,032   100.0%    29,174   100.0%    26,767   100.0%
----------  --------  -------  --------  -------  --------  -------
* Percentage of total syndicate portfolio
For further information please contact:
 HUW                             Nigel Hanbury    nigel.hanbury@huwplc.com
 Smith & Williamson Corporate
  Finance                        David Jones      020 7131 4000
 Westhouse Securities            Robert Finlay    020 7601 6100
About HUW
HUW provides a limited liability direct investment into the
Lloyd's insurance market and is quoted on the London Stock
Exchange's AIM market (ticker: HUW). HUW's subsidiary underwriting
vehicles trade within the Lloyd's insurance market as corporate
members of Lloyd's writing GBP27 million of capacity for the 2015
account. The portfolio provides a good spread of classes of
business being concentrated in property insurance and reinsurance.
For further information please visit www.huwplc.com.
This information is provided by RNS
The company news service from the London Stock Exchange
END
MSCUGGGWPUPAGGW
(END) Dow Jones Newswires
December 03, 2015 06:34 ET (11:34 GMT)
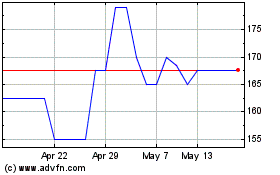
Helios Underwriting (LSE:HUW)
Historical Stock Chart
From Jun 2024 to Jul 2024

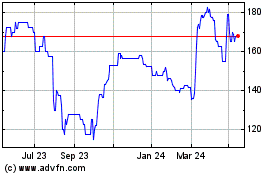
Helios Underwriting (LSE:HUW)
Historical Stock Chart
From Jul 2023 to Jul 2024
