Net Asset Value(s)
October 23 2009 - 2:00AM
UK Regulatory
TIDMSLI

RNS Number : 2562B
Standard Life Invs Property Inc Tst
23 October 2009

STANDARD LIFE INVESTMENTS PROPERTY INCOME TRUST LIMITED
30 September 2009


Key Highlights


  *  Net asset value per ordinary share was 51.3p as at 30 September 2009, an
  increase of 1.5% from 30 June 2009
  *  Cash held by the Trust of GBP32.6m as at 30 September 2009
  *  Loan to value of 42.1% after cash balances offset against debt
  *  Dividend yield of 6.8% using the share price as at 20 October 2009 of 58.5p
  *  2.25m ordinary shares were issued during the quarter at 53.0p each


Net Asset Value


The unaudited net asset value per ordinary share of Standard Life Investments
Property Income Trust Limited at 30 September 2009 was 51.3 pence. This is
an increase of 1.5% percentage points over the net asset value of 50.5 pence per
share at 30 June 2009.


The net asset value is calculated under International Financial Reporting
Standards ("IFRS") and includes a provision for payment of a proposed interim
dividend of 1.00p per ordinary share for the quarter to 30 September 2009.


The net asset value incorporates the external portfolio valuation by Jones Lang
LaSalle at 30 September 2009. The property portfolio will next be valued by an
external valuer during December 2009 and the next quarterly net asset value will
be published thereafter.


Breakdown of NAV movement


Set out below is a breakdown of the change to the unaudited net asset value per
share calculated under IFRS over the period 30 June 2009 to 30 September 2009.


+--------------------------------------------+-------------+--------------+
|                                            |   Pence per | % of opening |
|                                            |       share |          NAV |
+--------------------------------------------+-------------+--------------+
| Net Asset Value per share as at 30 June    |        50.5 |            - |
| 2009                                       |             |              |
+--------------------------------------------+-------------+--------------+
| Unrealised gain following revaluation of   |         0.8 |         1.5% |
| property portfolio (including the effect   |             |              |
| of gearing)                                |             |              |
+--------------------------------------------+-------------+--------------+
| Decrease in interest rate swap valuation   |       (0.8) |       (1.5)% |
+--------------------------------------------+-------------+--------------+
| Other movement in reserves                 |         0.8 |         1.5% |
+--------------------------------------------+-------------+--------------+
| Net Asset Value per share as at            |        51.3 |         1.5% |
| 30 September 2009                          |             |              |
+--------------------------------------------+-------------+--------------+


The ungeared increase in the valuation of the property portfolio over the
quarter to 30 September 2009 was 0.7%.


Cash position


As at 30 September 2009 the Company had borrowings of GBP84.4m and a cash
position of GBP32.6m (excluding rent deposits) therefore cash as a percentage of
debt was 38.6%.


Loan to value ratio


As at 30 September 2009 the loan to value ratio (assuming all cash is placed
with RBS as an offset to the loan balance) was 42.1% (30 June 2009: 42.8%).  The
covenant level is 65%.


Total asset analysis as at 30 September 2009 (unaudited)


+----------------------------+------------+------------+
|                            |       GBPm |          % |
+----------------------------+------------+------------+
|          Office            |       49.0 |       30.9 |
+----------------------------+------------+------------+
|          Retail            |       21.9 |       13.8 |
+----------------------------+------------+------------+
|          Industrial        |       37.4 |       23.5 |
+----------------------------+------------+------------+
|          Other             |       14.8 |        9.3 |
+----------------------------+------------+------------+
| Total Property Portfolio   |      123.1 |       77.5 |
+----------------------------+------------+------------+
| Cash                       |       32.6 |       20.5 |
+----------------------------+------------+------------+
| Other Assets               |        3.1 |        2.0 |
+----------------------------+------------+------------+
| Total Gross Assets         |      158.8 |      100.0 |
+----------------------------+------------+------------+


Breakdown in valuation movements over the period 30 June 2009 to 30 September
2009


+----------------------------+-------------------+--------------+---------+
|                            |    Exposure as    |   Capital    |  GBPm   |
|                            |        at         |    Value     |         |
|                            |30 September 2009  | Movement on  |         |
|                            |        (%)        |  Standing    |         |
|                            |                   |  Portfolio   |         |
|                            |                   |     (%)      |         |
+----------------------------+-------------------+--------------+---------+
| External Valuation at      |                   |              |  122.2  |
| 30/06/09                   |                   |              |         |
+----------------------------+-------------------+--------------+---------+
| Sub Sector Analysis:       |                   |              |         |
+----------------------------+-------------------+--------------+---------+
| RETAIL                     |                   |              |         |
+----------------------------+-------------------+--------------+---------+
| South East Standard Retail |        4.6        |      -       |    -    |
+----------------------------+-------------------+--------------+---------+
| Retail Warehouses          |       13.1        |    (3.6)     |  (0.6)  |
+----------------------------+-------------------+--------------+---------+
|                            |                   |              |         |
+----------------------------+-------------------+--------------+---------+
| OFFICES                    |                   |              |         |
+----------------------------+-------------------+--------------+---------+
| Central London Offices     |        9.8        |     4.8      |  0.5    |
+----------------------------+-------------------+--------------+---------+
| South East Offices         |       18.2        |     4.0      |  0.9    |
+----------------------------+-------------------+--------------+---------+
| Rest of UK Offices         |       11.9        |     0.7      |  0.1    |
+----------------------------+-------------------+--------------+---------+
|                            |                   |              |         |
+----------------------------+-------------------+--------------+---------+
| INDUSTRIAL                 |                   |              |         |
+----------------------------+-------------------+--------------+---------+
| South East Industrial      |        6.6        |    (0.9)     |  (0.1)  |
+----------------------------+-------------------+--------------+---------+
| Rest of UK Industrial      |       23.7        |    (2.4)     |  (0.7)  |
+----------------------------+-------------------+--------------+---------+
|                            |                   |              |         |
+----------------------------+-------------------+--------------+---------+
| OTHER                      |       12.1        |     5.4      |  0.8    |
+----------------------------+-------------------+--------------+---------+
|                            |                   |              |         |
+----------------------------+-------------------+--------------+---------+
| External Valuation at      |        100        |     0.7      |  123.1  |
| 30/09/09                   |                   |              |         |
+----------------------------+-------------------+--------------+---------+


Investment Manager Commentary


For the second quarter in a row the property investment portfolio has provided a
positive total return. In quarter 3 this was more pronounced at 3.4% than in
quarter 2 with positive capital growth, for the first time since quarter 2 2007.
The property and investment portfolio performance compared to IPD monthly index
is shown below.


+----------------+----------+------------+------------+----------+----------+
|                | Quarter  | YTD        | 12 months  | 3 years  | 5 years  |
|                | 3 2009   |            |            |          |          |
+----------------+----------+------------+------------+----------+----------+
| SLIPIT         | 3.4%     | -2.4%      | -13.8%     | -8.7%    | 0.5%     |
| Property only  |          |            |            |          |          |
+----------------+----------+------------+------------+----------+----------+
| SLIPIT inc     | 2.7%     | -1.3%      | -9.9%      | -5.9%    | 2.1%     |
| cash           |          |            |            |          |          |
+----------------+----------+------------+------------+----------+----------+
| IPD Monthly    | 3.3%     | -6.6%      | -19.2%     | -10.8%   | 0.1%     |
| Index          |          |            |            |          |          |
+----------------+----------+------------+------------+----------+----------+


Over the quarter we made a block listing of 10m shares, of which 2.25m have been
admitted at a premium of 4.7% to the June 30 NAV. This had a positive impact to
the NAV. The SWAP had a negative impact on NAV over the quarter, which almost
wiped out the increase in property values.

Although the property investment market has seen a significant improvement over
the quarter with evidence of a weight of money chasing limited stock, the
occupier market remains difficult, with negative rental growth continuing. In
that context, the fund had a good quarter, with several deals with tenants to
extend the income security, for example the removal of a break clause in 2011 on
an industrial unit in Leeds. We have also completed new leases on office space
in Farringdon London (total of 10,000sqft), and completed an agreement for lease
on a shop in Wood Green London with another in solicitors hands.


Despite the successful lettings the void rate in the portfolio rose as we
accepted a surrender from the guarantor of a logistics units in Skelmersdale
where the tenant was in administration in return for a substantial premium. This
gives the Company flexibility on the marketing and letting of the unit.


Cash holdings are becoming an increasing drag on performance, and we are
actively looking at several interesting new purchases that will enhance returns,
as well as a number of other asset management initiatives that will improve
future cash flow.


All Enquiries:
The Company Secretary
Northern Trust International Fund Administration Services (Guernsey) Ltd
Trafalgar Court
Les Banques
GY1 3Q1
Tel: 01481 745324
Fax: 01481 745085


APENDIX 1


Historical adjusted IFRS NAVs per Ordinary Share are as follows:


+------------------------+------------------------+------------------------+
| 30/09/09               |   51.28p               |                        |
+------------------------+------------------------+------------------------+
| 30/06/09               |   50.53p               |                        |
+------------------------+------------------------+------------------------+
| 31/03/09               |   52.49p               |                        |
+------------------------+------------------------+------------------------+
| 31/12/08               |   61.65p               |                        |
+------------------------+------------------------+------------------------+
| 30/09/08               |   87.24p               |                        |
+------------------------+------------------------+------------------------+
| 30/06/08               | 101.59p                |                        |
+------------------------+------------------------+------------------------+
| 31/03/08               | 102.71p                |                        |
+------------------------+------------------------+------------------------+
| 31/12/07               | 111.60p                |                        |
+------------------------+------------------------+------------------------+
| 30/09/07               | 130.70p                |                        |
+------------------------+------------------------+------------------------+
| 30/06/07               | 137.16p                |                        |
+------------------------+------------------------+------------------------+
| 31/03/07               | 134.42p                |                        |
+------------------------+------------------------+------------------------+
| 31/12/06               | 132.68p                |                        |
+------------------------+------------------------+------------------------+
| 30/09/06               | 129.51p                |                        |
+------------------------+------------------------+------------------------+
| 30/06/06               | 130.20p                |                        |
+------------------------+------------------------+------------------------+
| 31/03/06               | 124.28p                |                        |
+------------------------+------------------------+------------------------+
| 31/12/05               | 116.46p                |                        |
+------------------------+------------------------+------------------------+
| 30/09/05               | 107.12p                |                        |
+------------------------+------------------------+------------------------+
| 30/06/05               | 103.88p                |                        |
+------------------------+------------------------+------------------------+
| 31/03/05               | 101.34p                |                        |
+------------------------+------------------------+------------------------+
| 31/12/04               | 99.00p                 |                        |
+------------------------+------------------------+------------------------+


This information is provided by RNS
            The company news service from the London Stock Exchange
   END

 NAVPUGGWUUPBGAP
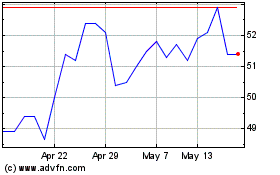
Abrdn Property Income (LSE:API)
Historical Stock Chart
From Jun 2024 to Jul 2024

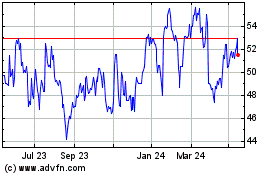
Abrdn Property Income (LSE:API)
Historical Stock Chart
From Jul 2023 to Jul 2024
