false
0001561032
0001561032
2023-12-07
2023-12-07
0001561032
HTIA:Sec7.375SeriesCumulativeRedeemablePerpetualPreferredStock0.01ParValuePerShareMember
2023-12-07
2023-12-07
0001561032
HTIA:Sec7.125SeriesBCumulativeRedeemablePerpetualPreferredStock0.01ParValuePerShareMember
2023-12-07
2023-12-07
iso4217:USD
xbrli:shares
iso4217:USD
xbrli:shares
UNITED STATES
SECURITIES AND EXCHANGE COMMISSION
WASHINGTON, D.C. 20549
FORM 8-K
CURRENT REPORT
PURSUANT TO SECTION 13 OR 15(d) OF THE
SECURITIES EXCHANGE ACT OF 1934
Date of Report (Date of earliest event reported):
December 7, 2023
Healthcare Trust, Inc.
(Exact Name of Registrant as Specified in Charter)
| Maryland |
|
001-39153 |
|
38-3888962 |
|
(State or other jurisdiction
of incorporation) |
|
(Commission File Number) |
|
(I.R.S. Employer
Identification No.) |
|
222 Bellevue Ave.
Newport, RI 02840 |
|
(Address, including zip code, of Principal
Executive Offices)
Registrant’s telephone number,
including area code: (212) 415-6500 |
Check the appropriate box below if the Form 8-K filing is intended
to simultaneously satisfy the filing obligation of the registrant under any of the following provisions:
¨ Written
communications pursuant to Rule 425 under the Securities Act (17 CFR 230.425)
¨ Soliciting
material pursuant to Rule 14a-12 under the Exchange Act (17 CFR 240.14a-12)
¨ Pre-commencement
communications pursuant to Rule 14d-2(b) under the Exchange Act (17 CFR 240.14d-2(b))
¨ Pre-commencement
communications pursuant to Rule 13e-4(c) under the Exchange Act (17 CFR 240.13e-4(c))
Securities registered pursuant to Section 12(b) of the Act:
| Title of each class: |
|
Trading
Symbol(s) |
|
Name of each exchange on
which registered: |
| 7.375% Series A Cumulative Redeemable Perpetual Preferred Stock, $0.01 par value per share |
|
HTIA |
|
The Nasdaq Global Market |
| 7.125% Series B Cumulative Redeemable Perpetual Preferred Stock, $0.01 par value per share |
|
HTIBP |
|
The Nasdaq Global Market |
Indicate by check mark whether the registrant is an emerging growth
company as defined in Rule 405 of the Securities Act of 1933 (§230.405
of this chapter) or Rule 12b-2 of the Securities Exchange Act of 1934 (§240.12b-2 of this
chapter).
| Emerging growth company ¨ |
If an emerging
growth company, indicate by check mark if the registrant has elected not to use the extended transition period for complying with any
new or revised financial accounting standards provided pursuant to Section 13(a) of the Exchange Act. ¨
Item 7.01 Regulation FD Disclosure.
Investor Presentation
and Transcript
Healthcare Trust, Inc.
(the “Company”) prepared an investor presentation containing certain portfolio information and financial highlights. Representatives
of the Company intend to present some of or all of this presentation to current investors and their financial advisors at various conferences
and meetings, including webinars. A copy of the investor presentation is furnished as Exhibit 99.1 to this Current Report on Form 8-K.
On December 7, 2023,
the Company hosted a conference call to discuss its financial and operating results for the quarter ended September 30, 2023. A transcript
of the pre-recorded portion of the webcast is furnished as Exhibit 99.2 to this Current Report on Form 8-K. A copy of the presentation
and replay of this webcast will be available on the Company’s website at www.healthcaretrustinc.com in the news section.
Neither the investor
presentation nor transcript shall be deemed “filed” for any purpose, including for the purposes of Section 18 of the Securities
Exchange Act of 1934, as amended (the “Exchange Act”), or otherwise subject to the liabilities of that Section. The information
in this Item 7.01, as well as Exhibit 99.1 and Exhibit 99.2, shall not be deemed incorporated by reference into any filing under the Securities
Act of 1933, as amended, or the Exchange Act regardless of any general incorporation language in such filing.
Forward-Looking Statements
The statements in this Current Report on Form
8-K that are not historical facts may be forward-looking statements. These forward-looking statements involve risks and uncertainties
that could cause actual results or events to be materially different. The words “anticipates,” “believes,” “expects,”
“estimates,” “projects,” “plans,” “intends,” “may,” “will,” “would”
and similar expressions are intended to identify forward-looking statements, although not all forward-looking statements contain these
identifying words. These forward-looking statements are subject to a number of risks, uncertainties and other factors, many of which are
outside of the Company’s control, which could cause actual results to differ materially from the results contemplated by the forward-looking
statements. These risks and uncertainties include the potential adverse effects of (i) the global COVID-19 pandemic, including actions
taken to contain or treat COVID-19, (ii) the geopolitical instability due to the ongoing military conflict between Russia and Ukraine
and Israel and Hamas, including related sanctions and other penalties imposed by the U.S. and European Union, and the related impact on
the Company, the Company’s tenants, the Company’s operators and the global economy and financial markets, and (iii) inflationary
conditions and higher interest rate environments, as well as those risks and uncertainties set forth in the Risk Factors section of the
Company’s Annual Report on Form 10-K for the year ended December 31, 2022 filed on March 17, 2023, and all other filings with the
Securities and Exchange Commission after that date, as such risks, uncertainties and other important factors may be updated from time
to time in the Company’s subsequent reports. Further, forward-looking statements speak only as of the date they are made, and the
Company undertakes no obligation to update or revise any forward-looking statement to reflect changed assumptions, the occurrence of unanticipated
events or changes to future operating results over time, unless required to do so by law.
Item 9.01. Financial Statements and Exhibits.
(d) Exhibits
SIGNATURES
Pursuant to the requirements
of the Securities Exchange Act of 1934, the registrant has duly caused this report to be signed on its behalf by the undersigned hereunto
duly authorized.
| |
HEALTHCARE TRUST, INC. |
| |
|
|
| Date: December 7, 2023 |
By: |
/s/ Scott M. Lappetito |
| |
Scott M. Lappetito
Chief Financial Officer, Secretary and Treasurer |
Exhibit 99.1

Healthcare Trust, Inc.
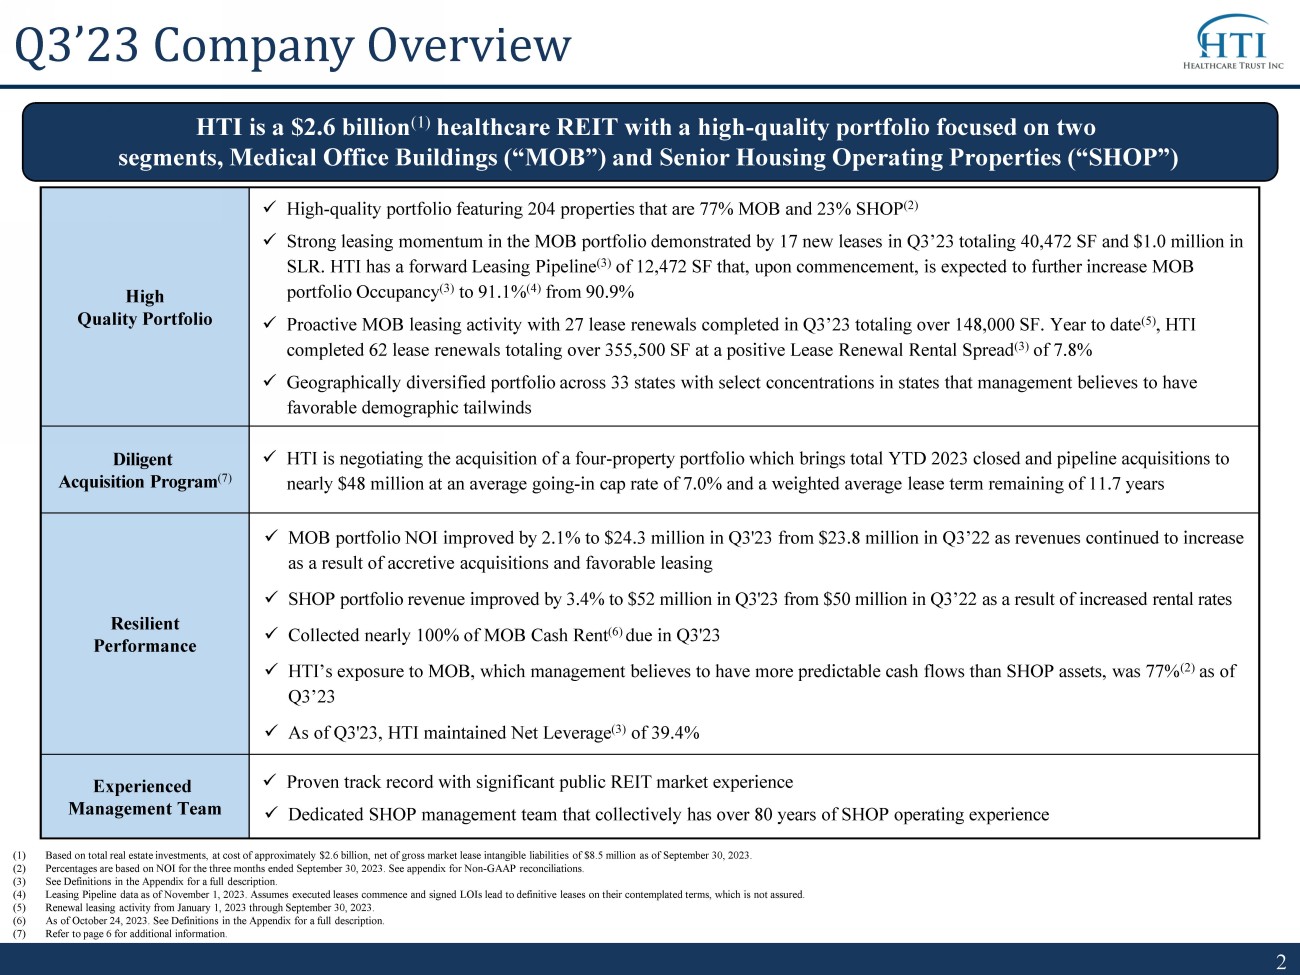
Q3’23 Company Overview (1) Based on total real estate investments, at cost of approximately $2.6 billion, net of gross market lease intangible liabiliti es of $8.5 million as of September 30, 2023. (2) Percentages are based on NOI for the three months ended September 30, 2023. See appendix for Non - GAAP reconciliations. (3) See Definitions in the Appendix for a full description. (4) Leasing Pipeline data as of November 1, 2023. Assumes executed leases commence and signed LOIs lead to definitive leases on t hei r contemplated terms, which is not assured. (5) Renewal leasing activity from January 1, 2023 through September 30, 2023. (6) As of October 24, 2023. See Definitions in the Appendix for a full description. (7) Refer to page 6 for additional information. HTI is a $2.6 billion (1) healthcare REIT with a high - quality portfolio focused on two segments, Medical Office Buildings (“MOB”) and Senior Housing Operating Properties (“SHOP”) High Quality Portfolio x High - quality portfolio featuring 204 properties that are 77% MOB and 23% SHOP (2) x Strong leasing momentum in the MOB portfolio demonstrated by 17 new leases in Q3’23 totaling 40,472 SF and $1.0 million in SLR. HTI has a forward Leasing Pipeline (3) of 12,472 SF that, upon commencement, is expected to further increase MOB portfolio Occupancy (3) to 91.1% (4) from 90.9% x Proactive MOB leasing activity with 27 lease renewals completed in Q3’23 totaling over 148,000 SF. Year to date (5) , HTI completed 62 lease renewals totaling over 355,500 SF at a positive Lease Renewal Rental Spread (3) of 7.8% x Geographically diversified portfolio across 33 states with select concentrations in states that management believes to have favorable demographic tailwinds Diligent Acquisition Program (7) x HTI is negotiating the acquisition of a four - property portfolio which brings total YTD 2023 closed and pipeline acquisitions to nearly $48 million at an average going - in cap rate of 7.0% and a weighted average lease term remaining of 11.7 years Resilient Performance x MOB portfolio NOI improved by 2.1% to $24.3 million in Q3'23 from $23.8 million in Q3’22 as revenues continued to increase as a result of accretive acquisitions and favorable leasing x SHOP portfolio revenue improved by 3.4% to $52 million in Q3'23 from $50 million in Q3’22 as a result of increased rental rat es x Collected nearly 100% of MOB Cash Rent (6) due in Q3'23 x HTI’s exposure to MOB, which management believes to have more predictable cash flows than SHOP assets, was 77% (2) as of Q3’23 x As of Q3'23, HTI maintained Net Leverage (3) of 39.4% Experienced Management Team x Proven track record with significant public REIT market experience x Dedicated SHOP management team that collectively has over 80 years of SHOP operating experience
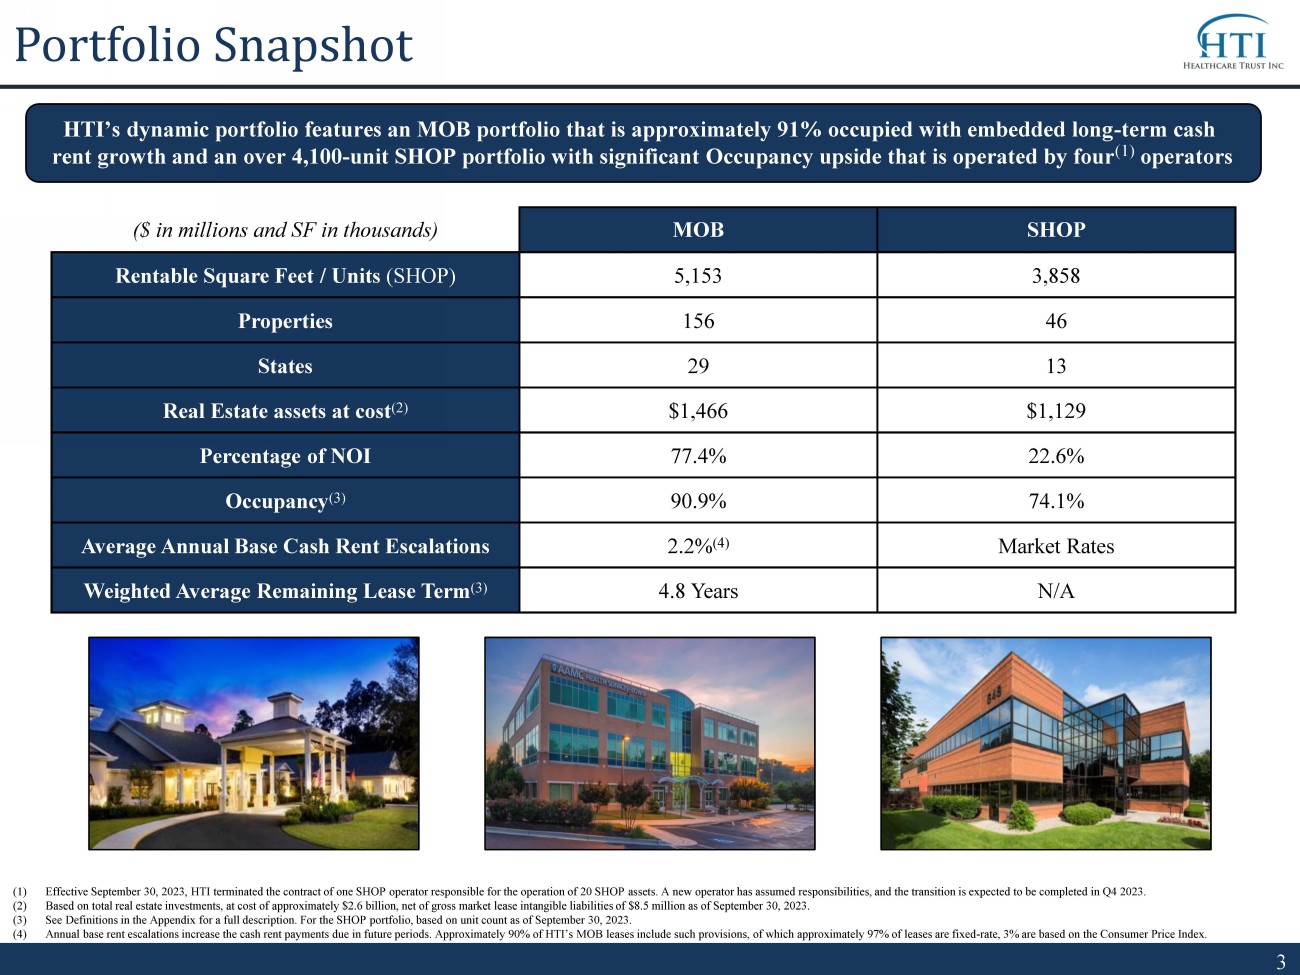
(1) Effective September 30, 2023, HTI terminated the contract of one SHOP operator responsible for the operation of 20 SHOP asset s. A new operator has assumed responsibilities, and the transition is expected to be completed in Q4 2023. (2) Based on total real estate investments, at cost of approximately $2.6 billion, net of gross market lease intangible liabiliti es of $8.5 million as of September 30, 2023. (3) See Definitions in the Appendix for a full description. For the SHOP portfolio, based on unit count as of September 30, 2023. (4) Annual base rent escalations increase the cash rent payments due in future periods. Approximately 90% of HTI’s MOB leases inc lud e such provisions, of which approximately 97% of leases are fixed - rate, 3% are based on the Consumer Price Index. Portfolio Snapshot HTI’s dynamic portfolio features an MOB portfolio that is approximately 91% occupied with embedded long - term cash rent growth and an over 4,100 - unit SHOP portfolio with significant Occupancy upside that is operated by four (1) operators ($ in millions and SF in thousands) MOB SHOP Rentable Square Feet / Units (SHOP) 5,153 3,858 Properties 156 46 States 29 13 Real Estate assets at cost (2) $1,466 $1,129 Percentage of NOI 77.4% 22.6% Occupancy (3) 90.9% 74.1% Average Annual Base Cash Rent Escalations 2.2% (4) Market Rates Weighted Average Remaining Lease Term (3) 4.8 Years N/A
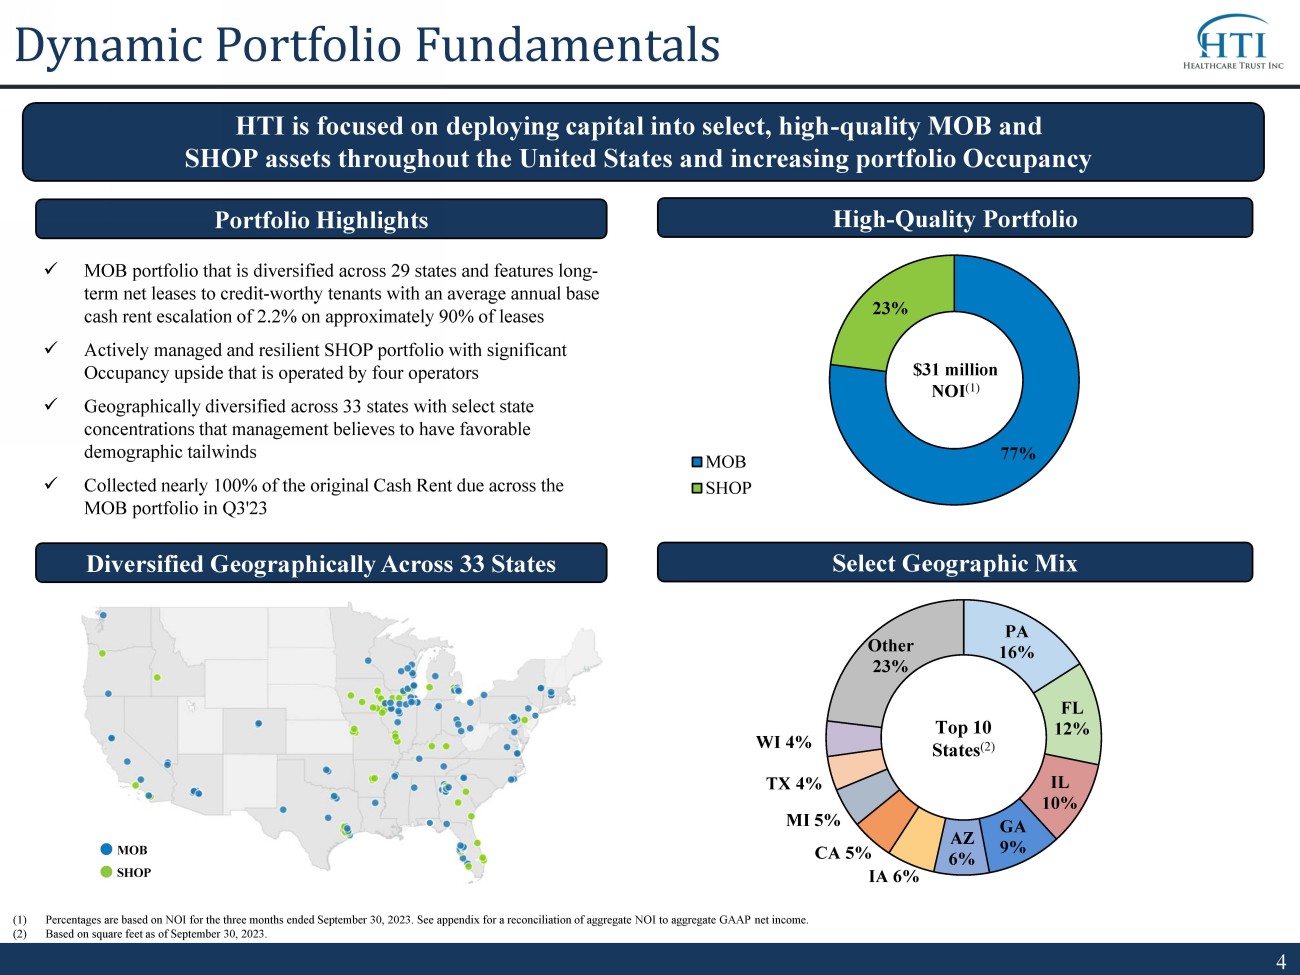
77% 23% MOB SHOP PA 16% FL 12% IL 10% GA 9% AZ 6% IA 6% CA 5% MI 5% TX 4% WI 4% Other 23% Dynamic Portfolio Fundamentals HTI is focused on deploying capital into select, high - quality MOB and SHOP assets throughout the United States and increasing portfolio Occupancy Select Geographic Mix (1) Percentages are based on NOI for the three months ended September 30, 2023. See appendix for a reconciliation of aggregate NO I t o aggregate GAAP net income. (2) Based on square feet as of September 30 , 2023. $ 31 million NOI (1) Diversified Geographically Across 33 States High - Quality Portfolio Top 10 States (2) x MOB portfolio that is diversified across 29 states and features long - term net leases to credit - worthy tenants with an average annual base cash rent escalation of 2.2% on approximately 90% of leases x Actively managed and resilient SHOP portfolio with significant Occupancy upside that is operated by four operators x Geographically diversified across 33 states with select state concentrations that management believes to have favorable demographic tailwinds x Collected nearly 100% of the original Cash Rent due across the MOB portfolio in Q3'23 Portfolio Highlights MOB SHOP
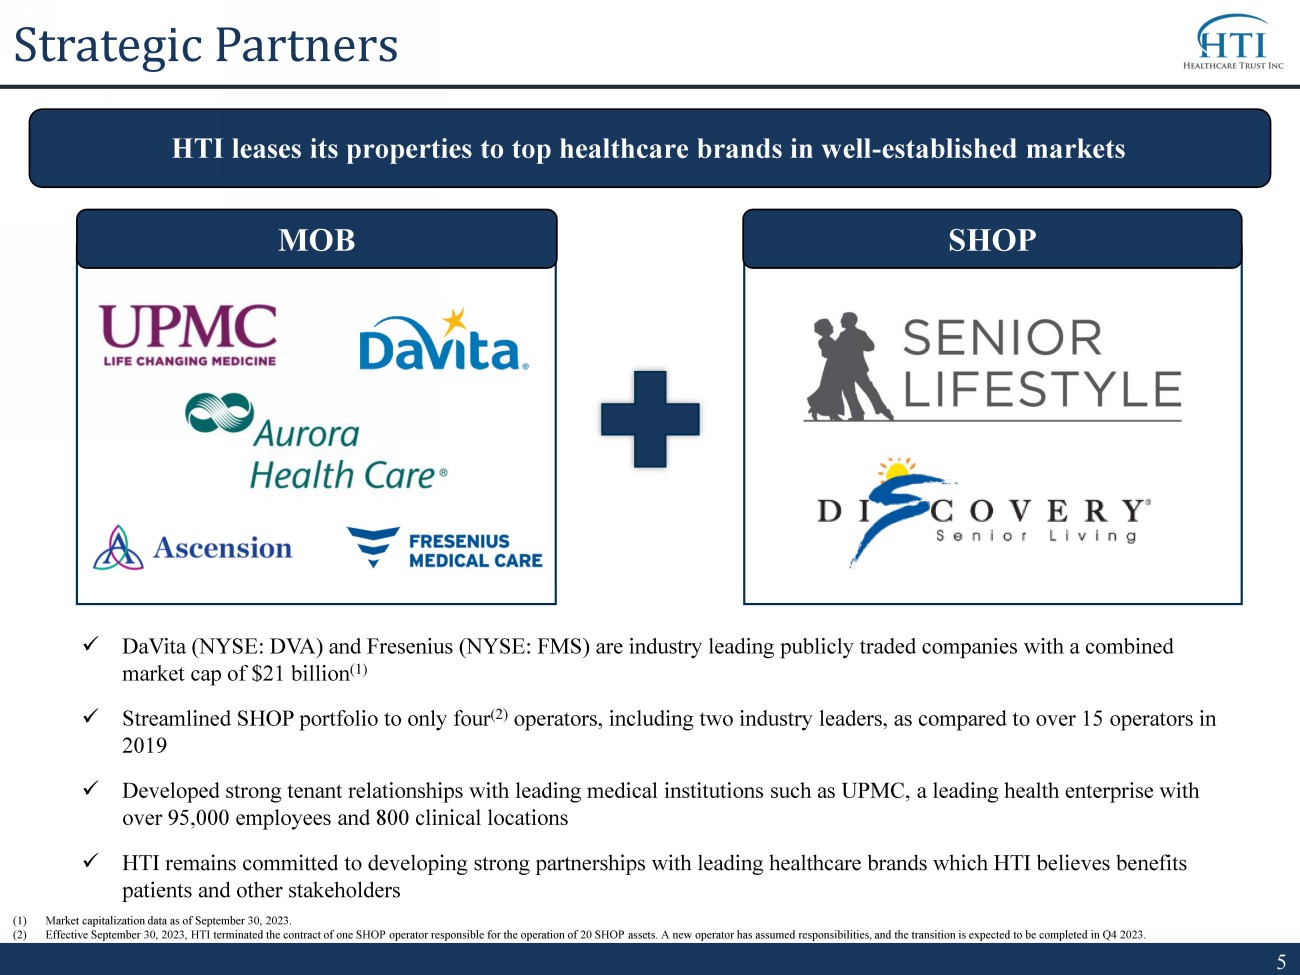
x DaVita (NYSE: DVA) and Fresenius (NYSE: FMS) are industry leading publicly traded companies with a combined market cap of $21 billion (1) x Streamlined SHOP portfolio to only four (2) operators, including two industry leaders, as compared to over 15 operators in 2019 x Developed strong tenant relationships with leading medical institutions such as UPMC, a leading health enterprise with over 95,000 employees and 800 clinical locations x HTI remains committed to developing strong partnerships with leading healthcare brands which HTI believes benefits patients and other stakeholders Strategic Partners HTI leases its properties to top healthcare brands in well - established markets MOB SHOP (1) Market capitalization data as of September 30, 2023. (2) Effective September 30, 2023, HTI terminated the contract of one SHOP operator responsible for the operation of 20 SHOP asset s. A new operator has assumed responsibilities, and the transition is expected to be completed in Q4 2023.
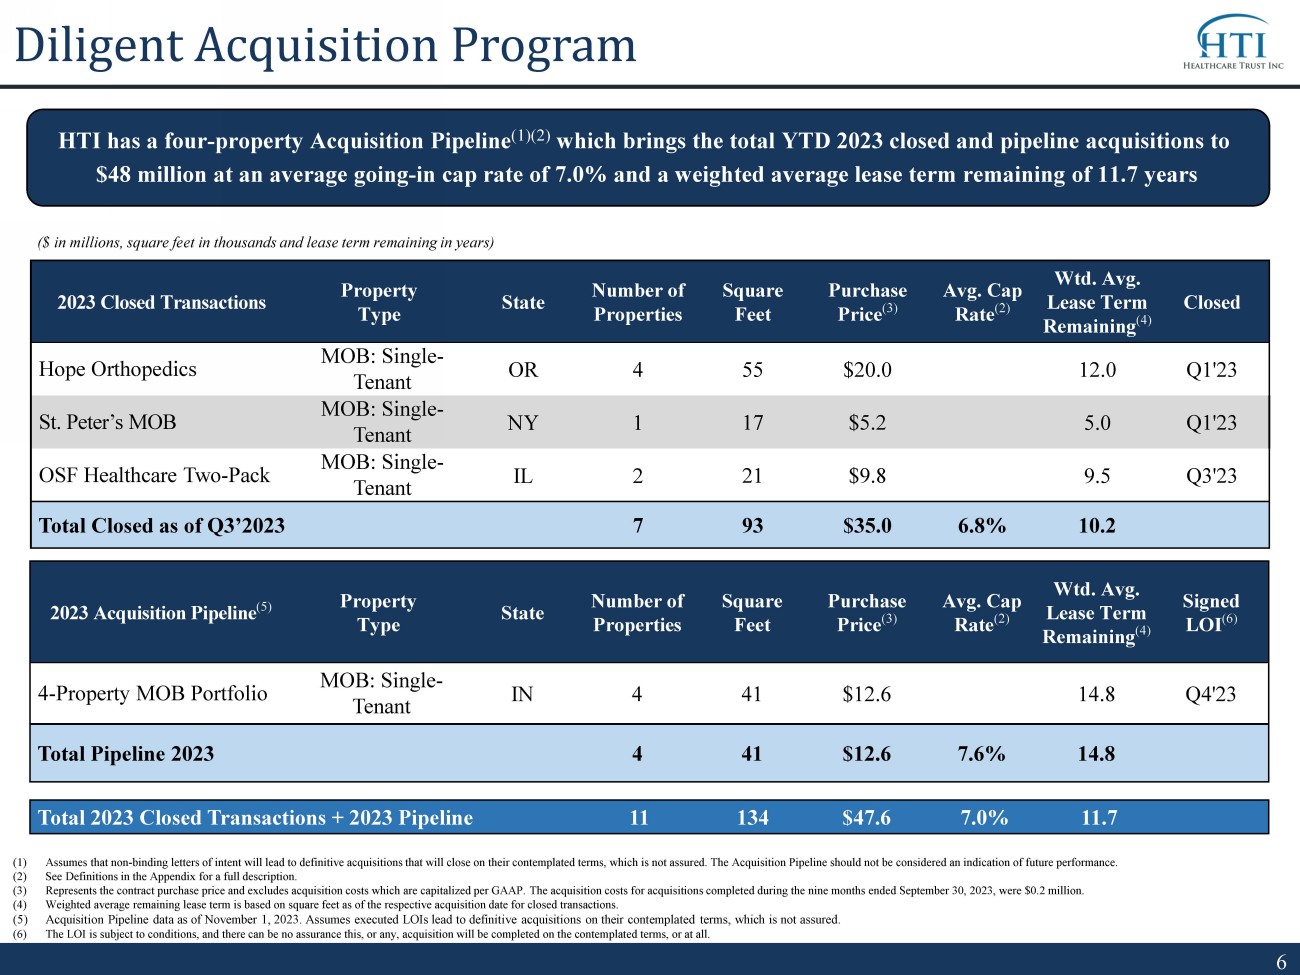
HTI has a four - property Acquisition Pi peline (1)(2) which brings the total YTD 2023 closed and pipeline a cquisitions to $48 million at an average going - in cap rate of 7.0% and a weighted average lease term remaining of 11.7 years (1) Assumes that non - binding letters of intent will lead to definitive acquisitions that will close on their contemplated terms, whi ch is not assured. The Acquisition Pipeline should not be considered an indication of future performance. (2) See Definitions in the Appendix for a full description. (3) Represents the contract purchase price and excludes acquisition costs which are capitalized per GAAP. The acquisition costs f or acquisitions completed during the nine months ended September 30 , 2023, were $0.2 million. (4) Weighted average remaining lease term is based on square feet as of the respective acquisition date for closed transactions. (5) Acquisition Pipeline data as of November 1, 2023. Assumes executed LOIs lead to definitive acquisitions on their contemplated te rms, which is not assured. (6) The LOI is subject to conditions, and there can be no assurance this, or any, acquisition will be completed on the contemplat ed terms, or at all. ($ in millions, square feet in thousands and lease term remaining in years) Diligent Acquisition Program 2023 Closed Transactions Property Type State Number of Properties Square Feet Purchase Price (3) Avg. Cap Rate (2) Wtd. Avg. Lease Term Remaining (4) Closed Hope Orthopedics MOB: Single - Tenant OR 4 55 $20.0 12.0 Q1'23 St. Peter’s MOB MOB: Single - Tenant NY 1 17 $5.2 5.0 Q1'23 OSF Healthcare Two - Pack MOB: Single - Tenant IL 2 21 $9.8 9.5 Q3'23 Total Closed as of Q3’2023 7 93 $35.0 6.8% 10.2 2023 Acquisition Pipeline (5) Property Type State Number of Properties Square Feet Purchase Price (3) Avg. Cap Rate (2) Wtd. Avg. Lease Term Remaining (4) Signed LOI (6) 4 - Property MOB Portfolio MOB: Single - Tenant IN 4 41 $12.6 14.8 Q4'23 Total Pipeline 2023 4 41 $12.6 7.6% 14.8 Total 2023 Closed Transactions + 2023 Pipeline 11 134 $47.6 7.0% 11.7
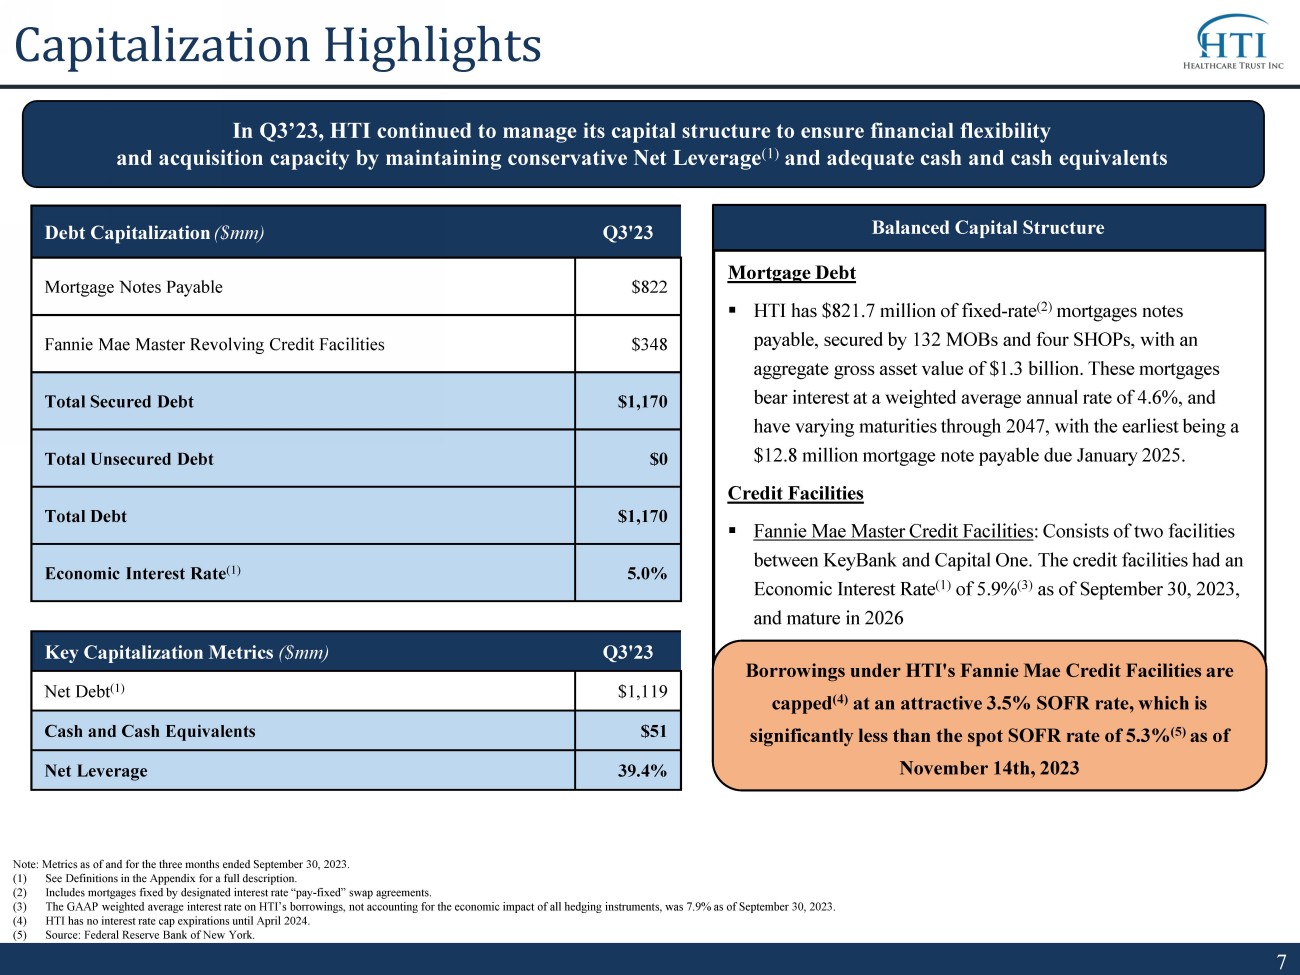
Debt Capitalization ($mm) Q3'23 Mortgage Notes Payable $822 Fannie Mae Master Revolving Credit Facilities $348 Total Secured Debt $1,170 Total Unsecured Debt $0 Total Debt $1,170 Economic Interest Rate (1) 5.0% Key Capitalization Metrics ($mm) Q3'23 Net Debt (1) $1,119 Cash and Cash Equivalents $51 Net Leverage 39.4% Balanced Capital Structure In Q3’23, HTI continued to manage its capital structure to ensure financial flexibility and acquisition capacity by maintaining conservative Net Leverage (1) and adequate cash and cash equivalents Note: Metrics as of and for the three months ended September 30, 2023. (1) See Definitions in the Appendix for a full description. (2) Includes mortgages fixed by designated interest rate “pay - fixed” swap agreements. (3) The GAAP weighted average interest rate on HTI’s borrowings, not accounting for the economic impact of all hedging instrument s, was 7.9% as of September 30, 2023. (4) HTI has no interest rate cap expirations until April 2024. (5) Source: Federal Reserve Bank of New York. Capitalization Highlights Mortgage Debt ▪ HTI has $821.7 million of fixed - rate (2) mortgages notes payable, secured by 132 MOBs and four SHOPs, with an aggregate gross asset value of $1.3 billion. These mortgages bear interest at a weighted average annual rate of 4.6%, and have varying maturities through 2047, with the earliest being a $12.8 million mortgage note payable due January 2025. Credit Facilities ▪ Fannie Mae Master Credit Facilities : Consists of two facilities between KeyBank and Capital One. The credit facilities had an Economic Interest Rate (1) of 5.9 % (3) as of September 30, 2023, and mature in 2026 Borrowings under HTI's Fannie Mae Credit Facilities are capped (4) at an attractive 3.5% SOFR rate, which is significantly less than the spot SOFR rate of 5.3% (5) as of November 14th, 2023
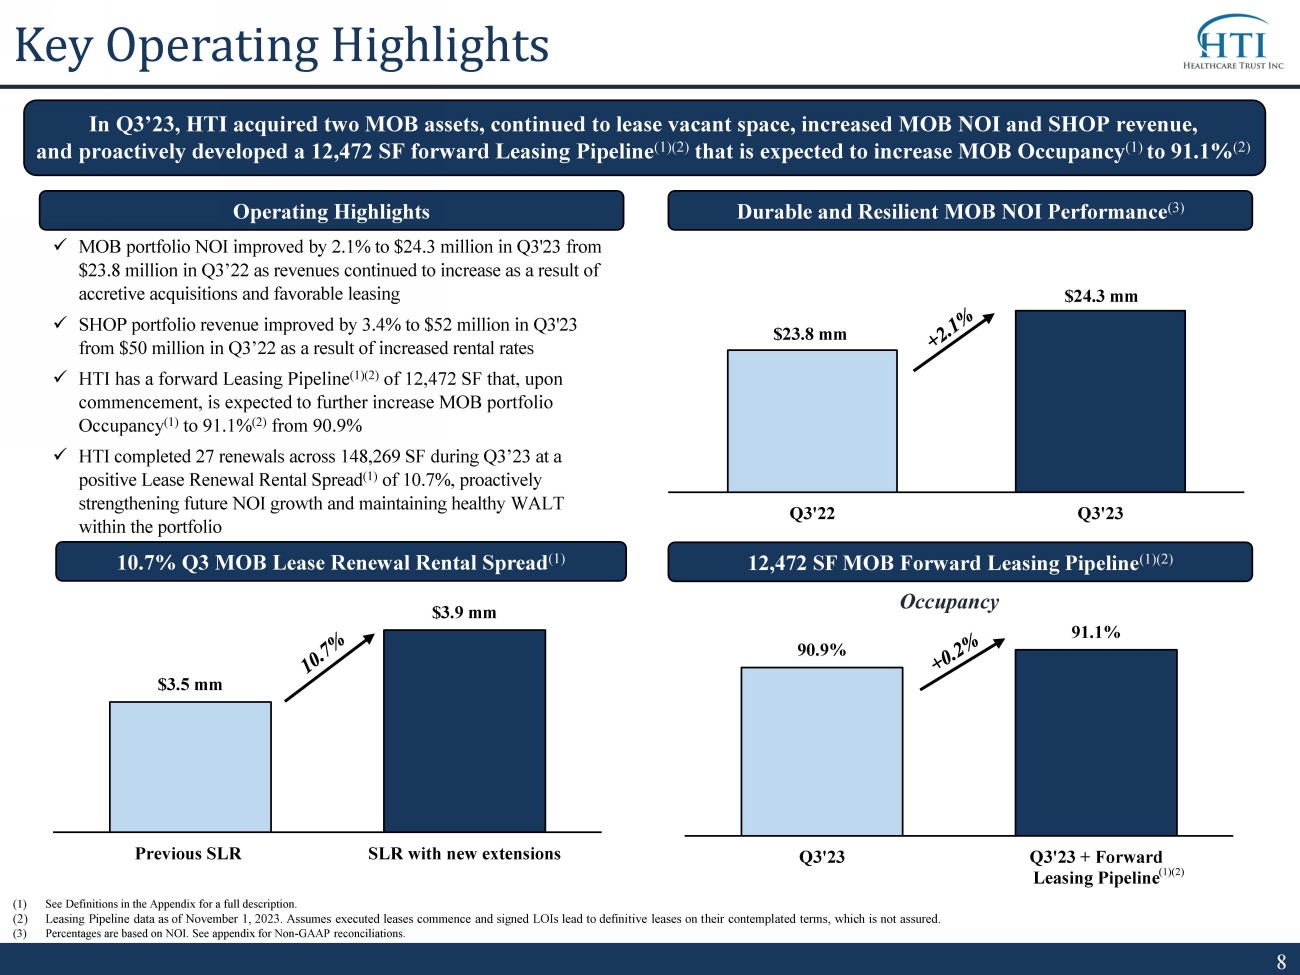
90.9% 91.1% Q3'23 Q3'23 + Forward Leasing Pipeline Key Operating Highlights Durable and Resilient MOB NOI Performance (3) x MOB portfolio NOI improved by 2.1% to $24.3 million in Q3'23 from $23.8 million in Q3’22 as revenues continued to increase as a result of accretive acquisitions and favorable leasing x SHOP portfolio revenue improved by 3.4% to $52 million in Q3'23 from $50 million in Q3’22 as a result of increased rental rates x HTI has a forward Leasing Pipeline (1)(2) of 12,472 SF that, upon commencement, is expected to further increase MOB portfolio Occupancy (1) to 91.1% (2) from 90.9% x HTI completed 27 renewals across 148,269 SF during Q3’23 at a positive Lease Renewal Rental Spread (1) of 10.7%, proactively strengthening future NOI growth and maintaining healthy WALT within the portfolio Operating Highlights $23.8 mm $24.3 mm Q3'22 Q3'23 $3.5 mm $3.9 mm Previous SLR SLR with new extensions 10.7% Q3 MOB Lease Renewal Rental Spread (1) (1) See Definitions in the Appendix for a full description. (2) Leasing Pipeline data as of November 1, 2023. Assumes executed leases commence and signed LOIs lead to definitive leases on t hei r contemplated terms, which is not assured. (3) Percentages are based on NOI. See appendix for Non - GAAP reconciliations. 12,472 SF MOB Forward Leasing Pipeline (1)(2) In Q3’23, HTI acquired two MOB assets, continued to lease vacant space, increased MOB NOI and SHOP revenue, and proactively developed a 12,472 SF forward Leasing Pipeline (1)(2) that is expected to increase MOB Occupancy (1) to 91.1% (2) (1)(2) Occupancy
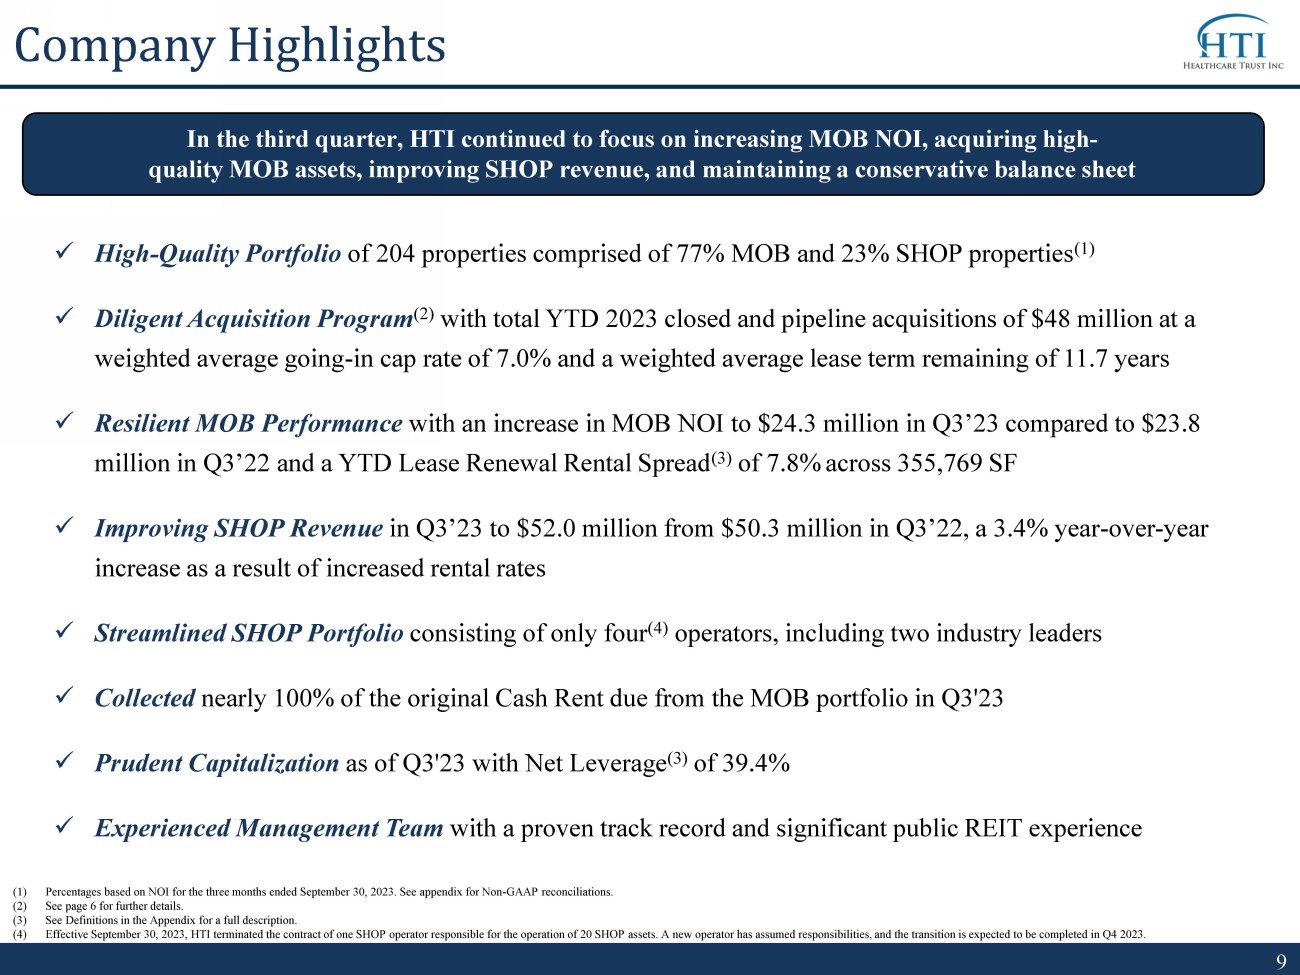
Company Highlights In the third quarter, HTI continued to focus on increasing MOB NOI, acquiring high - quality MOB assets, improving SHOP revenue, and maintaining a conservative balance sheet x High - Quality Portfolio of 204 properties comprised of 77% MOB and 23% SHOP properties (1) x Diligent Acquisition Program (2) with total YTD 2023 closed and pipeline acquisitions of $48 million at a weighted average going - in cap rate of 7.0 % and a weighted average lease term remaining of 11.7 years x Resilient MOB Performance with an increase in MOB NOI to $24.3 million in Q3’23 compared to $23.8 million in Q3’22 and a YTD Lease Renewal Rental Spread (3) of 7.8% across 355,769 SF x Improving SHOP Revenue in Q3’23 to $52.0 million from $50.3 million in Q3’22, a 3.4% year - over - year increase as a result of increased rental rates x Streamlined SHOP Portfolio consisting of only four (4) operators, including two industry leaders x Collected nearly 100% of the original Cash Rent due from the MOB portfolio in Q3'23 x Prudent Capitalization as of Q3'23 with Net Leverage (3) of 39.4% x Experienced Management Team with a proven track record and significant public REIT experience (1) Percentages based on NOI for the three months ended September 30, 2023. See appendix for Non - GAAP reconciliations. (2) See page 6 for further details. (3) See Definitions in the Appendix for a full description. (4) Effective September 30, 2023, HTI terminated the contract of one SHOP operator responsible for the operation of 20 SHOP asset s. A new operator has assumed responsibilities, and the transition is expected to be completed in Q4 2023.

Experienced Leadership Team (1) Scott Lappetito Chief Financial Officer, Secretary, and Treasurer Mr. Lappetito currently serves as the Chief Financial Officer, Treasurer and Secretary for HTI. Mr. Lappetito previously served as chief accounting officer from April 2019 until December 2021, and was the company’s controller from November 2017 through April 2019. Mr. Lappetito is a certified public accountant in the State of New York, holds a B.S. in accounting from The Pennsylvania State University and an M.B.A. from Villanova University. Leslie D. Michelson Non - Executive Chairman, Audit Committee Chair Mr. Michelson has served as the chairman of Private Health Management, a retainer - based primary care medical practice management company from April 2007 until February 2020, and executive chairman and a director since March 2020. Mr. Michelson served as Vice Chairman and Chief Executive Officer of the Prostate Cancer Foundation, the world’s largest private source of prostate cancer research funding, from April 2002 until December 2006 and served on its board of directors from January 2002 until April 2013. David Ruggiero Vice President, Acquisitions Mr. Ruggiero currently serves as Vice President at the Company’s advisor with a primary focus on acquisitions. Mr. Ruggiero has over 30 years of commercial real estate experience and has advised on over $3 billion in healthcare real estate dispositions, acquisitions and financings. He earned an MS in Finance from Kellstadt Graduate School of Business at DePaul University and a BA from DePaul University. Trent Taylor Senior Vice President, Asset Management Mr. Taylor currently serves as Vice President at the Company’s advisor with a primary focus on asset management and leasing. Mr. Taylor has over 16 years of commercial real estate and development experience. He earned an MS in Real Estate from New York University and BA in Accounting & Finance from the University of Central Florida. Michael Anderson Chief Executive Officer Mr. Anderson was appointed Chief Executive Officer in September 2023. Mr. Anderson has served as General Counsel of AR Global Investments, where he advised on both public and private debt and equity transactions, mergers and corporate acquisitions, commercial real estate transactions and operational integration of acquired companies. He earned a J.D. with Summa Cum Laude honors from the University of Mississippi School of Law and a BA from University of Arizona.
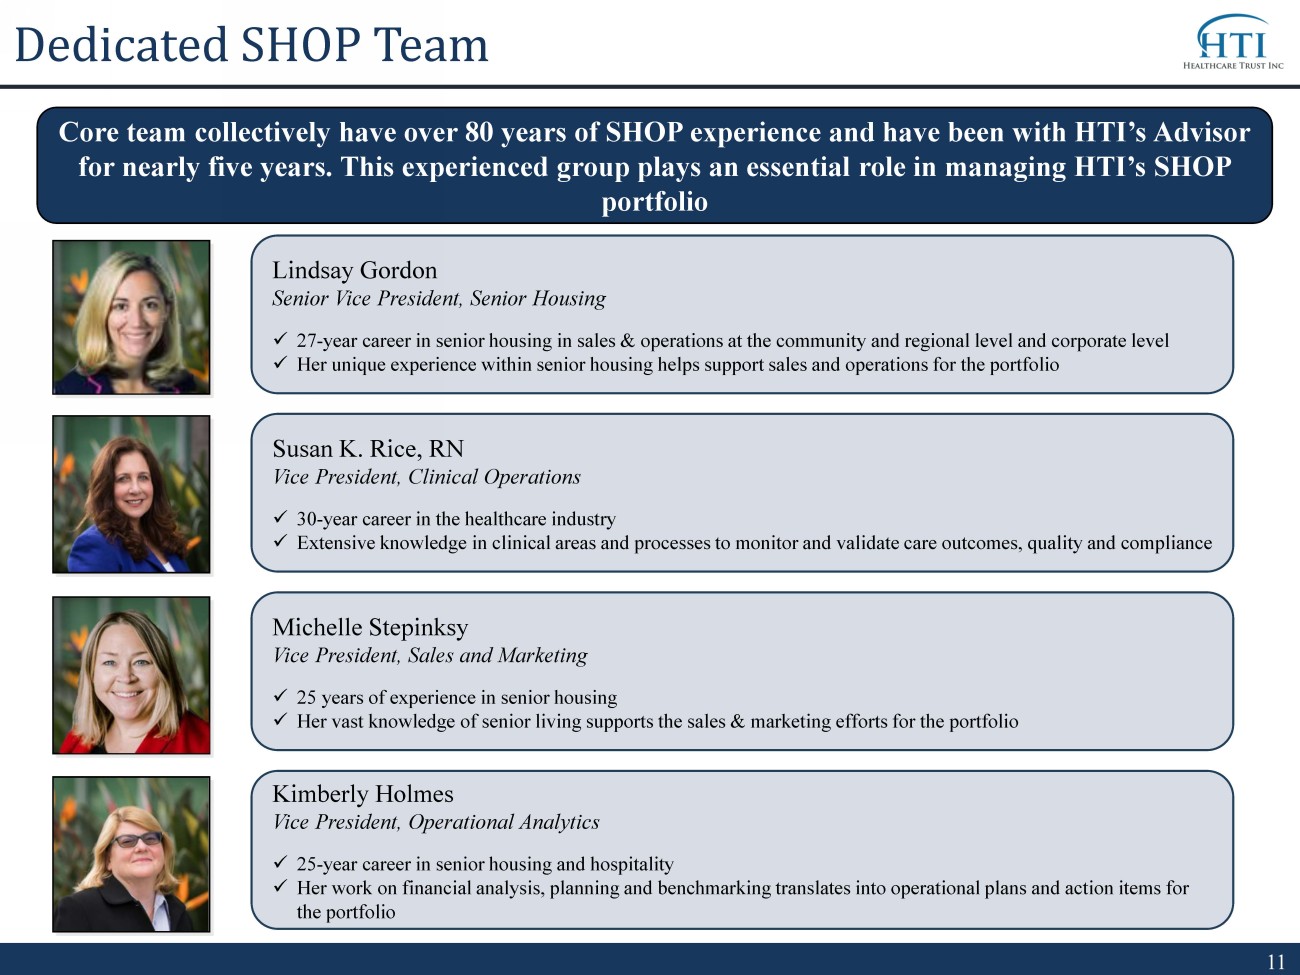
Dedicated SHOP Team Core team collectively have over 80 years of SHOP experience and have been with HTI’s Advisor for nearly five years. This experienced group plays an essential role in managing HTI’s SHOP portfolio Kimberly Holmes Vice President, Operational Analytics x 25 - year career in senior housing and hospitality x Her work on financial analysis, planning and benchmarking translates into operational plans and action items for the portfolio Lindsay Gordon Senior Vice President, Senior Housing x 27 - year career in senior housing in sales & operations at the community and regional level and corporate level x Her unique experience within senior housing helps support sales and operations for the portfolio Susan K. Rice, RN Vice President, Clinical Operations x 30 - year career in the healthcare industry x Extensive knowledge in clinical areas and processes to monitor and validate care outcomes, quality and compliance Michelle Stepinksy Vice President, Sales and Marketing x 25 years of experience in senior housing x Her vast knowledge of senior living supports the sales & marketing efforts for the portfolio

Legal Notice
Disclaimer References in this presentation to the “Company,” “we,” “us” and “our” refer to Healthcare Trust, Inc. (“ HTI”) and its consolidated subsidiaries. The statements in this presentation that are not historical facts may be forward - looking statements. These forward - looking state ments involve risks and uncertainties that could cause actual results or events to be materially different. Forward - looking statements may include, but are not limited to, statements regarding stockholder liquidity and investment value and returns. The words “anticipates,” “believes,” “expects,” “estimates, ” “ projects,” “plans,” “intends,” “may,” “will,” “would” and similar expressions are intended to identify forward - looking statements, although not all forward - loo king statements contain these identifying words. Actual results may differ materially from those contemplated by such forward - looking statements, including th ose set forth in the section titled Risk Factors of HTI’s Annual Report on Form 10 - K for the year ended December 31, 2022 filed on March 17, 2023 and all other filings with the Securities and Exchange Commission (the “SEC”) after that date, as such risks, uncertainties and other important factors may be updated from time to time in HTI’s subsequent reports. Please see slides 14 and 15 for further information. Further, forward - looking statements speak only as of the date they are made, and HTI undertakes no obligation to update or revise any forward - looking statement to reflect changed assumptions, the occurrence of unanticipated events or changes to future operating results, unless required to do so by law. This presentation includes estimated projections of future operating results. These projections were not prepared in accordan ce with published guidelines of the SEC or the guidelines established by the American Institute of Certified Public Accountants for preparation and presentation of financial projections. This information is not fact and should not be relied upon as being necessarily indicative of future results; the projections were pr epared in good faith by management and are based on numerous assumptions that may prove to be wrong. Important factors that may affect actual results an d cause the projections to not be achieved include, but are not limited to, risks and uncertainties relating to the Company and other factors described in the section titled Risk Factors of HTI’s Annual Report on Form 10 - K for the year ended December 31, 2022 filed on March 17, 2023 and all other filings with the SEC after that date. The projections also reflect assumptions as to certain business decisions that are subject to change. As a result, actual results ma y differ materially from those contained in the estimates. Accordingly, there can be no assurance that the estimates will be realized. This presentation includes certain non - GAAP financial measures, including net operating income (“NOI”). NOI is a non - GAAP measur e of our financial performance and should not be considered as an alternative to net income as a measure of financial performance, or any other per formance measure derived in accordance with GAAP and it should not be construed as an inference that our future results will be unaffected by unusual or non - recurring items. The reconciliation of net income to NOI for the applicable periods is set forth on page 18 to this presentation.
Forward - Looking Statements Certain statements made in this presentation are “forward - looking statements” (as defined in Section 21E of the Securities Excha nge Act of 1934, as amended), which reflect the expectations of the Company regarding future events. The forward - looking statements involve a number of risks, uncertainties and other factors that could cause actual results to differ materially from those contained in the forward - looking statements. Such forward - lookin g statements include, but are not limited to, market and other expectations, objectives, and intentions, as well as any other statements that are not historica l f acts. Our potential risks and uncertainties are presented in the section titled “Item 1A - Risk Factors” disclosed in our Annual Report on Form 10 - K for the year ended December 31, 2022 filed with the SEC on March 17, 2023 and all other filings with the SEC after that date. We disclaim any ob lig ation to update and revise statements contained in these materials to reflect changed assumptions, the occurrence of unanticipated events or changes to fut ure operating results over time, unless required by law. The following are some of the risks and uncertainties relating to us, although not all risks and unce rta inties, that could cause our actual results to differ materially from those presented in our forward - looking statements: • Our operating results are affected by economic and regulatory changes that have an adverse impact on the real estate market i n g eneral. • Our property portfolio has a high concentration of properties located in Florida. Our properties may be adversely affected by ec onomic cycles and risks inherent to those states. • Our loan agreement in connection with the Barclay’s MOB Loan requires us to maintain a minimum balance of cash and cash equiv ale nts totaling $12.5 million, which may restrict our ability to use cash that would otherwise be available to us. • A reduction in our NOI can impact our ability to satisfy debt covenants and could adversely affect our business. • We are subject to risks associated with a pandemic, epidemic or outbreak of a contagious disease, such as the global COVID - 19 pa ndemic, including negative impacts on our tenants and operators and their respective businesses. • Inflation and continuing increases in the inflation rate will have an adverse effect on our investments and results of operat ion s. • No public market currently exists, or may ever exist, for shares of our common stock and our shares are, and may continue to be, illiquid. • In owning properties we may experience, among other things, unforeseen costs associated with complying with laws and regulati ons and other costs, potential difficulties selling properties and potential damages or losses resulting from climate change. • We focus on acquiring and owning a diversified portfolio of healthcare - related assets located in the United States and are subje ct to risks inherent in concentrating investments in the healthcare industry. • The healthcare industry is heavily regulated, and we, our tenants, and operators may be impacted by new or existing laws or r egu lations, or changes to these laws or regulations, such as the CARES Act and the auditing and reporting requirements instituted by the CARES Act. • Loss of licensure or failure to obtain licensure could result in the inability of tenants to make lease payments to us. • We depend on tenants for our rental revenue and, accordingly, our rental revenue depends upon the success and economic viabil ity of our tenants. Lease terminations, tenant default and bankruptcy have adversely affected and could in the future adversely affect our income and c ash flow. • We assume additional operating risks and are subject to additional regulation and liability because we depend on eligible ind epe ndent contractors to manage some of our facilities.
Forward - Looking Statements (Continued) • We have substantial indebtedness and may be unable to repay, refinance, restructure or extend our indebtedness as it becomes due . Increases in interest rates could increase the amount of our debt payments. We will likely incur additional indebtedness in the future. • We depend on our Advisor and our Property Manager to provide us with executive officers, key personnel and all services requi red for us to conduct our operations and our operating performance may be impacted by an adverse changes in the financial health or reputation of our Advisor and our Property Manager. • All of our executive officers face conflicts of interest, such as conflicts created by the terms of our agreements with the A dvi sor and compensation payable thereunder, conflicts allocating investment opportunities to us, and conflicts in allocating their time and attention to our mat ters. Conflicts that arise may not be resolved in our favor and could result in actions that are adverse to us. • We have long - term agreements with our Advisor and its affiliates that may be terminated only in limited circumstances and may re quire us to pay a termination fee in some cases. • Estimated Per - Share NAV may not accurately reflect the value of our assets and may not represent what a stockholder may receive on a sale of the shares, what they may receive upon a liquidation of our assets and distribution of the net proceeds or what a third party may pay to acquire us . • The stockholder rights plan adopted by our board of directors, our classified board and other aspects of our corporate struct ure and Maryland law may discourage a third party from acquiring us in a manner that might result in a premium price to our stockholders. • Restrictions on share ownership contained in our charter may inhibit market activity in shares of our stock and restrict our bus iness combination opportunities. • We may fail to continue to qualify as a REIT.

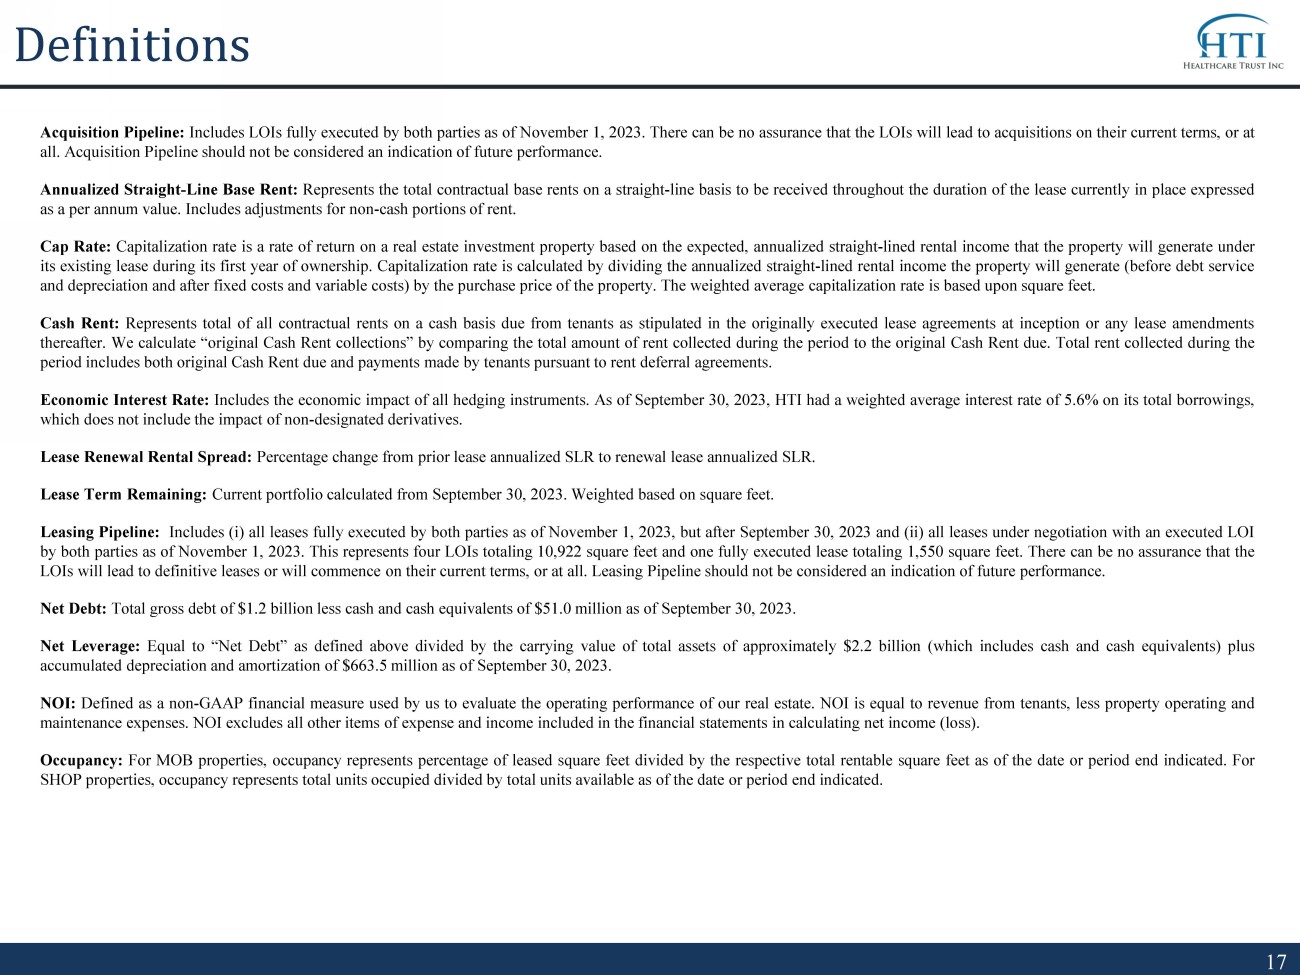
Definitions Acquisition Pipeline : Includes LOIs fully executed by both parties as of November 1 , 2023 . There can be no assurance that the LOIs will lead to acquisitions on their current terms, or at all . Acquisition Pipeline should not be considered an indication of future performance . Annualized Straight - Line Base Rent : Represents the total contractual base rents on a straight - line basis to be received throughout the duration of the lease currently in place expressed as a per annum value . Includes adjustments for non - cash portions of rent . Cap Rate : Capitalization rate is a rate of return on a real estate investment property based on the expected, annualized straight - lined rental income that the property will generate under its existing lease during its first year of ownership . Capitalization rate is calculated by dividing the annualized straight - lined rental income the property will generate (before debt service and depreciation and after fixed costs and variable costs) by the purchase price of the property . The weighted average capitalization rate is based upon square feet . Cash Rent : Represents total of all contractual rents on a cash basis due from tenants as stipulated in the originally executed lease agreements at inception or any lease amendments thereafter . We calculate “original Cash Rent collections” by comparing the total amount of rent collected during the period to the original Cash Rent due . Total rent collected during the period includes both original Cash Rent due and payments made by tenants pursuant to rent deferral agreements . Economic Interest Rate : Includes the economic impact of all hedging instruments . As of September 30 , 2023 , HTI had a weighted average interest rate of 5 . 6 % on its total borrowings, which does not include the impact of non - designated derivatives . Lease Renewal Rental Spread : Percentage change from prior lease annualized SLR to renewal lease annualized SLR . Lease Term Remaining : Current portfolio calculated from September 30 , 2023 . Weighted based on square feet . Leasing Pipeline : Includes (i) all leases fully executed by both parties as of November 1 , 2023 , but after September 30 , 2023 and (ii) all leases under negotiation with an executed LOI by both parties as of November 1 , 2023 . This represents four LOIs totaling 10 , 922 square feet and one fully executed lease totaling 1 , 550 square feet . There can be no assurance that the LOIs will lead to definitive leases or will commence on their current terms, or at all . Leasing Pipeline should not be considered an indication of future performance . Net Debt : Total gross debt of $ 1 . 2 billion less cash and cash equivalents of $ 51 . 0 million as of September 30 , 2023 . Net Leverage : Equal to “Net Debt” as defined above divided by the carrying value of total assets of approximately $ 2 . 2 billion (which includes cash and cash equivalents) plus accumulated depreciation and amortization of $ 663 . 5 million as of September 30 , 2023 . NOI : Defined as a non - GAAP financial measure used by us to evaluate the operating performance of our real estate . NOI is equal to revenue from tenants, less property operating and maintenance expenses . NOI excludes all other items of expense and income included in the financial statements in calculating net income (loss) . Occupancy : For MOB properties, occupancy represents percentage of leased square feet divided by the respective total rentable square feet as of the date or period end indicated . For SHOP properties, occupancy represents total units occupied divided by total units available as of the date or period end indicated .
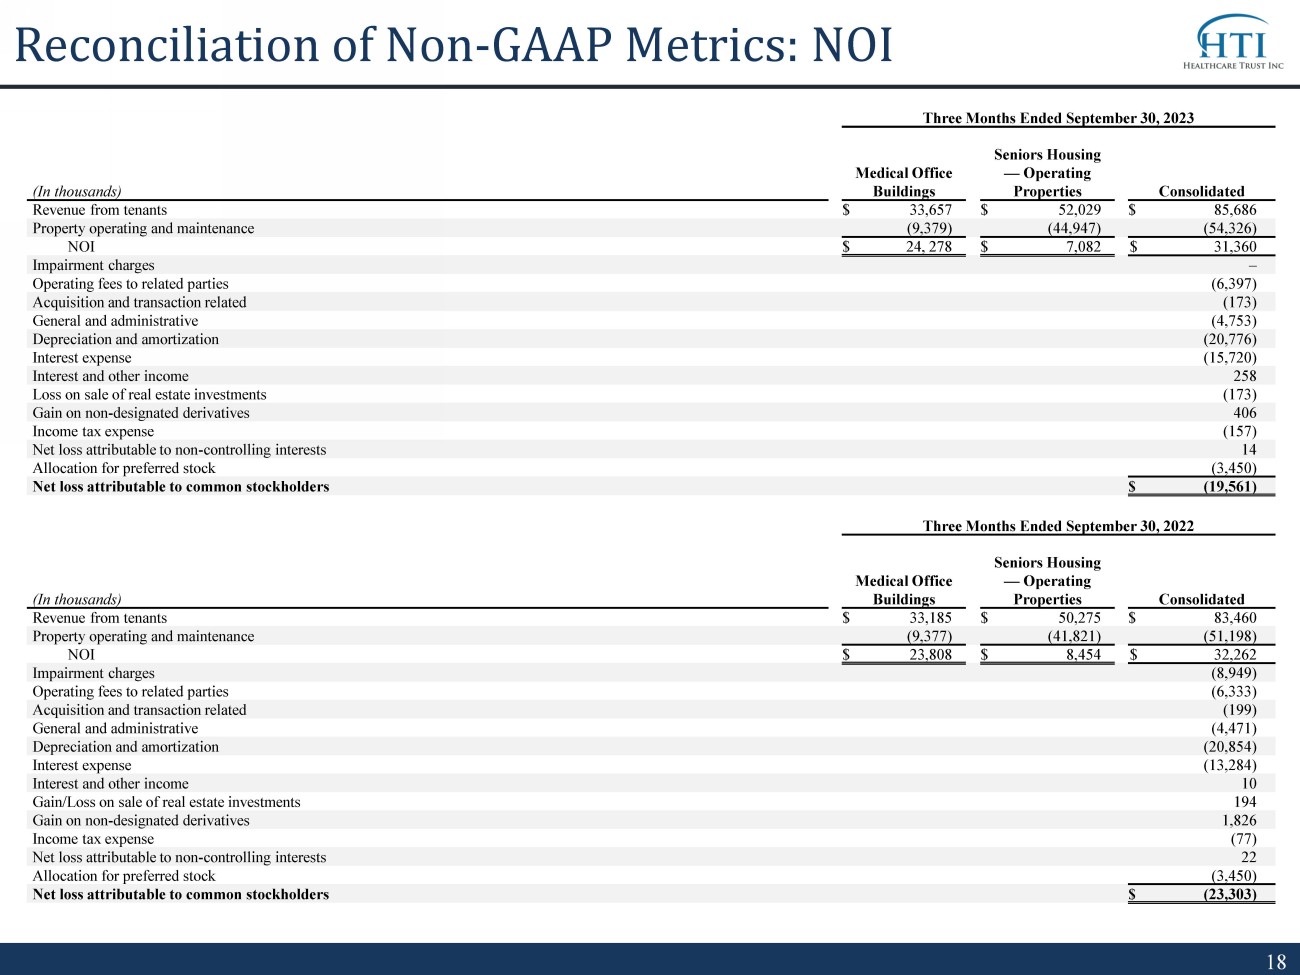
Reconciliation of Non - GAAP Metrics: NOI Three Months Ended September 30, 2023 (In thousands) Medical Office Buildings Seniors Housing — Operating Properties Consolidated Revenue from tenants $ 33,657 $ 52,029 $ 85,686 Property operating and maintenance (9,379) (44,947) (54,326) NOI $ 24, 278 $ 7,082 $ 31,360 Impairment charges – Operating fees to related parties (6,397) Acquisition and transaction related (173) General and administrative (4,753) Depreciation and amortization (20,776) Interest expense (15,720) Interest and other income 258 Loss on sale of real estate investments (173) Gain on non - designated derivatives 406 Income tax expense (157) Net loss attributable to non - controlling interests 14 Allocation for preferred stock (3,450) Net loss attributable to common stockholders $ (19,561) Three Months Ended September 30, 2022 (In thousands) Medical Office Buildings Seniors Housing — Operating Properties Consolidated Revenue from tenants $ 33,185 $ 50,275 $ 83,460 Property operating and maintenance (9,377) (41,821) (51,198) NOI $ 23,808 $ 8,454 $ 32,262 Impairment charges (8,949) Operating fees to related parties (6,333) Acquisition and transaction related (199) General and administrative (4,471) Depreciation and amortization (20,854) Interest expense (13,284) Interest and other income 10 Gain/Loss on sale of real estate investments 194 Gain on non - designated derivatives 1,826 Income tax expense (77) Net loss attributable to non - controlling interests 22 Allocation for preferred stock (3,450) Net loss attributable to common stockholders $ (23,303)

▪ For account information, including balances and the status of submitted paperwork, please call us at (866) 902 - 0063 ▪ Financial Advisors may view client accounts at www.computershare.com/advisorportal ▪ Shareholders may access their accounts at www.computershare.com/hti
Exhibit 99.2
Opening – Curtis Parker
Welcome to the third quarter 2023 Healthcare Trust,
Inc., or HTI, webcast. All participants will be in listen-only mode.
Please note, this event is being recorded. Also
note that certain statements and assumptions in this webcast presentation which are not historical facts will be forward-looking and are
being made pursuant to the safe harbor provisions of the Private Securities Litigation Reform Act of 1995.
These forward-looking statements are subject to
certain assumptions and risk factors which could cause HTI’s actual results to differ materially from the forward-looking statements.
We refer all of you to our SEC filings including the Form 10-K for the year ended December 31, 2022, filed on March 17, 2023, and all
other SEC filings after that date for a more detailed discussion of the risk factors that could cause these differences and impact our
business.
During today's call, we will discuss non-GAAP
financial measures of HTI. These measures should not be considered in isolation or as a substitution for the financial results prepared
in accordance with GAAP. HTI has provided a reconciliation of these measures to the most directly comparable GAAP measure as part
of the third quarter 2023 investor presentation for HTI (available on HTI’s website at www.healthcaretrustinc.com).
You may submit questions during today’s
webcast by typing them in the box on the screen and a member of our investor relations group will follow-up to answer questions directly
after this presentation. Also, please note that later today a copy of this presentation and replay of the webcast will be available on
HTI’s website.
I would now like to turn the call over to Michael
Anderson, our Chief Executive Officer. Please go-ahead Michael.
HTI Webinar Script
Slide 2: Company Overview – (Michael
Anderson)
Thanks Curtis and thank you all for joining us
today. I’m pleased to welcome you all to today’s call, my first as the CEO of Healthcare Trust Inc. As you may recall from
the second quarter earnings call, Mike Weil stepped down as the CEO of HTI to focus full-time on Global Net Lease. We wish him the best
of luck in his new role. Before we get into this quarter’s results, I want to say that the leadership of HTI remains cognizant of
how long most of you have been common shareholders of the Company and state that, while no definitive timing has been announced, a liquidity
event for all common shareholders remains a key objective that everyone associated with the Company is working toward delivering.
Turning to our results, I’m happy to
report that in the third quarter HTI grew occupancy in the seniors housing operating property, or “SHOP”, segment of our
portfolio by 0.8% to 74.1% compared to the prior quarter. Additionally, Net Operating Income, or “NOI” in the MOB
segment of our portfolio grew by 2.1% compared to the same quarter of 2022. Revenue from tenants in the SHOP segment of our
portfolio increased by nearly $2 million, or 3.4%, compared to the third quarter of 2022. NOI for the SHOP segment decreased
compared to the same quarter in 2022, primarily due to payments received in 2022 related to the CARES Act, which were not replicated
this year.
We maintained our strong leasing momentum in the
MOB portfolio with 17 new leases completed during the quarter, totaling over 40,000 square feet and nearly $1 million in straight-line
rent. In addition to new leases, we completed 27 lease renewals in the quarter, bringing us to 62 for the year totaling over 355,500 square
feet and at a positive Lease Renewal Rental Spread of 7.8% compared to the prior leases.
Slide 3: Portfolio Snapshot
As of September 30, 2023, HTI owned over 200 properties,
totaling over 9 million rentable square feet in 33 states. The portfolio consisted of 156 medical office buildings, 46 seniors housing
operating properties with over 4,100 individual units, and two land parcels. Based on NOI, the portfolio was comprised of 77% MOB and
23% SHOP assets.
Additionally, as of September 30, 2023, our medical office building
portfolio was 90.9% occupied, with a weighted-average remaining lease term of 4.8 years and featured annual cash rent escalations that
averaged 2.2% on approximately 90% of leases, which increase the cash rental payments in future periods.
Slide 4: Dynamic Portfolio Fundamentals
We have diligently constructed a portfolio of
MOB and SHOP assets and continue to deploy capital into select high-quality assets throughout the U.S. Our portfolio is well-diversified
geographically across 33 states with only two states representing more than 10% of the total portfolio by square feet. Third quarter NOI
for the portfolio was approximately $31 million, 77% of which was generated by the medical office buildings.
Slide 5: Strategic Partners
We partner with top healthcare brands in well-established
markets to maintain a durable portfolio of healthcare real estate. We believe that the quality of our tenants is essential to our long-term
success and that developing strong relationships with well-respected brands gives our portfolio stability and focus. We believe our partnerships
with tenants such as DaVita, Fresenius and UPMC in the MOB portfolio benefit not only HTI’s shareholders, but patients and other
stakeholders as well.
As we grow our portfolio, we continue to seek
high-quality tenants to add to HTI’s MOB portfolio and to maintain strong relationships with our SHOP operators.
Slide 6: Diligent Acquisition Program
As of November 1, 2023, we have a 4-property
portfolio of medical office buildings in our acquisitions pipeline. Combined with our earlier acquisitions, this brings us to 11
properties acquired or in the pipeline for 2023, totaling $47.6 million of purchase price at a weighted-average cap rate of 7.0% and
with a weighted average remaining lease term of 11.7 years, assuming the properties in our pipeline are acquired on the terms
contemplated in the purchase and sale agreement, which is not assured. We believe we are well-positioned to continue diligently
seeking accretive acquisitions at opportunistic cap rates.
Scott, will you please take us through the financials?
Slide 7: Capitalization Highlights –
(Scott Lappetito)
Thank you, Michael.
We continued to manage our capital structure during
the third quarter. As of September 30, 2023, our Net Leverage was 39.4%. All our debt is fixed-rate, inclusive of our hedging instruments,
at a weighted-average economic interest rate of 5.0%. Our nearest interest rate cap maturity is April 2024, representing approximately
17% of our aggregate notional capped amount.
Slide 8: Key Operating Highlights
HTI continues to execute on our operational initiatives
by increasing NOI in the MOB portfolio and revenue in the SHOP segment of our portfolio.
As Michael mentioned earlier, MOB NOI grew 2.1%
in the third quarter compared to the same quarter last year, to $24.3 million, as revenue continued to increase on the strength of accretive
acquisitions and favorable leasing activity. SHOP revenue also increased by 2.4% when compared to the third quarter of 2022, up from $50
million to $52 million.
We continue to successfully lease available space
in our medical office building portfolio. We have a forward leasing pipeline of over 68,000 square feet, assuming all of the leases commence
on their current terms. During the third quarter we also completed 27 lease renewals across almost 150,000 square feet at a positive Lease
Renewal Rental Spread of 10.7%, growing future revenue and maintaining the weighted-average remaining lease term across our portfolio.
I would now like to turn the call back to Michael
for some color on the HTI team and some closing remarks.
Slide 9: Company Highlights – (Michael
Anderson)
Thanks Scott.
We continue to position HTI for a liquidity event
and long-term earnings growth by, among other things, capitalizing on leasing available space and acquiring high-quality MOB properties.
Our portfolio continues to demonstrate its resilience, as we captured a positive spread on lease renewals in the MOB portfolio, built
an acquisitions pipeline and grew NOI compared to last year. We have an experienced management team that we believe is well positioned
to maximize the opportunities created by demographic trends which favor long-term investment in healthcare real estate.
Slide 10: Experienced Leadership Team
We believe we have the right team in place to
execute our strategy to drive long-term value.
Trent Taylor is our Senior Vice President of
asset management and ensures that our existing properties are leased, performing as expected, and that our tenants’ needs are
being met by local property managers. David Ruggiero is responsible for MOB acquisitions, applying over 30 years of experience and a
$3 billion acquisitions track record to our strict investment guidelines and underwriting standards.
Slide 11: Dedicated SHOP Team
Our dedicated SHOP team has over 80 years of collective
experience in the Seniors Housing space. Susan Rice and Kimberly Holmes have been with HTI for nearly five years, helping steer our SHOP
properties through uncharted waters throughout the COVID-19 pandemic. This year Lindsay Gordon and Michelle Stepinsky both joined the
team, bringing vast knowledge and experience to the operations and sales groups at our properties. We appreciate the new perspectives
Lindsay and Michelle have brought to our portfolio and believe that our team is well-qualified to continue guiding the recovery of our
seniors housing portfolio.
Closing Statements – (Michael Anderson)
We are pleased with the continued strong, dependable
performance of our MOB portfolio and the robust new and renewal leasing activity we recorded in the third quarter. We are encouraged by
the year over year increase in SHOP portfolio revenue, reflecting the results of our team’s dedication to improving our SHOP facilities,
operations, accessibility and attractiveness to seniors and their families. Our focus remains on the future and positioning HTI for an
eventual liquidity event.
Thank you for joining us today.
Operator Closes the Call
The conference has now concluded. If you have
submitted questions during today’s webcast, a member of our investor relations group will follow up to answer your questions. Also,
please note that a copy of the presentation and replay of this webcast will be available on the company’s website at www.healthcaretrustinc.com.
Thank you for attending today’s presentation. You may now disconnect.
v3.23.3
Cover
|
Dec. 07, 2023 |
| Document Information [Line Items] |
|
| Document Type |
8-K
|
| Amendment Flag |
false
|
| Document Period End Date |
Dec. 07, 2023
|
| Entity File Number |
001-39153
|
| Entity Registrant Name |
Healthcare Trust, Inc.
|
| Entity Central Index Key |
0001561032
|
| Entity Tax Identification Number |
38-3888962
|
| Entity Incorporation, State or Country Code |
MD
|
| Entity Address, Address Line One |
222 Bellevue Ave.
|
| Entity Address, City or Town |
Newport
|
| Entity Address, State or Province |
RI
|
| Entity Address, Postal Zip Code |
02840
|
| City Area Code |
212
|
| Local Phone Number |
415-6500
|
| Written Communications |
false
|
| Soliciting Material |
false
|
| Pre-commencement Tender Offer |
false
|
| Pre-commencement Issuer Tender Offer |
false
|
| Entity Emerging Growth Company |
false
|
| 7.375% Series A Cumulative Redeemable Perpetual Preferred Stock, $0.01 par value per share [Member] |
|
| Document Information [Line Items] |
|
| Title of 12(b) Security |
7.375% Series A Cumulative Redeemable Perpetual Preferred Stock, $0.01 par value per share
|
| Trading Symbol |
HTIA
|
| Security Exchange Name |
NASDAQ
|
| 7.125% Series B Cumulative Redeemable Perpetual Preferred Stock, $0.01 par value per share [Member] |
|
| Document Information [Line Items] |
|
| Title of 12(b) Security |
7.125% Series B Cumulative Redeemable Perpetual Preferred Stock, $0.01 par value per share
|
| Trading Symbol |
HTIBP
|
| Security Exchange Name |
NASDAQ
|
| X |
- DefinitionBoolean flag that is true when the XBRL content amends previously-filed or accepted submission.
| Name: |
dei_AmendmentFlag |
| Namespace Prefix: |
dei_ |
| Data Type: |
xbrli:booleanItemType |
| Balance Type: |
na |
| Period Type: |
duration |
|
| X |
- DefinitionFor the EDGAR submission types of Form 8-K: the date of the report, the date of the earliest event reported; for the EDGAR submission types of Form N-1A: the filing date; for all other submission types: the end of the reporting or transition period. The format of the date is YYYY-MM-DD.
| Name: |
dei_DocumentPeriodEndDate |
| Namespace Prefix: |
dei_ |
| Data Type: |
xbrli:dateItemType |
| Balance Type: |
na |
| Period Type: |
duration |
|
| X |
- DefinitionThe type of document being provided (such as 10-K, 10-Q, 485BPOS, etc). The document type is limited to the same value as the supporting SEC submission type, or the word 'Other'.
| Name: |
dei_DocumentType |
| Namespace Prefix: |
dei_ |
| Data Type: |
dei:submissionTypeItemType |
| Balance Type: |
na |
| Period Type: |
duration |
|
| X |
- DefinitionAddress Line 1 such as Attn, Building Name, Street Name
| Name: |
dei_EntityAddressAddressLine1 |
| Namespace Prefix: |
dei_ |
| Data Type: |
xbrli:normalizedStringItemType |
| Balance Type: |
na |
| Period Type: |
duration |
|
| X |
- Definition
+ References
+ Details
| Name: |
dei_EntityAddressCityOrTown |
| Namespace Prefix: |
dei_ |
| Data Type: |
xbrli:normalizedStringItemType |
| Balance Type: |
na |
| Period Type: |
duration |
|
| X |
- DefinitionCode for the postal or zip code
| Name: |
dei_EntityAddressPostalZipCode |
| Namespace Prefix: |
dei_ |
| Data Type: |
xbrli:normalizedStringItemType |
| Balance Type: |
na |
| Period Type: |
duration |
|
| X |
- DefinitionName of the state or province.
| Name: |
dei_EntityAddressStateOrProvince |
| Namespace Prefix: |
dei_ |
| Data Type: |
dei:stateOrProvinceItemType |
| Balance Type: |
na |
| Period Type: |
duration |
|
| X |
- DefinitionA unique 10-digit SEC-issued value to identify entities that have filed disclosures with the SEC. It is commonly abbreviated as CIK. Reference 1: http://www.xbrl.org/2003/role/presentationRef
-Publisher SEC
-Name Exchange Act
-Number 240
-Section 12
-Subsection b-2
| Name: |
dei_EntityCentralIndexKey |
| Namespace Prefix: |
dei_ |
| Data Type: |
dei:centralIndexKeyItemType |
| Balance Type: |
na |
| Period Type: |
duration |
|
| X |
- DefinitionIndicate if registrant meets the emerging growth company criteria. Reference 1: http://www.xbrl.org/2003/role/presentationRef
-Publisher SEC
-Name Exchange Act
-Number 240
-Section 12
-Subsection b-2
| Name: |
dei_EntityEmergingGrowthCompany |
| Namespace Prefix: |
dei_ |
| Data Type: |
xbrli:booleanItemType |
| Balance Type: |
na |
| Period Type: |
duration |
|
| X |
- DefinitionCommission file number. The field allows up to 17 characters. The prefix may contain 1-3 digits, the sequence number may contain 1-8 digits, the optional suffix may contain 1-4 characters, and the fields are separated with a hyphen.
| Name: |
dei_EntityFileNumber |
| Namespace Prefix: |
dei_ |
| Data Type: |
dei:fileNumberItemType |
| Balance Type: |
na |
| Period Type: |
duration |
|
| X |
- DefinitionTwo-character EDGAR code representing the state or country of incorporation.
| Name: |
dei_EntityIncorporationStateCountryCode |
| Namespace Prefix: |
dei_ |
| Data Type: |
dei:edgarStateCountryItemType |
| Balance Type: |
na |
| Period Type: |
duration |
|
| X |
- DefinitionThe exact name of the entity filing the report as specified in its charter, which is required by forms filed with the SEC. Reference 1: http://www.xbrl.org/2003/role/presentationRef
-Publisher SEC
-Name Exchange Act
-Number 240
-Section 12
-Subsection b-2
| Name: |
dei_EntityRegistrantName |
| Namespace Prefix: |
dei_ |
| Data Type: |
xbrli:normalizedStringItemType |
| Balance Type: |
na |
| Period Type: |
duration |
|
| X |
- DefinitionThe Tax Identification Number (TIN), also known as an Employer Identification Number (EIN), is a unique 9-digit value assigned by the IRS. Reference 1: http://www.xbrl.org/2003/role/presentationRef
-Publisher SEC
-Name Exchange Act
-Number 240
-Section 12
-Subsection b-2
| Name: |
dei_EntityTaxIdentificationNumber |
| Namespace Prefix: |
dei_ |
| Data Type: |
dei:employerIdItemType |
| Balance Type: |
na |
| Period Type: |
duration |
|
| X |
- DefinitionLocal phone number for entity.
| Name: |
dei_LocalPhoneNumber |
| Namespace Prefix: |
dei_ |
| Data Type: |
xbrli:normalizedStringItemType |
| Balance Type: |
na |
| Period Type: |
duration |
|
| X |
- DefinitionBoolean flag that is true when the Form 8-K filing is intended to satisfy the filing obligation of the registrant as pre-commencement communications pursuant to Rule 13e-4(c) under the Exchange Act. Reference 1: http://www.xbrl.org/2003/role/presentationRef
-Publisher SEC
-Name Exchange Act
-Number 240
-Section 13e
-Subsection 4c
| Name: |
dei_PreCommencementIssuerTenderOffer |
| Namespace Prefix: |
dei_ |
| Data Type: |
xbrli:booleanItemType |
| Balance Type: |
na |
| Period Type: |
duration |
|
| X |
- DefinitionBoolean flag that is true when the Form 8-K filing is intended to satisfy the filing obligation of the registrant as pre-commencement communications pursuant to Rule 14d-2(b) under the Exchange Act. Reference 1: http://www.xbrl.org/2003/role/presentationRef
-Publisher SEC
-Name Exchange Act
-Number 240
-Section 14d
-Subsection 2b
| Name: |
dei_PreCommencementTenderOffer |
| Namespace Prefix: |
dei_ |
| Data Type: |
xbrli:booleanItemType |
| Balance Type: |
na |
| Period Type: |
duration |
|
| X |
- DefinitionTitle of a 12(b) registered security. Reference 1: http://www.xbrl.org/2003/role/presentationRef
-Publisher SEC
-Name Exchange Act
-Number 240
-Section 12
-Subsection b
| Name: |
dei_Security12bTitle |
| Namespace Prefix: |
dei_ |
| Data Type: |
dei:securityTitleItemType |
| Balance Type: |
na |
| Period Type: |
duration |
|
| X |
- DefinitionName of the Exchange on which a security is registered. Reference 1: http://www.xbrl.org/2003/role/presentationRef
-Publisher SEC
-Name Exchange Act
-Number 240
-Section 12
-Subsection d1-1
| Name: |
dei_SecurityExchangeName |
| Namespace Prefix: |
dei_ |
| Data Type: |
dei:edgarExchangeCodeItemType |
| Balance Type: |
na |
| Period Type: |
duration |
|
| X |
- DefinitionBoolean flag that is true when the Form 8-K filing is intended to satisfy the filing obligation of the registrant as soliciting material pursuant to Rule 14a-12 under the Exchange Act. Reference 1: http://www.xbrl.org/2003/role/presentationRef
-Publisher SEC
-Name Exchange Act
-Section 14a
-Number 240
-Subsection 12
| Name: |
dei_SolicitingMaterial |
| Namespace Prefix: |
dei_ |
| Data Type: |
xbrli:booleanItemType |
| Balance Type: |
na |
| Period Type: |
duration |
|
| X |
- DefinitionTrading symbol of an instrument as listed on an exchange.
| Name: |
dei_TradingSymbol |
| Namespace Prefix: |
dei_ |
| Data Type: |
dei:tradingSymbolItemType |
| Balance Type: |
na |
| Period Type: |
duration |
|
| X |
- DefinitionBoolean flag that is true when the Form 8-K filing is intended to satisfy the filing obligation of the registrant as written communications pursuant to Rule 425 under the Securities Act. Reference 1: http://www.xbrl.org/2003/role/presentationRef
-Publisher SEC
-Name Securities Act
-Number 230
-Section 425
| Name: |
dei_WrittenCommunications |
| Namespace Prefix: |
dei_ |
| Data Type: |
xbrli:booleanItemType |
| Balance Type: |
na |
| Period Type: |
duration |
|
| X |
- Details
| Name: |
us-gaap_StatementClassOfStockAxis=HTIA_Sec7.375SeriesCumulativeRedeemablePerpetualPreferredStock0.01ParValuePerShareMember |
| Namespace Prefix: |
|
| Data Type: |
na |
| Balance Type: |
|
| Period Type: |
|
|
| X |
- Details
| Name: |
us-gaap_StatementClassOfStockAxis=HTIA_Sec7.125SeriesBCumulativeRedeemablePerpetualPreferredStock0.01ParValuePerShareMember |
| Namespace Prefix: |
|
| Data Type: |
na |
| Balance Type: |
|
| Period Type: |
|
|
Healthcare (PK) (USOTC:HLTC)
Historical Stock Chart
From Jul 2024 to Aug 2024
 Charts.")
Healthcare (PK) (USOTC:HLTC)
Historical Stock Chart
From Aug 2023 to Aug 2024
 Charts.")