AMERICAN BUSINESS BANK (Bank) (OTCBB: AMBZ) today reported net
income of $2,914,000 for the third quarter of 2014. Earnings per
share (basic) in the third quarter of 2014 were $0.59 versus $0.63
in the third quarter of 2013. The Bank’s “core” earnings per share
were $0.54 in the third quarter of 2014 versus $0.57 in the third
quarter of 2013.
“These results contribute to a double digit return on equity.
This was attained despite the low interest rate environment and
increased regulatory expenses we are experiencing,” said Robert
Schack, Chairman.
“Earnings in the third quarter reflected reduced income from our
securities portfolio. Despite a 9% increase in the size of the
portfolio, income generated from it was down by 10%. This was due
to a decision made by the Bank as to the allocation of assets
between higher yielding fixed rate securities and lower yielding
variable rate securities. As it is now conformed, the securities
portfolio is designed to have superior performance in a rising
interest rate environment,” said Wes Schaefer, Vice Chairman and
CFO.
Leon Blankstein, President and CEO, added: “We are very pleased
to report that our new business efforts have resulted in excellent
balance sheet growth, including a 12% increase in loan totals. This
growth, as always, emanates from new clients who are well known to
the Bank.”
Total assets increased 9% or $127 million to $1.476 billion at
September 30, 2014 as compared to $1.349 billion at September 30,
2013. The loan portfolio (net) increased 12% or $68 million to $626
million at September 30, 2014 as compared to $558 million at
September 30, 2013. Deposits increased 6% or $69 million to $1.273
billion at September 30, 2014 as compared to $1.203 billion at
September of 2013. Borrowings from the Federal Home Loan Bank
increased from $44 million at the end of the third quarter in 2013
to $78 million at the end of the third quarter in 2014.
During the third quarter of 2014, Net Interest Income increased
$195,000 or 2% to $10,259,000 from $10,064,000 during the third
quarter in 2013.
Non-Interest income during the third quarter of 2014 increased
$120,000 or 14% to $953,000 from $833,000 during the third quarter
of 2013.
Non-Interest expense during the third quarter of 2014 increased
$608,000 or 9.8% to $6,819,000 from $6,211,000 during the third
quarter in 2013. Increases in the “Other Expense” category
mentioned in the Income Statement below were driven by extra cost
incurred in customer related expenses, professional fees, promotion
expenses and regulatory fees.
Asset quality at the end of the third quarter of 2014 remains
excellent, with $42,000 of non-performing loans, or 0.01% of total
loans; and, no OREO. At the end of September 2014, the allowance
for loan losses stood at $12,531,000 or 1.96% of loans. During
the 9 months ended September 30th of 2014, the Bank has a net
recovery of previously charged-off loans totaling $631,000.
AMERICAN BUSINESS BANK, headquartered in downtown Los Angeles,
offers a wide range of financial services to the business
marketplace. Clients include wholesalers, manufacturers, service
businesses, professionals and non-profits. The Bank has opened four
Loan Production Offices in strategic areas including our Orange
County Office in Irvine, our South Bay Office in Torrance, our San
Fernando Valley Office in the Warner Center and our Inland Empire
Office in Ontario.
American Business Bank Figures in $000, except per share
amounts
CONSOLIDATED BALANCE SHEET (unaudited)
As of: September
September Change 2014
2013 %
Assets:
Cash & Equivalents $ 54,338 $ 70,668 -23.1 % Fed Funds Sold
1,000 1,000 0.0 % Interest Bearing Balances 528 28 1785.7 %
Investment
Securities:
US Agencies 481,336 359,695 33.8 % Mortgage Backed Securities
78,674 155,317 -49.3 % State & Municipals 178,616 161,988 10.3
% Other 3,308 3,139 5.4 %
Total Investment Securities 741,934 680,139 9.1 %
Gross
Loans:
Commercial Real Estate 384,317 334,810 14.8 % Commercial &
Industrial 202,232 193,217 4.7 % Other Real Estate 46,872 36,713
27.7 % Other 5,288 4,745
11.4 % Total Gross Loans 638,709 569,485 12.2 % Allowance for Loan
& Lease Losses (12,531 ) (10,924 )
14.7 % Net Loans 626,178 558,561 12.1 % Premises & Equipment
1,073 726 47.8 % Other Assets 50,790
37,689 34.8 %
Total Assets $
1,475,841 $ 1,348,811 9.4
%
Liabilities:
Demand Deposits $ 612,342 $ 573,039 6.9 % Money Market 585,053
549,875 6.4 % Time Deposits and Savings 75,530
80,469 -6.1 % Total Deposits 1,272,925
1,203,383 5.8 % FHLB Advances / Other Borrowings 78,400 44,000 78.2
% Other Liabilities 9,341 6,031
54.9 %
Total Liabilities $
1,360,666 $ 1,253,414 8.6
%
Shareholders'
Equity:
Common Stock & Retained Earnings $ 116,827 $ 103,878 12.5 %
Accumulated Other Comprehensive Income / (Loss)
(1,652 ) (8,481 ) -80.5 %
Total Shareholders'
Equity $ 115,175 $
95,397 20.7 %
Total Liabilities &
Shareholders' Equity $ 1,475,841
$ 1,348,811 9.4 %
Capital
Adequacy:
Tangible Common Equity / Tangible Assets 7.80 % 7.07 % -- Tier 1
Leverage Ratio 8.06 % 7.79 % -- Tier 1 Capital Ratio / Risk
Weighted Assets 15.51 % 15.61 % -- Total Risk-Based Ratio 16.77 %
16.87 % --
Per Share
Information:
Common Shares Outstanding 4,953,774 4,898,911 -- Book Value Per
Share $ 23.25 $ 19.47 19.4 % Tangible Book Value Per Share $ 23.25
$ 19.47 19.4 %
American Business Bank Figures in
$000, except per share amounts
CONSOLIDATED
INCOME STATEMENT (unaudited) For the 3-month
period ended: September September
Change 2014 2013
%
Interest
Income:
Loans & Leases $ 7,057 $ 6,499 8.6 % Investment Securities
3,574 3,984 -10.3 % Total
Interest Income 10,631 10,483 1.4 %
Interest
Expense:
Money Market, NOW Accounts & Savings 283 311 -9.0 % Time
Deposits 68 85 -20.0 % Repurchase Agreements / Other Borrowings
21 23 -8.7 % Total
Interest Expense 372 419 -11.2 % Net Interest Income
10,259 10,064 1.9 % Provision for Loan Losses (198 )
(300 ) -34.0 % Net Interest Income After Provision
for Loan Losses 10,061 9,764 3.0 %
Non-Interest
Income:
Deposit Fees 356 312 14.1 % Realized Securities Gains 372 451 -17.5
% Other 225 70 221.4 %
Total Non-Interest Income 953 833 14.4 %
Non-Interest
Expense:
Compensation & Benefits 3,993 3,860 3.4 % Occupancy &
Equipment 530 491 7.9 % Other 2,296
1,860 23.4 % Total Non-Interest Expense 6,819 6,211
9.8 % Pre-Tax Income 4,195 4,386 -4.4 % Provision for
Income Tax (1,281 ) (1,295 ) -1.1 %
Net Income $ 2,914 $
3,091 -5.7 % Less: After-Tax Realized Securities
Gains $ 258 $ 318
Core Net Income $ 2,656
$ 2,773 -4.2 %
Per Share
Information:
Average Shares Outstanding (for the quarter) 4,953,774 4,895,700 --
Earnings Per Share - Basic $ 0.59 $ 0.63 -6.8 %
Earnings Per Share "CORE" - Basic
$ 0.54 $ 0.57 -5.4 %
American Business Bank Figures
in $000, except per share amounts
September September Change
2014 2013 %
Performance
Ratios
Return on Average Assets (ROAA) 0.82 % 1.09 % -- Return on Average
Equity (ROAE) 10.83 % 13.93 % --
Return on Average Assets "CORE" (ROAA)
0.78 % 0.67 % --
Return on Average Equity "CORE" (ROAE)
10.32 % 8.59 % --
Asset Quality
Overview
Non-Performing Loans $ - $ - NA Loans 90+Days Past Due
42 979 -95.7 % Total
Non-Performing Loans $ 42 $ 979 -95.7 % Restructured Loans
(TDR's) $ 2,512 $ 1,911 31.4 % Other Real Estate Owned 0 0
-- ALLL / Gross Loans 1.96 % 1.92 % -- ALLL / Non-Performing
Loans * 29835.71 % 1115.83 % -- Non-Performing Loans / Total Loans
* 0.01 % 0.17 % -- Non-Performing Assets / Total Assets * 0.00 %
0.07 % -- Net Charge-Offs $ (631 ) $ 1,063 -- Net Charge-Offs /
Average Gross Loans -0.10 % 0.20 % --
* Excludes Restructured Loans
AMERICAN BUSINESS BANKWes E. SchaeferVice Chairman and Chief
Financial Officer213-430-4000
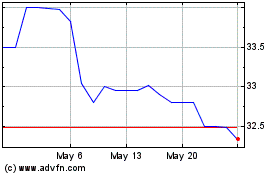
American Business Bank (QX) (USOTC:AMBZ)
Historical Stock Chart
From Dec 2024 to Jan 2025

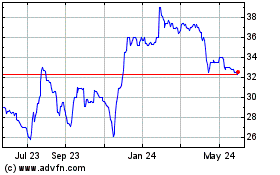
American Business Bank (QX) (USOTC:AMBZ)
Historical Stock Chart
From Jan 2024 to Jan 2025
