Globex Acquires Gold Silver Exploration Target in Nevada, USA
February 28 2024 - 9:00AM

GLOBEX MINING ENTERPRISES INC. (GMX – Toronto Stock
Exchange, G1MN – Frankfurt, Stuttgart, Berlin, Munich,
Tradegate, Lang & Schwarz, LS Exchange, TTMzero,
Düsseldorf and Quotrix Düsseldorf Stock
Exchanges and GLBXF – OTCQX
International in the US) is pleased to report to
shareholders that it has acquired by staking 8 unpatented lode
claims totaling 66.88 hectares (165.28 acres) in Clark County,
southern Nevada, USA.
The property herein called the
Red Star Project was staked to cover two
epithermal quartz vein systems, the over 2 km long Red Star vein
system and the western, 470m long segment, of the Double Standard
vein system. The Double Standard vein zone is located 2.5 km south
of the Red Star vein system. The project area is situated
at the north-western edge of the historic Crescent Mining district
at the western slope of the McCullough Mountain range.
Prospecting began in this district in about
1894, but no important discoveries were made. The period of
greatest activity was from 1905 to 1907, when at least 10
incorporated companies were working in this area. Late in 1936
metal mining was revived, stimulated by the increased price of
precious metals. Most of this work was carried out by small
companies or lessees until 1942. Most of the historic production
included turquoise (around the porphyry copper occurrence at
Crescent Peak), gold, silver, copper and lead. However, no complete
production data is available for the Crescent Mining district. In
the early 1980’s the Crescent Mining Ltd. exploited the Rest Mine
and extracted gold via a heap leach operation. However, no grade or
production data are available. Initial historic mining and
exploration at the Red Star vein system dates back to the period
1907-1914. At that time, it was staked by 5 unpatented lode claims
(Red Star Group) owned and operated by the Red Star Mines Company
(probably active from 1906 to 1910). In addition, this company also
had purchased the high-grade Ag-Au vein system at the Double
Standard mine (3 patented claims), located 2.5 km south of the Red
Star Group.
Globex has already carried out initial field
work including geological mapping and has collected a total of 65
rock samples (mostly grab samples and linear chip samples) from the
Red Star property and two samples from outside the property. These
include 60 samples from the Red Star vein, 3 samples from the
Double Standard veins, 1 sample from the Peak vein and 1 sample
from the Aurum vein (the two latter form part of the Red Star vein
system).
The Red Star vein system trends
about 100° and the principal Red Star vein dips in average about
55°N. Vein outcroppings of the Red Star system can be
followed over a lateral distance of 2000 m, but it is
likely that it continues under post-mineral sedimentary and
volcanic rock cover at least until the western limit of the Globex
claim block (resulting in about a 2240m strike length). Horizontal
vein widths of individual or composite quartz veins (including
quartz breccias and stockwork zones with > 30% quartz) vary
greatly from less than 1 m to 23 m (4 m to 23 m width in the 220 m
long Main-pocket). The average vein width is about 4
m.
The 1300 m long Double
Standard vein system strikes in average 105° and dips in
average 70° N. The western vein segment (staked by Globex) is
traceable over a length of 470 m. There is present
a principal vein and several vein splays, however detail geological
mapping has not yet been performed. Quartz veins are 0.2 to about
1.5 m thick.
Epithermal mineralization of low- and
intermediate sulfidation type (or
adularia-sericite type) took place in at least three
multi-quartz-generation pulses:
Pulse A1 has been observed only
in the Double Standard Vein system and in the Peak vein. Obtained
assay results are up to 9.6 g/t Au and up
to 70 g/t Ag. Pulse A1 is of the
intermediate sulfidation epithermal style.
Pulse A2 is volumetrically the
most important within the Red Star vein system, but is present also
in the Double Standard veins, the Aurum vein and possibly also in
the Peak vein. Pulse A2 is of the low sulfidation epithermal style.
Samples with significant elevated gold values collected exclusively
from A2 quartz along the Red Star vein are as follows: R-21 over 3
m width with 0.73 ppm Au and 4.1 ppm Ag; R-51 over
4.5 m width with 0.558 ppm Au and 3.8 ppm Ag, R-40
over 1.22 m width with 2.01 ppm Au and
46.2 ppm Ag.
Pulse B represents most likely
the latest multi-generation epithermal stage. It is present only in
the Red Star vein, especially in its hanging wall portion as
massive quartz bands from 1 to about 5 m wide. Chalcedony,
crustiform-colloform quartz banding, high-grade grey and black
ginguro quartz (these dark grey to black bands are referred to as
ginguro layers, which is the Japanese word for black silver) and
rarely quartz after platy calcite indicate precipitation from
boiling epithermal fluids. Pulse B appears to represent a low
sulfidation epithermal type with occasional injections of
intermediate sulfidation epithermal fluids (precipitating ginguro
quartz). So far only 5 samples have been collected from
ginguro-rich quartz vein material yielding gold equivalent
values of 5.67 g/t (sample C-3),
20.4 g/t (sample C-6), 4.83 g/t
(sample C-9), 20.1 g/t (sample R-9) and
11.42 g/t (sample R-10). Nevertheless, ginguro
quartz is present along the entire hanging wall portion of the
Main-pocket and in numerous isolated outcrops in the eastern vein
segment.
Selection of assay results from Red Star
epithermal Au-Ag project
The Red Star project offers exceptional
discovery potential for epithermal high-grade Ag-Au, polymetallic
Ag-Au and wide low-grade gold-silver mineralization.
Analytical Methods
Samples were placed in labelled plastic bags,
sealed with a plastic zip and shipped to American Assay
Laboratories (AAL) in Sparks, Nevada, USA for preparation and
geochemical analysis. AAL is an ISO 17025 certified laboratory.
Samples are crushed and a 300 g subsample pulverized to >85% -75
micron. All samples underwent ICP-OES analysis of a 0.5 g subsample
after 5-acid digestion (HNO3, HF, HClO4, HCl and H3BO3) for 11
elements including silver. 5-acid treatment results in near total
digest (resistant phases e.g. corundum, ilmenite, rutile are not
digested). Gold was analyzed via fire assay of a 30 g subsample and
analyzed with ICP-OES. Obtained gold values above 10 ppm and silver
above100 ppm were re-analyzed via fire assay of a 30 g subsample
and gravimetric determination. Typical internal standards and
checks were completed by AAL during analysis.
This press release was written by Matthias
Jurgeit, Eurogeologist under the supervision of Jack Stoch, Geo.,
President and CEO of Globex in his capacity as a Qualified Person
(Q.P.) under NI 43-101.
|
We Seek Safe Harbour. |
Foreign Private Issuer 12g3 – 2(b) |
|
|
CUSIP Number 379900 50 9LEI 529900XYUKGG3LF9PY95 |
|
For further information, contact: |
|
Jack Stoch, P.Geo., Acc.Dir.President & CEOGlobex Mining
Enterprises Inc.86, 14th StreetRouyn-Noranda, Quebec Canada J9X
2J1 |
Tel.: 819.797.5242Fax: 819.797.1470 info@globexmining.com
www.globexmining.com |
Forward Looking Statements:
Except for historical information, this news release may contain
certain “forward looking statements”. These statements may involve
a number of known and unknown risks and uncertainties and other
factors that may cause the actual results, level of activity and
performance to be materially different from the expectations and
projections of Globex Mining Enterprises Inc. (“Globex”). No
assurance can be given that any events anticipated by the
forward-looking information will transpire or occur, or if any of
them do so, what benefits Globex will derive therefrom. A more
detailed discussion of the risks is available in the “Annual
Information Form” filed by Globex on SEDAR at www.sedar.com.
A photo accompanying this announcement is available at
https://www.globenewswire.com/NewsRoom/AttachmentNg/1310ff3b-4685-4b80-a4d3-f4f6ea4f2199
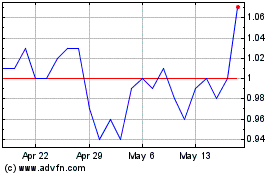
Globex Mining Enterprises (TSX:GMX)
Historical Stock Chart
From Nov 2024 to Dec 2024

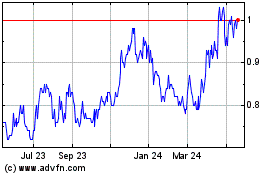
Globex Mining Enterprises (TSX:GMX)
Historical Stock Chart
From Dec 2023 to Dec 2024
