Bonterra Energy Corp. (Bonterra) (www.bonterraenergy.com) (TSX:BNE)
reports the results of the independent reserve report prepared by
Sproule Associates Limited with an effective date of December 31,
2012 for Spartan Oil Corp.; provides a pro forma reserves summary;
updates its 2013 operating cost guidance; and corrects its finding,
development and acquisition costs excluding future development
costs for 2012.
Highlights
--  Proved plus Probable (P+P) reserves on a pro forma basis of 70.5 million
    BOE with approximately 78 percent oil and liquids.
--  Approximately 74 percent of total reserves are classified as proved
    reserves with 26 percent classified as probable reserves.
Corporate Reserves Information (Spartan Oil Corp. Only)
Spartan Oil Corp. (Spartan) engaged the services of Sproule
Associates Limited to prepare a reserve evaluation with an
effective date of December 31, 2012. The gross reserve figures from
the following tables represent Spartan's ownership interest before
royalties and before consideration of the company's royalty
interests at December 31, 2012. Tables may not add due to
rounding.
Summary of Gross Oil and Gas Reserves as of December 31,
2012
                               Light and    Natural  Natural Gas
                              Medium Oil        Gas      Liquids      BOE(1)
Reserve Category:                 (Mbbl)      (MMcf)      (Mbbl)      (MBOE)
----------------------------------------------------------------------------
PROVED
  Developed Producing            6,019.8       9,762       462.8     8,109.6
  Developed Non-Producing          600.2         685        37.9       752.3
  Undeveloped                    8,115.4      10,005       533.2    10,316.1
----------------------------------------------------------------------------
TOTAL PROVED                    14,735.4      20,452     1,033.9    19,177.9
PROBABLE                         4,941.0       6,411       317.9     6,327.4
----------------------------------------------------------------------------
TOTAL PROVED PLUS PROBABLE      19,676.4      26,863     1,351.7    25,505.3
----------------------------------------------------------------------------
Reconciliation of Company Gross Reserves by Principal Product
Type as of December 31, 2012
                         Light and Medium Oil and
                              Natural Gas Liquids               Natural Gas
----------------------------------------------------------------------------

                                      Proved plus               Proved plus
                              Proved     Probable       Proved     Probable
                              (Mbbl)       (Mbbl)       (Mmcf)       (Mmcf)
----------------------------------------------------------------------------
December 31, 2011           12,838.2     18,639.4       11,822       16,750
 Extension                     966.2      1,628.3          740        1,214
 Infill Drilling               690.0      1,110.3          390          793
 Improved Recovery                 -            -            -            -
 Technical Revisions         2,027.0        380.1        8,515        9,109
 Discoveries                       -            -            -            -
 Acquisitions                   77.2         98.1           40           51
 Dispositions                      -            -            -            -
 Economic factors                0.2          1.4           (1)           -
 Production                   (829.5)      (829.8)      (1,054)      (1,054)
----------------------------------------------------------------------------
December 31, 2012           15,769.3     21,028.1       20,452       26,863
----------------------------------------------------------------------------


                                           BOE(1)
--------------------------------------------------

                                      Proved Plus
                              Proved     Probable
                              (MBOE)       (MBOE)
--------------------------------------------------
December 31, 2011           14,808.5     21,431.1
 Extension                   1,089.5      1,830.6
 Infill Drilling               755.0      1,242.5
 Improved Recovery                 -            -
 Technical Revisions         3,446.2      1,898.3
 Discoveries                       -            -
 Acquisitions                   83.9        106.6
 Dispositions                      -            -
 Economic factors                  -          1.4
 Production                 (1,005.2)    (1,005.5)
--------------------------------------------------
December 31, 2012           19,177.9     25,505.3
--------------------------------------------------
Summary of Net Present Values of Future Net Revenue as of
December 31, 2012
                                             Net Present Value Before Income
                                                                       Taxes
                                                  Discounted at (% per Year)
($ Millions)                                      0%          5%         10%
----------------------------------------------------------------------------
Reserve Category:
----------------------------------------------------------------------------
PROVED
  Developed Producing                        428,694     296,926     228,451
  Developed Non-Producing                     42,920      29,235      22,314
  Undeveloped                                437,088     236,173     138,422
----------------------------------------------------------------------------
TOTAL PROVED                                 908,702     562,333     389,187
PROBABLE                                     387,226     149,581      73,082
----------------------------------------------------------------------------
TOTAL PROVED PLUS PROBABLE                 1,295,929     711,914     462,269
----------------------------------------------------------------------------
Pro Forma Reserves (Bonterra and Spartan)
Summary of Gross Oil and Gas Reserves as of December 31,
2012
                               Light and    Natural  Natural Gas
                              Medium Oil        Gas      Liquids      BOE(1)
Reserve Category:                 (Mbbl)      (MMcf)      (Mbbl)      (MBOE)
----------------------------------------------------------------------------
PROVED
  Developed Producing           20,435.5      42,799     1,828.5    29,397.2
  Developed Non-Producing          966.5       3,314        89.7     1,608.6
  Undeveloped                   16,267.0      23,597     1,106.7    21,306.5
----------------------------------------------------------------------------
TOTAL PROVED                    37,669.0      69,710     3,024.9    52,312.2
PROBABLE                        12,954.1      25,374     1,041.9    18,225.0
----------------------------------------------------------------------------
TOTAL PROVED PLUS PROBABLE      50,623.1      95,084     4,066.7    70,537.2
----------------------------------------------------------------------------
Summary of Net Present Values of Future Net Revenue as of
December 31, 2012
                                                    Net Present Value Before
                                                                Income Taxes
                                                        Discounted at (% per
                                                                       Year)
($ Millions)                                      0%          5%         10%
----------------------------------------------------------------------------
Reserve Category:
----------------------------------------------------------------------------
PROVED
  Developed Producing                      1,270,577     839,852     634,987
  Developed Non-Producing                     69,742      45,731      33,802
  Undeveloped                                830,149     427,672     234,625
----------------------------------------------------------------------------
TOTAL PROVED                               2,170,468   1,313,254     903,414
PROBABLE                                   1,001,822     385,562     191,763
----------------------------------------------------------------------------
TOTAL PROVED PLUS PROBABLE                 3,172,291   1,698,816   1,095,178
----------------------------------------------------------------------------
Update: Bonterra 2013 Operating Cost Guidance
Bonterra closed the acquisition of Spartan in January, 2013 and
announced guidance based on the combined entity on February 5,
2013. The guidance reported included operating costs expected to
average approximately $15.00 per BOE on an annualized basis.
However, this only included Bonterra operating costs. On a
consolidated basis of Bonterra and Spartan, the operating costs for
the combined entity are expected to average $12.45 per BOE for the
period commencing from the acquisition date of January 25, 2013 to
December 31, 2013.
Correction: Finding, Development and Acquisition (FD&A)
Costs
The Company has historically been active in its capital
development program. Over three years, Bonterra has incurred the
following FD&A (3) costs excluding Future Development
Costs:
                             2012
                             FD&A      2011 FD&A     2010 FD&A
                         Costs per     Costs per     Costs per    Three Year
                      BOE(1)(2)(3)  BOE(1)(2)(3)  BOE(1)(2)(3)    Average(4)
----------------------------------------------------------------------------
Proved Reserve Net
 Additions           $       13.64 $       33.22 $       13.89 $       16.22
Proved plus Probable
 Reserve Net
 Additions           $       16.05 $       15.38 $       13.02 $       14.79
----------------------------------------------------------------------------
(1) Barrels of Oil Equivalent may be misleading, particularly if
used in isolation. A BOE conversion ratio of 6 MCF: 1 bbl is based
on an energy equivalency conversion method primarily applicable at
the burner tip and does not represent a value equivalency at the
wellhead.
(2) The aggregate of the exploration and development costs
incurred in the most recent financial year and the change during
that year in estimated future development costs generally will not
reflect total finding and development costs related to reserve
additions for that year.
(3) FD&A costs are net of proceeds of disposal and the
FD&A costs per BOE are based on reserves acquired net of
reserves disposed of.
(4) Three year average is calculated using three year total
capital costs and reserve additions on both a Proved and Proved
plus Probable basis
Certain financial and operating information, such as finding and
development costs and net asset values, included in this press
release for the year ended December 31, 2012 are based on estimated
unaudited financial results for the year and are subject to the
same limitations as discussed under Forward Looking Statements set
out below. These estimated amounts may change upon the completion
of audited financial statements for the year ended December 31,
2012 and changes could be material. All reserve numbers provided
above are Spartan's interest before royalties.
It should not be assumed that the estimates of future net
revenue presented in the above tables represent the fair market
value of the reserves. There is no assurance that the forecast
prices and costs assumptions will be attained and variances could
be material. Estimates of reserves and future net revenues for
individual properties may not reflect the same confidence level as
estimates of reserves and future net revenues for all properties
due to the effects of aggregation.
Caution Regarding Engineering Terms:
Disclosure provided herein in respect of barrels of oil
equivalent (BOE) may be misleading, particularly if used in
isolation. In accordance with NI 51-101, a BOE conversion ratio of
6 MCF to 1 barrel has been used in all cases in this disclosure.
This BOE conversion ratio is based on an energy equivalency
conversion method primarily available at the burner tip and does
not represent a value equivalency at the wellhead.
Caution Regarding Forward Looking Information:
Certain information set forth in this press release, including
management's assessment of Bonterra's future plans and operations,
contains forward-looking statements. By their nature,
forward-looking statements are subject to numerous risks and
uncertainties, some of which are beyond Bonterra's control,
including the impact of general economic conditions, industry
conditions, volatility of commodity prices, currency fluctuations,
imprecision of reserve estimates, environmental risks, competition
from other industry participants, the lack of availability of
qualified personnel or management, stock market volatility and
ability to access sufficient capital from internal and external
sources. Readers are cautioned that the assumptions used in the
preparation of such information, although considered reasonable at
the time of preparation, may prove to be imprecise and, as such,
undue reliance should not be placed on forward-looking statements.
Bonterra's actual results, performance or achievement could differ
materially from those expressed in, or implied by these
forward-looking statements, and, accordingly, no assurance can be
given that any of the events anticipated by the forward-looking
statements will transpire or occur, or if any of them do so, what
benefits that Bonterra will derive therefrom. Bonterra disclaims
any intention or obligation to update or revise any forward-looking
statements, whether as a result of new information, future events
or otherwise.
Contacts: Bonterra Energy Corp. George F. Fink Chairman and CEO
(403) 262-5307 (403) 265-7488 (FAX) Bonterra Energy Corp. Robb M.
Thompson CFO and Secretary (403) 262-5307 (403) 265-7488 (FAX)
Bonterra Energy Corp. Kirsten Lankester Manager, Investor Relations
(403) 262-5307 (403) 265-7488 (FAX)info@bonterraenergy.com
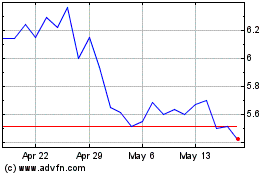
Bonterra Energy (TSX:BNE)
Historical Stock Chart
From Jun 2024 to Jul 2024

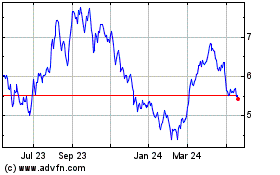
Bonterra Energy (TSX:BNE)
Historical Stock Chart
From Jul 2023 to Jul 2024
