Ford Sees Lower Margins in North America - Analyst Blog
April 01 2013 - 1:54PM
Zacks
Ford Motor Co. (F) revealed that its operating
margins from North American operations will come down to 10.0% in
2013 from 10.4% last year as it expects the lion’s share of sales
to generate from less-profitable small cars rather than high-margin
trucks.
Ford also expects increased costs associated with higher volumes to
affect margins growth. However, the automaker is banking on an
improving U.S. auto market, higher market share and increased
prices to boost its revenues.
In February this year, Ford topped all automakers in terms of
year-over-year sales growth. The company’s sales rose 9.3% to
195,310 vehicles, driven by impressive sales of its Escape SUV and
Fusion sedan. Escape sales soared 29% while Fusion sales surged 28%
during the month. Together, the vehicles contributed more than a
quarter of the company’s monthly sales.
General Motors Co. (GM) posted a 7.2% rise in
sales to 224,314 vehicles in February, driven by strong Chevrolet
Silverado and GMC Sierra pickup trucks sales like January. Sales of
Chevrolet Silverado leaped 29% while GMC Sierra sales jumped 25%
during the month.
Japanese automaker Toyota Motor Corp. (TM) saw a
disappointing 4.3% rise in sales to 166,377 vehicles compared to
its earlier performance as its popular car sales dipped 3% and its
less popular sport utility vehicles and truck sales rose 16% during
the month. Despite higher gas prices, sales of its Prius hybrid
went down 13.5%.
Another Japanese automaker, Honda Motor Co. (HMC)
recorded a 2.0% drop in sales to 107,987 vehicles as steep declines
of its CR-V crossover and Civic small car sales offset its strong
35% rise in new Accord sales. The company also attributed heavy
winter storms in the Northeast for the decline in sales.
Ford, a Zacks Rank #3 (Hold) stock, posted a robust 55.0% rise in
earnings per share to 31 cents in the fourth quarter of 2012 from
20 cents in the same quarter of 2011 (all excluding special items).
With this, the company has beaten the Zacks Consensus Estimate of
26 cents
Ford’s fourth-quarter pre-tax profit of $1.7 billion was the
highest in a decade. Meanwhile, net profit surged 55.7% to $1.2
billion from $797 million a year ago. Thanks to the impressive
North American results and, to some extent, solid improvements in
Asia-Pacific-Africa operations.
Ford’s market share in 2012 was 15.2% in the U.S., 7.9% in Europe
and 3.2% in China. In 2013, Ford expects market share in the U.S.
to be higher than 2012, Europe to be almost the same as in 2012,
and China to be higher than 2012.
During the year, Ford anticipates total company pre-tax operating
profit to be the same as in 2012. Ford Credit is expected to report
flat pre-tax operating profit compared with 2012.
FORD MOTOR CO (F): Free Stock Analysis Report
GENERAL MOTORS (GM): Free Stock Analysis Report
HONDA MOTOR (HMC): Free Stock Analysis Report
TOYOTA MOTOR CP (TM): Free Stock Analysis Report
To read this article on Zacks.com click here.
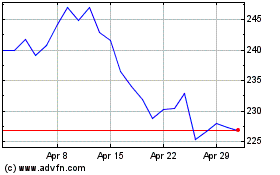
Toyota Motor (NYSE:TM)
Historical Stock Chart
From Jun 2024 to Jul 2024

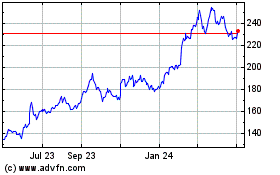
Toyota Motor (NYSE:TM)
Historical Stock Chart
From Jul 2023 to Jul 2024
