0001846069False00018460692023-11-072023-11-07
UNITED STATES
SECURITIES AND EXCHANGE COMMISSION
WASHINGTON, D.C. 20549
FORM 8-K
CURRENT REPORT
Pursuant to Section 13 or 15(d) of
the Securities Exchange Act of 1934
Date of Report (Date of Earliest Event Reported): November 7, 2023
Nextdoor Holdings, Inc.
(Exact Name of Registrant as Specified in its Charter)
| | | | | | | | |
| Delaware | 001-40246 | 86-1776836 |
(State or Other Jurisdiction
of Incorporation) | (Commission File Number) | (IRS Employer
Identification No.) |
420 Taylor Street
San Francisco, California
(Address of principal executive offices)
(415) 344-0333
(Registrant’s telephone number, including area code)
N/A
(Former name or former address, if changed since last report)
Check the appropriate box below if the Form 8-K filing is intended to simultaneously satisfy the filing obligation of the registrant under any of the following provisions (see General Instruction A.2. below):
| | | | | |
| ☐ | Written communications pursuant to Rule 425 under the Securities Act (17 CFR 230.425) |
| ☐ | Soliciting material pursuant to Rule 14a-12 under the Exchange Act (17 CFR 240.14a-12) |
| ☐ | Pre-commencement communications pursuant to Rule 14d-2(b) under the Exchange Act (17 CFR 240.14d-2(b)) |
| ☐ | Pre-commencement communications pursuant to Rule 13e-4(c) under the Exchange Act (17 CFR 240.13e-4(c)) |
Securities registered pursuant to Section 12(b) of the Act:
| | | | | | | | |
Title of each class | Trading Symbol | Name of each exchange on which registered |
Class A common stock, par value $0.0001 per share | KIND | New York Stock Exchange |
Indicate by check mark whether the registrant is an emerging growth company as defined in Rule 405 of the Securities Act of 1933 (§230.405 of this chapter) or Rule 12b-2 of the Securities Exchange Act of 1934 ((§240.12b-2 of this chapter).
Emerging growth company ☐
If an emerging growth company, indicate by check mark if the registrant has elected not to use the extended transition period for complying with any new or revised financial accounting standards provided pursuant to Section 13(a) of the Exchange Act. ☐
Item 2.02 Results of Operations and Financial Condition.
On November 7, 2023, Nextdoor Holdings, Inc. (the “Company”) issued a letter to shareholders and press release (together, the “Letter and Press Release”) announcing its financial results for the third quarter ended September 30, 2023. The Company also announced that it would be holding a conference call on November 7, 2023 to discuss its financial results. Copies of the Letter and Press Release are furnished as Exhibit 99.1 and Exhibit 99.2, respectively, to this Current Report on Form 8-K.
This information included in this Item 2.02 of this Current Report on Form 8-K and the exhibits hereto are being furnished and shall not be deemed “filed” for purposes of Section 18 of the Securities Exchange Act of 1934, as amended (the “Exchange Act”), or otherwise subject to the liabilities of that section, nor shall it been deemed incorporated by reference in any filing under the Securities Act of 1933, as amended, or the Exchange Act, except as shall be expressly set forth by specific reference in such a filing.
Item 2.05 Costs Associated with Exit or Disposal Activities.
On November 7, 2023, the Company announced a cost reduction plan (the “Cost Reduction Plan”) intended to right size the business and align the workforce and other expenses with the Company’s near term revenue expectations and long term business priorities. The Cost Reduction Plan will impact approximately 25% of the Company’s full-time employees.
The Company currently estimates that it will incur one-time charges of approximately $12 million in connection with the Cost Reduction Plan, consisting primarily of cash expenditures for notice period and severance payments, employee benefits, and related costs. In addition, the Company expects to incur approximately $0.5 million in stock-based compensation expense relating to the acceleration of the vesting of equity awards in connection with the Cost Reduction Plan.
The Company expects that the majority of the charges will be incurred in the fourth quarter of 2023 and that the execution of the Cost Reduction Plan will be substantially complete by the end of the fourth quarter of 2023. The Company intends to exclude the charges associated with the Cost Reduction Plan from its non-GAAP financial measures.
Potential position eliminations in each country are subject to local law and consultation requirements, which may extend this process further in certain countries. The charges that the Company expects to incur are subject to a number of assumptions, including local law requirements in various jurisdictions, and actual expenses may differ from the estimates disclosed above. The Company may also incur charges and expenditures not currently contemplated due to unanticipated events that may occur in connection with the Cost Reduction Plan.
Item 5.02 Departure of Directors or Certain Officers; Election of Directors; Appointment of Certain Officers; Compensatory Arrangements of Certain Officers
(b)
Michael Doyle will resign from his position as the Chief Financial Officer of the Company, effective on November 7, 2023. Mr. Doyle will remain employed by the Company until December 1, 2023 (the “Separation Date”). Mr. Doyle’s planned departure is not a result of any disagreement regarding the Company’s financial statements or disclosures.
In connection with his transition, the Company expects to enter into a Separation Agreement with Mr. Doyle on or about his Separation Date (the “Separation Agreement”), which provides for benefits consistent with his change in control and severance agreement dated October 31, 2021, including (i) a lump sum payment equal to six months’ base salary, less applicable state and federal payroll deductions, and (ii) upon his election to continue his existing health benefits under the Consolidated Omnibus Budget Reconciliation Act of 1985, as amended (“COBRA”), the Company paying the insurance premium
payments for Mr. Doyle to continue to receive coverage for six months following the Separation Date. The Separation Agreement includes a general release of claims in favor of the Company. The foregoing description of the Separation Agreement is qualified in its entirety by reference to the text of the Separation Agreement, which will be filed as an exhibit to the Company’s Annual Report on Form 10-K for the fiscal year ending December 31, 2023.
(c)
On November 7, 2023, the Board of Directors (the “Board”) of the Company appointed Matt Anderson as the Company’s Chief Financial Officer and principal financial officer, effective as of November 7, 2023.
Mr. Anderson, age 36, has served as the Company’s Head of Finance & Strategy since July 2019. Before joining the Company, Mr. Anderson served in a number of senior finance roles for Block, Inc., a digital payments and commerce company, between August 2013 and July 2019. Before joining Block, Inc. in 2013, Mr. Anderson served in a variety of finance and investment related roles for GI Partners, a private equity firm, and Barclays Capital Inc., an investment bank. Mr. Anderson has a B.A. in Economics and International Area Studies from UCLA.
There is no arrangement or understanding between Mr. Anderson and any other persons, pursuant to which Mr. Anderson was selected as an officer, no family relationships among any of the Company’s directors or executive officers and Mr. Anderson, and Mr. Anderson does not have any direct or indirect material interest in any transaction required to be disclosed pursuant to Item 404(a) of Regulation S-K.
In connection with his appointment as Chief Financial Officer, Mr. Anderson and the Company entered into an Offer Letter dated November 7, 2023 (the “Offer Letter”), which supersedes Mr. Anderson’s prior offer letter with the Company. Pursuant to the Offer Letter, Mr. Anderson will receive an initial annual base salary of $475,000 and will continue to be eligible to participate in Company-sponsored benefits to the extent he complies with the eligibility requirements of each such benefit plan. In addition, Mr. Anderson will be granted a restricted stock unit award covering $406,250 of the Company’s Class A common stock (the “RSUs”), which will vest over twenty-six (26) months. Mr. Anderson also will be granted an option to purchase $406,250 of the Company’s Class A common stock (the “Option,” and together with the RSUs, the “Equity Awards”), which will vest over twenty-six (26) months.
The Equity Awards will be granted pursuant to, and in accordance with the terms and conditions of, the Company’s 2021 Equity Incentive Plan (the “Plan”) previously filed with the U.S. Securities and Exchange Commission (the “SEC”). The exercise price of the Option will be the closing price of the Company’s Class A common stock as reported on the New York Stock Exchange on the effective date of the grant, representing the fair market value of the Company’s Class A common stock on the date of grant as determined under the terms of the Plan.
Mr. Anderson has also entered into the Company’s standard form of Indemnity Agreement and Change in Control and Severance Agreement. The forms of the Indemnity Agreement and Change in Control and Severance Agreement were previously filed by the Company as Exhibits 10.6 and 10.11, respectively, to the Company’s Current Report on Form 8-K filed with the SEC on November 12, 2021 and are incorporated by reference herein.
The foregoing descriptions of the Offer Letter and Change in Control and Severance Agreement are qualified in their entirety by reference to the full text of the Offer Letter and the Change in Control and Severance Agreement, which will be filed as exhibits to the Company’s Annual Report on Form 10-K for the fiscal year ending December 31, 2023.
(e)
The information set forth above under 5.02(c) is hereby incorporated by reference into this Item 5.02(e).
Forward-Looking Statements
This Current Report on Form 8-K contains forward-looking statements including, but not limited to, statements related to the Company’s expectations regarding entering into the Separation Agreement with Mr. Doyle. These forward-looking statements are based on management’s beliefs and assumptions and on information available to management as of the date they are made. However, investors should not place undue reliance on any such forward-looking statements because they speak only as of the date they are made. The Company does not undertake any obligation to update or revise any forward-looking statements, whether as a result of new information, future events or otherwise, except as required by law. In addition, forward-looking statements are subject to certain risks and uncertainties that could cause actual results, events and developments to differ materially from the Company’s historical experience and its present expectations or projections. These risks and uncertainties include, but are not necessarily limited to, those described in the Company’s filings with the SEC.
Item 9.01 Financial Statements and Exhibits
(d) Exhibits
| | | | | |
| Exhibit Number | Description |
| 99.1 | |
| 99.2 | |
| 104 | Cover Page Interactive Data File (embedded within the Inline XBRL document). |
SIGNATURE
Pursuant to the requirements of the Securities Exchange Act of 1934, the registrant has duly caused this report to be signed on its behalf by the undersigned hereunto duly authorized.
| | | | | | | | |
| NEXTDOOR HOLDINGS, INC. |
| | |
| | |
Date: November 7, 2023 | By: | /s/ Michael Doyle |
| | Michael Doyle |
| | Chief Financial Officer |
Business Highlights

| | | | | | | | |
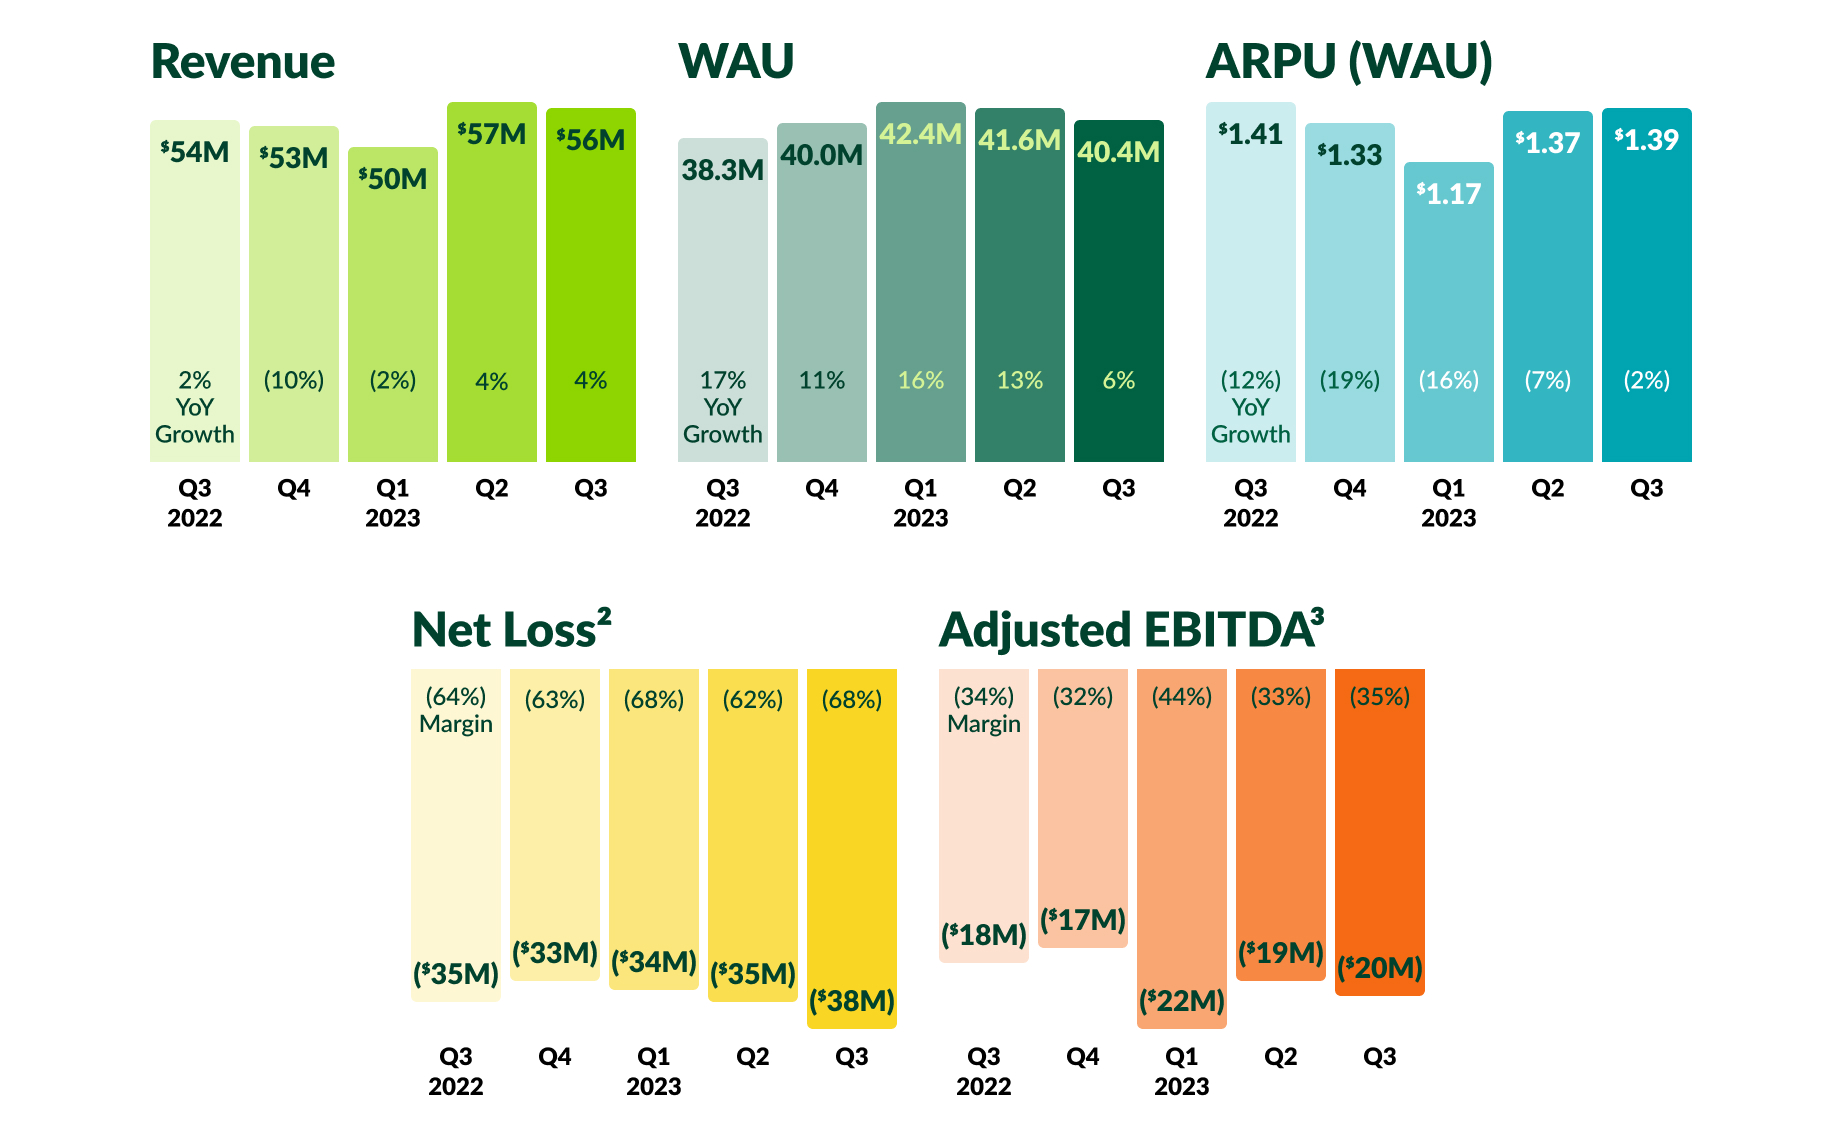
Q3 revenue of $56M increased 4% year-over-year, reflecting an acceleration of growth from small and medium-sized businesses (SMBs), who were the first set of customers benefiting from the move to the Nextdoor Ad Server. That momentum was partially offset by slower growth from US direct-sold advertisers, particularly those with exposure to home-related spending. | Q3 Weekly Active Users (WAU) of 40.4 million grew 6% year-over-year, but was down 3% quarter-over-quarter as we deliberately limited notification volumes for certain user types, reducing in-period visit frequency to improve long-term platform health. In Q3, we added more organic Verified Neighbors than in any quarter in our history, while session depth hit all-time highs—showcasing our progress delivering relevant local content. | Q3 ARPU1 of $1.39 declined 2% year-over-year. Sustained ad impression growth was offset by a year-over-year decline in eCPMs for our US Newsfeed, reflecting demand shifts across verticals and performance objectives. Additionally, direct-sold advertisers—who monetize at a relatively higher rate—made up a smaller share of total ad impressions delivered. |
_____________________
1 ARPU is defined as average revenue per WAU. eCPM is a measure of revenue received for every thousand ad impressions served.
2 Net loss margin is calculated as net loss divided by revenue.
3 Adjusted EBITDA margin is calculated as adjusted EBITDA divided by revenue. A reconciliation of non-GAAP metrics used in this letter to their most comparable GAAP measures is provided at the end of the letter.
To Our Shareholders
Q3: Progress and foundations for growth
In Q3, we made significant advances in three core areas that are critical for Nextdoor’s long-term growth: scaling new channels for Verified Neighbor growth, providing more relevant local content to neighbors, and delivering value and reducing effort for advertisers4.
First, scaling new channels for Verified Neighbor growth. The number of new neighbors coming to the platform organically accelerated 32% quarter-over-quarter, enabling us to reach nearly 85 million global Verified Neighbors. Digital invites drove the acceleration of new neighbors joining the platform, and were further bolstered by efforts to verify previously unverified neighbors and deliver more personalized email neighbor invitations. We expect organic Verified Neighbor growth will continue its momentum in Q4, and see longer-term upside as AI-enhanced neighborhood and city pages help neighbors discover the most engaging and useful information from businesses, events, and local agencies.
Second, delivering more relevant local content to neighbors. Neighbors are finding more value from the platform and engaging more when they visit Nextdoor, which, in turn, contributes to sustained growth in ad impressions. In Q3, session depth—the number of ad impression opportunities during each user session—grew approximately 30% year-over-year, driven by increases in consumption of user generated content. AI is improving our local knowledge graph, increasing the relevance of content and driving double digit growth of comments and replies. By increasing all forms of neighbor activity beyond just posts, we are expanding the availability of fresher and more local content, creating additional opportunities for improved personalization and deeper engagement.
Third, delivering advertiser value and reducing advertiser effort. In Q3, we saw this most immediately among US SMBs who are now benefiting from the Nextdoor Ad Server, our proprietary backend ad server, and the ability to access Nextdoor Ads Manager, our proprietary self-serve ad platform. SMB customer and revenue growth accelerated in Q3, reflecting improved conversion, budget utilization, and revenue retention following the initial quarter of transition to the Nextdoor Ad Server.
Beyond the US, International revenue accelerated to 79% year-over-year growth in Q3, reflecting sustained new logo growth and a broader awareness of Nextdoor’s audience and ad platform. More recently, the launch of our Conversion API (CAPI) delivers higher visibility on return on investment (ROI), particularly for advertisers seeking to measure the effect of online activity on offline action. This performance visibility will be valuable for many advertisers, particularly in verticals such as retail, where we already began to see a return to growth in Q3.
_____________________
4 Verified Neighbors are individuals who have joined Nextdoor and completed the verification process for their account.
Looking forward: Performance trends, and a performance focus
In Q3, we made progress across each of our strategic focus areas, and saw signals of future growth. But we also encountered challenges that will require us to adapt and improve.
Efforts to improve the long-term user experience—most notably through an evolved notification strategy—had a negative near-term effect on WAU, which finished at 40.4 million, up 6% year-over-year, and up nearly 50% over the last three years. The 2.3 million net new Verified Neighbors in Q3 contribute to near- and long-term engagement; however, the addition of these neighbors was more than offset by some neighbors engaging less frequently as they received fewer notifications. We have also begun reducing certain high-engagement notifications—for example those regarding crime and safety—to better align platform perception and content. These changes to the nature and frequency of notifications are contributing to the near-term decline in WAU growth. However, they represent a deliberate step that we believe will reduce negativity, improve the timeliness, proximity and relevance of notifications, and ultimately sustain our high levels of long-term user retention.
Relative to the beginning of Q3, we observed uneven demand trends in August and September. Weaker-than-expected growth from US direct-sold advertisers, particularly those in verticals with higher levels of exposure to home-related spending, offset much of the momentum we observed among international and SMB customers. The technology & telecommunications and healthcare verticals have shown multi-year growth; however, in Q3, home services spending on the platform slowed, and financial services remained challenged. We believe these weaker enterprise demand trends will likely persist for at least the coming quarters, constraining near-term revenue growth.
We now anticipate revenue growth to be approximately flat for the full year 2023, limiting the potential for near-term adjusted EBITDA margin improvement despite Q3 adjusted EBITDA of ($20M) finishing in-line with our guidance. This more muted near-term growth trajectory reflects neither our desired progress nor the strength of the long-term drivers of our business.
Our focus is therefore squarely on performance through 2024. Performance for neighbors seeking relevant and timely content. Performance for advertisers seeking reach and ROI. And performance for shareholders seeking a clear path to free cash flow5 generation. To achieve that performance, we aim to:
•Add more Verified Neighbors in 2024 than we did in 2023, with the majority coming organically via word of mouth, digital neighbor and business invitations and sharing of unique Nextdoor content.
•Deliver improved formats, targeting and tools for advertisers, and improved yield on our ad inventory.
◦In Q4, we plan to introduce the ability for Nextdoor Ads Manager advertisers to create and run video ads and lead generation ad campaigns served by Nextdoor Ad Server.
◦During Q4, we plan to migrate an increasing amount of ads delivery for Nextdoor Ads Manager campaigns to Nextdoor Ad Server, with a goal of serving substantially all demand by the end of the year. We expect to continue to improve our pacing capabilities, and begin our first tests of delivery optimization based on click prediction.
◦By mid-2024, we seek to offer delivery optimization capabilities to all Nextdoor Ads Manager advertisers, equipping us to scale performance campaigns in 2024 and beyond.
•Accelerate the path to free cash flow breakeven by taking the immediate action of executing a reduction in force impacting approximately 25% of our workforce, aligning our expenses with our near-term trajectory and long-term priorities. We are targeting a reduction in current GAAP personnel expenses of up to $60 million annually, and non-GAAP personnel expenses of approximately $45 million annually.
With a streamlined cost structure, healthy balance sheet, momentum at the top and bottom of the engagement funnel, and clear ad platform milestones, we believe we will be equipped to deliver quarterly free cash flow breakeven by the end of 2025.
_____________________
5 We define free cash flow as cash flow from operating activities less capital expenditures.
Outlook & Foundations For Future Growth
2023 guidance
Q4 2023 Outlook
•We expect Q4 2023 revenue in a range between $50 million and $52 million.
•We expect Q4 adjusted EBITDA in a range between ($21) million and ($19) million, excluding the impact of one-time expenses related to our cost reduction plan.
FY 2023 Outlook
•We expect FY 2023 revenue in a range between $213 million and $215 million, flat to slightly higher vs. FY 2022.
•We expect FY 2023 adjusted EBITDA in a range between ($81) million and ($79) million, excluding the impact of one-time expenses related to our cost reduction plan.
Even though near-term uncertainty exists, we are equipped to deliver long-term value in a number of ways:
•We have levers—and momentum—at multiple stages of the user funnel. Neighbors are joining organically, and at increasing scale: New unpaid Verified Neighbor additions are up 32% quarter-over-quarter and 23% year-over-year, continuing to make up nearly all of total new neighbors on the platform. Session depth is up approximately 30% year-over-year, highlighting the increasingly personalized content on the platform.
•Nextdoor’s fully verified audience, high-intent signals, and unique location data offer a compelling value proposition. Nextdoor’s combination of location-specific and context-based advertising enables us to connect neighbors to relevant ads. Additionally, as marketers prepare for cookie-less tracking, we are well positioned to help them drive business outcomes. The value of this audience will be amplified as the capabilities of our proprietary ad stack become more broadly available.
•Our local knowledge graph and neighbor-labeled data provides an AI edge. Since 2022, the number of active machine learning models in our products has increased by approximately 10x, and the number of successful model experiments has increased by approximately 100x. We prioritize velocity and breadth of different large language models (LLMs) across markets and user needs. These LLMs are built on our proprietary local knowledge graph and play a key role driving future neighbor growth and engagement.
•Nextdoor is uniquely positioned for recovery in our core verticals. While some financial services, real estate and home services advertisers are reducing budgets, we continue to grow our overall advertiser base and see strong customer retention. Given that, we will see leverage as those budgets begin to expand again.
•Stability from our strong balance sheet and a clarified path to breakeven. This gives us the ability to invest prudently under any conditions.
For additional detail on our progress against our three core focus areas, and on our financial results, please see the following pages.
| | | | | |
Scaling New Channels For Verified Neighbor Growth
We are growing the number of neighbors and organizations on Nextdoor, creating viral growth loops through invites, content sharing, and brand awareness initiatives. We are making significant progress across each of these channels—in Q3, we added more Verified Neighbors organically than in any other quarter in Nextdoor’s history.
Using invites to create viral growth loops for neighbors and organizations globally
In Q3, the greatest contribution to neighbor growth was from the evolution of our digital invite strategy. We launched the Neighbor Hub, which transforms the invite tab into a more holistic neighbor experience. Traffic to the Neighbor Hub is already approaching 1M visits per week, contributing to over 100% year-over-year growth in digital Neighbor-to-Neighbor invites. | |
Our invite-driven viral growth loops extend beyond neighbors. Page-to-neighbor invites enable organizations such as local businesses, nonprofits and public agencies to easily represent themselves, build a reputation by inviting their customers to Fave and follow their Page on Nextdoor, which ultimately brings new users to Nextdoor. In Q3, these page-to-neighbor invites grew by over 100% quarter-over-quarter, and will continue to be a scalable organic growth channel that drives value for both Neighbors and organizations. For example, guests who were asked by businesses to “Support their local business” were willing to accept invites to join Nextdoor at a 1.6x rate.
| | | | | | | | |
Neighborhood Faves—the annual local business awards in which Nextdoor neighbors vote to celebrate their favorite local businesses—are becoming more central in the neighbor user experience globally. This evolution is especially notable given 94% of neighbors value recommendations for products, services, and businesses from their neighbors on Nextdoor6. Following the Q2 US launch, in Q3 we launched Neighborhood Faves in the UK for the first time. The campaign more than doubled the number of Faves on the platform bringing the total to 1.3M Faves in that market. We are still early in our journey to educate businesses that Faves is the currency for building reputation in the neighborhood. In Q4, we are taking further steps to demonstrate that value by providing businesses with visitor analytics, to help them measure and grow their presence on the platform. | | |
_____________________
6 Based on a survey of US neighbors in Q2 2023.
Driving growth from content that can’t be found anywhere else
In Q3, by leveraging OpenAI’s ChatGPT, we generated business recommendation summaries for approximately 300K businesses. Summarizing all of the recommendations a business has received enhanced the quality of business pages, which in turn increased SEO visits and new neighbor registration rates. We see ample opportunity to scale this effort to continue driving top-of-funnel neighbor growth. Further, in Q4, our AI-enhanced Neighborhood and City pages will help position us to be the hub for discovering trusted information to learn more about the neighborhood and stay up-to-date. We believe these Neighborhood and City pages represent an opportunity of over 100 million searches per month, creating a natural channel for introducing new neighbors to Nextdoor.
We also have significant opportunity to increase Verified Neighbor growth and engagement via a developer platform that can enable many new use cases. Our Content API allows partners such as Microsoft and The Weather Channel, to incorporate Nextdoor posts into their own websites and apps, distributing Nextdoor content broadly to high-traffic sites. In turn, our content directs traffic back to Nextdoor, which drives new Verified Neighbor growth from guests who seek to engage with that content. Our partnership with Microsoft has driven millions of unique visitors to Nextdoor, and in Q3, our integration with The Weather Channel rolled out nationwide.
Delivering More Relevant Local Content To Neighbors
The sequential decline in WAU in Q3, while below our potential, also reflects a series of long-term-oriented actions. Notably, in Q3, the focus of our notifications strategy shifted to better calibrate: (1) relevance, and how far negative content can travel in notifications; (2) volume, assessing limits based on user segments; and (3) control, providing Neighbors better settings and user experience. We believe these changes will allow us to maintain long-term growth in WAU.
While year-over-year WAU growth slowed in Q3, increases in session depth accelerated. This reflected an increasing number of content views as our engagement models consider a broader range of neighbor contributions—including comments and reactions—to more effectively deliver highly localized content.
We are also driving engagement in a way that increases transparency for neighbors and improves efficiency in Nextdoor’s operations. In Q3, we launched our in-app account suspension appeals experience. By bringing this experience into the app we created a more seamless experience for neighbors and reduced manual review by 30%, driving both improved speed and efficiency.
Multiple paths for delivering more—and more engaging—content
In Q3, we used AI to personalize content by taking into account: (1) How neighbors engage with notifications; (2) how often neighbors make different types of contributions such as comments, reactions and chats; and (3) how neighbors engage with different types of posts, including For Sale & Free. Taken together, these changes increased comments and replies, which, in turn, increased the availability of more local and more timely content.
AI also continues to play a key role driving content creation. Nextdoor’s Post Assistant feature, which is available to all neighbors in the US and the UK, improves neighbor communication by suggesting post content that fosters community engagement. The selected use cases for the Post Assistant—helping neighbors to find a service, and helping business owners and agencies to promote their services—have an approximately 70% suggestion acceptance rate. Notably, SMB authors are the most frequent users of the Post Assistant, with a rate exceeding that of neighbors by more than 2x.
During the quarter we introduced a foundational shift in how we think about the content in our Newsfeed, moving from a “Feed of Posts” to a “Feed of Activities.” Neighbors can make many types of contributions on Nextdoor, and posts are just one of them. Instead of showing more distant posts, we now show the nearby comment that was made on that post. This makes the Newsfeed feel more local by highlighting the more proximate neighbor contribution. Adding a broader range of activities also increases the pool of available fresh content for neighbors. Over time, we will also introduce additional activity types into the feed, such as reactions and event RSVPs, enabling us to surface increasingly lively and timely content.
| | | | | |
Increasing utility across a range of surfaces
Increasing utility beyond the Newsfeed remains critical for driving long-term engagement and monetization.
On our Discover surface neighbors can now use Nextdoor beyond their own neighborhood. In Q3, we launched a moveable map where neighbors can look at businesses, events, For Sale & Free listings, and seasonal activations like the Treat Map, anywhere. Neighbors now have a clearer content creation experience so they know how their posts will be used on the map, they can center the map to their mobile location, and snap back to their home in one click.
On our For Sale & Free surface, we reduced friction in messaging by enabling one-click messaging to make reaching out to a seller seamless. These and other changes contributed to an increase in For Sale & Free ad impressions. | |
Delivering Advertiser Value and Reducing Advertiser Effort
Q3 revenue of $56 million reflected momentum among SMB customers and slowing spend among some larger advertisers.
Beginning in July, 100% of ads from US SMB advertisers were served via Nextdoor Ad Server. This allowed us to develop and release a new pacing algorithm specifically for smaller budgets, enabling increased reach and smoother delivery throughout their campaigns, increasing budget utilization and revenue retention. For larger advertisers not yet serving via Nextdoor Ad Server, we launched a Conversion API (CAPI) to enable them to better understand the value of their Nextdoor ads and providing us better data for optimizing their campaigns.
In conjunction with the continued roll out of Nextdoor Ads Manager and its accompanying campaign management API, we remain focused on increasing awareness by continuing to expand relationships with advertising agencies. More than half of new global enterprise accounts added to the platform in the quarter had an agency relationship. We expect these relationships will continue to allow us to efficiently activate new logos and increase customer diversity. In Q3, this progress was most visible internationally.
Nextdoor Ad Server: The foundation of advertiser performance
The Nextdoor Ad Server is the foundation for delivering advertiser performance and for increasing ARPU growth through improved revenue yields. In Q3, we delivered in two key areas. First, we developed more sophisticated pacing methods to better deliver ads over the course of a day and the course of a campaign. Second, we built the core components required for performance optimization, so that we can begin experimenting with this capability later in Q4.
Our work in Q3 also prepares us to serve substantially all Nextdoor Ads Manager demand on the Nextdoor Ad Server by the end of Q4. Given a subset of mid-market advertisers are already using the Nextdoor Ads Manager, this effectively serves as the first phase of our migration of mid-market customers.
| | | | | |
Nextdoor Ads Manager: Key to reducing advertiser effort
We built features and functionality with large advertisers and their agency partners in mind. This includes releasing user roles and permissions, creative duplication, pixel tooling, audience exclusions, ad credit tooling, and multi-edit functionality in Nextdoor Ads Manager.
In Q3, in partnership with Oracle Advertising, we experimented with contextual targeting, further improving the ability to align customer messaging to relevant conversations. We also offered even greater transparency and controls to advertisers on the platform, enabling advertisers to deliver high-performance ads in a safe and highly relevant environment.
In Q4, we expect to deliver our first lead generation and video ad formats created in Nextdoor Ads Manager and served via Nextdoor Ad Server. Additionally, we expect to develop improved functionality for invoicing, daily reporting, and audit logging in Nextdoor Ads Manager. Finally, we plan to test our first experiments with performance optimization. | |
As we look forward to 2024, we want AI to play a role in both the Nextdoor advertiser experience and our underlying ad serving. We plan to pilot and iterate our AI assistant geared to simplify and enhance ad creation. We also expect to continue our investment in performance optimization leveraging data from advertisers and our proprietary platform data.
Our API and partner strategy continue to deliver advertiser value
At the end of Q3, we launched our Conversion API (CAPI), which receives information on online and offline transactions to improve attribution capabilities, giving advertisers maximum visibility into return on ad spend (ROAS). Building on Nextdoor’s conversion pixel capabilities, the CAPI allows advertisers to gain further insight into how media campaigns on Nextdoor drive online to offline action, providing the ability to assign conversion on Nextdoor. This attribution will play an important role in both attracting new advertisers, and scaling existing advertiser budgets.
Brand safety—and the need to build and maintain brand equity broadly—is also top of mind for advertisers of all types. In Q3, we completed full brand safety integrations with Oracle Moat, leading to increased market traction with high profile brands, particularly within the retail and CPG categories.
Q3 2023 Financial Discussion
| | | | | |
Revenue Q3 revenue was $56M, an increase of 4% year-over-year. Strength from small business advertisers, growing relationships with advertising agencies, and resilience in verticals such as technology & telecommunications and healthcare offset slowing home services spend and continued headwinds in financial services. | |
Operating expenses In Q3, GAAP operating expenses were $100M, an increase of 11% year-over-year. The growth in operating expenses was primarily driven by increased personnel costs in product development and sales, partially offset by an overall reduction in marketing expenses. Cost of revenue was $11M, up 9% year-over-year. In Q3, cost of revenue represented 19% of revenue, an increase of 1 percentage point from the year-ago period, primarily driven by third-party hosting costs. | |
| |
Research and development expenses were $40M, or 71% of revenue, up 19% year-over-year. The growth was driven primarily by increased headcount and personnel costs related to our engineering, data science, and product management teams. Sales and marketing expenses were $31M, or 54% of revenue, up 5% year-over-year. The increase was driven by personnel-related costs due to headcount growth in the sales organization. This was partially offset by lower marketing costs associated with neighbor acquisition as focus continues to shift to product-led growth channels. General and administrative expenses were $20M, or 35% of revenue, up 8% year-over-year, driven primarily by an increase in personnel-related costs, partially offset by a decrease in other expenses. Total non-GAAP operating expenses were $76M, or 135% of revenue, up 6% year-over-year7. |
______________________________
7 A reconciliation of non-GAAP metrics used in this letter to their most comparable GAAP measures is provided at the end of this letter.
| | | | | |
Earnings Net loss was $38M, representing a (68%) margin, compared to $35M and a (64%) margin in the year-ago period. An increase in operating loss was partially offset by an increase in interest income. | |
Q3 adjusted EBITDA loss was $20M, representing a (35%) margin, compared to $18M and a (34%) margin in the year-ago period. Non-GAAP operating expense growth of 6% year-over-year slightly outpaced revenue growth, driving margins down slightly compared to the year ago period. This non-GAAP expense growth was driven primarily by hiring within select R&D and sales teams, offset in part by more efficient neighbor acquisition. | |
Balance sheet and cash flows We ended the period with $540M in cash, cash equivalents, and marketable securities. In Q3, cash used in operations reflected an increase in net loss, offset in part by an increase in interest income. For the nine months ended September 30, 2023, cash used in operations was $44M compared to $41M in the year-ago period. |
Q3 Conference Call and Webcast
We will host a Q&A webcast at 2:00 pm PT/5:00 pm ET today, November 7, 2023, to discuss these results and outlook. An audio webcast archive will be available following the live webcast for approximately one year on Nextdoor’s Investor Relations website at investors.nextdoor.com. Thank you for your support in building stronger neighborhoods across the globe and for being active neighbors in your neighborhood. We look forward to your questions and comments this afternoon.
We use our Investor Relations website (investors.nextdoor.com), our X handle (x.com/Nextdoor), our LinkedIn Home Page (linkedin.com/company/nextdoor-com), and Sarah Friar’s LinkedIn posts (linkedin.com/in/sarah-friar-922b044) as a means of disseminating or providing notification of, among other things, news or announcements regarding our business or financial performance, investor events, press releases, and earnings releases and as a means of disclosing material nonpublic information and for complying with our disclosure obligations under Regulation FD. The content of our websites and information that we may post on or provide to online and social media channels, including those mentioned above, and information that can be accessed through our websites or these online and social media channels are not incorporated by reference into this shareholder letter or in any report or document we file with the SEC, and any references to our websites or these online and social media channels are intended to be inactive textual references only.
Safe Harbor Statement
This shareholder letter includes forward-looking statements, which are statements other than statements of historical facts and statements in the future tense. These statements include, but are not limited to, statements regarding our future performance and our market opportunity, including expected financial results for the fourth quarter of 2023 and full year 2023, trends and expectations regarding our business and operating results, our expectations on Verified Neighbor growth, the expected cost reductions associated with the reduction in force, our business strategy and plans, and our objectives and future operations, including our expansion into new markets.
Forward-looking statements are based upon various estimates and assumptions, as well as information known to us as of the date of this shareholder letter, and are subject to risks and uncertainties. Accordingly, actual results could differ materially due to a variety of factors, including: our ability to scale our business and monetization efforts; our ability to expand business operations abroad; our limited operating history; risks associated with managing our growth; our ability to achieve and maintain profitability in the future; the effects of the highly competitive market in which we operate; the impact of macroeconomic conditions on our business; our ability to attract new and retain existing customers and users, or renew and expand our relationships with them; our ability to anticipate and satisfy customer preferences; market acceptance of our platform; our ability to successfully develop and timely introduce new products and services; our ability to achieve our objectives of strategic and operational initiatives; cybersecurity risks to our various systems and software; the impact of privacy and data security laws; and other general market, political, economic, and business conditions.
Additional risks and uncertainties that could affect our financial results and business are more fully described in our Quarterly Report on Form 10-Q for the period ended June 30, 2023 filed with the SEC on August 8, 2023, our Quarterly Report on Form 10-Q for the period ended September 30, 2023, expected to be filed on or about November 7, 2023, and our other SEC filings, which are available on the Investor Relations page of our website at investors.nextdoor.com and on the SEC’s website at www.sec.gov.
All forward-looking statements contained herein are based on information available to us as of the date hereof and you should not rely upon forward-looking statements as predictions of future events. The events and circumstances reflected in the forward-looking statements may not be achieved or occur. Although we believe that the expectations reflected in the forward-looking statements are reasonable, we cannot guarantee future results, performance, or achievements. We undertake no obligation to update any of these forward-looking statements for any reason after the date of this shareholder letter or to conform these statements to actual results or revised expectations, except as required by law. Undue reliance should not be placed on the forward-looking statements in this shareholder letter.
A Note on Guidance
We have not reconciled our adjusted EBITDA and adjusted EBITDA margin outlook to GAAP net loss or GAAP net loss margin because certain items that impact GAAP net loss and GAAP net loss margin are uncertain or out of our control and cannot be reasonably predicted. In particular, stock-based compensation expense is impacted by the future fair market value of our common stock and other factors, all of which are difficult to predict, subject to frequent change, or not within our control. The actual amount of these expenses during 2023 will have a significant impact on our future GAAP financial results. Accordingly, a reconciliation of adjusted EBITDA outlook to net loss and adjusted EBITDA margin to GAAP net loss margin is not available without unreasonable efforts.
Condensed Consolidated
Balance Sheets
in thousands, except per share data (unaudited)
| | | | | | | | | | | |
| September 30, | | December 31 |
| 2023 | | 2022 |
| | | |
| Assets | | | |
| Current assets: | | | |
| Cash and cash equivalents | $ | 48,444 | | | $ | 55,236 | |
| Marketable securities | 491,283 | | | 528,067 | |
| Accounts receivable, net of allowance of $441 and $422 as of September 30, 2023 and December 31, 2022, respectively | 29,991 | | | 29,770 | |
| Prepaid expenses and other current assets | 11,052 | | | 12,185 | |
| Total current assets | 580,770 | | | 625,258 | |
| Restricted cash, non-current | 11,171 | | | — | |
| Property and equipment, net | 9,050 | | | 11,818 | |
| Operating lease right-of-use assets | 58,123 | | | 52,555 | |
| Intangible assets, net | 1,746 | | | 3,067 | |
| Goodwill | 1,211 | | | 1,211 | |
| Other assets | 8,029 | | | 5,653 | |
| Total assets | $ | 670,100 | | | $ | 699,562 | |
| | | |
| Liabilities and Stockholders’ Equity | | | |
| Current liabilities: | | | |
| Accounts payable | $ | 3,307 | | | $ | 4,535 | |
| Operating lease liabilities, current | 6,021 | | | 7,766 | |
| Accrued expenses and other current liabilities | 25,313 | | | 22,362 | |
| Total current liabilities | 34,641 | | | 34,663 | |
| Operating lease liabilities, non-current | 62,011 | | | 53,831 | |
| Other liabilities, non-current | 267 | | | — | |
| Total liabilities | 96,919 | | | 88,494 | |
| | | |
| Stockholders’ equity: | | | |
| Class A common stock, $0.0001 par value; 2,500,000 shares authorized, 180,104 and 153,693 shares issued and outstanding as of September 30, 2023 and December 31, 2022, respectively | 18 | | | 15 | |
| Class B common stock, $0.0001 par value; 500,000 shares authorized, 203,417 and 218,029 shares issued and outstanding as of September 30, 2023 and December 31, 2022, respectively | 20 | | | 22 | |
| Additional paid-in capital | 1,300,845 | | | 1,231,482 | |
| Accumulated other comprehensive loss | (2,212) | | | (2,196) | |
| Accumulated deficit | (725,490) | | | (618,255) | |
| Total stockholders’ equity | 573,181 | | | 611,068 | |
| | | |
| Total liabilities and stockholders’ equity | $ | 670,100 | | | $ | 699,562 | |
Condensed Consolidated Statements of Operations
in thousands, except per share data (unaudited)
| | | | | | | | | | | | | | | | | | | | | | | |
| Three Months Ended September 30, | | Nine Months Ended September 30, |
| 2023 | | 2022 | | 2023 | | 2022 |
| | | | | | | |
| Revenue | $ | 56,092 | | | $ | 53,954 | | | $ | 162,752 | | | $ | 159,495 | |
| Costs and expenses: | | | | | | | |
| Cost of revenue | 10,723 | | | 9,882 | | | 31,074 | | | 29,124 | |
| Research and development | 39,649 | | | 33,398 | | | 109,748 | | | 95,057 | |
| Sales and marketing | 30,564 | | | 29,000 | | | 91,159 | | | 92,688 | |
| General and administrative | 19,532 | | | 18,066 | | | 55,401 | | | 50,499 | |
| Total costs and expenses | 100,468 | | | 90,346 | | | 287,382 | | | 267,368 | |
| Loss from operations | (44,376) | | | (36,392) | | | (124,630) | | | (107,873) | |
| Interest income | 6,766 | | | 2,703 | | | 18,635 | | | 5,347 | |
| Other income (expense), net | (217) | | | (709) | | | (526) | | | (1,602) | |
| Loss before income taxes | (37,827) | | | (34,398) | | | (106,521) | | | (104,128) | |
| Provision for income taxes | 289 | | | 319 | | | 714 | | | 380 | |
| Net loss | $ | (38,116) | | | $ | (34,717) | | | $ | (107,235) | | | $ | (104,508) | |
| | | | | | | |
| Net loss per share attributable to Class A and Class B common stockholders, basic and diluted | $ | (0.10) | | | $ | (0.09) | | | $ | (0.28) | | | $ | (0.27) | |
| Weighted average shares used in computing net loss per share attributable to Class A and Class B common stockholders, basic and diluted | 381,482 | | | 377,756 | | | 376,832 | | | 381,571 | |
Condensed Consolidated Statements of Cash Flows
in thousands (unaudited)
| | | | | | | | | | | |
| Nine Months Ended September 30, |
| 2023 | | 2022 |
| | | |
| Cash flows from operating activities | | | |
| Net loss | $ | (107,235) | | | $ | (104,508) | |
| Adjustments to reconcile net loss to net cash used in operating activities: | | | |
| Depreciation and amortization | 4,356 | | | 4,169 | |
| Stock-based compensation | 60,735 | | | 46,957 | |
| Bad debt expense | 75 | | | (40) | |
| Accretion of investments | (6,505) | | | 954 | |
| Other | 245 | | | (1,631) | |
| Changes in operating assets and liabilities: | | | |
| Accounts receivable, net | (296) | | | 2,750 | |
| Prepaid expenses and other assets | 2,815 | | | 5,806 | |
| Operating lease right-of-use assets | 3,539 | | | 5,120 | |
| | | |
| Accounts payable | (1,228) | | | (445) | |
| Operating lease liabilities | (4,230) | | | (5,280) | |
| Accrued expenses and other liabilities | 3,393 | | | 5,351 | |
| Net cash used in operating activities | (44,336) | | | (40,797) | |
| Cash flows from investing activities | | | |
| Purchases of property and equipment | (268) | | | (2,182) | |
| Purchases of marketable securities | (454,897) | | | (555,052) | |
| Sales of marketable securities | 81,266 | | | 7,822 | |
| Maturities of marketable securities | 416,587 | | | 224,005 | |
| Loan to Opportunity Finance Network | (2,500) | | | — | |
| Net cash provided by (used in) investing activities | 40,188 | | | (325,407) | |
| Cash flows from financing activities | | | |
| Proceeds from exercise of stock options | 6,676 | | | 11,219 | |
| Proceeds from issuance of common stock under employee stock purchase plan | 2,016 | | | 1,430 | |
| Payment of transaction costs related to the Reverse Recapitalization | — | | | (314) | |
| Tax withholdings on release of restricted stock units | (237) | | | (695) | |
| Repurchase of common stock | — | | | (77,232) | |
| Prepayment under share repurchase program | — | | | (68) | |
| Net cash provided by (used in) financing activities | 8,455 | | | (65,660) | |
| Effect of exchange rate changes on cash and cash equivalents | 72 | | | 783 | |
| Net increase (decrease) in cash and cash equivalents | 4,379 | | | (431,081) | |
| Cash, cash equivalents, and restricted cash at beginning of period | 55,236 | | | 521,812 | |
| Cash, cash equivalents, and restricted cash at end of period | $ | 59,615 | | | $ | 90,731 | |
Non-GAAP Financial Measures
To supplement our condensed consolidated financial statements, which are prepared in accordance with GAAP, we present non-GAAP cost of revenue, non-GAAP research and development, non-GAAP sales and marketing, non-GAAP general and administrative, adjusted EBITDA and adjusted EBITDA margin in this shareholder letter. Our use of non-GAAP financial measures has limitations as an analytical tool, and these measures should not be considered in isolation or as a substitute for analysis of financial results as reported under GAAP.
We use these non-GAAP financial measures in conjunction with financial measures prepared in accordance with GAAP for planning purposes, including in the preparation of our annual operating budget, as a measure of our core operating results and the effectiveness of our business strategy, and in evaluating our financial performance. These measures provide consistency and comparability with past financial performance, facilitate period-to-period comparisons of core operating results, and also facilitate comparisons with other peer companies, many of which use similar non-GAAP financial measures to supplement their GAAP results. In addition, adjusted EBITDA is widely used by investors and securities analysts to measure a company's operating performance. We exclude the following items from one or more of our non-GAAP financial measures: stock-based compensation expense (non-cash expense calculated by companies using a variety of valuation methodologies and subjective assumptions), depreciation and amortization (non-cash expense), interest income, provision for income taxes, and, if applicable, acquisition-related costs.
Investors are cautioned that there are material limitations associated with the use of non-GAAP financial measures as an analytical tool. In particular, (1) stock-based compensation expense has recently been, and will continue to be for the foreseeable future, a significant recurring expense for our business and an important part of our compensation strategy, (2) although depreciation and amortization expense are non-cash charges, the assets subject to depreciation and amortization may have to be replaced in the future, and our non-GAAP measures do not reflect cash capital expenditure requirements for such replacements or for new capital expenditure requirements, and (3) adjusted EBITDA does not reflect: (a) changes in, or cash requirements for, our working capital needs; (b) interest expense, or the cash requirements necessary to service interest or principal payments on our debt, which reduces cash available to us; or (c) tax payments that may represent a reduction in cash available to us. The non-GAAP measures we use may be different from non-GAAP financial measures used by other companies, limiting their usefulness for comparison purposes. We compensate for these limitations by providing specific information regarding the GAAP items excluded from these non-GAAP financial measures. A reconciliation of these non-GAAP measures has been provided below:
Non-GAAP Financial Measures
in thousands (unaudited)
| | | | | | | | | | | | | | | | | | | | | | | |
| Three Months Ended September 30, | | Nine Months Ended September 30, |
| 2023 | | 2022 | | 2023 | | 2022 |
| | | | | | | |
| Net loss | $ | (38,116) | | | $ | (34,717) | | | $ | (107,235) | | | $ | (104,508) | |
| % Margin | (68 | %) | | (64 | %) | | (66 | %) | | (66 | %) |
| Depreciation and amortization | $ | 1,451 | | | $ | 1,465 | | | $ | 4,356 | | | $ | 4,169 | |
| Stock-based compensation | 23,343 | | | 17,270 | | | 60,735 | | | 46,957 | |
| Interest income | (6,766) | | | (2,703) | | | (18,635) | | | (5,347) | |
| Provision for income taxes | 289 | | | 319 | | | 714 | | | 380 | |
| Adjusted EBITDA | $ | (19,799) | | | $ | (18,366) | | | $ | (60,065) | | | $ | (58,349) | |
| % Margin | (35 | %) | | (34 | %) | | (37 | %) | | (37 | %) |
| Cost of Revenue Reconciliation: | | | | | | | |
| Cost of Revenue, GAAP | $ | 10,723 | | | $ | 9,882 | | | $ | 31,074 | | | $ | 29,124 | |
| Stock-based compensation | (835) | | | (732) | | | (2,311) | | | (1,906) | |
| Cost of Revenue, Non-GAAP | $ | 9,888 | | | $ | 9,150 | | | $ | 28,763 | | | $ | 27,218 | |
| % of revenue, GAAP | 19 | % | | 18 | % | | 19 | % | | 18 | % |
| % of revenue, Non-GAAP | 18 | % | | 17 | % | | 18 | % | | 17 | % |
| Research and Development Reconciliation: | | | | | | | |
| Research and Development, GAAP | $ | 39,649 | | | $ | 33,398 | | | $ | 109,748 | | | $ | 95,057 | |
| Stock-based compensation | (12,107) | | | (9,630) | | | (31,804) | | | (25,914) | |
| Depreciation and amortization | (496) | | | (506) | | | (1,485) | | | (1,443) | |
| Research and Development, Non-GAAP | $ | 27,046 | | | $ | 23,262 | | | $ | 76,459 | | | $ | 67,700 | |
| % of revenue, GAAP | 71 | % | | 62 | % | | 67 | % | | 60 | % |
| % of revenue, Non-GAAP | 48 | % | | 43 | % | | 47 | % | | 42 | % |
| Sales and Marketing Reconciliation: | | | | | | | |
| Sales and Marketing, GAAP | $ | 30,564 | | | $ | 29,000 | | | $ | 91,159 | | | $ | 92,688 | |
| Stock-based compensation | (3,582) | | | (2,621) | | | (9,140) | | | (7,617) | |
| Depreciation and amortization | (785) | | | (770) | | | (2,344) | | | (2,219) | |
| Sales and Marketing, Non-GAAP | $ | 26,197 | | | $ | 25,609 | | | $ | 79,675 | | | $ | 82,852 | |
| % of revenue, GAAP | 54 | % | | 54 | % | | 56 | % | | 58 | % |
| % of revenue, Non-GAAP | 47 | % | | 47 | % | | 49 | % | | 52 | % |
| General and Administrative Reconciliation: | | | | | | | |
| General and Administrative, GAAP | $ | 19,532 | | | $ | 18,066 | | | $ | 55,401 | | | $ | 50,499 | |
| Stock-based compensation | (6,819) | | | (4,287) | | | (17,480) | | | (11,520) | |
| Depreciation and amortization | (170) | | | (189) | | | (527) | | | (507) | |
| General and Administrative, Non-GAAP | $ | 12,543 | | | $ | 13,590 | | | $ | 37,394 | | | $ | 38,472 | |
| % of revenue, GAAP | 35 | % | | 33 | % | | 34 | % | | 32 | % |
| % of revenue, Non-GAAP | 22 | % | | 25 | % | | 23 | % | | 24 | % |
| Total Operating Expenses Reconciliation: | | | | | | | |
| Operating Expenses, GAAP | $ | 100,468 | | | $ | 90,346 | | | $ | 287,382 | | | $ | 267,368 | |
| Stock-based compensation | (23,343) | | | (17,270) | | | (60,735) | | | (46,957) | |
| Depreciation and amortization | (1,451) | | | (1,465) | | | (4,356) | | | (4,169) | |
| Total Operating Expenses, Non-GAAP | $ | 75,674 | | | $ | 71,611 | | | $ | 222,291 | | | $ | 216,242 | |
| % of revenue, GAAP | 179 | % | | 167 | % | | 177 | % | | 168 | % |
| % of revenue, Non-GAAP | 135 | % | | 133 | % | | 137 | % | | 136 | % |
Nextdoor Reports Third Quarter 2023 Results
•Adds Record Number of Organic Verified Neighbors in Q3, with continued momentum expected in Q4
•Implements Cost Reduction Plan to Accelerate Path to Quarterly Free Cash Flow Breakeven by Year-End 2025
SAN FRANCISCO, CA, November 7, 2023 — Nextdoor Holdings, Inc. (NYSE: KIND) today announced financial results for the third quarter ended September 30, 2023.
Nextdoor's highlighted metrics for the quarter ended September 30, 2023 include:
•Total Weekly Active Users (WAU) of 40.4 million increased 6% year-over-year.
•Revenue of $56 million increased 4% year-over-year.
•Net loss was $38 million, compared to $35 million in the year-ago period.
•Adjusted EBITDA loss was $20 million, compared to $18 million in the year-ago period.
•Ending cash, cash equivalents, and marketable securities were $540 million as of September 30, 2023.
"Nextdoor made great strides in Q3 against a difficult advertising backdrop, and delivered year-over-year growth in the metrics that matter most for our long-term success. Weekly Active Users increased 6% year-over-year to 40.4 million, and we ended the quarter with approximately 85 million Verified Neighbors, with the largest addition of organic verified neighbors in any quarter in our history,” said Nextdoor CEO Sarah Friar. "Revenue of $56 million increased 4% year-over-year, including accelerating growth from small and medium business customers moving to the Nextdoor Ad Server. For the rest of 2023 and beyond, we remain focused on attracting new Neighbors to the platform, providing the relevant local content to drive engagement, and ensuring value for our advertisers– while building a sustainable business that delivers long-term value for our shareholders."
Today, Nextdoor announced a cost reduction plan, targeting a reduction of the Company’s current GAAP personnel expenses of up to $60M annually, including a 25% reduction in its employee base. “This reduction in our team is the hardest decision we have had to make at Nextdoor” said Sarah Friar. “While our opportunity and belief in the transformative power of community remains unwavering, and our business is financially strong with a healthy balance sheet, we must follow through on our commitment to our shareholders. This means right sizing our business and aligning our team and other expenses with our near term revenue expectations. We expect that these actions will position us to reach quarterly free cash flow breakeven by the end of 2025.”
Nextdoor also announced today that Mike Doyle is resigning from his position as Chief Financial Officer, effective November 7, 2023, following the filing of the Company’s Quarterly Report on Form 10-Q. Doyle will remain at Nextdoor through December 1, 2023, to help ensure a smooth transition. Matt Anderson, Nextdoor’s Head of Finance and Strategy, has been appointed as Chief Financial Officer effective on November 7th. Anderson has been with Nextdoor for the past four years with growing responsibilities within its finance organization, including leading the Investor
Relations function. Prior to joining Nextdoor, Anderson spent six years at Block, Inc. in leadership roles, and prior to joining Block, Inc., Anderson worked in private equity and investment banking.
“I want to thank Mike for his significant contributions to Nextdoor over the last five plus years. Over that time, Mike has led multiple rounds of funding including our public offering and listing on the NYSE and built a leading finance function. Mike will always be a friend and a Nextdoor neighbor, and we wish him all the best in his future endeavors,” said Sarah Friar. “We are in the enviable position of having a deep and talented bench, and I'm thrilled to introduce Matt Anderson as Nextdoor’s next CFO. I have had the privilege of working closely with Matt for more than a decade, including at Block Inc., and I know that he has the experience to be a great CFO,” concluded Friar.
For more detailed information on our operating and financial results for the third quarter ended September 30, 2023, as well as our outlook for Q4 and fiscal year 2023, please reference our Shareholder Letter posted to our Investor Relations website located at investors.nextdoor.com.
| | | | | | | | | | | | | | | | | | | | | | | |
| Three Months Ended September 30, | | Nine Months Ended September 30, |
| (in thousands) | 2023 | | 2022 | | 2023 | | 2022 |
| Revenue | $ | 56,092 | | | $ | 53,954 | | | $ | 162,752 | | | $ | 159,495 | |
| Loss from operations | $ | (44,376) | | | $ | (36,392) | | | $ | (124,630) | | | $ | (107,873) | |
| Net loss | $ | (38,116) | | | $ | (34,717) | | | $ | (107,235) | | | $ | (104,508) | |
Adjusted EBITDA(1) | $ | (19,799) | | | $ | (18,366) | | | $ | (60,065) | | | $ | (58,349) | |
(1) The following is a reconciliation of net loss, the most comparable GAAP measure, to adjusted EBITDA for the periods presented above:
| | | | | | | | | | | | | | | | | | | | | | | |
| Three Months Ended September 30, | | Nine Months Ended September 30, |
| (in thousands) | 2023 | | 2022 | | 2023 | | 2022 |
| Net loss | $ | (38,116) | | | $ | (34,717) | | | $ | (107,235) | | | $ | (104,508) | |
| Depreciation and amortization | 1,451 | | | 1,465 | | | 4,356 | | | 4,169 | |
| Stock-based compensation | 23,343 | | | 17,270 | | | 60,735 | | | 46,957 | |
| Interest income | (6,766) | | | (2,703) | | | (18,635) | | | (5,347) | |
| Provision for income taxes | 289 | | | 319 | | | 714 | | | 380 | |
| Adjusted EBITDA | $ | (19,799) | | | $ | (18,366) | | | $ | (60,065) | | | $ | (58,349) | |
Nextdoor will host a conference call at 2:00 p.m. PT/5:00 p.m. ET today to discuss these results and outlook. A live webcast of our third quarter 2023 earnings release call will be available in the Events & Presentations section of Nextdoor’s Investor Relations website. After the live event, the audio recording for the webcast can be accessed on the same website for approximately one year.
Nextdoor uses its Investor Relations website (investors.nextdoor.com), its Twitter handle (twitter.com/Nextdoor), its LinkedIn Home Page (linkedin.com/company/nextdoor-com), and Sarah Friar’s LinkedIn posts (linkedin.com/in/sarah-friar-922b044) as a means of disseminating or providing notification of, among other things, news or announcements regarding its business or financial performance, investor events, press releases, and earnings releases, and as a means of disclosing material nonpublic information and for complying with its disclosure obligations under Regulation FD.
Non-GAAP Financial Measures
To supplement our condensed consolidated financial statements, which are prepared in accordance with GAAP, we present certain non-GAAP financial measures, such as adjusted EBITDA, in this press release. Our use of non-GAAP financial measures has limitations as an analytical tool, and these measures should not be considered in isolation or as a substitute for analysis of financial results as reported under GAAP.
We use non-GAAP financial measures in conjunction with financial measures prepared in accordance with GAAP for planning purposes, including in the preparation of our annual operating budget, as a measure of our core operating results and the effectiveness of our business strategy, and in evaluating our financial performance. Non-GAAP financial measures provide consistency and comparability with past financial performance, facilitate period-to-period comparisons of core operating results, and also facilitate comparisons with other peer companies, many of which use similar non-GAAP financial measures to supplement their GAAP results. In addition, adjusted EBITDA is widely used by investors and securities analysts to measure a company's operating performance. We exclude the following items from one or more of our non-GAAP financial measures: stock-based compensation expense (non-cash expense calculated by companies using a variety of valuation methodologies and subjective assumptions), depreciation and amortization (non-cash expense), interest income, provision for income taxes, and, if applicable, acquisition-related costs.
Investors are cautioned that there are material limitations associated with the use of non-GAAP financial measures as an analytical tool. In particular, (1) stock-based compensation expense has recently been, and will continue to be for the foreseeable future, a significant recurring expense for our business and an important part of our compensation strategy, (2) although depreciation and amortization expense are non-cash charges, the assets subject to depreciation and amortization may have to be replaced in the future, and our non-GAAP measures do not reflect cash capital expenditure requirements for such replacements or for new capital expenditure requirements, and (3) adjusted EBITDA does not reflect: (a) changes in, or cash requirements for, our working capital needs; (b) interest expense, or the cash requirements necessary to service interest or principal payments on our debt, which reduces cash available to us; or (c) tax payments that may represent a reduction in cash available to us. The non-GAAP measures we use may be different from non-GAAP financial measures used by other companies, limiting their usefulness for comparison purposes. We compensate for these limitations by providing specific information regarding the GAAP items excluded from these non-GAAP financial measures.
About Nextdoor
Nextdoor (NYSE: KIND) is the neighborhood network. Neighbors, businesses of all sizes, and public agencies in more than 315,000 neighborhoods across 11 countries turn to Nextdoor to
connect to the neighborhoods that matter to them so that they can thrive. As a purpose-driven company, Nextdoor leverages innovative technology to cultivate a kinder world where everyone has a neighborhood they can rely on — both online and in the real world. Download the app or join the neighborhood at nexdoor.com. For more information and assets, visit nextdoor.com/newsroom.
Contacts
Nextdoor Investor Relations:
Matt Anderson
John T. Williams
ir@nextdoor.com
or visit investors.nextdoor.com
Nextdoor Media Relations:
David Roady
Antonia Gray
press@nextdoor.com
v3.23.3
| X |
- DefinitionBoolean flag that is true when the XBRL content amends previously-filed or accepted submission.
| Name: |
dei_AmendmentFlag |
| Namespace Prefix: |
dei_ |
| Data Type: |
xbrli:booleanItemType |
| Balance Type: |
na |
| Period Type: |
duration |
|
| X |
- DefinitionFor the EDGAR submission types of Form 8-K: the date of the report, the date of the earliest event reported; for the EDGAR submission types of Form N-1A: the filing date; for all other submission types: the end of the reporting or transition period. The format of the date is YYYY-MM-DD.
| Name: |
dei_DocumentPeriodEndDate |
| Namespace Prefix: |
dei_ |
| Data Type: |
xbrli:dateItemType |
| Balance Type: |
na |
| Period Type: |
duration |
|
| X |
- DefinitionThe type of document being provided (such as 10-K, 10-Q, 485BPOS, etc). The document type is limited to the same value as the supporting SEC submission type, or the word 'Other'.
| Name: |
dei_DocumentType |
| Namespace Prefix: |
dei_ |
| Data Type: |
dei:submissionTypeItemType |
| Balance Type: |
na |
| Period Type: |
duration |
|
| X |
- DefinitionAddress Line 1 such as Attn, Building Name, Street Name
| Name: |
dei_EntityAddressAddressLine1 |
| Namespace Prefix: |
dei_ |
| Data Type: |
xbrli:normalizedStringItemType |
| Balance Type: |
na |
| Period Type: |
duration |
|
| X |
- Definition
+ References
+ Details
| Name: |
dei_EntityAddressCityOrTown |
| Namespace Prefix: |
dei_ |
| Data Type: |
xbrli:normalizedStringItemType |
| Balance Type: |
na |
| Period Type: |
duration |
|
| X |
- DefinitionCode for the postal or zip code
| Name: |
dei_EntityAddressPostalZipCode |
| Namespace Prefix: |
dei_ |
| Data Type: |
xbrli:normalizedStringItemType |
| Balance Type: |
na |
| Period Type: |
duration |
|
| X |
- DefinitionName of the state or province.
| Name: |
dei_EntityAddressStateOrProvince |
| Namespace Prefix: |
dei_ |
| Data Type: |
dei:stateOrProvinceItemType |
| Balance Type: |
na |
| Period Type: |
duration |
|
| X |
- DefinitionA unique 10-digit SEC-issued value to identify entities that have filed disclosures with the SEC. It is commonly abbreviated as CIK. Reference 1: http://www.xbrl.org/2003/role/presentationRef
-Publisher SEC
-Name Exchange Act
-Number 240
-Section 12
-Subsection b-2
| Name: |
dei_EntityCentralIndexKey |
| Namespace Prefix: |
dei_ |
| Data Type: |
dei:centralIndexKeyItemType |
| Balance Type: |
na |
| Period Type: |
duration |
|
| X |
- DefinitionIndicate if registrant meets the emerging growth company criteria. Reference 1: http://www.xbrl.org/2003/role/presentationRef
-Publisher SEC
-Name Exchange Act
-Number 240
-Section 12
-Subsection b-2
| Name: |
dei_EntityEmergingGrowthCompany |
| Namespace Prefix: |
dei_ |
| Data Type: |
xbrli:booleanItemType |
| Balance Type: |
na |
| Period Type: |
duration |
|
| X |
- DefinitionCommission file number. The field allows up to 17 characters. The prefix may contain 1-3 digits, the sequence number may contain 1-8 digits, the optional suffix may contain 1-4 characters, and the fields are separated with a hyphen.
| Name: |
dei_EntityFileNumber |
| Namespace Prefix: |
dei_ |
| Data Type: |
dei:fileNumberItemType |
| Balance Type: |
na |
| Period Type: |
duration |
|
| X |
- DefinitionTwo-character EDGAR code representing the state or country of incorporation.
| Name: |
dei_EntityIncorporationStateCountryCode |
| Namespace Prefix: |
dei_ |
| Data Type: |
dei:edgarStateCountryItemType |
| Balance Type: |
na |
| Period Type: |
duration |
|
| X |
- DefinitionThe exact name of the entity filing the report as specified in its charter, which is required by forms filed with the SEC. Reference 1: http://www.xbrl.org/2003/role/presentationRef
-Publisher SEC
-Name Exchange Act
-Number 240
-Section 12
-Subsection b-2
| Name: |
dei_EntityRegistrantName |
| Namespace Prefix: |
dei_ |
| Data Type: |
xbrli:normalizedStringItemType |
| Balance Type: |
na |
| Period Type: |
duration |
|
| X |
- DefinitionThe Tax Identification Number (TIN), also known as an Employer Identification Number (EIN), is a unique 9-digit value assigned by the IRS. Reference 1: http://www.xbrl.org/2003/role/presentationRef
-Publisher SEC
-Name Exchange Act
-Number 240
-Section 12
-Subsection b-2
| Name: |
dei_EntityTaxIdentificationNumber |
| Namespace Prefix: |
dei_ |
| Data Type: |
dei:employerIdItemType |
| Balance Type: |
na |
| Period Type: |
duration |
|
| X |
- DefinitionLocal phone number for entity.
| Name: |
dei_LocalPhoneNumber |
| Namespace Prefix: |
dei_ |
| Data Type: |
xbrli:normalizedStringItemType |
| Balance Type: |
na |
| Period Type: |
duration |
|
| X |
- DefinitionBoolean flag that is true when the Form 8-K filing is intended to satisfy the filing obligation of the registrant as pre-commencement communications pursuant to Rule 13e-4(c) under the Exchange Act. Reference 1: http://www.xbrl.org/2003/role/presentationRef
-Publisher SEC
-Name Exchange Act
-Number 240
-Section 13e
-Subsection 4c
| Name: |
dei_PreCommencementIssuerTenderOffer |
| Namespace Prefix: |
dei_ |
| Data Type: |
xbrli:booleanItemType |
| Balance Type: |
na |
| Period Type: |
duration |
|
| X |
- DefinitionBoolean flag that is true when the Form 8-K filing is intended to satisfy the filing obligation of the registrant as pre-commencement communications pursuant to Rule 14d-2(b) under the Exchange Act. Reference 1: http://www.xbrl.org/2003/role/presentationRef
-Publisher SEC
-Name Exchange Act
-Number 240
-Section 14d
-Subsection 2b
| Name: |
dei_PreCommencementTenderOffer |
| Namespace Prefix: |
dei_ |
| Data Type: |
xbrli:booleanItemType |
| Balance Type: |
na |
| Period Type: |
duration |
|
| X |
- DefinitionTitle of a 12(b) registered security. Reference 1: http://www.xbrl.org/2003/role/presentationRef
-Publisher SEC
-Name Exchange Act
-Number 240
-Section 12
-Subsection b
| Name: |
dei_Security12bTitle |
| Namespace Prefix: |
dei_ |
| Data Type: |
dei:securityTitleItemType |
| Balance Type: |
na |
| Period Type: |
duration |
|
| X |
- DefinitionName of the Exchange on which a security is registered. Reference 1: http://www.xbrl.org/2003/role/presentationRef
-Publisher SEC
-Name Exchange Act
-Number 240
-Section 12
-Subsection d1-1
| Name: |
dei_SecurityExchangeName |
| Namespace Prefix: |
dei_ |
| Data Type: |
dei:edgarExchangeCodeItemType |
| Balance Type: |
na |
| Period Type: |
duration |
|
| X |
- DefinitionBoolean flag that is true when the Form 8-K filing is intended to satisfy the filing obligation of the registrant as soliciting material pursuant to Rule 14a-12 under the Exchange Act. Reference 1: http://www.xbrl.org/2003/role/presentationRef
-Publisher SEC
-Name Exchange Act
-Section 14a
-Number 240
-Subsection 12
| Name: |
dei_SolicitingMaterial |
| Namespace Prefix: |
dei_ |
| Data Type: |
xbrli:booleanItemType |
| Balance Type: |
na |
| Period Type: |
duration |
|
| X |
- DefinitionTrading symbol of an instrument as listed on an exchange.
| Name: |
dei_TradingSymbol |
| Namespace Prefix: |
dei_ |
| Data Type: |
dei:tradingSymbolItemType |
| Balance Type: |
na |
| Period Type: |
duration |
|
| X |
- DefinitionBoolean flag that is true when the Form 8-K filing is intended to satisfy the filing obligation of the registrant as written communications pursuant to Rule 425 under the Securities Act. Reference 1: http://www.xbrl.org/2003/role/presentationRef
-Publisher SEC
-Name Securities Act
-Number 230
-Section 425
| Name: |
dei_WrittenCommunications |
| Namespace Prefix: |
dei_ |
| Data Type: |
xbrli:booleanItemType |
| Balance Type: |
na |
| Period Type: |
duration |
|
Nextdoor (NYSE:KIND)
Historical Stock Chart
From Apr 2024 to May 2024

Nextdoor (NYSE:KIND)
Historical Stock Chart
From May 2023 to May 2024
