Guess?, Inc. Reports Third Quarter 2003 Financial Results Third
Quarter Earnings Per Share Reach $0.15 Versus $0.02, Excluding
Settlement Proceeds, in 2002 Quarter LOS ANGELES, Oct. 27
/PRNewswire-FirstCall/ -- Guess?, Inc. today reported its financial
results for the third quarter ended September 27, 2003. Third
Quarter Results For the third quarter of 2003, the Company reported
net earnings of $6.7 million, or diluted earnings of $0.15 per
share. This compares to adjusted net earnings of $0.8 million, or
diluted earnings of $0.02 per share, for the third quarter of 2002,
which excludes proceeds of $4.0 million, or $2.6 million net of
tax, from a litigation settlement. Third quarter 2002 net earnings
under Generally Accepted Accounting Principles ("GAAP") were $3.4
million, or diluted earnings of $0.08 per share. A reconciliation
of the adjusted net earnings to GAAP net earnings is attached.
Total net revenue for the third quarter of 2003 increased 5.6% to
$166.7 million from $157.8 million in the third quarter of 2002.
The Company's retail stores, including those in Canada, generated
net revenues of $114.2 million in the 2003 third quarter, a 20.5%
increase from $94.8 million reported in the same period a year ago.
Comparable store sales increased 13.2% during the third quarter of
2003 from the year-ago period. Net revenue from the Company's
wholesale segment decreased 16.6% to $42.4 million in the third
quarter of 2003 from $50.7 million in the same year-ago period.
Licensing segment net revenue decreased 17.5% to $10.1 million in
the 2003 third quarter from $12.3 million in the third quarter last
year. Licensing segment net revenue declined primarily due to
positive prior year licensee audit royalty adjustments. Carlos
Alberini, President and Chief Operating Officer, commented, "We are
pleased with our solid financial performance in the third quarter
which is indicative of the positive trends underway at our Company.
Our current product lines have been well received by our customers,
resulting in sales gains in our stores and good sell-throughs in
all channels. During the period, we continued to manage the
business effectively, driving higher margins and reducing expenses
even as we continued to grow overall sales and open new stores. As
a result of these efforts, all of our business segments had a
positive contribution to our operating profit in the quarter." Nine
Months Results For the nine months ended September 27, 2003, the
Company reported a net loss of $4.5 million, or a diluted loss per
share of $0.10. This compares to an adjusted net loss of $9.3
million, or a diluted loss of $0.21 per share for the 2002
nine-month period, which excludes the litigation settlement
proceeds of $4.0 million, or $2.6 million net of tax. The net loss
for the 2002 nine- month period under GAAP was $6.7 million, or a
diluted loss of $0.15 per share. A reconciliation of the adjusted
net loss to GAAP net loss for the 2002 nine-month period is
attached. Total net revenue increased 5.2% to $437.3 million in the
2003 nine-month period from $415.8 million in the same period in
2002. The Company's retail stores, including those in Canada,
generated net revenue of $293.5 million for the first nine months
of 2003, an increase of 15.8% from $253.5 million for the same
period last year. Comparable store sales increased 8.1% during the
first nine months of 2003 from the year-ago period. Net revenue
from the Company's wholesale segment in the first nine months of
2003 declined by 13.8% to $114.9 million from $133.3 million in the
first nine months of 2002. Licensing segment net revenue for the
2003 nine-month period decreased slightly to $28.9 million from
$29.0 million for the nine-month period in 2002. October Retail
Store Sales Outlook The Company anticipates that October comparable
store sales in its retail stores will increase in the mid single
digit range. The Company will release retail sales for the fiscal
month of October on November 5, 2003, after the market closes. The
Company will hold a conference call at 4:30 pm (ET) on October 27,
2003 to discuss the news announced in this press release. A live
webcast of the conference call will be accessible at
http://www.guess.com/ via the "Investor's Info" link from the
"About Guess, Inc." section of the site. The webcast will be
archived on the website. Guess?, Inc. designs, markets, distributes
and licenses one of the world's leading lifestyle collections of
contemporary apparel, accessories and related consumer products.
Except for historical information contained herein, certain matters
discussed in this press release are forward-looking statements that
are made pursuant to the safe harbor provisions of the Private
Securities Litigation Reform Act of 1995. Forward-looking
statements are only expectations, and involve known and unknown
risks and uncertainties, which may cause actual results in future
periods and other future events to differ materially from what is
currently anticipated. Factors which may cause actual results in
future periods to differ from current expectations include, among
other things, the continued availability of sufficient working
capital, the successful integration of new stores into existing
operations, the continued desirability and customer acceptance of
existing and future product lines (including licensed product
lines), possible cancellations of wholesale orders, the success of
competitive products, and the availability of adequate sources of
capital. In addition to these factors, the economic and other
factors identified in the Company's most recent annual report on
Form 10-K for the fiscal year ended December 31, 2002 including but
not limited to the risk factors discussed therein, could affect the
forward-looking statements contained herein and in the Company's
other public documents. For further information please contact
Carlos Alberini, President & Chief Operating Officer,
+1-213-765-3582, or Frederick G. Silny, SVP & Chief Financial
Officer, +1-213-765-3289, both of Guess?, Inc.; or Molly Morse of
Kekst and Company, +1-212-521-4800, for Guess?, Inc. Guess?, Inc.
and Subsidiaries Condensed Consolidated Statements of Operations
(in thousands, except per share data) (Unaudited) Three Months
Ended September 27, September 28, 2003 2002 $ % $ % Net revenue:
Product sales $156,549 93.9% $145,524 92.2% Net royalties 10,125
6.1% 12,274 7.8% 166,674 100.0% 157,798 100.0% Cost of product
sales 105,078 63.0% 101,039 64.0% Gross profit 61,596 37.0% 56,759
36.0% Selling, general and administrative expenses 48,133 28.9%
51,704 32.8% Litigation settlement --- 0.0% (4,000) (2.5%)
Restructuring, impairment and severance charges --- 0.0% --- 0.0%
Earnings (loss) from operations 13,463 8.1% 9,055 5.7% Other
(income) expense: Interest expense 1,733 1.0% 2,249 1.4% Interest
Income (17) 0.0% (24) (0.0%) Other, net --- 0.0% (129) (0.1%)
Earnings (loss) before income tax (benefit) 11,747 7.0% 6,959 4.4%
Income tax (benefit) 5,050 3.0% 3,585 2.3% Net earnings (loss)
$6,697 4.0% $3,374 2.1% Net earnings (loss) per share: Basic $0.15
$0.08 Diluted $0.15 $0.08 Weighted number of shares outstanding:
Basic 43,237 43,345 Diluted 43,573 43,420 Nine Months Ended
September 27, September 28, 2003 2002 $ % $ % Net revenue: Product
sales $408,435 93.4% $386,781 93.0% Net royalties 28,865 6.6%
28,985 7.0% 437,300 100.0% 415,766 100.0% Cost of product sales
293,368 67.1% 273,483 65.8% Gross profit 143,932 32.9% 142,283
34.2% Selling, general and administrative expenses 144,764 33.1%
150,178 36.1% Litigation settlement --- 0.0% (4,000) (1.0%)
Restructuring, impairment and severance charges 846 0.2% 655 0.2%
Earnings (loss) from operations (1,678) (0.4%) (4,550) (1.1%) Other
(income) expense: Interest expense 6,379 1.4% 6,841 1.6% Interest
Income (100) (0.0%) (177) (0.0%) Other, net (26) (0.0%) (805)
(0.2%) Earnings (loss) before income tax (benefit) (7,931) (1.8%)
(10,409) (2.5%) Income tax (benefit) (3,410) (0.8%) (3,750) (0.9%)
Net earnings (loss) $(4,521) (1.0%) $(6,659) (1.6%) Net earnings
(loss) per share: Basic $(0.10) $(0.15) Diluted $(0.10) $(0.15)
Weighted number of shares outstanding: Basic 43,178 43,499 Diluted
43,178 43,499 Guess?, Inc. and Subsidiaries Reconciliation of Net
Earnings (Loss) to Adjusted Net Earnings (Loss) Before Litigation
Settlement Proceeds (in thousands, except per share data)
(Unaudited) Three Months Ended Nine Months Ended Sept. 27, Sept.
28, Sept. 27, Sept. 28, 2003 2002 2003 2002 Net earnings (loss)
under GAAP $6,697 $3,374 $(4,521) $(6,659) Less Litigation
Settlement proceeds, net of tax --- 2,600 --- 2,600 Adjusted net
earnings (loss) $6,697 $774 $(4,521) $(9,259) Adjusted net earnings
(loss) per share: Basic $0.15 $0.02 $(0.10) $(0.21) Diluted $0.15
$0.02 $(0.10) $(0.21) Weighted number of shares outstanding: Basic
43,237 43,345 43,178 43,499 Diluted 43,573 43,420 43,178 43,499
Guess?, Inc. and Subsidiaries Consolidated Segment Data (in
thousands) (Unaudited) Three Months Ended Nine Months Ended Sept.
27, Sept. 28, Sept. 27, Sept. 28, 2003 2002 2003 2002 Net revenue:
Retail operations $114,196 $94,760 $293,515 $253,518 Wholesale
operations 42,353 50,764 114,920 133,263 Licensing operations
10,125 12,274 28,865 28,985 $166,674 $157,798 $437,300 $415,766
Earnings (loss) from operations: Retail operations $9,489 $1,702
$7,425 $(5,205) Wholesale operations 2,439 3,512 (5,689) 6,249
Licensing operations 8,464 9,496 23,175 21,231 Corporate overhead
(Note 1) (6,929) (5,655) (26,589) (26,825) $13,463 $9,055 $(1,678)
$(4,550) Note 1: Corporate overhead for both the three and nine
months ended September 28, 2002, is net of proceeds of $4.0 million
from a litigation settlement in the third quarter of 2002. Guess?,
Inc. and Subsidiaries Selected Condensed Consolidated Balance Sheet
Data (in thousands) (Unaudited) September 27, December 31,
September 28, 2003 2002 2002 ASSETS Cash and cash equivalents
$12,384 $31,753 $7,907 Restricted cash 4,748 --- --- Receivables,
net 41,166 35,437 53,349 Inventories, net 104,671 95,683 106,304
Other current assets 30,577 26,114 25,327 Property and equipment,
net 119,742 128,097 138,235 Other assets 31,040 32,448 29,188 Total
Assets $344,328 $349,532 $360,310 LIABILITIES AND STOCKHOLDERS'
EQUITY Current installments of notes payable and long-term debt
$14,111 $80,138 $5,967 Other current liabilities 91,726 87,423
91,460 Notes payable and long-term debt, excluding current
installments 58,222 1,480 79,991 Other liabilities 14,330 14,211
12,510 Stockholders' equity 165,939 166,280 170,382 Total
Liabilities and Stockholders' Equity $344,328 $349,532 $360,310
Guess?, Inc. and Subsidiaries Condensed Consolidated Cash Flow Data
(in thousands) (Unaudited) Nine Months Ended September 27,
September 28, 2003 2002 Net cash provided by (used in) operating
activities $2,490 $(1,529) Net cash used in investing activities
(14,440) (19,172) Net cash used in financing activities (7,801)
(3,328) Effect of exchange rates on cash 382 66 Net decrease in
cash and cash equivalents (19,369) (23,963) Cash and cash
equivalents at the beginning of the year 31,753 31,870 Cash and
cash equivalents at the end of the period $12,384 $7,907
Supplemental information: Depreciation and amortization $26,102
$29,467 Rent 43,725 38,999 Guess?, Inc. and Subsidiaries Retail
Store Data Nine Months Ended September 27, September 28, 2003 2002
Number of stores at the beginning of the year 249 227 Store
openings 12 16 Store closures (3) (1) Number of stores at the end
of the period 258 242 Total store square footage at the end of the
period 1,329,000 1,239,000 DATASOURCE: Guess?, Inc. CONTACT: Carlos
Alberini, President & Chief Operating Officer, +1-213-765-3582,
or Frederick G. Silny, SVP & Chief Financial Officer,
+1-213-765-3289, both of Guess?, Inc.; or Molly Morse of Kekst and
Company, +1-212-521-4800, for Guess?, Inc. Web site:
http://www.guess.com/
Copyright
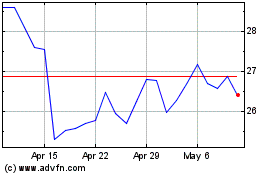
Guess (NYSE:GES)
Historical Stock Chart
From Jun 2024 to Jul 2024

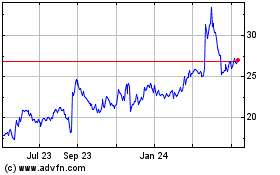
Guess (NYSE:GES)
Historical Stock Chart
From Jul 2023 to Jul 2024
