0001059142false00010591422023-11-092023-11-09
UNITED STATES
SECURITIES AND EXCHANGE COMMISSION
WASHINGTON, D.C. 20549
FORM 8-K
CURRENT REPORT
Pursuant to Section 13 or 15(d) of the Securities Exchange Act of 1934
|
Date of Report (Date of earliest event reported): November 9, 2023 |
Greystone Housing Impact Investors LP
(Exact name of Registrant as Specified in Its Charter)
|
|
|
|
|
Delaware |
001-41564 |
47-0810385 |
(State or Other Jurisdiction
of Incorporation) |
(Commission File Number) |
(IRS Employer
Identification No.) |
|
|
|
|
|
14301 FNB Parkway, Suite 211 |
|
Omaha, Nebraska |
|
68154 |
(Address of Principal Executive Offices) |
|
(Zip Code) |
|
Registrant’s Telephone Number, Including Area Code: 402 952-1235 |
(Former Name or Former Address, if Changed Since Last Report)
Check the appropriate box below if the Form 8-K filing is intended to simultaneously satisfy the filing obligation of the registrant under any of the following provisions:
|
|
☐ |
Written communications pursuant to Rule 425 under the Securities Act (17 CFR 230.425) |
☐ |
Soliciting material pursuant to Rule 14a-12 under the Exchange Act (17 CFR 240.14a-12) |
☐ |
Pre-commencement communications pursuant to Rule 14d-2(b) under the Exchange Act (17 CFR 240.14d-2(b)) |
☐ |
Pre-commencement communications pursuant to Rule 13e-4(c) under the Exchange Act (17 CFR 240.13e-4(c)) |
Securities registered pursuant to Section 12(b) of the Act:
|
|
|
|
|
Title of each class
|
|
Trading
Symbol(s) |
|
Name of each exchange on which registered
|
Beneficial Unit Certificates representing assignments of limited partnership interests in Greystone Housing Impact Investors LP |
|
GHI |
|
New York Stock Exchange |
Indicate by check mark whether the registrant is an emerging growth company as defined in Rule 405 of the Securities Act of 1933 (§ 230.405 of this chapter) or Rule 12b-2 of the Securities Exchange Act of 1934 (§ 240.12b-2 of this chapter).
Emerging growth company ☐
If an emerging growth company, indicate by check mark if the registrant has elected not to use the extended transition period for complying with any new or revised financial accounting standards provided pursuant to Section 13(a) of the Exchange Act. ☐
Item 7.01. Regulation FD Disclosure.
On November 9, 2023, Greystone Housing Impact Investors LP (the “Partnership”) is providing the information which is included in this Current Report on Form 8-K (including Exhibit 99.1 hereto) with respect to supplemental financial information for the Partnership on the Partnership’s website, www.ghiinvestors.com. This information includes selected financial and operations information from the third quarter of 2023 and does not represent a complete set of financial statements and related notes prepared in conformity with generally accepted accounting principles (“GAAP”). Most, but not all, of the selected financial information furnished herein is derived from the Partnership’s consolidated financial statements and related notes prepared in accordance with GAAP and management’s discussion and analysis of financial condition and results of operations included in the Partnership’s reports on Forms 10-K and 10-Q.
The information included in this Current Report on Form 8-K (including Exhibit 99.1 hereto) that is furnished pursuant to this Item 7.01 shall not be deemed to be “filed” for the purposes of Section 18 of the Securities and Exchange Act of 1934, as amended, or otherwise subject to the liabilities of that Section or Sections 11 and 12(a)(2) of the Securities Act of 1933, as amended. The information contained in this Item and in the accompanying Exhibit 99.1 shall not be incorporated by reference into any filing of the Partnership, whether made before or after the date hereof, regardless of any general incorporation language in such filing, unless expressly incorporated by specific reference into such filing.
Item 9.01 Financial Statements and Exhibits.
(a) Not applicable.
(b) Not applicable.
(c) Not applicable.
(d) Exhibits.
SIGNATURES
Pursuant to the requirements of the Securities Exchange Act of 1934, the registrant has duly caused this report to be signed on its behalf by the undersigned thereunto duly authorized.
|
|
|
|
|
|
|
Greystone Housing Impact Investors LP |
|
|
|
|
Date: |
November 9, 2023 |
By: |
/s/ Jesse A. Coury |
|
|
|
Printed: Jesse A. Coury
Title: Chief Financial Officer |
Exhibit 99.1

Supplemental Financial Report for the
Quarter Ended September 30, 2023
|
|
©2023 Greystone & Co. II LLC. All rights reserved. References to the term “Greystone,” refer to Greystone & Co. II LLC and/or its affiliated companies, as applicable. |

|
|
|
Supplemental Financial Report for the Quarter Ended September 30, 2023 
|

|
Partnership Financial Information
TABLE OF CONTENTS
|
|
Letter from the CEO |
3 |
Quarterly Fact Sheet |
5 |
Financial Performance Information |
6 |
Appendices |
18 |
Important Disclosure Notices |
22 |
Other Partnership Information |
24 |
|
|
© 2023 Greystone & Co. II LLC |
 2 2
|
|
|
Supplemental Financial Report for the Quarter Ended September 30, 2023 |
|
Letter from the CEO
I am pleased to report Greystone Housing Impact Investors LP’s operating results for the third quarter of 2023. We reported the following financial results as of and for the three months ended September 30, 2023:
•Total revenues of $26.5 million
•Net income of $0.39 per Beneficial Unit Certificate (“BUC”), basic and diluted
•Cash Available for Distribution (“CAD”) of $0.25 per BUC
•Total assets of $1.55 billion
•Total Mortgage Revenue Bond (“MRB”) and Governmental Issuer Loan (“GIL”) investments of $1.1 billion
We reported the following notable transactions during the third quarter of 2023:
•Advanced funds on MRB and taxable MRB investments totaling $11.7 million.
•Advanced funds on GIL and property loan investments totaling $34.5 million.
•Advanced funds to joint venture equity investments totaling $10.2 million, which includes funds advanced to The Jessam at Hays Farm, our first investment with a new multifamily developer partner.
•Freddie Mac executed forward purchases of three GIL investments during the quarter. The Partnership’s GIL and property loan investments totaling $109.4 million associated with construction financing were settled in full at par plus accrued interest.
•Received TOB trust financing proceeds totaling $41.5 million as leverage on various investment fundings.
We continue to strategically invest in the affordable multifamily MRB and GIL asset classes where we believe we can earn attractive leveraged returns. We also continue to see consistent operating results from the properties underlying our affordable multifamily MRBs and GILs, with all such investments being current on contractual principal and interest payments as of September 30, 2023.
Other highlights of our investment portfolio include the following:
•We continue to execute on our hedging strategy, primarily through the use of interest rate swaps, to reduce the impact of volatile market interest rates. We received net swap payments of approximately $1.7 million and $3.8 million during the three and nine months ended September 30, 2023, respectively.
|
|
© 2023 Greystone & Co. II LLC |
3 |
|
|
Supplemental Financial Report for the Quarter Ended September 30, 2023 |
|
•Two joint venture equity investment properties were at least 90% occupied as of September 30, 2023 and two other properties have begun leasing activities. Seven of the Partnership’s joint venture equity investments are currently under construction or in development, with none having experienced material supply chain disruptions for either construction materials or labor to date. One stabilized property has been listed for sale by the managing member.
•We directly own the Suites on Paseo MF Property near San Diego State University. The property continues to meet all direct obligations with cash flows from operations and was 100% occupied as of September 30, 2023. We negotiated a master lease with San Diego State University for 140 beds for the 2023-2024 academic year.
In November 2023, we completed a new secured financing transaction (the “TEBS Residual Financing”) secured by our residual interests in three Freddie Mac Tax Exempt Bond Securitization financings (“TEBS Financings”). The transaction involved the sale of the TEBS Financings residual interests to a governmental entity, which then issued and sold $61.5 million of senior Affordable Housing Multifamily Certificates to unaffiliated investors. We retained $20.5 million of residual Affordable Housing Multifamily Certificates as part of the transaction. We received net proceeds of approximately $60.4 million after payment of transaction-related costs. The $61.5 million of senior Affordable Housing Multifamily Certificates represent secured financing of the Partnership for financial reporting purposes. The senior Affordable Housing Multifamily Certificate holders are entitled to interest at a fixed rate of 7.125% per annum as well as certain principal payments from the assets within the TEBS Residual Financing. The TEBS Residual Financing has a maximum term ending in July 2034. The Partnership used $57.9 million of the net proceeds to pay down existing variable-rate corporate debt with a higher interest rate and a shorter maturity.
The closing of the TEBS Residual Financing provides many benefits to the Partnership. This new debt financing provides non-recourse, non-mark-to-market financing that generates effective interest cost savings of approximately 3.9% per annum compared to our prior variable-rate corporate debt which was secured by the same collateral. We have also successfully extended the term of the financing by approximately nine years.
We have noticed traditional bank lenders are offering less credit or imposing more restrictive terms on borrowers, creating new opportunities for us to pursue beyond our traditional pipeline. We will continue to strategically work with strong sponsors on new investment opportunities where traditional sources of capital may not currently be available. We will also continue to seek to develop new relationships, particularly with those sponsors that are existing clients of Greystone and its affiliates.
Thank you for your continued support of Greystone Housing Impact Investors LP!
Kenneth C. Rogozinski
Chief Executive Officer
|
|
© 2023 Greystone & Co. II LLC |
4 |
|
|
Supplemental Financial Report for the Quarter Ended September 30, 2023 |
|
Third Quarter 2023 Fact Sheet
|
|
|
|
|
|
|
PARTNERSHIP DETAILS |
|
Greystone Housing Impact Investors LP was formed for the primary purpose of acquiring a portfolio of MRBs that are issued to provide construction and/or permanent financing of affordable multifamily residential and commercial properties. We also invest in GILs, which are similar to MRBs, to provide construction financing for affordable multifamily properties. We expect and believe the interest paid on the MRBs and GILs to be excludable from gross income for federal income tax purposes. In addition, we have invested in equity interests in multifamily, market rate properties throughout the U.S. We also own interests in multifamily properties (“MF Properties”) until the “highest and best use” can be determined. We continue to pursue a business strategy of acquiring additional MRBs and GILs on a leveraged basis, and other investments. |
(As of September 30, 2023) |
|
|
|
Symbol (NYSE) |
|
|
GHI |
|
Most Recent Quarterly Distribution per BUC (1) |
$ |
0.44 |
|
|
|
|
|
BUC Price |
$ |
15.45 |
|
Year to Date Annualized Yield (2) |
|
10.8% |
|
|
|
|
|
|
BUCs Outstanding |
|
|
22,734,375 |
|
Market Capitalization |
|
$ |
$351,246,094 |
|
52-week BUC price range |
|
$15.07 to $19.28 |
|
|
|
|
|
|
|
|
|
|
|
Partnership Financial Information for Q3 2023 ($’s in 000’s, except per BUC amounts) |
|
|
9/30/2023 |
|
12/31/2022 |
|
|
|
|
|
|
Total Assets |
$1,546,331 |
|
$1,567,130 |
|
Leverage Ratio (3) |
72% |
|
73% |
|
|
|
|
|
|
|
Q3 2023 |
|
YTD 2023 |
|
|
|
|
|
|
Total Revenue |
$26,474 |
|
$79,716 |
|
Net Income |
$9,729 |
|
$47,808 |
|
Cash Available for Distribution (“CAD”) (4) |
$5,602 |
|
$37,953 |
|
Cash Distributions declared, per BUC (1) |
$0.368 |
|
$1.102 |
|
BUCs Distributions declared, per BUC (1) |
$0.070 |
|
$0.139 |
|
(1)The distribution was paid on October 31, 2023 for BUC holders of record as of September 29, 2023. The distribution is payable to BUC holders of record as of the last business day of the quarter end and GHI trades ex-dividend one day prior to the record date, with a payable date of the last business day of the subsequent month. The distribution includes the regular quarterly cash distribution of $0.37 per outstanding BUC and a supplemental distribution payable in the form of additional BUCs equal to $0.07 per BUC. The supplemental BUCs Distribution was paid at a ratio of 0.00418 BUCs for each issued and outstanding BUC as of the record date. The amounts above have been retroactively adjusted to reflect the BUCs distribution as of the beginning of the periods presented.
(2)The annualized yield calculation is based on year-to-date distributions declared of $1.25 per BUC.
(3)Our overall leverage ratio is calculated as total outstanding debt divided by total assets using cost adjusted for paydowns and allowances for MRBs, Governmental Issuer Loans, property loans, taxable MRBs and taxable GILs, and initial cost for deferred financing costs and real estate assets.
(4)Management utilizes a calculation of Cash Available for Distribution (“CAD”) to assess the Partnership’s operating performance. This is a non-GAAP financial measure. See the Important Disclosure Notices in the Appendices for important information regarding non-GAAP measures. A reconciliation of our GAAP net income (loss) to CAD is provided on page 20 of this report.
|
|
© 2023 Greystone & Co. II LLC |
5 |
|
|
Supplemental Financial Report for the Quarter Ended September 30, 2023 |
|
Operating Results Summary
(Dollar amounts in thousands, except per BUC information)
|
|
|
|
|
|
|
|
|
|
|
|
|
|
|
|
|
|
|
|
|
|
|
Q3 2022 |
|
|
Q4 2022 |
|
|
Q1 2023 |
|
|
Q2 2023 |
|
|
Q3 2023 |
|
Total revenues |
|
$ |
22,604 |
|
|
$ |
22,030 |
|
|
$ |
24,938 |
|
|
$ |
28,304 |
|
|
$ |
26,474 |
|
Total expenses |
|
|
(14,750 |
) |
|
|
(19,002 |
) |
|
|
(23,506 |
) |
|
|
(14,344 |
) |
|
|
(16,771 |
) |
Gain on sale of investments in unconsolidated entities |
|
|
10,581 |
|
|
|
141 |
|
|
|
15,367 |
|
|
|
7,326 |
|
|
|
32 |
|
Income tax (expense) benefit |
|
|
82 |
|
|
|
6 |
|
|
|
(7 |
) |
|
|
1 |
|
|
|
(6 |
) |
Net income |
|
$ |
18,517 |
|
|
$ |
3,175 |
|
|
$ |
16,792 |
|
|
$ |
21,287 |
|
|
$ |
9,729 |
|
|
|
|
|
|
|
|
|
|
|
|
|
|
|
|
|
Per BUC operating metrics(1): |
|
|
|
|
|
|
|
|
|
|
|
|
|
|
|
Net income |
|
$ |
0.79 |
|
|
$ |
0.09 |
|
|
$ |
0.60 |
|
|
$ |
0.85 |
|
|
$ |
0.39 |
|
Cash available for distribution |
|
$ |
0.53 |
|
|
$ |
0.15 |
|
|
$ |
0.81 |
|
|
$ |
0.62 |
|
|
$ |
0.25 |
|
|
|
|
|
|
|
|
|
|
|
|
|
|
|
|
|
Per BUC distribution information(1): |
|
|
|
|
|
|
|
|
|
|
|
|
|
|
|
Cash distributions declared |
|
$ |
0.37 |
|
|
$ |
0.47 |
|
|
$ |
0.37 |
|
|
$ |
0.37 |
|
|
$ |
0.37 |
|
BUC distributions declared |
|
|
0.20 |
|
|
|
0.20 |
|
|
|
- |
|
|
|
0.07 |
|
|
|
0.07 |
|
Total distributions declared |
|
$ |
0.57 |
|
|
$ |
0.67 |
|
|
$ |
0.37 |
|
|
$ |
0.44 |
|
|
$ |
0.44 |
|
|
|
|
|
|
|
|
|
|
|
|
|
|
|
|
|
Weighted average BUCs outstanding |
|
|
22,247,781 |
|
|
|
22,501,386 |
|
|
|
22,538,928 |
|
|
|
22,639,852 |
|
|
|
22,734,412 |
|
BUCs outstanding, end of period |
|
|
22,247,781 |
|
|
|
22,539,029 |
|
|
|
22,538,878 |
|
|
|
22,639,852 |
|
|
|
22,734,375 |
|
(1)Per BUC metrics are presented as initially reported and have not been retrospectively adjusted for subsequent distributions payable in the form of additional BUCs.
|
|
© 2023 Greystone & Co. II LLC |
6 |
|
|
Supplemental Financial Report for the Quarter Ended September 30, 2023 |
|
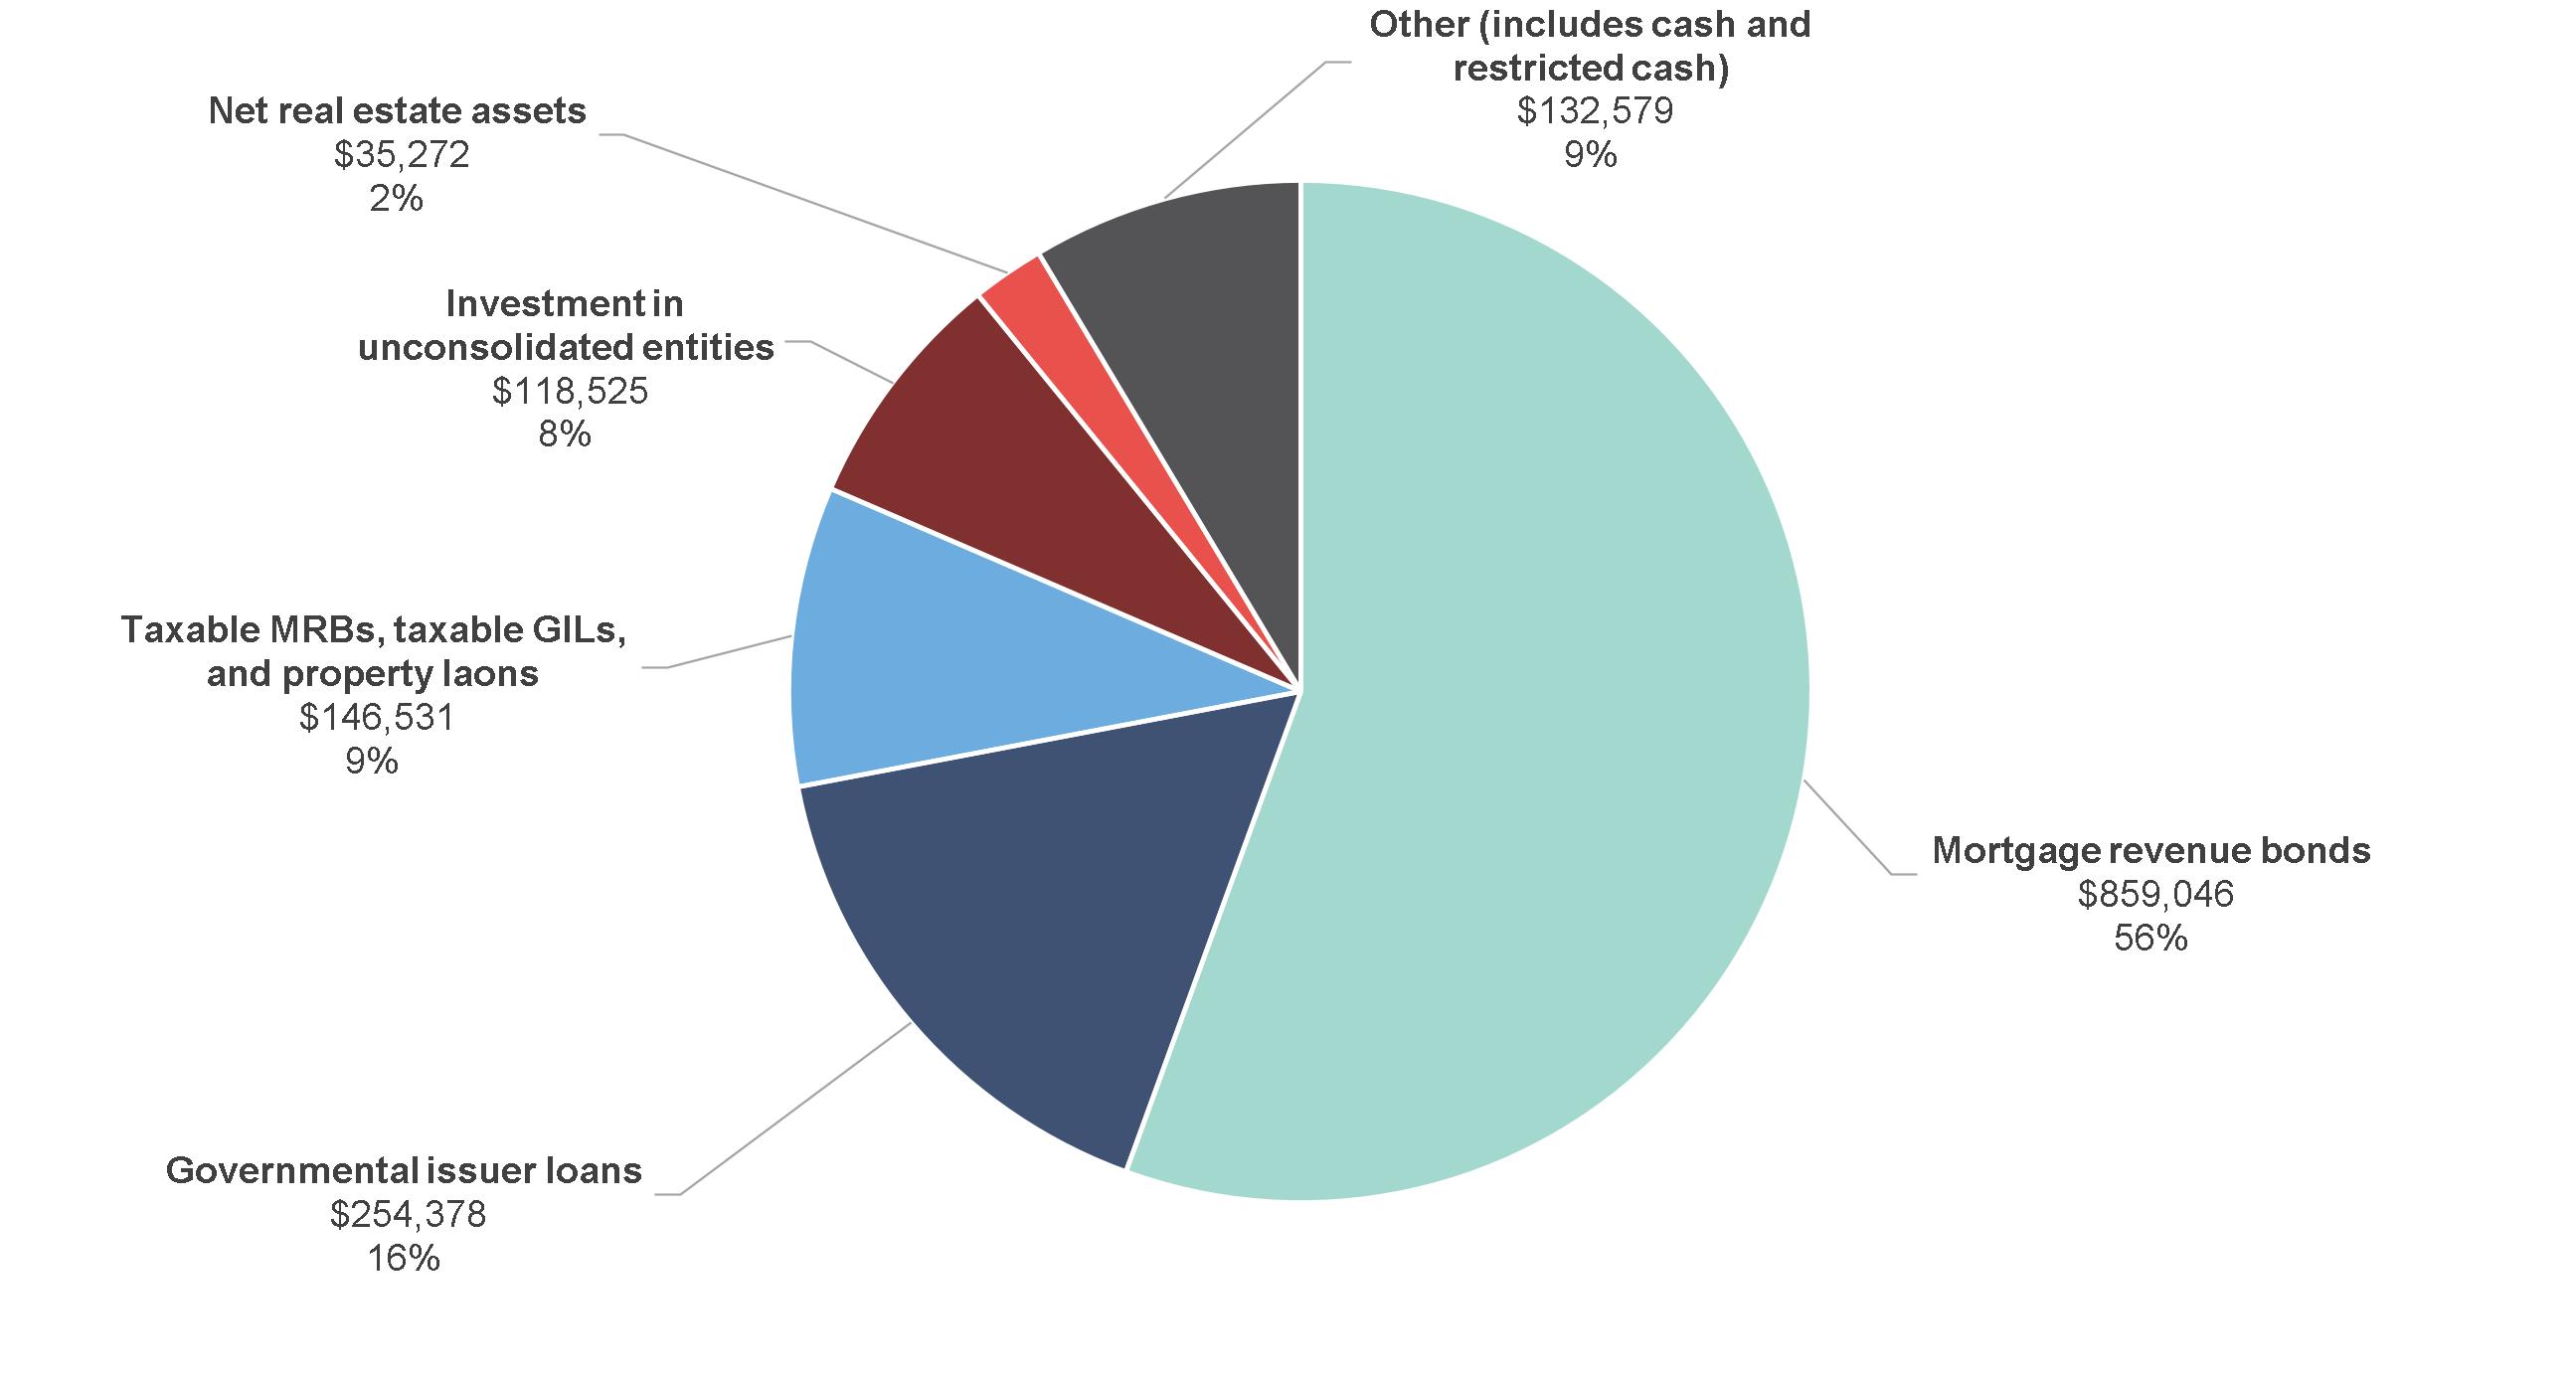
Asset Profile
(Dollar amounts in thousands)
|
|
© 2023 Greystone & Co. II LLC |
7 |
|
|
Supplemental Financial Report for the Quarter Ended September 30, 2023 |
|
Mortgage Investments to Total Assets Profile
(Dollar amounts in thousands)
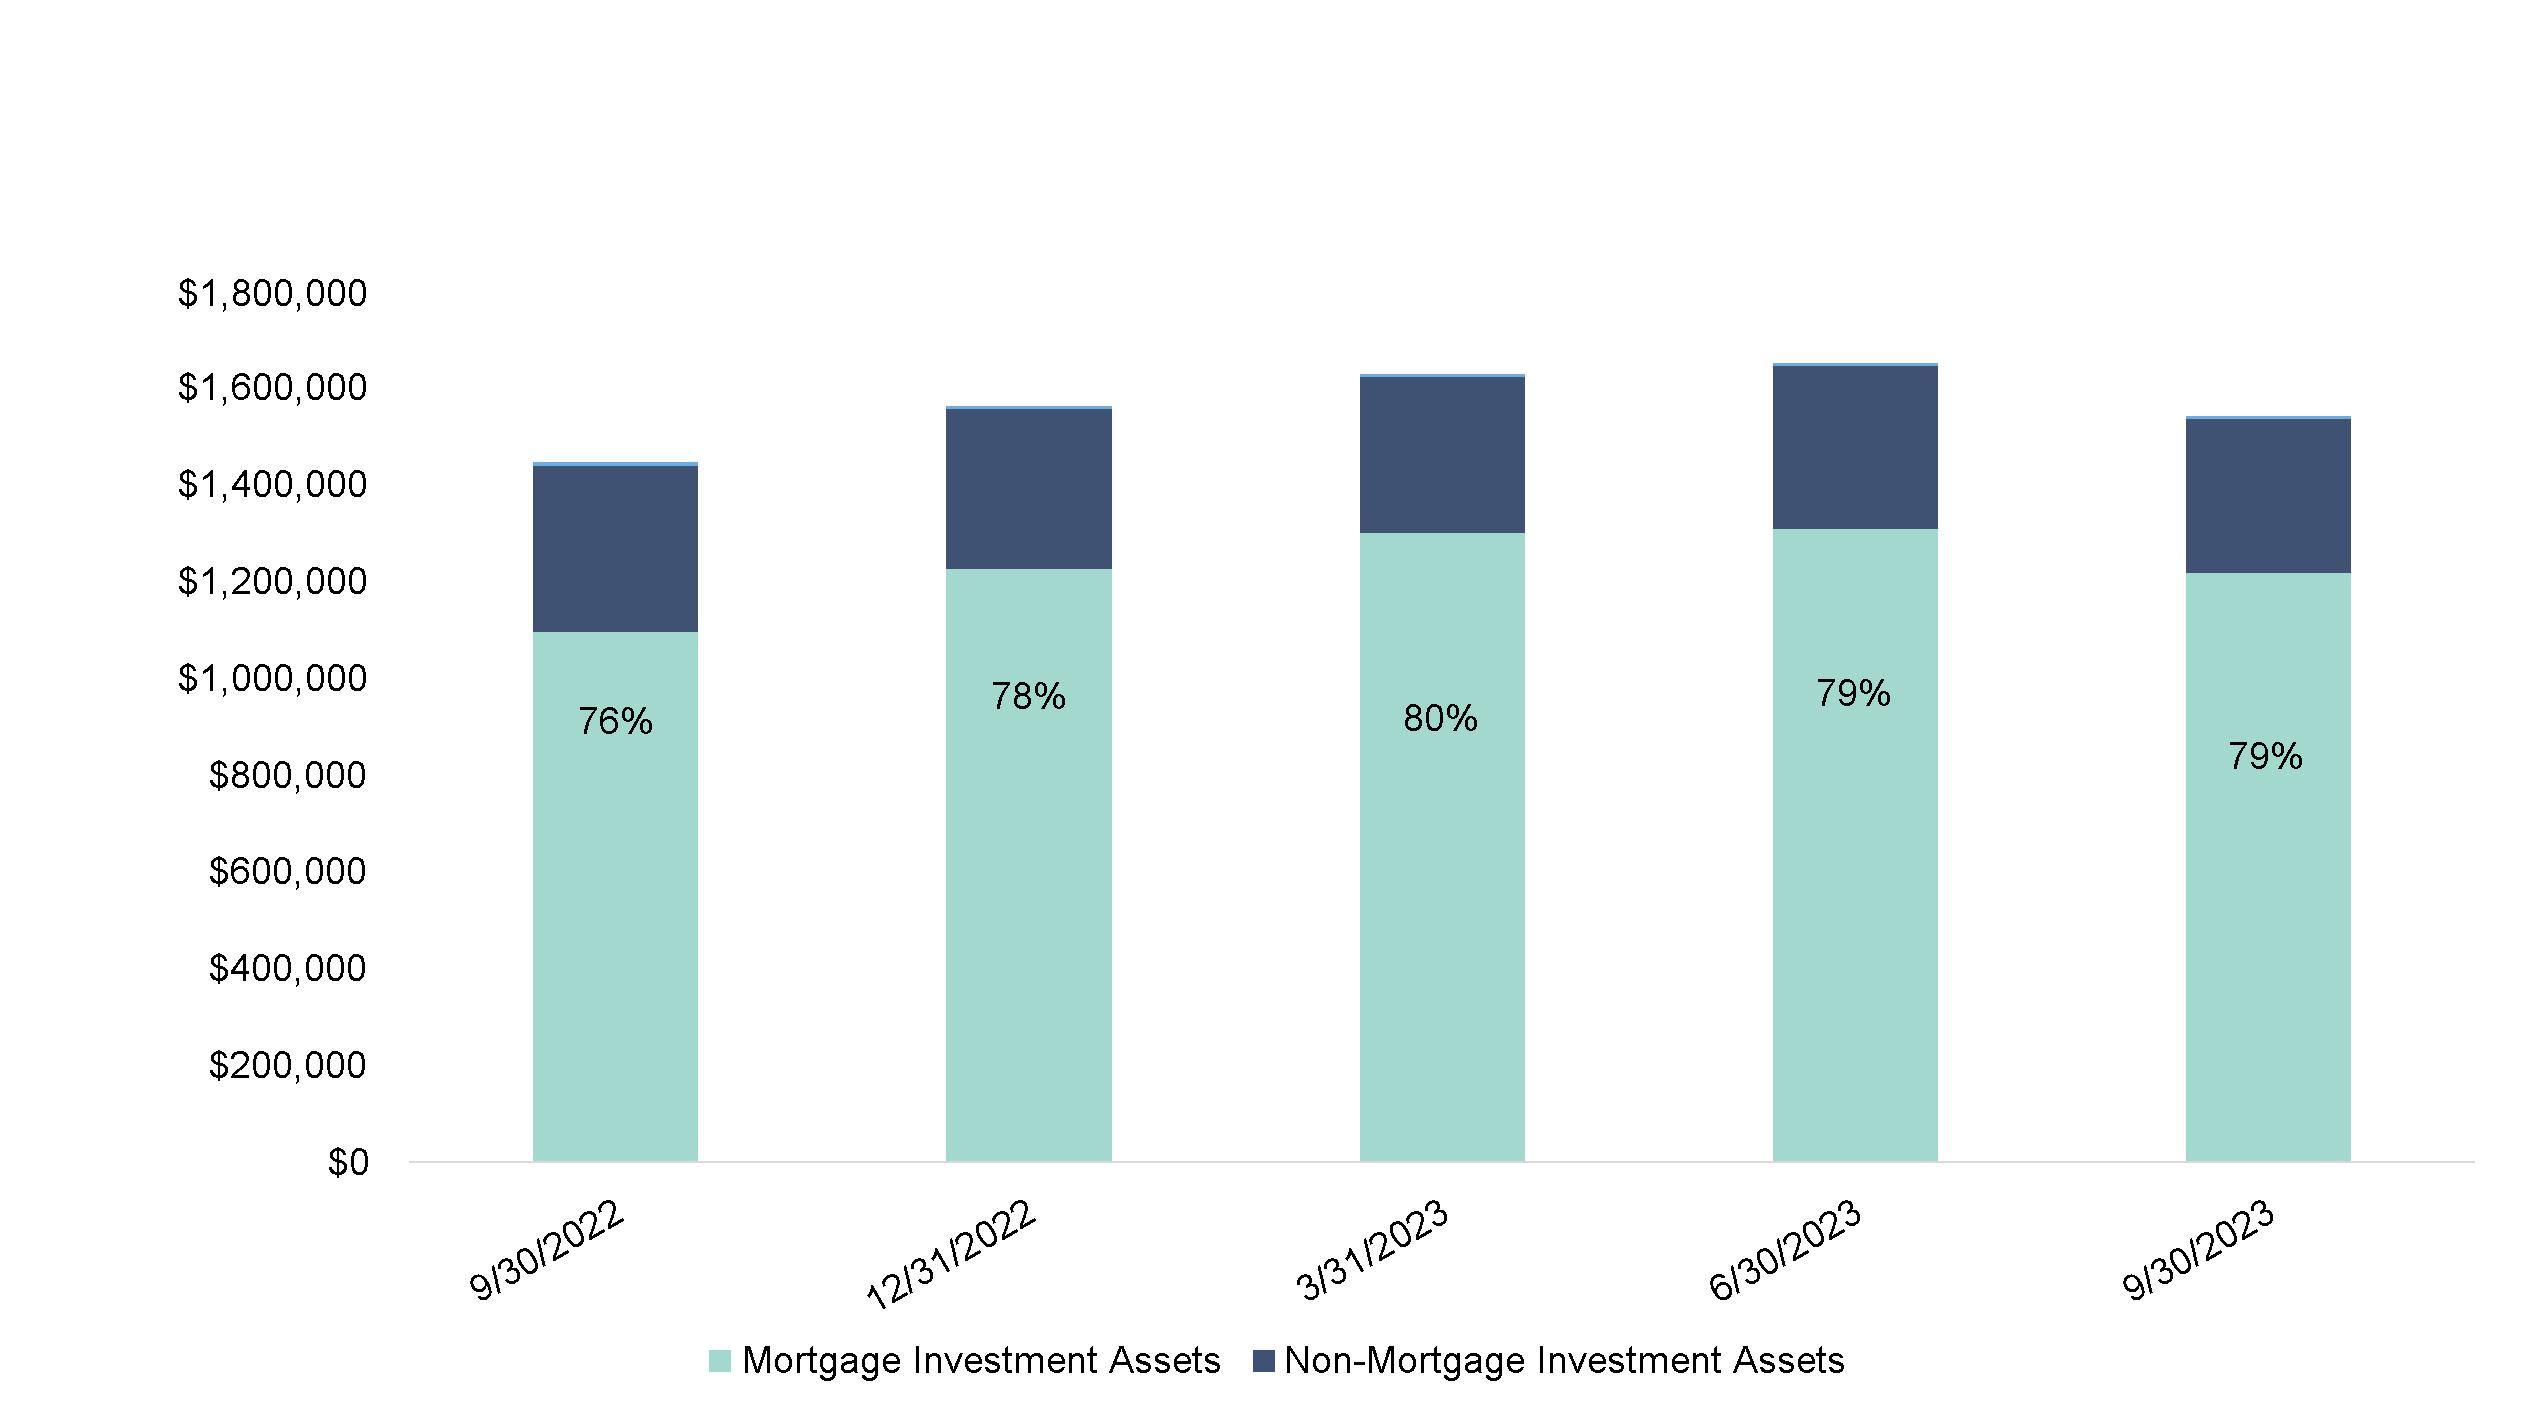
Note: Mortgage Investments include the Partnership’s Mortgage Revenue Bonds, Governmental Issuer Loans, Taxable Mortgage Revenue
Bonds, Taxable Governmental Issuer Loans, and Property Loans that share a first mortgage lien with the Governmental Issuer Loans.
|
|
© 2023 Greystone & Co. II LLC |
8 |
|
|
Supplemental Financial Report for the Quarter Ended September 30, 2023 |
|
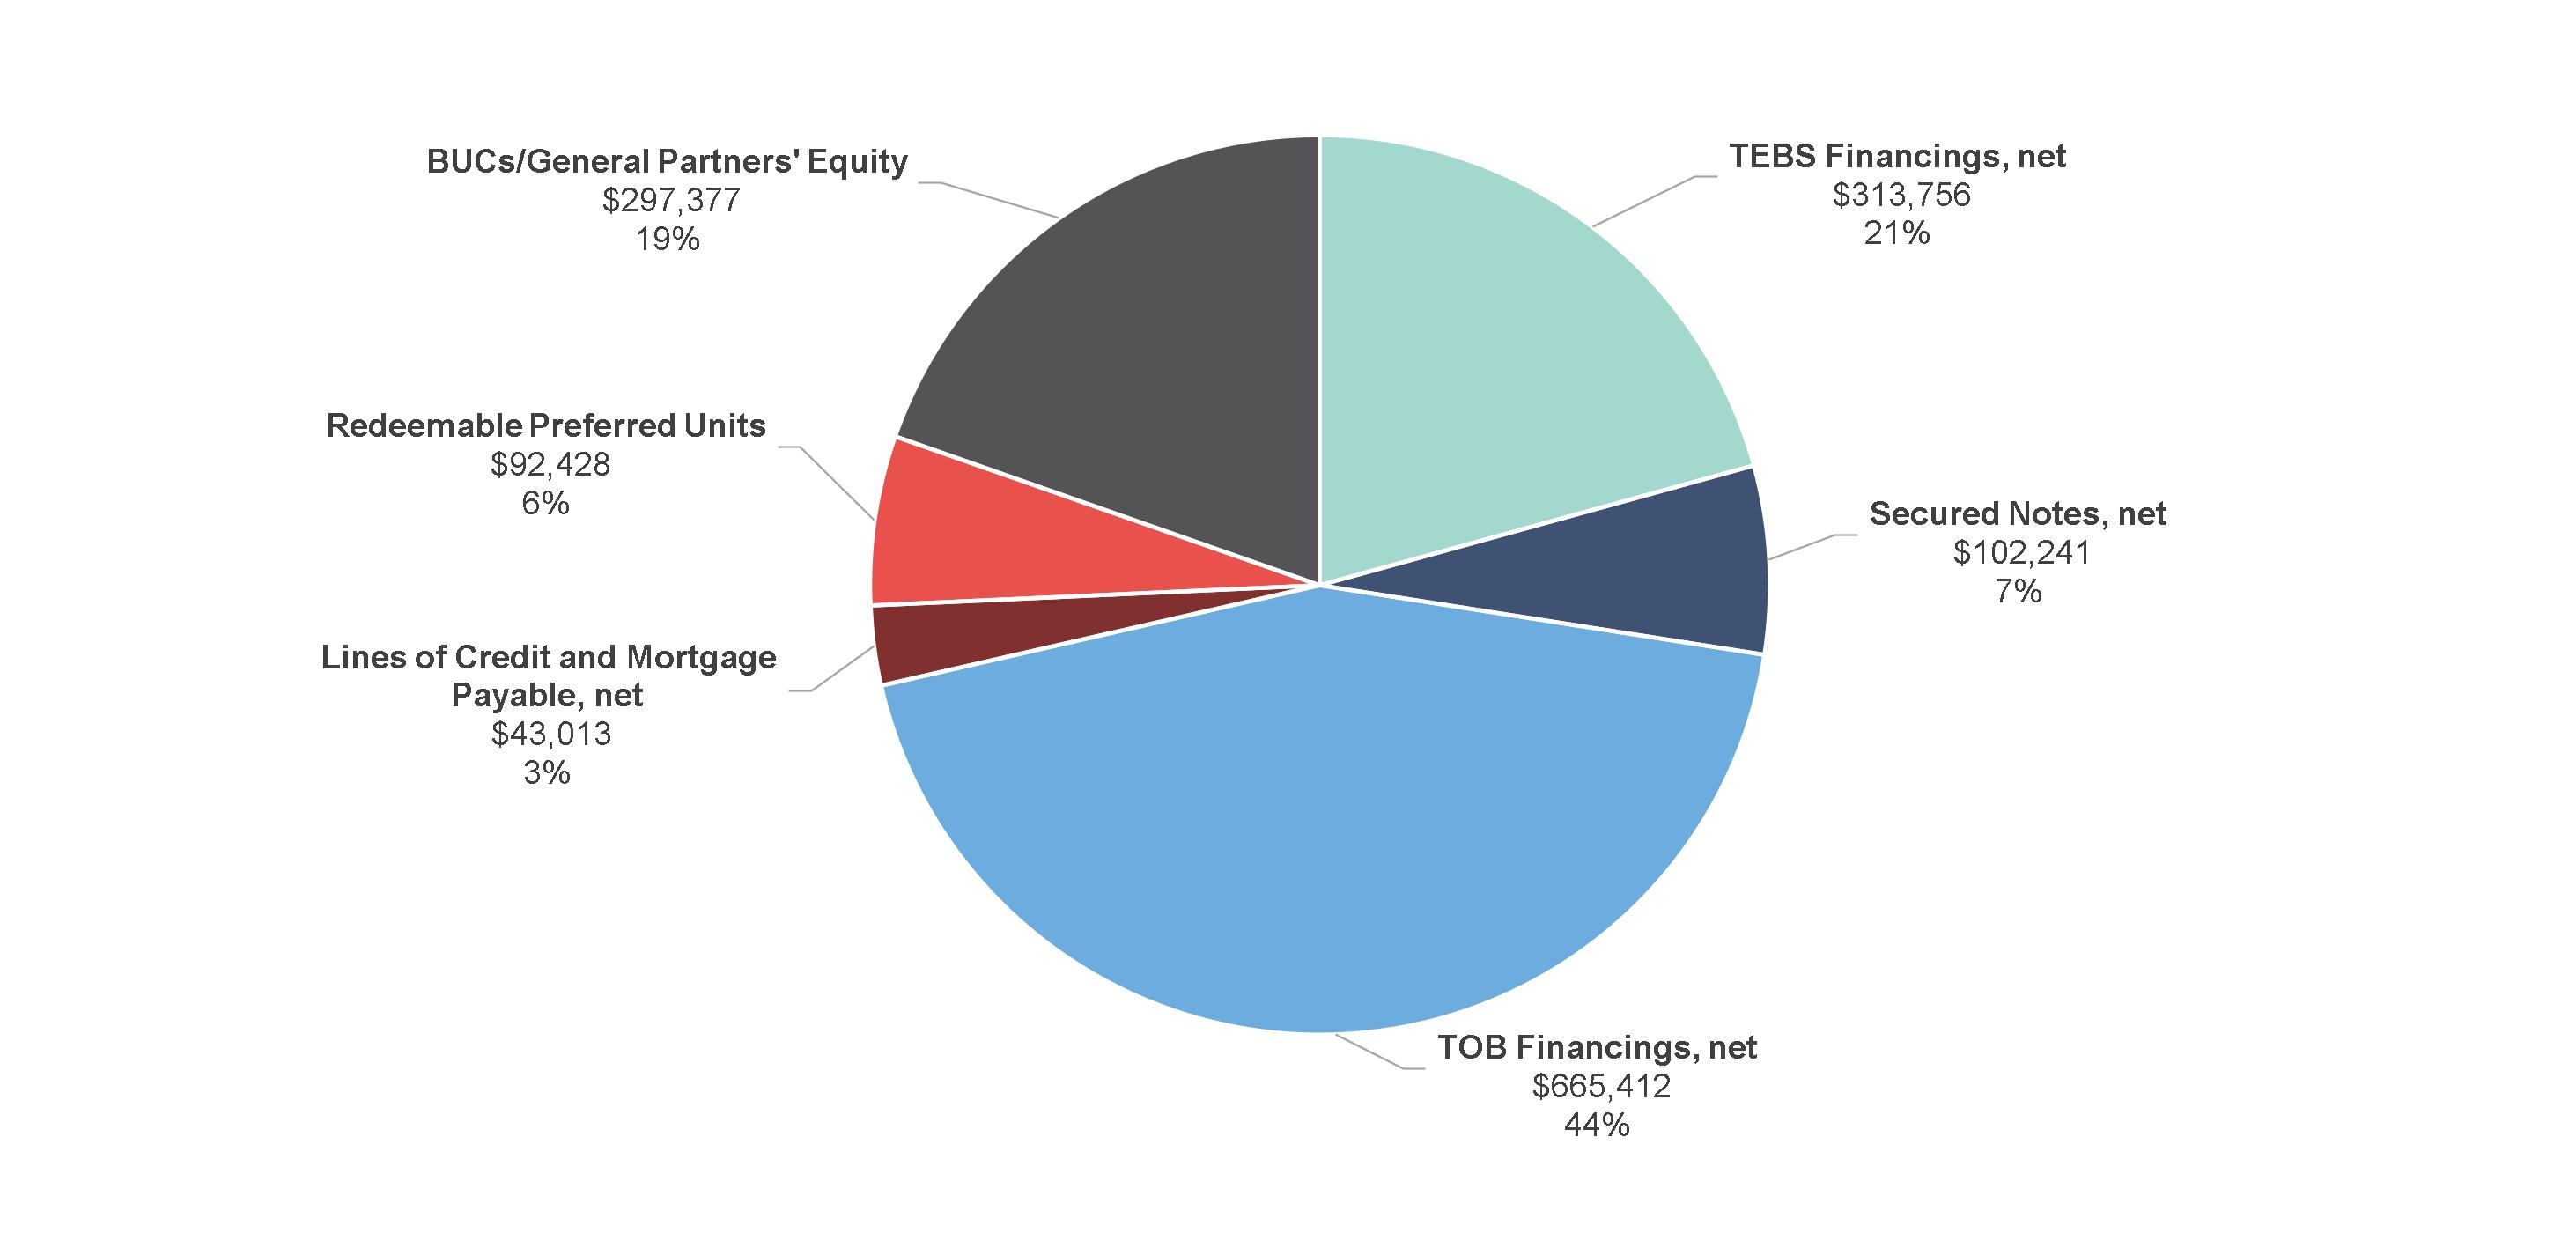
Debt and Equity Profile
(Dollar amounts in thousands)
|
|
© 2023 Greystone & Co. II LLC |
9 |
|
|
Supplemental Financial Report for the Quarter Ended September 30, 2023 |
|
Debt Financing
(Dollar amounts in thousands)
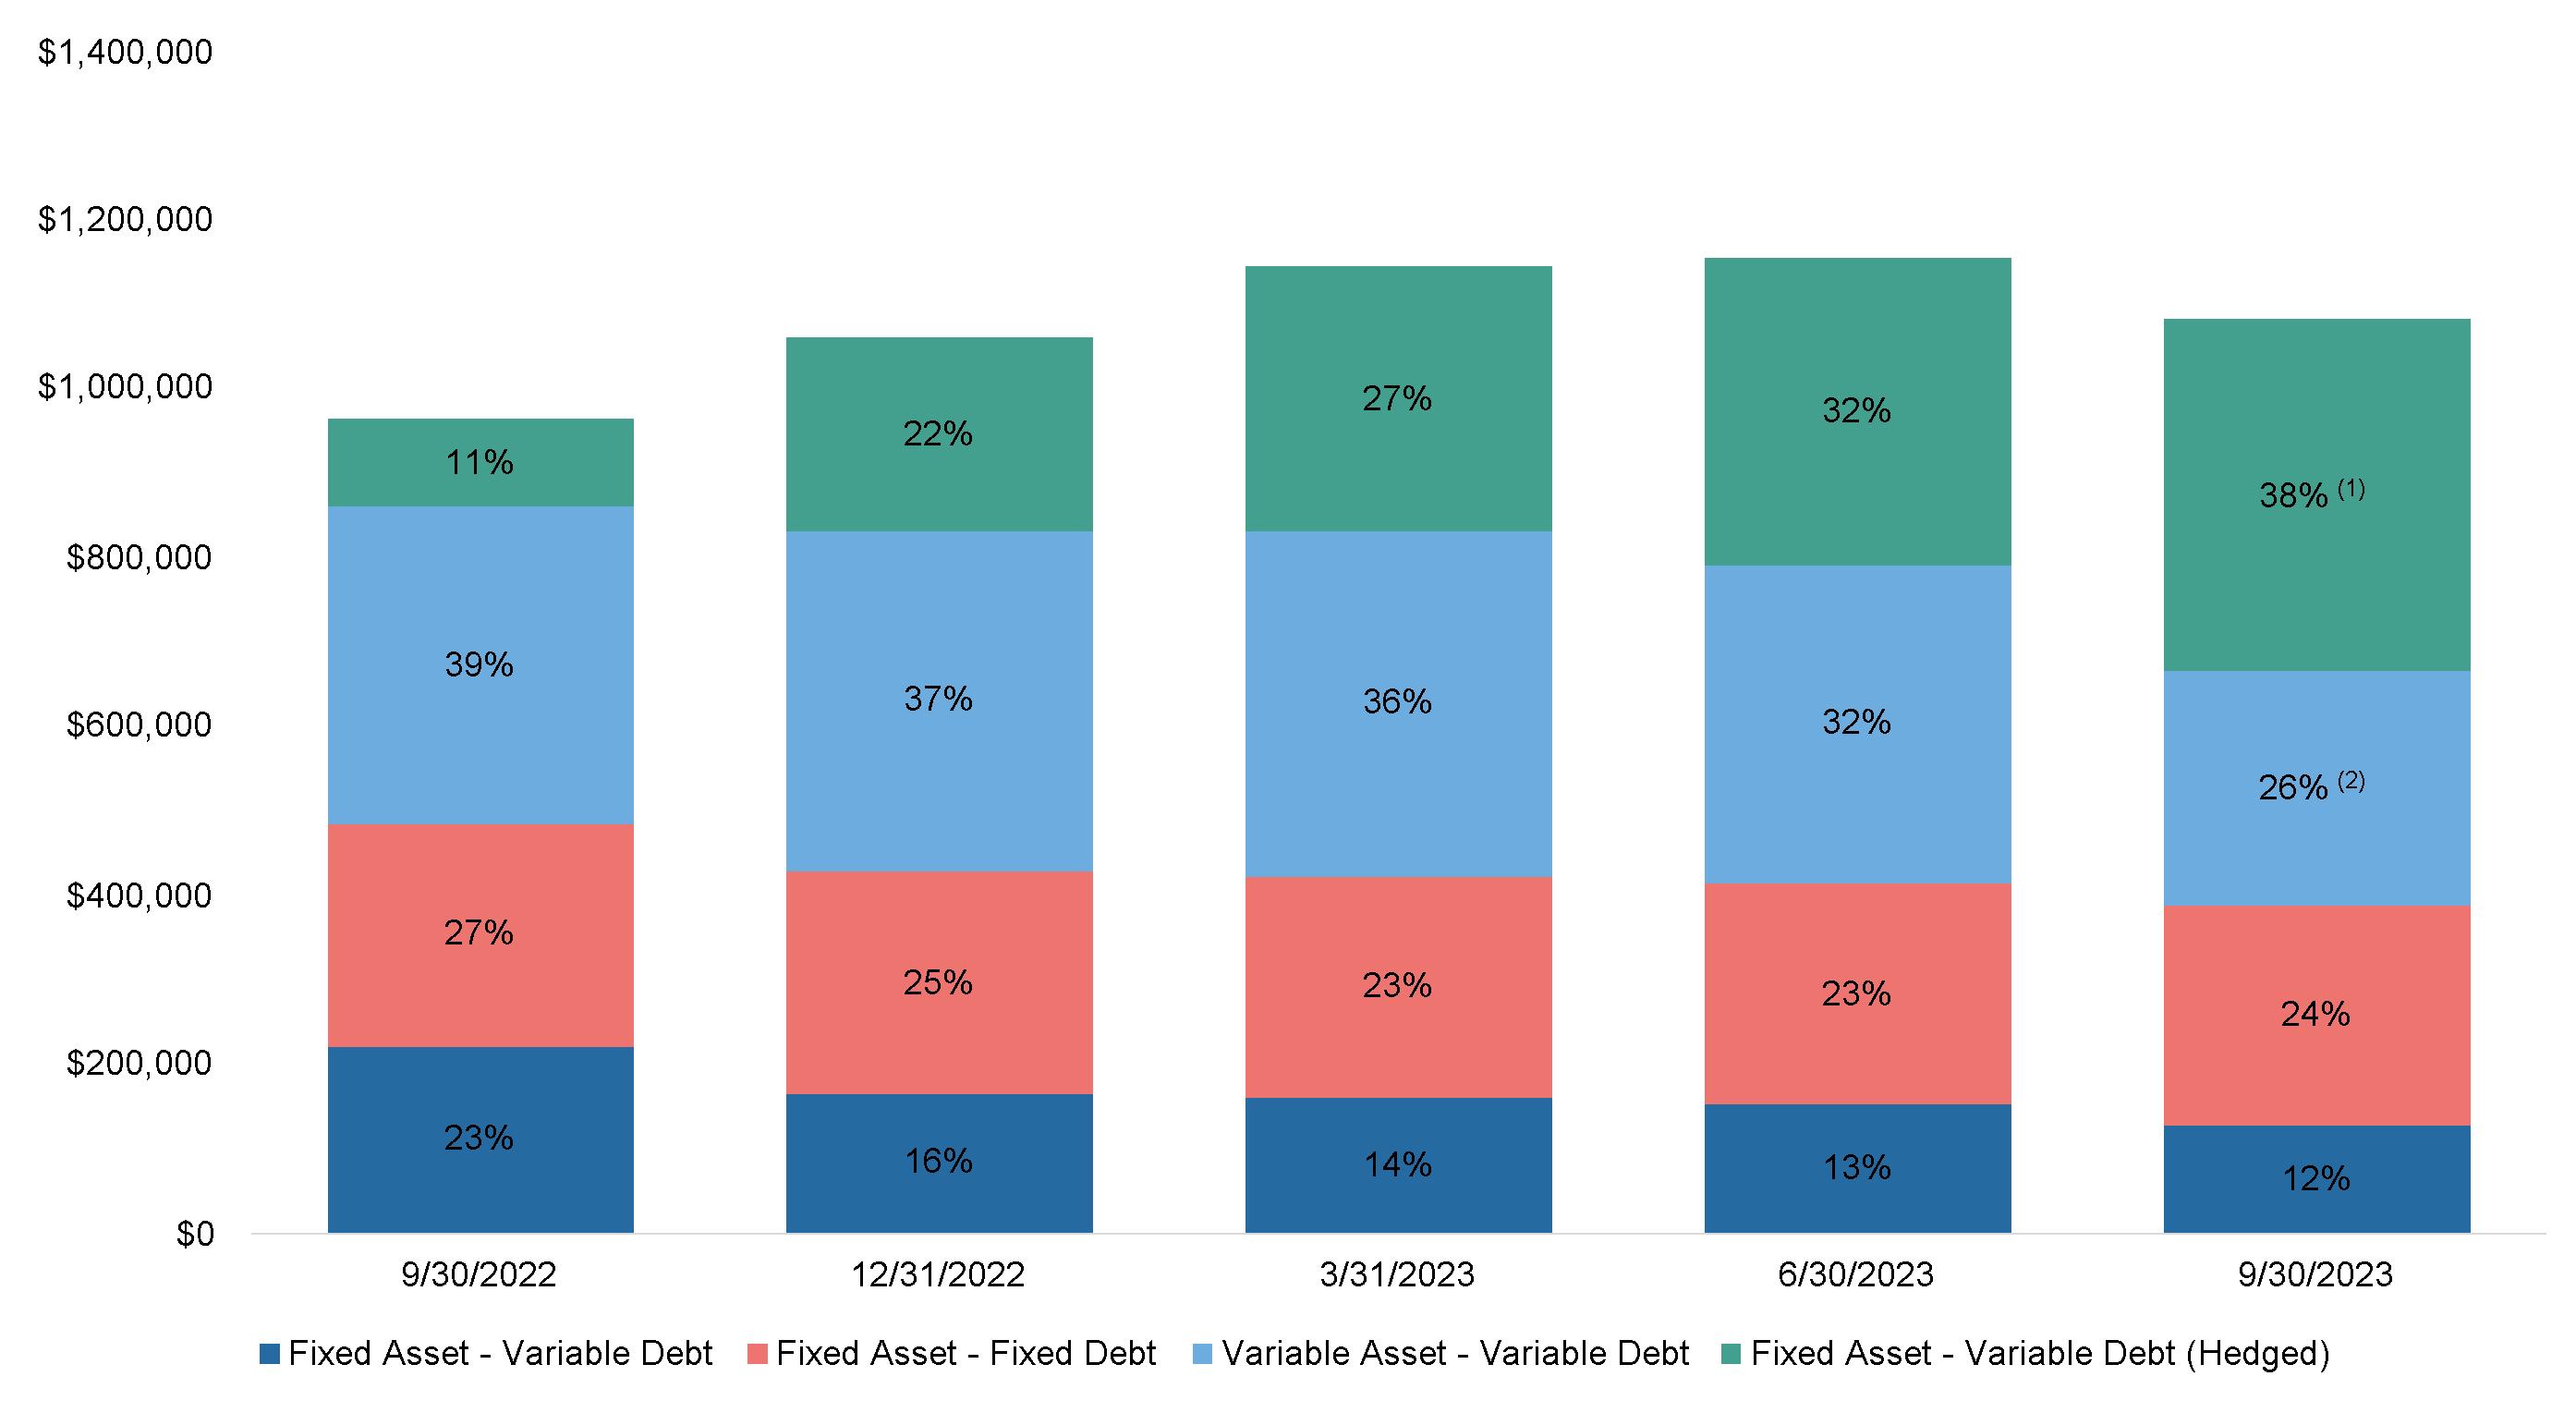
(1)The variable-rate debt financing is hedged through our interest rate swap agreements. Though the variable rate indices may differ, these interest rate swaps have effectively synthetically fixed the interest rate of the related debt financing.
(2)The securitized assets and related debt financings each have variable interest rates, though the variable rate indices may differ. As such, the Partnership is largely hedged against rising interest rates.
|
|
© 2023 Greystone & Co. II LLC |
10 |
|
|
Supplemental Financial Report for the Quarter Ended September 30, 2023 |
|
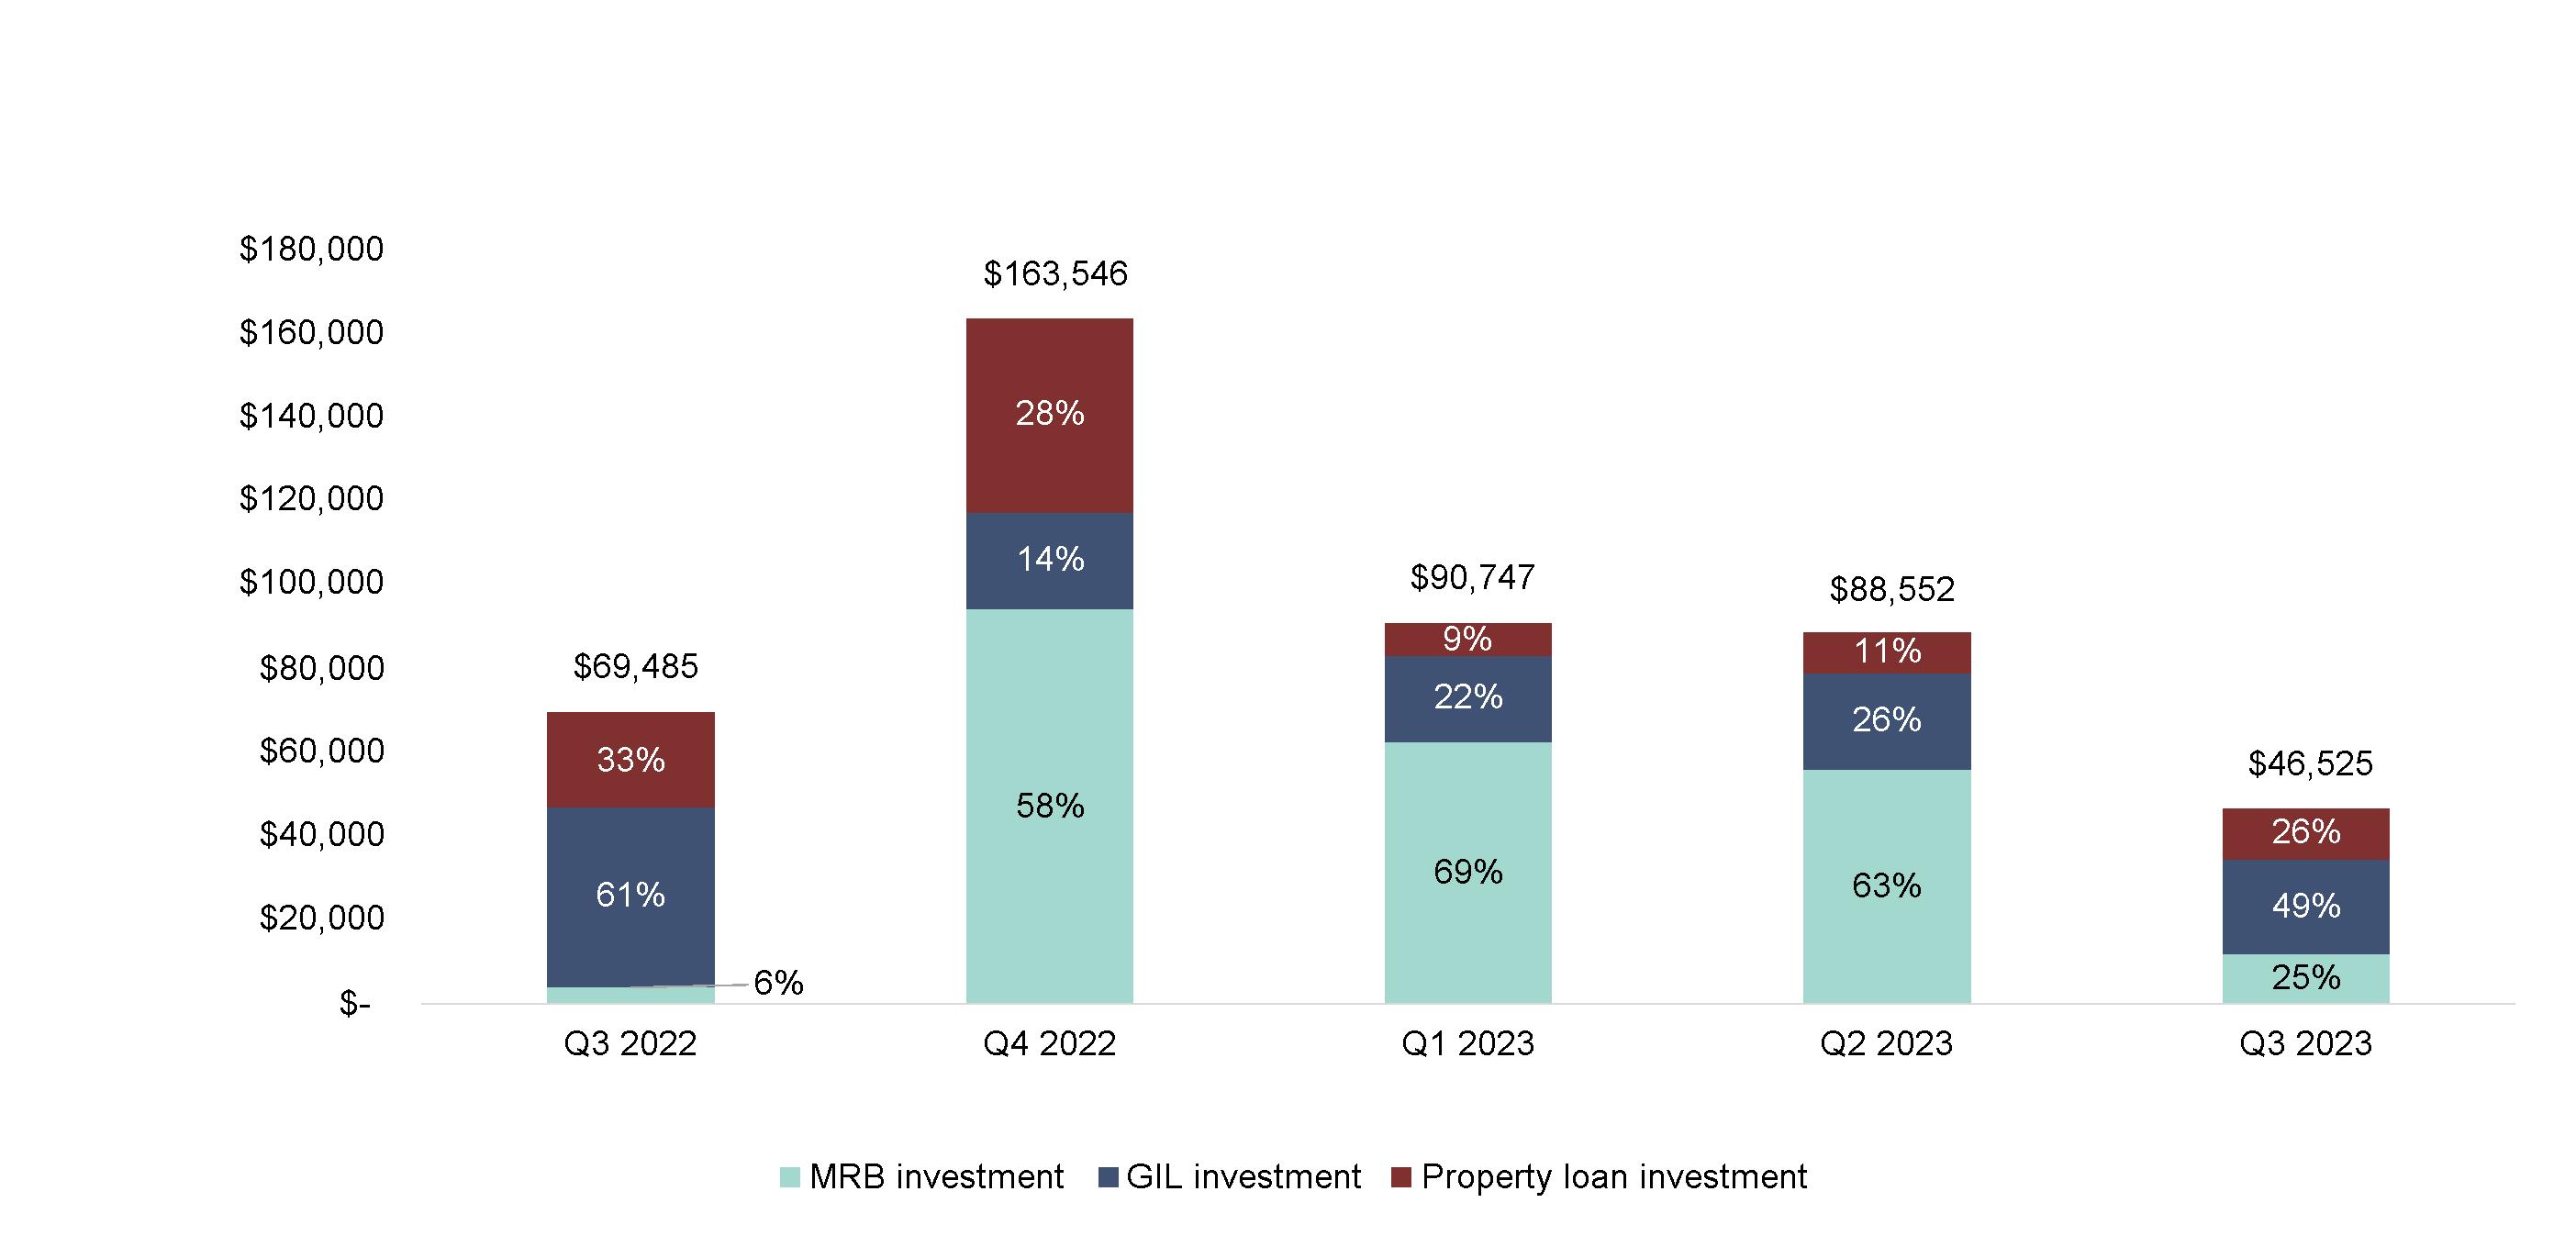
Debt Investments Activity
(Dollar amounts in thousands)
|
|
|
|
|
|
|
|
|
|
|
|
|
|
|
|
Quarterly Activity |
Q3 2022 |
|
Q4 2022 |
|
Q1 2023 |
|
Q2 2023 |
|
Q3 2023 |
|
Investment Purchases |
$ |
69,485 |
|
$ |
163,546 |
|
$ |
90,747 |
|
$ |
88,552 |
|
$ |
46,525 |
|
Sales and Redemptions |
|
(40,109 |
) |
|
(7,779 |
) |
|
(31,622 |
) |
|
(65,511 |
) |
|
(126,121 |
) |
Net Investment Activity |
|
29,376 |
|
|
155,767 |
|
|
59,125 |
|
|
23,041 |
|
|
(79,596 |
) |
Net Debt Proceeds |
|
(21,832 |
) |
|
(120,394 |
) |
|
(35,595 |
) |
|
(16,330 |
) |
|
68,749 |
|
Net Capital Deployed |
$ |
7,544 |
|
$ |
35,373 |
|
$ |
23,530 |
|
$ |
6,711 |
|
$ |
(10,847 |
) |
|
|
© 2023 Greystone & Co. II LLC |
11 |
|
|
Supplemental Financial Report for the Quarter Ended September 30, 2023 |
|
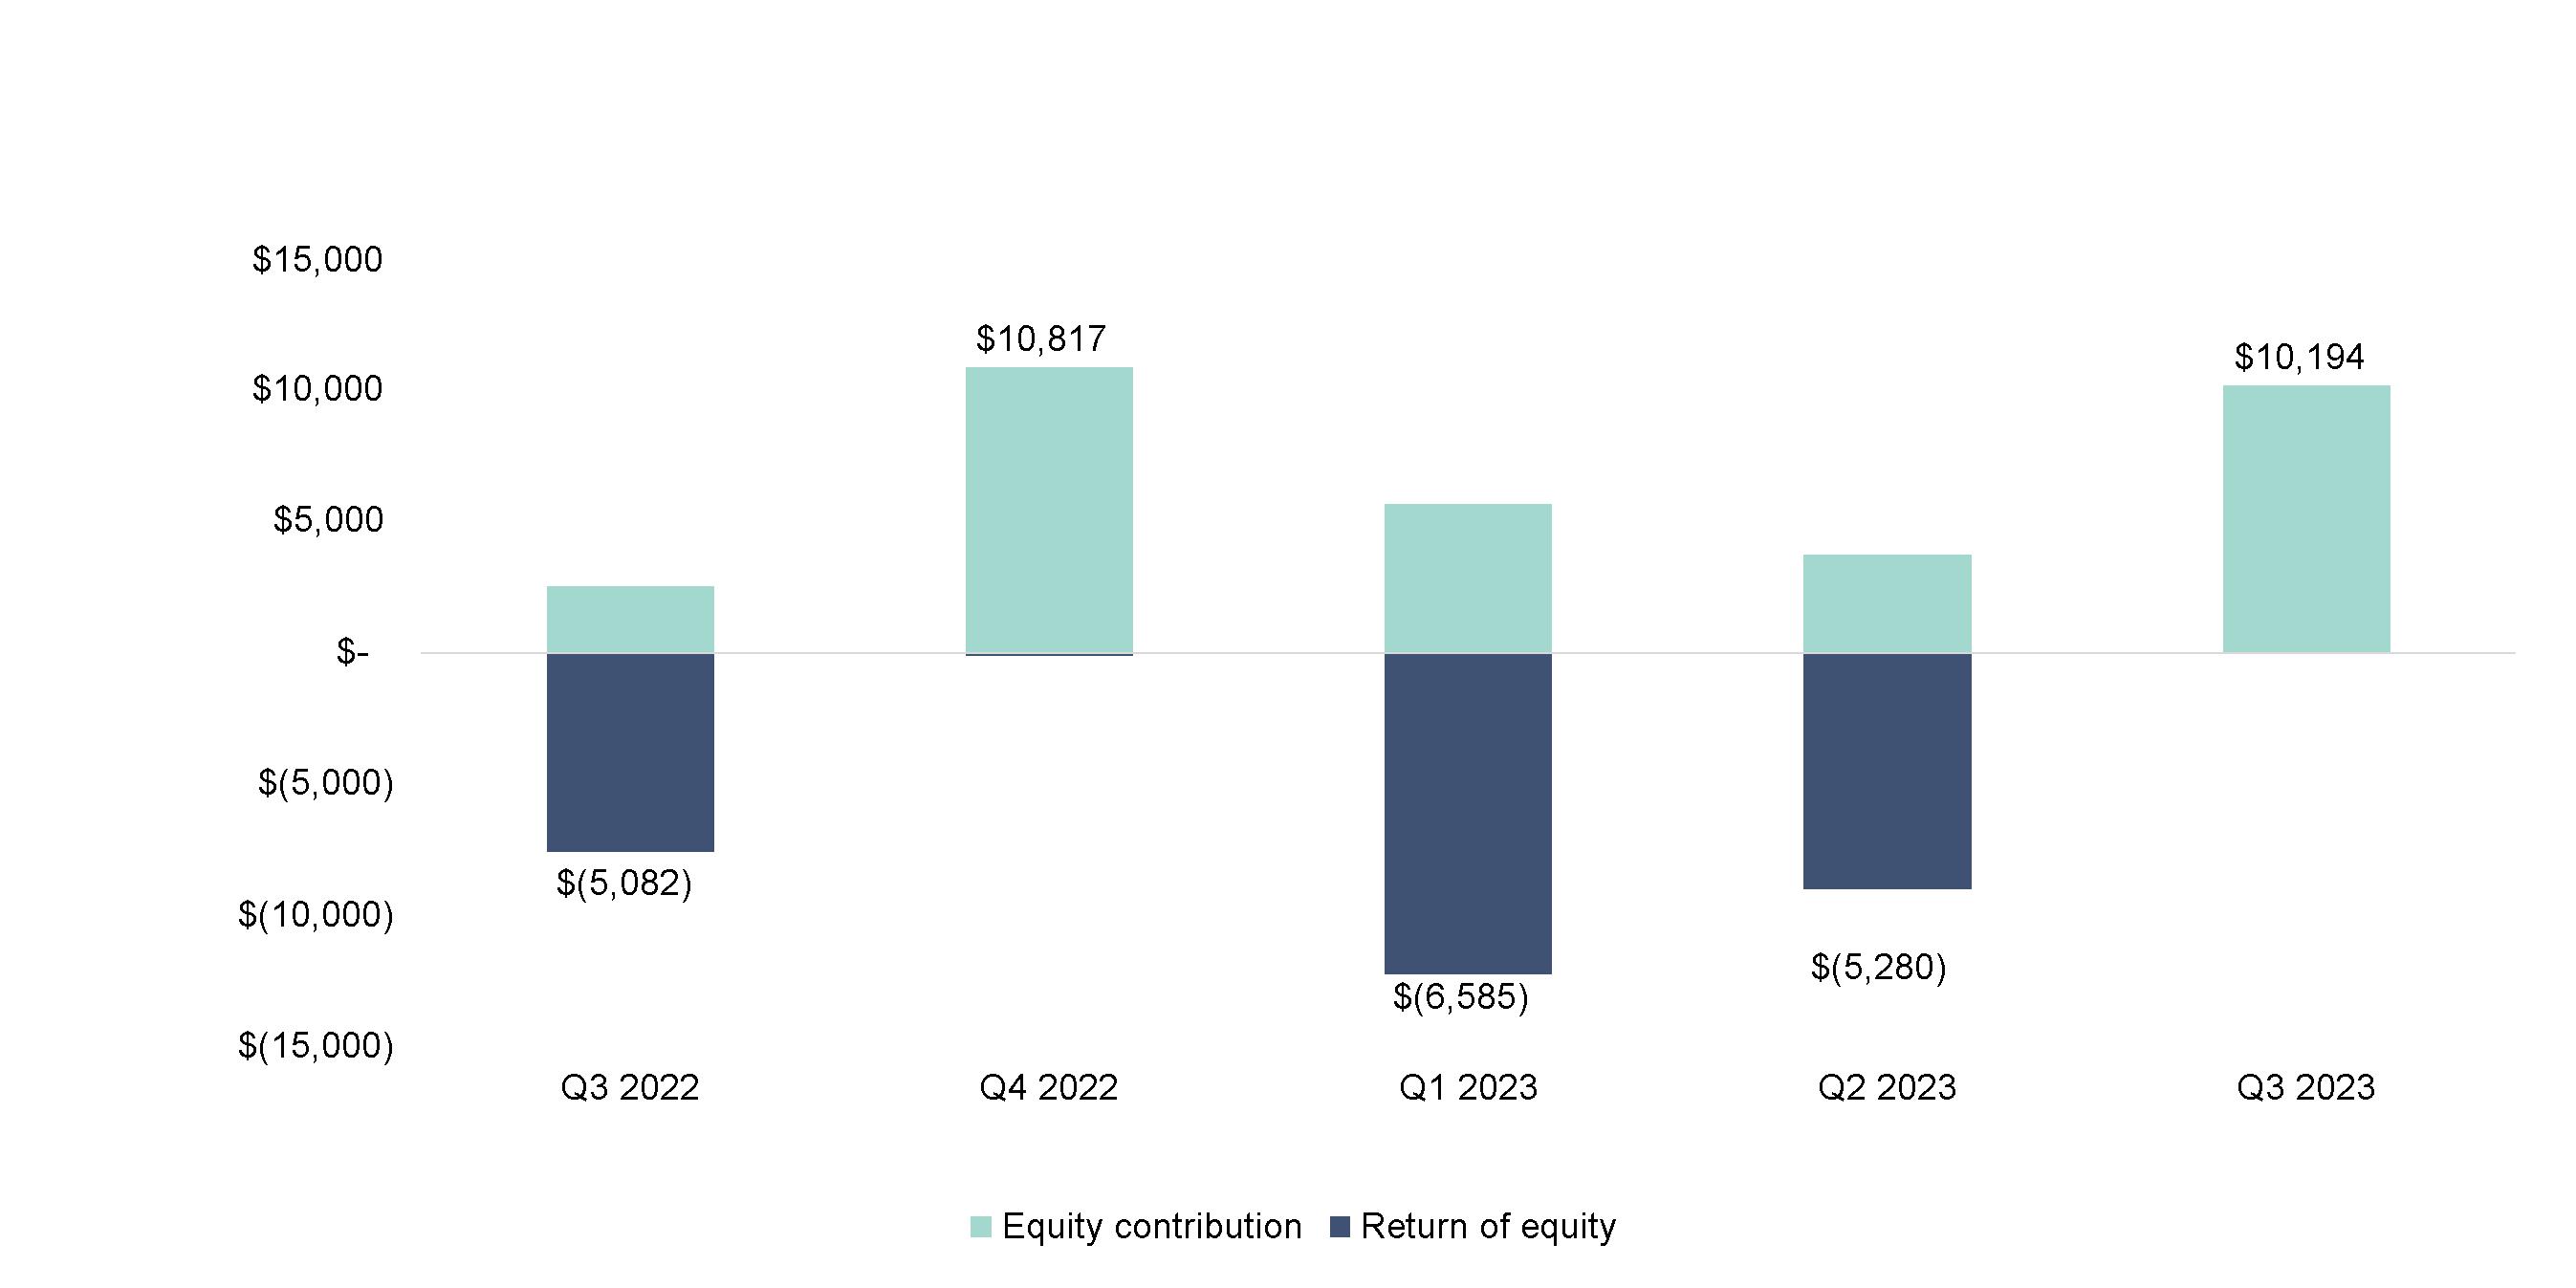
JV Equity Investments Activity
(Dollar amounts in thousands)
|
|
|
|
|
|
|
|
|
|
|
|
|
|
|
|
Quarterly Activity |
Q3 2022 |
|
Q4 2022 |
|
Q1 2023 |
|
Q2 2023 |
|
Q3 2023 |
|
JV Equity Contributions |
$ |
2,524 |
|
$ |
10,912 |
|
$ |
5,698 |
|
$ |
3,744 |
|
$ |
10,194 |
|
Return of JV Equity Contributions |
|
(7,606 |
) |
|
(95 |
) |
|
(12,283 |
) |
|
(9,024 |
) |
|
- |
|
Net JV Equity Activity |
$ |
(5,082 |
) |
$ |
10,817 |
|
$ |
(6,585 |
) |
$ |
(5,280 |
) |
$ |
10,194 |
|
|
|
© 2023 Greystone & Co. II LLC |
12 |
|
|
Supplemental Financial Report for the Quarter Ended September 30, 2023 |
|
Net Book Value Waterfall
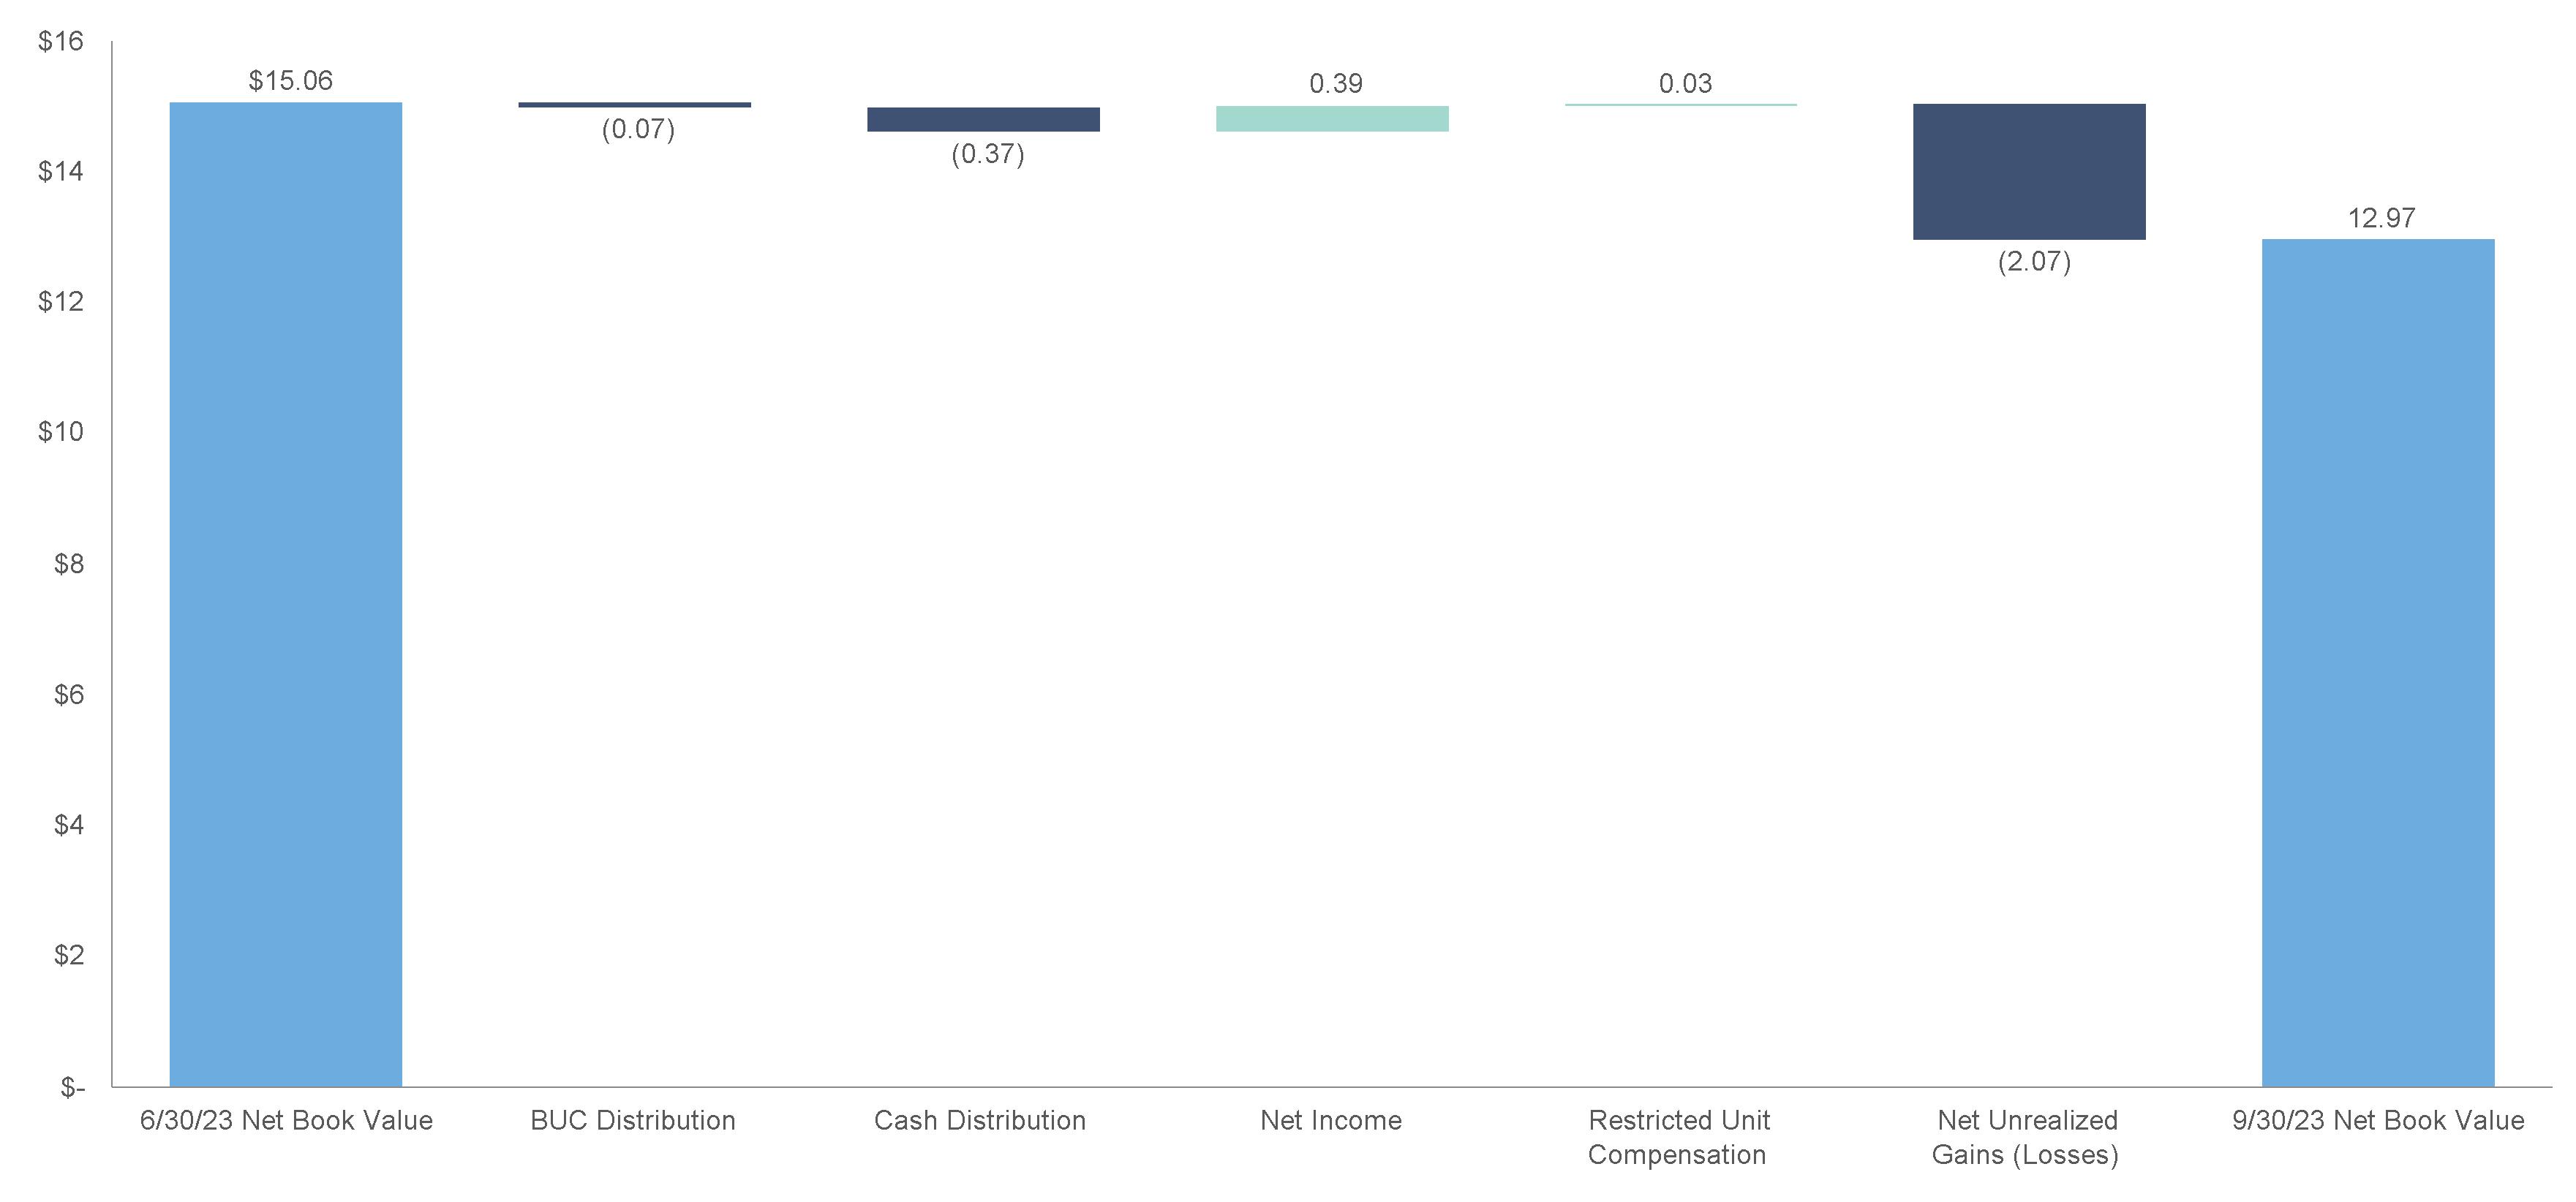
Note: Per unit data derived from weighted average BUCs outstanding during the period, except for the Net Book Values, which are based on
shares outstanding on the stated date. Numbers may not sum due to rounding.
|
|
© 2023 Greystone & Co. II LLC |
13 |
|
|
Supplemental Financial Report for the Quarter Ended September 30, 2023 |
|
Interest Rate Sensitivity Analysis
The interest rate sensitivity table below represents the change in interest income from investments, net of interest on debt and settlement payments for interest rate derivatives over the next twelve months, assuming an immediate parallel shift in the SOFR yield curve and the resulting implied forward rates are realized as a component of this shift in the curve and assuming management does not adjust its strategy in response. The amounts in the table below do not consider any potential derivative fair value adjustments in determining the net interest income impact.
|
|
|
|
|
|
|
|
|
|
|
|
|
|
|
|
|
|
|
|
|
Description |
|
- 25 basis points |
|
|
+ 50 basis points |
|
|
+ 100 basis points |
|
|
+ 150 basis points |
|
|
+ 200 basis points |
|
TOB Debt Financings |
|
$ |
1,223,811 |
|
|
$ |
(2,447,621 |
) |
|
$ |
(4,895,243 |
) |
|
$ |
(7,342,864 |
) |
|
$ |
(9,790,485 |
) |
TEBS Debt Financings |
|
|
96,944 |
|
|
|
(193,887 |
) |
|
|
(387,774 |
) |
|
|
(581,661 |
) |
|
|
(775,548 |
) |
Other Investment Financings |
|
|
(536,889 |
) |
|
|
1,073,779 |
|
|
|
2,147,557 |
|
|
|
3,221,336 |
|
|
|
4,295,115 |
|
Variable Rate Investments |
|
|
(566,796 |
) |
|
|
1,133,592 |
|
|
|
2,267,183 |
|
|
|
3,400,775 |
|
|
|
4,534,366 |
|
Net Interest Income Impact |
|
$ |
217,070 |
|
|
$ |
(434,137 |
) |
|
$ |
(868,277 |
) |
|
$ |
(1,302,414 |
) |
|
$ |
(1,736,552 |
) |
|
|
|
|
|
|
|
|
|
|
|
|
|
|
|
|
Per BUC Impact (1) |
|
$ |
0.010 |
|
|
$ |
(0.019 |
) |
|
$ |
(0.038 |
) |
|
$ |
(0.057 |
) |
|
$ |
(0.076 |
) |
(1)The net interest income impact per BUC calculated based on 22,734,375 BUCs outstanding as of September 30, 2023.
|
|
© 2023 Greystone & Co. II LLC |
14 |
|
|
Supplemental Financial Report for the Quarter Ended September 30, 2023 |
|
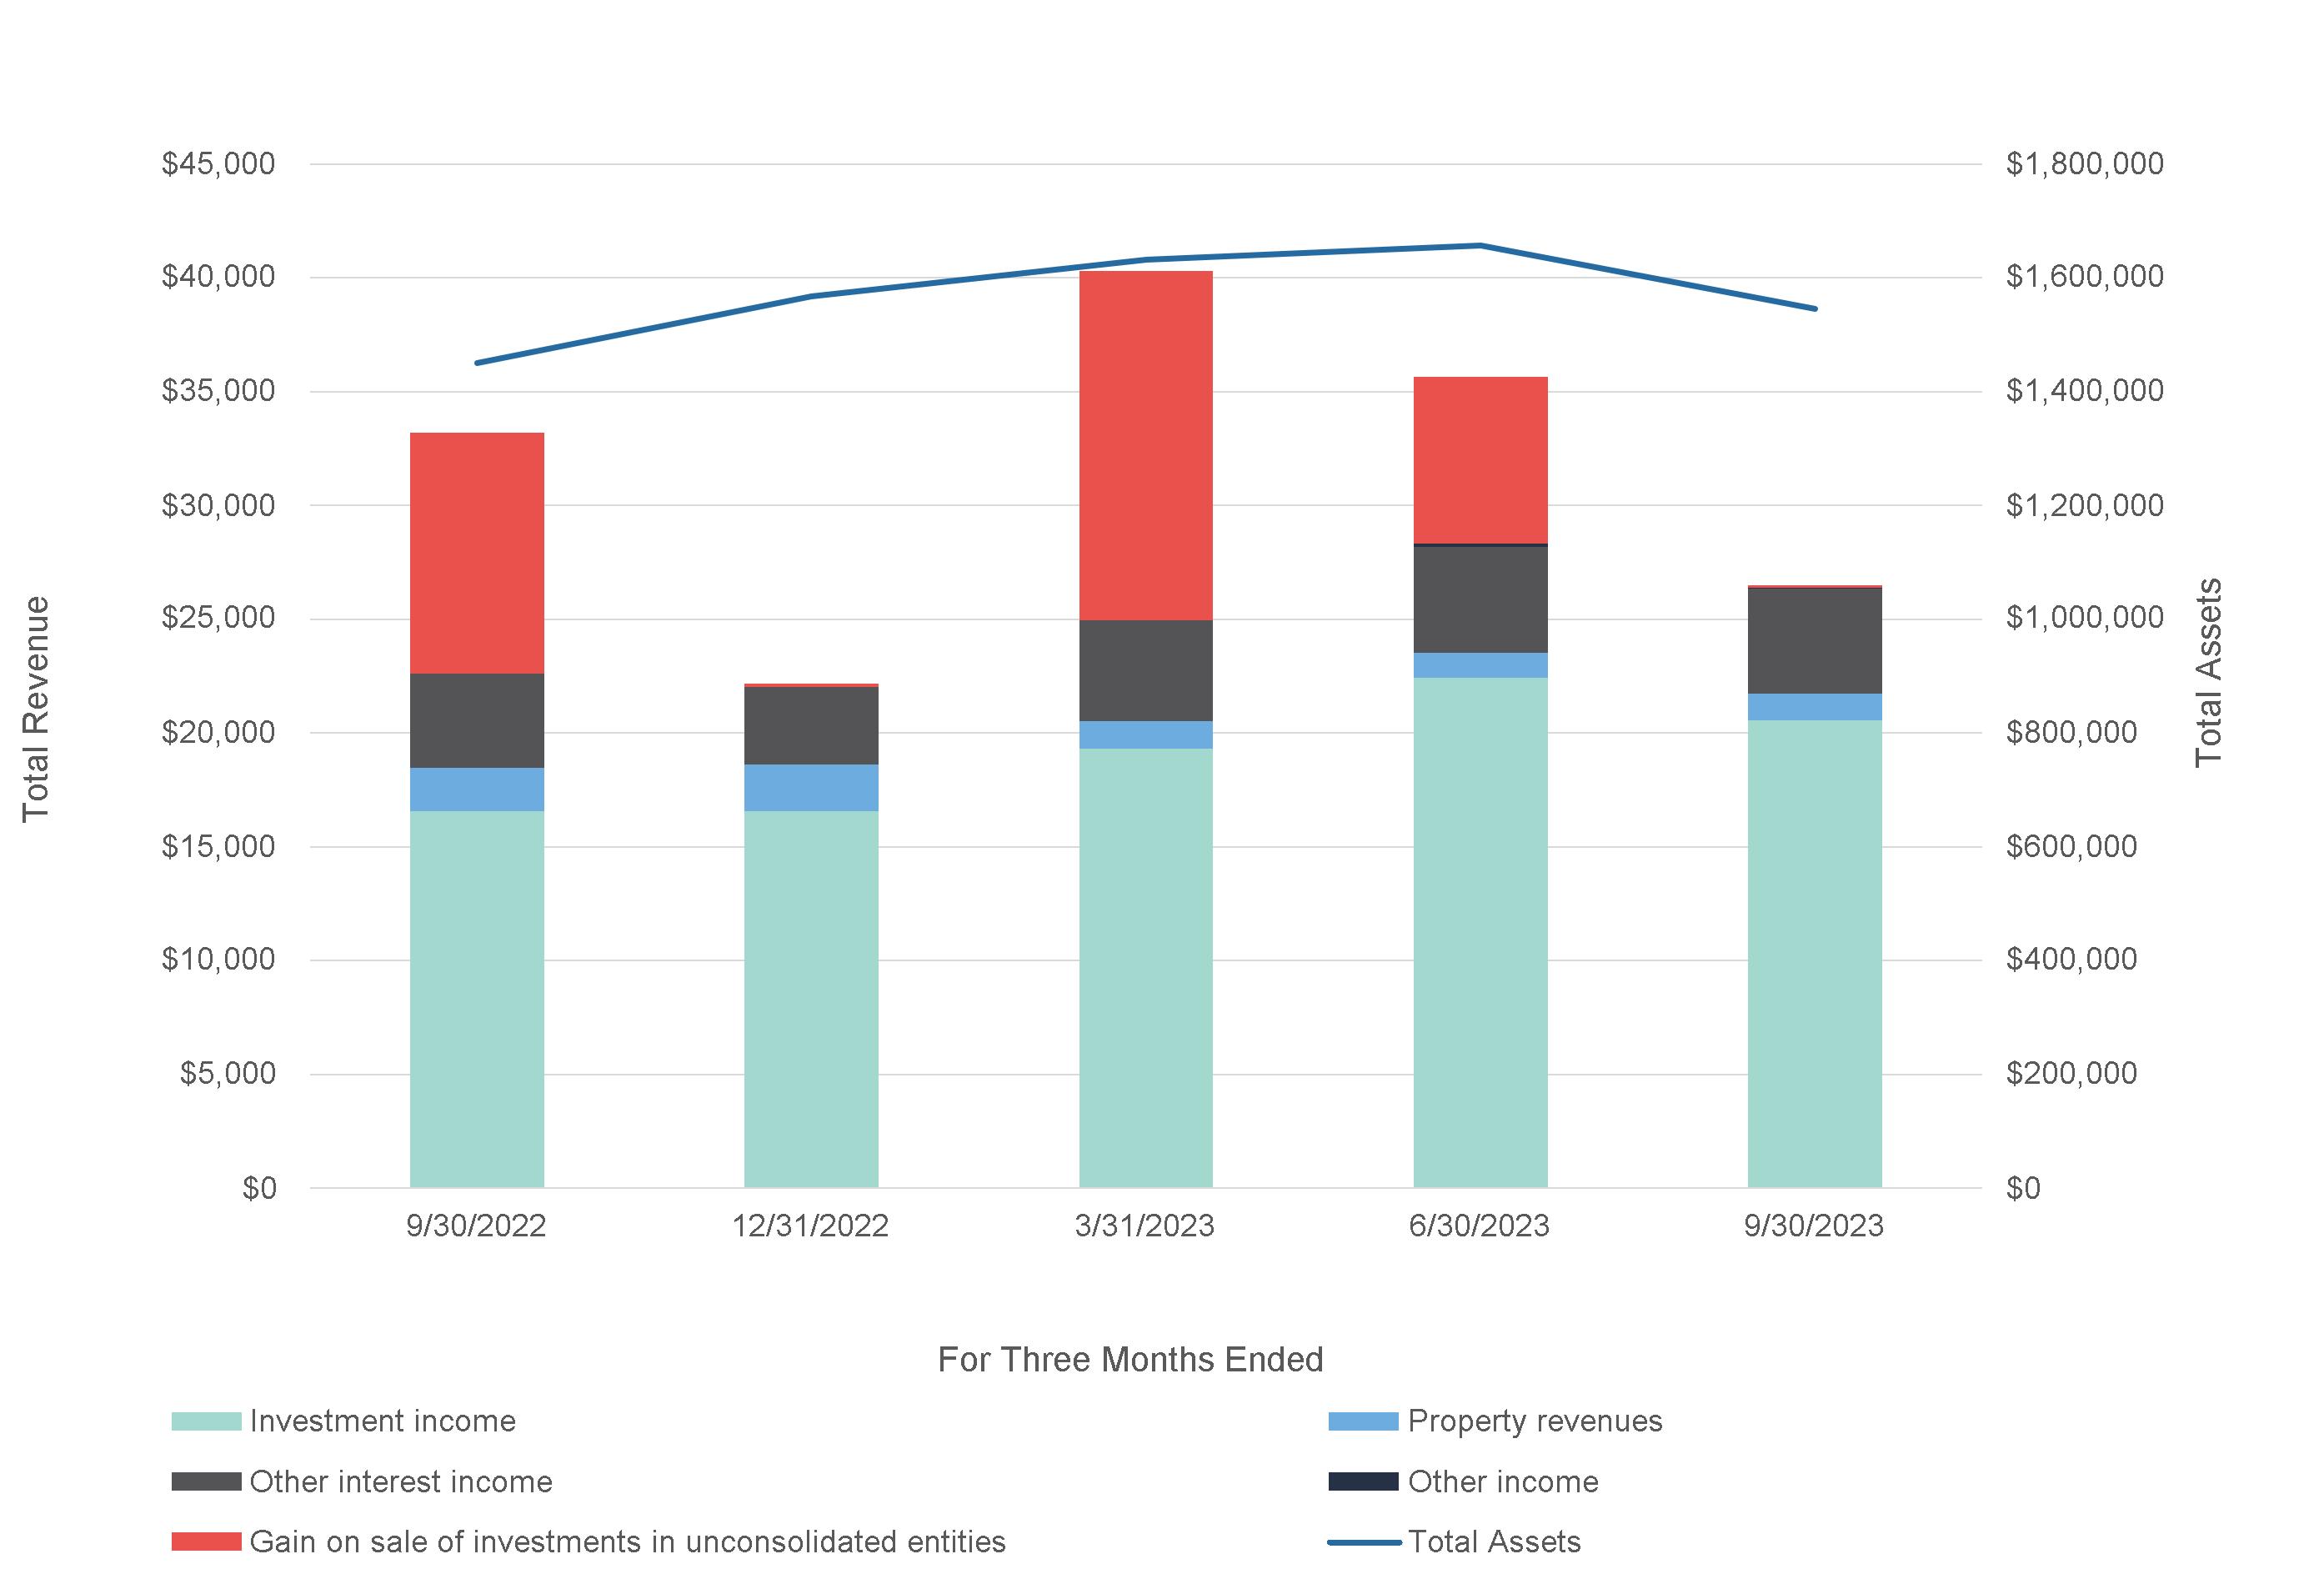
Total Revenue & Gain on Sale Trends
(Dollar amounts in thousands)
|
|
© 2023 Greystone & Co. II LLC |
15 |
|
|
Supplemental Financial Report for the Quarter Ended September 30, 2023 |
|
Operating Expense Trends
(Dollar amounts in thousands)
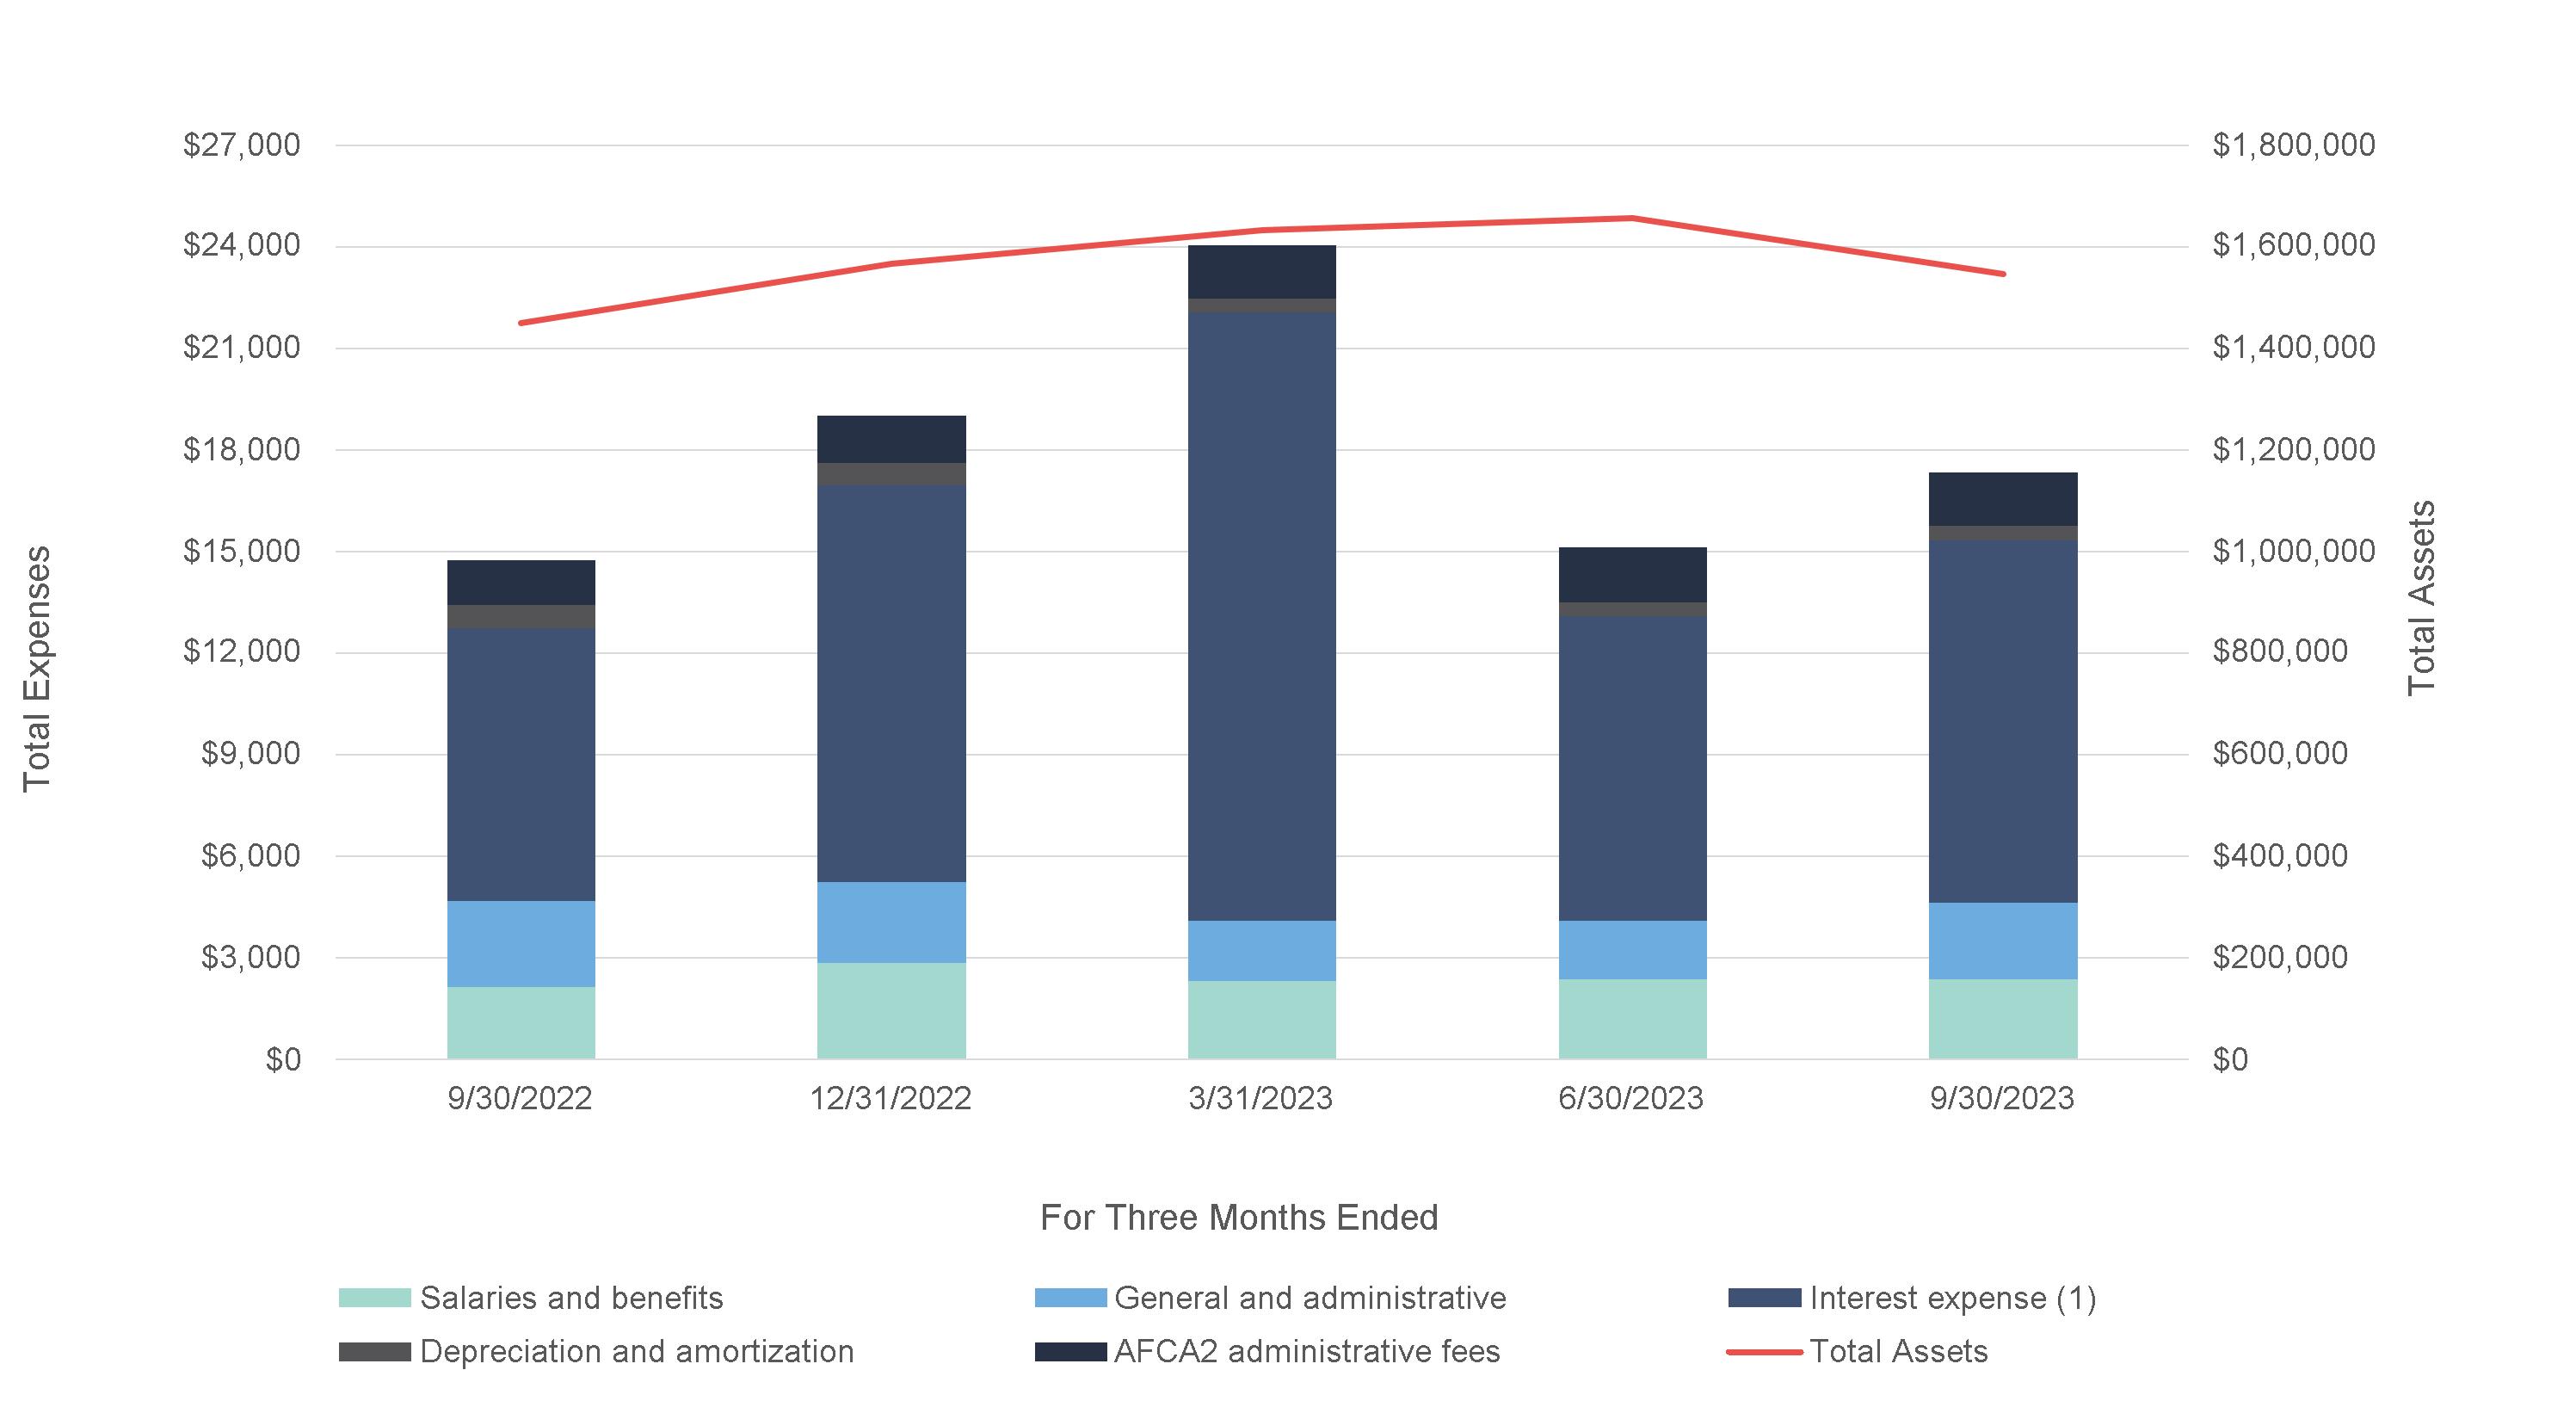
(1)Interest expense includes fair value adjustments to the Partnership's interest rate derivative instruments that are non-cash income (expense) in the period reported.
Since July 1, 2021, the sum of “Salaries and benefits” and “General and administrative” expenses as a percentage of Total Assets has
averaged approximately 0.29% per quarter.
|
|
© 2023 Greystone & Co. II LLC |
16 |
|
|
Supplemental Financial Report for the Quarter Ended September 30, 2023 |
|
Tax Income Information Related to Beneficial Unit Certificates
The following table summarizes tax-exempt and taxable income as percentages of total income allocated to the Partnership’s BUCs on Schedule K-1 for tax years 2020 to 2022. This disclosure relates only to income allocated to the Partnership’s BUCs and does not consider an individual unitholder’s basis in the BUCs or potential return of capital as such matters are dependent on the individual unitholders’ specific tax circumstances. Such amounts are for all BUC holders in the aggregate during the year. Income is allocated to individual investors monthly and amounts allocated to individual investors may differ from these percentages due to, including, but not limited to, BUC purchases and sales activity and the timing of significant transactions during the year.
|
|
|
|
|
|
|
|
|
|
|
|
|
|
2022 |
|
|
2021 |
|
|
2020 |
|
|
Tax-exempt income |
|
25 |
% |
|
|
32 |
% |
|
|
215 |
% |
|
Taxable income (loss) |
|
75 |
% |
|
|
68 |
% |
|
|
-115 |
% |
(1) |
|
|
100 |
% |
|
|
100 |
% |
|
|
100 |
% |
|
(1)The taxable loss in 2020 is due primarily to net rental real estate losses that exceeded gains on sale for tax purposes during the year related to the Partnership’s investment in unconsolidated entities.
Unrelated Business Taxable Income
In recent years, the Partnership has generated little to no Unrelated Business Taxable Income (“UBTI”) for BUC unitholders. For tax years 2020 to 2022, the Partnership generated a net loss from activities considered to be UBTI as reported on investor Schedule K-1s. The rules around UBTI are complex, so please consult your tax advisor.
|
|
© 2023 Greystone & Co. II LLC |
17 |
|
|
Supplemental Financial Report for the Quarter Ended September 30, 2023 |
|
Appendices
|
|
© 2023 Greystone & Co. II LLC |
18 |
|
|
Supplemental Financial Report for the Quarter Ended September 30, 2023 |
|
Operating Results Detail
(Dollar amounts in thousands, except per BUC information)
|
|
|
|
|
|
|
|
|
|
|
|
|
|
|
|
|
|
|
|
|
|
|
Q3 2022 |
|
|
Q4 2022 |
|
|
Q1 2023 |
|
|
Q2 2023 |
|
|
Q3 2023 |
|
Revenues: |
|
|
|
|
|
|
|
|
|
|
|
|
|
|
|
Investment income |
|
$ |
16,564 |
|
|
$ |
16,550 |
|
|
$ |
19,303 |
|
|
$ |
22,416 |
|
|
$ |
20,537 |
|
Property revenues |
|
|
1,914 |
|
|
|
2,070 |
|
|
|
1,226 |
|
|
|
1,108 |
|
|
|
1,199 |
|
Other interest income |
|
|
4,127 |
|
|
|
3,410 |
|
|
|
4,410 |
|
|
|
4,646 |
|
|
|
4,621 |
|
Other income |
|
|
- |
|
|
|
- |
|
|
|
- |
|
|
|
133 |
|
|
|
117 |
|
Total revenues |
|
|
22,605 |
|
|
|
22,030 |
|
|
|
24,939 |
|
|
|
28,303 |
|
|
|
26,474 |
|
|
|
|
|
|
|
|
|
|
|
|
|
|
|
|
|
Expenses: |
|
|
|
|
|
|
|
|
|
|
|
|
|
|
|
Real estate operating (exclusive of items shown below) |
|
|
1,521 |
|
|
|
1,174 |
|
|
|
602 |
|
|
|
615 |
|
|
|
874 |
|
Provision for credit losses |
|
|
- |
|
|
|
- |
|
|
|
(545 |
) |
|
|
(774 |
) |
|
|
(562 |
) |
Depreciation and amortization |
|
|
688 |
|
|
|
661 |
|
|
|
405 |
|
|
|
405 |
|
|
|
413 |
|
Interest expense |
|
|
8,036 |
|
|
|
11,714 |
|
|
|
17,971 |
|
|
|
8,988 |
|
|
|
10,717 |
|
General and administrative |
|
|
4,505 |
|
|
|
5,452 |
|
|
|
5,073 |
|
|
|
5,109 |
|
|
|
5,328 |
|
Total expenses |
|
|
14,750 |
|
|
|
19,001 |
|
|
|
23,506 |
|
|
|
14,343 |
|
|
|
16,770 |
|
|
|
|
|
|
|
|
|
|
|
|
|
|
|
|
|
Other Income: |
|
|
|
|
|
|
|
|
|
|
|
|
|
|
|
Gain on sale of investments in unconsolidated entities |
|
|
10,581 |
|
|
|
141 |
|
|
|
15,367 |
|
|
|
7,326 |
|
|
|
32 |
|
Income before income taxes |
|
|
18,436 |
|
|
|
3,170 |
|
|
|
16,800 |
|
|
|
21,286 |
|
|
|
9,736 |
|
Income tax expense (benefit) |
|
|
(82 |
) |
|
|
(6 |
) |
|
|
7 |
|
|
|
(1 |
) |
|
|
6 |
|
Net income |
|
|
18,518 |
|
|
|
3,176 |
|
|
|
16,793 |
|
|
|
21,287 |
|
|
|
9,730 |
|
Redeemable preferred unit distributions and accretion |
|
|
(716 |
) |
|
|
(716 |
) |
|
|
(747 |
) |
|
|
(799 |
) |
|
|
(700 |
) |
Net income available to partners |
|
$ |
17,802 |
|
|
$ |
2,460 |
|
|
$ |
16,046 |
|
|
$ |
20,488 |
|
|
$ |
9,030 |
|
|
|
|
|
|
|
|
|
|
|
|
|
|
|
|
|
Net income available to partners allocated to: |
|
|
|
|
|
|
|
|
|
|
|
|
|
|
|
General partner |
|
$ |
142 |
|
|
$ |
360 |
|
|
$ |
2,479 |
|
|
$ |
1,010 |
|
|
$ |
25 |
|
Limited partners - BUCs |
|
|
17,553 |
|
|
|
2,063 |
|
|
|
13,491 |
|
|
|
19,324 |
|
|
|
8,922 |
|
Limited partners - Restricted units |
|
|
105 |
|
|
|
36 |
|
|
|
75 |
|
|
|
154 |
|
|
|
82 |
|
Net income available to partners |
|
$ |
17,800 |
|
|
$ |
2,459 |
|
|
$ |
16,045 |
|
|
$ |
20,488 |
|
|
$ |
9,029 |
|
|
|
© 2023 Greystone & Co. II LLC |
19 |
|
|
Supplemental Financial Report for the Quarter Ended September 30, 2023 |
|
Cash Available for Distribution (1)
(Dollar amounts in thousands, except per BUC information)
|
|
|
|
|
|
|
|
|
|
|
|
|
|
|
|
|
|
|
|
|
|
|
|
Q3 2022 |
|
|
Q4 2022 |
|
|
Q1 2023 |
|
|
Q2 2023 |
|
|
Q3 2023 |
|
|
Net income |
|
$ |
18,517 |
|
|
$ |
3,175 |
|
|
$ |
16,791 |
|
|
$ |
21,287 |
|
|
$ |
9,729 |
|
|
Change in fair value of derivative instruments |
|
|
(2,872 |
) |
|
|
(660 |
) |
|
|
3,436 |
|
|
|
(6,020 |
) |
|
|
(4,237 |
) |
|
Depreciation and amortization expense |
|
|
688 |
|
|
|
661 |
|
|
|
405 |
|
|
|
405 |
|
|
|
413 |
|
|
Provision for credit losses |
|
|
- |
|
|
|
- |
|
|
|
(545 |
) |
|
|
(774 |
) |
|
|
(562 |
) |
|
Realized impairment of securities |
|
|
(5,712 |
) |
|
|
- |
|
|
|
- |
|
|
|
- |
|
|
|
- |
|
|
Realized provision for loan loss |
|
|
(593 |
) |
|
|
- |
|
|
|
- |
|
|
|
- |
|
|
|
- |
|
|
Amortization of deferred financing costs |
|
|
982 |
|
|
|
611 |
|
|
|
1,006 |
|
|
|
393 |
|
|
|
353 |
|
|
Restricted unit compensation expense |
|
|
580 |
|
|
|
612 |
|
|
|
350 |
|
|
|
587 |
|
|
|
603 |
|
|
Deferred income taxes |
|
|
(43 |
) |
|
|
4 |
|
|
|
(1 |
) |
|
|
(1 |
) |
|
|
(1 |
) |
|
Redeemable Preferred Unit distributions and accretion |
|
|
(716 |
) |
|
|
(716 |
) |
|
|
(747 |
) |
|
|
(799 |
) |
|
|
(700 |
) |
|
Tier 2 Income allocable to the General Partner |
|
|
(70 |
) |
|
|
(337 |
) |
|
|
(2,415 |
) |
|
|
(878 |
) |
|
|
65 |
|
|
Recovery of prior credit loss |
|
|
(17 |
) |
|
|
(17 |
) |
|
|
(17 |
) |
|
|
(17 |
) |
|
|
(17 |
) |
|
Bond premium, discount and amortization, net of cash received |
|
|
957 |
|
|
|
(51 |
) |
|
|
(47 |
) |
|
|
(47 |
) |
|
|
(45 |
) |
|
Total Cash Available for Distribution |
|
$ |
11,701 |
|
|
$ |
3,282 |
|
|
$ |
18,216 |
|
|
$ |
14,136 |
|
|
$ |
5,601 |
|
|
|
|
|
|
|
|
|
|
|
|
|
|
|
|
|
|
|
Weighted average number of BUCs outstanding, basic |
|
|
22,247,781 |
|
|
|
22,501,386 |
|
|
|
22,538,928 |
|
|
|
22,639,852 |
|
|
|
22,734,412 |
|
|
Net income per BUC, basic |
|
$ |
0.79 |
|
|
$ |
0.09 |
|
|
$ |
0.60 |
|
|
$ |
0.85 |
|
|
$ |
0.39 |
|
|
Total CAD per BUC, basic |
|
$ |
0.53 |
|
|
$ |
0.15 |
|
|
$ |
0.81 |
|
|
$ |
0.62 |
|
|
$ |
0.25 |
|
|
Cash Distributions declared, per BUC |
|
$ |
0.37 |
|
|
$ |
0.47 |
|
|
$ |
0.37 |
|
|
$ |
0.37 |
|
|
$ |
0.37 |
|
|
BUCs Distributions declared, per BUC (2) |
|
$ |
0.20 |
|
|
$ |
0.20 |
|
|
$ |
- |
|
|
$ |
0.07 |
|
|
$ |
0.07 |
|
|
|
|
|
|
|
|
|
|
|
|
|
|
|
|
|
|
|
|
|
|
|
|
Trailing five quarter totals: |
|
|
|
|
|
Net income per BUC, basic |
|
|
$ |
2.73 |
|
|
|
|
|
|
|
Total CAD per BUC, basic |
|
|
$ |
2.35 |
|
|
|
|
|
|
|
Cash Distributions declared, per BUC |
|
|
$ |
1.94 |
|
|
|
|
|
|
|
BUCs Distributions declared, per BUC |
|
|
$ |
0.54 |
|
|
|
|
|
|
|
|
(1)See the Important Disclosure Notices in the Appendices for important information regarding non-GAAP measures. Per BUC metrics are presented as initially reported and have not been retrospectively adjusted for future distributions payable in the form of additional BUCs.
(2)See the Important Disclosure Notices in the Appendices for information regarding the BUCs distributions declared.
|
|
© 2023 Greystone & Co. II LLC |
20 |
|
|
Supplemental Financial Report for the Quarter Ended September 30, 2023 |
|
Balance Sheet Summary
(Dollar amounts in thousands, except per BUC information)
|
|
|
|
|
|
|
|
|
|
|
|
|
|
|
|
|
|
|
|
|
|
|
9/30/2022 |
|
|
12/31/2022 |
|
|
3/31/2023 |
|
|
6/30/2023 |
|
|
9/30/2023 |
|
Assets: |
|
|
|
|
|
|
|
|
|
|
|
|
|
|
|
Cash |
|
$ |
103,204 |
|
|
$ |
51,188 |
|
|
$ |
52,105 |
|
|
$ |
59,246 |
|
|
$ |
58,918 |
|
Restricted cash |
|
|
45,850 |
|
|
|
41,449 |
|
|
|
36,213 |
|
|
|
45,765 |
|
|
|
47,908 |
|
Interest receivable |
|
|
9,402 |
|
|
|
11,628 |
|
|
|
14,615 |
|
|
|
10,315 |
|
|
|
8,712 |
|
Mortgage revenue bonds, at fair value |
|
|
695,070 |
|
|
|
799,409 |
|
|
|
867,384 |
|
|
|
905,964 |
|
|
|
859,046 |
|
Governmental issuer loans, net |
|
|
281,275 |
|
|
|
300,230 |
|
|
|
315,528 |
|
|
|
302,173 |
|
|
|
254,378 |
|
Property loans, net |
|
|
123,867 |
|
|
|
175,110 |
|
|
|
162,781 |
|
|
|
142,903 |
|
|
|
115,432 |
|
Investments in unconsolidated entities |
|
|
103,103 |
|
|
|
115,791 |
|
|
|
111,135 |
|
|
|
106,296 |
|
|
|
118,525 |
|
Real estate assets, net |
|
|
58,599 |
|
|
|
36,550 |
|
|
|
35,673 |
|
|
|
35,563 |
|
|
|
35,272 |
|
Other assets |
|
|
29,717 |
|
|
|
35,775 |
|
|
|
37,236 |
|
|
|
48,458 |
|
|
|
48,140 |
|
Total assets |
|
$ |
1,450,087 |
|
|
$ |
1,567,130 |
|
|
$ |
1,632,670 |
|
|
$ |
1,656,683 |
|
|
$ |
1,546,331 |
|
|
|
|
|
|
|
|
|
|
|
|
|
|
|
|
|
Liabilities |
|
|
|
|
|
|
|
|
|
|
|
|
|
|
|
Accounts payable, accrued expenses and other liabilities |
|
$ |
16,366 |
|
|
$ |
21,734 |
|
|
$ |
23,408 |
|
|
$ |
22,468 |
|
|
$ |
23,622 |
|
Distribution payable |
|
|
8,313 |
|
|
|
10,900 |
|
|
|
10,835 |
|
|
|
9,322 |
|
|
|
8,481 |
|
Secured lines of credit |
|
|
30,942 |
|
|
|
55,500 |
|
|
|
6,500 |
|
|
|
12,500 |
|
|
|
16,500 |
|
Debt financing, net |
|
|
962,615 |
|
|
|
1,058,903 |
|
|
|
1,143,735 |
|
|
|
1,154,030 |
|
|
|
1,081,410 |
|
Mortgages payable and other secured financing, net |
|
|
26,231 |
|
|
|
1,690 |
|
|
|
1,690 |
|
|
|
1,690 |
|
|
|
26,513 |
|
Total liabilities |
|
|
1,044,467 |
|
|
|
1,148,727 |
|
|
|
1,186,168 |
|
|
|
1,200,010 |
|
|
|
1,156,526 |
|
|
|
|
|
|
|
|
|
|
|
|
|
|
|
|
|
Redeemable preferred units |
|
|
94,453 |
|
|
|
94,447 |
|
|
|
102,430 |
|
|
|
112,421 |
|
|
|
92,428 |
|
Partners' capital |
|
|
311,167 |
|
|
|
323,956 |
|
|
|
344,072 |
|
|
|
344,252 |
|
|
|
297,377 |
|
Total liabilities and partners' capital |
|
$ |
1,450,087 |
|
|
$ |
1,567,130 |
|
|
$ |
1,632,670 |
|
|
$ |
1,656,683 |
|
|
$ |
1,546,331 |
|
|
|
|
|
|
|
|
|
|
|
|
|
|
|
|
|
Net book value per BUC |
|
$ |
13.88 |
|
|
$ |
14.31 |
|
|
$ |
15.12 |
|
|
$ |
15.06 |
|
|
$ |
12.97 |
|
|
|
© 2023 Greystone & Co. II LLC |
21 |
|
|
Supplemental Financial Report for the Quarter Ended September 30, 2023 |
|
Important Disclosure Notices
Forward-Looking Statements
All statements in this document other than statements of historical facts, including statements regarding our future results of operations and financial position, business strategy and plans and objectives of management for future operations, are forward-looking statements. When used, statements which are not historical in nature, including those containing words such as “anticipate,” “estimate,” “should,” “expect,” “believe,” “intend,” and similar expressions, are intended to identify forward-looking statements. We have based forward-looking statements largely on our current expectations and projections about future events and financial trends that we believe may affect our business, financial condition and results of operations. This document may also contain estimates and other statistical data made by independent parties and by us relating to market size and growth and other industry data. This data involves a number of assumptions and limitations, and you are cautioned not to give undue weight to such estimates. We have not independently verified the statistical and other industry data generated by independent parties contained in this supplement and, accordingly, we cannot guarantee their accuracy or completeness. In addition, projections, assumptions and estimates of our future performance and the future performance of the industries in which we operate are necessarily subject to a high degree of uncertainty and risk due to a variety of factors, including those described under the headings “Item 1A Risk Factors” in our 2022 Annual Report on Form 10-K for the year ended December 31, 2022 and our Quarterly Report on Form 10-Q for the quarter ended March 31, 2023. These forward-looking statements are subject to various risks and uncertainties and Greystone Housing Impact Investors LP (the “Partnership”) expressly disclaims any obligation to publicly update or revise any forward-looking statements, whether as a result of new information, future events or otherwise.
Most, but not all, of the selected financial information furnished herein is derived from the Greystone Housing Impact Investors LP’s consolidated financial statements and related notes prepared in conformity with generally accepted accounting principles in the United States of America (“GAAP”) and management’s discussion and analysis of financial condition and results of operations included in the Partnership’s reports on Forms 10-K and 10-Q. The Partnership’s annual consolidated financial statements were subject to an independent audit, dated February 23, 2023.
Disclosure Regarding Non-GAAP Measures
This document refers to certain financial measures that are identified as non-GAAP. We believe these non-GAAP measures are helpful to investors because they are the key information used by management to analyze our operations. This supplemental information should not be considered in isolation or as a substitute for the related GAAP measures.
Please see the consolidated financial statements we filed with the Securities and Exchange Commission on Forms 10-K and 10-Q. Our GAAP consolidated financial statements can be located upon searching for the Partnership’s filings at www.sec.gov.
Other Information
On September 14, 2022, the Partnership declared a supplemental distribution payable in the form of additional BUCs equal to $0.20 per BUC (the “Third Quarter 2022 BUCs Distribution”). The Third Quarter 2022 BUCs Distribution was paid at a ratio of 0.01044 BUCs for each issued and outstanding BUC as of the record date of September 30, 2022, which represents an amount per BUC based on the closing price of the BUCs on the Nasdaq Stock Market LLC on September 13, 2022. The Third Quarter 2022 BUCs Distribution was completed on October 31, 2022.
|
|
© 2023 Greystone & Co. II LLC |
22 |
|
|
Supplemental Financial Report for the Quarter Ended September 30, 2023 |
|
On December 19, 2022, the Partnership declared a supplemental distribution payable in the form of additional BUCs equal to $0.20 per BUC (the “Fourth Quarter 2022 BUCs Distribution”). The Fourth Quarter 2022 BUCs Distribution was paid at a ratio of 0.0105 BUCs for each issued and outstanding BUC as of the record date of December 30, 2022, which represents an amount per BUC based on the closing price of the BUCs on the New York Stock Exchange ("NYSE") on December 16, 2022. The Fourth Quarter 2022 BUCs Distribution was completed on January 31, 2023.
On June 14, 2023, the Partnership declared a supplemental distribution payable in the form of additional BUCs equal to $0.07 per BUC (the “Second Quarter 2023 BUCs Distribution”). The Second Quarter 2023 BUCs Distribution was paid at a ratio of 0.00448 BUCs for each issued and outstanding BUC as of the record date of June 30, 2023, which represents an amount per BUC based on the closing price of the BUCs on the NYSE on June 13, 2023. The Second Quarter 2023 BUCs Distribution was completed on July 31, 2023.
On September 13, 2023, the Partnership declared a supplemental distribution payable in the form of additional BUCs equal to $0.07 per BUC (the “Third Quarter 2023 BUCs Distribution”, collectively with the Third Quarter 2022 BUCs Distribution, the Fourth Quarter 2022 BUCs Distribution, and the Second Quarter 2023 BUCs Distribution, the “BUCs Distributions”). The Third Quarter 2023 BUCs Distribution was paid at a ratio of 0.00418 BUCs for each issued and outstanding BUC as of the record date of September 29, 2023, which represents an amount per BUC based on the closing price of the BUCs on the NYSE on September 12, 2023. The Third Quarter 2023 BUCs Distribution was completed on October 31, 2023.
There were no fractional BUCs issued in connection with the BUCs Distributions. All fractional BUCs resulting from the BUCs Distributions received cash for such fraction based on the market value of the BUCs on the record date.
Unless noted otherwise herein, the BUCs Distributions have been applied retroactively to all net income per BUC, distributions per BUC and similar per BUC disclosures for all periods indicated in this supplemental financial report.
|
|
© 2023 Greystone & Co. II LLC |
23 |
|
|
Supplemental Financial Report for the Quarter Ended September 30, 2023 |
|
Other Partnership Information
|
|
|
|
|
Corporate Office: |
|
|
Transfer Agent: |
14301 FNB Parkway |
|
|
American Stock Transfer & Trust Company |
Suite 211 |
|
|
59 Maiden Lane |
Omaha, NE 68154 |
|
|
Plaza Level |
Phone: |
402-952-1235 |
|
New York, NY 10038 |
Investor & K-1 Services: |
855-428-2951 |
|
Phone: 718-921-8124 |
|
Web Site: |
www.ghiinvestors.com |
|
888-991-9902 |
|
K-1 Services Email: |
ghiK1s@greyco.com |
|
|
|
Ticker Symbol (NYSE): |
GHI |
|
|
|
|
|
|
Corporate Counsel: |
|
Independent Accountants: |
Barnes & Thornburg LLP |
|
PwC |
11 S. Meridian Street |
|
1 North Wacker Drive |
Indianapolis, IN 46204 |
|
Chicago, Illinois 60606 |
|
|
|
Board of Managers of Greystone AF Manager LLC: |
(acting as the directors of Greystone Housing Impact Investors LP) |
|
|
|
Stephen Rosenberg |
Chairman of the Board |
|
Jeffrey M. Baevsky |
Manager |
|
Drew C. Fletcher |
Manager |
|
Steven C. Lilly |
Manager |
|
W. Kimball Griffith |
Manager |
|
Deborah A. Wilson |
Manager |
|
Robert K. Jacobsen |
Manager |
|
|
|
|
Corporate Officers: |
Kenneth C. Rogozinski |
Chief Executive Officer |
|
Jesse A. Coury |
Chief Financial Officer |
|
|
|
© 2023 Greystone & Co. II LLC |
24 |
v3.23.3
| X |
- DefinitionBoolean flag that is true when the XBRL content amends previously-filed or accepted submission.
| Name: |
dei_AmendmentFlag |
| Namespace Prefix: |
dei_ |
| Data Type: |
xbrli:booleanItemType |
| Balance Type: |
na |
| Period Type: |
duration |
|
| X |
- DefinitionFor the EDGAR submission types of Form 8-K: the date of the report, the date of the earliest event reported; for the EDGAR submission types of Form N-1A: the filing date; for all other submission types: the end of the reporting or transition period. The format of the date is YYYY-MM-DD.
| Name: |
dei_DocumentPeriodEndDate |
| Namespace Prefix: |
dei_ |
| Data Type: |
xbrli:dateItemType |
| Balance Type: |
na |
| Period Type: |
duration |
|
| X |
- DefinitionThe type of document being provided (such as 10-K, 10-Q, 485BPOS, etc). The document type is limited to the same value as the supporting SEC submission type, or the word 'Other'.
| Name: |
dei_DocumentType |
| Namespace Prefix: |
dei_ |
| Data Type: |
dei:submissionTypeItemType |
| Balance Type: |
na |
| Period Type: |
duration |
|
| X |
- DefinitionAddress Line 1 such as Attn, Building Name, Street Name
| Name: |
dei_EntityAddressAddressLine1 |
| Namespace Prefix: |
dei_ |
| Data Type: |
xbrli:normalizedStringItemType |
| Balance Type: |
na |
| Period Type: |
duration |
|
| X |
- Definition
+ References
+ Details
| Name: |
dei_EntityAddressCityOrTown |
| Namespace Prefix: |
dei_ |
| Data Type: |
xbrli:normalizedStringItemType |
| Balance Type: |
na |
| Period Type: |
duration |
|
| X |
- DefinitionCode for the postal or zip code
| Name: |
dei_EntityAddressPostalZipCode |
| Namespace Prefix: |
dei_ |
| Data Type: |
xbrli:normalizedStringItemType |
| Balance Type: |
na |
| Period Type: |
duration |
|
| X |
- DefinitionName of the state or province.
| Name: |
dei_EntityAddressStateOrProvince |
| Namespace Prefix: |
dei_ |
| Data Type: |
dei:stateOrProvinceItemType |
| Balance Type: |
na |
| Period Type: |
duration |
|
| X |
- DefinitionA unique 10-digit SEC-issued value to identify entities that have filed disclosures with the SEC. It is commonly abbreviated as CIK. Reference 1: http://www.xbrl.org/2003/role/presentationRef
-Publisher SEC
-Name Exchange Act
-Number 240
-Section 12
-Subsection b-2
| Name: |
dei_EntityCentralIndexKey |
| Namespace Prefix: |
dei_ |
| Data Type: |
dei:centralIndexKeyItemType |
| Balance Type: |
na |
| Period Type: |
duration |
|
| X |
- DefinitionIndicate if registrant meets the emerging growth company criteria. Reference 1: http://www.xbrl.org/2003/role/presentationRef
-Publisher SEC
-Name Exchange Act
-Number 240
-Section 12
-Subsection b-2
| Name: |
dei_EntityEmergingGrowthCompany |
| Namespace Prefix: |
dei_ |
| Data Type: |
xbrli:booleanItemType |
| Balance Type: |
na |
| Period Type: |
duration |
|
| X |
- DefinitionCommission file number. The field allows up to 17 characters. The prefix may contain 1-3 digits, the sequence number may contain 1-8 digits, the optional suffix may contain 1-4 characters, and the fields are separated with a hyphen.
| Name: |
dei_EntityFileNumber |
| Namespace Prefix: |
dei_ |
| Data Type: |
dei:fileNumberItemType |
| Balance Type: |
na |
| Period Type: |
duration |
|
| X |
- DefinitionTwo-character EDGAR code representing the state or country of incorporation.
| Name: |
dei_EntityIncorporationStateCountryCode |
| Namespace Prefix: |
dei_ |
| Data Type: |
dei:edgarStateCountryItemType |
| Balance Type: |
na |
| Period Type: |
duration |
|
| X |
- DefinitionThe exact name of the entity filing the report as specified in its charter, which is required by forms filed with the SEC. Reference 1: http://www.xbrl.org/2003/role/presentationRef
-Publisher SEC
-Name Exchange Act
-Number 240
-Section 12
-Subsection b-2
| Name: |
dei_EntityRegistrantName |
| Namespace Prefix: |
dei_ |
| Data Type: |
xbrli:normalizedStringItemType |
| Balance Type: |
na |
| Period Type: |
duration |
|
| X |
- DefinitionThe Tax Identification Number (TIN), also known as an Employer Identification Number (EIN), is a unique 9-digit value assigned by the IRS. Reference 1: http://www.xbrl.org/2003/role/presentationRef
-Publisher SEC
-Name Exchange Act
-Number 240
-Section 12
-Subsection b-2
| Name: |
dei_EntityTaxIdentificationNumber |
| Namespace Prefix: |
dei_ |
| Data Type: |
dei:employerIdItemType |
| Balance Type: |
na |
| Period Type: |
duration |
|
| X |
- DefinitionLocal phone number for entity.
| Name: |
dei_LocalPhoneNumber |
| Namespace Prefix: |
dei_ |
| Data Type: |
xbrli:normalizedStringItemType |
| Balance Type: |
na |
| Period Type: |
duration |
|
| X |
- DefinitionBoolean flag that is true when the Form 8-K filing is intended to satisfy the filing obligation of the registrant as pre-commencement communications pursuant to Rule 13e-4(c) under the Exchange Act. Reference 1: http://www.xbrl.org/2003/role/presentationRef
-Publisher SEC
-Name Exchange Act
-Number 240
-Section 13e
-Subsection 4c
| Name: |
dei_PreCommencementIssuerTenderOffer |
| Namespace Prefix: |
dei_ |
| Data Type: |
xbrli:booleanItemType |
| Balance Type: |
na |
| Period Type: |
duration |
|
| X |
- DefinitionBoolean flag that is true when the Form 8-K filing is intended to satisfy the filing obligation of the registrant as pre-commencement communications pursuant to Rule 14d-2(b) under the Exchange Act. Reference 1: http://www.xbrl.org/2003/role/presentationRef
-Publisher SEC
-Name Exchange Act
-Number 240
-Section 14d
-Subsection 2b
| Name: |
dei_PreCommencementTenderOffer |
| Namespace Prefix: |
dei_ |
| Data Type: |
xbrli:booleanItemType |
| Balance Type: |
na |
| Period Type: |
duration |
|
| X |
- DefinitionTitle of a 12(b) registered security. Reference 1: http://www.xbrl.org/2003/role/presentationRef
-Publisher SEC
-Name Exchange Act
-Number 240
-Section 12
-Subsection b
| Name: |
dei_Security12bTitle |
| Namespace Prefix: |
dei_ |
| Data Type: |
dei:securityTitleItemType |
| Balance Type: |
na |
| Period Type: |
duration |
|
| X |
- DefinitionName of the Exchange on which a security is registered. Reference 1: http://www.xbrl.org/2003/role/presentationRef
-Publisher SEC
-Name Exchange Act
-Number 240
-Section 12
-Subsection d1-1
| Name: |
dei_SecurityExchangeName |
| Namespace Prefix: |
dei_ |
| Data Type: |
dei:edgarExchangeCodeItemType |
| Balance Type: |
na |
| Period Type: |
duration |
|
| X |
- DefinitionBoolean flag that is true when the Form 8-K filing is intended to satisfy the filing obligation of the registrant as soliciting material pursuant to Rule 14a-12 under the Exchange Act. Reference 1: http://www.xbrl.org/2003/role/presentationRef
-Publisher SEC
-Name Exchange Act
-Section 14a
-Number 240
-Subsection 12
| Name: |
dei_SolicitingMaterial |
| Namespace Prefix: |
dei_ |
| Data Type: |
xbrli:booleanItemType |
| Balance Type: |
na |
| Period Type: |
duration |
|
| X |
- DefinitionTrading symbol of an instrument as listed on an exchange.
| Name: |
dei_TradingSymbol |
| Namespace Prefix: |
dei_ |
| Data Type: |
dei:tradingSymbolItemType |
| Balance Type: |
na |
| Period Type: |
duration |
|
| X |
- DefinitionBoolean flag that is true when the Form 8-K filing is intended to satisfy the filing obligation of the registrant as written communications pursuant to Rule 425 under the Securities Act. Reference 1: http://www.xbrl.org/2003/role/presentationRef
-Publisher SEC
-Name Securities Act
-Number 230
-Section 425
| Name: |
dei_WrittenCommunications |
| Namespace Prefix: |
dei_ |
| Data Type: |
xbrli:booleanItemType |
| Balance Type: |
na |
| Period Type: |
duration |
|
Greystone Housing Impact... (NYSE:GHI)
Historical Stock Chart
From Apr 2024 to May 2024

Greystone Housing Impact... (NYSE:GHI)
Historical Stock Chart
From May 2023 to May 2024
