000136425012/312023Q3false00013642502023-01-012023-09-3000013642502023-10-27xbrli:shares00013642502023-09-30iso4217:USD00013642502022-12-31iso4217:USDxbrli:shares0001364250nysedei:RentalRevenueAndTenantRecoveryRevenueMembernysedei:OfficeSegmentMember2023-07-012023-09-300001364250nysedei:RentalRevenueAndTenantRecoveryRevenueMembernysedei:OfficeSegmentMember2022-07-012022-09-300001364250nysedei:RentalRevenueAndTenantRecoveryRevenueMembernysedei:OfficeSegmentMember2023-01-012023-09-300001364250nysedei:RentalRevenueAndTenantRecoveryRevenueMembernysedei:OfficeSegmentMember2022-01-012022-09-300001364250nysedei:ParkingRevenueAndOtherIncomeMembernysedei:OfficeSegmentMember2023-07-012023-09-300001364250nysedei:ParkingRevenueAndOtherIncomeMembernysedei:OfficeSegmentMember2022-07-012022-09-300001364250nysedei:ParkingRevenueAndOtherIncomeMembernysedei:OfficeSegmentMember2023-01-012023-09-300001364250nysedei:ParkingRevenueAndOtherIncomeMembernysedei:OfficeSegmentMember2022-01-012022-09-300001364250nysedei:OfficeSegmentMember2023-07-012023-09-300001364250nysedei:OfficeSegmentMember2022-07-012022-09-300001364250nysedei:OfficeSegmentMember2023-01-012023-09-300001364250nysedei:OfficeSegmentMember2022-01-012022-09-300001364250nysedei:MultifamilySegmentMembernysedei:RentalRevenueMember2023-07-012023-09-300001364250nysedei:MultifamilySegmentMembernysedei:RentalRevenueMember2022-07-012022-09-300001364250nysedei:MultifamilySegmentMembernysedei:RentalRevenueMember2023-01-012023-09-300001364250nysedei:MultifamilySegmentMembernysedei:RentalRevenueMember2022-01-012022-09-300001364250nysedei:ParkingRevenueAndOtherIncomeMembernysedei:MultifamilySegmentMember2023-07-012023-09-300001364250nysedei:ParkingRevenueAndOtherIncomeMembernysedei:MultifamilySegmentMember2022-07-012022-09-300001364250nysedei:ParkingRevenueAndOtherIncomeMembernysedei:MultifamilySegmentMember2023-01-012023-09-300001364250nysedei:ParkingRevenueAndOtherIncomeMembernysedei:MultifamilySegmentMember2022-01-012022-09-300001364250nysedei:MultifamilySegmentMember2023-07-012023-09-300001364250nysedei:MultifamilySegmentMember2022-07-012022-09-300001364250nysedei:MultifamilySegmentMember2023-01-012023-09-300001364250nysedei:MultifamilySegmentMember2022-01-012022-09-3000013642502023-07-012023-09-3000013642502022-07-012022-09-3000013642502022-01-012022-09-300001364250us-gaap:CommonStockMember2023-06-300001364250us-gaap:CommonStockMember2022-06-300001364250us-gaap:CommonStockMember2022-12-310001364250us-gaap:CommonStockMember2021-12-310001364250us-gaap:CommonStockMember2022-07-012022-09-300001364250us-gaap:CommonStockMember2022-01-012022-09-300001364250us-gaap:CommonStockMember2023-01-012023-09-300001364250us-gaap:CommonStockMember2023-09-300001364250us-gaap:CommonStockMember2022-09-300001364250us-gaap:AdditionalPaidInCapitalMember2023-06-300001364250us-gaap:AdditionalPaidInCapitalMember2022-06-300001364250us-gaap:AdditionalPaidInCapitalMember2022-12-310001364250us-gaap:AdditionalPaidInCapitalMember2021-12-310001364250us-gaap:AdditionalPaidInCapitalMember2022-07-012022-09-300001364250us-gaap:AdditionalPaidInCapitalMember2022-01-012022-09-300001364250us-gaap:AdditionalPaidInCapitalMember2023-07-012023-09-300001364250us-gaap:AdditionalPaidInCapitalMember2023-01-012023-09-300001364250us-gaap:AdditionalPaidInCapitalMember2023-09-300001364250us-gaap:AdditionalPaidInCapitalMember2022-09-300001364250us-gaap:AccumulatedOtherComprehensiveIncomeMember2023-06-300001364250us-gaap:AccumulatedOtherComprehensiveIncomeMember2022-06-300001364250us-gaap:AccumulatedOtherComprehensiveIncomeMember2022-12-310001364250us-gaap:AccumulatedOtherComprehensiveIncomeMember2021-12-310001364250us-gaap:AccumulatedOtherComprehensiveIncomeMember2023-07-012023-09-300001364250us-gaap:AccumulatedOtherComprehensiveIncomeMember2022-07-012022-09-300001364250us-gaap:AccumulatedOtherComprehensiveIncomeMember2023-01-012023-09-300001364250us-gaap:AccumulatedOtherComprehensiveIncomeMember2022-01-012022-09-300001364250us-gaap:AccumulatedOtherComprehensiveIncomeMember2023-09-300001364250us-gaap:AccumulatedOtherComprehensiveIncomeMember2022-09-300001364250us-gaap:AccumulatedDistributionsInExcessOfNetIncomeMember2023-06-300001364250us-gaap:AccumulatedDistributionsInExcessOfNetIncomeMember2022-06-300001364250us-gaap:AccumulatedDistributionsInExcessOfNetIncomeMember2022-12-310001364250us-gaap:AccumulatedDistributionsInExcessOfNetIncomeMember2021-12-310001364250us-gaap:AccumulatedDistributionsInExcessOfNetIncomeMember2023-07-012023-09-300001364250us-gaap:AccumulatedDistributionsInExcessOfNetIncomeMember2022-07-012022-09-300001364250us-gaap:AccumulatedDistributionsInExcessOfNetIncomeMember2023-01-012023-09-300001364250us-gaap:AccumulatedDistributionsInExcessOfNetIncomeMember2022-01-012022-09-300001364250us-gaap:AccumulatedDistributionsInExcessOfNetIncomeMember2023-09-300001364250us-gaap:AccumulatedDistributionsInExcessOfNetIncomeMember2022-09-300001364250us-gaap:NoncontrollingInterestMember2023-06-300001364250us-gaap:NoncontrollingInterestMember2022-06-300001364250us-gaap:NoncontrollingInterestMember2022-12-310001364250us-gaap:NoncontrollingInterestMember2021-12-310001364250us-gaap:NoncontrollingInterestMember2023-07-012023-09-300001364250us-gaap:NoncontrollingInterestMember2022-07-012022-09-300001364250us-gaap:NoncontrollingInterestMember2023-01-012023-09-300001364250us-gaap:NoncontrollingInterestMember2022-01-012022-09-300001364250us-gaap:NoncontrollingInterestMember2023-09-300001364250us-gaap:NoncontrollingInterestMember2022-09-3000013642502023-06-3000013642502022-06-3000013642502021-12-3100013642502022-09-300001364250us-gaap:EquityMethodInvestmentNonconsolidatedInvesteeOrGroupOfInvesteesMember2023-01-012023-09-300001364250us-gaap:EquityMethodInvestmentNonconsolidatedInvesteeOrGroupOfInvesteesMember2022-01-012022-09-300001364250nysedei:WhollyOwnedAndConsolidatedPropertiesMembersrt:OfficeBuildingMember2023-09-30utr:sqft0001364250srt:MultifamilyMembernysedei:WhollyOwnedAndConsolidatedPropertiesMember2023-09-30nysedei:unit0001364250nysedei:WhollyOwnedAndConsolidatedPropertiesMember2023-09-30nysedei:parcel0001364250us-gaap:UnconsolidatedPropertiesMembersrt:OfficeBuildingMember2022-09-300001364250us-gaap:UnconsolidatedPropertiesMembersrt:OfficeBuildingMember2023-09-300001364250us-gaap:WhollyOwnedPropertiesMembersrt:ReportableLegalEntitiesMembersrt:OfficeBuildingMember2023-09-30nysedei:property0001364250us-gaap:WhollyOwnedPropertiesMembersrt:OfficeBuildingMember2023-09-300001364250srt:ReportableLegalEntitiesMembersrt:OfficeBuildingMemberus-gaap:ConsolidatedPropertiesMember2023-09-300001364250srt:OfficeBuildingMemberus-gaap:ConsolidatedPropertiesMember2023-09-300001364250us-gaap:UnconsolidatedPropertiesMembersrt:ReportableLegalEntitiesMembersrt:OfficeBuildingMember2023-09-300001364250srt:ReportableLegalEntitiesMembersrt:OfficeBuildingMember2023-09-300001364250srt:OfficeBuildingMember2023-09-300001364250us-gaap:WhollyOwnedPropertiesMembersrt:MultifamilyMembersrt:ReportableLegalEntitiesMember2023-09-300001364250us-gaap:WhollyOwnedPropertiesMembersrt:MultifamilyMember2023-09-300001364250srt:MultifamilyMembersrt:ReportableLegalEntitiesMemberus-gaap:ConsolidatedPropertiesMember2023-09-300001364250srt:MultifamilyMemberus-gaap:ConsolidatedPropertiesMember2023-09-300001364250srt:MultifamilyMembersrt:ReportableLegalEntitiesMember2023-09-300001364250srt:MultifamilyMember2023-09-300001364250srt:ReportableLegalEntitiesMember2023-09-300001364250srt:SubsidiariesMember2023-09-300001364250srt:SubsidiariesMember2022-12-31nysedei:venture0001364250nysedei:SubsidiariesAndJointVenturesMember2023-09-300001364250nysedei:SubsidiariesAndJointVenturesMember2022-12-310001364250nysedei:OfficeRevenuesMember2023-07-012023-09-300001364250nysedei:OfficeRevenuesMember2022-07-012022-09-300001364250nysedei:OfficeRevenuesMember2023-01-012023-09-300001364250nysedei:OfficeRevenuesMember2022-01-012022-09-300001364250us-gaap:BuildingImprovementsMember2023-09-300001364250srt:MultifamilyMember2022-04-262022-04-260001364250srt:MultifamilyMember2022-04-260001364250us-gaap:VariableInterestEntityPrimaryBeneficiaryMember2022-04-262022-04-26xbrli:pure0001364250nysedei:A1221OceanAvenueMemberus-gaap:LandMember2023-01-012023-09-300001364250nysedei:A1221OceanAvenueMemberus-gaap:BuildingAndBuildingImprovementsMember2023-01-012023-09-300001364250nysedei:A1221OceanAvenueMember2023-01-012023-09-300001364250nysedei:AboveMarketTenantLeasesMember2023-09-300001364250nysedei:AboveMarketTenantLeasesMember2022-12-310001364250nysedei:AboveMarketGroundLeasesMember2023-09-300001364250nysedei:AboveMarketGroundLeasesMember2022-12-310001364250nysedei:BelowMarketTenantLeasesMember2023-09-300001364250nysedei:BelowMarketTenantLeasesMember2022-12-310001364250nysedei:TenantLeaseMembernysedei:OperatingLeaseRevenueMember2023-07-012023-09-300001364250nysedei:TenantLeaseMembernysedei:OperatingLeaseRevenueMember2022-07-012022-09-300001364250nysedei:TenantLeaseMembernysedei:OperatingLeaseRevenueMember2023-01-012023-09-300001364250nysedei:TenantLeaseMembernysedei:OperatingLeaseRevenueMember2022-01-012022-09-300001364250nysedei:AboveMarketGroundLeasesMembernysedei:OfficeParkingAndOtherIncomeMember2023-07-012023-09-300001364250nysedei:AboveMarketGroundLeasesMembernysedei:OfficeParkingAndOtherIncomeMember2022-07-012022-09-300001364250nysedei:AboveMarketGroundLeasesMembernysedei:OfficeParkingAndOtherIncomeMember2023-01-012023-09-300001364250nysedei:AboveMarketGroundLeasesMembernysedei:OfficeParkingAndOtherIncomeMember2022-01-012022-09-300001364250nysedei:PartnershipXMember2022-09-300001364250nysedei:PartnershipXMember2023-09-300001364250us-gaap:EquityMethodInvestmentNonconsolidatedInvesteeOrGroupOfInvesteesMember2023-09-300001364250us-gaap:EquityMethodInvestmentNonconsolidatedInvesteeOrGroupOfInvesteesMember2022-12-310001364250srt:SubsidiariesMembernysedei:FannieMaeLoanJune12027MaturityMemberus-gaap:SecuredDebtMember2023-09-300001364250srt:SubsidiariesMembernysedei:TermLoanMarch32025MaturityMemberus-gaap:SecuredDebtMember2023-01-012023-09-300001364250srt:SubsidiariesMembernysedei:TermLoanMarch32025MaturityMemberus-gaap:SecuredDebtMember2023-09-300001364250srt:SubsidiariesMembernysedei:TermLoanMarch32025MaturityMemberus-gaap:SecuredDebtMember2022-12-310001364250srt:SubsidiariesMembernysedei:TermLoanMarch32025MaturityMembernysedei:SecuredOvernightFinancingRateSOFRMemberus-gaap:SecuredDebtMember2023-01-012023-09-300001364250srt:SubsidiariesMemberus-gaap:SecuredDebtMembernysedei:FannieMaeLoanApril12025MaturityMember2023-01-012023-09-300001364250srt:SubsidiariesMemberus-gaap:SecuredDebtMembernysedei:FannieMaeLoanApril12025MaturityMember2023-09-300001364250srt:SubsidiariesMemberus-gaap:SecuredDebtMembernysedei:FannieMaeLoanApril12025MaturityMember2022-12-310001364250srt:SubsidiariesMembernysedei:SecuredOvernightFinancingRateSOFRMemberus-gaap:SecuredDebtMembernysedei:FannieMaeLoanApril12025MaturityMember2023-01-012023-09-300001364250srt:SubsidiariesMembernysedei:TermLoanAug152026MaturityMemberus-gaap:SecuredDebtMember2023-01-012023-09-300001364250srt:SubsidiariesMembernysedei:TermLoanAug152026MaturityMemberus-gaap:SecuredDebtMember2023-09-300001364250srt:SubsidiariesMembernysedei:TermLoanAug152026MaturityMemberus-gaap:SecuredDebtMember2022-12-310001364250srt:SubsidiariesMembernysedei:TermLoanAug152026MaturityMembernysedei:SecuredOvernightFinancingRateSOFRMemberus-gaap:SecuredDebtMember2023-01-012023-09-300001364250srt:SubsidiariesMembernysedei:TermLoanSep192026MaturityMemberus-gaap:SecuredDebtMember2023-01-012023-09-300001364250srt:SubsidiariesMembernysedei:TermLoanSep192026MaturityMemberus-gaap:SecuredDebtMember2023-09-300001364250srt:SubsidiariesMembernysedei:TermLoanSep192026MaturityMemberus-gaap:SecuredDebtMember2022-12-310001364250srt:SubsidiariesMembernysedei:TermLoanSep192026MaturityMembernysedei:SecuredOvernightFinancingRateSOFRMemberus-gaap:SecuredDebtMember2023-01-012023-09-300001364250srt:SubsidiariesMembernysedei:TermLoanSep262026MaturityMemberus-gaap:SecuredDebtMember2023-01-012023-09-300001364250srt:SubsidiariesMembernysedei:TermLoanSep262026MaturityMemberus-gaap:SecuredDebtMember2023-09-300001364250srt:SubsidiariesMembernysedei:TermLoanSep262026MaturityMemberus-gaap:SecuredDebtMember2022-12-310001364250srt:SubsidiariesMembernysedei:TermLoanSep262026MaturityMembernysedei:SecuredOvernightFinancingRateSOFRMemberus-gaap:SecuredDebtMember2023-01-012023-09-300001364250srt:SubsidiariesMembernysedei:TermLoanNov12026MaturityMemberus-gaap:SecuredDebtMember2023-01-012023-09-300001364250srt:SubsidiariesMembernysedei:TermLoanNov12026MaturityMemberus-gaap:SecuredDebtMember2023-09-300001364250srt:SubsidiariesMembernysedei:TermLoanNov12026MaturityMemberus-gaap:SecuredDebtMember2022-12-310001364250srt:SubsidiariesMembernysedei:TermLoanNov12026MaturityMembernysedei:SecuredOvernightFinancingRateSOFRMemberus-gaap:SecuredDebtMember2023-01-012023-09-300001364250srt:SubsidiariesMembernysedei:FannieMaeLoanJune12027MaturityMemberus-gaap:SecuredDebtMember2023-01-012023-09-300001364250srt:SubsidiariesMembernysedei:FannieMaeLoanJune12027MaturityMemberus-gaap:SecuredDebtMember2022-12-310001364250srt:SubsidiariesMembernysedei:FannieMaeLoanJune12027MaturityMembernysedei:SecuredOvernightFinancingRateSOFRMemberus-gaap:SecuredDebtMember2023-01-012023-09-300001364250srt:SubsidiariesMemberus-gaap:SecuredDebtMembernysedei:TermLoanMay182028MaturityMember2023-01-012023-09-300001364250srt:SubsidiariesMemberus-gaap:SecuredDebtMembernysedei:TermLoanMay182028MaturityMember2023-09-300001364250srt:SubsidiariesMemberus-gaap:SecuredDebtMembernysedei:TermLoanMay182028MaturityMember2022-12-310001364250srt:SubsidiariesMembernysedei:SecuredOvernightFinancingRateSOFRMemberus-gaap:SecuredDebtMembernysedei:TermLoanMay182028MaturityMember2023-01-012023-09-300001364250srt:SubsidiariesMembernysedei:TermLoanJanuary12029MaturityMemberus-gaap:SecuredDebtMember2023-01-012023-09-300001364250srt:SubsidiariesMembernysedei:TermLoanJanuary12029MaturityMemberus-gaap:SecuredDebtMember2023-09-300001364250srt:SubsidiariesMembernysedei:TermLoanJanuary12029MaturityMemberus-gaap:SecuredDebtMember2022-12-310001364250srt:SubsidiariesMembernysedei:TermLoanJanuary12029MaturityMembernysedei:SecuredOvernightFinancingRateSOFRMemberus-gaap:SecuredDebtMember2023-01-012023-09-300001364250srt:SubsidiariesMembernysedei:FannieMaeLoanMHAJune12029MaturityMemberus-gaap:SecuredDebtMember2023-01-012023-09-300001364250srt:SubsidiariesMembernysedei:FannieMaeLoanMHAJune12029MaturityMemberus-gaap:SecuredDebtMember2023-09-300001364250srt:SubsidiariesMembernysedei:FannieMaeLoanMHAJune12029MaturityMemberus-gaap:SecuredDebtMember2022-12-310001364250srt:SubsidiariesMembernysedei:FannieMaeLoanMHAJune12029MaturityMembernysedei:SecuredOvernightFinancingRateSOFRMemberus-gaap:SecuredDebtMember2023-01-012023-09-300001364250srt:SubsidiariesMemberus-gaap:SecuredDebtMembernysedei:FannieMaeLoansBoutiquesJune12029MaturityMember2023-01-012023-09-300001364250srt:SubsidiariesMemberus-gaap:SecuredDebtMembernysedei:FannieMaeLoansBoutiquesJune12029MaturityMember2023-09-300001364250srt:SubsidiariesMemberus-gaap:SecuredDebtMembernysedei:FannieMaeLoansBoutiquesJune12029MaturityMember2022-12-310001364250srt:SubsidiariesMembernysedei:SecuredOvernightFinancingRateSOFRMemberus-gaap:SecuredDebtMembernysedei:FannieMaeLoansBoutiquesJune12029MaturityMember2023-01-012023-09-300001364250srt:SubsidiariesMembernysedei:FannieMaeLoanAugust12033MaturityMemberus-gaap:SecuredDebtMember2023-01-012023-09-300001364250srt:SubsidiariesMembernysedei:FannieMaeLoanAugust12033MaturityMemberus-gaap:SecuredDebtMember2023-09-300001364250srt:SubsidiariesMembernysedei:FannieMaeLoanAugust12033MaturityMemberus-gaap:SecuredDebtMember2022-12-310001364250srt:SubsidiariesMembernysedei:FannieMaeLoanAugust12033MaturityMembernysedei:SecuredOvernightFinancingRateSOFRMemberus-gaap:SecuredDebtMember2023-01-012023-09-300001364250srt:SubsidiariesMembernysedei:TermLoanFixedJune12038MaturityMemberus-gaap:SecuredDebtMember2023-01-012023-09-300001364250srt:SubsidiariesMembernysedei:TermLoanFixedJune12038MaturityMemberus-gaap:SecuredDebtMember2023-09-300001364250srt:SubsidiariesMembernysedei:TermLoanFixedJune12038MaturityMemberus-gaap:SecuredDebtMember2022-12-310001364250nysedei:TermLoanDecember192024MaturityMembersrt:AffiliatedEntityMemberus-gaap:SecuredDebtMember2023-01-012023-09-300001364250nysedei:TermLoanDecember192024MaturityMembersrt:AffiliatedEntityMemberus-gaap:SecuredDebtMember2023-09-300001364250nysedei:TermLoanDecember192024MaturityMembersrt:AffiliatedEntityMemberus-gaap:SecuredDebtMember2022-12-310001364250nysedei:TermLoanDecember192024MaturityMembersrt:AffiliatedEntityMembernysedei:SecuredOvernightFinancingRateSOFRMemberus-gaap:SecuredDebtMember2023-01-012023-09-300001364250srt:AffiliatedEntityMemberus-gaap:SecuredDebtMembernysedei:TermLoanMay152027MaturityMember2023-01-012023-09-300001364250srt:AffiliatedEntityMemberus-gaap:SecuredDebtMembernysedei:TermLoanMay152027MaturityMember2023-09-300001364250srt:AffiliatedEntityMemberus-gaap:SecuredDebtMembernysedei:TermLoanMay152027MaturityMember2022-12-310001364250srt:AffiliatedEntityMembernysedei:SecuredOvernightFinancingRateSOFRMemberus-gaap:SecuredDebtMembernysedei:TermLoanMay152027MaturityMember2023-01-012023-09-300001364250srt:AffiliatedEntityMemberus-gaap:SecuredDebtMembernysedei:TermLoanAugust192028MaturityMember2023-01-012023-09-300001364250srt:AffiliatedEntityMemberus-gaap:SecuredDebtMembernysedei:TermLoanAugust192028MaturityMember2023-09-300001364250srt:AffiliatedEntityMemberus-gaap:SecuredDebtMembernysedei:TermLoanAugust192028MaturityMember2022-12-310001364250srt:AffiliatedEntityMembernysedei:SecuredOvernightFinancingRateSOFRMemberus-gaap:SecuredDebtMembernysedei:TermLoanAugust192028MaturityMember2023-01-012023-09-300001364250nysedei:TermLoanApril262029MaturityMembersrt:AffiliatedEntityMemberus-gaap:SecuredDebtMember2023-01-012023-09-300001364250nysedei:TermLoanApril262029MaturityMembersrt:AffiliatedEntityMemberus-gaap:SecuredDebtMember2023-09-300001364250nysedei:TermLoanApril262029MaturityMembersrt:AffiliatedEntityMemberus-gaap:SecuredDebtMember2022-12-310001364250nysedei:TermLoanApril262029MaturityMembersrt:AffiliatedEntityMembernysedei:SecuredOvernightFinancingRateSOFRMemberus-gaap:SecuredDebtMember2023-01-012023-09-300001364250srt:AffiliatedEntityMemberus-gaap:SecuredDebtMembernysedei:FannieMaeLoanJune12029MaturityMember2023-01-012023-09-300001364250srt:AffiliatedEntityMemberus-gaap:SecuredDebtMembernysedei:FannieMaeLoanJune12029MaturityMember2023-09-300001364250srt:AffiliatedEntityMemberus-gaap:SecuredDebtMembernysedei:FannieMaeLoanJune12029MaturityMember2022-12-310001364250srt:AffiliatedEntityMembernysedei:SecuredOvernightFinancingRateSOFRMemberus-gaap:SecuredDebtMembernysedei:FannieMaeLoanJune12029MaturityMember2023-01-012023-09-300001364250us-gaap:SecuredDebtMembernysedei:SecuredOvernightFinancingRateSOFRMember2023-01-012023-09-300001364250srt:SubsidiariesMembernysedei:FannieMaeLoanJune12027MaturityMember2023-09-300001364250srt:SubsidiariesMembernysedei:FannieMaeLoanAugust12033MaturityMember2023-09-300001364250nysedei:TermLoanFixedJune12038MaturityMemberus-gaap:SecuredDebtMember2023-01-012023-09-300001364250nysedei:EffectiveFixedRateLoansMember2023-09-300001364250nysedei:EffectiveFixedRateLoansMember2022-12-310001364250nysedei:FixedRateLoansMember2023-09-300001364250nysedei:FixedRateLoansMember2022-12-310001364250nysedei:CappedRateLoansMember2023-09-300001364250nysedei:CappedRateLoansMember2022-12-310001364250nysedei:VariableRateLoansMember2023-09-300001364250nysedei:VariableRateLoansMember2022-12-310001364250us-gaap:InterestExpenseMember2023-07-012023-09-300001364250us-gaap:InterestExpenseMember2022-07-012022-09-300001364250us-gaap:InterestExpenseMember2023-01-012023-09-300001364250us-gaap:InterestExpenseMember2022-01-012022-09-300001364250us-gaap:InterestRateSwapMemberus-gaap:DesignatedAsHedgingInstrumentMemberus-gaap:CashFlowHedgingMember2023-09-30nysedei:instrument0001364250us-gaap:DesignatedAsHedgingInstrumentMemberus-gaap:InterestRateCapMemberus-gaap:CashFlowHedgingMember2023-09-300001364250us-gaap:InterestRateSwapMemberus-gaap:DesignatedAsHedgingInstrumentMemberus-gaap:CashFlowHedgingMemberus-gaap:EquityMethodInvestmentNonconsolidatedInvesteeOrGroupOfInvesteesMember2023-09-300001364250us-gaap:NondesignatedMemberus-gaap:InterestRateCapMember2023-09-300001364250us-gaap:DesignatedAsHedgingInstrumentMemberus-gaap:InterestRateCapMemberus-gaap:CashFlowHedgingMembernysedei:InterestRateCapPurchasedNotionalAmountMember2023-09-300001364250nysedei:InterestRateCapExpiredNotionalAmountMemberus-gaap:NondesignatedMemberus-gaap:InterestRateCapMember2023-06-300001364250us-gaap:InterestRateSwapMemberus-gaap:DesignatedAsHedgingInstrumentMemberus-gaap:CashFlowHedgingMember2022-12-310001364250us-gaap:InterestRateSwapMemberus-gaap:DesignatedAsHedgingInstrumentMemberus-gaap:CashFlowHedgingMemberus-gaap:EquityMethodInvestmentNonconsolidatedInvesteeOrGroupOfInvesteesMember2022-12-310001364250us-gaap:DesignatedAsHedgingInstrumentMemberus-gaap:CashFlowHedgingMember2023-01-012023-09-300001364250us-gaap:DesignatedAsHedgingInstrumentMemberus-gaap:CashFlowHedgingMember2022-01-012022-09-300001364250us-gaap:DesignatedAsHedgingInstrumentMemberus-gaap:CashFlowHedgingMemberus-gaap:EquityMethodInvestmentNonconsolidatedInvesteeOrGroupOfInvesteesMember2023-01-012023-09-300001364250us-gaap:DesignatedAsHedgingInstrumentMemberus-gaap:CashFlowHedgingMemberus-gaap:EquityMethodInvestmentNonconsolidatedInvesteeOrGroupOfInvesteesMember2022-01-012022-09-300001364250us-gaap:NondesignatedMemberus-gaap:CashFlowHedgingMemberus-gaap:InterestExpenseMember2023-01-012023-09-300001364250us-gaap:NondesignatedMemberus-gaap:CashFlowHedgingMemberus-gaap:InterestExpenseMember2022-01-012022-09-300001364250nysedei:UnconsolidatedFundsMember2023-09-300001364250us-gaap:VariableInterestEntityPrimaryBeneficiaryMember2022-01-012022-09-300001364250srt:MultifamilyMember2022-01-012022-09-300001364250srt:MultifamilyMemberus-gaap:InvestorMember2022-01-012022-09-300001364250nysedei:DouglasEmmettOperatingPartnershipMember2023-09-3000013642502023-05-240001364250nysedei:OperatingPartnershipUnitsMember2023-07-012023-09-300001364250nysedei:OperatingPartnershipUnitsMember2022-07-012022-09-300001364250nysedei:OperatingPartnershipUnitsMember2023-01-012023-09-300001364250nysedei:OperatingPartnershipUnitsMember2022-01-012022-09-300001364250nysedei:VestedLongTermIncentivePlanLTIPUnitsMember2023-07-012023-09-300001364250nysedei:VestedLongTermIncentivePlanLTIPUnitsMember2022-07-012022-09-300001364250nysedei:VestedLongTermIncentivePlanLTIPUnitsMember2023-01-012023-09-300001364250nysedei:VestedLongTermIncentivePlanLTIPUnitsMember2022-01-012022-09-300001364250us-gaap:EstimateOfFairValueFairValueDisclosureMemberus-gaap:FairValueInputsLevel2Member2023-09-300001364250us-gaap:EstimateOfFairValueFairValueDisclosureMemberus-gaap:FairValueInputsLevel2Member2022-12-310001364250us-gaap:FairValueInputsLevel2Memberus-gaap:CarryingReportedAmountFairValueDisclosureMember2023-09-300001364250us-gaap:FairValueInputsLevel2Memberus-gaap:CarryingReportedAmountFairValueDisclosureMember2022-12-310001364250us-gaap:FairValueInputsLevel2Member2023-09-300001364250us-gaap:FairValueInputsLevel2Member2022-12-310001364250us-gaap:FairValueInputsLevel2Memberus-gaap:EquityMethodInvestmentNonconsolidatedInvesteeOrGroupOfInvesteesMember2023-09-300001364250us-gaap:FairValueInputsLevel2Memberus-gaap:EquityMethodInvestmentNonconsolidatedInvesteeOrGroupOfInvesteesMember2022-12-31nysedei:segment0001364250us-gaap:OperatingSegmentsMembernysedei:OfficeSegmentMember2023-07-012023-09-300001364250us-gaap:OperatingSegmentsMembernysedei:OfficeSegmentMember2022-07-012022-09-300001364250us-gaap:OperatingSegmentsMembernysedei:OfficeSegmentMember2023-01-012023-09-300001364250us-gaap:OperatingSegmentsMembernysedei:OfficeSegmentMember2022-01-012022-09-300001364250us-gaap:OperatingSegmentsMembernysedei:MultifamilySegmentMember2023-07-012023-09-300001364250us-gaap:OperatingSegmentsMembernysedei:MultifamilySegmentMember2022-07-012022-09-300001364250us-gaap:OperatingSegmentsMembernysedei:MultifamilySegmentMember2023-01-012023-09-300001364250us-gaap:OperatingSegmentsMembernysedei:MultifamilySegmentMember2022-01-012022-09-300001364250us-gaap:OperatingSegmentsMember2023-07-012023-09-300001364250us-gaap:OperatingSegmentsMember2022-07-012022-09-300001364250us-gaap:OperatingSegmentsMember2023-01-012023-09-300001364250us-gaap:OperatingSegmentsMember2022-01-012022-09-300001364250us-gaap:WhollyOwnedPropertiesMember2023-09-30nysedei:building0001364250stpr:HInysedei:DevelopmentProjectsMember2023-09-300001364250stpr:HInysedei:DevelopmentProjectsMember2023-01-012023-09-30nysedei:apartment0001364250nysedei:DevelopmentProjectsMember2023-09-300001364250nysedei:RepositioningsCapitalExpenditureProjectsAndTenantImprovementsMember2023-09-300001364250us-gaap:LoansPayableMembernysedei:PartnershipXMember2023-09-300001364250us-gaap:LoansPayableMembernysedei:PartnershipXMember2023-01-012023-09-300001364250us-gaap:LoansPayableMembernysedei:PartnershipXMembernysedei:SecuredOvernightFinancingRateSOFRMember2023-01-012023-09-300001364250us-gaap:LoansPayableMemberus-gaap:InterestRateSwapMembernysedei:PartnershipXMember2023-09-300001364250us-gaap:LoansPayableMemberus-gaap:InterestRateSwapMembernysedei:PartnershipXMember2023-01-012023-09-30
United States
Securities and Exchange Commission
Washington, D.C. 20549
FORM 10-Q
| | | | | |
| ☒ | QUARTERLY REPORT PURSUANT TO SECTION 13 OR 15(d) OF THE SECURITIES EXCHANGE ACT OF 1934 |
For the quarterly period ended September 30, 2023
or
| | | | | |
| ☐ | TRANSITION REPORT PURSUANT TO SECTION 13 OR 15(d) OF THE SECURITIES EXCHANGE ACT OF 1934 |
For the transition period from _____ to _____
Commission file number: 001-33106
Douglas Emmett, Inc.
(Exact name of registrant as specified in its charter)
| | | | | | | | |
| Maryland | | 20-3073047 |
| (State or other jurisdiction of incorporation or organization) | | (I.R.S. Employer Identification No.) |
| | | | | | | | |
1299 Ocean Avenue, Suite 1000, Santa Monica, California | | 90401 |
| (Address of principal executive offices) | | (Zip Code) |
(310) 255-7700
(Registrant’s telephone number, including area code)
N/A
(Former name, former address and former fiscal year, if changed since last report)
Securities registered pursuant to Section 12(b) of the Act:
| | | | | | | | | | | | | | |
| Title of Each Class | | Trading Symbol | | Name of Each Exchange on Which Registered |
| Common Stock, $0.01 par value per share | | DEI | | New York Stock Exchange |
Indicate by check mark whether the registrant (1) has filed all reports required to be filed by Section 13 or 15(d) of the Securities Exchange Act of 1934 during the preceding 12 months (or for such shorter period that the registrant was required to file such reports), and (2) has been subject to such filing requirements for the past 90 days. Yes ☒ No ☐
Indicate by check mark whether the registrant has submitted electronically every Interactive Data File required to be submitted pursuant to Rule 405 of Regulation S-T (§232.405 of this chapter) during the preceding 12 months (or for such shorter period that the registrant was required to submit such files). Yes ☒ No ☐
Indicate by check mark whether the registrant is a large accelerated filer, an accelerated filer, a non-accelerated filer, a smaller reporting company, or an emerging growth company. See definitions of "large accelerated filer," "accelerated filer," "smaller reporting company," and "emerging growth company" in Rule 12b-2 of the Exchange Act.
| | | | | | | | | | | | | | |
| Large accelerated filer | ☒ | | Accelerated filer | ☐ |
| Non-accelerated filer | ☐ | | Smaller reporting company | ☐ |
| | | Emerging growth company | ☐ |
If an emerging growth company, indicate by check mark if the registrant has elected not to use the extended transition period for complying with any new or revised financial accounting standards provided pursuant to Section 13(a) of the Exchange Act. ☐
Indicate by check mark whether the registrant is a shell company (as defined in Rule 12b-2 of the Exchange Act). Yes ☐ No ☒
Indicate the number of shares outstanding of each of the issuer’s classes of common stock, as of the latest practicable date.
| | | | | | | | | | | |
| Class | | Outstanding at | October 27, 2023 |
| Common Stock, $0.01 par value per share | | 166,737,730 | shares |
| | | | | | | | |
DOUGLAS EMMETT, INC. FORM 10-Q |
| Table of Contents |
| | |
| | Page |
| | |
| | |
| | |
| | |
| | |
| | |
| | |
| | | |
| | | |
| | | |
| | |
| | | |
| | | |
| | |
| | |
| | |
| | |
| | |
| | |
| | |
| | |
| | |
| | |
| | |
| | |
| | |
| | |
| | |
| | |
| | |
| | |
| | |
| | |
| | |
| | |
| | |
| | |
| | |
| | |
| | |
| | |
| | |
| | |
| | |
| | |
Abbreviations used in this Report:
| | | | | |
| AOCI | Accumulated Other Comprehensive Income (Loss) |
| ASC | Accounting Standards Codification |
| ASU | Accounting Standards Update |
| BOMA | Building Owners and Managers Association |
| CEO | Chief Executive Officer |
| CFO | Chief Financial Officer |
| Code | Internal Revenue Code of 1986, as amended |
| COVID-19 | Coronavirus Disease 2019 |
| DEI | Douglas Emmett, Inc. |
| EPS | Earnings Per Share |
| Exchange Act | Securities Exchange Act of 1934, as amended |
| FASB | Financial Accounting Standards Board |
| FCA | Financial Conduct Authority |
| FDIC | Federal Deposit Insurance Corporation |
| FFO | Funds From Operations |
| Fund | Unconsolidated Institutional Real Estate Fund |
| GAAP | Generally Accepted Accounting Principles (United States) |
| JV | Joint Venture |
| LIBOR | London Interbank Offered Rate |
| LTIP Units | Long-Term Incentive Plan Units |
| NAREIT | National Association of Real Estate Investment Trusts |
| OCI | Other Comprehensive Income (Loss) |
| OP Units | Operating Partnership Units |
| Operating Partnership | Douglas Emmett Properties, LP |
| Partnership X | Douglas Emmett Partnership X, LP |
| PCAOB | Public Company Accounting Oversight Board (United States) |
| REIT | Real Estate Investment Trust |
| Report | Quarterly Report on Form 10-Q |
| SEC | Securities and Exchange Commission |
| Securities Act | Securities Act of 1933, as amended |
| SOFR | Secured Overnight Financing Rate |
| TRS | Taxable REIT Subsidiary(ies) |
| US | United States |
| USD | United States Dollar |
| VIE | Variable Interest Entity(ies) |
Defined terms used in this Report:
| | | | | |
| Annualized Rent | Annualized cash base rent (excludes tenant reimbursements, parking and other revenue) before abatements under leases commenced as of the reporting date and expiring after the reporting date. Annualized Rent for our triple net office properties (in Honolulu and one single tenant building in Los Angeles) is calculated by adding expense reimbursements and estimates of normal building expenses paid by tenants to base rent. Annualized Rent does not include lost rent recovered from insurance and rent for building management use. Annualized Rent includes rent for our corporate headquarters in Santa Monica. We report Annualized Rent because it is a widely reported measure of the performance of equity REITs, and is used by some investors as a means to determine tenant demand and to compare our performance and value with other REITs. We use Annualized Rent to manage and monitor the performance of our office and multifamily portfolios. |
| Consolidated Portfolio | Includes all of the properties included in our consolidated results, including our consolidated JVs. |
Funds From Operations (FFO)
| We calculate FFO in accordance with the standards established by NAREIT by excluding gains (or losses) on sales of investments in real estate, gains (or losses) from changes in control of investments in real estate, real estate depreciation and amortization (other than amortization of right-of-use assets for which we are the lessee and amortization of deferred loan costs), and impairment write-downs of real estate from our net income (loss) (including adjusting for the effect of such items attributable to our consolidated JVs and our unconsolidated Fund, but not for noncontrolling interests included in our Operating Partnership). FFO is a non-GAAP supplemental financial measure that we report because we believe it is useful to our investors. See Management’s Discussion and Analysis of Financial Condition and Results of Operations in Item 2 of this Report for a discussion of FFO. |
| Leased Rate | The percentage leased as of the reporting date. Management space is considered leased. Space taken out of service during a repositioning or which is vacant as a result of a fire or other damage is excluded from both the numerator and denominator for calculating the Leased Rate. For newly developed buildings going through initial lease up, units are included in both the numerator and denominator as they are leased. We report Leased Rate because it is a widely reported measure of the performance of equity REITs, and is also used by some investors as a means to determine tenant demand and to compare our performance with other REITs. We use Leased Rate to manage and monitor the performance of our office and multifamily portfolios. |
Net Operating Income (NOI)
| We calculate NOI as revenue less operating expenses attributable to the properties that we own and operate. NOI is calculated by excluding the following from our net income (loss): general and administrative expenses, depreciation and amortization expense, other income, other expenses, income from unconsolidated Fund, interest expense, gains (or losses) on sales of investments in real estate and net income (loss) attributable to noncontrolling interests. NOI is a non-GAAP supplemental financial measure that we report because we believe it is useful to our investors. See Management’s Discussion and Analysis of Financial Condition and Results of Operations in Item 2 of this Report for a discussion of our Same Property NOI. |
| Occupancy Rate | We calculate Occupancy Rate by excluding signed leases not yet commenced from the Leased Rate. Management space is considered occupied. Space taken out of service during a repositioning or which is vacant as a result of a fire or other damage is excluded from both the numerator and denominator for calculating the Occupancy Rate. For newly developed buildings going through initial lease up, units are included in both the numerator and denominator as they are occupied. We report Occupancy Rate because it is a widely reported measure of the performance of equity REITs, and is also used by some investors as a means to determine tenant demand and to compare our performance with other REITs. We use Occupancy Rate to manage and monitor the performance of our office and multifamily portfolios. |
| Recurring Capital Expenditures | Building improvements required to maintain revenues once a property has been stabilized, and excludes capital expenditures for (i) acquired buildings being stabilized, (ii) newly developed space, (iii) upgrades to improve revenues or operating expenses or significantly change the use of the space, (iv) casualty damage and (v) bringing the property into compliance with governmental or lender requirements. We report Recurring Capital Expenditures because it is a widely reported measure of the performance of equity REITs, and is used by some investors as a means to determine our cash flow requirements and to compare our performance with other REITs. We use Recurring Capital Expenditures to manage and monitor the performance of our office and multifamily portfolios. |
| |
| | | | | |
| |
Defined terms used in this Report (continued): |
| |
Rentable Square Feet
| Based on the BOMA remeasurement and consists of leased square feet (including square feet with respect to signed leases not commenced as of the reporting date), available square feet, building management use square feet and square feet of the BOMA adjustment on leased space. We report Rentable Square Feet because it is a widely reported measure of the performance and value of equity REITs, and is also used by some investors to compare our performance and value with other REITs. We use Rentable Square Feet to manage and monitor the performance of our office portfolio. |
| Rental Rate | We present two forms of Rental Rates - Cash Rental Rates and Straight-Line Rental Rates. Cash Rental Rate is calculated by dividing the rent paid by the Rentable Square Feet. Straight-Line Rental Rate is calculated by dividing the average rent over the lease term by the Rentable Square Feet. |
| Same Properties | Our consolidated properties that have been owned and operated by us in a consistent manner, and reported in our consolidated results during the entire span of both periods being compared. We exclude from our same property subset any properties that during the comparable periods were: (i) acquired, (ii) sold, held for sale, contributed or otherwise removed from our consolidated financial statements, (iii) that underwent a major repositioning project or were impacted by development activity, or suffered significant casualty loss that we believed significantly affected the properties' operating results. We also exclude rent received from ground leases. |
| Short-Term Leases | Represents leases that expired on or before the reporting date or had a term of less than one year, including hold over tenancies, month to month leases and other short-term occupancies. |
| Total Portfolio | Includes our Consolidated Portfolio plus the properties owned by our Fund. |
Forward Looking Statements
This Report contains forward-looking statements within the meaning of the Section 27A of the Securities Act and Section 21E of the Exchange Act. You can find many (but not all) of these statements by looking for words such as “believe”, “expect”, “anticipate”, “estimate”, “approximate”, “intend”, “plan”, “would”, “could”, “may”, “future” or other similar expressions in this Report. We claim the protection of the safe harbor contained in the Private Securities Litigation Reform Act of 1995. We caution investors that any forward-looking statements used in this Report, or those that we make orally or in writing from time to time, are based on our beliefs and assumptions, as well as information currently available to us. Actual outcomes will be affected by known and unknown risks, trends, uncertainties and factors beyond our control or ability to predict. Although we believe that our assumptions are reasonable, they are not guarantees of future performance and some will inevitably prove to be incorrect. As a result, our future results can be expected to differ from our expectations, and those differences may be material. Accordingly, investors should use caution when relying on previously reported forward-looking statements, which were based on results and trends at the time they were made, to anticipate future results or trends. Some of the risks and uncertainties that could cause our actual results, performance or achievements to differ materially from those expressed or implied by forward-looking statements include the following:
•adverse economic or real estate developments affecting Southern California or Honolulu, Hawaii;
•competition from other real estate investors in our markets;
•decreasing rental rates or increasing tenant incentive and vacancy rates;
•reduced demand for office space, including as a result of remote work and flexible working arrangements that allow work from remote locations other than the employer’s office premises;
•defaults on, early terminations of, or non-renewal of leases by tenants;
•increases in interest rates;
•increases in operating costs, including due to inflation;
•insufficient cash flows to service our outstanding debt or pay rent on ground leases;
•difficulties in raising capital;
•inability to liquidate real estate or other investments quickly;
•adverse changes to rent control laws and regulations;
•environmental uncertainties;
•natural disasters;
•fire and other property damage;
•insufficient insurance, or increases in insurance costs;
•inability to successfully expand into new markets and submarkets;
•difficulties in identifying properties to acquire and failure to complete acquisitions successfully;
•failure to successfully operate acquired properties;
•risks associated with property development;
•risks associated with JVs;
•conflicts of interest with our officers and reliance on key personnel;
•changes in zoning and other land use laws;
•adverse results of litigation or governmental proceedings;
•failure to comply with laws, regulations and covenants that are applicable to our business;
•possible terrorist attacks or wars;
•possible cyber attacks or intrusions;
•adverse changes to accounting rules;
•weaknesses in our internal controls over financial reporting;
•failure to maintain our REIT status under federal tax laws; and
•adverse changes to tax laws, including those related to property taxes.
For further discussion of these and other risk factors see Item 1A. "Risk Factors” in our 2022 Annual Report on Form 10-K for the fiscal year ended December 31, 2022, and Item 1A. "Risk Factors" in this Report. This Report and all subsequent written and oral forward-looking statements attributable to us or any person acting on our behalf are expressly qualified in their entirety by the cautionary statements contained or referred to in this section. We do not undertake any obligation to release publicly any revisions to our forward-looking statements to reflect events or circumstances after the date of this Report.
PART I. FINANCIAL INFORMATION
Item 1. Financial Statements
| | | | | | | | | | | |
Douglas Emmett, Inc. Consolidated Balance Sheets (Unaudited; In thousands, except share data) |
| | | |
| | | |
| | September 30, 2023 | | December 31, 2022 |
| | | |
| Assets | | | |
| Investment in real estate, gross | $ | 12,385,477 | | | $ | 12,292,973 | |
| Less: accumulated depreciation and amortization | (3,558,336) | | | (3,299,365) | |
| Investment in real estate, net | 8,827,141 | | | 8,993,608 | |
| | | |
| Ground lease right-of-use asset | 7,449 | | | 7,455 | |
| Cash and cash equivalents | 526,230 | | | 268,837 | |
| Tenant receivables | 8,555 | | | 6,879 | |
| Deferred rent receivables | 116,987 | | | 114,980 | |
| Acquired lease intangible assets, net | 3,103 | | | 3,536 | |
| Interest rate contract assets | 248,232 | | | 270,234 | |
| Investment in unconsolidated Fund | 47,988 | | | 47,976 | |
| Other assets | 60,394 | | | 33,941 | |
| Total Assets | $ | 9,846,079 | | | $ | 9,747,446 | |
| | | |
| Liabilities | | | |
| Secured notes payable, net | $ | 5,541,846 | | | $ | 5,191,893 | |
| Ground lease liability | 10,839 | | | 10,848 | |
| Interest payable, accounts payable and deferred revenue | 169,069 | | | 140,925 | |
| Security deposits | 62,403 | | | 61,429 | |
| Acquired lease intangible liabilities, net | 22,775 | | | 31,364 | |
| Interest rate contract liabilities | — | | | 1,790 | |
| Dividends payable | 31,691 | | | 33,414 | |
| Total Liabilities | 5,838,623 | | | 5,471,663 | |
| | | |
| Equity | | | |
| Douglas Emmett, Inc. stockholders' equity: | | | |
Common Stock, $0.01 par value, 750,000,000 authorized, 166,737,730 and 175,809,682 outstanding at September 30, 2023 and December 31, 2022, respectively | 1,667 | | | 1,758 | |
| Additional paid-in capital | 3,384,285 | | | 3,493,307 | |
| Accumulated other comprehensive income | 169,760 | | | 187,063 | |
| Accumulated deficit | (1,218,457) | | | (1,119,714) | |
| Total Douglas Emmett, Inc. stockholders' equity | 2,337,255 | | | 2,562,414 | |
| Noncontrolling interests | 1,670,201 | | | 1,713,369 | |
| Total Equity | 4,007,456 | | | 4,275,783 | |
| Total Liabilities and Equity | $ | 9,846,079 | | | $ | 9,747,446 | |
See accompanying notes to the consolidated financial statements.
Douglas Emmett, Inc.
Consolidated Statements of Operations
(Unaudited; in thousands, except per share data)
| | | | | | | | | | | | | | | | | | | | | | | |
| | Three Months Ended September 30, | | Nine Months Ended September 30, |
| | 2023 | | 2022 | | 2023 | | 2022 |
| | | | | | | |
| Revenues | | | | | | | |
| Office rental | | | | | | | |
| Rental revenues and tenant recoveries | $ | 181,106 | | | $ | 182,011 | | | $ | 535,243 | | | $ | 542,535 | |
| Parking and other income | 27,717 | | | 25,916 | | | 82,371 | | | 74,209 | |
| Total office revenues | 208,823 | | | 207,927 | | | 617,614 | | | 616,744 | |
| | | | | | | |
| Multifamily rental | | | | | | | |
| Rental revenues | 42,864 | | | 41,057 | | | 131,126 | | | 110,235 | |
| Parking and other income | 3,722 | | | 4,679 | | | 12,469 | | | 12,536 | |
| Total multifamily revenues | 46,586 | | | 45,736 | | | 143,595 | | | 122,771 | |
| | | | | | | |
| Total revenues | 255,409 | | | 253,663 | | | 761,209 | | | 739,515 | |
| | | | | | | |
| Operating Expenses | | | | | | | |
| Office expenses | 74,631 | | | 74,653 | | | 220,261 | | | 212,006 | |
| Multifamily expenses | 17,256 | | | 13,661 | | | 50,470 | | | 35,729 | |
| General and administrative expenses | 12,826 | | | 11,272 | | | 34,698 | | | 34,173 | |
| Depreciation and amortization | 122,022 | | | 96,276 | | | 336,771 | | | 279,588 | |
| Total operating expenses | 226,735 | | | 195,862 | | | 642,200 | | | 561,496 | |
| | | | | | | |
| | | | | | | |
| | | | | | | |
| Other income | 6,229 | | | 1,649 | | | 12,561 | | | 2,490 | |
| Other expenses | (175) | | | (199) | | | (820) | | | (561) | |
| Income from unconsolidated Fund | 290 | | | 356 | | | 1,177 | | | 921 | |
| Interest expense | (56,043) | | | (38,394) | | | (151,859) | | | (109,560) | |
| | | | | | | |
| | | | | | | |
| | | | | | | |
| Net (loss) income | (21,025) | | | 21,213 | | | (19,932) | | | 71,309 | |
| Net loss attributable to noncontrolling interests | 7,663 | | | 1,742 | | | 17,681 | | | 1,534 | |
| Net (loss) income attributable to common stockholders | $ | (13,362) | | | $ | 22,955 | | | $ | (2,251) | | | $ | 72,843 | |
| | | | | | | |
| Net (loss) income per common share – basic and diluted | $ | (0.08) | | | $ | 0.13 | | | $ | (0.02) | | | $ | 0.41 | |
| | | | | | | |
See accompanying notes to the consolidated financial statements.
Douglas Emmett, Inc.
Consolidated Statements of Comprehensive Income (Loss)
(Unaudited and in thousands)
| | | | | | | | | | | | | | | | | | | | | | | |
| | Three Months Ended September 30, | | Nine Months Ended September 30, |
| | 2023 | | 2022 | | 2023 | | 2022 |
| | | | | | | |
| Net (loss) income | $ | (21,025) | | | $ | 21,213 | | | $ | (19,932) | | | $ | 71,309 | |
| Other comprehensive (loss) income: cash flow hedges | (7,045) | | | 108,352 | | | (21,757) | | | 342,628 | |
| Comprehensive (loss) income | (28,070) | | | 129,565 | | | (41,689) | | | 413,937 | |
| Comprehensive loss (income) attributable to noncontrolling interests | 9,571 | | | (31,731) | | | 22,135 | | | (102,671) | |
| Comprehensive (loss) income attributable to common stockholders | $ | (18,499) | | | $ | 97,834 | | | $ | (19,554) | | | $ | 311,266 | |
See accompanying notes to the consolidated financial statements.
Douglas Emmett, Inc.
Consolidated Statements of Equity
(Unaudited; in thousands, except dividend per share data)
| | | | | | | | | | | | | | | | | | | | | | | | | | |
| | Three Months Ended September 30, | | Nine Months Ended September 30, |
| | 2023 | | 2022 | | 2023 | | 2022 |
| | | | | | | | |
| Shares of Common Stock | Beginning balance | 166,738 | | | 175,784 | | | 175,810 | | | 175,529 | |
| Exchange of OP Units for common stock | — | | | 5 | | | — | | | 260 | |
| | | | | | | |
| Repurchases of common stock | — | | | — | | | (9,072) | | | — | |
| Ending balance | 166,738 | | | 175,789 | | | 166,738 | | | 175,789 | |
| | | | | | | | |
| Common Stock | Beginning balance | $ | 1,667 | | | $ | 1,758 | | | $ | 1,758 | | | $ | 1,755 | |
| Exchange of OP units for common stock | — | | | — | | | — | | | 3 | |
| | | | | | | |
| Repurchases of common stock | — | | | — | | | (91) | | | — | |
| Ending balance | $ | 1,667 | | | $ | 1,758 | | | $ | 1,667 | | | $ | 1,758 | |
| | | | | | | | |
| Additional Paid-in Capital | Beginning balance | $ | 3,384,274 | | | $ | 3,492,864 | | | $ | 3,493,307 | | | $ | 3,488,886 | |
| Exchange of OP Units for common stock | — | | | 80 | | | — | | | 4,233 | |
| Repurchases of OP Units with cash | 11 | | | (1) | | | 120 | | | (176) | |
| | | | | | | |
| | | | | | | |
| Repurchases of common stock | — | | | — | | | (109,142) | | | — | |
| Ending balance | $ | 3,384,285 | | | $ | 3,492,943 | | | $ | 3,384,285 | | | $ | 3,492,943 | |
| | | | | | | | |
| Accumulated Other Comprehensive Income (Loss) | Beginning balance | $ | 174,897 | | | $ | 124,770 | | | $ | 187,063 | | | $ | (38,774) | |
| | | | | | | |
| Cash flow hedge adjustments | (5,137) | | | 74,879 | | | (17,303) | | | 238,423 | |
| Ending balance | $ | 169,760 | | | $ | 199,649 | | | $ | 169,760 | | | $ | 199,649 | |
| | | | | | | | |
| Accumulated Deficit | Beginning balance | $ | (1,173,415) | | | $ | (1,084,346) | | | $ | (1,119,714) | | | $ | (1,035,798) | |
| | | | | | | |
| | | | | | | |
| Net (loss) income attributable to common stockholders | (13,362) | | | 22,955 | | | (2,251) | | | 72,843 | |
| Dividends | (31,680) | | | (49,220) | | | (96,492) | | | (147,656) | |
| Ending balance | $ | (1,218,457) | | | $ | (1,110,611) | | | $ | (1,218,457) | | | $ | (1,110,611) | |
| | | | | | | | |
| Noncontrolling Interests | Beginning balance | 1,686,895 | | | 1,693,905 | | | $ | 1,713,369 | | | $ | 1,570,484 | |
| | | | | | | |
| Net loss | (7,663) | | | (1,742) | | | (17,681) | | | (1,534) | |
| Cash flow hedge adjustments | (1,908) | | | 33,473 | | | (4,454) | | | 104,205 | |
| Contributions | — | | | — | | | 125 | | | 81,000 | |
| | | | | | | |
| | | | | | | |
| Distributions | (10,145) | | | (14,649) | | | (30,433) | | | (45,376) | |
| | | | | | | |
| | | | | | | |
| | | | | | | |
| Exchange of OP Units for common stock | — | | | (80) | | | — | | | (4,236) | |
| Repurchases of OP Units with cash | (57) | | | (5) | | | (487) | | | (160) | |
| | | | | | | |
| Stock-based compensation | 3,079 | | | 3,092 | | | 9,762 | | | 9,611 | |
| Ending balance | $ | 1,670,201 | | | $ | 1,713,994 | | | $ | 1,670,201 | | | $ | 1,713,994 | |
| | | | | | | | |
| Statement continues on the next page. |
| | | | | | | | |
| | | | | | | | |
| | | | | | | | |
Douglas Emmett, Inc.
Consolidated Statements of Equity
(Unaudited; in thousands, except dividend per share data)
| | | | | | | | | | | | | | | | | | | | | | | | | | |
| | | | | | | | |
| | Three Months Ended September 30, | | Nine Months Ended September 30, |
| | 2023 | | 2022 | | 2023 | | 2022 |
| | | | | | | | |
| Total Equity | Beginning balance | $ | 4,074,318 | | | $ | 4,228,951 | | | $ | 4,275,783 | | | $ | 3,986,553 | |
| | | | | | | |
| | | | | | | |
| Net (loss) income | (21,025) | | | 21,213 | | | (19,932) | | | 71,309 | |
| Cash flow hedge adjustments | (7,045) | | | 108,352 | | | (21,757) | | | 342,628 | |
| | | | | | | |
| | | | | | | |
| | | | | | | |
| | | | | | | |
| | | | | | | |
| Repurchases of OP Units with cash | (46) | | | (6) | | | (367) | | | (336) | |
| Repurchases of common stock | — | | | — | | | (109,233) | | | — | |
| Contributions | — | | | — | | | 125 | | | 81,000 | |
| | | | | | | |
| Dividends | (31,680) | | | (49,220) | | | (96,492) | | | (147,656) | |
| Distributions | (10,145) | | | (14,649) | | | (30,433) | | | (45,376) | |
| Stock-based compensation | 3,079 | | | 3,092 | | | 9,762 | | | 9,611 | |
| Ending balance | $ | 4,007,456 | | | $ | 4,297,733 | | | $ | 4,007,456 | | | $ | 4,297,733 | |
| | | | | | | | |
| Dividends declared per common share | $ | 0.19 | | | $ | 0.28 | | | $ | 0.57 | | | $ | 0.84 | |
See accompanying notes to the consolidated financial statements.
Douglas Emmett, Inc.
Consolidated Statements of Cash Flows
(Unaudited and in thousands)
| | | | | | | | | | | |
| | Nine Months Ended September 30, |
| 2023 | | 2022 |
| Operating Activities | | | |
| Net (loss) income | $ | (19,932) | | | $ | 71,309 | |
| Adjustments to reconcile net (loss) income to net cash provided by operating activities: | | | |
| Income from unconsolidated Fund | (1,177) | | | (921) | |
| | | |
| | | |
| | | |
| Depreciation and amortization | 336,771 | | | 279,588 | |
| Net accretion of acquired lease intangibles | (8,156) | | | (8,050) | |
| Straight-line rent | (2,007) | | | (880) | |
| | | |
| Loan premium amortized and written off | (344) | | | (344) | |
| Deferred loan costs amortized and written off | 6,623 | | | 5,908 | |
| | | |
| Amortization of stock-based compensation | 7,553 | | | 7,156 | |
| Operating distributions from unconsolidated Fund | 957 | | | 921 | |
| Purchase of interest rate caps | (1,622) | | | — | |
| Change in working capital components: | | | |
| Tenant receivables | (1,676) | | | 4,156 | |
| Interest payable, accounts payable and deferred revenue | 41,277 | | | 31,825 | |
| Security deposits | 974 | | | 4,508 | |
| Other assets | (27,032) | | | (13,507) | |
| Net cash provided by operating activities | 332,209 | | | 381,669 | |
| | | |
| Investing Activities | | | |
| Capital expenditures for improvements to real estate | (144,842) | | | (111,495) | |
| Capital expenditures for developments | (37,297) | | | (60,762) | |
| Insurance recoveries for damage to real estate | 1,686 | | | 4,274 | |
| Property acquisition | — | | | (330,470) | |
| | | |
| | | |
| | | |
| | | |
| | | |
| | | |
| | | |
| | | |
| | | |
| Capital distributions from unconsolidated Fund | 80 | | | 1,454 | |
| Net cash used in investing activities | (180,373) | | | (496,999) | |
| | | |
| Financing Activities | | | |
| Proceeds from borrowings | 505,000 | | | 230,000 | |
| Repayment of borrowings | (155,642) | | | (55,614) | |
| | | |
| Loan cost payments | (5,678) | | | (1,620) | |
| Purchase of interest rate caps | — | | | (481) | |
| Proceeds from sale of interest rate cap | — | | | 444 | |
| Contributions from noncontrolling interests in consolidated JVs | 125 | | | 81,000 | |
| Distributions paid to noncontrolling interests | (30,433) | | | (45,376) | |
| | | |
| Dividends paid to common stockholders | (98,215) | | | (147,584) | |
| | | |
| | | |
| | | |
| Repurchases of OP Units | (367) | | | (336) | |
| | | |
| Repurchases of common stock | (109,233) | | | — | |
| Net cash provided by financing activities | 105,557 | | | 60,433 | |
| | | |
| Increase (decrease) in cash and cash equivalents and restricted cash | 257,393 | | | (54,897) | |
| Cash and cash equivalents and restricted cash - beginning balance | 268,938 | | | 336,006 | |
| Cash and cash equivalents and restricted cash - ending balance | $ | 526,331 | | | $ | 281,109 | |
|
Douglas Emmett, Inc.
Consolidated Statements of Cash Flows
(Unaudited and in thousands)
| | | | | | | | | | | |
| Reconciliation of Ending Cash Balance |
| September 30, 2023 | | September 30, 2022 |
| | | |
| Cash and cash equivalents | $ | 526,230 | | | $ | 281,008 | |
| Restricted cash | 101 | | | 101 | |
| Cash and cash equivalents and restricted cash | $ | 526,331 | | | $ | 281,109 | |
Supplemental Cash Flows Information
| | | | | | | | | | | |
| | Nine Months Ended September 30, |
| | 2023 | | 2022 |
| | | |
| Cash paid for interest, net of capitalized interest | $ | 141,081 | | | $ | 103,666 | |
| Capitalized interest paid | $ | 1,296 | | | $ | 7,357 | |
| | | |
| Non-cash Investing Transactions | | | |
| Accrual for real estate and development capital expenditures | $ | 19,261 | | | $ | 19,508 | |
| Capitalized stock-based compensation for improvements to real estate and developments | $ | 2,209 | | | $ | 2,455 | |
| Removal of fully depreciated and amortized buildings, building improvements, tenant improvements and lease intangibles | $ | 74,277 | | | $ | 57,177 | |
| Removal of fully amortized acquired lease intangible assets | $ | 255 | | | $ | 1,221 | |
| Removal of fully accreted acquired lease intangible liabilities | $ | 14,504 | | | $ | 9,831 | |
| | | |
| | | |
| | | |
| | | |
| | | |
| | | |
| | | |
| Non-cash Financing Transactions | | | |
| | | |
| Gain recorded in AOCI - consolidated derivatives | $ | 83,157 | | | $ | 318,408 | |
| Gain recorded in AOCI - unconsolidated Fund's derivatives (our share) | $ | 1,185 | | | $ | 3,777 | |
| | | |
| | | |
| | | |
| Dividends declared | $ | 96,492 | | | $ | 147,656 | |
| Exchange of OP Units for common stock | $ | — | | | $ | 4,236 | |
| | | |
| | | |
See accompanying notes to the consolidated financial statements.
Douglas Emmett, Inc.
Notes to Consolidated Financial Statements (unaudited)
1. Overview
Organization and Business Description
Douglas Emmett, Inc. is a fully integrated, self-administered and self-managed REIT. We are one of the largest owners and operators of high-quality office and multifamily properties in Los Angeles County, California and Honolulu, Hawaii. Through our interest in our Operating Partnership and its subsidiaries, consolidated JVs and unconsolidated Fund, we focus on owning, acquiring, developing and managing a substantial market share of top-tier office properties and premier multifamily communities in neighborhoods that possess significant supply constraints, high-end executive housing and key lifestyle amenities. The terms "us," "we" and "our" as used in the consolidated financial statements refer to Douglas Emmett, Inc. and its subsidiaries on a consolidated basis.
At September 30, 2023, our Consolidated Portfolio consisted of (i) a 17.6 million square foot office portfolio, (ii) 4,594 multifamily apartment units and (iii) fee interests in two parcels of land from which we receive rent under ground leases. We also manage and own an equity interest in an unconsolidated Fund which, at September 30, 2023, owned an additional 0.4 million square feet of office space. We manage our unconsolidated Fund alongside our Consolidated Portfolio, and we therefore present the statistics for our office portfolio on a Total Portfolio basis. As of September 30, 2023, our portfolio consisted of the following (including ancillary retail space and excluding two parcels of land from which we receive rent under ground leases):
| | | | | | | | | | | |
| | Consolidated Portfolio | | Total
Portfolio |
| Office | | | |
| Wholly-owned properties | 52 | | 52 |
| Consolidated JV properties | 16 | | 16 |
| Unconsolidated Fund properties | — | | 2 |
| 68 | | 70 |
| | | |
| Multifamily | | | |
| Wholly-owned properties | 12 | | 12 |
| Consolidated JV properties | 2 | | 2 |
| 14 | | 14 |
| | | |
| Total | 82 | | 84 |
Basis of Presentation
The accompanying consolidated financial statements are the consolidated financial statements of Douglas Emmett, Inc. and its subsidiaries, including our Operating Partnership and our consolidated JVs. All significant intercompany balances and transactions have been eliminated in our consolidated financial statements.
We consolidate entities in which we are considered to be the primary beneficiary of a VIE or have a majority of the voting interest of the entity. We are deemed to be the primary beneficiary of a VIE when we have (i) the power to direct the activities of that VIE that most significantly impact its economic performance, and (ii) the obligation to absorb losses or the right to receive benefits that could potentially be significant to the VIE. We do not consolidate entities in which the other parties have substantive kick-out rights to remove our power to direct the activities, most significantly impacting the economic performance, of that VIE. In determining whether we are the primary beneficiary, we consider factors such as ownership interest, management representation, authority to control decisions, and contractual and substantive participating rights of each party.
We consolidate our Operating Partnership through which we conduct substantially all of our business, and own, directly and through subsidiaries, substantially all of our assets, and are obligated to repay substantially all of our liabilities. The consolidated debt, excluding our consolidated JVs, was $3.76 billion as of September 30, 2023 and $3.41 billion as of December 31, 2022. See Note 8. We also consolidate four JVs through our Operating Partnership. We consolidate our Operating Partnership and our four JVs because they are VIEs and we or our Operating Partnership are the primary beneficiary for each.
Douglas Emmett, Inc.
Notes to Consolidated Financial Statements (unaudited) (continued)
As of September 30, 2023, our consolidated VIE entities, excluding our Operating Partnership, had:
•aggregate consolidated assets of $3.90 billion (of which $3.49 billion related to investment in real estate), and
•aggregate consolidated liabilities of $1.89 billion (of which $1.81 billion related to debt).
As of December 31, 2022, our consolidated VIE entities, excluding our Operating Partnership, had:
•aggregate consolidated assets of $3.94 billion (of which $3.54 billion related to investment in real estate), and
•aggregate consolidated liabilities of $1.89 billion (of which $1.81 billion related to debt).
The accompanying unaudited interim consolidated financial statements have been prepared pursuant to the rules and regulations of the SEC in conformity with US GAAP as established by the FASB in the ASC. Certain information and footnote disclosures normally included in the consolidated financial statements prepared in conformity with US GAAP may have been condensed or omitted pursuant to SEC rules and regulations, although we believe that the disclosures are adequate to make their presentation not misleading. The accompanying unaudited interim consolidated financial statements include, in our opinion, all adjustments, consisting of normal recurring adjustments, necessary to present fairly the financial information set forth therein. The results of operations for the interim periods are not necessarily indicative of the results that may be expected for the year ending December 31, 2023. The interim consolidated financial statements should be read in conjunction with the consolidated financial statements in our 2022 Annual Report on Form 10-K and the notes thereto. Any references to the number or class of properties, square footage, per square footage amounts, apartment units and geography, are outside the scope of our independent registered public accounting firm’s review of our consolidated financial statements in accordance with the standards of the PCAOB.
2. Summary of Significant Accounting Policies
We have not made any changes to our significant accounting policies disclosed in our 2022 Annual Report on Form 10-K.
Use of Estimates
The preparation of consolidated financial statements in conformity with US GAAP requires management to make certain estimates that affect the reported amounts in the consolidated financial statements and accompanying notes. Actual results could differ materially from those estimates.
Revenue Recognition
Rental revenues and tenant recoveries
We account for our rental revenues and tenant recoveries in accordance with Topic 842 "Leases". Rental revenues and tenant recoveries are included in: (i) Rental revenues and tenant recoveries under Office rental, and (ii) Rental revenues under Multifamily rental, on our consolidated statements of operations.
Collectibility
In accordance with Topic 842, we perform an assessment as to whether or not substantially all of the amounts due under a tenant’s lease agreement is deemed probable of collection. This assessment involves using a methodology that requires judgment and estimates about matters that are uncertain at the time the estimates are made, including tenant specific factors, specific industry conditions, and general economic trends and conditions. For leases where we have concluded it is probable that we will collect substantially all the lease payments due under those leases, we continue to record lease income on a straight-line basis over the lease term. For leases where we have concluded that it is not probable that we will collect substantially all the lease payments due under those leases, we limit the lease income to the lesser of the income recognized on a straight-line basis or cash basis. We write-off tenant receivables and deferred rent receivables as a charge against rental revenues and tenant recoveries in the period we conclude that substantially all of the lease payments are not probable of collection. If we subsequently collect amounts that were previously written off then the amounts collected are recorded as an increase to our rental revenues and tenant recoveries in the period they are collected. If our conclusion of collectibility changes, we will record the difference between the lease income that would have been recognized on a straight-line basis and cash basis as a current-period adjustment to rental revenues and tenant recoveries.
Douglas Emmett, Inc.
Notes to Consolidated Financial Statements (unaudited) (continued)
Charges for uncollectible office tenant receivables and deferred rent receivables, reduced our office revenues by:
•$0.2 million and $0.1 million for the three months ended September 30, 2023 and 2022, respectively, and
•$0.5 million and $0.3 million for the nine months ended September 30, 2023 and 2022, respectively.
We restored accrual basis accounting for certain office tenants that were previously determined to be uncollectible and accounted for on a cash basis of accounting, which increased our office revenues by:
•$2.3 million and $1.6 million for the three months ended September 30, 2023 and 2022, respectively, and
•$4.4 million and $3.3 million for the nine months ended September 30, 2023 and 2022, respectively.
Office parking revenues
We account for our office parking revenues in accordance with ASC 606 "Revenue from Contracts with Customers". Office parking revenues are included in Parking and other income under Office rental on our consolidated statements of operations. Our lease contracts generally make a specified number of parking spaces available to the tenant, and we bill and recognize parking revenues on a monthly basis in accordance with the lease agreements, generally using the monthly parking rates in effect at the time of billing.
Office parking revenues were:
•$23.4 million and $22.1 million for the three months ended September 30, 2023, and 2022, respectively, and
•$69.1 million and $62.6 million for the nine months ended September 30, 2023 and 2022, respectively.
Office parking receivables, which are included in Tenant receivables on our consolidated balance sheets, were
•$1.0 million as of September 30, 2023, and
•$0.9 million as of December 31, 2022.
Income Taxes
We have elected to be taxed as a REIT under the Code. Provided that we qualify for taxation as a REIT, we are generally not subject to corporate-level income tax on the earnings distributed currently to our stockholders that we derive from our REIT qualifying activities. We are subject to corporate-level tax on the earnings that we derive through our TRS.
New Accounting Pronouncements
Changes to US GAAP are implemented by the FASB in the form of ASUs. We consider the applicability and impact of all ASUs. As of the date of this Report, the FASB has not issued any ASUs that we expect to be applicable and have a material impact on our consolidated financial statements.
Douglas Emmett, Inc.
Notes to Consolidated Financial Statements (unaudited) (continued)
3. Investment in Real Estate
The table below summarizes our investment in real estate:
| | | | | | | | | | | |
| (In thousands) | September 30, 2023 | | December 31, 2022 |
| | | |
| Land | $ | 1,185,977 | | $ | 1,185,977 |
Buildings and improvements(1) | 10,118,965 | | 10,055,499 |
| Tenant improvements and lease intangibles | 1,011,310 | | 981,460 |
Property under development(1) | 69,225 | | 70,037 |
| Investment in real estate, gross | $ | 12,385,477 | | $ | 12,292,973 |
________________________________________________
(1) During the nine months ended September 30, 2023, Property under development balances transferred to Building and improvements for real estate placed into service was $34.0 million.
2022 Property Acquisition
Acquisition of 1221 Ocean Avenue
On April 26, 2022, we paid $330.0 million, excluding acquisition costs, to acquire a luxury multifamily apartment building with 120 units, located at 1221 Ocean Avenue in Santa Monica. We acquired the property through a new consolidated JV that we manage and in which we own a 55% interest. We accounted for the acquisition as an asset acquisition and the acquired property's operating results are included in our consolidated operating results from the date of acquisition. The table below summarizes the purchase price allocation for the acquisition. The contract price and the purchase price allocation total in the table below differ due to acquisition costs, prorations and similar adjustments:
| | | | | |
| (In thousands) | Purchase Price Allocation |
| |
| Land | $ | 22,086 | |
| Buildings and improvements | 319,666 | |
| Tenant improvements and lease intangibles | 8,879 | |
| Acquired below-market leases | (18,542) | |
| Other liabilities assumed | (1,619) | |
| Net assets and liabilities acquired | $ | 330,470 | |
Property to be Removed from Service
During the second quarter of 2023, we filed paperwork to remove our Barrington Plaza Apartments property in Los Angeles from the rental market because of city directives to install fire sprinklers and other life safety improvements. In connection with the removal of the aforementioned property from the rental market, we accelerated and recorded additional depreciation expense of $27.4 million for the three months ended September 30, 2023 and $54.8 million for the nine months ended September 30, 2023, which is included in Depreciation and amortization on our consolidated statements of operations.
Douglas Emmett, Inc.
Notes to Consolidated Financial Statements (unaudited) (continued)
4. Ground Lease
We pay rent under a ground lease located in Honolulu, Hawaii, which expires on December 31, 2086. The rent is fixed at $733 thousand per year until February 28, 2029, after which it will reset to the greater of the existing ground rent or the market rent at the time.
As of September 30, 2023, the ground lease right-of-use asset carrying value was $7.4 million and the ground lease liability was $10.8 million.
Ground rent expense, which is included in Office expenses on our consolidated statements of operations, was:
•$183 thousand for each of the three month periods ended September 30, 2023 and 2022, and
•$549 thousand for each of the nine month periods ended September 30, 2023 and 2022.
The table below, which assumes that the ground rent payments will continue to be $733 thousand per year after February 28, 2029, presents the future minimum ground lease payments as of September 30, 2023:
| | | | | |
| Twelve months ending September 30: | (In thousands) |
| |
| 2024 | $ | 733 | |
| 2025 | 733 | |
| 2026 | 733 | |
| 2027 | 733 | |
| 2028 | 733 | |
| Thereafter | 42,696 | |
| Total future minimum lease payments | $ | 46,361 | |
Douglas Emmett, Inc.
Notes to Consolidated Financial Statements (unaudited) (continued)
5. Acquired Lease Intangibles
Summary of our Acquired Lease Intangibles
| | | | | | | | | | | |
| (In thousands) | September 30, 2023 | | December 31, 2022 |
| | | |
| Above-market tenant leases | $ | 4,712 | | | $ | 4,968 | |
| Above-market tenant leases - accumulated amortization | (2,474) | | | (2,309) | |
| Above-market ground lease where we are the lessor | 1,152 | | | 1,152 | |
| Above-market ground lease - accumulated amortization | (287) | | | (275) | |
| Acquired lease intangible assets, net | $ | 3,103 | | | $ | 3,536 | |
| | | |
| Below-market tenant leases | $ | 50,347 | | | $ | 64,851 | |
| Below-market tenant leases - accumulated accretion | (27,572) | | | (33,487) | |
| Acquired lease intangible liabilities, net | $ | 22,775 | | | $ | 31,364 | |
Impact on the Consolidated Statements of Operations
The table below summarizes the net amortization/accretion related to our above- and below-market leases:
| | | | | | | | | | | | | | | | | | | | | | | |
| | Three Months Ended September 30, | | Nine Months Ended September 30, |
| (In thousands) | 2023 | | 2022 | | 2023 | | 2022 |
| | | | | | | |
Net accretion of above- and below-market tenant lease assets and liabilities(1) | $ | 2,466 | | | $ | 3,348 | | | $ | 8,169 | | | $ | 8,063 | |
Amortization of an above-market ground lease asset(2) | (5) | | | (5) | | | (13) | | | (13) | |
| Total | $ | 2,461 | | | $ | 3,343 | | | $ | 8,156 | | | $ | 8,050 | |
______________________________________________
(1) Recorded as a net increase to office and multifamily rental revenues.
(2) Recorded as a decrease to office parking and other income.
Douglas Emmett, Inc.
Notes to Consolidated Financial Statements (unaudited) (continued)
6. Investment in Unconsolidated Fund
Description of our Fund
As of September 30, 2023 and 2022, we managed and owned an equity interest of 33.5% in an unconsolidated Fund, Partnership X, through which we and other investors in the Fund owned two office properties totaling 0.4 million square feet.
Partnership X pays us fees and reimburses us for certain expenses related to property management and other services we provide, which are included in Other income on our consolidated statements of operations. We also receive distributions based on invested capital and on any profits that exceed certain specified cash returns to the investors. The table below presents the cash distributions we received from Partnership X:
| | | | | | | | | | | |
| Nine Months Ended September 30, |
| (In thousands) | 2023 | | 2022 |
| | | |
| Operating distributions received | $ | 957 | | | $ | 921 | |
| Capital distributions received | 80 | | | 1,454 | |
| Total distributions received | $ | 1,037 | | | $ | 2,375 | |
Summarized Financial Information for Partnership X
The tables below present selected financial information for Partnership X. The amounts presented reflect 100% (not our pro-rata share) of the amounts related to the Fund, and are based upon historical book value:
| | | | | | | | | | | |
| (In thousands) | September 30, 2023 | | December 31, 2022 |
| | | |
| Total assets | $ | 149,588 | | | $ | 147,853 | |
| Total liabilities | $ | 118,942 | | | $ | 119,038 | |
| Total equity | $ | 30,646 | | | $ | 28,815 | |
| | | | | | | | | | | |
| | Nine Months Ended September 30, |
| (In thousands) | 2023 | | 2022 |
| | | |
| Total revenues | $ | 14,929 | | | $ | 13,893 | |
| Operating income | $ | 4,749 | | | $ | 4,361 | |
| Net income | $ | 3,167 | | | $ | 2,387 | |
7. Other Assets
| | | | | | | | | | | |
| (In thousands) | September 30, 2023 | | December 31, 2022 |
| | | |
| Restricted cash | $ | 101 | | | $ | 101 | |
| Prepaid expenses | 30,811 | | | 19,871 | |
| Indefinite-lived intangibles | 1,988 | | | 1,988 | |
Deposit with lender(1) | 13,300 | | | — | |
| Furniture, fixtures and equipment, net | 7,042 | | | 7,144 | |
| Other | 7,152 | | | 4,837 | |
| Total other assets | $ | 60,394 | | | $ | 33,941 | |
_______________________________________________________________________
(1) In connection with the Barrington Plaza loan, Barrington Plaza Apartments have been removed from the rental market. The lender is treating the debt as a construction loan. They have required a $13.3 million cash deposit, which we placed in a collateral account during the third quarter, and they are requiring a construction completion guarantee. See Note 8 for our debt disclosures.
Douglas Emmett, Inc.
Notes to Consolidated Financial Statements (unaudited) (continued)
8. Secured Notes Payable, Net
| | | | | | | | | | | | | | | | | | | | | | | | | | | | | | | | | | | | | | |
| Description | | Maturity Date(1) | | Principal Balance as of September 30, 2023 | | Principal Balance as of December 31, 2022 | | Variable Interest Rate(2) | | Fixed Interest Rate(3) | | Swap Maturity Date |
| | | | | | | | | | | | |
| | | | (In thousands) | | | | | | |
| | | | | | | | | | | | |
| Consolidated Wholly Owned Subsidiaries |
Term loan(4)(5) | | 3/3/2025 | | $ | 335,000 | | | $ | 335,000 | | | SOFR + 1.41% | | N/A | | N/A |
Fannie Mae loan(4)(5) | | 4/1/2025 | | 102,400 | | | 102,400 | | | SOFR + 1.36% | | N/A | | N/A |
Term loan(4) | | 8/15/2026 | | 415,000 | | | 415,000 | | | SOFR + 1.20% | | 3.07% | | 8/1/2025 |
Term loan(4) | | 9/19/2026 | | 400,000 | | | 400,000 | | | SOFR + 1.25% | | 2.44% | | 9/1/2024 |
Term loan(4) | | 9/26/2026 | | 200,000 | | | 200,000 | | | SOFR + 1.30% | | 2.36% | | 10/1/2024 |
Term loan(4) | | 11/1/2026 | | 400,000 | | | 400,000 | | | SOFR + 1.25% | | 2.31% | | 10/1/2024 |
Fannie Mae loan(4)(6) | | 6/1/2027 | | 550,000 | | | 550,000 | | | SOFR + 1.48% | | N/A | | N/A |
Term loan(4) | | 5/18/2028 | | 300,000 | | | 300,000 | | | SOFR + 1.51% | | 2.21% | | 6/1/2026 |
Term loan(4) | | 1/1/2029 | | 300,000 | | | 300,000 | | | SOFR + 1.56% | | 2.66% | | 1/1/2027 |
Fannie Mae loan(4) | | 6/1/2029 | | 255,000 | | | 255,000 | | | SOFR + 1.09% | | 3.26% | | 6/1/2027 |
Fannie Mae loan(4) | | 6/1/2029 | | 125,000 | | | 125,000 | | | SOFR + 1.09% | | 3.25% | | 6/1/2027 |
Fannie Mae loan(4)(7) | | 8/1/2033 | | 350,000 | | | — | | | SOFR + 1.37% | | N/A | | N/A |
Term loan(8) | | 6/1/2038 | | 27,859 | | | 28,502 | | | N/A | | 4.55% | | N/A |
| Total Wholly-Owned Subsidiary Debt | 3,760,259 | | | 3,410,902 | | | | | | | |
| | | | | | | | | | | | |
| Consolidated JVs |
Term loan(4)(9) | | 12/19/2024 | | 400,000 | | | 400,000 | | | SOFR + 1.40% | | N/A | | N/A |
Term loan(4) | | 5/15/2027 | | 450,000 | | | 450,000 | | | SOFR + 1.45% | | 2.26% | | 4/1/2025 |
Term loan(4) | | 8/19/2028 | | 625,000 | | | 625,000 | | | SOFR + 1.45% | | 2.12% | | 6/1/2025 |
Term loan(4) | | 4/26/2029 | | 175,000 | | | 175,000 | | | SOFR + 1.25% | | 3.90% | | 5/1/2026 |
Fannie Mae loan(4) | | 6/1/2029 | | 160,000 | | | 160,000 | | | SOFR + 1.09% | | 3.25% | | 7/1/2027 |
Total Consolidated Debt(10) | 5,570,259 | | | 5,220,902 | | | | | | | |
Unamortized loan premium, net(11) | 3,203 | | | 3,547 | | | | | | | |
Unamortized deferred loan costs, net(12) | (31,616) | | | (32,556) | | | | | | | |
| Total Consolidated Debt, net | $ | 5,541,846 | | | $ | 5,191,893 | | | | | | | |
_______________________________________________________________________
Except as noted below, our loans: (i) are non-recourse, (ii) are secured by separate collateral pools consisting of one or more properties, (iii) require interest-only monthly payments with the outstanding principal due upon maturity, and (iv) contain certain financial covenants which could require us to deposit excess cash flow with the lender under certain circumstances unless we (at our option) either provide a guarantee or additional collateral or pay down the loan within certain parameters set forth in the loan documents. Certain loans with maturity date extension options require us to meet minimum financial thresholds in order to extend the loan maturity date.
(1)Maturity dates include extension options.
(2)LIBOR loans converted to SOFR during the third quarter include a small SOFR adjustment to calculate the interest payable to the lender, which are included in the spreads. The SOFR conversion did not change the swap-fixed interest rates for our swap-fixed loans.
(3)Effective rate as of September 30, 2023. Includes the effect of interest rate swaps (if applicable) and excludes the effect of prepaid loan fees and loan premiums. See Note 10 for details of our interest rate swaps. See further below for details of our loan costs and loan premiums.
(4)The loan agreement includes a zero-percent SOFR floor. If the loan is swap-fixed then the related swaps do not include such a floor.
(5)The swaps expired on March 1, 2023.
(6)The loan is secured by four residential properties. A portion of the loan totaling $472 million has a lender-required out-of-the-money interest rate cap at a weighted average of 8.99% until July 2026. Barrington Plaza Apartments have been removed from the rental market. See Note 3. For the portion of the loan relating to Barrington Plaza, the lender is treating the debt as a construction loan. They have required a $13.3 million cash deposit, which we placed in a collateral account during the third quarter, and they are requiring a construction completion guarantee. The lender will return the deposit at the earlier of August 2026 or when the loan is paid in full. The deposit is included in Other assets in our balance sheet. See Note 7.
(7)We closed the loan during the third quarter of 2023. The loan has a lender-required out-of-the-money interest rate cap at an interest rate of 7.84% until August 2026. We used part of the proceeds from the loan to pay off the balance on our revolving credit facility, which expired in August 2023. There was no balance outstanding on the credit facility as of December 31, 2022.
(8)The loan requires monthly payments of principal and interest. The principal amortization is based upon a 30-year amortization schedule.
Douglas Emmett, Inc.
Notes to Consolidated Financial Statements (unaudited) (continued)
(9)The swaps expired on January 1, 2023.
(10)The table does not include our unconsolidated Fund's loan - see Note 16. See Note 13 for our fair value disclosures.
(11)Balances are net of accumulated amortization of $4.0 million and $3.7 million at September 30, 2023 and December 31, 2022, respectively.
(12)Balances are net of accumulated amortization of $54.2 million and $54.1 million at September 30, 2023 and December 31, 2022, respectively.
Debt Statistics
The table below summarizes our consolidated fixed and floating rate debt:
| | | | | | | | | | | | | | |
| (In thousands) | | Principal Balance as of September 30, 2023 | | Principal Balance as of December 31, 2022 |
| | | | |
| Aggregate swapped to fixed rate loans | | $ | 3,805,000 | | | $ | 4,642,400 | |
| Aggregate fixed rate loans | | 27,859 | | | 28,502 | |
| Aggregate capped rate loans | | 822,000 | | | — | |
| Aggregate floating rate loans | | 915,400 | | | 550,000 | |
| Total Debt | | $ | 5,570,259 | | | $ | 5,220,902 | |
The table below summarizes certain consolidated debt statistics as of September 30, 2023:
| | | | | | | | |
| Statistics for consolidated loans with interest fixed under the terms of the loan or a swap |
| | |
| Principal balance (in billions) | | $3.83 |
| Weighted average remaining life (including extension options) | | 4.3 years |
| Weighted average remaining fixed interest period | | 2.1 years |
| Weighted average annual interest rate | | 2.65% |
Future Principal Payments
At September 30, 2023, the minimum future principal payments due on our consolidated secured notes payable were as follows:
| | | | | | | | |
| Twelve months ending September 30: | | Including Maturity Extension Options(1) |
| | |
| | (In thousands) |
| | |
| 2024 | | $ | 891 | |
| 2025 | | 838,333 | |
| 2026 | | 1,015,976 | |
| 2027 | | 1,401,022 | |
| 2028 | | 926,069 | |
| Thereafter | | 1,387,968 | |
| Total future principal payments | | $ | 5,570,259 | |
________________________________________________
(1) Some of our loan agreements require that we meet certain minimum financial thresholds to be able to extend the loan maturity.
Douglas Emmett, Inc.
Notes to Consolidated Financial Statements (unaudited) (continued)
Loan Premium and Loan Costs
The table below presents loan premium and loan costs, which are included in Interest expense on our consolidated statements of operations:
| | | | | | | | | | | | | | | | | | | | | | | |
| | Three Months Ended September 30, | | Nine Months Ended September 30, |
| (In thousands) | 2023 | | 2022 | | 2023 | | 2022 |
| | | | | | | |
| Loan premium amortized and written off | $ | (116) | | | $ | (116) | | | $ | (344) | | | $ | (344) | |
| Deferred loan costs amortized and written off | 2,261 | | | 2,030 | | | 6,623 | | | 5,908 | |
| Loan costs expensed | 59 | | | 8 | | | 79 | | | 110 | |
| Total | $ | 2,204 | | | $ | 1,922 | | | $ | 6,358 | | | $ | 5,674 | |
9. Interest Payable, Accounts Payable and Deferred Revenue
| | | | | | | | | | | |
| (In thousands) | September 30, 2023 | | December 31, 2022 |
| | | |
| Interest payable | $ | 18,028 | | | $ | 13,529 | |
| Accounts payable and accrued liabilities | 99,805 | | | 80,244 | |
| Deferred revenue | 51,236 | | | 47,152 | |
| Total interest payable, accounts payable and deferred revenue | $ | 169,069 | | | $ | 140,925 | |
Douglas Emmett, Inc.
Notes to Consolidated Financial Statements (unaudited) (continued)
10. Derivative Contracts
We make use of interest rate swap and cap contracts to manage the risk associated with changes in interest rates on our floating-rate debt and to satisfy certain lender requirements. When we enter into a floating-rate term loan, we generally enter into an interest rate swap agreement for the equivalent principal amount, for a period covering the majority of the loan term, which effectively converts our floating-rate debt to a fixed-rate basis during that time. We also enter into interest rate cap agreements from time to time to cap the interest rates on our floating rate loans. We may enter into derivative contracts that are intended to hedge certain economic risks, even though hedge accounting does not apply or we elect to not apply hedge accounting. We do not speculate in derivatives and we do not make use of any other derivative instruments. See Note 8 regarding our debt and our consolidated JVs' debt that is hedged.
Derivative Summary
The table below summarizes our derivative contracts as of September 30, 2023:
| | | | | | | | | | | |
| Number of Interest Rate Contracts | | Notional
(In thousands) |
| | | |
| Derivatives Designated as Cash Flow Hedges: | | | |
Consolidated derivatives - swaps(1)(2)(3) | 24 | | $ | 3,805,000 | |
Consolidated derivatives - caps(2)(3)(4) | 5 | | $ | 822,000 | |
Unconsolidated Fund's derivatives - swaps(2)(3)(5) | 2 | | $ | 115,000 | |
| | | |
| Derivatives Not Designated as Cash Flow Hedges: | | | |
Consolidated derivatives - caps(6) | — | | $ | — | |
___________________________________________________
(1)The notional amount includes 100%, not our pro-rata share, of our consolidated JVs' derivatives. See Note 8 for more information about our hedged consolidated debt.
(2)Our derivative contracts do not provide for right of offset between derivative contracts.
(3)See Note 13 for our derivative fair value disclosures.
(4)We purchased five interest rate caps with a notional amount of $822.0 million during the third quarter of 2023. See Note 8 for more information about our hedged consolidated debt.
(5)The notional amount reflects 100%, not our pro-rata share, of our unconsolidated Fund's derivatives. See Note 6 for more information about our Fund, including our equity interest percentage.
(6)Five interest rate caps with a total aggregate notional amount of $1.10 billion expired on July 1, 2023.
Counterparty Credit Risk
We are subject to credit risk from the counterparties on our interest rate swap and cap contract assets because we do not receive collateral. We seek to minimize that risk by entering into agreements with a variety of counterparties with investment grade ratings. The fair value of our interest rate swap and cap contract assets, including accrued interest and excluding credit risk adjustments, was as follows:
| | | | | | | | | | | |
| (In thousands) | September 30, 2023 | | December 31, 2022 |
| | | |
Consolidated derivatives(1) | $ | 262,322 | | | $ | 281,982 | |
Unconsolidated Fund's derivatives(2) | $ | 12,877 | | | $ | 12,863 | |
___________________________________________________
(1)The amounts include 100%, not our pro-rata share, of our consolidated JVs' derivatives.
(2)The amounts reflect 100%, not our pro-rata share, of our unconsolidated Fund's derivatives. For more information about our Fund, including our equity interest percentage, see Note 6.
Douglas Emmett, Inc.
Notes to Consolidated Financial Statements (unaudited) (continued)
Impact of Hedges on AOCI and the Consolidated Statements of Operations
The table below presents the effect of our derivatives on our AOCI and the consolidated statements of operations:
| | | | | | | | | | | |
| (In thousands) | Nine Months Ended September 30, |
| | 2023 | | 2022 |
| Derivatives Designated as Cash Flow Hedges: | | | |
| | | |
| Consolidated derivatives: | | | |
Gains recorded in AOCI before reclassifications(1) | $ | 83,157 | | | $ | 318,408 | |
(Gains) losses reclassified from AOCI to Interest Expense(1) | $ | (104,891) | | | $ | 20,505 | |
| Interest expense presented on the consolidated statements of operations | $ | (151,859) | | | $ | (109,560) | |
Unconsolidated Fund's derivatives (our share)(2): | | | |
Gains recorded in AOCI before reclassifications(1) | $ | 1,185 | | | $ | 3,777 | |
Gains reclassified from AOCI to Income from unconsolidated Fund(1) | $ | (1,208) | | | $ | (62) | |
| Income from unconsolidated Fund presented on the consolidated statements of operations | $ | 1,177 | | | $ | 921 | |
| Derivatives Not Designated as Cash Flow Hedges: | | | |
| Consolidated derivatives: | | | |
Loss recorded as interest expense(3) | $ | — | | | $ | 38 | |
___________________________________________________
(1)See Note 11 for our AOCI reconciliation.
(2)We calculate our share by multiplying the total amount for the Fund by our equity interest in the Fund. For more information about our Fund, including our equity interest percentage, see Note 6.
(3)Gains and losses from non-designated interest rate caps offset each other during the periods presented. The respective caps expired on July 1, 2023.
Future Reclassifications from AOCI
At September 30, 2023, our estimate of the AOCI related to derivatives designated as cash flow hedges that will be reclassified to earnings during the next twelve months is as follows:
| | | | | |
| (In thousands) |
| |
| Consolidated derivatives: | |
| Gains to be reclassified from AOCI to Interest Expense | $ | 150,054 | |
Unconsolidated Fund's derivatives (our share)(1): | |
| Gains to be reclassified from AOCI to Income from unconsolidated Fund | $ | 1,741 | |
___________________________________________________
(1) We calculate our share by multiplying the total amount for the Fund by our equity interest in the Fund. For more information about our Fund, including our equity interest percentage, see Note 6.
Douglas Emmett, Inc.
Notes to Consolidated Financial Statements (unaudited) (continued)
11. Equity
Transactions
During the Nine Months Ended September 30, 2023
•We repurchased 9.1 million shares of our common stock for $109.1 million in cash, excluding transaction costs, in open market transactions. The average purchase price was $12.03 per share.
•We acquired 29 thousand OP Units for $367 thousand in cash.
During the Nine Months Ended September 30, 2022
•We acquired 260 thousand OP Units in exchange for issuing an equal number of shares of our common stock to the holders of the OP Units.
•We acquired 10 thousand OP Units for $336 thousand in cash.
•We acquired a multifamily apartment building through a new consolidated JV that we manage and in which we own a 55% interest. See Note 3 for more information regarding the property we purchased. We contributed $99.0 million to the JV and an outside investor contributed $81.0 million to the JV.
Noncontrolling Interests
Our noncontrolling interests consist of interests in our Operating Partnership and consolidated JVs which are not owned by us. As of September 30, 2023, noncontrolling interests in our Operating Partnership owned 32.5 million OP Units and fully-vested LTIP Units, which represented approximately 16.3% of our Operating Partnership's total outstanding interests, and we owned 166.7 million OP Units (to match our 166.7 million shares of outstanding common stock).
A share of our common stock, an OP Unit and an LTIP Unit (once vested and booked up) have essentially the same economic characteristics, sharing equally in the distributions from our Operating Partnership. Investors who own OP Units have the right to cause our Operating Partnership to acquire their OP Units for an amount of cash per unit equal to the market value of one share of our common stock at the date of acquisition, or, at our election, exchange their OP Units for shares of our common stock on a one-for-one basis. LTIP Units have been granted to our employees and non-employee directors as part of their compensation. These awards generally vest over a service period and once vested can generally be converted to OP Units provided our stock price increases by more than a specified hurdle.
Changes in our Ownership Interest in our Operating Partnership
The table below presents the effect on our equity from net (loss) income attributable to common stockholders and changes in our ownership interest in our Operating Partnership:
| | | | | | | | | | | |
| | Nine Months Ended September 30, |
| (In thousands) | 2023 | | 2022 |
| | | |
| Net (loss) income attributable to common stockholders | $ | (2,251) | | | $ | 72,843 | |
| | | |
| Transfers from noncontrolling interests: | | | |
| Exchange of OP Units with noncontrolling interests | — | | | 4,236 | |
| Repurchases of OP Units from noncontrolling interests | 120 | | | (176) | |
| Net transfers from noncontrolling interests | 120 | | | 4,060 | |
| | | |
| Change from net (loss) income attributable to common stockholders and transfers from noncontrolling interests | $ | (2,131) | | | $ | 76,903 | |
Douglas Emmett, Inc.
Notes to Consolidated Financial Statements (unaudited) (continued)
AOCI Reconciliation(1)
The table below presents a reconciliation of our AOCI, which consists solely of adjustments related to derivatives designated as cash flow hedges:
| | | | | | | | | | | |
| Nine Months Ended September 30, |
| (In thousands) | 2023 | | 2022 |
| | | |
| Accumulated Other Comprehensive Income (Loss) - Beginning balance | $ | 187,063 | | | $ | (38,774) | |
| Consolidated derivatives: | | | |
| Other comprehensive income before reclassifications | 83,157 | | | 318,408 | |
| Reclassification of (gains) losses from AOCI to Interest Expense | (104,891) | | | 20,505 | |
Unconsolidated Fund's derivatives (our share)(2): | | | |
| Other comprehensive income before reclassifications | 1,185 | | | 3,777 | |
| Reclassification of gains from AOCI to Income from unconsolidated Fund | (1,208) | | | (62) | |
| Net current period OCI | (21,757) | | | 342,628 | |
| OCI attributable to noncontrolling interests | 4,454 | | | (104,205) | |
| OCI attributable to common stockholders | (17,303) | | | 238,423 | |
| | | |
| Accumulated Other Comprehensive Income - Ending balance | $ | 169,760 | | | $ | 199,649 | |
___________________________________________________
(1)See Note 10 for the details of our derivatives and Note 13 for our derivative fair value disclosures.
(2)We calculate our share by multiplying the total amount for our Fund by our equity interest in the Fund. For more information about our Fund, including our equity interest percentage, see Note 6.
Stock-Based Compensation
The Douglas Emmett, Inc. 2016 Omnibus Stock Incentive Plan, as amended (the "2016 Plan"), permits us to make grants of stock-based compensation awards to our directors, officers, employees and consultants. The plan is administered by the compensation committee of our board of directors.
On May 24, 2023, we held our 2023 annual meeting of stockholders. At the annual meeting, our stockholders approved an amendment to the 2016 Plan to, among other things, increase the number of shares of common stock available for future awards by 19 million. As of September 30, 2023, we had an aggregate of 21.3 million shares of common stock available for future awards.
The table below presents our stock-based compensation expense:
| | | | | | | | | | | | | | | | | | | | | | | |
| Three Months Ended September 30, | | Nine Months Ended September 30, |
| (In thousands) | 2023 | | 2022 | | 2023 | | 2022 |
| | | | | | | |
| Stock-based compensation expense | $ | 2,327 | | | $ | 2,266 | | | $ | 7,553 | | | $ | 7,156 | |
| Capitalized stock-based compensation | $ | 752 | | | $ | 826 | | | $ | 2,209 | | | $ | 2,455 | |
Douglas Emmett, Inc.
Notes to Consolidated Financial Statements (unaudited) (continued)
12. EPS
We calculate basic EPS by dividing the net income (loss) attributable to common stockholders for the period by the weighted average number of common shares outstanding during the period. We calculate diluted EPS by dividing the net income (loss) attributable to common stockholders for the period by the weighted average number of common shares and dilutive instruments outstanding during the period using the treasury stock method. We account for unvested LTIP awards that contain non-forfeitable rights to dividends as participating securities and include these securities in the computation of basic and diluted EPS using the two-class method. The table below presents the calculation of basic and diluted EPS:
| | | | | | | | | | | | | | | | | | | | | | | |
| | Three Months Ended September 30, | | Nine Months Ended September 30, |
| | 2023 | | 2022 | | 2023 | | 2022 |
| Numerator (In thousands): | | | | | | | |
| Net (loss) income attributable to common stockholders | $ | (13,362) | | | $ | 22,955 | | | $ | (2,251) | | | $ | 72,843 | |
| Allocation to participating securities: Unvested LTIP Units | (271) | | | (218) | | | (831) | | | (666) | |
| Net (loss) income attributable to common stockholders - basic and diluted | $ | (13,633) | | | $ | 22,737 | | | $ | (3,082) | | | $ | 72,177 | |
| | | | | | | |
| Denominator (In thousands): | | | | | | | |
Weighted average shares of common stock outstanding - basic and diluted(1) | 166,738 | | | 175,784 | | | 170,553 | | | 175,742 | |
| | | | | | | |
| | | | | | | |
| | | | | | | |
| | | | | | | |
| Net (loss) income per common share - basic and diluted | $ | (0.08) | | | $ | 0.13 | | | $ | (0.02) | | | $ | 0.41 | |
| | | | | | | |
| | | | | | | |
____________________________________________________
(1) Outstanding OP Units and vested LTIP Units are not included in the denominator in calculating diluted EPS, even though they may be exchanged under certain conditions for common stock on a one-for-one basis, because their associated net income or loss (equal on a per unit basis to the Net income or loss per common share - diluted) was already deducted in calculating Net income (loss) attributable to common stockholders. Accordingly, any exchange would not have any effect on diluted EPS. The table below presents the weighted average OP Units and vested LTIP Units outstanding for the respective periods:
| | | | | | | | | | | | | | | | | | | | | | | |
| | Three Months Ended September 30, | | Nine Months Ended September 30, |
| (In thousands) | 2023 | | 2022 | | 2023 | | 2022 |
| | | | | | | |
| OP Units | 31,698 | | | 30,158 | | | 30,720 | | | 29,626 | |
| Vested LTIP Units | 851 | | | 690 | | | 1,816 | | | 1,255 | |
Douglas Emmett, Inc.
Notes to Consolidated Financial Statements (unaudited) (continued)
13. Fair Value of Financial Instruments
Our estimates of the fair value of financial instruments were determined using available market information and widely used valuation methods. Considerable judgment is necessary to interpret market data and determine an estimated fair value. The use of different market assumptions or valuation methods may have a material effect on the estimated fair values. The FASB fair value framework hierarchy distinguishes between assumptions based on market data obtained from sources independent of the reporting entity, and the reporting entity’s own assumptions about market-based inputs. The hierarchy is as follows:
Level 1 - inputs utilize unadjusted quoted prices in active markets for identical assets or liabilities.
Level 2 - inputs are observable either directly or indirectly for similar assets and liabilities in active markets.
Level 3 - inputs are unobservable assumptions generated by the reporting entity.
As of September 30, 2023, we did not have any fair value estimates of financial instruments using Level 3 inputs.
Financial instruments disclosed at fair value
Short term financial instruments
The carrying amounts for cash and cash equivalents, tenant receivables, interest payable, accounts payable, security deposits and dividends payable approximate fair value because of the short-term nature of these instruments.
Secured notes payable
See Note 8 for the details of our secured notes payable. We estimate the fair value of our consolidated secured notes payable by calculating the credit-adjusted present value of the principal and interest payments for each secured note payable. The calculation incorporates observable market interest rates which we consider to be Level 2 inputs, assumes that the loans will be outstanding through maturity, and includes any maturity extension options. The table below presents the estimated fair value and carrying value of our secured notes payable, the carrying value includes unamortized loan premium and excludes unamortized deferred loan fees:
| | | | | | | | | | | |
| (In thousands) | September 30, 2023 | | December 31, 2022 |
| | | |
| Fair value | $ | 5,476,975 | | | $ | 5,115,548 | |
| Carrying value | $ | 5,573,462 | | | $ | 5,224,449 | |
Ground lease liability
See Note 4 for the details of our ground lease. We estimate the fair value of our ground lease liability by calculating the present value of the future lease payments disclosed in Note 4 using our incremental borrowing rate. The calculation incorporates observable market interest rates which we consider to be Level 2 inputs. The table below presents the estimated fair value and carrying value of our ground lease liability:
| | | | | | | | | | | |
| (In thousands) | September 30, 2023 | | December 31, 2022 |
| | | |
| Fair value | $ | 4,226 | | | $ | 4,466 | |
| Carrying value | $ | 10,839 | | | $ | 10,848 | |
Douglas Emmett, Inc.
Notes to Consolidated Financial Statements (unaudited) (continued)
Financial instruments measured at fair value
Derivative instruments
See Note 10 for the details of our derivatives. We present our derivatives on our consolidated balance sheets at fair value, on a gross basis, excluding accrued interest. We estimate the fair value of our derivative instruments by calculating the credit-adjusted present value of the expected future cash flows of each derivative. The calculation incorporates the contractual terms of the derivatives, observable market interest rates which we consider to be Level 2 inputs, and credit risk adjustments to reflect the counterparty's as well as our own non-performance risk. Our derivatives are not subject to master netting arrangements.
The table below presents the estimated fair value of our derivatives:
| | | | | | | | | | | |
| (In thousands) | September 30, 2023 | | December 31, 2022 |
| Derivative Assets: | | | |
Fair value - consolidated derivatives(1) | $ | 248,232 | | | $ | 270,234 | |
Fair value - unconsolidated Fund's derivatives(2) | $ | 12,356 | | | $ | 12,426 | |
| | | |
| Derivative Liabilities: | | | |
Fair value - consolidated derivatives(1) | $ | — | | | $ | 1,790 | |
Fair value - unconsolidated Fund's derivatives(2) | $ | — | | | $ | — | |
____________________________________________________
(1) Consolidated derivatives, which include 100%, not our pro-rata share, of our consolidated JVs' derivatives, are included in interest rate contracts on our consolidated balance sheets. The fair values exclude accrued interest which is included in interest payable on our consolidated balance sheets.
(2) The amounts reflect 100%, not our pro-rata share, of our unconsolidated Fund's derivatives. Our pro-rata share of the amounts related to the unconsolidated Fund's derivatives is included in our Investment in unconsolidated Fund on our consolidated balance sheets. Our unconsolidated Fund did not have any derivatives in a liability position for the periods presented. See Note 6 for more information about our Fund, including our equity interest percentage, and see "Guarantees" in Note 16 regarding our Fund's derivatives.
Douglas Emmett, Inc.
Notes to Consolidated Financial Statements (unaudited) (continued)
14. Segment Reporting
Segment information is prepared on the same basis that our management reviews information for operational decision-making purposes. We operate in two business segments: (i) the acquisition, development, ownership and management of office real estate and (ii) the acquisition, development, ownership and management of multifamily real estate. The services for our office segment primarily include rental of office space and other tenant services, including parking and storage space rental. The services for our multifamily segment include rental of apartments and other tenant services, including parking and storage space rental. Asset information by segment is not reported because we do not use this measure to assess performance or make decisions to allocate resources. Therefore, depreciation and amortization expense is not allocated among segments. General and administrative expenses and interest expense are not included in segment profit as our internal reporting addresses these items on a corporate level.
The table below presents the operating activity of our reportable segments:
| | | | | | | | | | | | | | | | | | | | | | | |
| (In thousands) | Three Months Ended September 30, | | Nine Months Ended September 30, |
| 2023 | | 2022 | | 2023 | | 2022 |
| Office Segment | | | | | | | |
| Total office revenues | $ | 208,823 | | | $ | 207,927 | | | $ | 617,614 | | | $ | 616,744 | |
| Office expenses | (74,631) | | | (74,653) | | | (220,261) | | | (212,006) | |
| Office segment profit | 134,192 | | | 133,274 | | | 397,353 | | | 404,738 | |
| | | | | | | |
| Multifamily Segment | | | | | | | |
| Total multifamily revenues | 46,586 | | | 45,736 | | | 143,595 | | | 122,771 | |
| Multifamily expenses | (17,256) | | | (13,661) | | | (50,470) | | | (35,729) | |
| Multifamily segment profit | 29,330 | | | 32,075 | | | 93,125 | | | 87,042 | |
| | | | | | | |
| Total profit from all segments | $ | 163,522 | | | $ | 165,349 | | | $ | 490,478 | | | $ | 491,780 | |
The table below presents a reconciliation of the total profit from all segments to net (loss) income attributable to common stockholders:
| | | | | | | | | | | | | | | | | | | | | | | |
| (In thousands) | Three Months Ended September 30, | | Nine Months Ended September 30, |
| | 2023 | | 2022 | | 2023 | | 2022 |
| | | | | | | |
| Total profit from all segments | $ | 163,522 | | | $ | 165,349 | | | $ | 490,478 | | | $ | 491,780 | |
| General and administrative expenses | (12,826) | | | (11,272) | | | (34,698) | | | (34,173) | |
| Depreciation and amortization | (122,022) | | | (96,276) | | | (336,771) | | | (279,588) | |
| Other income | 6,229 | | | 1,649 | | | 12,561 | | | 2,490 | |
| Other expenses | (175) | | | (199) | | | (820) | | | (561) | |
| Income from unconsolidated Fund | 290 | | | 356 | | | 1,177 | | | 921 | |
| Interest expense | (56,043) | | | (38,394) | | | (151,859) | | | (109,560) | |
| | | | | | | |
| | | | | | | |
| | | | | | | |
| Net (loss) income | (21,025) | | | 21,213 | | | (19,932) | | | 71,309 | |
| Net loss attributable to noncontrolling interests | 7,663 | | | 1,742 | | | 17,681 | | | 1,534 | |
| Net (loss) income attributable to common stockholders | $ | (13,362) | | | $ | 22,955 | | | $ | (2,251) | | | $ | 72,843 | |
Douglas Emmett, Inc.
Notes to Consolidated Financial Statements (unaudited) (continued)
15. Future Minimum Lease Rental Receipts
We lease space to tenants primarily under non-cancelable operating leases that generally contain provisions for a base rent plus reimbursement of certain operating expenses, and we own fee interests in two parcels of land from which we receive rent under ground leases. The table below presents the future minimum base rentals on our non-cancelable office tenant and ground leases for our consolidated properties at September 30, 2023:
| | | | | |
| Twelve months ending September 30: | (In thousands) |
| |
| 2024 | $ | 616,384 | |
| 2025 | 507,320 | |
| 2026 | 405,771 | |
| 2027 | 321,408 | |
| 2028 | 231,391 | |
| Thereafter | 678,380 | |
Total future minimum base rentals(1) | $ | 2,760,654 | |
___________________________________
(1) Does not include (i) residential leases, which typically have a term of one year or less, (ii) holdover rent, (iii) other types of rent such as storage and antenna rent, (iv) tenant reimbursements, (v) straight-line rent, (vi) amortization/accretion of acquired above/below-market lease intangibles and (vii) percentage rents. The amounts assume that early termination options held by tenants will not be exercised.
16. Commitments, Contingencies and Guarantees
Legal Proceedings
From time to time, we are party to various lawsuits, claims and other legal proceedings that arise in the ordinary course of our business. We are currently in litigation with the insurance providers in 2020 for Barrington Plaza to recover certain costs associated with reconstruction. Excluding ordinary, routine litigation incidental to our business, we are not currently a party to any legal proceedings that we believe would reasonably be expected to have a materially adverse effect on our business, financial condition or results of operations.
Concentration of Risk
Tenant Receivables
We are subject to credit risk with respect to our tenant receivables and deferred rent receivables related to our tenant leases. Our tenants' ability to honor the terms of their respective leases remains dependent upon economic, regulatory and social factors. We seek to minimize our credit risk from our tenant leases by (i) targeting smaller, more affluent office tenants, from a diverse mix of industries, (ii) performing credit evaluations of prospective tenants and (iii) obtaining security deposits or letters of credit from our tenants. For the nine months ended September 30, 2023 and 2022, no tenant accounted for more than 10% of our total revenues. See our revenue recognition policy in Note 2 for the charges to revenue for uncollectible amounts for tenant receivables and deferred rent receivables.
Geographic Risk
All of our properties, including our consolidated JVs and our unconsolidated Fund's properties, are located in Los Angeles County, California and Honolulu, Hawaii, and we are therefore susceptible to adverse economic and regulatory developments, as well as natural disasters, in those markets.
Douglas Emmett, Inc.
Notes to Consolidated Financial Statements (unaudited) (continued)
Derivative Counterparty Credit Risk
We are subject to credit risk with respect to our derivative counterparties. We do not post or receive collateral with respect to our derivative transactions. Our derivative contracts do not provide for right of offset between derivative contracts. See Note 10 for the details of our derivative contracts. We seek to minimize our credit risk by entering into agreements with a variety of counterparties with investment grade ratings.
Cash Balances
We have significant cash balances invested in a variety of short-term money market funds that are intended to preserve principal value and maintain a high degree of liquidity while providing current income. These investments are not insured against loss of principal and there is no guarantee that our investments in these funds will be redeemable at par value. We also have significant cash balances in bank accounts with high quality financial institutions with investment grade ratings. Interest bearing bank accounts at each U.S. banking institution are insured by the FDIC up to $250 thousand.
Asset Retirement Obligations
Conditional asset retirement obligations represent a legal obligation to perform an asset retirement activity in which the timing and/or method of settlement is conditional on a future event that may or may not be within our control. A liability for a conditional asset retirement obligation must be recorded if the fair value of the obligation can be reasonably estimated. Environmental site assessments have identified thirty-three buildings in our Consolidated Portfolio which contain asbestos, and would have to be removed in compliance with applicable environmental regulations if these properties are demolished or undergo major renovations. As of September 30, 2023, the obligations to remove the asbestos from properties which are currently undergoing major renovations, or that we plan to renovate in the future, are not material to our consolidated financial statements. As of September 30, 2023, the obligations to remove the asbestos from our other properties have indeterminable settlement dates, and we are unable to reasonably estimate the fair value of the associated conditional asset retirement obligations.
Contractual Commitments
Development Projects
In downtown Honolulu, we are converting a 25 story, 493,000 square foot office tower into approximately 493 apartments in phases over a number of years as the office space is vacated. As of September 30, 2023, we had an aggregate remaining contractual commitment for this development project and other development projects of approximately $19.3 million.
Other Contractual Commitments
As of September 30, 2023, we had an aggregate remaining contractual commitment for repositionings, capital expenditure projects and tenant improvements of approximately $15.0 million.
Guarantees
Unconsolidated Fund Guarantees
Our unconsolidated Fund, Partnership X, has a $115.0 million floating-rate term loan that matures on September 14, 2028. The loan carries interest at SOFR + 1.46% (with a zero-percent SOFR floor), which has been effectively fixed at 2.19% until October 1, 2026 with interest rate swaps (which do not have zero-percent SOFR floors). The loan and related swaps were converted to SOFR from LIBOR during the third quarter of 2023, resulting in a small SOFR adjustment to calculate the interest payable to the lender (which is included in the loan spread above). The conversion to SOFR did not change the swap-fixed interest rate. The loan is secured by two properties held by Partnership X and is non-recourse. We have made certain environmental and other limited indemnities and guarantees covering customary non-recourse carve-outs for Partnership X's loan, and we have also guaranteed the related swaps. Partnership X has agreed to indemnify us for any amounts that we would be required to pay under these agreements. As of September 30, 2023, assuming that SOFR does not decrease below zero-percent, the maximum future interest payments for the swaps were $2.9 million. As of September 30, 2023, all of the obligations under the related loan and swap agreements have been performed in accordance with the terms of those agreements. As of September 30, 2023, we estimate the risk of loss for the various indemnities and guarantees to be low. See Note 6 for more information regarding Partnership X.
Item 2. Management’s Discussion and Analysis of Financial Condition and Results of Operations
The following discussion should be read in conjunction with our Forward Looking Statements disclaimer, and our consolidated financial statements and related notes in Part I, Item 1 of this Report. During the nine months ended September 30, 2023, our results of operations were impacted by various transactions - see "Debt and Equity Transactions, Development and Repositioning Projects, and Other Transactions" further below.
Business Description
Douglas Emmett, Inc. is a fully integrated, self-administered and self-managed REIT. Through our interest in our Operating Partnership and its subsidiaries, our consolidated JVs and our unconsolidated Fund, we are one of the largest owners and operators of high-quality office and multifamily properties in Los Angeles County, California and in Honolulu, Hawaii. We focus on owning, acquiring, developing and managing a substantial market share of top-tier office properties and premier multifamily communities in neighborhoods that possess significant supply constraints, high-end executive housing and key lifestyle amenities. As of September 30, 2023, our portfolio consisted of the following (including ancillary retail space and excluding two parcels of land from which we receive rent under ground leases):
| | | | | | | | | | | | | | | | | |
| | | | | |
| | Consolidated Portfolio(1) | | Total Portfolio(2) | |
| Office | | | | |
| Class A Properties | 68 | | 70 | |
| Rentable Square Feet (in thousands)(3) | 17,595 | | 17,981 | |
| Leased rate | 83.8% | | 83.8% | |
| Occupancy rate | 81.8% | | 81.8% | |
| | | | | |
| Multifamily(4) | | | | |
| Properties | 14 | | 14 | |
| Units | 4,594 | | 4,594 | |
| Leased rate | 98.9% | | 98.9% | |
| Occupancy rate | 97.6% | | 97.6% | |
| | | | | |
______________________________________________________________________
(1) Our Consolidated Portfolio includes the properties in our consolidated results. Through our subsidiaries, we wholly-own 52 office properties totaling 13.4 million square feet and 12 residential properties with 4,124 apartments. Through four consolidated JVs, we partially own an additional 16 office properties totaling 4.2 million square feet and two residential properties with 470 apartments. Our Consolidated Portfolio excludes two wholly-owned land parcels from which we receive ground rent from ground leases to the owners of a Class A office building and a hotel.
(2) Our Total Portfolio includes our Consolidated Portfolio as well as two properties totaling 0.4 million square feet owned by our unconsolidated Fund, Partnership X. See Note 6 to our consolidated financial statements in Item 1 of this Report for more information about Partnership X.
(3) As of September 30, 2023, we removed 77,000 Rentable Square Feet for an office building that we are converting to residential apartments. See "Debt and Equity Transactions, Development and Repositioning Projects, and other Transactions" further below.
(4) Unit totals exclude units vacated to perform the fire life safety work at Barrington Plaza. The leased and occupancy rates exclude the impact of Barrington Plaza. See "Debt and Equity Transactions, Development and Repositioning Projects, and Other Transactions" further below.
Revenues by Segment and Location
During the nine months ended September 30, 2023, revenues from our Consolidated Portfolio were derived as follows:
 ____
____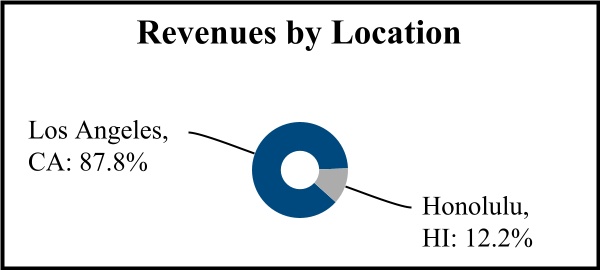
Debt and Equity Transactions, Development and Repositioning Projects, and Other Transactions
Debt and Equity Transactions
During the first quarter of 2023:
•Interest rate swaps, which fixed the interest rate on a $400.0 million interest-only, floating-rate term loan that matures in December 2024 for one of our consolidated JVs, expired on January 1, 2023, and the interest rate on the respective loan is now floating.
•Interest rate swaps, which fixed the interest rate on a $335.0 million interest-only, floating-rate term loan that matures in March 2025 for one of our wholly-owned subsidiaries, expired on March 1, 2023, and the interest rate on the respective loan is now floating.
•An interest rate swap that fixed the interest rate on a $102.4 million interest-only, floating-rate term loan that matures in April 2025 for one of our wholly-owned subsidiaries, expired on March 1, 2023, and the interest rate on the respective loan is now floating.
•We repurchased 1.4 million shares of common stock for $16.5 million in cash, excluding transaction costs, in open market transactions. The average purchase price was $11.50 per share.
•We acquired 5 thousand OP Units for $89 thousand in cash.
During the second quarter of 2023:
•We repurchased 7.6 million shares of common stock for $92.6 million in cash, excluding transaction costs, in open market transactions. The average purchase price was $12.13 per share.
•We acquired 20 thousand OP Units for $232 thousand in cash.
During the third quarter of 2023:
•We closed a new $350.0 million secured, non-recourse interest-only term loan that matures in August 2033. The loan accrues interest at SOFR plus 1.37% and is secured by our Landmark Los Angeles and Bishop Place properties. The interest rate is capped with lender-required out-of-the-money interest rate caps at 7.84% until August 2026. We used part of the proceeds to pay off the balance on our revolving credit facility, which expired in August 2023.
•We purchased three lender-required out-of-the-money interest rate caps with an aggregate notional amount of $472.0 million to hedge $472.0 million of a $550.0 million loan. The interest rate is capped at a weighted average of 8.99% until July 2026.
•We converted our LIBOR loans and swaps to SOFR. See Item 3 in Part I for our SOFR transition disclosures.
•In connection with the Barrington Plaza loan, Barrington Plaza Apartments have been removed from the rental market. The lender is treating the debt as a construction loan. They have required a $13.3 million cash deposit, which we placed in a collateral account during the third quarter, and they are requiring a construction completion guarantee. See "Property to be Removed from Service" further below for more information about Barrington Plaza.
•We acquired 3 thousand OP Units for $46 thousand in cash.
See Notes 8, 10 and 11 to our consolidated financial statements in Item 1 of this Report for more information regarding our debt, derivatives and equity, respectively.
Development
•1132 Bishop Street, Honolulu, Hawaii - "The Residences at Bishop Place"
In downtown Honolulu, we are converting a 25-story, 493 thousand square foot office tower into 493 rental apartments. This project is helping to address the severe shortage of rental housing in Honolulu and revitalize the central business district, where we own a significant portion of the Class A office space. As of September 30, 2023, we had delivered eighty-six-percent of the planned units and leased ninety-nine-percent of the units delivered. The conversion will continue in phases through 2025 as the remaining office space is vacated, therefore, the expected timing of the remaining spending is uncertain.
Repositionings
We often strategically purchase properties with large vacancies or expected near-term lease roll-over and use our knowledge of the property and submarket to reposition the property for the optimal use and tenant mix. In addition, we may reposition properties already in our portfolio. The work we undertake to reposition a building typically takes months or even years, and could involve a range of improvements from a complete structural renovation to a targeted remodeling of selected spaces. During the repositioning, the affected property may display depressed rental revenue and occupancy levels that impact our results and, therefore, comparisons of our performance from period to period.
Property to be Removed from Service
During the second quarter of 2023, we filed paperwork to remove our Barrington Plaza Apartments property in Los Angeles from the rental market because of city directives to install fire sprinklers and other life safety improvements. A reconstruction of this property is expected to take a number of years at a cost of several hundred million dollars. We are currently in litigation with the insurance providers in 2020 for Barrington Plaza to recover certain costs associated with reconstruction. As of September 30, 2023, a significant majority of the tenants have vacated. Tenants occupying 170 units have the right to remain until May 2024, and we expect them to move out at an uneven pace over the intervening period. That schedule could be impacted by legal or regulatory actions. During any period when the property is unoccupied, we will not generate any revenue from it. In connection with the removal of the aforementioned property from the rental market, we accelerated and recorded additional depreciation expense of $27.4 million for the three months ended September 30, 2023 and $54.8 million for the nine months ended September 30, 2023, which is included in Depreciation and amortization on our consolidated statements of operations.
Rental Rate Trends - Total Portfolio
Office Rental Rates
The table below presents the average annual rental rate per leased square foot and the annualized lease transaction costs per leased square foot for leases executed in our total office portfolio during the respective periods:
| | | | | | | | | | | | | | | | | | | | | | | | | | | | | | | | | | | | | | |
| | | | | | | | | | | | |
| | | Nine Months Ended | | Year Ended December 31, | |
| | | September 30, 2023 | | 2022 | | 2021 | | 2020 | | 2019 | |
| | | | | | | | | | | | |
| Average straight-line rental rate(1)(2)(4) | | $43.24 | | $46.78 | | $44.99 | | $45.26 | | $49.65 | |
| Annualized lease transaction costs(3)(4) | | $5.44 | | $5.85 | | $4.77 | | $5.11 | | $6.02 | |
| | | | | | | | | | | | |
___________________________________________________
(1)These average rental rates are not directly comparable from year to year because the averages are significantly affected from period to period by factors such as the buildings, submarkets, and types of space and terms involved in the leases executed during the respective reporting period. Because straight-line rent takes into account the full economic value during the full term of each lease, including rent concessions and escalations, we believe that it may provide a better comparison than ending cash rents, which include the impact of the annual escalations over the entire term of the lease.
(2)Reflects the weighted average straight-line Annualized Rent.
(3)Reflects the weighted average leasing commissions and tenant improvement allowances divided by the weighted average number of years for the leases. Excludes leases substantially negotiated by the seller in the case of acquired properties and leases for tenants relocated from space at the landlord's request.
(4)Our office rental rates were adversely impacted by the COVID-19 pandemic during 2020, 2021 and 2022, although the lower rental rates for the respective periods were partly offset by lower tenant improvement costs.
Office Rent Roll
The table below presents the rent roll for new and renewed leases per leased square foot executed in our total office portfolio:
| | | | | | | | | | | | | | | | | | | | | | | |
| | | | | | | |
| | Nine Months Ended September 30, 2023 | |
| | | | | | | |
| Rent Roll(1)(2) | Expiring Rate(2) | | New/Renewal Rate(2) | | Percentage Change | |
| | | | | | | |
| Cash Rent | $45.59 | | $41.95 | | (8.0)% | |
| Straight-line Rent | $41.43 | | $43.24 | | 4.4% | |
| | | | | | | |
___________________________________________________
(1)Represents the average annual initial stabilized cash and straight-line rents per square foot on new and renewed leases signed during the period compared to the prior leases for the same space. Excludes leases with a term of twelve months or less, leases where the prior lease was terminated more than a year before signing of the new lease, leases for tenants relocated at the landlord's request, leases in acquired buildings where we believe the information about the prior agreement is incomplete or where we believe the base rent reflects other off-market inducements to the tenant, and other non-comparable leases.
(2)Our office rent roll can fluctuate from period to period as a result of changes in our submarkets, buildings and term of the expiring leases, making these metrics difficult to predict.
Multifamily Rental Rates
The table below presents the average annual rental rate per leased unit for new tenants:
| | | | | | | | | | | | | | | | | | | | | | | | | | | | | | | | | | | | | | |
| | | | | | | | | | | | |
| | | Nine Months Ended | | Year Ended December 31, | |
| | | September 30, 2023 | | 2022 | | 2021 | | 2020 | | 2019 | |
| | | | | | | | | | | | |
| Average annual rental rate - new tenants(1)(2) | | $36,200 | | $31,763 | | $29,837 | | $28,416 | | $28,350 | |
| | | | | | | | | | | | |
_____________________________________________________
(1) These average rental rates are not directly comparable from year to year because of changes in the properties and units included. For example:
(i) During 2020, the average was impacted by the addition of a significant number of units at our Bishop Place development in Honolulu, where the rental rates were higher than the average in our portfolio, and
(ii) During 2022, the average was impacted by the acquisition of 1221 Ocean Avenue, where the rental rates were higher than the average in our portfolio.
(iii) During the nine months ended September 30, 2023, the average was impacted by leasing of units at our newly developed West Los Angeles property, where the rental rates were higher than the average in our portfolio. Barrington Plaza was removed from this metric beginning with the third quarter of 2023.
(2) Our multifamily rental rates were adversely impacted by the COVID-19 pandemic in 2020 but improved in 2021 and 2022.
Multifamily Rent Roll
The rent on leases subject to rent change during the nine months ended September 30, 2023 (new tenants and existing tenants undergoing annual rent review) was 2.5% higher on average than the prior rent on the same unit.
Occupancy Rates - Total Portfolio
The tables below present the occupancy rates for our total office portfolio and multifamily portfolio:
| | | | | | | | | | | | | | | | | | | | | | | | | | | | | | | | | | | | | | |
| | | | | | | | | | | | |
| | | | | December 31, | |
| Occupancy Rates(1) as of: | | September 30, 2023 | | 2022 | | 2021 | | 2020 | | 2019 | |
| | | | | | | | | | | | |
| Office portfolio(2) | | 81.8% | | 83.7% | | 84.9% | | 87.4% | | 91.4% | |
| Multifamily portfolio(3)(5) | | 97.6% | | 98.1% | | 98.0% | | 94.2% | | 95.2% | |
| | | | | | | | | | | | |
| | | | | | | | | | | | | | | | | | | | | | | | | | | | | | | | | | | | | | |
| | | | | | | | | | | | |
| | | Nine Months Ended | | Year Ended December 31, | |
| Average Occupancy Rates(1)(4): | | September 30, 2023 | | 2022 | | 2021 | | 2020 | | 2019 | |
| | | | | | | | | | | | |
| Office portfolio(2) | | 83.0% | | 84.2% | | 85.7% | | 89.5% | | 90.7% | |
| Multifamily portfolio(3)(5) | | 97.0% | | 97.9% | | 96.8% | | 94.2% | | 96.5% | |
| | | | | | | | | | | | |
___________________________________________________
(1)Occupancy rates include the impact of property acquisitions, most of whose occupancy rates at the time of acquisition were below that of our existing portfolio.
(2)Our office occupancy rates were adversely impacted by the COVID-19 pandemic during 2020, 2021 and 2022.
(3)Our Occupancy Rates may not be directly comparable from year to year, as they can be impacted by acquisitions, dispositions, development and redevelopment projects. Excludes units vacated to perform the fire life safety work at Barrington Plaza until June of 2023 and excludes impact of Barrington Plaza entirely starting in July 2023.
(4)Average occupancy rates are calculated by averaging the occupancy rates at the end of each of the quarters in the period and at the end of the quarter immediately prior to the start of the period.
(5)Our multifamily occupancy rates were adversely impacted by the COVID-19 pandemic during 2020 but recovered during 2021 and 2022.
Office Lease Expirations
As of September 30, 2023, assuming non-exercise of renewal options and early termination rights, we expect to see expiring square footage in our total office portfolio as follows:
____________________________________________________
(1) Average of the percentage of leases at September 30, 2020, 2021, and 2022 with the same remaining duration as the leases for the labeled year had at September 30, 2023. Acquisitions are included in the prior year average commencing in the quarter after the acquisition.
Results of Operations
Comparison of three months ended September 30, 2023 to three months ended September 30, 2022
Our operating results were adversely impacted by the effects of inflation and higher interest rates during the three months ended September 30, 2023, and by the COVID-19 pandemic during the three months ended September 30, 2022.
| | | | | | | | | | | | | | | | | | | | | | | | | | | | | | | | | | | | | | |
| | | | | | | | | | | | |
| | | Three Months Ended September 30, | | Favorable (Unfavorable) | | | |
| | | 2023 | | 2022 | | Change | | % | | Commentary | |
| | | | | | | | | | | | |
| | | (In thousands) | | | | | |
| Revenues | |
| | | | | | | | | | | | |
| Office rental revenue and tenant recoveries | | $ | 181,106 | | | $ | 182,011 | | | $ | (905) | | | (0.5) | % | | The decrease was primarily due to lower occupancy, lower collections, and our office to residential conversion project at Bishop Place. The decrease was partly offset by higher tenant recoveries and higher rental rates. | |
| Office parking and other income | | $ | 27,717 | | | $ | 25,916 | | | $ | 1,801 | | | 6.9 | % | | The increase was primarily due to an increase in parking income due to an increase in parking activity. | |
| Multifamily revenue | | $ | 46,586 | | | $ | 45,736 | | | $ | 850 | | | 1.9 | % | | The increase was primarily due to an increase in revenues from new units at our Landmark Los Angeles development project and our Residences at Bishop Place conversion project. The increase was partly offset by a decrease in revenues from units removed from service at our Barrington Plaza property commencing during the second quarter of 2023. | |
| | | | | | | | | | | | |
| Operating expenses | |
| | | | | | | | | | | | |
| Office rental expenses | | $ | 74,631 | | | $ | 74,653 | | | $ | 22 | | | — | % | | The office rental expenses were relatively flat compared to the prior period. Security, repairs and maintenance, janitorial and personnel expenses increased, and those increases were offset by lower property taxes and a decrease in rental expenses from our office to residential conversion project at Bishop Place. | |
| | | | | | | | | | | | |
| | | | | | | | |
| | | | | | | | | | | | |
| | | | | | | | | | | | |
| | | | | | | | |
| | | | | | | | | | | | |
| Multifamily rental expenses | | $ | 17,256 | | | $ | 13,661 | | | $ | (3,595) | | | (26.3) | % | | The increase was primarily due to rental expenses from new units at our Landmark Los Angeles development project and our Residences at Bishop Place conversion project. | |
| General and administrative expenses | | $ | 12,826 | | | $ | 11,272 | | | $ | (1,554) | | | (13.8) | % | | The increase was primarily due to higher legal expenses, partly offset by a decrease in personnel and advocacy expenses. | |
| | | | | | | | | | | | |
| | | | | | | | | | | | |
| | | | | | | | | | | | |
| | | | | | | | | | | | |
| | | | | | | | |
| | | | | | | | | | | | |
| | | | | | | | | | | | |
| | | | | | | | |
| | | | | | | | | | | | |
| Depreciation and amortization | | $ | 122,022 | | | $ | 96,276 | | | $ | (25,746) | | | (26.7) | % | | The increase was primarily due to accelerated depreciation related to removing units from service at our Barrington Plaza property commencing during the second quarter of 2023. | |
| | | | | | | | | | | | |
| | | | | | | | | | | | | | | | | | | | | | | | | | | | | | | | | | | | | | |
| | | | | | | | | | | | |
| | | | | | | | | | | | |
| | | Three Months Ended September 30, | | Favorable (Unfavorable) | | | |
| | | 2023 | | 2022 | | Change | | % | | Commentary | |
| | | | | | | | | | | | |
| | | (In thousands) | | | | | |
| | | | | | | | | | | | |
| Non-Operating Income and Expenses | |
| | | | | | | | | | | | |
| Other income | | $ | 6,229 | | | $ | 1,649 | | | $ | 4,580 | | | 277.7 | % | | The increase was primarily due to an increase in interest income due to higher interest rates and higher cash and cash equivalent balances. | |
| Other expenses | | $ | (175) | | | $ | (199) | | | $ | 24 | | | 12.1 | % | | The decrease was primarily due to a decrease in expenses related to property management and other services provided to our unconsolidated fund and transaction expenses in the comparable period. | |
| Income from unconsolidated Fund | | $ | 290 | | | $ | 356 | | | $ | (66) | | | (18.5) | % | | The decrease was due to a decrease in the net income of our fund, Partnership X, which was primarily due to lower occupancy, lower tenant recoveries, higher rental expenses and higher depreciation expense. The decrease was partly offset by higher interest income. | |
| Interest expense | | $ | (56,043) | | | $ | (38,394) | | | $ | (17,649) | | | (46.0) | % | | The increase was primarily due to higher interest rates on our floating rate debt, higher debt and a decrease in interest capitalized related to development activity. | |
| | | | | | | | | | | | |
| | | | | | | | | | | | |
| | | | | | |
Results of Operations
Comparison of nine months ended September 30, 2023 to nine months ended September 30, 2022
Our operating results were adversely impacted by the effects of inflation and higher interest rates during the nine months ended September 30, 2023, and by the COVID-19 pandemic during the nine months ended September 30, 2022.
| | | | | | | | | | | | | | | | | | | | | | | | | | | | | | | | | | | | | | | | | | | | |
| | | | | | | | | | | | | | | | | | |
| | | Nine Months Ended September 30, | | Favorable (Unfavorable) | | | | | | | | | |
| | | 2023 | | 2022 | | Change | | % | | Commentary | | | | | | | |
| | | | | | | | | | | | | | | | | | |
| | | (In thousands) | | | | | | | | | | | |
| Revenues | | | | | | | |
| | | | | | | | | | | | | | | | | | |
| Office rental revenue and tenant recoveries | | $ | 535,243 | | | $ | 542,535 | | | $ | (7,292) | | | (1.3) | % | | The decrease was primarily due to lower occupancy, lower collections, lower accretion from below-market leases and our office to residential conversion project at Bishop Place. The decrease was partly offset by higher tenant recoveries and higher rental rates. | | | | | | | |
| Office parking and other income | | $ | 82,371 | | | $ | 74,209 | | | $ | 8,162 | | | 11.0 | % | | The increase was primarily due to an increase in parking income due to an increase in parking activity. | | | | | | | |
| | | | | | | | | | | | | | | | | | |
| | | | | | | | | | | | | | | | | | |
| | | | | | | | | | | | | | | | | | |
| | | | | | | | | | | | | | |
| | | | | | | | | | | | | | | | | | |
| | | | | | | | | | | | | | | | | | |
| | | | | | | | | | | | | | |
| Multifamily revenue | | $ | 143,595 | | | $ | 122,771 | | | $ | 20,824 | | | 17.0 | % | | The increase was primarily due to: (i) an increase in revenues from new units at our Landmark Los Angeles development project and our Residences at Bishop Place conversion project, (ii) an increase in revenues from our 1221 Ocean Avenue property in Santa Monica that we purchased in the second quarter of 2022 and (iii) higher rental rates at our other multifamily properties. The increase was partly offset by a decrease in revenues from units removed from service at our Barrington Plaza property commencing during the second quarter of 2023. | | | | | | | |
| | | | | | | | | | | | | | | | | | |
| | | | | | | | | | | | | | | | | | |
| | | | | | | | | | | | | | | | | | | | | | | | | | | | | | | | | | | | | | | | | | | | |
| | | | | | | | | | | | | | | | | | |
| | | | | | | | | | | | | | | | | | |
| | | | | | | | | | | | | | | | | | |
| | | Nine Months Ended September 30, | | Favorable (Unfavorable) | | | | | | | | | |
| | | 2023 | | 2022 | | Change | | % | | Commentary | | | | | | | |
| | | | | | | | | | | | | | | | | | |
| | | (In thousands) | | | | | | | | | | | |
| | | | | | | | | | | | | | | | | | |
| Operating expenses | | | | | | | |
| | | | | | | | | | | | | | | | | | |
| Office rental expenses | | $ | 220,261 | | | $ | 212,006 | | | $ | (8,255) | | | (3.9) | % | | The increase was primarily due to an increase in utility, insurance, janitorial and security expenses. The increase was partly offset by a decrease in rental expenses from our office to residential conversion project at Bishop Place and lower property taxes. | | | | | | | |
| | | | | | | | | | | | | | | | | | |
| | | | | | | | | | | | | | | | | | |
| | | | | | | | | | | | | | | | | | |
| | | | | | | | | | | | | | | | | | |
| | | | | | | | | | | | | | | | | | |
| | | | | | | | | | | | | | |
| | | | | | | | | | | | | | | | | | |
| | | | | | | | | | | | | | | | | | |
| | | | | | | | | | | | | | |
| | | | | | | | | | | | | | | | | | |
| Multifamily rental expenses | | $ | 50,470 | | | $ | 35,729 | | | $ | (14,741) | | | (41.3) | % | | The increase was primarily due to: (i) an increase in rental expenses from new units at our development projects, (ii) an increase in rental expenses from our 1221 Ocean Avenue property in Santa Monica that we purchased in the second quarter of 2022, and (iii) an increase in personnel, security, and insurance expenses at our other multifamily properties. | | | | | | | |
| General and administrative expenses | | $ | 34,698 | | | $ | 34,173 | | | $ | (525) | | | (1.5) | % | | The increase was primarily due to higher legal and leasing expenses, partly offset by a decrease in advocacy and personnel expenses. | | | | | | | |
| Depreciation and amortization | | $ | 336,771 | | | $ | 279,588 | | | $ | (57,183) | | | (20.5) | % | | The increase was primarily due to accelerated depreciation related to removing units from service at our Barrington Plaza property commencing during the second quarter of 2023. | | | | | | | |
| | | | | | | | | | | | | | | | | | |
| | | | | | | | | | | | | | | | | | |
| | | | | | | | | | | | | | | | | | |
| | | | | | | | | | | | | | | | | | |
| | | | | | | | | | | | | | | | | | |
| | | | | | | | | | | | | | |
| | | | | | | | | | | | | | | | | | |
| | | | | | | | | | | | | | | | | | |
| | | | | | | | | | | | | | |
| | | | | | | | | | | | | | | | | | |
| | | | | | | | | | | | | | | | | | |
| Non-Operating Income and Expenses | | | | | | | |
| | | | | | | | | | | | | | | | | | |
| Other income | | $ | 12,561 | | | $ | 2,490 | | | $ | 10,071 | | | 404.5 | % | | The increase was primarily due to an increase in interest income due to higher interest rates and higher cash and cash equivalent balances. | | | | | | | |
| | | | | | | | | | | | | | | | | | |
| | | | | | | | | | | | | | | | | | |
| | | | | | | | | | | | | | | | | | |
| | | | | | | | | | | | | | | | | | |
| | | | | | | | | | | | | | |
| | | | | | | | | | | | | | | | | | |
| | | | | | | | | | | | | | | | | | |
| | | | | | | | | | | | | | |
| | | | | | | | | | | | | | | | | | |
| Other expenses | | $ | (820) | | | $ | (561) | | | $ | (259) | | | (46.2) | % | | The increase was primarily due to transaction costs, partly offset by a decrease in expenses related to property management and other services provided to our unconsolidated fund. | | | | | | | |
| Income from unconsolidated Fund | | $ | 1,177 | | | $ | 921 | | | $ | 256 | | | 27.8 | % | | The increase was due to an increase in the net income of our fund, Partnership X, which was primarily due to better collections and higher interest income, partly offset by higher rental expenses and depreciation expense. | | | | | | | |
| Interest expense | | $ | (151,859) | | | $ | (109,560) | | | $ | (42,299) | | | (38.6) | % | | The increase was primarily due to higher interest rates on our floating rate debt, higher debt, and a decrease in interest capitalized related to development activity. | | | | | | | |
| | | | | | | | | | | | | | | | | | |
| | | | | | | | | | | | | | | | | | |
| | | | | | | | | | | | |
| | | | | | | | | | | | | | | | | | |
Non-GAAP Supplemental Financial Measure: FFO
Usefulness to Investors
We report FFO because it is a widely reported measure of the performance of equity REITs, and is also used by some investors to identify the impact of trends in occupancy rates, rental rates and operating costs from year to year, excluding impacts from changes in the value of our real estate, and to compare our performance with other REITs. FFO is a non-GAAP financial measure for which we believe that net income (loss) is the most directly comparable GAAP financial measure. FFO has limitations as a measure of our performance because it excludes depreciation and amortization of real estate, and captures neither the changes in the value of our properties that result from use or market conditions, nor the level of capital expenditures, tenant improvements and leasing commissions necessary to maintain the operating performance of our properties, all of which have real economic effect and could materially impact our results from operations. FFO should be considered only as a supplement to net income (loss) as a measure of our performance and should not be used as a measure of our liquidity or cash flow, nor is it indicative of funds available to fund our cash needs, including our ability to pay dividends. Other REITs may not calculate FFO in accordance with the NAREIT definition and, accordingly, our FFO may not be comparable to the FFO of other REITs. See "Results of Operations" above for a discussion of the items that impacted our net income (loss).
FFO Reconciliation to GAAP
The table below reconciles our FFO (the FFO attributable to our common stockholders and noncontrolling interests in our Operating Partnership - which includes our share of our consolidated JVs and our unconsolidated Fund's FFO) to net (loss) income attributable to common stockholders (the most directly comparable GAAP measure):
| | | | | | | | | | | | | | | | | | | | | | | | | | | | | |
| | | | | | | | | |
| | Three Months Ended September 30, | | Nine Months Ended September 30, | |
| (In thousands) | 2023 | | 2022 | | 2023 | | 2022 | |
| | | | | | | | | |
| Net (loss) income attributable to common stockholders | $ | (13,362) | | | $ | 22,955 | | | $ | (2,251) | | | $ | 72,843 | | |
| Depreciation and amortization of real estate assets | 122,022 | | | 96,276 | | | 336,771 | | | 279,588 | | |
| Net loss attributable to noncontrolling interests | (7,663) | | | (1,742) | | | (17,681) | | | (1,534) | | |
| Adjustments attributable to unconsolidated Fund(1) | 742 | | | 716 | | | 2,232 | | | 2,112 | | |
| Adjustments attributable to consolidated JVs(2) | (12,358) | | | (13,046) | | | (34,646) | | | (38,863) | | |
| | | | | | | | | |
| | | | | | | | | |
| | | | | | | | | |
| FFO | $ | 89,381 | | | $ | 105,159 | | | $ | 284,425 | | | $ | 314,146 | | |
| | | | | | | | | |
________________________________________________________________
(1)Adjusts for our share of Partnership X's depreciation and amortization of real estate assets.
(2)Adjusts for the net income (loss) and depreciation and amortization of real estate assets that is attributable to the noncontrolling interests in our consolidated JVs.
Comparison of three months ended September 30, 2023 to three months ended September 30, 2022
For the three months ended September 30, 2023, FFO decreased by $15.8 million, or 15.0%, to $89.4 million, compared to $105.2 million for the three months ended September 30, 2022. The decrease was primarily due to higher interest expense and a decrease in NOI from our multifamily portfolio, partly offset by higher interest income and an increase in NOI from our office portfolio. The increase in interest expense was primarily due to higher interest rates on our floating rate debt, higher debt and a decrease in interest capitalized related to development activity. The decrease in NOI from our multifamily portfolio was primarily due to a decrease in revenues from units removed from service at our Barrington Plaza property commencing during the second quarter of 2023. The increase in interest income was primarily due to higher interest rates and higher cash and cash equivalents balances. The increase in NOI from our office portfolio was primarily due to higher parking income and higher tenant recoveries.
Comparison of nine months ended September 30, 2023 to nine months ended September 30, 2022
For the nine months ended September 30, 2023, FFO decreased by $29.7 million, or 9.5%, to $284.4 million, compared to $314.1 million for the nine months ended September 30, 2022. The decrease was primarily due to higher interest expense and a decrease in NOI from our office portfolio, partly offset by higher interest income and an increase in NOI from our multifamily portfolio. The reasons for the higher interest expense are the same as those described above. The decrease in NOI from our office portfolio was primarily due to: (i) lower occupancy, (ii) lower collections, (iii) lower accretion from below-market leases, (iv) our office to residential conversion project at Bishop Place, and (v) higher rental expenses. The reasons for the higher interest income are the same as those described above. The increase in NOI from our multifamily portfolio was primarily due to: (i) new units from our development projects, (ii) our acquisition of the 1221 Ocean Avenue property in Santa Monica in the second quarter of 2022, and (iii) higher rental rates at our other multifamily properties.
Non-GAAP Supplemental Financial Measure: Same Property NOI
Usefulness to Investors
We report Same Property NOI to facilitate a comparison of our operations between reported periods. Many investors use Same Property NOI to evaluate our operating performance and to compare our operating performance with other REITs, because it can reduce the impact of investing transactions on operating trends. Same Property NOI is a non-GAAP financial measure for which we believe that net income (loss) is the most directly comparable GAAP financial measure. We report Same Property NOI because it is a widely recognized measure of the performance of equity REITs, and is used by some investors to identify trends in occupancy rates, rental rates and operating costs and to compare our operating performance with that of other REITs. Same Property NOI has limitations as a measure of our performance because it excludes depreciation and amortization expense, and captures neither the changes in the value of our properties that result from use or market conditions, nor the level of capital expenditures, tenant improvements and leasing commissions necessary to maintain the operating performance of our properties, all of which have real economic effect and could materially impact our results from operations. Other REITs may not calculate Same Property NOI in the same manner. As a result, our Same Property NOI may not be comparable to the Same Property NOI of other REITs. Same Property NOI should be considered only as a supplement to net income (loss) as a measure of our performance and should not be used as a measure of our liquidity or cash flow, nor is it indicative of funds available to fund our cash needs, including our ability to pay dividends.
Comparison of three months ended September 30, 2023 to three months ended September 30, 2022
Our Same Properties for 2023 included 67 office properties, aggregating 17.6 million Rentable Square Feet, and 10 multifamily properties with an aggregate 3,449 units. The amounts presented below reflect 100% (not our pro-rata share). Our Same Property results were adversely impacted by the effects of inflation during the three months ended September 30, 2023 and by the COVID-19 pandemic during the three months ended September 30, 2022.
| | | | | | | | | | | | | | | | | | | | | | | | | | | | | | | | | | | |
| | | | | | | | | | | |
| | Three Months Ended September 30, | | Favorable (Unfavorable) | | | |
| | 2023 | | 2022 | | Change | | % | | Commentary | |
| | (In thousands) | | | | | |
| | | | | | | | | | | |
| Office revenues | $ | 207,766 | | | $ | 205,588 | | | $ | 2,178 | | | 1.1 | % | | The increase was primarily due to an increase in tenant recoveries and parking income. The increase was partly offset by a decrease in rental revenues due to lower occupancy and collections. | |
| Office expenses | (74,476) | | | (73,184) | | | (1,292) | | | (1.8) | % | | The increase was primarily due to an increase in security, repairs and maintenance, janitorial and personnel expenses. The increase was partly offset by lower property taxes. | |
| Office NOI | 133,290 | | | 132,404 | | | 886 | | | 0.7 | % | | | |
| | | | | | | | | | | |
| Multifamily revenues | 29,652 | | | 29,155 | | | 497 | | | 1.7 | % | | The increase was primarily due to an increase in rental revenues due to higher rental rates, which was partly offset by lower collections. | |
| Multifamily expenses | (9,204) | | | (8,998) | | | (206) | | | (2.3) | % | | The increase was primarily due to an increase in security and personnel expenses, partly offset by a decrease in utility costs. | |
| Multifamily NOI | 20,448 | | | 20,157 | | | 291 | | | 1.4 | % | | | |
| | | | | | | | | | | |
| Total NOI | $ | 153,738 | | | $ | 152,561 | | | $ | 1,177 | | | 0.8 | % | | | |
| | | | | | | | | | | |
Reconciliation to GAAP
The table below presents a reconciliation of our Same Property NOI to net (loss) income attributable to common stockholders (the most directly comparable GAAP measure):
| | | | | | | | | | | | | | | | | |
| | | | | |
| | Three Months Ended September 30, | |
| (In thousands) | 2023 | | 2022 | |
| | | | | |
| Same Property NOI | $ | 153,738 | | | $ | 152,561 | | |
| Non-comparable office revenues | 1,057 | | | 2,339 | | |
| Non-comparable office expenses | (155) | | | (1,469) | | |
| Non-comparable multifamily revenues | 16,934 | | | 16,581 | | |
| Non-comparable multifamily expenses | (8,052) | | | (4,663) | | |
| NOI | 163,522 | | | 165,349 | | |
| General and administrative expenses | (12,826) | | | (11,272) | | |
| Depreciation and amortization | (122,022) | | | (96,276) | | |
| Other income | 6,229 | | | 1,649 | | |
| Other expenses | (175) | | | (199) | | |
| Income from unconsolidated Fund | 290 | | | 356 | | |
| Interest expense | (56,043) | | | (38,394) | | |
| | | | | |
| | | | | |
| | | | | |
| Net (loss) income | (21,025) | | | 21,213 | | |
| Net loss attributable to noncontrolling interests | 7,663 | | | 1,742 | | |
| Net (loss) income attributable to common stockholders | $ | (13,362) | | | $ | 22,955 | | |
| | | | | |
Comparison of nine months ended September 30, 2023 to nine months ended September 30, 2022
Our Same Properties for 2023 included 67 office properties, aggregating 17.6 million Rentable Square Feet, and 10 multifamily properties with an aggregate 3,449 units. The amounts presented below reflect 100% (not our pro-rata share). Our Same Property results were adversely impacted by the effects of inflation during the nine months ended September 30, 2023 and by the COVID-19 pandemic during the nine months ended September 30, 2022.
| | | | | | | | | | | | | | | | | | | | | | | | | | | | | | | | | | | |
| | | | | | | | | | | |
| | Nine Months Ended September 30, | | Favorable (Unfavorable) | | | |
| | 2023 | | 2022 | | Change | | % | | Commentary | |
| | (In thousands) | | | | | |
| | | | | | | | | | | |
| Office revenues | $ | 614,308 | | | $ | 608,626 | | | $ | 5,682 | | | 0.9% | | The increase was primarily due to an increase in parking income and tenant recoveries, partly offset by lower rental revenues. The lower rental revenues were primarily due to lower occupancy, lower collections and lower accretion from below-market leases. | |
| Office expenses | (219,792) | | | (208,188) | | | (11,604) | | | (5.6)% | | The increase was primarily due to an increase in utility, insurance, janitorial and security expenses. The increase was partly offset by lower property taxes. | |
| Office NOI | 394,516 | | | 400,438 | | | (5,922) | | | (1.5)% | | | |
| | | | | | | | | | | |
| Multifamily revenues | 89,339 | | | 85,216 | | | 4,123 | | | 4.8% | | The increase was primarily due to an increase in rental revenues due to higher rental rates. | |
| Multifamily expenses | (28,025) | | | (26,284) | | | (1,741) | | | (6.6)% | | The increase was primarily due to an increase in personnel, security, and insurance expenses. | |
| Multifamily NOI | 61,314 | | | 58,932 | | | 2,382 | | | 4.0% | | | |
| | | | | | | | | | | |
| Total NOI | $ | 455,830 | | | $ | 459,370 | | | $ | (3,540) | | | (0.8)% | | | |
| | | | | | | | | | | |
Reconciliation to GAAP
The table below presents a reconciliation of our Same Property NOI to net (loss) income attributable to common stockholders (the most directly comparable GAAP measure):
| | | | | | | | | | | | | | | | | |
| | | | | |
| | Nine Months Ended September 30, | |
| (In thousands) | 2023 | | 2022 | |
| Same Property NOI | $ | 455,830 | | | $ | 459,370 | | |
| Non-comparable office revenues | 3,306 | | | 8,118 | | |
| Non-comparable office expenses | (469) | | | (3,818) | | |
| Non-comparable multifamily revenues | 54,256 | | | 37,555 | | |
| Non-comparable multifamily expenses | (22,445) | | | (9,445) | | |
| NOI | 490,478 | | | 491,780 | | |
| General and administrative expenses | (34,698) | | | (34,173) | | |
| Depreciation and amortization | (336,771) | | | (279,588) | | |
| Other income | 12,561 | | | 2,490 | | |
| Other expenses | (820) | | | (561) | | |
| Income from unconsolidated Fund | 1,177 | | | 921 | | |
| Interest expense | (151,859) | | | (109,560) | | |
| | | | | |
| | | | | |
| | | | | |
| Net (loss) income | (19,932) | | | 71,309 | | |
| Net loss attributable to noncontrolling interests | 17,681 | | | 1,534 | | |
| Net (loss) income attributable to common stockholders | $ | (2,251) | | | $ | 72,843 | | |
| | | | | |
Liquidity and Capital Resources
Short-term liquidity
Our short-term liquidity needs consist primarily of funds necessary for our operating activities, development, repositioning projects, dividends, distributions and discretionary share repurchases. During the nine months ended September 30, 2023, we generated cash from operations of $332.2 million. As of September 30, 2023, we had $526.2 million of cash and cash equivalents. Our earliest term loan maturity is December 2024. See Note 8 to our consolidated financial statements in Item 1 of this Report for more information regarding our debt. Excluding acquisitions and debt refinancings, we expect to meet our short-term liquidity requirements through cash on hand and cash generated by operations.
Long-term liquidity
Our long-term liquidity needs consist primarily of funds necessary to pay for acquisitions, development and debt refinancings. We do not expect to have sufficient funds on hand to cover these long-term cash requirements due to REIT federal tax rules which require that we distribute at least 90% of our income on an annual basis. We plan to meet our long-term liquidity needs through long-term secured non-recourse debt, the issuance of equity securities, including common stock and OP Units, as well as property dispositions and JV transactions.
We only use non-recourse debt secured by our properties. As of the date of this report, approximately 45% of our total office portfolio was unencumbered. To mitigate the impact of changing interest rates on our cash flows from operations, we generally enter into interest rate swap agreements with respect to our loans with floating interest rates. These swap agreements generally expire two years before the maturity date of the related loan, during which time we can refinance the loan without any interest penalty. We also enter into interest rate cap agreements from time to time to cap the interest rates on our floating rate loans. See Notes 8 and 10 to our consolidated financial statements in Item 1 of this Report for more information regarding our debt and derivative contracts, respectively. See Item 3 "Quantitative and Qualitative Disclosures about Market Risk" of this Report regarding the impact of interest rate increases on our future operating results and cash flows.
Certain Contractual Obligations
See the following notes to our consolidated financial statements in Item 1 of this Report for information regarding our contractual commitments:
•Note 4 - minimum future ground lease payments;
•Note 8 - minimum future principal payments for our secured notes payable, and the interest rates that determine our future periodic interest payments; and
•Note 16 - contractual commitments.
Off-Balance Sheet Arrangements
Unconsolidated Fund Debt
Our Fund, Partnership X, has its own secured non-recourse debt and interest rate swaps. We have made certain environmental and other limited indemnities and guarantees covering customary non-recourse carve-outs related to that loan, and we have also guaranteed the interest rate swaps. Partnership X has agreed to indemnify us for any amounts that we would be required to pay under these agreements. As of September 30, 2023, all of the obligations under the respective loan and swap agreements have been performed in accordance with the terms of those agreements. See "Guarantees" in Note 16 to our consolidated financial statements in Item 1 of this Report for more information about our Fund's debt and swaps, and the respective guarantees.
Cash Flows
Comparison of nine months ended September 30, 2023 to nine months ended September 30, 2022
Our operating cash flows were adversely impacted by the effects of inflation and higher interest rates during the nine months ended September 30, 2023 and by the COVID-19 pandemic during the nine months ended September 30, 2022.
| | | | | | | | | | | | | | | | | | | | | | | | | | | | | |
| | | | | | | | | |
| | Nine Months Ended September 30, | | Increase (Decrease) In Cash | | | |
| | 2023 | | 2022 | | | % | |
| | (In thousands) | | | |
| | | | | | | | | |
| Net cash provided by operating activities(1) | $ | 332,209 | | | $ | 381,669 | | | $ | (49,460) | | | (13.0) | % | |
| Net cash used in investing activities(2) | $ | (180,373) | | | $ | (496,999) | | | $ | 316,626 | | | 63.7 | % | |
| Net cash provided by financing activities(3) | $ | 105,557 | | | $ | 60,433 | | | $ | 45,124 | | | 74.7 | % | |
| | | | | | | | | |
________________________________________________________________________
(1) Our cash flows from operating activities are primarily dependent upon the occupancy and rental rates of our portfolio, the collectibility of tenant receivables, the level of our operating and general and administrative expenses, and interest expense. The decrease in cash from operating activities of $49.5 million was primarily due to: (i) higher interest expense, (ii) cash used to fund working capital, and (iii) a decrease in NOI from our office portfolio, partly offset by higher interest income and an increase in NOI from our multifamily portfolio.
(2) Our cash flows from investing activities is generally used to fund property acquisitions, developments and redevelopment projects, and Recurring and non-Recurring Capital Expenditures. The increase in cash from investing activities of $316.6 million was primarily due to: (i) $330.5 million for a property acquisition during the nine months ended September 30, 2022, and (ii) a decrease in capital expenditures for developments of $23.5 million, partly offset by an increase in capital expenditures for improvements to real estate of $33.3 million.
(3) Our cash flows from financing activities are generally impacted by our borrowings and capital activities, as well as dividends and distributions paid to common stockholders and noncontrolling interests, respectively. The increase in cash from financing activities of $45.1 million was primarily due to: (i) an increase in net borrowings of $175.0 million, (ii) a decrease in dividends paid to common stockholders of $49.4 million, and (iii) lower distributions paid to noncontrolling interests of $14.9 million, partly offset by cash paid to repurchase common stock of $109.2 million and a decrease in contributions from noncontrolling interests in our consolidated JVs of $80.9 million.
Critical Accounting Policies
We have not made any changes to our critical accounting policies disclosed in our 2022 Annual Report on Form 10-K. Our discussion and analysis of our financial condition and results of operations is based upon our consolidated financial statements, which have been prepared in accordance with US GAAP, and which requires us to make estimates of certain items, which affect the reported amounts of our assets, liabilities, revenues and expenses. While we believe that our estimates are based upon reasonable assumptions and judgments at the time that they are made, some of our estimates could prove to be incorrect, and those differences could be material. Some of our estimates are subject to adjustment as we believe appropriate, based on revised estimates, and reconciliation to actual results when available.
Item 3. Quantitative and Qualitative Disclosures about Market Risk
Fixed-Rate Borrowings and Hedged Borrowings
As of September 30, 2023, the interest rates for 69% of our consolidated borrowings were fixed or swap-fixed with interest rate swaps, and 15% were capped with interest rate caps. Our use of interest rate swaps and caps exposes us to credit risk from the potential inability of our counterparties to perform under the terms of those agreements. We attempt to minimize this credit risk by contracting with a variety of financial counterparties with investment grade ratings. As of September 30, 2023, the maximum amount the interest expense on our capped-rate borrowings could increase by is $14.5 million per year. Higher interest rates would cause an increase in our future interest expense on our capped-rate debt, which would reduce our future net income, cash flows from operations and FFO.
Unhedged Floating-Rate Borrowings
As of September 30, 2023, the interest rates for 16% of our consolidated borrowings were floating. As of September 30, 2023, the interest expense for our floating-rate borrowings that are not hedged would increase by $9.3 million per year for every one hundred basis point increase in the related benchmark interest rate. Higher interest rates would cause an increase in our future interest expense on our floating-rate debt, which would reduce our future net income, cash flows from operations and FFO.
See Note 8 to our consolidated financial statements in Item 1 of this Report for our more information regarding our debt and our future swap and cap expirations. See Note 10 to our consolidated financial statements in Item 1 of this Report for more information regarding our swaps and caps.
Market Transition to SOFR from LIBOR
During the third quarter of 2023, we converted all of our LIBOR loans and swaps to SOFR. The LIBOR loans converted to SOFR include a small SOFR adjustment (an increase to the SOFR rate) to calculate the interest payable to the lender. The SOFR conversion did not change the swap-fixed interest rates for our swap-fixed loans. See Notes 8 and 10 to our consolidated financial statements in Item 1 of this Report for more information regarding our debt and derivatives, respectively.
Item 4. Controls and Procedures
As of September 30, 2023, the end of the period covered by this Report, we carried out an evaluation, under the supervision and with the participation of management, including our CEO and CFO, regarding the effectiveness of our disclosure controls and procedures (as defined in Rules 13a-15(e) and 15d-15(e) under the Exchange Act). Based on the foregoing, our CEO and CFO concluded, as of that time, that our disclosure controls and procedures were effective in ensuring that information required to be disclosed by us in reports filed or submitted under the Exchange Act (i) is processed, recorded, summarized and reported within the time periods specified in the SEC’s rules and forms and (ii) is accumulated and communicated to our management, including our CEO and our CFO, as appropriate, to allow for timely decisions regarding required disclosure. There have not been any changes in our internal control over financial reporting that occurred during the quarter ended September 30, 2023, that have materially affected, or are reasonably likely to materially affect, our internal control over financial reporting.
PART II. OTHER INFORMATION
Item 1. Legal Proceedings
From time to time, we are party to various lawsuits, claims and other legal proceedings that arise in the ordinary course of our business. Excluding ordinary routine litigation incidental to our business, we are not currently a party to any legal proceedings that we believe would reasonably be expected to have a materially adverse effect on our business, financial condition or results of operations. See "Legal Proceedings" in Note 16 to our consolidated financial statements in Part I, Item 1 of this Report.
Item 1A. Risk Factors
We are not aware of any material changes to the risk factors disclosed in Part I, “Item 1A. Risk Factors” in our 2022 Annual Report on Form 10-K.
Item 2. Unregistered Sales of Equity Securities and Use of Proceeds
None.
Item 3. Defaults Upon Senior Securities
None.
Item 4. Mine Safety Disclosures
Not applicable.
Item 5. Other Information
(a) None.
(b) None.
(c) During the three months ended September 30, 2023, no director or officer of the Company adopted or terminated a “Rule 10b5-1 trading arrangement” or “non-Rule 10b5-1 trading arrangement,” as each such term is defined in Item 408(a) of Regulation S-K.
Item 6. Exhibits
| | | | | | | | | | | |
| Exhibit Number | | Description | Footnote |
| | | |
| 3.1 | | | (1) |
| 3.2 | | | (2) |
| 3.3 | | | (3) |
| 3.4 | | | (4) |
| 31.1 | | | |
| 31.2 | | | |
32.1 | | | (5) |
32.2 | | | (5) |
101.INS | | Inline XBRL Instance Document - the instance document does not appear in the interactive data file because its XBRL tags are embedded within the inline XBRL document. | |
101.SCH | | Inline XBRL Taxonomy Extension Schema Document. | |
101.CAL | | Inline XBRL Taxonomy Extension Calculation Linkbase Document. | |
101.DEF | | Inline XBRL Taxonomy Extension Definition Linkbase Document. | |
101.LAB | | Inline XBRL Taxonomy Extension Label Linkbase Document. | |
101.PRE | | Inline XBRL Taxonomy Extension Presentation Linkbase Document. | |
| 104 | | Cover Page Interactive Data File (embedded within the Inline XBRL document) | |
________________________________________________
(1) Filed with Amendment No. 6 to Form S-11 on October 19, 2006 and incorporated herein by this reference. (File number 333-135082).
(2) Filed with Form 8-K on September 6, 2013 and incorporated herein by this reference. (File number 001-33106).
(3) Filed with Form 8-K on October 30, 2006 and incorporated herein by this reference. (File number 001-33106).
(4) Filed with Form 8-K on April 9, 2018 and incorporated herein by this reference. (File number 001-33106).
(5) In accordance with SEC Release No. 33-8212, these exhibits are being furnished, and are not being filed as part of this Report on Form 10-Q or as a separate disclosure document, and are not being incorporated by reference into any Securities Act registration statement.
Pursuant to the requirements of the Exchange Act, the registrant has duly caused this report to be signed on its behalf by the undersigned, thereunto duly authorized.
| | | | | | | | | | | | | | |
| | DOUGLAS EMMETT, INC. |
| | | |
| | | |
| Date: | November 3, 2023 | By: | /s/ JORDAN L. KAPLAN |
| | | Jordan L. Kaplan |
| | | President and CEO |
| | | |
| | | |
| Date: | November 3, 2023 | By: | /s/ PETER D. SEYMOUR |
| | | Peter D. Seymour |
| | | CFO |
EXHIBIT 31.1
CEO Certification
Pursuant to Section 302 of the Sarbanes-Oxley Act of 2002
I, Jordan L. Kaplan, certify that:
1.I have reviewed this Quarterly Report on Form 10-Q of Douglas Emmett, Inc.;
2.Based on my knowledge, this report does not contain any untrue statement of a material fact or omit to state a
material fact necessary to make the statements made, in light of the circumstances under which such statements were made, not misleading with respect to the period covered by this report;
3. Based on my knowledge, the financial statements, and other financial information included in this report fairly present in all material respects the financial condition, results of operations and cash flows of the registrant as of, and for, the periods presented in this report;
4. The registrant’s other certifying officer and I are responsible for establishing and maintaining disclosure controls and procedures (as defined in Exchange Act Rules 13a-15(e) and 15d-15(e)) and internal control over financial reporting (as defined in Exchange Act Rules 13a-15(f) and 15d-15(f)) for the registrant and have:
a.Designed such disclosure controls and procedures, or caused such disclosure controls and procedures to be designed under our supervision, to ensure that material information relating to the registrant, including its consolidated subsidiaries, is made known to us by others within those entities, particularly during the period in which this report is being prepared;
b.Designed such internal control over financial reporting, or caused such internal control over financial reporting to be designed under our supervision, to provide reasonable assurance regarding the reliability of financial reporting and the preparation of financial statements for external purposes in accordance with generally accepted accounting principles;
c.Evaluated the effectiveness of the registrant’s disclosure controls and procedures and presented in this report our conclusions about the effectiveness of the disclosure controls and procedures, as of the end of the period covered by this report based on such evaluation; and
d.Disclosed in this report any change in the registrant’s internal control over financial reporting that occurred during the registrant’s most recent fiscal quarter (the registrant’s fourth fiscal quarter in the case of an annual report) that has materially affected, or is reasonably likely to materially affect, the registrant’s internal control over financial reporting; and
5. The registrant’s other certifying officer and I have disclosed, based on our most recent evaluation of internal control over financial reporting, to the registrant’s auditors and the audit committee of the registrant’s board of directors (or persons performing the equivalent functions):
a. All significant deficiencies and material weaknesses in the design or operation of internal control over financial reporting which are reasonably likely to adversely affect the registrant’s ability to record, process, summarize and report financial information; and
b. Any fraud, whether or not material, that involves management or other employees who have a significant role in the registrant’s internal control over financial reporting.
| | | | | | | | | | | |
| Date: | November 3, 2023 | By: | /s/ JORDAN L. KAPLAN |
| | | Jordan L. Kaplan |
| | | President and CEO |
EXHIBIT 31.2
CFO Certification
Pursuant to Section 302 of the Sarbanes-Oxley Act of 2002
I, Peter D. Seymour, certify that:
1.I have reviewed this Quarterly Report on Form 10-Q of Douglas Emmett, Inc.;
2.Based on my knowledge, this report does not contain any untrue statement of a material fact or omit to state a material fact necessary to make the statements made, in light of the circumstances under which such statements were made, not misleading with respect to the period covered by this report;
3. Based on my knowledge, the financial statements, and other financial information included in this report, fairly present in all material respects the financial condition, results of operations and cash flows of the registrant as of, and for, the periods presented in this report;
4. The registrant’s other certifying officer and I are responsible for establishing and maintaining disclosure controls and procedures (as defined in Exchange Act Rules 13a-15(e) and 15d-15(e)) and internal control over financial reporting (as defined in Exchange Act Rules 13a-15(f) and 15d-15(f)) for the registrant and have:
a. Designed such disclosure controls and procedures, or caused such disclosure controls and procedures to be designed under our supervision, to ensure that material information relating to the registrant, including its consolidated subsidiaries, is made known to us by others within those entities, particularly during the period in which this report is being prepared;
b. Designed such internal control over financial reporting, or caused such internal control over financial reporting to be designed under our supervision, to provide reasonable assurance regarding the reliability of financial reporting and the preparation of financial statements for external purposes in accordance with generally accepted accounting principles;
c. Evaluated the effectiveness of the registrant’s disclosure controls and procedures and presented in this report our conclusions about the effectiveness of the disclosure controls and procedures, as of the end of the period covered by this report based on such evaluation; and
d. Disclosed in this report any change in the registrant’s internal control over financial reporting that occurred during the registrant’s most recent fiscal quarter (the registrant’s fourth fiscal quarter in the case of an annual report) that has materially affected, or is reasonably likely to materially affect, the registrant’s internal control over financial reporting; and
5. The registrant’s other certifying officer and I have disclosed, based on our most recent evaluation of internal control over financial reporting, to the registrant’s auditors and the audit committee of the registrant’s board of directors (or persons performing the equivalent functions):
a. All significant deficiencies and material weaknesses in the design or operation of internal control over financial reporting which are reasonably likely to adversely affect the registrant’s ability to record, process, summarize and report financial information; and
b. Any fraud, whether or not material, that involves management or other employees who have a significant role in the registrant’s internal control over financial reporting.
| | | | | | | | | | | |
| Date: | November 3, 2023 | By: | /s/ PETER D. SEYMOUR |
| | | Peter D. Seymour |
| | | CFO |
EXHIBIT 32.1
OFFICERS’ CERTIFICATIONS
CEO Certification
Pursuant to 18 U.S.C. § 1350, as created by Section 906 of the Sarbanes-Oxley Act of 2002, the undersigned officer of Douglas Emmett, Inc. (the “Company”), hereby certifies, to such officer’s knowledge, that:
(i)the accompanying quarterly report on Form 10-Q of the Company for the period ended September 30, 2023 (the “Report”) fully complies with the requirements of Section 13(a) or Section 15(d), as applicable, of the Securities Exchange Act of 1934, as amended; and
(ii)the information contained in the Report fairly presents, in all material respects, the financial condition and results of operations of the Company.
| | | | | | | | | | | |
| Date: | November 3, 2023 | By: | /s/ JORDAN L. KAPLAN |
| | | Jordan L. Kaplan |
| | | President and CEO |
A signed original of this written statement required by Section 906 has been provided to the Company and will be retained by the Company and furnished to the Securities and Exchange Commission or its staff upon request.
The foregoing certification is being furnished solely to accompany the Report pursuant to 18 U.S.C. §1350, and is not being filed for purposes of Section 18 of the Securities Exchange Act of 1934, as amended, and is not to be incorporated by reference into any filing of the Company, whether made before or after the date hereof, regardless of any general incorporation language in such filing.
EXHIBIT 32.2
OFFICERS’ CERTIFICATIONS
CFO Certification
Pursuant to 18 U.S.C. § 1350, as created by Section 906 of the Sarbanes-Oxley Act of 2002, the undersigned officer of Douglas Emmett, Inc. (the “Company”), hereby certifies, to such officer’s knowledge, that:
(i)the accompanying quarterly report on Form 10-Q of the Company for the period ended September 30, 2023 (the “Report”) fully complies with the requirements of Section 13(a) or Section 15(d), as applicable, of the Securities Exchange Act of 1934, as amended; and
(ii)the information contained in the Report fairly presents, in all material respects, the financial condition and results of operations of the Company.
| | | | | | | | | | | |
| Date: | November 3, 2023 | By: | /s/ PETER D. SEYMOUR |
| | | Peter D. Seymour |
| | | CFO |
A signed original of this written statement required by Section 906 has been provided to the Company and will be retained by the Company and furnished to the Securities and Exchange Commission or its staff upon request.
The foregoing certification is being furnished solely to accompany the Report pursuant to 18 U.S.C. §1350, and is not being filed for purposes of Section 18 of the Securities Exchange Act of 1934, as amended, and is not to be incorporated by reference into any filing of the Company, whether made before or after the date hereof, regardless of any general incorporation language in such filing.
v3.23.3
Cover - shares
|
9 Months Ended |
|
Sep. 30, 2023 |
Oct. 27, 2023 |
| Cover [Abstract] |
|
|
| Document Type |
10-Q
|
|
| Document Quarterly Report |
true
|
|
| Document Period End Date |
Sep. 30, 2023
|
|
| Document Transition Report |
false
|
|
| Entity File Number |
001-33106
|
|
| Entity Registrant Name |
Douglas Emmett, Inc.
|
|
| Entity Incorporation, State or Country Code |
MD
|
|
| Entity Tax Identification Number |
20-3073047
|
|
| Entity Address, Address Line One |
1299 Ocean Avenue
|
|
| Entity Address, Address Line Two |
Suite 1000
|
|
| Entity Address, City or Town |
Santa Monica
|
|
| Entity Address, State or Province |
CA
|
|
| Entity Address, Postal Zip Code |
90401
|
|
| City Area Code |
310
|
|
| Local Phone Number |
255-7700
|
|
| Title of 12(b) Security |
Common Stock, $0.01 par value per share
|
|
| Trading Symbol |
DEI
|
|
| Security Exchange Name |
NYSE
|
|
| Entity Current Reporting Status |
Yes
|
|
| Entity Interactive Data Current |
Yes
|
|
| Entity Filer Category |
Large Accelerated Filer
|
|
| Entity Small Business |
false
|
|
| Entity Emerging Growth Company |
false
|
|
| Entity Shell Company |
false
|
|
| Common Shares Outstanding |
|
166,737,730
|
| Entity Central Index Key |
0001364250
|
|
| Current Fiscal Year End Date |
--12-31
|
|
| Document Fiscal Year Focus |
2023
|
|
| Document Fiscal Period Focus |
Q3
|
|
| Amendment Flag |
false
|
|
| X |
- DefinitionBoolean flag that is true when the XBRL content amends previously-filed or accepted submission.
| Name: |
dei_AmendmentFlag |
| Namespace Prefix: |
dei_ |
| Data Type: |
xbrli:booleanItemType |
| Balance Type: |
na |
| Period Type: |
duration |
|
| X |
- DefinitionEnd date of current fiscal year in the format --MM-DD.
| Name: |
dei_CurrentFiscalYearEndDate |
| Namespace Prefix: |
dei_ |
| Data Type: |
xbrli:gMonthDayItemType |
| Balance Type: |
na |
| Period Type: |
duration |
|
| X |
- DefinitionFiscal period values are FY, Q1, Q2, and Q3. 1st, 2nd and 3rd quarter 10-Q or 10-QT statements have value Q1, Q2, and Q3 respectively, with 10-K, 10-KT or other fiscal year statements having FY.
| Name: |
dei_DocumentFiscalPeriodFocus |
| Namespace Prefix: |
dei_ |
| Data Type: |
dei:fiscalPeriodItemType |
| Balance Type: |
na |
| Period Type: |
duration |
|
| X |
- DefinitionThis is focus fiscal year of the document report in YYYY format. For a 2006 annual report, which may also provide financial information from prior periods, fiscal 2006 should be given as the fiscal year focus. Example: 2006.
| Name: |
dei_DocumentFiscalYearFocus |
| Namespace Prefix: |
dei_ |
| Data Type: |
xbrli:gYearItemType |
| Balance Type: |
na |
| Period Type: |
duration |
|
| X |
- DefinitionFor the EDGAR submission types of Form 8-K: the date of the report, the date of the earliest event reported; for the EDGAR submission types of Form N-1A: the filing date; for all other submission types: the end of the reporting or transition period. The format of the date is YYYY-MM-DD.
| Name: |
dei_DocumentPeriodEndDate |
| Namespace Prefix: |
dei_ |
| Data Type: |
xbrli:dateItemType |
| Balance Type: |
na |
| Period Type: |
duration |
|
| X |
- DefinitionBoolean flag that is true only for a form used as an quarterly report. Reference 1: http://www.xbrl.org/2003/role/presentationRef
-Publisher SEC
-Name Form 10-Q
-Number 240
-Section 308
-Subsection a
| Name: |
dei_DocumentQuarterlyReport |
| Namespace Prefix: |
dei_ |
| Data Type: |
xbrli:booleanItemType |
| Balance Type: |
na |
| Period Type: |
duration |
|
| X |
- DefinitionBoolean flag that is true only for a form used as a transition report. Reference 1: http://www.xbrl.org/2003/role/presentationRef
-Publisher SEC
-Name Forms 10-K, 10-Q, 20-F
-Number 240
-Section 13
-Subsection a-1
| Name: |
dei_DocumentTransitionReport |
| Namespace Prefix: |
dei_ |
| Data Type: |
xbrli:booleanItemType |
| Balance Type: |
na |
| Period Type: |
duration |
|
| X |
- DefinitionThe type of document being provided (such as 10-K, 10-Q, 485BPOS, etc). The document type is limited to the same value as the supporting SEC submission type, or the word 'Other'.
| Name: |
dei_DocumentType |
| Namespace Prefix: |
dei_ |
| Data Type: |
dei:submissionTypeItemType |
| Balance Type: |
na |
| Period Type: |
duration |
|
| X |
- DefinitionAddress Line 1 such as Attn, Building Name, Street Name
| Name: |
dei_EntityAddressAddressLine1 |
| Namespace Prefix: |
dei_ |
| Data Type: |
xbrli:normalizedStringItemType |
| Balance Type: |
na |
| Period Type: |
duration |
|
| X |
- DefinitionAddress Line 2 such as Street or Suite number
| Name: |
dei_EntityAddressAddressLine2 |
| Namespace Prefix: |
dei_ |
| Data Type: |
xbrli:normalizedStringItemType |
| Balance Type: |
na |
| Period Type: |
duration |
|
| X |
- Definition
+ References
+ Details
| Name: |
dei_EntityAddressCityOrTown |
| Namespace Prefix: |
dei_ |
| Data Type: |
xbrli:normalizedStringItemType |
| Balance Type: |
na |
| Period Type: |
duration |
|
| X |
- DefinitionCode for the postal or zip code
| Name: |
dei_EntityAddressPostalZipCode |
| Namespace Prefix: |
dei_ |
| Data Type: |
xbrli:normalizedStringItemType |
| Balance Type: |
na |
| Period Type: |
duration |
|
| X |
- DefinitionName of the state or province.
| Name: |
dei_EntityAddressStateOrProvince |
| Namespace Prefix: |
dei_ |
| Data Type: |
dei:stateOrProvinceItemType |
| Balance Type: |
na |
| Period Type: |
duration |
|
| X |
- DefinitionA unique 10-digit SEC-issued value to identify entities that have filed disclosures with the SEC. It is commonly abbreviated as CIK. Reference 1: http://www.xbrl.org/2003/role/presentationRef
-Publisher SEC
-Name Exchange Act
-Number 240
-Section 12
-Subsection b-2
| Name: |
dei_EntityCentralIndexKey |
| Namespace Prefix: |
dei_ |
| Data Type: |
dei:centralIndexKeyItemType |
| Balance Type: |
na |
| Period Type: |
duration |
|
| X |
- DefinitionIndicate number of shares or other units outstanding of each of registrant's classes of capital or common stock or other ownership interests, if and as stated on cover of related periodic report. Where multiple classes or units exist define each class/interest by adding class of stock items such as Common Class A [Member], Common Class B [Member] or Partnership Interest [Member] onto the Instrument [Domain] of the Entity Listings, Instrument.
| Name: |
dei_EntityCommonStockSharesOutstanding |
| Namespace Prefix: |
dei_ |
| Data Type: |
xbrli:sharesItemType |
| Balance Type: |
na |
| Period Type: |
instant |
|
| X |
- DefinitionIndicate 'Yes' or 'No' whether registrants (1) have filed all reports required to be filed by Section 13 or 15(d) of the Securities Exchange Act of 1934 during the preceding 12 months (or for such shorter period that registrants were required to file such reports), and (2) have been subject to such filing requirements for the past 90 days. This information should be based on the registrant's current or most recent filing containing the related disclosure.
| Name: |
dei_EntityCurrentReportingStatus |
| Namespace Prefix: |
dei_ |
| Data Type: |
dei:yesNoItemType |
| Balance Type: |
na |
| Period Type: |
duration |
|
| X |
- DefinitionIndicate if registrant meets the emerging growth company criteria. Reference 1: http://www.xbrl.org/2003/role/presentationRef
-Publisher SEC
-Name Exchange Act
-Number 240
-Section 12
-Subsection b-2
| Name: |
dei_EntityEmergingGrowthCompany |
| Namespace Prefix: |
dei_ |
| Data Type: |
xbrli:booleanItemType |
| Balance Type: |
na |
| Period Type: |
duration |
|
| X |
- DefinitionCommission file number. The field allows up to 17 characters. The prefix may contain 1-3 digits, the sequence number may contain 1-8 digits, the optional suffix may contain 1-4 characters, and the fields are separated with a hyphen.
| Name: |
dei_EntityFileNumber |
| Namespace Prefix: |
dei_ |
| Data Type: |
dei:fileNumberItemType |
| Balance Type: |
na |
| Period Type: |
duration |
|
| X |
- DefinitionIndicate whether the registrant is one of the following: Large Accelerated Filer, Accelerated Filer, Non-accelerated Filer. Definitions of these categories are stated in Rule 12b-2 of the Exchange Act. This information should be based on the registrant's current or most recent filing containing the related disclosure. Reference 1: http://www.xbrl.org/2003/role/presentationRef
-Publisher SEC
-Name Exchange Act
-Number 240
-Section 12
-Subsection b-2
| Name: |
dei_EntityFilerCategory |
| Namespace Prefix: |
dei_ |
| Data Type: |
dei:filerCategoryItemType |
| Balance Type: |
na |
| Period Type: |
duration |
|
| X |
- DefinitionTwo-character EDGAR code representing the state or country of incorporation.
| Name: |
dei_EntityIncorporationStateCountryCode |
| Namespace Prefix: |
dei_ |
| Data Type: |
dei:edgarStateCountryItemType |
| Balance Type: |
na |
| Period Type: |
duration |
|
| X |
- DefinitionBoolean flag that is true when the registrant has submitted electronically every Interactive Data File required to be submitted pursuant to Rule 405 of Regulation S-T during the preceding 12 months (or for such shorter period that the registrant was required to submit such files). Reference 1: http://www.xbrl.org/2003/role/presentationRef
-Publisher SEC
-Name Regulation S-T
-Number 232
-Section 405
| Name: |
dei_EntityInteractiveDataCurrent |
| Namespace Prefix: |
dei_ |
| Data Type: |
dei:yesNoItemType |
| Balance Type: |
na |
| Period Type: |
duration |
|
| X |
- DefinitionThe exact name of the entity filing the report as specified in its charter, which is required by forms filed with the SEC. Reference 1: http://www.xbrl.org/2003/role/presentationRef
-Publisher SEC
-Name Exchange Act
-Number 240
-Section 12
-Subsection b-2
| Name: |
dei_EntityRegistrantName |
| Namespace Prefix: |
dei_ |
| Data Type: |
xbrli:normalizedStringItemType |
| Balance Type: |
na |
| Period Type: |
duration |
|
| X |
- DefinitionBoolean flag that is true when the registrant is a shell company as defined in Rule 12b-2 of the Exchange Act. Reference 1: http://www.xbrl.org/2003/role/presentationRef
-Publisher SEC
-Name Exchange Act
-Number 240
-Section 12
-Subsection b-2
| Name: |
dei_EntityShellCompany |
| Namespace Prefix: |
dei_ |
| Data Type: |
xbrli:booleanItemType |
| Balance Type: |
na |
| Period Type: |
duration |
|
| X |
- DefinitionIndicates that the company is a Smaller Reporting Company (SRC). Reference 1: http://www.xbrl.org/2003/role/presentationRef
-Publisher SEC
-Name Exchange Act
-Number 240
-Section 12
-Subsection b-2
| Name: |
dei_EntitySmallBusiness |
| Namespace Prefix: |
dei_ |
| Data Type: |
xbrli:booleanItemType |
| Balance Type: |
na |
| Period Type: |
duration |
|
| X |
- DefinitionThe Tax Identification Number (TIN), also known as an Employer Identification Number (EIN), is a unique 9-digit value assigned by the IRS. Reference 1: http://www.xbrl.org/2003/role/presentationRef
-Publisher SEC
-Name Exchange Act
-Number 240
-Section 12
-Subsection b-2
| Name: |
dei_EntityTaxIdentificationNumber |
| Namespace Prefix: |
dei_ |
| Data Type: |
dei:employerIdItemType |
| Balance Type: |
na |
| Period Type: |
duration |
|
| X |
- DefinitionLocal phone number for entity.
| Name: |
dei_LocalPhoneNumber |
| Namespace Prefix: |
dei_ |
| Data Type: |
xbrli:normalizedStringItemType |
| Balance Type: |
na |
| Period Type: |
duration |
|
| X |
- DefinitionTitle of a 12(b) registered security. Reference 1: http://www.xbrl.org/2003/role/presentationRef
-Publisher SEC
-Name Exchange Act
-Number 240
-Section 12
-Subsection b
| Name: |
dei_Security12bTitle |
| Namespace Prefix: |
dei_ |
| Data Type: |
dei:securityTitleItemType |
| Balance Type: |
na |
| Period Type: |
duration |
|
| X |
- DefinitionName of the Exchange on which a security is registered. Reference 1: http://www.xbrl.org/2003/role/presentationRef
-Publisher SEC
-Name Exchange Act
-Number 240
-Section 12
-Subsection d1-1
| Name: |
dei_SecurityExchangeName |
| Namespace Prefix: |
dei_ |
| Data Type: |
dei:edgarExchangeCodeItemType |
| Balance Type: |
na |
| Period Type: |
duration |
|
| X |
- DefinitionTrading symbol of an instrument as listed on an exchange.
| Name: |
dei_TradingSymbol |
| Namespace Prefix: |
dei_ |
| Data Type: |
dei:tradingSymbolItemType |
| Balance Type: |
na |
| Period Type: |
duration |
|
v3.23.3
Consolidated Balance Sheets - USD ($)
$ in Thousands |
Sep. 30, 2023 |
Dec. 31, 2022 |
| Assets |
|
|
| Investment in real estate, gross |
$ 12,385,477
|
$ 12,292,973
|
| Less: accumulated depreciation and amortization |
(3,558,336)
|
(3,299,365)
|
| Investment in real estate, net |
8,827,141
|
8,993,608
|
| Ground lease right-of-use asset |
7,449
|
7,455
|
| Cash and cash equivalents |
526,230
|
268,837
|
| Tenant receivables |
8,555
|
6,879
|
| Deferred rent receivables |
116,987
|
114,980
|
| Acquired lease intangible assets, net |
3,103
|
3,536
|
| Interest rate contract assets |
248,232
|
270,234
|
| Investment in unconsolidated Fund |
47,988
|
47,976
|
| Other assets |
60,394
|
33,941
|
| Total Assets |
9,846,079
|
9,747,446
|
| Liabilities |
|
|
| Secured notes payable, net |
5,541,846
|
5,191,893
|
| Ground lease liability |
10,839
|
10,848
|
| Interest payable, accounts payable and deferred revenue |
169,069
|
140,925
|
| Security deposits |
62,403
|
61,429
|
| Acquired lease intangible liabilities, net |
22,775
|
31,364
|
| Interest rate contract liabilities |
0
|
1,790
|
| Dividends payable |
31,691
|
33,414
|
| Total Liabilities |
5,838,623
|
5,471,663
|
| Douglas Emmett, Inc. stockholders' equity: |
|
|
| Common Stock, $0.01 par value, 750,000,000 authorized, 166,737,730 and 175,809,682 outstanding at September 30, 2023 and December 31, 2022, respectively |
1,667
|
1,758
|
| Additional paid-in capital |
3,384,285
|
3,493,307
|
| Accumulated other comprehensive income |
169,760
|
187,063
|
| Accumulated deficit |
(1,218,457)
|
(1,119,714)
|
| Total Douglas Emmett, Inc. stockholders' equity |
2,337,255
|
2,562,414
|
| Noncontrolling interests |
1,670,201
|
1,713,369
|
| Total Equity |
4,007,456
|
4,275,783
|
| Total Liabilities and Equity |
$ 9,846,079
|
$ 9,747,446
|
| X |
- DefinitionSum of the carrying values as of the balance sheet date of obligations incurred through that date, including liabilities incurred and payable to vendors for goods and services received, taxes, interest, rent and utilities, compensation costs, payroll taxes and fringe benefits (other than pension and postretirement obligations), contractual rights and obligations, and statutory obligations. Reference 1: http://fasb.org/us-gaap/role/ref/legacyRef
-Name Accounting Standards Codification
-Topic 942
-SubTopic 210
-Section S99
-Paragraph 1
-Subparagraph (SX 210.9-03.15(1),(5))
-Publisher FASB
-URI https://asc.fasb.org//1943274/2147479853/942-210-S99-1
| Name: |
us-gaap_AccountsPayableAndAccruedLiabilitiesCurrentAndNoncurrent |
| Namespace Prefix: |
us-gaap_ |
| Data Type: |
xbrli:monetaryItemType |
| Balance Type: |
credit |
| Period Type: |
instant |
|
| X |
- DefinitionAmount, after allowance for credit loss, of right to consideration from customer for product sold and service rendered in normal course of business. Reference 1: http://www.xbrl.org/2003/role/exampleRef
-Topic 946
-SubTopic 310
-Name Accounting Standards Codification
-Section 45
-Paragraph 1
-Subparagraph (d)
-Publisher FASB
-URI https://asc.fasb.org//1943274/2147480833/946-310-45-1
Reference 2: http://www.xbrl.org/2009/role/commonPracticeRef
-Topic 944
-SubTopic 210
-Name Accounting Standards Codification
-Section S99
-Paragraph 1
-Subparagraph (SX 210.7-03(a)(5))
-Publisher FASB
-URI https://asc.fasb.org//1943274/2147479440/944-210-S99-1
Reference 3: http://www.xbrl.org/2003/role/disclosureRef
-Topic 946
-SubTopic 210
-Name Accounting Standards Codification
-Section S99
-Paragraph 1
-Subparagraph (SX 210.6-04(5)(b))
-Publisher FASB
-URI https://asc.fasb.org//1943274/2147479617/946-210-S99-1
Reference 4: http://www.xbrl.org/2003/role/disclosureRef
-Topic 954
-SubTopic 310
-Name Accounting Standards Codification
-Section 45
-Paragraph 1
-Publisher FASB
-URI https://asc.fasb.org//1943274/2147481058/954-310-45-1
| Name: |
us-gaap_AccountsReceivableNet |
| Namespace Prefix: |
us-gaap_ |
| Data Type: |
xbrli:monetaryItemType |
| Balance Type: |
debit |
| Period Type: |
instant |
|
| X |
- DefinitionAmount, after tax, of accumulated increase (decrease) in equity from transaction and other event and circumstance from nonowner source. Reference 1: http://fasb.org/us-gaap/role/ref/legacyRef
-Name Accounting Standards Codification
-Topic 220
-SubTopic 10
-Section 45
-Paragraph 14A
-Publisher FASB
-URI https://asc.fasb.org//1943274/2147482790/220-10-45-14A
Reference 2: http://fasb.org/us-gaap/role/ref/legacyRef
-Topic 220
-SubTopic 10
-Name Accounting Standards Codification
-Section 45
-Paragraph 11
-Publisher FASB
-URI https://asc.fasb.org//1943274/2147482790/220-10-45-11
Reference 3: http://www.xbrl.org/2003/role/disclosureRef
-Topic 944
-SubTopic 40
-Name Accounting Standards Codification
-Section 65
-Paragraph 2
-Subparagraph (g)(2)(ii)
-Publisher FASB
-URI https://asc.fasb.org//1943274/2147480016/944-40-65-2
Reference 4: http://www.xbrl.org/2003/role/disclosureRef
-Topic 944
-SubTopic 40
-Name Accounting Standards Codification
-Section 65
-Paragraph 2
-Subparagraph (h)(2)
-Publisher FASB
-URI https://asc.fasb.org//1943274/2147480016/944-40-65-2
Reference 5: http://www.xbrl.org/2003/role/disclosureRef
-Topic 210
-SubTopic 10
-Name Accounting Standards Codification
-Section S99
-Paragraph 1
-Subparagraph (SX 210.5-02(30)(a)(4))
-Publisher FASB
-URI https://asc.fasb.org//1943274/2147480566/210-10-S99-1
Reference 6: http://www.xbrl.org/2003/role/disclosureRef
-Topic 944
-SubTopic 210
-Name Accounting Standards Codification
-Section S99
-Paragraph 1
-Subparagraph (SX 210.7-03(a)(23)(a)(3))
-Publisher FASB
-URI https://asc.fasb.org//1943274/2147479440/944-210-S99-1
Reference 7: http://fasb.org/us-gaap/role/ref/legacyRef
-Name Accounting Standards Codification
-Topic 220
-SubTopic 10
-Section 45
-Paragraph 14
-Publisher FASB
-URI https://asc.fasb.org//1943274/2147482790/220-10-45-14
| Name: |
us-gaap_AccumulatedOtherComprehensiveIncomeLossNetOfTax |
| Namespace Prefix: |
us-gaap_ |
| Data Type: |
xbrli:monetaryItemType |
| Balance Type: |
credit |
| Period Type: |
instant |
|
| X |
- DefinitionValue received from shareholders in common stock-related transactions that are in excess of par value or stated value and amounts received from other stock-related transactions. Includes only common stock transactions (excludes preferred stock transactions). May be called contributed capital, capital in excess of par, capital surplus, or paid-in capital. Reference 1: http://fasb.org/us-gaap/role/ref/legacyRef
-Topic 210
-SubTopic 10
-Name Accounting Standards Codification
-Section S99
-Paragraph 1
-Subparagraph (SX 210.5-02(30)(a)(1))
-Publisher FASB
-URI https://asc.fasb.org//1943274/2147480566/210-10-S99-1
| Name: |
us-gaap_AdditionalPaidInCapitalCommonStock |
| Namespace Prefix: |
us-gaap_ |
| Data Type: |
xbrli:monetaryItemType |
| Balance Type: |
credit |
| Period Type: |
instant |
|
| X |
- DefinitionSum of the carrying amounts as of the balance sheet date of all assets that are recognized. Assets are probable future economic benefits obtained or controlled by an entity as a result of past transactions or events. Reference 1: http://www.xbrl.org/2003/role/disclosureRef
-Topic 810
-SubTopic 10
-Name Accounting Standards Codification
-Section 50
-Paragraph 3
-Subparagraph (bb)
-Publisher FASB
-URI https://asc.fasb.org//1943274/2147481203/810-10-50-3
Reference 2: http://www.xbrl.org/2003/role/disclosureRef
-Topic 810
-SubTopic 10
-Name Accounting Standards Codification
-Section 45
-Paragraph 25
-Subparagraph (a)
-Publisher FASB
-URI https://asc.fasb.org//1943274/2147481231/810-10-45-25
Reference 3: http://www.xbrl.org/2003/role/disclosureRef
-Topic 235
-SubTopic 10
-Name Accounting Standards Codification
-Section S99
-Paragraph 1
-Subparagraph (SX 210.4-08(g)(1)(ii))
-Publisher FASB
-URI https://asc.fasb.org//1943274/2147480678/235-10-S99-1
Reference 4: http://www.xbrl.org/2003/role/disclosureRef
-Topic 323
-SubTopic 10
-Name Accounting Standards Codification
-Section 50
-Paragraph 3
-Subparagraph (c)
-Publisher FASB
-URI https://asc.fasb.org//1943274/2147481687/323-10-50-3
Reference 5: http://www.xbrl.org/2003/role/disclosureRef
-Topic 825
-SubTopic 10
-Name Accounting Standards Codification
-Section 50
-Paragraph 28
-Subparagraph (f)
-Publisher FASB
-URI https://asc.fasb.org//1943274/2147482907/825-10-50-28
Reference 6: http://www.xbrl.org/2003/role/exampleRef
-Topic 852
-SubTopic 10
-Name Accounting Standards Codification
-Section 55
-Paragraph 10
-Publisher FASB
-URI https://asc.fasb.org//1943274/2147481372/852-10-55-10
Reference 7: http://www.xbrl.org/2003/role/exampleRef
-Topic 946
-SubTopic 830
-Name Accounting Standards Codification
-Section 55
-Paragraph 12
-Publisher FASB
-URI https://asc.fasb.org//1943274/2147480167/946-830-55-12
Reference 8: http://www.xbrl.org/2003/role/disclosureRef
-Topic 944
-SubTopic 210
-Name Accounting Standards Codification
-Section S99
-Paragraph 1
-Subparagraph (SX 210.7-03(a)(12))
-Publisher FASB
-URI https://asc.fasb.org//1943274/2147479440/944-210-S99-1
Reference 9: http://www.xbrl.org/2003/role/disclosureRef
-Topic 280
-SubTopic 10
-Name Accounting Standards Codification
-Section 50
-Paragraph 22
-Publisher FASB
-URI https://asc.fasb.org//1943274/2147482810/280-10-50-22
Reference 10: http://www.xbrl.org/2003/role/disclosureRef
-Topic 946
-SubTopic 210
-Name Accounting Standards Codification
-Section S99
-Paragraph 1
-Subparagraph (SX 210.6-04(8))
-Publisher FASB
-URI https://asc.fasb.org//1943274/2147479617/946-210-S99-1
Reference 11: http://www.xbrl.org/2003/role/disclosureRef
-Topic 210
-SubTopic 10
-Name Accounting Standards Codification
-Section S99
-Paragraph 1
-Subparagraph (SX 210.5-02(18))
-Publisher FASB
-URI https://asc.fasb.org//1943274/2147480566/210-10-S99-1
Reference 12: http://www.xbrl.org/2003/role/disclosureRef
-Topic 470
-SubTopic 10
-Name Accounting Standards Codification
-Section S99
-Paragraph 1A
-Subparagraph (SX 210.13-01(a)(4)(i))
-Publisher FASB
-URI https://asc.fasb.org//1943274/2147480097/470-10-S99-1A
Reference 13: http://www.xbrl.org/2009/role/commonPracticeRef
-Topic 470
-SubTopic 10
-Name Accounting Standards Codification
-Section S99
-Paragraph 1A
-Subparagraph (SX 210.13-01(a)(4)(ii))
-Publisher FASB
-URI https://asc.fasb.org//1943274/2147480097/470-10-S99-1A
Reference 14: http://www.xbrl.org/2009/role/commonPracticeRef
-Topic 470
-SubTopic 10
-Name Accounting Standards Codification
-Section S99
-Paragraph 1A
-Subparagraph (SX 210.13-01(a)(4)(iii))
-Publisher FASB
-URI https://asc.fasb.org//1943274/2147480097/470-10-S99-1A
Reference 15: http://www.xbrl.org/2003/role/disclosureRef
-Topic 470
-SubTopic 10
-Name Accounting Standards Codification
-Section S99
-Paragraph 1A
-Subparagraph (SX 210.13-01(a)(4)(iii)(A))
-Publisher FASB
-URI https://asc.fasb.org//1943274/2147480097/470-10-S99-1A
Reference 16: http://www.xbrl.org/2003/role/disclosureRef
-Topic 470
-SubTopic 10
-Name Accounting Standards Codification
-Section S99
-Paragraph 1A
-Subparagraph (SX 210.13-01(a)(4)(iv))
-Publisher FASB
-URI https://asc.fasb.org//1943274/2147480097/470-10-S99-1A
Reference 17: http://www.xbrl.org/2003/role/disclosureRef
-Topic 470
-SubTopic 10
-Name Accounting Standards Codification
-Section S99
-Paragraph 1A
-Subparagraph (SX 210.13-01(a)(5))
-Publisher FASB
-URI https://asc.fasb.org//1943274/2147480097/470-10-S99-1A
Reference 18: http://www.xbrl.org/2003/role/disclosureRef
-Topic 470
-SubTopic 10
-Name Accounting Standards Codification
-Section S99
-Paragraph 1B
-Subparagraph (SX 210.13-02(a)(4)(i))
-Publisher FASB
-URI https://asc.fasb.org//1943274/2147480097/470-10-S99-1B
Reference 19: http://www.xbrl.org/2003/role/disclosureRef
-Topic 470
-SubTopic 10
-Name Accounting Standards Codification
-Section S99
-Paragraph 1B
-Subparagraph (SX 210.13-02(a)(4)(iii)(A))
-Publisher FASB
-URI https://asc.fasb.org//1943274/2147480097/470-10-S99-1B
Reference 20: http://www.xbrl.org/2003/role/disclosureRef
-Topic 470
-SubTopic 10
-Name Accounting Standards Codification
-Section S99
-Paragraph 1B
-Subparagraph (SX 210.13-02(a)(4)(iii)(B))
-Publisher FASB
-URI https://asc.fasb.org//1943274/2147480097/470-10-S99-1B
Reference 21: http://www.xbrl.org/2003/role/disclosureRef
-Topic 470
-SubTopic 10
-Name Accounting Standards Codification
-Section S99
-Paragraph 1B
-Subparagraph (SX 210.13-02(a)(4)(iv))
-Publisher FASB
-URI https://asc.fasb.org//1943274/2147480097/470-10-S99-1B
Reference 22: http://www.xbrl.org/2003/role/disclosureRef
-Topic 470
-SubTopic 10
-Name Accounting Standards Codification
-Section S99
-Paragraph 1B
-Subparagraph (SX 210.13-02(a)(5))
-Publisher FASB
-URI https://asc.fasb.org//1943274/2147480097/470-10-S99-1B
Reference 23: http://www.xbrl.org/2009/role/commonPracticeRef
-Topic 852
-SubTopic 10
-Name Accounting Standards Codification
-Section 50
-Paragraph 7
-Subparagraph (a)
-Publisher FASB
-URI https://asc.fasb.org//1943274/2147481404/852-10-50-7
Reference 24: http://www.xbrl.org/2003/role/disclosureRef
-Topic 280
-SubTopic 10
-Name Accounting Standards Codification
-Section 50
-Paragraph 30
-Subparagraph (c)
-Publisher FASB
-URI https://asc.fasb.org//1943274/2147482810/280-10-50-30
Reference 25: http://www.xbrl.org/2003/role/disclosureRef
-Topic 280
-SubTopic 10
-Name Accounting Standards Codification
-Section 50
-Paragraph 32
-Subparagraph (d)
-Publisher FASB
-URI https://asc.fasb.org//1943274/2147482810/280-10-50-32
Reference 26: http://fasb.org/us-gaap/role/ref/legacyRef
-Topic 942
-SubTopic 210
-Name Accounting Standards Codification
-Section S99
-Paragraph 1
-Subparagraph (SX 210.9-03(11))
-Publisher FASB
-URI https://asc.fasb.org//1943274/2147479853/942-210-S99-1
| Name: |
us-gaap_Assets |
| Namespace Prefix: |
us-gaap_ |
| Data Type: |
xbrli:monetaryItemType |
| Balance Type: |
debit |
| Period Type: |
instant |
|
| X |
- References
+ Details
| Name: |
us-gaap_AssetsAbstract |
| Namespace Prefix: |
us-gaap_ |
| Data Type: |
xbrli:stringItemType |
| Balance Type: |
na |
| Period Type: |
duration |
|
| X |
- DefinitionAmount of currency on hand as well as demand deposits with banks or financial institutions. Includes other kinds of accounts that have the general characteristics of demand deposits. Also includes short-term, highly liquid investments that are both readily convertible to known amounts of cash and so near their maturity that they present insignificant risk of changes in value because of changes in interest rates. Excludes cash and cash equivalents within disposal group and discontinued operation. Reference 1: http://www.xbrl.org/2003/role/disclosureRef
-Topic 210
-SubTopic 10
-Name Accounting Standards Codification
-Section S99
-Paragraph 1
-Subparagraph (SX 210.5-02(1))
-Publisher FASB
-URI https://asc.fasb.org//1943274/2147480566/210-10-S99-1
Reference 2: http://www.xbrl.org/2003/role/exampleRef
-Topic 210
-SubTopic 10
-Name Accounting Standards Codification
-Section 45
-Paragraph 1
-Subparagraph (a)
-Publisher FASB
-URI https://asc.fasb.org//1943274/2147483467/210-10-45-1
Reference 3: http://fasb.org/us-gaap/role/ref/legacyRef
-Name Accounting Standards Codification
-Topic 230
-SubTopic 10
-Section 45
-Paragraph 4
-Publisher FASB
-URI https://asc.fasb.org//1943274/2147482740/230-10-45-4
| Name: |
us-gaap_CashAndCashEquivalentsAtCarryingValue |
| Namespace Prefix: |
us-gaap_ |
| Data Type: |
xbrli:monetaryItemType |
| Balance Type: |
debit |
| Period Type: |
instant |
|
| X |
- DefinitionAggregate par or stated value of issued nonredeemable common stock (or common stock redeemable solely at the option of the issuer). This item includes treasury stock repurchased by the entity. Note: elements for number of nonredeemable common shares, par value and other disclosure concepts are in another section within stockholders' equity. Reference 1: http://www.xbrl.org/2003/role/exampleRef
-Topic 852
-SubTopic 10
-Name Accounting Standards Codification
-Section 55
-Paragraph 10
-Publisher FASB
-URI https://asc.fasb.org//1943274/2147481372/852-10-55-10
Reference 2: http://www.xbrl.org/2003/role/disclosureRef
-Topic 944
-SubTopic 210
-Name Accounting Standards Codification
-Section S99
-Paragraph 1
-Subparagraph (SX 210.7-03(a)(22))
-Publisher FASB
-URI https://asc.fasb.org//1943274/2147479440/944-210-S99-1
Reference 3: http://fasb.org/us-gaap/role/ref/legacyRef
-Topic 210
-SubTopic 10
-Name Accounting Standards Codification
-Section S99
-Paragraph 1
-Subparagraph (SX 210.5-02(29))
-Publisher FASB
-URI https://asc.fasb.org//1943274/2147480566/210-10-S99-1
| Name: |
us-gaap_CommonStockValue |
| Namespace Prefix: |
us-gaap_ |
| Data Type: |
xbrli:monetaryItemType |
| Balance Type: |
credit |
| Period Type: |
instant |
|
| X |
- DefinitionAmount of excess of rental income recognized over rental payment required by lease. Reference 1: http://fasb.org/us-gaap/role/ref/otherTransitionRef
-Topic 840
-SubTopic 20
-Name Accounting Standards Codification
-Section 35
-Paragraph 2
-Publisher FASB
-URI https://asc.fasb.org//1943274/2147481123/840-20-35-2
Reference 2: http://fasb.org/us-gaap/role/ref/otherTransitionRef
-Topic 840
-SubTopic 20
-Name Accounting Standards Codification
-Section 25
-Paragraph 1
-Publisher FASB
-URI https://asc.fasb.org//1943274/2147481178/840-20-25-1
Reference 3: http://www.xbrl.org/2009/role/commonPracticeRef
-Topic 842
-SubTopic 30
-Name Accounting Standards Codification
-Section 25
-Paragraph 11
-Subparagraph (a)
-Publisher FASB
-URI https://asc.fasb.org//1943274/2147479341/842-30-25-11
Reference 4: http://fasb.org/us-gaap/role/ref/otherTransitionRef
-Topic 840
-SubTopic 20
-Name Accounting Standards Codification
-Section 25
-Paragraph 2
-Publisher FASB
-URI https://asc.fasb.org//1943274/2147481178/840-20-25-2
| Name: |
us-gaap_DeferredRentReceivablesNet |
| Namespace Prefix: |
us-gaap_ |
| Data Type: |
xbrli:monetaryItemType |
| Balance Type: |
debit |
| Period Type: |
instant |
|
| X |
- DefinitionFair value, after the effects of master netting arrangements, of a financial asset or other contract with one or more underlyings, notional amount or payment provision or both, and the contract can be net settled by means outside the contract or delivery of an asset. Includes assets not subject to a master netting arrangement and not elected to be offset. Reference 1: http://www.xbrl.org/2003/role/disclosureRef
-Topic 946
-SubTopic 210
-Name Accounting Standards Codification
-Section 50
-Paragraph 12
-Publisher FASB
-URI https://asc.fasb.org//1943274/2147480524/946-210-50-12
Reference 2: http://www.xbrl.org/2003/role/disclosureRef
-Topic 946
-SubTopic 210
-Name Accounting Standards Codification
-Section 50
-Paragraph 6
-Subparagraph (e)
-Publisher FASB
-URI https://asc.fasb.org//1943274/2147480524/946-210-50-6
Reference 3: http://www.xbrl.org/2003/role/exampleRef
-Topic 946
-SubTopic 210
-Name Accounting Standards Codification
-Section 55
-Paragraph 1
-Publisher FASB
-URI https://asc.fasb.org//1943274/2147480493/946-210-55-1
Reference 4: http://www.xbrl.org/2003/role/disclosureRef
-Topic 946
-SubTopic 210
-Name Accounting Standards Codification
-Section 50
-Paragraph 6
-Subparagraph (a)(1)
-Publisher FASB
-URI https://asc.fasb.org//1943274/2147480524/946-210-50-6
Reference 5: http://www.xbrl.org/2003/role/disclosureRef
-Topic 946
-SubTopic 210
-Name Accounting Standards Codification
-Section 50
-Paragraph 6
-Subparagraph (a)(2)
-Publisher FASB
-URI https://asc.fasb.org//1943274/2147480524/946-210-50-6
Reference 6: http://www.xbrl.org/2003/role/disclosureRef
-Topic 946
-SubTopic 210
-Name Accounting Standards Codification
-Section 50
-Paragraph 6
-Subparagraph (a)(4)
-Publisher FASB
-URI https://asc.fasb.org//1943274/2147480524/946-210-50-6
Reference 7: http://www.xbrl.org/2003/role/disclosureRef
-Topic 946
-SubTopic 210
-Name Accounting Standards Codification
-Section 50
-Paragraph 1
-Subparagraph (a)(1)
-Publisher FASB
-URI https://asc.fasb.org//1943274/2147480524/946-210-50-1
Reference 8: http://www.xbrl.org/2003/role/disclosureRef
-Topic 946
-SubTopic 210
-Name Accounting Standards Codification
-Section 50
-Paragraph 1
-Subparagraph (b)(1)
-Publisher FASB
-URI https://asc.fasb.org//1943274/2147480524/946-210-50-1
Reference 9: http://www.xbrl.org/2003/role/disclosureRef
-Topic 946
-SubTopic 210
-Name Accounting Standards Codification
-Section 50
-Paragraph 1
-Subparagraph (b)(2)
-Publisher FASB
-URI https://asc.fasb.org//1943274/2147480524/946-210-50-1
Reference 10: http://www.xbrl.org/2003/role/disclosureRef
-Topic 946
-SubTopic 210
-Name Accounting Standards Codification
-Section 50
-Paragraph 1
-Subparagraph (c)(2)
-Publisher FASB
-URI https://asc.fasb.org//1943274/2147480524/946-210-50-1
Reference 11: http://www.xbrl.org/2003/role/disclosureRef
-Topic 946
-SubTopic 210
-Name Accounting Standards Codification
-Section 50
-Paragraph 6
-Subparagraph (f)
-Publisher FASB
-URI https://asc.fasb.org//1943274/2147480524/946-210-50-6
Reference 12: http://www.xbrl.org/2009/role/commonPracticeRef
-Topic 946
-SubTopic 210
-Name Accounting Standards Codification
-Section 50
-Paragraph 6
-Subparagraph (a)(3)
-Publisher FASB
-URI https://asc.fasb.org//1943274/2147480524/946-210-50-6
Reference 13: http://www.xbrl.org/2003/role/disclosureRef
-Topic 946
-SubTopic 210
-Name Accounting Standards Codification
-Section S99
-Paragraph 1
-Subparagraph (SX 210.6-04(3)(c))
-Publisher FASB
-URI https://asc.fasb.org//1943274/2147479617/946-210-S99-1
Reference 14: http://www.xbrl.org/2003/role/disclosureRef
-Topic 946
-SubTopic 320
-Name Accounting Standards Codification
-Section S99
-Paragraph 5C
-Subparagraph (SX 210.12-13C(Column H)(Footnote 7))
-Publisher FASB
-URI https://asc.fasb.org//1943274/2147480032/946-320-S99-5C
Reference 15: http://www.xbrl.org/2003/role/disclosureRef
-Topic 946
-SubTopic 210
-Name Accounting Standards Codification
-Section S99
-Paragraph 1
-Subparagraph (SX 210.6-04(3)(b))
-Publisher FASB
-URI https://asc.fasb.org//1943274/2147479617/946-210-S99-1
Reference 16: http://www.xbrl.org/2003/role/disclosureRef
-Topic 946
-SubTopic 320
-Name Accounting Standards Codification
-Section S99
-Paragraph 5
-Subparagraph (SX 210.12-13(Column A)(Footnote 3))
-Publisher FASB
-URI https://asc.fasb.org//1943274/2147480032/946-320-S99-5
Reference 17: http://www.xbrl.org/2003/role/disclosureRef
-Topic 946
-SubTopic 320
-Name Accounting Standards Codification
-Section S99
-Paragraph 5C
-Subparagraph (SX 210.12-13C(Column H))
-Publisher FASB
-URI https://asc.fasb.org//1943274/2147480032/946-320-S99-5C
Reference 18: http://www.xbrl.org/2003/role/disclosureRef
-Topic 946
-SubTopic 320
-Name Accounting Standards Codification
-Section S99
-Paragraph 5A
-Subparagraph (SX 210.12-13A(Column E))
-Publisher FASB
-URI https://asc.fasb.org//1943274/2147480032/946-320-S99-5A
Reference 19: http://www.xbrl.org/2003/role/disclosureRef
-Topic 946
-SubTopic 320
-Name Accounting Standards Codification
-Section S99
-Paragraph 5B
-Subparagraph (SX 210.12-13B(Column E))
-Publisher FASB
-URI https://asc.fasb.org//1943274/2147480032/946-320-S99-5B
Reference 20: http://www.xbrl.org/2003/role/disclosureRef
-Topic 946
-SubTopic 320
-Name Accounting Standards Codification
-Section S99
-Paragraph 5B
-Subparagraph (SX 210.12-13B(Column E)(Footnote 4))
-Publisher FASB
-URI https://asc.fasb.org//1943274/2147480032/946-320-S99-5B
Reference 21: http://www.xbrl.org/2003/role/disclosureRef
-Topic 210
-SubTopic 20
-Name Accounting Standards Codification
-Section 50
-Paragraph 3
-Subparagraph (c)
-Publisher FASB
-URI https://asc.fasb.org//1943274/2147483466/210-20-50-3
Reference 22: http://www.xbrl.org/2003/role/exampleRef
-Topic 210
-SubTopic 20
-Name Accounting Standards Codification
-Section 55
-Paragraph 22
-Publisher FASB
-URI https://asc.fasb.org//1943274/2147483444/210-20-55-22
Reference 23: http://www.xbrl.org/2003/role/disclosureRef
-Topic 210
-SubTopic 20
-Name Accounting Standards Codification
-Section 55
-Paragraph 10
-Publisher FASB
-URI https://asc.fasb.org//1943274/2147483444/210-20-55-10
Reference 24: http://www.xbrl.org/2003/role/disclosureRef
-Topic 825
-SubTopic 10
-Name Accounting Standards Codification
-Section 50
-Paragraph 10
-Publisher FASB
-URI https://asc.fasb.org//1943274/2147482907/825-10-50-10
| Name: |
us-gaap_DerivativeAssets |
| Namespace Prefix: |
us-gaap_ |
| Data Type: |
xbrli:monetaryItemType |
| Balance Type: |
debit |
| Period Type: |
instant |
|
| X |
- DefinitionFair value, after the effects of master netting arrangements, of a financial liability or contract with one or more underlyings, notional amount or payment provision or both, and the contract can be net settled by means outside the contract or delivery of an asset. Includes liabilities not subject to a master netting arrangement and not elected to be offset. Reference 1: http://www.xbrl.org/2003/role/disclosureRef
-Topic 946
-SubTopic 210
-Name Accounting Standards Codification
-Section 50
-Paragraph 6
-Subparagraph (e)
-Publisher FASB
-URI https://asc.fasb.org//1943274/2147480524/946-210-50-6
Reference 2: http://www.xbrl.org/2003/role/disclosureRef
-Topic 946
-SubTopic 210
-Name Accounting Standards Codification
-Section 50
-Paragraph 6
-Subparagraph (a)(1)
-Publisher FASB
-URI https://asc.fasb.org//1943274/2147480524/946-210-50-6
Reference 3: http://www.xbrl.org/2003/role/disclosureRef
-Topic 946
-SubTopic 210
-Name Accounting Standards Codification
-Section 50
-Paragraph 6
-Subparagraph (a)(2)
-Publisher FASB
-URI https://asc.fasb.org//1943274/2147480524/946-210-50-6
Reference 4: http://www.xbrl.org/2003/role/disclosureRef
-Topic 946
-SubTopic 210
-Name Accounting Standards Codification
-Section 50
-Paragraph 6
-Subparagraph (a)(4)
-Publisher FASB
-URI https://asc.fasb.org//1943274/2147480524/946-210-50-6
Reference 5: http://www.xbrl.org/2003/role/disclosureRef
-Topic 946
-SubTopic 210
-Name Accounting Standards Codification
-Section 50
-Paragraph 1
-Subparagraph (a)(1)
-Publisher FASB
-URI https://asc.fasb.org//1943274/2147480524/946-210-50-1
Reference 6: http://www.xbrl.org/2003/role/disclosureRef
-Topic 946
-SubTopic 210
-Name Accounting Standards Codification
-Section 50
-Paragraph 1
-Subparagraph (b)(1)
-Publisher FASB
-URI https://asc.fasb.org//1943274/2147480524/946-210-50-1
Reference 7: http://www.xbrl.org/2003/role/disclosureRef
-Topic 946
-SubTopic 210
-Name Accounting Standards Codification
-Section 50
-Paragraph 1
-Subparagraph (b)(2)
-Publisher FASB
-URI https://asc.fasb.org//1943274/2147480524/946-210-50-1
Reference 8: http://www.xbrl.org/2003/role/disclosureRef
-Topic 946
-SubTopic 210
-Name Accounting Standards Codification
-Section 50
-Paragraph 1
-Subparagraph (c)(2)
-Publisher FASB
-URI https://asc.fasb.org//1943274/2147480524/946-210-50-1
Reference 9: http://www.xbrl.org/2003/role/disclosureRef
-Topic 946
-SubTopic 210
-Name Accounting Standards Codification
-Section 50
-Paragraph 6
-Subparagraph (f)
-Publisher FASB
-URI https://asc.fasb.org//1943274/2147480524/946-210-50-6
Reference 10: http://www.xbrl.org/2009/role/commonPracticeRef
-Topic 946
-SubTopic 210
-Name Accounting Standards Codification
-Section 50
-Paragraph 6
-Subparagraph (a)(3)
-Publisher FASB
-URI https://asc.fasb.org//1943274/2147480524/946-210-50-6
Reference 11: http://www.xbrl.org/2003/role/disclosureRef
-Topic 946
-SubTopic 210
-Name Accounting Standards Codification
-Section S99
-Paragraph 1
-Subparagraph (SX 210.6-04(9)(e))
-Publisher FASB
-URI https://asc.fasb.org//1943274/2147479617/946-210-S99-1
Reference 12: http://www.xbrl.org/2003/role/disclosureRef
-Topic 946
-SubTopic 320
-Name Accounting Standards Codification
-Section S99
-Paragraph 5C
-Subparagraph (SX 210.12-13C(Column H)(Footnote 7))
-Publisher FASB
-URI https://asc.fasb.org//1943274/2147480032/946-320-S99-5C
Reference 13: http://www.xbrl.org/2003/role/disclosureRef
-Topic 946
-SubTopic 210
-Name Accounting Standards Codification
-Section S99
-Paragraph 1
-Subparagraph (SX 210.6-04(9)(b))
-Publisher FASB
-URI https://asc.fasb.org//1943274/2147479617/946-210-S99-1
Reference 14: http://www.xbrl.org/2003/role/disclosureRef
-Topic 946
-SubTopic 210
-Name Accounting Standards Codification
-Section S99
-Paragraph 1
-Subparagraph (SX 210.6-04(9)(d))
-Publisher FASB
-URI https://asc.fasb.org//1943274/2147479617/946-210-S99-1
Reference 15: http://www.xbrl.org/2003/role/disclosureRef
-Topic 946
-SubTopic 320
-Name Accounting Standards Codification
-Section S99
-Paragraph 5
-Subparagraph (SX 210.12-13(Column G)(Footnote 8))
-Publisher FASB
-URI https://asc.fasb.org//1943274/2147480032/946-320-S99-5
Reference 16: http://www.xbrl.org/2003/role/disclosureRef
-Topic 946
-SubTopic 320
-Name Accounting Standards Codification
-Section S99
-Paragraph 5C
-Subparagraph (SX 210.12-13C(Column H))
-Publisher FASB
-URI https://asc.fasb.org//1943274/2147480032/946-320-S99-5C
Reference 17: http://www.xbrl.org/2003/role/disclosureRef
-Topic 946
-SubTopic 320
-Name Accounting Standards Codification
-Section S99
-Paragraph 5
-Subparagraph (SX 210.12-13(Column G))
-Publisher FASB
-URI https://asc.fasb.org//1943274/2147480032/946-320-S99-5
Reference 18: http://www.xbrl.org/2003/role/disclosureRef
-Topic 946
-SubTopic 320
-Name Accounting Standards Codification
-Section S99
-Paragraph 5A
-Subparagraph (SX 210.12-13A(Column E))
-Publisher FASB
-URI https://asc.fasb.org//1943274/2147480032/946-320-S99-5A
Reference 19: http://www.xbrl.org/2003/role/disclosureRef
-Topic 946
-SubTopic 320
-Name Accounting Standards Codification
-Section S99
-Paragraph 5B
-Subparagraph (SX 210.12-13B(Column E))
-Publisher FASB
-URI https://asc.fasb.org//1943274/2147480032/946-320-S99-5B
Reference 20: http://www.xbrl.org/2003/role/disclosureRef
-Topic 946
-SubTopic 320
-Name Accounting Standards Codification
-Section S99
-Paragraph 5B
-Subparagraph (SX 210.12-13B(Column E)(Footnote 4))
-Publisher FASB
-URI https://asc.fasb.org//1943274/2147480032/946-320-S99-5B
Reference 21: http://www.xbrl.org/2003/role/disclosureRef
-Topic 210
-SubTopic 20
-Name Accounting Standards Codification
-Section 50
-Paragraph 3
-Subparagraph (c)
-Publisher FASB
-URI https://asc.fasb.org//1943274/2147483466/210-20-50-3
Reference 22: http://www.xbrl.org/2003/role/exampleRef
-Topic 210
-SubTopic 20
-Name Accounting Standards Codification
-Section 55
-Paragraph 22
-Publisher FASB
-URI https://asc.fasb.org//1943274/2147483444/210-20-55-22
Reference 23: http://www.xbrl.org/2003/role/disclosureRef
-Topic 210
-SubTopic 20
-Name Accounting Standards Codification
-Section 55
-Paragraph 10
-Publisher FASB
-URI https://asc.fasb.org//1943274/2147483444/210-20-55-10
Reference 24: http://www.xbrl.org/2003/role/disclosureRef
-Topic 825
-SubTopic 10
-Name Accounting Standards Codification
-Section 50
-Paragraph 10
-Publisher FASB
-URI https://asc.fasb.org//1943274/2147482907/825-10-50-10
| Name: |
us-gaap_DerivativeLiabilities |
| Namespace Prefix: |
us-gaap_ |
| Data Type: |
xbrli:monetaryItemType |
| Balance Type: |
credit |
| Period Type: |
instant |
|
| X |
- DefinitionCarrying value as of the balance sheet date of dividends declared but unpaid on equity securities issued by the entity and outstanding. Reference 1: http://fasb.org/us-gaap/role/ref/legacyRef
-Topic 210
-SubTopic 10
-Name Accounting Standards Codification
-Section S99
-Paragraph 1
-Subparagraph (SX 210.5-02(20))
-Publisher FASB
-URI https://asc.fasb.org//1943274/2147480566/210-10-S99-1
Reference 2: http://fasb.org/us-gaap/role/ref/legacyRef
-Topic 210
-SubTopic 10
-Name Accounting Standards Codification
-Section S99
-Paragraph 1
-Subparagraph (SX 210.5-02(24))
-Publisher FASB
-URI https://asc.fasb.org//1943274/2147480566/210-10-S99-1
Reference 3: http://www.xbrl.org/2003/role/exampleRef
-Topic 946
-SubTopic 405
-Name Accounting Standards Codification
-Section 45
-Paragraph 2
-Publisher FASB
-URI https://asc.fasb.org//1943274/2147480191/946-405-45-2
Reference 4: http://www.xbrl.org/2009/role/commonPracticeRef
-Topic 944
-SubTopic 210
-Name Accounting Standards Codification
-Section S99
-Paragraph 1
-Subparagraph (SX 210.7-03(a)(15)(a))
-Publisher FASB
-URI https://asc.fasb.org//1943274/2147479440/944-210-S99-1
Reference 5: http://fasb.org/us-gaap/role/ref/legacyRef
-Topic 942
-SubTopic 210
-Name Accounting Standards Codification
-Section S99
-Paragraph 1
-Subparagraph (SX 210.9-03(15)(5))
-Publisher FASB
-URI https://asc.fasb.org//1943274/2147479853/942-210-S99-1
| Name: |
us-gaap_DividendsPayableCurrentAndNoncurrent |
| Namespace Prefix: |
us-gaap_ |
| Data Type: |
xbrli:monetaryItemType |
| Balance Type: |
credit |
| Period Type: |
instant |
|
| X |
- DefinitionThis item represents the carrying amount on the entity's balance sheet of its investment in common stock of an equity method investee. This is not an indicator of the fair value of the investment, rather it is the initial cost adjusted for the entity's share of earnings and losses of the investee, adjusted for any distributions (dividends) and other than temporary impairment (OTTI) losses recognized. Reference 1: http://www.xbrl.org/2003/role/disclosureRef
-Topic 323
-SubTopic 10
-Name Accounting Standards Codification
-Section 45
-Paragraph 1
-Publisher FASB
-URI https://asc.fasb.org//1943274/2147481664/323-10-45-1
Reference 2: http://www.xbrl.org/2009/role/commonPracticeRef
-Topic 323
-SubTopic 10
-Name Accounting Standards Codification
-Section 50
-Paragraph 3
-Subparagraph (a)(3)
-Publisher FASB
-URI https://asc.fasb.org//1943274/2147481687/323-10-50-3
Reference 3: http://www.xbrl.org/2009/role/commonPracticeRef
-Topic 210
-SubTopic 10
-Name Accounting Standards Codification
-Section S99
-Paragraph 1
-Subparagraph (SX 210.5-02(10))
-Publisher FASB
-URI https://asc.fasb.org//1943274/2147480566/210-10-S99-1
Reference 4: http://www.xbrl.org/2003/role/disclosureRef
-Topic 280
-SubTopic 10
-Name Accounting Standards Codification
-Section 50
-Paragraph 25
-Subparagraph (a)
-Publisher FASB
-URI https://asc.fasb.org//1943274/2147482810/280-10-50-25
| Name: |
us-gaap_EquityMethodInvestments |
| Namespace Prefix: |
us-gaap_ |
| Data Type: |
xbrli:monetaryItemType |
| Balance Type: |
debit |
| Period Type: |
instant |
|
| X |
- DefinitionAmount after amortization of assets, excluding financial assets and goodwill, lacking physical substance with a finite life. Reference 1: http://www.xbrl.org/2003/role/disclosureRef
-Topic 926
-SubTopic 20
-Name Accounting Standards Codification
-Section 50
-Paragraph 5
-Publisher FASB
-URI https://asc.fasb.org//1943274/2147483154/926-20-50-5
Reference 2: http://fasb.org/us-gaap/role/ref/legacyRef
-Topic 350
-SubTopic 30
-Name Accounting Standards Codification
-Section 50
-Paragraph 2
-Subparagraph (a)(1)
-Publisher FASB
-URI https://asc.fasb.org//1943274/2147482665/350-30-50-2
| Name: |
us-gaap_FiniteLivedIntangibleAssetsNet |
| Namespace Prefix: |
us-gaap_ |
| Data Type: |
xbrli:monetaryItemType |
| Balance Type: |
debit |
| Period Type: |
instant |
|
| X |
- DefinitionSum of the carrying amounts as of the balance sheet date of all liabilities that are recognized. Liabilities are probable future sacrifices of economic benefits arising from present obligations of an entity to transfer assets or provide services to other entities in the future. Reference 1: http://www.xbrl.org/2003/role/disclosureRef
-Topic 810
-SubTopic 10
-Name Accounting Standards Codification
-Section 50
-Paragraph 3
-Subparagraph (c)
-Publisher FASB
-URI https://asc.fasb.org//1943274/2147481203/810-10-50-3
Reference 2: http://www.xbrl.org/2003/role/disclosureRef
-Topic 810
-SubTopic 10
-Name Accounting Standards Codification
-Section 45
-Paragraph 25
-Subparagraph (b)
-Publisher FASB
-URI https://asc.fasb.org//1943274/2147481231/810-10-45-25
Reference 3: http://www.xbrl.org/2003/role/disclosureRef
-Topic 810
-SubTopic 10
-Name Accounting Standards Codification
-Section 50
-Paragraph 3
-Subparagraph (bb)
-Publisher FASB
-URI https://asc.fasb.org//1943274/2147481203/810-10-50-3
Reference 4: http://www.xbrl.org/2003/role/disclosureRef
-Topic 235
-SubTopic 10
-Name Accounting Standards Codification
-Section S99
-Paragraph 1
-Subparagraph (SX 210.4-08(g)(1)(ii))
-Publisher FASB
-URI https://asc.fasb.org//1943274/2147480678/235-10-S99-1
Reference 5: http://www.xbrl.org/2003/role/disclosureRef
-Topic 323
-SubTopic 10
-Name Accounting Standards Codification
-Section 50
-Paragraph 3
-Subparagraph (c)
-Publisher FASB
-URI https://asc.fasb.org//1943274/2147481687/323-10-50-3
Reference 6: http://www.xbrl.org/2003/role/disclosureRef
-Topic 825
-SubTopic 10
-Name Accounting Standards Codification
-Section 50
-Paragraph 28
-Subparagraph (f)
-Publisher FASB
-URI https://asc.fasb.org//1943274/2147482907/825-10-50-28
Reference 7: http://www.xbrl.org/2003/role/exampleRef
-Topic 946
-SubTopic 830
-Name Accounting Standards Codification
-Section 55
-Paragraph 12
-Publisher FASB
-URI https://asc.fasb.org//1943274/2147480167/946-830-55-12
Reference 8: http://www.xbrl.org/2003/role/disclosureRef
-Topic 946
-SubTopic 210
-Name Accounting Standards Codification
-Section S99
-Paragraph 1
-Subparagraph (SX 210.6-04(14))
-Publisher FASB
-URI https://asc.fasb.org//1943274/2147479617/946-210-S99-1
Reference 9: http://www.xbrl.org/2003/role/disclosureRef
-Topic 470
-SubTopic 10
-Name Accounting Standards Codification
-Section S99
-Paragraph 1A
-Subparagraph (SX 210.13-01(a)(4)(i))
-Publisher FASB
-URI https://asc.fasb.org//1943274/2147480097/470-10-S99-1A
Reference 10: http://www.xbrl.org/2009/role/commonPracticeRef
-Topic 470
-SubTopic 10
-Name Accounting Standards Codification
-Section S99
-Paragraph 1A
-Subparagraph (SX 210.13-01(a)(4)(ii))
-Publisher FASB
-URI https://asc.fasb.org//1943274/2147480097/470-10-S99-1A
Reference 11: http://www.xbrl.org/2003/role/disclosureRef
-Topic 470
-SubTopic 10
-Name Accounting Standards Codification
-Section S99
-Paragraph 1A
-Subparagraph (SX 210.13-01(a)(4)(iii)(A))
-Publisher FASB
-URI https://asc.fasb.org//1943274/2147480097/470-10-S99-1A
Reference 12: http://www.xbrl.org/2003/role/disclosureRef
-Topic 470
-SubTopic 10
-Name Accounting Standards Codification
-Section S99
-Paragraph 1A
-Subparagraph (SX 210.13-01(a)(4)(iv))
-Publisher FASB
-URI https://asc.fasb.org//1943274/2147480097/470-10-S99-1A
Reference 13: http://www.xbrl.org/2003/role/disclosureRef
-Topic 470
-SubTopic 10
-Name Accounting Standards Codification
-Section S99
-Paragraph 1A
-Subparagraph (SX 210.13-01(a)(5))
-Publisher FASB
-URI https://asc.fasb.org//1943274/2147480097/470-10-S99-1A
Reference 14: http://www.xbrl.org/2003/role/disclosureRef
-Topic 470
-SubTopic 10
-Name Accounting Standards Codification
-Section S99
-Paragraph 1B
-Subparagraph (SX 210.13-02(a)(4)(i))
-Publisher FASB
-URI https://asc.fasb.org//1943274/2147480097/470-10-S99-1B
Reference 15: http://www.xbrl.org/2003/role/disclosureRef
-Topic 470
-SubTopic 10
-Name Accounting Standards Codification
-Section S99
-Paragraph 1B
-Subparagraph (SX 210.13-02(a)(4)(iii)(A))
-Publisher FASB
-URI https://asc.fasb.org//1943274/2147480097/470-10-S99-1B
Reference 16: http://www.xbrl.org/2003/role/disclosureRef
-Topic 470
-SubTopic 10
-Name Accounting Standards Codification
-Section S99
-Paragraph 1B
-Subparagraph (SX 210.13-02(a)(4)(iii)(B))
-Publisher FASB
-URI https://asc.fasb.org//1943274/2147480097/470-10-S99-1B
Reference 17: http://www.xbrl.org/2003/role/disclosureRef
-Topic 470
-SubTopic 10
-Name Accounting Standards Codification
-Section S99
-Paragraph 1B
-Subparagraph (SX 210.13-02(a)(4)(iv))
-Publisher FASB
-URI https://asc.fasb.org//1943274/2147480097/470-10-S99-1B
Reference 18: http://www.xbrl.org/2003/role/disclosureRef
-Topic 470
-SubTopic 10
-Name Accounting Standards Codification
-Section S99
-Paragraph 1B
-Subparagraph (SX 210.13-02(a)(5))
-Publisher FASB
-URI https://asc.fasb.org//1943274/2147480097/470-10-S99-1B
Reference 19: http://www.xbrl.org/2009/role/commonPracticeRef
-Topic 852
-SubTopic 10
-Name Accounting Standards Codification
-Section 50
-Paragraph 7
-Subparagraph (a)
-Publisher FASB
-URI https://asc.fasb.org//1943274/2147481404/852-10-50-7
Reference 20: http://www.xbrl.org/2009/role/commonPracticeRef
-Topic 852
-SubTopic 10
-Name Accounting Standards Codification
-Section 50
-Paragraph 7
-Subparagraph (b)
-Publisher FASB
-URI https://asc.fasb.org//1943274/2147481404/852-10-50-7
Reference 21: http://www.xbrl.org/2003/role/exampleRef
-Topic 280
-SubTopic 10
-Name Accounting Standards Codification
-Section 50
-Paragraph 30
-Subparagraph (d)
-Publisher FASB
-URI https://asc.fasb.org//1943274/2147482810/280-10-50-30
Reference 22: http://fasb.org/us-gaap/role/ref/legacyRef
-Name Accounting Standards Codification
-Topic 210
-SubTopic 10
-Section S99
-Paragraph 1
-Subparagraph (SX 210.5-02.19-26)
-Publisher FASB
-URI https://asc.fasb.org//1943274/2147480566/210-10-S99-1
| Name: |
us-gaap_Liabilities |
| Namespace Prefix: |
us-gaap_ |
| Data Type: |
xbrli:monetaryItemType |
| Balance Type: |
credit |
| Period Type: |
instant |
|
| X |
- References
+ Details
| Name: |
us-gaap_LiabilitiesAbstract |
| Namespace Prefix: |
us-gaap_ |
| Data Type: |
xbrli:stringItemType |
| Balance Type: |
na |
| Period Type: |
duration |
|
| X |
- DefinitionAmount of liabilities and equity items, including the portion of equity attributable to noncontrolling interests, if any. Reference 1: http://www.xbrl.org/2003/role/exampleRef
-Topic 852
-SubTopic 10
-Name Accounting Standards Codification
-Section 55
-Paragraph 10
-Publisher FASB
-URI https://asc.fasb.org//1943274/2147481372/852-10-55-10
Reference 2: http://www.xbrl.org/2003/role/disclosureRef
-Topic 944
-SubTopic 210
-Name Accounting Standards Codification
-Section S99
-Paragraph 1
-Subparagraph (SX 210.7-03(a)(25))
-Publisher FASB
-URI https://asc.fasb.org//1943274/2147479440/944-210-S99-1
Reference 3: http://www.xbrl.org/2009/role/commonPracticeRef
-Topic 235
-SubTopic 10
-Name Accounting Standards Codification
-Section S99
-Paragraph 1
-Subparagraph (SX 210.4-08(g)(1)(ii))
-Publisher FASB
-URI https://asc.fasb.org//1943274/2147480678/235-10-S99-1
Reference 4: http://www.xbrl.org/2009/role/commonPracticeRef
-Topic 323
-SubTopic 10
-Name Accounting Standards Codification
-Section 50
-Paragraph 3
-Subparagraph (c)
-Publisher FASB
-URI https://asc.fasb.org//1943274/2147481687/323-10-50-3
Reference 5: http://www.xbrl.org/2009/role/commonPracticeRef
-Topic 825
-SubTopic 10
-Name Accounting Standards Codification
-Section 50
-Paragraph 28
-Subparagraph (f)
-Publisher FASB
-URI https://asc.fasb.org//1943274/2147482907/825-10-50-28
Reference 6: http://fasb.org/us-gaap/role/ref/legacyRef
-Topic 942
-SubTopic 210
-Name Accounting Standards Codification
-Section S99
-Paragraph 1
-Subparagraph (SX 210.9-03(23))
-Publisher FASB
-URI https://asc.fasb.org//1943274/2147479853/942-210-S99-1
Reference 7: http://fasb.org/us-gaap/role/ref/legacyRef
-Topic 210
-SubTopic 10
-Name Accounting Standards Codification
-Section S99
-Paragraph 1
-Subparagraph (SX 210.5-02(32))
-Publisher FASB
-URI https://asc.fasb.org//1943274/2147480566/210-10-S99-1
| Name: |
us-gaap_LiabilitiesAndStockholdersEquity |
| Namespace Prefix: |
us-gaap_ |
| Data Type: |
xbrli:monetaryItemType |
| Balance Type: |
credit |
| Period Type: |
instant |
|
| X |
- DefinitionAmount, after deduction of unamortized premium (discount) and debt issuance cost, of long-term debt. Excludes lease obligation. Reference 1: http://fasb.org/us-gaap/role/ref/legacyRef
-Name Accounting Standards Codification
-Section S99
-Paragraph 1
-Subparagraph (SX 210.5-02(22))
-SubTopic 10
-Topic 210
-Publisher FASB
-URI https://asc.fasb.org//1943274/2147480566/210-10-S99-1
Reference 2: http://www.xbrl.org/2003/role/exampleRef
-Topic 470
-SubTopic 20
-Name Accounting Standards Codification
-Section 55
-Paragraph 69B
-Publisher FASB
-URI https://asc.fasb.org//1943274/2147481568/470-20-55-69B
Reference 3: http://www.xbrl.org/2003/role/exampleRef
-Topic 470
-SubTopic 20
-Name Accounting Standards Codification
-Section 55
-Paragraph 69C
-Publisher FASB
-URI https://asc.fasb.org//1943274/2147481568/470-20-55-69C
Reference 4: http://www.xbrl.org/2003/role/disclosureRef
-Topic 470
-SubTopic 20
-Name Accounting Standards Codification
-Section 50
-Paragraph 1D
-Subparagraph (b)
-Publisher FASB
-URI https://asc.fasb.org//1943274/2147481139/470-20-50-1D
Reference 5: http://www.xbrl.org/2009/role/commonPracticeRef
-Topic 944
-SubTopic 210
-Name Accounting Standards Codification
-Section S99
-Paragraph 1
-Subparagraph (SX 210.7-03(a)(16)(a)(2))
-Publisher FASB
-URI https://asc.fasb.org//1943274/2147479440/944-210-S99-1
Reference 6: http://fasb.org/us-gaap/role/ref/legacyRef
-Topic 942
-SubTopic 210
-Name Accounting Standards Codification
-Section S99
-Paragraph 1
-Subparagraph (SX 210.9-03(16))
-Publisher FASB
-URI https://asc.fasb.org//1943274/2147479853/942-210-S99-1
Reference 7: http://www.xbrl.org/2003/role/disclosureRef
-Topic 470
-SubTopic 20
-Name Accounting Standards Codification
-Section 50
-Paragraph 4
-Subparagraph (b)(3)
-Publisher FASB
-URI https://asc.fasb.org//1943274/2147481139/470-20-50-4
| Name: |
us-gaap_LongTermDebt |
| Namespace Prefix: |
us-gaap_ |
| Data Type: |
xbrli:monetaryItemType |
| Balance Type: |
credit |
| Period Type: |
instant |
|
| X |
- DefinitionAmount of equity (deficit) attributable to noncontrolling interest. Excludes temporary equity. Reference 1: http://www.xbrl.org/2003/role/disclosureRef
-Topic 235
-SubTopic 10
-Name Accounting Standards Codification
-Section S99
-Paragraph 1
-Subparagraph (SX 210.4-08(g)(1)(ii))
-Publisher FASB
-URI https://asc.fasb.org//1943274/2147480678/235-10-S99-1
Reference 2: http://www.xbrl.org/2003/role/disclosureRef
-Topic 323
-SubTopic 10
-Name Accounting Standards Codification
-Section 50
-Paragraph 3
-Subparagraph (c)
-Publisher FASB
-URI https://asc.fasb.org//1943274/2147481687/323-10-50-3
Reference 3: http://www.xbrl.org/2003/role/disclosureRef
-Topic 825
-SubTopic 10
-Name Accounting Standards Codification
-Section 50
-Paragraph 28
-Subparagraph (f)
-Publisher FASB
-URI https://asc.fasb.org//1943274/2147482907/825-10-50-28
Reference 4: http://www.xbrl.org/2003/role/disclosureRef
-Topic 944
-SubTopic 210
-Name Accounting Standards Codification
-Section S99
-Paragraph 1
-Subparagraph (SX 210.7-03(a)(24))
-Publisher FASB
-URI https://asc.fasb.org//1943274/2147479440/944-210-S99-1
Reference 5: http://www.xbrl.org/2003/role/disclosureRef
-Topic 946
-SubTopic 210
-Name Accounting Standards Codification
-Section S99
-Paragraph 1
-Subparagraph (SX 210.6-04(19))
-Publisher FASB
-URI https://asc.fasb.org//1943274/2147479617/946-210-S99-1
Reference 6: http://www.xbrl.org/2003/role/disclosureRef
-Topic 470
-SubTopic 10
-Name Accounting Standards Codification
-Section S99
-Paragraph 1A
-Subparagraph (SX 210.13-01(a)(4)(i))
-Publisher FASB
-URI https://asc.fasb.org//1943274/2147480097/470-10-S99-1A
Reference 7: http://www.xbrl.org/2003/role/disclosureRef
-Topic 470
-SubTopic 10
-Name Accounting Standards Codification
-Section S99
-Paragraph 1A
-Subparagraph (SX 210.13-01(a)(4)(iv))
-Publisher FASB
-URI https://asc.fasb.org//1943274/2147480097/470-10-S99-1A
Reference 8: http://www.xbrl.org/2003/role/disclosureRef
-Topic 470
-SubTopic 10
-Name Accounting Standards Codification
-Section S99
-Paragraph 1A
-Subparagraph (SX 210.13-01(a)(5))
-Publisher FASB
-URI https://asc.fasb.org//1943274/2147480097/470-10-S99-1A
Reference 9: http://www.xbrl.org/2003/role/disclosureRef
-Topic 470
-SubTopic 10
-Name Accounting Standards Codification
-Section S99
-Paragraph 1B
-Subparagraph (SX 210.13-02(a)(4)(i))
-Publisher FASB
-URI https://asc.fasb.org//1943274/2147480097/470-10-S99-1B
Reference 10: http://www.xbrl.org/2003/role/disclosureRef
-Topic 470
-SubTopic 10
-Name Accounting Standards Codification
-Section S99
-Paragraph 1B
-Subparagraph (SX 210.13-02(a)(4)(iv))
-Publisher FASB
-URI https://asc.fasb.org//1943274/2147480097/470-10-S99-1B
Reference 11: http://www.xbrl.org/2003/role/disclosureRef
-Topic 470
-SubTopic 10
-Name Accounting Standards Codification
-Section S99
-Paragraph 1B
-Subparagraph (SX 210.13-02(a)(5))
-Publisher FASB
-URI https://asc.fasb.org//1943274/2147480097/470-10-S99-1B
Reference 12: http://fasb.org/us-gaap/role/ref/legacyRef
-Topic 942
-SubTopic 210
-Name Accounting Standards Codification
-Section S99
-Paragraph 1
-Subparagraph (SX 210.9-03(22))
-Publisher FASB
-URI https://asc.fasb.org//1943274/2147479853/942-210-S99-1
Reference 13: http://fasb.org/us-gaap/role/ref/legacyRef
-Name Accounting Standards Codification
-Topic 210
-SubTopic 10
-Section S99
-Paragraph 1
-Subparagraph (SX 210.5-02.31)
-Publisher FASB
-URI https://asc.fasb.org//1943274/2147480566/210-10-S99-1
| Name: |
us-gaap_MinorityInterest |
| Namespace Prefix: |
us-gaap_ |
| Data Type: |
xbrli:monetaryItemType |
| Balance Type: |
credit |
| Period Type: |
instant |
|
| X |
- DefinitionThis element represents a liability associated with the acquisition of an off-market lease when the terms of the lease are unfavorable to the market terms for the lease at the date of acquisition. Reference 1: http://fasb.org/us-gaap/role/ref/legacyRef
-Name Accounting Standards Codification
-Topic 210
-SubTopic 10
-Section S99
-Paragraph 1
-Subparagraph (SX 210.5-02.24)
-Publisher FASB
-URI https://asc.fasb.org//1943274/2147480566/210-10-S99-1
| Name: |
us-gaap_OffMarketLeaseUnfavorable |
| Namespace Prefix: |
us-gaap_ |
| Data Type: |
xbrli:monetaryItemType |
| Balance Type: |
credit |
| Period Type: |
instant |
|
| X |
- DefinitionPresent value of lessee's discounted obligation for lease payments from operating lease. Reference 1: http://www.xbrl.org/2003/role/disclosureRef
-Topic 842
-SubTopic 20
-Name Accounting Standards Codification
-Section 45
-Paragraph 1
-Subparagraph (b)
-Publisher FASB
-URI https://asc.fasb.org//1943274/2147479041/842-20-45-1
| Name: |
us-gaap_OperatingLeaseLiability |
| Namespace Prefix: |
us-gaap_ |
| Data Type: |
xbrli:monetaryItemType |
| Balance Type: |
credit |
| Period Type: |
instant |
|
| X |
- DefinitionAmount of lessee's right to use underlying asset under operating lease. Reference 1: http://www.xbrl.org/2003/role/disclosureRef
-Topic 842
-SubTopic 20
-Name Accounting Standards Codification
-Section 45
-Paragraph 1
-Subparagraph (a)
-Publisher FASB
-URI https://asc.fasb.org//1943274/2147479041/842-20-45-1
| Name: |
us-gaap_OperatingLeaseRightOfUseAsset |
| Namespace Prefix: |
us-gaap_ |
| Data Type: |
xbrli:monetaryItemType |
| Balance Type: |
debit |
| Period Type: |
instant |
|
| X |
- DefinitionAmount of asset related to consideration paid in advance for costs that provide economic benefits in future periods, and amount of other assets.
| Name: |
us-gaap_PrepaidExpenseAndOtherAssets |
| Namespace Prefix: |
us-gaap_ |
| Data Type: |
xbrli:monetaryItemType |
| Balance Type: |
debit |
| Period Type: |
instant |
|
| X |
- DefinitionThe cumulative amount of depreciation for real estate property held for investment purposes. Reference 1: http://www.xbrl.org/2003/role/disclosureRef
-Topic 944
-SubTopic 210
-Name Accounting Standards Codification
-Section S99
-Paragraph 1
-Subparagraph (SX 210.7-03(a)(1)(3))
-Publisher FASB
-URI https://asc.fasb.org//1943274/2147479440/944-210-S99-1
| Name: |
us-gaap_RealEstateInvestmentPropertyAccumulatedDepreciation |
| Namespace Prefix: |
us-gaap_ |
| Data Type: |
xbrli:monetaryItemType |
| Balance Type: |
credit |
| Period Type: |
instant |
|
| X |
- DefinitionAmount of real estate investment property which may include the following: (1) land available-for-sale; (2) land available-for-development; (3) investments in building and building improvements; (4) tenant allowances; (5) developments in-process; (6) rental properties; and (7) other real estate investments. Reference 1: http://www.xbrl.org/2003/role/disclosureRef
-Topic 944
-SubTopic 210
-Name Accounting Standards Codification
-Section S99
-Paragraph 1
-Subparagraph (SX 210.7-03(a)(1)(d))
-Publisher FASB
-URI https://asc.fasb.org//1943274/2147479440/944-210-S99-1
| Name: |
us-gaap_RealEstateInvestmentPropertyAtCost |
| Namespace Prefix: |
us-gaap_ |
| Data Type: |
xbrli:monetaryItemType |
| Balance Type: |
debit |
| Period Type: |
instant |
|
| X |
- DefinitionAmount of real estate investment property, net of accumulated depreciation, which may include the following: (1) land available-for-sale; (2) land available-for-development; (3) investments in building and building improvements; (4) tenant allowances; (5) developments in-process; (6) rental properties; and (7) other real estate investments. Reference 1: http://www.xbrl.org/2009/role/commonPracticeRef
-Topic 944
-SubTopic 210
-Name Accounting Standards Codification
-Section S99
-Paragraph 1
-Subparagraph (SX 210.7-03(a)(1)(d))
-Publisher FASB
-URI https://asc.fasb.org//1943274/2147479440/944-210-S99-1
| Name: |
us-gaap_RealEstateInvestmentPropertyNet |
| Namespace Prefix: |
us-gaap_ |
| Data Type: |
xbrli:monetaryItemType |
| Balance Type: |
debit |
| Period Type: |
instant |
|
| X |
- DefinitionAmount of accumulated undistributed earnings (deficit). Reference 1: http://www.xbrl.org/2003/role/exampleRef
-Topic 852
-SubTopic 10
-Name Accounting Standards Codification
-Section 55
-Paragraph 10
-Publisher FASB
-URI https://asc.fasb.org//1943274/2147481372/852-10-55-10
Reference 2: http://www.xbrl.org/2003/role/disclosureRef
-Topic 944
-SubTopic 40
-Name Accounting Standards Codification
-Section 65
-Paragraph 2
-Subparagraph (g)(2)(i)
-Publisher FASB
-URI https://asc.fasb.org//1943274/2147480016/944-40-65-2
Reference 3: http://www.xbrl.org/2003/role/disclosureRef
-Topic 944
-SubTopic 40
-Name Accounting Standards Codification
-Section 65
-Paragraph 2
-Subparagraph (h)(2)
-Publisher FASB
-URI https://asc.fasb.org//1943274/2147480016/944-40-65-2
Reference 4: http://www.xbrl.org/2003/role/disclosureRef
-Topic 946
-SubTopic 20
-Name Accounting Standards Codification
-Section 50
-Paragraph 11
-Publisher FASB
-URI https://asc.fasb.org//1943274/2147480990/946-20-50-11
Reference 5: http://www.xbrl.org/2003/role/disclosureRef
-Topic 944
-SubTopic 210
-Name Accounting Standards Codification
-Section S99
-Paragraph 1
-Subparagraph (SX 210.7-03(a)(23)(a)(4))
-Publisher FASB
-URI https://asc.fasb.org//1943274/2147479440/944-210-S99-1
Reference 6: http://www.xbrl.org/2003/role/disclosureRef
-Topic 946
-SubTopic 210
-Name Accounting Standards Codification
-Section S99
-Paragraph 1
-Subparagraph (SX 210.6-04(17))
-Publisher FASB
-URI https://asc.fasb.org//1943274/2147479617/946-210-S99-1
Reference 7: http://fasb.org/us-gaap/role/ref/legacyRef
-Topic 505
-SubTopic 10
-Name Accounting Standards Codification
-Section S99
-Paragraph 1
-Subparagraph (SX 210.3-04)
-Publisher FASB
-URI https://asc.fasb.org//1943274/2147480008/505-10-S99-1
Reference 8: http://fasb.org/us-gaap/role/ref/legacyRef
-Topic 210
-SubTopic 10
-Name Accounting Standards Codification
-Section S99
-Paragraph 1
-Subparagraph (SX 210.5-02(30)(a)(3))
-Publisher FASB
-URI https://asc.fasb.org//1943274/2147480566/210-10-S99-1
| Name: |
us-gaap_RetainedEarningsAccumulatedDeficit |
| Namespace Prefix: |
us-gaap_ |
| Data Type: |
xbrli:monetaryItemType |
| Balance Type: |
credit |
| Period Type: |
instant |
|
| X |
- DefinitionThis element represents money paid in advance to protect the provider of a product or service, such as a lessor, against damage or nonpayment by the buyer or tenant (lessee) during the term of the agreement. Such damages may include physical damage to the property, theft of property, and other contractual breaches. Security deposits held may be interest or noninterest bearing.
| Name: |
us-gaap_SecurityDepositLiability |
| Namespace Prefix: |
us-gaap_ |
| Data Type: |
xbrli:monetaryItemType |
| Balance Type: |
credit |
| Period Type: |
instant |
|
| X |
- DefinitionAmount of equity (deficit) attributable to parent. Excludes temporary equity and equity attributable to noncontrolling interest. Reference 1: http://www.xbrl.org/2003/role/exampleRef
-Topic 852
-SubTopic 10
-Name Accounting Standards Codification
-Section 55
-Paragraph 10
-Publisher FASB
-URI https://asc.fasb.org//1943274/2147481372/852-10-55-10
Reference 2: http://www.xbrl.org/2003/role/exampleRef
-Topic 946
-SubTopic 830
-Name Accounting Standards Codification
-Section 55
-Paragraph 12
-Publisher FASB
-URI https://asc.fasb.org//1943274/2147480167/946-830-55-12
Reference 3: http://www.xbrl.org/2003/role/disclosureRef
-Topic 946
-SubTopic 210
-Name Accounting Standards Codification
-Section S99
-Paragraph 1
-Subparagraph (SX 210.6-04(19))
-Publisher FASB
-URI https://asc.fasb.org//1943274/2147479617/946-210-S99-1
Reference 4: http://www.xbrl.org/2003/role/disclosureRef
-Topic 946
-SubTopic 210
-Name Accounting Standards Codification
-Section S99
-Paragraph 2
-Subparagraph (SX 210.6-05(4))
-Publisher FASB
-URI https://asc.fasb.org//1943274/2147479617/946-210-S99-2
Reference 5: http://www.xbrl.org/2009/role/commonPracticeRef
-Topic 946
-SubTopic 220
-Name Accounting Standards Codification
-Section S99
-Paragraph 3
-Subparagraph (SX 210.6-09(4)(b))
-Publisher FASB
-URI https://asc.fasb.org//1943274/2147483575/946-220-S99-3
Reference 6: http://www.xbrl.org/2003/role/disclosureRef
-Topic 946
-SubTopic 220
-Name Accounting Standards Codification
-Section S99
-Paragraph 3
-Subparagraph (SX 210.6-09(6))
-Publisher FASB
-URI https://asc.fasb.org//1943274/2147483575/946-220-S99-3
Reference 7: http://www.xbrl.org/2003/role/disclosureRef
-Topic 946
-SubTopic 220
-Name Accounting Standards Codification
-Section S99
-Paragraph 3
-Subparagraph (SX 210.6-09(7))
-Publisher FASB
-URI https://asc.fasb.org//1943274/2147483575/946-220-S99-3
Reference 8: http://www.xbrl.org/2009/role/commonPracticeRef
-Topic 235
-SubTopic 10
-Name Accounting Standards Codification
-Section S99
-Paragraph 1
-Subparagraph (SX 210.4-08(g)(1)(ii))
-Publisher FASB
-URI https://asc.fasb.org//1943274/2147480678/235-10-S99-1
Reference 9: http://www.xbrl.org/2009/role/commonPracticeRef
-Topic 323
-SubTopic 10
-Name Accounting Standards Codification
-Section 50
-Paragraph 3
-Subparagraph (c)
-Publisher FASB
-URI https://asc.fasb.org//1943274/2147481687/323-10-50-3
Reference 10: http://www.xbrl.org/2009/role/commonPracticeRef
-Topic 825
-SubTopic 10
-Name Accounting Standards Codification
-Section 50
-Paragraph 28
-Subparagraph (f)
-Publisher FASB
-URI https://asc.fasb.org//1943274/2147482907/825-10-50-28
Reference 11: http://fasb.org/us-gaap/role/ref/legacyRef
-Topic 210
-SubTopic 10
-Name Accounting Standards Codification
-Section S99
-Paragraph 1
-Subparagraph (SX 210.5-02(29))
-Publisher FASB
-URI https://asc.fasb.org//1943274/2147480566/210-10-S99-1
Reference 12: http://fasb.org/us-gaap/role/ref/legacyRef
-Topic 210
-SubTopic 10
-Name Accounting Standards Codification
-Section S99
-Paragraph 1
-Subparagraph (SX 210.5-02(31))
-Publisher FASB
-URI https://asc.fasb.org//1943274/2147480566/210-10-S99-1
Reference 13: http://fasb.org/us-gaap/role/ref/legacyRef
-Topic 210
-SubTopic 10
-Name Accounting Standards Codification
-Section S99
-Paragraph 1
-Subparagraph (SX 210.5-02(30))
-Publisher FASB
-URI https://asc.fasb.org//1943274/2147480566/210-10-S99-1
Reference 14: http://fasb.org/us-gaap/role/ref/legacyRef
-Topic 310
-SubTopic 10
-Name Accounting Standards Codification
-Section S99
-Paragraph 2
-Subparagraph (SAB Topic 4.E)
-Publisher FASB
-URI https://asc.fasb.org//1943274/2147480418/310-10-S99-2
| Name: |
us-gaap_StockholdersEquity |
| Namespace Prefix: |
us-gaap_ |
| Data Type: |
xbrli:monetaryItemType |
| Balance Type: |
credit |
| Period Type: |
instant |
|
| X |
- DefinitionAmount of equity (deficit) attributable to parent and noncontrolling interest. Excludes temporary equity. Reference 1: http://www.xbrl.org/2003/role/disclosureRef
-Topic 250
-SubTopic 10
-Name Accounting Standards Codification
-Section 45
-Paragraph 24
-Publisher FASB
-URI https://asc.fasb.org//1943274/2147483421/250-10-45-24
Reference 2: http://www.xbrl.org/2003/role/disclosureRef
-Topic 250
-SubTopic 10
-Name Accounting Standards Codification
-Section 45
-Paragraph 23
-Subparagraph (b)
-Publisher FASB
-URI https://asc.fasb.org//1943274/2147483421/250-10-45-23
Reference 3: http://www.xbrl.org/2003/role/disclosureRef
-Topic 250
-SubTopic 10
-Name Accounting Standards Codification
-Section 45
-Paragraph 5
-Subparagraph (b)
-Publisher FASB
-URI https://asc.fasb.org//1943274/2147483421/250-10-45-5
Reference 4: http://www.xbrl.org/2003/role/disclosureRef
-Topic 326
-SubTopic 10
-Name Accounting Standards Codification
-Section 65
-Paragraph 5
-Subparagraph (c)(2)
-Publisher FASB
-URI https://asc.fasb.org//1943274/2147479654/326-10-65-5
Reference 5: http://www.xbrl.org/2003/role/disclosureRef
-Topic 815
-SubTopic 20
-Name Accounting Standards Codification
-Section 65
-Paragraph 6
-Subparagraph (e)
-Publisher FASB
-URI https://asc.fasb.org//1943274/2147480528/815-20-65-6
Reference 6: http://www.xbrl.org/2003/role/disclosureRef
-Topic 815
-SubTopic 20
-Name Accounting Standards Codification
-Section 65
-Paragraph 6
-Subparagraph (h)(1)
-Publisher FASB
-URI https://asc.fasb.org//1943274/2147480528/815-20-65-6
Reference 7: http://www.xbrl.org/2003/role/disclosureRef
-Topic 815
-SubTopic 20
-Name Accounting Standards Codification
-Section 65
-Paragraph 6
-Subparagraph (h)(1)(i)
-Publisher FASB
-URI https://asc.fasb.org//1943274/2147480528/815-20-65-6
Reference 8: http://www.xbrl.org/2003/role/disclosureRef
-Topic 815
-SubTopic 20
-Name Accounting Standards Codification
-Section 65
-Paragraph 6
-Subparagraph (h)(1)(iii)
-Publisher FASB
-URI https://asc.fasb.org//1943274/2147480528/815-20-65-6
Reference 9: http://www.xbrl.org/2003/role/disclosureRef
-Topic 815
-SubTopic 20
-Name Accounting Standards Codification
-Section 65
-Paragraph 6
-Subparagraph (h)(1)(iv)
-Publisher FASB
-URI https://asc.fasb.org//1943274/2147480528/815-20-65-6
Reference 10: http://www.xbrl.org/2003/role/disclosureRef
-Topic 815
-SubTopic 20
-Name Accounting Standards Codification
-Section 65
-Paragraph 6
-Subparagraph (i)(3)
-Publisher FASB
-URI https://asc.fasb.org//1943274/2147480528/815-20-65-6
Reference 11: http://www.xbrl.org/2003/role/disclosureRef
-Topic 848
-SubTopic 10
-Name Accounting Standards Codification
-Section 65
-Paragraph 2
-Subparagraph (a)(3)(iii)(03)
-Publisher FASB
-URI https://asc.fasb.org//1943274/2147483550/848-10-65-2
Reference 12: http://www.xbrl.org/2003/role/disclosureRef
-Topic 105
-SubTopic 10
-Name Accounting Standards Codification
-Section 65
-Paragraph 6
-Subparagraph (c)
-Publisher FASB
-URI https://asc.fasb.org//1943274/2147479343/105-10-65-6
Reference 13: http://www.xbrl.org/2003/role/disclosureRef
-Topic 105
-SubTopic 10
-Name Accounting Standards Codification
-Section 65
-Paragraph 6
-Subparagraph (d)
-Publisher FASB
-URI https://asc.fasb.org//1943274/2147479343/105-10-65-6
Reference 14: http://www.xbrl.org/2003/role/disclosureRef
-Topic 944
-SubTopic 40
-Name Accounting Standards Codification
-Section 65
-Paragraph 2
-Subparagraph (f)(1)
-Publisher FASB
-URI https://asc.fasb.org//1943274/2147480016/944-40-65-2
Reference 15: http://www.xbrl.org/2003/role/disclosureRef
-Topic 944
-SubTopic 40
-Name Accounting Standards Codification
-Section 65
-Paragraph 2
-Subparagraph (f)(2)
-Publisher FASB
-URI https://asc.fasb.org//1943274/2147480016/944-40-65-2
Reference 16: http://www.xbrl.org/2003/role/disclosureRef
-Topic 740
-SubTopic 10
-Name Accounting Standards Codification
-Section 65
-Paragraph 8
-Subparagraph (d)(2)
-Publisher FASB
-URI https://asc.fasb.org//1943274/2147482615/740-10-65-8
Reference 17: http://www.xbrl.org/2003/role/disclosureRef
-Topic 740
-SubTopic 10
-Name Accounting Standards Codification
-Section 65
-Paragraph 8
-Subparagraph (d)(3)
-Publisher FASB
-URI https://asc.fasb.org//1943274/2147482615/740-10-65-8
Reference 18: http://www.xbrl.org/2003/role/disclosureRef
-Topic 326
-SubTopic 10
-Name Accounting Standards Codification
-Section 65
-Paragraph 4
-Subparagraph (d)
-Publisher FASB
-URI https://asc.fasb.org//1943274/2147479654/326-10-65-4
Reference 19: http://www.xbrl.org/2003/role/disclosureRef
-Topic 718
-SubTopic 10
-Name Accounting Standards Codification
-Section 65
-Paragraph 15
-Subparagraph (e)
-Publisher FASB
-URI https://asc.fasb.org//1943274/2147480336/718-10-65-15
Reference 20: http://www.xbrl.org/2003/role/disclosureRef
-Topic 718
-SubTopic 10
-Name Accounting Standards Codification
-Section 65
-Paragraph 15
-Subparagraph (f)(1)
-Publisher FASB
-URI https://asc.fasb.org//1943274/2147480336/718-10-65-15
Reference 21: http://www.xbrl.org/2003/role/disclosureRef
-Topic 718
-SubTopic 10
-Name Accounting Standards Codification
-Section 65
-Paragraph 15
-Subparagraph (f)(2)
-Publisher FASB
-URI https://asc.fasb.org//1943274/2147480336/718-10-65-15
Reference 22: http://www.xbrl.org/2003/role/disclosureRef
-Topic 250
-SubTopic 10
-Name Accounting Standards Codification
-Section 50
-Paragraph 1
-Subparagraph (b)(3)
-Publisher FASB
-URI https://asc.fasb.org//1943274/2147483443/250-10-50-1
Reference 23: http://www.xbrl.org/2003/role/disclosureRef
-Topic 815
-SubTopic 40
-Name Accounting Standards Codification
-Section 65
-Paragraph 1
-Subparagraph (e)(3)
-Publisher FASB
-URI https://asc.fasb.org//1943274/2147480175/815-40-65-1
Reference 24: http://www.xbrl.org/2003/role/disclosureRef
-Topic 250
-SubTopic 10
-Name Accounting Standards Codification
-Section 50
-Paragraph 7
-Subparagraph (b)
-Publisher FASB
-URI https://asc.fasb.org//1943274/2147483443/250-10-50-7
Reference 25: http://www.xbrl.org/2003/role/disclosureRef
-Topic 220
-SubTopic 10
-Name Accounting Standards Codification
-Section 50
-Paragraph 5
-Publisher FASB
-URI https://asc.fasb.org//1943274/2147482765/220-10-50-5
Reference 26: http://www.xbrl.org/2003/role/disclosureRef
-Topic 830
-SubTopic 30
-Name Accounting Standards Codification
-Section 50
-Paragraph 1
-Publisher FASB
-URI https://asc.fasb.org//1943274/2147481674/830-30-50-1
Reference 27: http://www.xbrl.org/2003/role/disclosureRef
-Topic 830
-SubTopic 30
-Name Accounting Standards Codification
-Section 45
-Paragraph 17
-Publisher FASB
-URI https://asc.fasb.org//1943274/2147481694/830-30-45-17
Reference 28: http://www.xbrl.org/2003/role/disclosureRef
-Topic 830
-SubTopic 30
-Name Accounting Standards Codification
-Section 45
-Paragraph 20
-Subparagraph (a)
-Publisher FASB
-URI https://asc.fasb.org//1943274/2147481694/830-30-45-20
Reference 29: http://www.xbrl.org/2003/role/exampleRef
-Topic 946
-SubTopic 830
-Name Accounting Standards Codification
-Section 55
-Paragraph 11
-Publisher FASB
-URI https://asc.fasb.org//1943274/2147480167/946-830-55-11
Reference 30: http://www.xbrl.org/2003/role/disclosureRef
-Topic 946
-SubTopic 205
-Name Accounting Standards Codification
-Section 45
-Paragraph 3
-Publisher FASB
-URI https://asc.fasb.org//1943274/2147480767/946-205-45-3
Reference 31: http://www.xbrl.org/2003/role/disclosureRef
-Topic 946
-SubTopic 505
-Name Accounting Standards Codification
-Section 50
-Paragraph 3
-Publisher FASB
-URI https://asc.fasb.org//1943274/2147481004/946-505-50-3
Reference 32: http://www.xbrl.org/2003/role/disclosureRef
-Topic 946
-SubTopic 210
-Name Accounting Standards Codification
-Section S99
-Paragraph 1
-Subparagraph (SX 210.6-04(19))
-Publisher FASB
-URI https://asc.fasb.org//1943274/2147479617/946-210-S99-1
Reference 33: http://www.xbrl.org/2003/role/disclosureRef
-Topic 946
-SubTopic 210
-Name Accounting Standards Codification
-Section S99
-Paragraph 2
-Subparagraph (SX 210.6-05(4))
-Publisher FASB
-URI https://asc.fasb.org//1943274/2147479617/946-210-S99-2
Reference 34: http://www.xbrl.org/2009/role/commonPracticeRef
-Topic 946
-SubTopic 220
-Name Accounting Standards Codification
-Section S99
-Paragraph 3
-Subparagraph (SX 210.6-09(4)(b))
-Publisher FASB
-URI https://asc.fasb.org//1943274/2147483575/946-220-S99-3
Reference 35: http://www.xbrl.org/2003/role/disclosureRef
-Topic 946
-SubTopic 220
-Name Accounting Standards Codification
-Section S99
-Paragraph 3
-Subparagraph (SX 210.6-09(6))
-Publisher FASB
-URI https://asc.fasb.org//1943274/2147483575/946-220-S99-3
Reference 36: http://www.xbrl.org/2003/role/disclosureRef
-Topic 946
-SubTopic 220
-Name Accounting Standards Codification
-Section S99
-Paragraph 3
-Subparagraph (SX 210.6-09(7))
-Publisher FASB
-URI https://asc.fasb.org//1943274/2147483575/946-220-S99-3
Reference 37: http://www.xbrl.org/2003/role/disclosureRef
-Topic 505
-SubTopic 10
-Name Accounting Standards Codification
-Section S99
-Paragraph 1
-Subparagraph (SX 210.3-04)
-Publisher FASB
-URI https://asc.fasb.org//1943274/2147480008/505-10-S99-1
Reference 38: http://www.xbrl.org/2009/role/commonPracticeRef
-Topic 235
-SubTopic 10
-Name Accounting Standards Codification
-Section S99
-Paragraph 1
-Subparagraph (SX 210.4-08(g)(1)(ii))
-Publisher FASB
-URI https://asc.fasb.org//1943274/2147480678/235-10-S99-1
Reference 39: http://www.xbrl.org/2009/role/commonPracticeRef
-Topic 323
-SubTopic 10
-Name Accounting Standards Codification
-Section 50
-Paragraph 3
-Subparagraph (c)
-Publisher FASB
-URI https://asc.fasb.org//1943274/2147481687/323-10-50-3
Reference 40: http://www.xbrl.org/2009/role/commonPracticeRef
-Topic 825
-SubTopic 10
-Name Accounting Standards Codification
-Section 50
-Paragraph 28
-Subparagraph (f)
-Publisher FASB
-URI https://asc.fasb.org//1943274/2147482907/825-10-50-28
Reference 41: http://fasb.org/us-gaap/role/ref/legacyRef
-Name Accounting Standards Codification
-Topic 810
-SubTopic 10
-Section 45
-Paragraph 15
-Publisher FASB
-URI https://asc.fasb.org//1943274/2147481231/810-10-45-15
Reference 42: http://fasb.org/us-gaap/role/ref/legacyRef
-Name Accounting Standards Codification
-Topic 810
-SubTopic 10
-Section 45
-Paragraph 16
-Publisher FASB
-URI https://asc.fasb.org//1943274/2147481231/810-10-45-16
Reference 43: http://fasb.org/us-gaap/role/ref/legacyRef
-Name Accounting Standards Codification
-Topic 810
-SubTopic 10
-Section 55
-Paragraph 4I
-Publisher FASB
-URI https://asc.fasb.org//1943274/2147481175/810-10-55-4I
| Name: |
us-gaap_StockholdersEquityIncludingPortionAttributableToNoncontrollingInterest |
| Namespace Prefix: |
us-gaap_ |
| Data Type: |
xbrli:monetaryItemType |
| Balance Type: |
credit |
| Period Type: |
instant |
|
| X |
- References
+ Details
| Name: |
us-gaap_StockholdersEquityIncludingPortionAttributableToNoncontrollingInterestAbstract |
| Namespace Prefix: |
us-gaap_ |
| Data Type: |
xbrli:stringItemType |
| Balance Type: |
na |
| Period Type: |
duration |
|
v3.23.3
Consolidated Balance Sheets (Parenthetical) - $ / shares
|
Sep. 30, 2023 |
Dec. 31, 2022 |
| Statement of Financial Position [Abstract] |
|
|
| Common stock, par value (in usd per share) |
$ 0.01
|
$ 0.01
|
| Common stock, authorized (in shares) |
750,000,000
|
750,000,000
|
| Common Stock, outstanding (in shares) |
166,737,730
|
175,809,682
|
| X |
- DefinitionFace amount or stated value per share of common stock. Reference 1: http://fasb.org/us-gaap/role/ref/legacyRef
-Topic 210
-SubTopic 10
-Name Accounting Standards Codification
-Section S99
-Paragraph 1
-Subparagraph (SX 210.5-02(29))
-Publisher FASB
-URI https://asc.fasb.org//1943274/2147480566/210-10-S99-1
| Name: |
us-gaap_CommonStockParOrStatedValuePerShare |
| Namespace Prefix: |
us-gaap_ |
| Data Type: |
dtr-types:perShareItemType |
| Balance Type: |
na |
| Period Type: |
instant |
|
| X |
- DefinitionThe maximum number of common shares permitted to be issued by an entity's charter and bylaws. Reference 1: http://www.xbrl.org/2003/role/disclosureRef
-Topic 946
-SubTopic 210
-Name Accounting Standards Codification
-Section S99
-Paragraph 1
-Subparagraph (SX 210.6-04(16)(a))
-Publisher FASB
-URI https://asc.fasb.org//1943274/2147479617/946-210-S99-1
Reference 2: http://fasb.org/us-gaap/role/ref/legacyRef
-Topic 210
-SubTopic 10
-Name Accounting Standards Codification
-Section S99
-Paragraph 1
-Subparagraph (SX 210.5-02(29))
-Publisher FASB
-URI https://asc.fasb.org//1943274/2147480566/210-10-S99-1
| Name: |
us-gaap_CommonStockSharesAuthorized |
| Namespace Prefix: |
us-gaap_ |
| Data Type: |
xbrli:sharesItemType |
| Balance Type: |
na |
| Period Type: |
instant |
|
| X |
- DefinitionNumber of shares of common stock outstanding. Common stock represent the ownership interest in a corporation. Reference 1: http://fasb.org/us-gaap/role/ref/legacyRef
-Name Accounting Standards Codification
-Section 50
-Paragraph 2
-SubTopic 10
-Topic 505
-Publisher FASB
-URI https://asc.fasb.org//1943274/2147481112/505-10-50-2
Reference 2: http://www.xbrl.org/2003/role/disclosureRef
-Topic 946
-SubTopic 210
-Name Accounting Standards Codification
-Section S99
-Paragraph 2
-Subparagraph (SX 210.6-05(4))
-Publisher FASB
-URI https://asc.fasb.org//1943274/2147479617/946-210-S99-2
Reference 3: http://www.xbrl.org/2009/role/commonPracticeRef
-Topic 946
-SubTopic 220
-Name Accounting Standards Codification
-Section S99
-Paragraph 3
-Subparagraph (SX 210.6-09(4)(b))
-Publisher FASB
-URI https://asc.fasb.org//1943274/2147483575/946-220-S99-3
Reference 4: http://www.xbrl.org/2003/role/disclosureRef
-Topic 946
-SubTopic 210
-Name Accounting Standards Codification
-Section S99
-Paragraph 1
-Subparagraph (SX 210.6-04(16)(a))
-Publisher FASB
-URI https://asc.fasb.org//1943274/2147479617/946-210-S99-1
Reference 5: http://www.xbrl.org/2009/role/commonPracticeRef
-Topic 946
-SubTopic 220
-Name Accounting Standards Codification
-Section S99
-Paragraph 3
-Subparagraph (SX 210.6-09(7))
-Publisher FASB
-URI https://asc.fasb.org//1943274/2147483575/946-220-S99-3
Reference 6: http://fasb.org/us-gaap/role/ref/legacyRef
-Topic 210
-SubTopic 10
-Name Accounting Standards Codification
-Section S99
-Paragraph 1
-Subparagraph (SX 210.5-02(29))
-Publisher FASB
-URI https://asc.fasb.org//1943274/2147480566/210-10-S99-1
| Name: |
us-gaap_CommonStockSharesOutstanding |
| Namespace Prefix: |
us-gaap_ |
| Data Type: |
xbrli:sharesItemType |
| Balance Type: |
na |
| Period Type: |
instant |
|
| X |
- References
+ Details
| Name: |
us-gaap_StatementOfFinancialPositionAbstract |
| Namespace Prefix: |
us-gaap_ |
| Data Type: |
xbrli:stringItemType |
| Balance Type: |
na |
| Period Type: |
duration |
|
v3.23.3
Consolidated Statements of Operations - USD ($)
$ in Thousands |
3 Months Ended |
9 Months Ended |
Sep. 30, 2023 |
Sep. 30, 2022 |
Sep. 30, 2023 |
Sep. 30, 2022 |
| Revenues |
|
|
|
|
| Total revenues |
$ 255,409
|
$ 253,663
|
$ 761,209
|
$ 739,515
|
| Operating Expenses |
|
|
|
|
| General and administrative expenses |
12,826
|
11,272
|
34,698
|
34,173
|
| Depreciation and amortization |
122,022
|
96,276
|
336,771
|
279,588
|
| Total operating expenses |
226,735
|
195,862
|
642,200
|
561,496
|
| Other income |
6,229
|
1,649
|
12,561
|
2,490
|
| Other expenses |
(175)
|
(199)
|
(820)
|
(561)
|
| Income from unconsolidated Fund |
290
|
356
|
1,177
|
921
|
| Interest expense |
(56,043)
|
(38,394)
|
(151,859)
|
(109,560)
|
| Net (loss) income |
(21,025)
|
21,213
|
(19,932)
|
71,309
|
| Net loss attributable to noncontrolling interests |
7,663
|
1,742
|
17,681
|
1,534
|
| Net (loss) income attributable to common stockholders |
$ (13,362)
|
$ 22,955
|
$ (2,251)
|
$ 72,843
|
| Net (loss) income per common share - basic (in usd per share) |
$ (0.08)
|
$ 0.13
|
$ (0.02)
|
$ 0.41
|
| Net (loss) income per common share – diluted (in usd per share) |
$ (0.08)
|
$ 0.13
|
$ (0.02)
|
$ 0.41
|
| Office rental |
|
|
|
|
| Revenues |
|
|
|
|
| Total revenues |
$ 208,823
|
$ 207,927
|
$ 617,614
|
$ 616,744
|
| Operating Expenses |
|
|
|
|
| Operating expenses |
74,631
|
74,653
|
220,261
|
212,006
|
| Office rental | Rental revenues and tenant recoveries |
|
|
|
|
| Revenues |
|
|
|
|
| Total revenues |
181,106
|
182,011
|
535,243
|
542,535
|
| Office rental | Parking and other income |
|
|
|
|
| Revenues |
|
|
|
|
| Total revenues |
27,717
|
25,916
|
82,371
|
74,209
|
| Multifamily rental |
|
|
|
|
| Revenues |
|
|
|
|
| Total revenues |
46,586
|
45,736
|
143,595
|
122,771
|
| Operating Expenses |
|
|
|
|
| Operating expenses |
17,256
|
13,661
|
50,470
|
35,729
|
| Multifamily rental | Parking and other income |
|
|
|
|
| Revenues |
|
|
|
|
| Total revenues |
3,722
|
4,679
|
12,469
|
12,536
|
| Multifamily rental | Rental revenues |
|
|
|
|
| Revenues |
|
|
|
|
| Total revenues |
$ 42,864
|
$ 41,057
|
$ 131,126
|
$ 110,235
|
| X |
- DefinitionThe aggregate cost of goods produced and sold and services rendered during the reporting period. Reference 1: http://www.xbrl.org/2003/role/disclosureRef
-Topic 235
-SubTopic 10
-Name Accounting Standards Codification
-Section S99
-Paragraph 1
-Subparagraph (SX 210.4-08(g)(1)(ii))
-Publisher FASB
-URI https://asc.fasb.org//1943274/2147480678/235-10-S99-1
Reference 2: http://www.xbrl.org/2003/role/disclosureRef
-Topic 323
-SubTopic 10
-Name Accounting Standards Codification
-Section 50
-Paragraph 3
-Subparagraph (c)
-Publisher FASB
-URI https://asc.fasb.org//1943274/2147481687/323-10-50-3
Reference 3: http://www.xbrl.org/2003/role/disclosureRef
-Topic 825
-SubTopic 10
-Name Accounting Standards Codification
-Section 50
-Paragraph 28
-Subparagraph (f)
-Publisher FASB
-URI https://asc.fasb.org//1943274/2147482907/825-10-50-28
Reference 4: http://www.xbrl.org/2003/role/disclosureRef
-Topic 470
-SubTopic 10
-Name Accounting Standards Codification
-Section S99
-Paragraph 1A
-Subparagraph (SX 210.13-01(a)(4)(i))
-Publisher FASB
-URI https://asc.fasb.org//1943274/2147480097/470-10-S99-1A
Reference 5: http://www.xbrl.org/2009/role/commonPracticeRef
-Topic 470
-SubTopic 10
-Name Accounting Standards Codification
-Section S99
-Paragraph 1A
-Subparagraph (SX 210.13-01(a)(4)(ii))
-Publisher FASB
-URI https://asc.fasb.org//1943274/2147480097/470-10-S99-1A
Reference 6: http://www.xbrl.org/2003/role/disclosureRef
-Topic 470
-SubTopic 10
-Name Accounting Standards Codification
-Section S99
-Paragraph 1A
-Subparagraph (SX 210.13-01(a)(4)(iii)(A))
-Publisher FASB
-URI https://asc.fasb.org//1943274/2147480097/470-10-S99-1A
Reference 7: http://www.xbrl.org/2003/role/disclosureRef
-Topic 470
-SubTopic 10
-Name Accounting Standards Codification
-Section S99
-Paragraph 1A
-Subparagraph (SX 210.13-01(a)(4)(iv))
-Publisher FASB
-URI https://asc.fasb.org//1943274/2147480097/470-10-S99-1A
Reference 8: http://www.xbrl.org/2003/role/disclosureRef
-Topic 470
-SubTopic 10
-Name Accounting Standards Codification
-Section S99
-Paragraph 1A
-Subparagraph (SX 210.13-01(a)(5))
-Publisher FASB
-URI https://asc.fasb.org//1943274/2147480097/470-10-S99-1A
Reference 9: http://www.xbrl.org/2003/role/disclosureRef
-Topic 470
-SubTopic 10
-Name Accounting Standards Codification
-Section S99
-Paragraph 1B
-Subparagraph (SX 210.13-02(a)(4)(i))
-Publisher FASB
-URI https://asc.fasb.org//1943274/2147480097/470-10-S99-1B
Reference 10: http://www.xbrl.org/2003/role/disclosureRef
-Topic 470
-SubTopic 10
-Name Accounting Standards Codification
-Section S99
-Paragraph 1B
-Subparagraph (SX 210.13-02(a)(4)(iii)(A))
-Publisher FASB
-URI https://asc.fasb.org//1943274/2147480097/470-10-S99-1B
Reference 11: http://www.xbrl.org/2003/role/disclosureRef
-Topic 470
-SubTopic 10
-Name Accounting Standards Codification
-Section S99
-Paragraph 1B
-Subparagraph (SX 210.13-02(a)(4)(iii)(B))
-Publisher FASB
-URI https://asc.fasb.org//1943274/2147480097/470-10-S99-1B
Reference 12: http://www.xbrl.org/2003/role/disclosureRef
-Topic 470
-SubTopic 10
-Name Accounting Standards Codification
-Section S99
-Paragraph 1B
-Subparagraph (SX 210.13-02(a)(4)(iv))
-Publisher FASB
-URI https://asc.fasb.org//1943274/2147480097/470-10-S99-1B
Reference 13: http://www.xbrl.org/2003/role/disclosureRef
-Topic 470
-SubTopic 10
-Name Accounting Standards Codification
-Section S99
-Paragraph 1B
-Subparagraph (SX 210.13-02(a)(5))
-Publisher FASB
-URI https://asc.fasb.org//1943274/2147480097/470-10-S99-1B
Reference 14: http://fasb.org/us-gaap/role/ref/legacyRef
-Topic 220
-SubTopic 10
-Name Accounting Standards Codification
-Section S99
-Paragraph 2
-Subparagraph (SX 210.5-03.2)
-Publisher FASB
-URI https://asc.fasb.org//1943274/2147483621/220-10-S99-2
| Name: |
us-gaap_CostOfRevenue |
| Namespace Prefix: |
us-gaap_ |
| Data Type: |
xbrli:monetaryItemType |
| Balance Type: |
debit |
| Period Type: |
duration |
|
| X |
- DefinitionTotal costs of sales and operating expenses for the period. Reference 1: http://fasb.org/us-gaap/role/ref/legacyRef
-Topic 220
-SubTopic 10
-Name Accounting Standards Codification
-Section S99
-Paragraph 2
-Subparagraph (SX 210.5-03)
-Publisher FASB
-URI https://asc.fasb.org//1943274/2147483621/220-10-S99-2
| Name: |
us-gaap_CostsAndExpenses |
| Namespace Prefix: |
us-gaap_ |
| Data Type: |
xbrli:monetaryItemType |
| Balance Type: |
debit |
| Period Type: |
duration |
|
| X |
- References
+ Details
| Name: |
us-gaap_CostsAndExpensesAbstract |
| Namespace Prefix: |
us-gaap_ |
| Data Type: |
xbrli:stringItemType |
| Balance Type: |
na |
| Period Type: |
duration |
|
| X |
- DefinitionThe current period expense charged against earnings on long-lived, physical assets not used in production, and which are not intended for resale, to allocate or recognize the cost of such assets over their useful lives; or to record the reduction in book value of an intangible asset over the benefit period of such asset; or to reflect consumption during the period of an asset that is not used in production. Reference 1: http://fasb.org/us-gaap/role/ref/legacyRef
-Name Accounting Standards Codification
-Section 45
-Paragraph 28
-Subparagraph (b)
-SubTopic 10
-Topic 230
-Publisher FASB
-URI https://asc.fasb.org//1943274/2147482740/230-10-45-28
Reference 2: http://fasb.org/us-gaap/role/ref/legacyRef
-Name Accounting Standards Codification
-Topic 360
-SubTopic 10
-Section 50
-Paragraph 1
-Subparagraph (a)
-Publisher FASB
-URI https://asc.fasb.org//1943274/2147482099/360-10-50-1
| Name: |
us-gaap_DepreciationAndAmortization |
| Namespace Prefix: |
us-gaap_ |
| Data Type: |
xbrli:monetaryItemType |
| Balance Type: |
debit |
| Period Type: |
duration |
|
| X |
- DefinitionThe amount of net income (loss) for the period per each share of common stock or unit outstanding during the reporting period. Reference 1: http://www.xbrl.org/2003/role/disclosureRef
-Topic 250
-SubTopic 10
-Name Accounting Standards Codification
-Section 50
-Paragraph 3
-Publisher FASB
-URI https://asc.fasb.org//1943274/2147483443/250-10-50-3
Reference 2: http://www.xbrl.org/2003/role/disclosureRef
-Topic 260
-SubTopic 10
-Name Accounting Standards Codification
-Section 55
-Paragraph 15
-Publisher FASB
-URI https://asc.fasb.org//1943274/2147482635/260-10-55-15
Reference 3: http://www.xbrl.org/2003/role/disclosureRef
-Topic 815
-SubTopic 40
-Name Accounting Standards Codification
-Section 65
-Paragraph 1
-Subparagraph (e)(4)
-Publisher FASB
-URI https://asc.fasb.org//1943274/2147480175/815-40-65-1
Reference 4: http://www.xbrl.org/2003/role/disclosureRef
-Topic 815
-SubTopic 40
-Name Accounting Standards Codification
-Section 65
-Paragraph 1
-Subparagraph (f)
-Publisher FASB
-URI https://asc.fasb.org//1943274/2147480175/815-40-65-1
Reference 5: http://www.xbrl.org/2003/role/disclosureRef
-Topic 250
-SubTopic 10
-Name Accounting Standards Codification
-Section 50
-Paragraph 11
-Subparagraph (a)
-Publisher FASB
-URI https://asc.fasb.org//1943274/2147483443/250-10-50-11
Reference 6: http://www.xbrl.org/2003/role/disclosureRef
-Topic 250
-SubTopic 10
-Name Accounting Standards Codification
-Section 50
-Paragraph 11
-Subparagraph (b)
-Publisher FASB
-URI https://asc.fasb.org//1943274/2147483443/250-10-50-11
Reference 7: http://www.xbrl.org/2003/role/disclosureRef
-Topic 250
-SubTopic 10
-Name Accounting Standards Codification
-Section 50
-Paragraph 7
-Subparagraph (a)
-Publisher FASB
-URI https://asc.fasb.org//1943274/2147483443/250-10-50-7
Reference 8: http://www.xbrl.org/2003/role/disclosureRef
-Topic 260
-SubTopic 10
-Name Accounting Standards Codification
-Section 45
-Paragraph 2
-Publisher FASB
-URI https://asc.fasb.org//1943274/2147482689/260-10-45-2
Reference 9: http://www.xbrl.org/2003/role/disclosureRef
-Topic 260
-SubTopic 10
-Name Accounting Standards Codification
-Section 45
-Paragraph 60B
-Subparagraph (d)
-Publisher FASB
-URI https://asc.fasb.org//1943274/2147482689/260-10-45-60B
Reference 10: http://www.xbrl.org/2003/role/disclosureRef
-Topic 250
-SubTopic 10
-Name Accounting Standards Codification
-Section 50
-Paragraph 4
-Publisher FASB
-URI https://asc.fasb.org//1943274/2147483443/250-10-50-4
Reference 11: http://www.xbrl.org/2003/role/disclosureRef
-Topic 260
-SubTopic 10
-Name Accounting Standards Codification
-Section 50
-Paragraph 1
-Subparagraph (a)
-Publisher FASB
-URI https://asc.fasb.org//1943274/2147482662/260-10-50-1
Reference 12: http://www.xbrl.org/2003/role/disclosureRef
-Topic 260
-SubTopic 10
-Name Accounting Standards Codification
-Section 45
-Paragraph 10
-Publisher FASB
-URI https://asc.fasb.org//1943274/2147482689/260-10-45-10
Reference 13: http://www.xbrl.org/2003/role/disclosureRef
-Topic 220
-SubTopic 10
-Name Accounting Standards Codification
-Section S99
-Paragraph 2
-Subparagraph (SX 210.5-03(25))
-Publisher FASB
-URI https://asc.fasb.org//1943274/2147483621/220-10-S99-2
Reference 14: http://www.xbrl.org/2003/role/disclosureRef
-Topic 942
-SubTopic 220
-Name Accounting Standards Codification
-Section S99
-Paragraph 1
-Subparagraph (SX 210.9-04(27))
-Publisher FASB
-URI https://asc.fasb.org//1943274/2147483589/942-220-S99-1
Reference 15: http://www.xbrl.org/2003/role/disclosureRef
-Topic 944
-SubTopic 220
-Name Accounting Standards Codification
-Section S99
-Paragraph 1
-Subparagraph (SX 210.7-04(23))
-Publisher FASB
-URI https://asc.fasb.org//1943274/2147483586/944-220-S99-1
Reference 16: http://www.xbrl.org/2003/role/exampleRef
-Topic 260
-SubTopic 10
-Name Accounting Standards Codification
-Section 55
-Paragraph 52
-Publisher FASB
-URI https://asc.fasb.org//1943274/2147482635/260-10-55-52
Reference 17: http://www.xbrl.org/2003/role/disclosureRef
-Topic 260
-SubTopic 10
-Name Accounting Standards Codification
-Section 45
-Paragraph 7
-Publisher FASB
-URI https://asc.fasb.org//1943274/2147482689/260-10-45-7
| Name: |
us-gaap_EarningsPerShareBasic |
| Namespace Prefix: |
us-gaap_ |
| Data Type: |
dtr-types:perShareItemType |
| Balance Type: |
na |
| Period Type: |
duration |
|
| X |
- DefinitionThe amount of net income (loss) for the period available to each share of common stock or common unit outstanding during the reporting period and to each share or unit that would have been outstanding assuming the issuance of common shares or units for all dilutive potential common shares or units outstanding during the reporting period. Reference 1: http://www.xbrl.org/2003/role/disclosureRef
-Topic 250
-SubTopic 10
-Name Accounting Standards Codification
-Section 50
-Paragraph 3
-Publisher FASB
-URI https://asc.fasb.org//1943274/2147483443/250-10-50-3
Reference 2: http://www.xbrl.org/2003/role/disclosureRef
-Topic 260
-SubTopic 10
-Name Accounting Standards Codification
-Section 55
-Paragraph 15
-Publisher FASB
-URI https://asc.fasb.org//1943274/2147482635/260-10-55-15
Reference 3: http://www.xbrl.org/2003/role/disclosureRef
-Topic 815
-SubTopic 40
-Name Accounting Standards Codification
-Section 65
-Paragraph 1
-Subparagraph (e)(4)
-Publisher FASB
-URI https://asc.fasb.org//1943274/2147480175/815-40-65-1
Reference 4: http://www.xbrl.org/2003/role/disclosureRef
-Topic 815
-SubTopic 40
-Name Accounting Standards Codification
-Section 65
-Paragraph 1
-Subparagraph (f)
-Publisher FASB
-URI https://asc.fasb.org//1943274/2147480175/815-40-65-1
Reference 5: http://www.xbrl.org/2003/role/disclosureRef
-Topic 250
-SubTopic 10
-Name Accounting Standards Codification
-Section 50
-Paragraph 11
-Subparagraph (a)
-Publisher FASB
-URI https://asc.fasb.org//1943274/2147483443/250-10-50-11
Reference 6: http://www.xbrl.org/2003/role/disclosureRef
-Topic 250
-SubTopic 10
-Name Accounting Standards Codification
-Section 50
-Paragraph 11
-Subparagraph (b)
-Publisher FASB
-URI https://asc.fasb.org//1943274/2147483443/250-10-50-11
Reference 7: http://www.xbrl.org/2003/role/disclosureRef
-Topic 250
-SubTopic 10
-Name Accounting Standards Codification
-Section 50
-Paragraph 7
-Subparagraph (a)
-Publisher FASB
-URI https://asc.fasb.org//1943274/2147483443/250-10-50-7
Reference 8: http://www.xbrl.org/2003/role/disclosureRef
-Topic 260
-SubTopic 10
-Name Accounting Standards Codification
-Section 45
-Paragraph 2
-Publisher FASB
-URI https://asc.fasb.org//1943274/2147482689/260-10-45-2
Reference 9: http://www.xbrl.org/2003/role/disclosureRef
-Topic 260
-SubTopic 10
-Name Accounting Standards Codification
-Section 45
-Paragraph 60B
-Subparagraph (d)
-Publisher FASB
-URI https://asc.fasb.org//1943274/2147482689/260-10-45-60B
Reference 10: http://www.xbrl.org/2003/role/disclosureRef
-Topic 250
-SubTopic 10
-Name Accounting Standards Codification
-Section 50
-Paragraph 4
-Publisher FASB
-URI https://asc.fasb.org//1943274/2147483443/250-10-50-4
Reference 11: http://www.xbrl.org/2003/role/disclosureRef
-Topic 260
-SubTopic 10
-Name Accounting Standards Codification
-Section 50
-Paragraph 1
-Subparagraph (a)
-Publisher FASB
-URI https://asc.fasb.org//1943274/2147482662/260-10-50-1
Reference 12: http://www.xbrl.org/2003/role/disclosureRef
-Topic 220
-SubTopic 10
-Name Accounting Standards Codification
-Section S99
-Paragraph 2
-Subparagraph (SX 210.5-03(25))
-Publisher FASB
-URI https://asc.fasb.org//1943274/2147483621/220-10-S99-2
Reference 13: http://www.xbrl.org/2003/role/disclosureRef
-Topic 942
-SubTopic 220
-Name Accounting Standards Codification
-Section S99
-Paragraph 1
-Subparagraph (SX 210.9-04(27))
-Publisher FASB
-URI https://asc.fasb.org//1943274/2147483589/942-220-S99-1
Reference 14: http://www.xbrl.org/2003/role/disclosureRef
-Topic 944
-SubTopic 220
-Name Accounting Standards Codification
-Section S99
-Paragraph 1
-Subparagraph (SX 210.7-04(23))
-Publisher FASB
-URI https://asc.fasb.org//1943274/2147483586/944-220-S99-1
Reference 15: http://www.xbrl.org/2003/role/exampleRef
-Topic 260
-SubTopic 10
-Name Accounting Standards Codification
-Section 55
-Paragraph 52
-Publisher FASB
-URI https://asc.fasb.org//1943274/2147482635/260-10-55-52
Reference 16: http://www.xbrl.org/2003/role/disclosureRef
-Topic 260
-SubTopic 10
-Name Accounting Standards Codification
-Section 45
-Paragraph 7
-Publisher FASB
-URI https://asc.fasb.org//1943274/2147482689/260-10-45-7
| Name: |
us-gaap_EarningsPerShareDiluted |
| Namespace Prefix: |
us-gaap_ |
| Data Type: |
dtr-types:perShareItemType |
| Balance Type: |
na |
| Period Type: |
duration |
|
| X |
- DefinitionThe aggregate total of expenses of managing and administering the affairs of an entity, including affiliates of the reporting entity, which are not directly or indirectly associated with the manufacture, sale or creation of a product or product line. Reference 1: http://www.xbrl.org/2003/role/disclosureRef
-Topic 946
-SubTopic 220
-Name Accounting Standards Codification
-Section S99
-Paragraph 1
-Subparagraph (SX 210.6-07(2)(a))
-Publisher FASB
-URI https://asc.fasb.org//1943274/2147483575/946-220-S99-1
Reference 2: http://fasb.org/us-gaap/role/ref/legacyRef
-Topic 220
-SubTopic 10
-Name Accounting Standards Codification
-Section S99
-Paragraph 2
-Subparagraph (SX 210.5-03.4)
-Publisher FASB
-URI https://asc.fasb.org//1943274/2147483621/220-10-S99-2
| Name: |
us-gaap_GeneralAndAdministrativeExpense |
| Namespace Prefix: |
us-gaap_ |
| Data Type: |
xbrli:monetaryItemType |
| Balance Type: |
debit |
| Period Type: |
duration |
|
| X |
- DefinitionAmount of income (loss) for proportionate share of equity method investee's income (loss). Reference 1: http://fasb.org/us-gaap/role/ref/legacyRef
-Name Accounting Standards Codification
-Section 45
-Paragraph 28
-Subparagraph (b)
-SubTopic 10
-Topic 230
-Publisher FASB
-URI https://asc.fasb.org//1943274/2147482740/230-10-45-28
Reference 2: http://www.xbrl.org/2003/role/disclosureRef
-Topic 944
-SubTopic 220
-Name Accounting Standards Codification
-Section S99
-Paragraph 1
-Subparagraph (SX 210.7-04(10))
-Publisher FASB
-URI https://asc.fasb.org//1943274/2147483586/944-220-S99-1
Reference 3: http://www.xbrl.org/2003/role/disclosureRef
-Topic 323
-SubTopic 10
-Name Accounting Standards Codification
-Section 45
-Paragraph 1
-Publisher FASB
-URI https://asc.fasb.org//1943274/2147481664/323-10-45-1
Reference 4: http://www.xbrl.org/2003/role/disclosureRef
-Topic 280
-SubTopic 10
-Name Accounting Standards Codification
-Section 50
-Paragraph 22
-Subparagraph (g)
-Publisher FASB
-URI https://asc.fasb.org//1943274/2147482810/280-10-50-22
Reference 5: http://fasb.org/us-gaap/role/ref/legacyRef
-Topic 220
-SubTopic 10
-Name Accounting Standards Codification
-Section S99
-Paragraph 2
-Subparagraph (SX 210.5-03(12))
-Publisher FASB
-URI https://asc.fasb.org//1943274/2147483621/220-10-S99-2
Reference 6: http://fasb.org/us-gaap/role/ref/legacyRef
-Topic 942
-SubTopic 220
-Name Accounting Standards Codification
-Section S99
-Paragraph 1
-Subparagraph (SX 210.9-04(13)(f))
-Publisher FASB
-URI https://asc.fasb.org//1943274/2147483589/942-220-S99-1
| Name: |
us-gaap_IncomeLossFromEquityMethodInvestments |
| Namespace Prefix: |
us-gaap_ |
| Data Type: |
xbrli:monetaryItemType |
| Balance Type: |
credit |
| Period Type: |
duration |
|
| X |
- DefinitionAmount of the cost of borrowed funds accounted for as interest expense. Reference 1: http://www.xbrl.org/2003/role/exampleRef
-Topic 946
-SubTopic 830
-Name Accounting Standards Codification
-Section 55
-Paragraph 10
-Publisher FASB
-URI https://asc.fasb.org//1943274/2147480167/946-830-55-10
Reference 2: http://www.xbrl.org/2009/role/commonPracticeRef
-Topic 946
-SubTopic 220
-Name Accounting Standards Codification
-Section 45
-Paragraph 3
-Subparagraph (i)
-Publisher FASB
-URI https://asc.fasb.org//1943274/2147483581/946-220-45-3
Reference 3: http://www.xbrl.org/2003/role/disclosureRef
-Topic 946
-SubTopic 220
-Name Accounting Standards Codification
-Section S99
-Paragraph 1
-Subparagraph (SX 210.6-07(3))
-Publisher FASB
-URI https://asc.fasb.org//1943274/2147483575/946-220-S99-1
Reference 4: http://www.xbrl.org/2003/role/disclosureRef
-Topic 280
-SubTopic 10
-Name Accounting Standards Codification
-Section 50
-Paragraph 22
-Subparagraph (d)
-Publisher FASB
-URI https://asc.fasb.org//1943274/2147482810/280-10-50-22
Reference 5: http://fasb.org/us-gaap/role/ref/legacyRef
-Name Accounting Standards Codification
-Topic 835
-SubTopic 30
-Section 45
-Paragraph 3
-Publisher FASB
-URI https://asc.fasb.org//1943274/2147482925/835-30-45-3
Reference 6: http://fasb.org/us-gaap/role/ref/legacyRef
-Topic 942
-SubTopic 220
-Name Accounting Standards Codification
-Section S99
-Paragraph 1
-Subparagraph (SX 210.9-04.9)
-Publisher FASB
-URI https://asc.fasb.org//1943274/2147483589/942-220-S99-1
Reference 7: http://www.xbrl.org/2003/role/disclosureRef
-Topic 220
-SubTopic 10
-Name Accounting Standards Codification
-Section S99
-Paragraph 2
-Subparagraph (210.5-03(11))
-Publisher FASB
-URI https://asc.fasb.org//1943274/2147483621/220-10-S99-2
Reference 8: http://www.xbrl.org/2003/role/disclosureRef
-Topic 835
-SubTopic 20
-Name Accounting Standards Codification
-Section 50
-Paragraph 1
-Subparagraph (a)
-Publisher FASB
-URI https://asc.fasb.org//1943274/2147483013/835-20-50-1
| Name: |
us-gaap_InterestExpense |
| Namespace Prefix: |
us-gaap_ |
| Data Type: |
xbrli:monetaryItemType |
| Balance Type: |
debit |
| Period Type: |
duration |
|
| X |
- DefinitionThe portion of profit or loss for the period, net of income taxes, which is attributable to the parent. Reference 1: http://www.xbrl.org/2003/role/disclosureRef
-Topic 235
-SubTopic 10
-Name Accounting Standards Codification
-Section S99
-Paragraph 1
-Subparagraph (SX 210.4-08(g)(1)(ii))
-Publisher FASB
-URI https://asc.fasb.org//1943274/2147480678/235-10-S99-1
Reference 2: http://www.xbrl.org/2003/role/disclosureRef
-Topic 323
-SubTopic 10
-Name Accounting Standards Codification
-Section 50
-Paragraph 3
-Subparagraph (c)
-Publisher FASB
-URI https://asc.fasb.org//1943274/2147481687/323-10-50-3
Reference 3: http://www.xbrl.org/2003/role/disclosureRef
-Topic 825
-SubTopic 10
-Name Accounting Standards Codification
-Section 50
-Paragraph 28
-Subparagraph (f)
-Publisher FASB
-URI https://asc.fasb.org//1943274/2147482907/825-10-50-28
Reference 4: http://www.xbrl.org/2003/role/disclosureRef
-Topic 220
-SubTopic 10
-Name Accounting Standards Codification
-Section 50
-Paragraph 6
-Publisher FASB
-URI https://asc.fasb.org//1943274/2147482765/220-10-50-6
Reference 5: http://www.xbrl.org/2003/role/disclosureRef
-Topic 250
-SubTopic 10
-Name Accounting Standards Codification
-Section 50
-Paragraph 3
-Publisher FASB
-URI https://asc.fasb.org//1943274/2147483443/250-10-50-3
Reference 6: http://www.xbrl.org/2003/role/disclosureRef
-Topic 250
-SubTopic 10
-Name Accounting Standards Codification
-Section 50
-Paragraph 1
-Subparagraph (b)(2)
-Publisher FASB
-URI https://asc.fasb.org//1943274/2147483443/250-10-50-1
Reference 7: http://www.xbrl.org/2003/role/disclosureRef
-Topic 815
-SubTopic 40
-Name Accounting Standards Codification
-Section 65
-Paragraph 1
-Subparagraph (f)
-Publisher FASB
-URI https://asc.fasb.org//1943274/2147480175/815-40-65-1
Reference 8: http://www.xbrl.org/2003/role/disclosureRef
-Topic 250
-SubTopic 10
-Name Accounting Standards Codification
-Section 50
-Paragraph 8
-Publisher FASB
-URI https://asc.fasb.org//1943274/2147483443/250-10-50-8
Reference 9: http://www.xbrl.org/2003/role/disclosureRef
-Topic 250
-SubTopic 10
-Name Accounting Standards Codification
-Section 50
-Paragraph 9
-Publisher FASB
-URI https://asc.fasb.org//1943274/2147483443/250-10-50-9
Reference 10: http://www.xbrl.org/2003/role/disclosureRef
-Topic 250
-SubTopic 10
-Name Accounting Standards Codification
-Section 50
-Paragraph 11
-Subparagraph (a)
-Publisher FASB
-URI https://asc.fasb.org//1943274/2147483443/250-10-50-11
Reference 11: http://www.xbrl.org/2003/role/disclosureRef
-Topic 250
-SubTopic 10
-Name Accounting Standards Codification
-Section 50
-Paragraph 11
-Subparagraph (b)
-Publisher FASB
-URI https://asc.fasb.org//1943274/2147483443/250-10-50-11
Reference 12: http://www.xbrl.org/2003/role/disclosureRef
-Topic 250
-SubTopic 10
-Name Accounting Standards Codification
-Section 50
-Paragraph 4
-Publisher FASB
-URI https://asc.fasb.org//1943274/2147483443/250-10-50-4
Reference 13: http://www.xbrl.org/2003/role/exampleRef
-Topic 946
-SubTopic 830
-Name Accounting Standards Codification
-Section 55
-Paragraph 10
-Publisher FASB
-URI https://asc.fasb.org//1943274/2147480167/946-830-55-10
Reference 14: http://www.xbrl.org/2003/role/disclosureRef
-Topic 946
-SubTopic 220
-Name Accounting Standards Codification
-Section 45
-Paragraph 7
-Publisher FASB
-URI https://asc.fasb.org//1943274/2147483581/946-220-45-7
Reference 15: http://www.xbrl.org/2003/role/disclosureRef
-Topic 944
-SubTopic 220
-Name Accounting Standards Codification
-Section S99
-Paragraph 1
-Subparagraph (SX 210.7-04(18))
-Publisher FASB
-URI https://asc.fasb.org//1943274/2147483586/944-220-S99-1
Reference 16: http://www.xbrl.org/2003/role/disclosureRef
-Topic 280
-SubTopic 10
-Name Accounting Standards Codification
-Section 50
-Paragraph 22
-Publisher FASB
-URI https://asc.fasb.org//1943274/2147482810/280-10-50-22
Reference 17: http://www.xbrl.org/2003/role/disclosureRef
-Topic 946
-SubTopic 220
-Name Accounting Standards Codification
-Section S99
-Paragraph 1
-Subparagraph (SX 210.6-07(9))
-Publisher FASB
-URI https://asc.fasb.org//1943274/2147483575/946-220-S99-1
Reference 18: http://www.xbrl.org/2003/role/disclosureRef
-Topic 946
-SubTopic 220
-Name Accounting Standards Codification
-Section S99
-Paragraph 3
-Subparagraph (SX 210.6-09(1)(d))
-Publisher FASB
-URI https://asc.fasb.org//1943274/2147483575/946-220-S99-3
Reference 19: http://www.xbrl.org/2003/role/disclosureRef
-Topic 470
-SubTopic 10
-Name Accounting Standards Codification
-Section S99
-Paragraph 1A
-Subparagraph (SX 210.13-01(a)(4)(i))
-Publisher FASB
-URI https://asc.fasb.org//1943274/2147480097/470-10-S99-1A
Reference 20: http://www.xbrl.org/2009/role/commonPracticeRef
-Topic 470
-SubTopic 10
-Name Accounting Standards Codification
-Section S99
-Paragraph 1A
-Subparagraph (SX 210.13-01(a)(4)(ii))
-Publisher FASB
-URI https://asc.fasb.org//1943274/2147480097/470-10-S99-1A
Reference 21: http://www.xbrl.org/2003/role/disclosureRef
-Topic 470
-SubTopic 10
-Name Accounting Standards Codification
-Section S99
-Paragraph 1A
-Subparagraph (SX 210.13-01(a)(4)(iii)(A))
-Publisher FASB
-URI https://asc.fasb.org//1943274/2147480097/470-10-S99-1A
Reference 22: http://www.xbrl.org/2003/role/disclosureRef
-Topic 470
-SubTopic 10
-Name Accounting Standards Codification
-Section S99
-Paragraph 1A
-Subparagraph (SX 210.13-01(a)(4)(iv))
-Publisher FASB
-URI https://asc.fasb.org//1943274/2147480097/470-10-S99-1A
Reference 23: http://www.xbrl.org/2003/role/disclosureRef
-Topic 470
-SubTopic 10
-Name Accounting Standards Codification
-Section S99
-Paragraph 1A
-Subparagraph (SX 210.13-01(a)(5))
-Publisher FASB
-URI https://asc.fasb.org//1943274/2147480097/470-10-S99-1A
Reference 24: http://www.xbrl.org/2003/role/disclosureRef
-Topic 470
-SubTopic 10
-Name Accounting Standards Codification
-Section S99
-Paragraph 1B
-Subparagraph (SX 210.13-02(a)(4)(i))
-Publisher FASB
-URI https://asc.fasb.org//1943274/2147480097/470-10-S99-1B
Reference 25: http://www.xbrl.org/2003/role/disclosureRef
-Topic 470
-SubTopic 10
-Name Accounting Standards Codification
-Section S99
-Paragraph 1B
-Subparagraph (SX 210.13-02(a)(4)(iii)(A))
-Publisher FASB
-URI https://asc.fasb.org//1943274/2147480097/470-10-S99-1B
Reference 26: http://www.xbrl.org/2003/role/disclosureRef
-Topic 470
-SubTopic 10
-Name Accounting Standards Codification
-Section S99
-Paragraph 1B
-Subparagraph (SX 210.13-02(a)(4)(iii)(B))
-Publisher FASB
-URI https://asc.fasb.org//1943274/2147480097/470-10-S99-1B
Reference 27: http://www.xbrl.org/2003/role/disclosureRef
-Topic 470
-SubTopic 10
-Name Accounting Standards Codification
-Section S99
-Paragraph 1B
-Subparagraph (SX 210.13-02(a)(4)(iv))
-Publisher FASB
-URI https://asc.fasb.org//1943274/2147480097/470-10-S99-1B
Reference 28: http://www.xbrl.org/2003/role/disclosureRef
-Topic 470
-SubTopic 10
-Name Accounting Standards Codification
-Section S99
-Paragraph 1B
-Subparagraph (SX 210.13-02(a)(5))
-Publisher FASB
-URI https://asc.fasb.org//1943274/2147480097/470-10-S99-1B
Reference 29: http://www.xbrl.org/2003/role/disclosureRef
-Topic 280
-SubTopic 10
-Name Accounting Standards Codification
-Section 50
-Paragraph 30
-Subparagraph (b)
-Publisher FASB
-URI https://asc.fasb.org//1943274/2147482810/280-10-50-30
Reference 30: http://www.xbrl.org/2003/role/disclosureRef
-Topic 280
-SubTopic 10
-Name Accounting Standards Codification
-Section 50
-Paragraph 32
-Subparagraph (f)
-Publisher FASB
-URI https://asc.fasb.org//1943274/2147482810/280-10-50-32
Reference 31: http://www.xbrl.org/2003/role/disclosureRef
-Topic 260
-SubTopic 10
-Name Accounting Standards Codification
-Section 45
-Paragraph 60B
-Subparagraph (a)
-Publisher FASB
-URI https://asc.fasb.org//1943274/2147482689/260-10-45-60B
Reference 32: http://www.xbrl.org/2003/role/exampleRef
-Topic 280
-SubTopic 10
-Name Accounting Standards Codification
-Section 50
-Paragraph 31
-Publisher FASB
-URI https://asc.fasb.org//1943274/2147482810/280-10-50-31
Reference 33: http://www.xbrl.org/2003/role/disclosureRef
-Topic 280
-SubTopic 10
-Name Accounting Standards Codification
-Section 50
-Paragraph 32
-Subparagraph (c)
-Publisher FASB
-URI https://asc.fasb.org//1943274/2147482810/280-10-50-32
Reference 34: http://www.xbrl.org/2003/role/disclosureRef
-Topic 205
-SubTopic 20
-Name Accounting Standards Codification
-Section 50
-Paragraph 7
-Publisher FASB
-URI https://asc.fasb.org//1943274/2147483499/205-20-50-7
Reference 35: http://fasb.org/us-gaap/role/ref/legacyRef
-Topic 230
-SubTopic 10
-Name Accounting Standards Codification
-Section 45
-Paragraph 28
-Publisher FASB
-URI https://asc.fasb.org//1943274/2147482740/230-10-45-28
Reference 36: http://www.xbrl.org/2003/role/disclosureRef
-Topic 220
-SubTopic 10
-Name Accounting Standards Codification
-Section 45
-Paragraph 1A
-Subparagraph (a)
-Publisher FASB
-URI https://asc.fasb.org//1943274/2147482790/220-10-45-1A
Reference 37: http://www.xbrl.org/2003/role/disclosureRef
-Topic 220
-SubTopic 10
-Name Accounting Standards Codification
-Section 45
-Paragraph 1B
-Subparagraph (a)
-Publisher FASB
-URI https://asc.fasb.org//1943274/2147482790/220-10-45-1B
Reference 38: http://fasb.org/us-gaap/role/ref/legacyRef
-Topic 220
-SubTopic 10
-Name Accounting Standards Codification
-Section S99
-Paragraph 2
-Subparagraph (SX 210.5-03(20))
-Publisher FASB
-URI https://asc.fasb.org//1943274/2147483621/220-10-S99-2
Reference 39: http://fasb.org/us-gaap/role/ref/legacyRef
-Topic 942
-SubTopic 220
-Name Accounting Standards Codification
-Section S99
-Paragraph 1
-Subparagraph (SX 210.9-04(22))
-Publisher FASB
-URI https://asc.fasb.org//1943274/2147483589/942-220-S99-1
| Name: |
us-gaap_NetIncomeLoss |
| Namespace Prefix: |
us-gaap_ |
| Data Type: |
xbrli:monetaryItemType |
| Balance Type: |
credit |
| Period Type: |
duration |
|
| X |
- DefinitionAmount of Net Income (Loss) attributable to noncontrolling interest. Reference 1: http://www.xbrl.org/2003/role/disclosureRef
-Topic 250
-SubTopic 10
-Name Accounting Standards Codification
-Section 50
-Paragraph 8
-Publisher FASB
-URI https://asc.fasb.org//1943274/2147483443/250-10-50-8
Reference 2: http://www.xbrl.org/2003/role/disclosureRef
-Topic 250
-SubTopic 10
-Name Accounting Standards Codification
-Section 50
-Paragraph 9
-Publisher FASB
-URI https://asc.fasb.org//1943274/2147483443/250-10-50-9
Reference 3: http://www.xbrl.org/2003/role/disclosureRef
-Topic 944
-SubTopic 220
-Name Accounting Standards Codification
-Section S99
-Paragraph 1
-Subparagraph (SX 210.7-04(17))
-Publisher FASB
-URI https://asc.fasb.org//1943274/2147483586/944-220-S99-1
Reference 4: http://www.xbrl.org/2009/role/commonPracticeRef
-Topic 220
-SubTopic 10
-Name Accounting Standards Codification
-Section 50
-Paragraph 6
-Publisher FASB
-URI https://asc.fasb.org//1943274/2147482765/220-10-50-6
Reference 5: http://fasb.org/us-gaap/role/ref/legacyRef
-Topic 810
-SubTopic 10
-Name Accounting Standards Codification
-Section 50
-Paragraph 1A
-Subparagraph (a)(2)
-Publisher FASB
-URI https://asc.fasb.org//1943274/2147481203/810-10-50-1A
Reference 6: http://fasb.org/us-gaap/role/ref/legacyRef
-Name Accounting Standards Codification
-Topic 810
-SubTopic 10
-Section 55
-Paragraph 4J
-Publisher FASB
-URI https://asc.fasb.org//1943274/2147481175/810-10-55-4J
Reference 7: http://www.xbrl.org/2003/role/disclosureRef
-Topic 220
-SubTopic 10
-Name Accounting Standards Codification
-Section 45
-Paragraph 1A
-Subparagraph (a)
-Publisher FASB
-URI https://asc.fasb.org//1943274/2147482790/220-10-45-1A
Reference 8: http://www.xbrl.org/2003/role/disclosureRef
-Topic 220
-SubTopic 10
-Name Accounting Standards Codification
-Section 45
-Paragraph 1B
-Subparagraph (a)
-Publisher FASB
-URI https://asc.fasb.org//1943274/2147482790/220-10-45-1B
| Name: |
us-gaap_NetIncomeLossAttributableToNoncontrollingInterest |
| Namespace Prefix: |
us-gaap_ |
| Data Type: |
xbrli:monetaryItemType |
| Balance Type: |
debit |
| Period Type: |
duration |
|
| X |
- DefinitionAmount of expense related to nonoperating activities, classified as other. Reference 1: http://fasb.org/us-gaap/role/ref/legacyRef
-Topic 220
-SubTopic 10
-Name Accounting Standards Codification
-Section S99
-Paragraph 2
-Subparagraph (SX 210.5-03.9)
-Publisher FASB
-URI https://asc.fasb.org//1943274/2147483621/220-10-S99-2
| Name: |
us-gaap_OtherNonoperatingExpense |
| Namespace Prefix: |
us-gaap_ |
| Data Type: |
xbrli:monetaryItemType |
| Balance Type: |
debit |
| Period Type: |
duration |
|
| X |
- DefinitionAmount of income related to nonoperating activities, classified as other. Reference 1: http://www.xbrl.org/2003/role/disclosureRef
-Topic 220
-SubTopic 10
-Name Accounting Standards Codification
-Section S99
-Paragraph 2
-Subparagraph (SX 210.5-03(7)(d))
-Publisher FASB
-URI https://asc.fasb.org//1943274/2147483621/220-10-S99-2
| Name: |
us-gaap_OtherNonoperatingIncome |
| Namespace Prefix: |
us-gaap_ |
| Data Type: |
xbrli:monetaryItemType |
| Balance Type: |
credit |
| Period Type: |
duration |
|
| X |
- DefinitionThe consolidated profit or loss for the period, net of income taxes, including the portion attributable to the noncontrolling interest. Reference 1: http://www.xbrl.org/2003/role/disclosureRef
-Topic 235
-SubTopic 10
-Name Accounting Standards Codification
-Section S99
-Paragraph 1
-Subparagraph (SX 210.4-08(g)(1)(ii))
-Publisher FASB
-URI https://asc.fasb.org//1943274/2147480678/235-10-S99-1
Reference 2: http://www.xbrl.org/2003/role/disclosureRef
-Topic 323
-SubTopic 10
-Name Accounting Standards Codification
-Section 50
-Paragraph 3
-Subparagraph (c)
-Publisher FASB
-URI https://asc.fasb.org//1943274/2147481687/323-10-50-3
Reference 3: http://www.xbrl.org/2003/role/disclosureRef
-Topic 825
-SubTopic 10
-Name Accounting Standards Codification
-Section 50
-Paragraph 28
-Subparagraph (f)
-Publisher FASB
-URI https://asc.fasb.org//1943274/2147482907/825-10-50-28
Reference 4: http://www.xbrl.org/2003/role/disclosureRef
-Topic 250
-SubTopic 10
-Name Accounting Standards Codification
-Section 50
-Paragraph 1
-Subparagraph (b)(2)
-Publisher FASB
-URI https://asc.fasb.org//1943274/2147483443/250-10-50-1
Reference 5: http://www.xbrl.org/2003/role/disclosureRef
-Topic 815
-SubTopic 40
-Name Accounting Standards Codification
-Section 65
-Paragraph 1
-Subparagraph (f)
-Publisher FASB
-URI https://asc.fasb.org//1943274/2147480175/815-40-65-1
Reference 6: http://www.xbrl.org/2003/role/disclosureRef
-Topic 250
-SubTopic 10
-Name Accounting Standards Codification
-Section 50
-Paragraph 8
-Publisher FASB
-URI https://asc.fasb.org//1943274/2147483443/250-10-50-8
Reference 7: http://www.xbrl.org/2003/role/disclosureRef
-Topic 250
-SubTopic 10
-Name Accounting Standards Codification
-Section 50
-Paragraph 9
-Publisher FASB
-URI https://asc.fasb.org//1943274/2147483443/250-10-50-9
Reference 8: http://www.xbrl.org/2003/role/exampleRef
-Topic 946
-SubTopic 830
-Name Accounting Standards Codification
-Section 55
-Paragraph 11
-Publisher FASB
-URI https://asc.fasb.org//1943274/2147480167/946-830-55-11
Reference 9: http://www.xbrl.org/2003/role/disclosureRef
-Topic 946
-SubTopic 205
-Name Accounting Standards Codification
-Section 45
-Paragraph 3
-Subparagraph (a)
-Publisher FASB
-URI https://asc.fasb.org//1943274/2147480767/946-205-45-3
Reference 10: http://www.xbrl.org/2003/role/disclosureRef
-Topic 946
-SubTopic 220
-Name Accounting Standards Codification
-Section 45
-Paragraph 7
-Publisher FASB
-URI https://asc.fasb.org//1943274/2147483581/946-220-45-7
Reference 11: http://www.xbrl.org/2003/role/disclosureRef
-Topic 944
-SubTopic 220
-Name Accounting Standards Codification
-Section S99
-Paragraph 1
-Subparagraph (SX 210.7-04(16))
-Publisher FASB
-URI https://asc.fasb.org//1943274/2147483586/944-220-S99-1
Reference 12: http://www.xbrl.org/2003/role/disclosureRef
-Topic 280
-SubTopic 10
-Name Accounting Standards Codification
-Section 50
-Paragraph 22
-Publisher FASB
-URI https://asc.fasb.org//1943274/2147482810/280-10-50-22
Reference 13: http://www.xbrl.org/2003/role/disclosureRef
-Topic 946
-SubTopic 220
-Name Accounting Standards Codification
-Section S99
-Paragraph 1
-Subparagraph (SX 210.6-07(9))
-Publisher FASB
-URI https://asc.fasb.org//1943274/2147483575/946-220-S99-1
Reference 14: http://www.xbrl.org/2003/role/disclosureRef
-Topic 946
-SubTopic 220
-Name Accounting Standards Codification
-Section S99
-Paragraph 3
-Subparagraph (SX 210.6-09(1)(d))
-Publisher FASB
-URI https://asc.fasb.org//1943274/2147483575/946-220-S99-3
Reference 15: http://www.xbrl.org/2003/role/disclosureRef
-Topic 810
-SubTopic 10
-Name Accounting Standards Codification
-Section 45
-Paragraph 19
-Publisher FASB
-URI https://asc.fasb.org//1943274/2147481231/810-10-45-19
Reference 16: http://www.xbrl.org/2009/role/commonPracticeRef
-Topic 220
-SubTopic 10
-Name Accounting Standards Codification
-Section 50
-Paragraph 6
-Publisher FASB
-URI https://asc.fasb.org//1943274/2147482765/220-10-50-6
Reference 17: http://www.xbrl.org/2003/role/disclosureRef
-Topic 470
-SubTopic 10
-Name Accounting Standards Codification
-Section S99
-Paragraph 1A
-Subparagraph (SX 210.13-01(a)(4)(i))
-Publisher FASB
-URI https://asc.fasb.org//1943274/2147480097/470-10-S99-1A
Reference 18: http://www.xbrl.org/2009/role/commonPracticeRef
-Topic 470
-SubTopic 10
-Name Accounting Standards Codification
-Section S99
-Paragraph 1A
-Subparagraph (SX 210.13-01(a)(4)(ii))
-Publisher FASB
-URI https://asc.fasb.org//1943274/2147480097/470-10-S99-1A
Reference 19: http://www.xbrl.org/2003/role/disclosureRef
-Topic 470
-SubTopic 10
-Name Accounting Standards Codification
-Section S99
-Paragraph 1A
-Subparagraph (SX 210.13-01(a)(4)(iii)(A))
-Publisher FASB
-URI https://asc.fasb.org//1943274/2147480097/470-10-S99-1A
Reference 20: http://www.xbrl.org/2003/role/disclosureRef
-Topic 470
-SubTopic 10
-Name Accounting Standards Codification
-Section S99
-Paragraph 1A
-Subparagraph (SX 210.13-01(a)(4)(iv))
-Publisher FASB
-URI https://asc.fasb.org//1943274/2147480097/470-10-S99-1A
Reference 21: http://www.xbrl.org/2003/role/disclosureRef
-Topic 470
-SubTopic 10
-Name Accounting Standards Codification
-Section S99
-Paragraph 1A
-Subparagraph (SX 210.13-01(a)(5))
-Publisher FASB
-URI https://asc.fasb.org//1943274/2147480097/470-10-S99-1A
Reference 22: http://www.xbrl.org/2003/role/disclosureRef
-Topic 470
-SubTopic 10
-Name Accounting Standards Codification
-Section S99
-Paragraph 1B
-Subparagraph (SX 210.13-02(a)(4)(i))
-Publisher FASB
-URI https://asc.fasb.org//1943274/2147480097/470-10-S99-1B
Reference 23: http://www.xbrl.org/2003/role/disclosureRef
-Topic 470
-SubTopic 10
-Name Accounting Standards Codification
-Section S99
-Paragraph 1B
-Subparagraph (SX 210.13-02(a)(4)(iii)(A))
-Publisher FASB
-URI https://asc.fasb.org//1943274/2147480097/470-10-S99-1B
Reference 24: http://www.xbrl.org/2003/role/disclosureRef
-Topic 470
-SubTopic 10
-Name Accounting Standards Codification
-Section S99
-Paragraph 1B
-Subparagraph (SX 210.13-02(a)(4)(iii)(B))
-Publisher FASB
-URI https://asc.fasb.org//1943274/2147480097/470-10-S99-1B
Reference 25: http://www.xbrl.org/2003/role/disclosureRef
-Topic 470
-SubTopic 10
-Name Accounting Standards Codification
-Section S99
-Paragraph 1B
-Subparagraph (SX 210.13-02(a)(4)(iv))
-Publisher FASB
-URI https://asc.fasb.org//1943274/2147480097/470-10-S99-1B
Reference 26: http://www.xbrl.org/2003/role/disclosureRef
-Topic 470
-SubTopic 10
-Name Accounting Standards Codification
-Section S99
-Paragraph 1B
-Subparagraph (SX 210.13-02(a)(5))
-Publisher FASB
-URI https://asc.fasb.org//1943274/2147480097/470-10-S99-1B
Reference 27: http://www.xbrl.org/2003/role/disclosureRef
-Topic 280
-SubTopic 10
-Name Accounting Standards Codification
-Section 50
-Paragraph 30
-Subparagraph (b)
-Publisher FASB
-URI https://asc.fasb.org//1943274/2147482810/280-10-50-30
Reference 28: http://www.xbrl.org/2003/role/disclosureRef
-Topic 280
-SubTopic 10
-Name Accounting Standards Codification
-Section 50
-Paragraph 32
-Subparagraph (f)
-Publisher FASB
-URI https://asc.fasb.org//1943274/2147482810/280-10-50-32
Reference 29: http://www.xbrl.org/2003/role/exampleRef
-Topic 280
-SubTopic 10
-Name Accounting Standards Codification
-Section 50
-Paragraph 31
-Publisher FASB
-URI https://asc.fasb.org//1943274/2147482810/280-10-50-31
Reference 30: http://www.xbrl.org/2003/role/disclosureRef
-Topic 280
-SubTopic 10
-Name Accounting Standards Codification
-Section 50
-Paragraph 32
-Subparagraph (c)
-Publisher FASB
-URI https://asc.fasb.org//1943274/2147482810/280-10-50-32
Reference 31: http://www.xbrl.org/2003/role/disclosureRef
-Topic 942
-SubTopic 235
-Name Accounting Standards Codification
-Section S99
-Paragraph 1
-Subparagraph (SX 210.9-05(b)(2))
-Publisher FASB
-URI https://asc.fasb.org//1943274/2147479557/942-235-S99-1
Reference 32: http://www.xbrl.org/2003/role/disclosureRef
-Topic 205
-SubTopic 20
-Name Accounting Standards Codification
-Section 50
-Paragraph 7
-Publisher FASB
-URI https://asc.fasb.org//1943274/2147483499/205-20-50-7
Reference 33: http://www.xbrl.org/2003/role/exampleRef
-Topic 810
-SubTopic 10
-Name Accounting Standards Codification
-Section 55
-Paragraph 4J
-Publisher FASB
-URI https://asc.fasb.org//1943274/2147481175/810-10-55-4J
Reference 34: http://www.xbrl.org/2003/role/exampleRef
-Topic 810
-SubTopic 10
-Name Accounting Standards Codification
-Section 55
-Paragraph 4K
-Publisher FASB
-URI https://asc.fasb.org//1943274/2147481175/810-10-55-4K
Reference 35: http://www.xbrl.org/2003/role/disclosureRef
-Topic 220
-SubTopic 10
-Name Accounting Standards Codification
-Section 45
-Paragraph 1A
-Subparagraph (a)
-Publisher FASB
-URI https://asc.fasb.org//1943274/2147482790/220-10-45-1A
Reference 36: http://www.xbrl.org/2003/role/disclosureRef
-Topic 220
-SubTopic 10
-Name Accounting Standards Codification
-Section 45
-Paragraph 1B
-Subparagraph (a)
-Publisher FASB
-URI https://asc.fasb.org//1943274/2147482790/220-10-45-1B
Reference 37: http://www.xbrl.org/2003/role/disclosureRef
-Topic 230
-SubTopic 10
-Name Accounting Standards Codification
-Section 45
-Paragraph 2
-Publisher FASB
-URI https://asc.fasb.org//1943274/2147482740/230-10-45-2
Reference 38: http://www.xbrl.org/2003/role/disclosureRef
-Topic 810
-SubTopic 10
-Name Accounting Standards Codification
-Section 50
-Paragraph 1A
-Subparagraph (a)(1)
-Publisher FASB
-URI https://asc.fasb.org//1943274/2147481203/810-10-50-1A
Reference 39: http://www.xbrl.org/2003/role/disclosureRef
-Topic 810
-SubTopic 10
-Name Accounting Standards Codification
-Section 50
-Paragraph 1A
-Subparagraph (c)(1)
-Publisher FASB
-URI https://asc.fasb.org//1943274/2147481203/810-10-50-1A
| Name: |
us-gaap_ProfitLoss |
| Namespace Prefix: |
us-gaap_ |
| Data Type: |
xbrli:monetaryItemType |
| Balance Type: |
credit |
| Period Type: |
duration |
|
| X |
- DefinitionAmount of revenue recognized from goods sold, services rendered, insurance premiums, or other activities that constitute an earning process. Includes, but is not limited to, investment and interest income before deduction of interest expense when recognized as a component of revenue, and sales and trading gain (loss). Reference 1: http://www.xbrl.org/2003/role/disclosureRef
-Topic 235
-SubTopic 10
-Name Accounting Standards Codification
-Section S99
-Paragraph 1
-Subparagraph (SX 210.4-08(g)(1)(ii))
-Publisher FASB
-URI https://asc.fasb.org//1943274/2147480678/235-10-S99-1
Reference 2: http://www.xbrl.org/2003/role/disclosureRef
-Topic 323
-SubTopic 10
-Name Accounting Standards Codification
-Section 50
-Paragraph 3
-Subparagraph (c)
-Publisher FASB
-URI https://asc.fasb.org//1943274/2147481687/323-10-50-3
Reference 3: http://www.xbrl.org/2003/role/disclosureRef
-Topic 825
-SubTopic 10
-Name Accounting Standards Codification
-Section 50
-Paragraph 28
-Subparagraph (f)
-Publisher FASB
-URI https://asc.fasb.org//1943274/2147482907/825-10-50-28
Reference 4: http://www.xbrl.org/2003/role/disclosureRef
-Topic 220
-SubTopic 10
-Name Accounting Standards Codification
-Section S99
-Paragraph 2
-Subparagraph (SX 210.5-03(1))
-Publisher FASB
-URI https://asc.fasb.org//1943274/2147483621/220-10-S99-2
Reference 5: http://www.xbrl.org/2003/role/disclosureRef
-Topic 470
-SubTopic 10
-Name Accounting Standards Codification
-Section S99
-Paragraph 1A
-Subparagraph (SX 210.13-01(a)(4)(i))
-Publisher FASB
-URI https://asc.fasb.org//1943274/2147480097/470-10-S99-1A
Reference 6: http://www.xbrl.org/2009/role/commonPracticeRef
-Topic 470
-SubTopic 10
-Name Accounting Standards Codification
-Section S99
-Paragraph 1A
-Subparagraph (SX 210.13-01(a)(4)(ii))
-Publisher FASB
-URI https://asc.fasb.org//1943274/2147480097/470-10-S99-1A
Reference 7: http://www.xbrl.org/2003/role/disclosureRef
-Topic 470
-SubTopic 10
-Name Accounting Standards Codification
-Section S99
-Paragraph 1A
-Subparagraph (SX 210.13-01(a)(4)(iii)(A))
-Publisher FASB
-URI https://asc.fasb.org//1943274/2147480097/470-10-S99-1A
Reference 8: http://www.xbrl.org/2003/role/disclosureRef
-Topic 470
-SubTopic 10
-Name Accounting Standards Codification
-Section S99
-Paragraph 1A
-Subparagraph (SX 210.13-01(a)(4)(iv))
-Publisher FASB
-URI https://asc.fasb.org//1943274/2147480097/470-10-S99-1A
Reference 9: http://www.xbrl.org/2003/role/disclosureRef
-Topic 470
-SubTopic 10
-Name Accounting Standards Codification
-Section S99
-Paragraph 1A
-Subparagraph (SX 210.13-01(a)(5))
-Publisher FASB
-URI https://asc.fasb.org//1943274/2147480097/470-10-S99-1A
Reference 10: http://www.xbrl.org/2003/role/disclosureRef
-Topic 470
-SubTopic 10
-Name Accounting Standards Codification
-Section S99
-Paragraph 1B
-Subparagraph (SX 210.13-02(a)(4)(i))
-Publisher FASB
-URI https://asc.fasb.org//1943274/2147480097/470-10-S99-1B
Reference 11: http://www.xbrl.org/2003/role/disclosureRef
-Topic 470
-SubTopic 10
-Name Accounting Standards Codification
-Section S99
-Paragraph 1B
-Subparagraph (SX 210.13-02(a)(4)(iii)(A))
-Publisher FASB
-URI https://asc.fasb.org//1943274/2147480097/470-10-S99-1B
Reference 12: http://www.xbrl.org/2003/role/disclosureRef
-Topic 470
-SubTopic 10
-Name Accounting Standards Codification
-Section S99
-Paragraph 1B
-Subparagraph (SX 210.13-02(a)(4)(iii)(B))
-Publisher FASB
-URI https://asc.fasb.org//1943274/2147480097/470-10-S99-1B
Reference 13: http://www.xbrl.org/2003/role/disclosureRef
-Topic 470
-SubTopic 10
-Name Accounting Standards Codification
-Section S99
-Paragraph 1B
-Subparagraph (SX 210.13-02(a)(4)(iv))
-Publisher FASB
-URI https://asc.fasb.org//1943274/2147480097/470-10-S99-1B
Reference 14: http://www.xbrl.org/2003/role/disclosureRef
-Topic 470
-SubTopic 10
-Name Accounting Standards Codification
-Section S99
-Paragraph 1B
-Subparagraph (SX 210.13-02(a)(5))
-Publisher FASB
-URI https://asc.fasb.org//1943274/2147480097/470-10-S99-1B
Reference 15: http://www.xbrl.org/2003/role/disclosureRef
-Topic 280
-SubTopic 10
-Name Accounting Standards Codification
-Section 50
-Paragraph 30
-Subparagraph (a)
-Publisher FASB
-URI https://asc.fasb.org//1943274/2147482810/280-10-50-30
Reference 16: http://www.xbrl.org/2003/role/disclosureRef
-Topic 280
-SubTopic 10
-Name Accounting Standards Codification
-Section 50
-Paragraph 42
-Publisher FASB
-URI https://asc.fasb.org//1943274/2147482810/280-10-50-42
Reference 17: http://www.xbrl.org/2003/role/disclosureRef
-Topic 280
-SubTopic 10
-Name Accounting Standards Codification
-Section 50
-Paragraph 22
-Subparagraph (b)
-Publisher FASB
-URI https://asc.fasb.org//1943274/2147482810/280-10-50-22
Reference 18: http://www.xbrl.org/2003/role/disclosureRef
-Topic 280
-SubTopic 10
-Name Accounting Standards Codification
-Section 50
-Paragraph 32
-Subparagraph (b)
-Publisher FASB
-URI https://asc.fasb.org//1943274/2147482810/280-10-50-32
Reference 19: http://www.xbrl.org/2003/role/disclosureRef
-Topic 280
-SubTopic 10
-Name Accounting Standards Codification
-Section 50
-Paragraph 40
-Publisher FASB
-URI https://asc.fasb.org//1943274/2147482810/280-10-50-40
Reference 20: http://www.xbrl.org/2003/role/disclosureRef
-Topic 280
-SubTopic 10
-Name Accounting Standards Codification
-Section 50
-Paragraph 22
-Subparagraph (a)
-Publisher FASB
-URI https://asc.fasb.org//1943274/2147482810/280-10-50-22
Reference 21: http://www.xbrl.org/2003/role/disclosureRef
-Topic 280
-SubTopic 10
-Name Accounting Standards Codification
-Section 50
-Paragraph 32
-Subparagraph (a)
-Publisher FASB
-URI https://asc.fasb.org//1943274/2147482810/280-10-50-32
Reference 22: http://www.xbrl.org/2003/role/disclosureRef
-Topic 280
-SubTopic 10
-Name Accounting Standards Codification
-Section 50
-Paragraph 41
-Subparagraph (a)
-Publisher FASB
-URI https://asc.fasb.org//1943274/2147482810/280-10-50-41
Reference 23: http://www.xbrl.org/2003/role/disclosureRef
-Topic 942
-SubTopic 235
-Name Accounting Standards Codification
-Section S99
-Paragraph 1
-Subparagraph (SX 210.9-05(b)(2))
-Publisher FASB
-URI https://asc.fasb.org//1943274/2147479557/942-235-S99-1
| Name: |
us-gaap_Revenues |
| Namespace Prefix: |
us-gaap_ |
| Data Type: |
xbrli:monetaryItemType |
| Balance Type: |
credit |
| Period Type: |
duration |
|
| X |
- References
+ Details
| Name: |
us-gaap_RevenuesAbstract |
| Namespace Prefix: |
us-gaap_ |
| Data Type: |
xbrli:stringItemType |
| Balance Type: |
na |
| Period Type: |
duration |
|
| X |
- Details
| Name: |
us-gaap_StatementBusinessSegmentsAxis=nysedei_OfficeSegmentMember |
| Namespace Prefix: |
|
| Data Type: |
na |
| Balance Type: |
|
| Period Type: |
|
|
| X |
- Details
| Name: |
srt_ProductOrServiceAxis=nysedei_RentalRevenueAndTenantRecoveryRevenueMember |
| Namespace Prefix: |
|
| Data Type: |
na |
| Balance Type: |
|
| Period Type: |
|
|
| X |
- Details
| Name: |
srt_ProductOrServiceAxis=nysedei_ParkingRevenueAndOtherIncomeMember |
| Namespace Prefix: |
|
| Data Type: |
na |
| Balance Type: |
|
| Period Type: |
|
|
| X |
- Details
| Name: |
us-gaap_StatementBusinessSegmentsAxis=nysedei_MultifamilySegmentMember |
| Namespace Prefix: |
|
| Data Type: |
na |
| Balance Type: |
|
| Period Type: |
|
|
| X |
- Details
| Name: |
srt_ProductOrServiceAxis=nysedei_RentalRevenueMember |
| Namespace Prefix: |
|
| Data Type: |
na |
| Balance Type: |
|
| Period Type: |
|
|
v3.23.3
Consolidated Statements of Comprehensive Income (Loss) - USD ($)
$ in Thousands |
3 Months Ended |
9 Months Ended |
Sep. 30, 2023 |
Sep. 30, 2022 |
Sep. 30, 2023 |
Sep. 30, 2022 |
| Statement of Comprehensive Income [Abstract] |
|
|
|
|
| Net (loss) income |
$ (21,025)
|
$ 21,213
|
$ (19,932)
|
$ 71,309
|
| Other comprehensive (loss) income: cash flow hedges |
(7,045)
|
108,352
|
(21,757)
|
342,628
|
| Comprehensive (loss) income |
(28,070)
|
129,565
|
(41,689)
|
413,937
|
| Comprehensive loss (income) attributable to noncontrolling interests |
9,571
|
(31,731)
|
22,135
|
(102,671)
|
| Comprehensive (loss) income attributable to common stockholders |
$ (18,499)
|
$ 97,834
|
$ (19,554)
|
$ 311,266
|
| X |
- DefinitionAmount after tax of increase (decrease) in equity from transactions and other events and circumstances from net income and other comprehensive income, attributable to parent entity. Excludes changes in equity resulting from investments by owners and distributions to owners. Reference 1: http://www.xbrl.org/2003/role/disclosureRef
-Topic 220
-SubTopic 10
-Name Accounting Standards Codification
-Section S99
-Paragraph 2
-Subparagraph (SX 210.5-03(24))
-Publisher FASB
-URI https://asc.fasb.org//1943274/2147483621/220-10-S99-2
Reference 2: http://www.xbrl.org/2003/role/disclosureRef
-Topic 942
-SubTopic 220
-Name Accounting Standards Codification
-Section S99
-Paragraph 1
-Subparagraph (SX 210.9-04(26))
-Publisher FASB
-URI https://asc.fasb.org//1943274/2147483589/942-220-S99-1
Reference 3: http://www.xbrl.org/2003/role/disclosureRef
-Topic 944
-SubTopic 220
-Name Accounting Standards Codification
-Section S99
-Paragraph 1
-Subparagraph (SX 210.7-04(22))
-Publisher FASB
-URI https://asc.fasb.org//1943274/2147483586/944-220-S99-1
Reference 4: http://www.xbrl.org/2003/role/disclosureRef
-Topic 220
-SubTopic 10
-Name Accounting Standards Codification
-Section 45
-Paragraph 1A
-Subparagraph (c)
-Publisher FASB
-URI https://asc.fasb.org//1943274/2147482790/220-10-45-1A
Reference 5: http://www.xbrl.org/2003/role/disclosureRef
-Topic 220
-SubTopic 10
-Name Accounting Standards Codification
-Section 45
-Paragraph 1B
-Subparagraph (b)
-Publisher FASB
-URI https://asc.fasb.org//1943274/2147482790/220-10-45-1B
Reference 6: http://fasb.org/us-gaap/role/ref/legacyRef
-Name Accounting Standards Codification
-Topic 220
-SubTopic 10
-Section 45
-Paragraph 5
-Publisher FASB
-URI https://asc.fasb.org//1943274/2147482790/220-10-45-5
| Name: |
us-gaap_ComprehensiveIncomeNetOfTax |
| Namespace Prefix: |
us-gaap_ |
| Data Type: |
xbrli:monetaryItemType |
| Balance Type: |
credit |
| Period Type: |
duration |
|
| X |
- DefinitionAmount after tax of increase (decrease) in equity from transactions and other events and circumstances from net income (loss) and other comprehensive income (loss), attributable to noncontrolling interests. Excludes changes in equity resulting from investments by owners and distributions to owners. Reference 1: http://fasb.org/us-gaap/role/ref/legacyRef
-Name Accounting Standards Codification
-Section 45
-Paragraph 20
-SubTopic 10
-Topic 810
-Publisher FASB
-URI https://asc.fasb.org//1943274/2147481231/810-10-45-20
Reference 2: http://www.xbrl.org/2003/role/disclosureRef
-Topic 220
-SubTopic 10
-Name Accounting Standards Codification
-Section S99
-Paragraph 2
-Subparagraph (SX 210.5-03(23))
-Publisher FASB
-URI https://asc.fasb.org//1943274/2147483621/220-10-S99-2
Reference 3: http://www.xbrl.org/2003/role/disclosureRef
-Topic 942
-SubTopic 220
-Name Accounting Standards Codification
-Section S99
-Paragraph 1
-Subparagraph (SX 210.9-04(25))
-Publisher FASB
-URI https://asc.fasb.org//1943274/2147483589/942-220-S99-1
Reference 4: http://www.xbrl.org/2003/role/disclosureRef
-Topic 944
-SubTopic 220
-Name Accounting Standards Codification
-Section S99
-Paragraph 1
-Subparagraph (SX 210.7-04(21))
-Publisher FASB
-URI https://asc.fasb.org//1943274/2147483586/944-220-S99-1
Reference 5: http://fasb.org/us-gaap/role/ref/legacyRef
-Name Accounting Standards Codification
-Topic 810
-SubTopic 10
-Section 45
-Paragraph 21
-Publisher FASB
-URI https://asc.fasb.org//1943274/2147481231/810-10-45-21
Reference 6: http://www.xbrl.org/2003/role/disclosureRef
-Topic 220
-SubTopic 10
-Name Accounting Standards Codification
-Section 45
-Paragraph 1A
-Subparagraph (c)
-Publisher FASB
-URI https://asc.fasb.org//1943274/2147482790/220-10-45-1A
Reference 7: http://www.xbrl.org/2003/role/disclosureRef
-Topic 220
-SubTopic 10
-Name Accounting Standards Codification
-Section 45
-Paragraph 1B
-Subparagraph (b)
-Publisher FASB
-URI https://asc.fasb.org//1943274/2147482790/220-10-45-1B
Reference 8: http://fasb.org/us-gaap/role/ref/legacyRef
-Name Accounting Standards Codification
-Topic 810
-SubTopic 10
-Section 55
-Paragraph 4K
-Publisher FASB
-URI https://asc.fasb.org//1943274/2147481175/810-10-55-4K
| Name: |
us-gaap_ComprehensiveIncomeNetOfTaxAttributableToNoncontrollingInterest |
| Namespace Prefix: |
us-gaap_ |
| Data Type: |
xbrli:monetaryItemType |
| Balance Type: |
debit |
| Period Type: |
duration |
|
| X |
- DefinitionAmount after tax of increase (decrease) in equity from transactions and other events and circumstances from net income and other comprehensive income. Excludes changes in equity resulting from investments by owners and distributions to owners. Reference 1: http://fasb.org/us-gaap/role/ref/legacyRef
-Topic 810
-SubTopic 10
-Name Accounting Standards Codification
-Section 45
-Paragraph 19
-Publisher FASB
-URI https://asc.fasb.org//1943274/2147481231/810-10-45-19
Reference 2: http://www.xbrl.org/2003/role/disclosureRef
-Topic 220
-SubTopic 10
-Name Accounting Standards Codification
-Section S99
-Paragraph 2
-Subparagraph (SX 210.5-03(22))
-Publisher FASB
-URI https://asc.fasb.org//1943274/2147483621/220-10-S99-2
Reference 3: http://www.xbrl.org/2003/role/disclosureRef
-Topic 942
-SubTopic 220
-Name Accounting Standards Codification
-Section S99
-Paragraph 1
-Subparagraph (SX 210.9-04(24))
-Publisher FASB
-URI https://asc.fasb.org//1943274/2147483589/942-220-S99-1
Reference 4: http://www.xbrl.org/2003/role/disclosureRef
-Topic 944
-SubTopic 220
-Name Accounting Standards Codification
-Section S99
-Paragraph 1
-Subparagraph (SX 210.7-04(20))
-Publisher FASB
-URI https://asc.fasb.org//1943274/2147483586/944-220-S99-1
Reference 5: http://www.xbrl.org/2003/role/disclosureRef
-Topic 220
-SubTopic 10
-Name Accounting Standards Codification
-Section 45
-Paragraph 1A
-Subparagraph (c)
-Publisher FASB
-URI https://asc.fasb.org//1943274/2147482790/220-10-45-1A
Reference 6: http://www.xbrl.org/2003/role/disclosureRef
-Topic 220
-SubTopic 10
-Name Accounting Standards Codification
-Section 45
-Paragraph 1B
-Subparagraph (b)
-Publisher FASB
-URI https://asc.fasb.org//1943274/2147482790/220-10-45-1B
Reference 7: http://fasb.org/us-gaap/role/ref/legacyRef
-Name Accounting Standards Codification
-Topic 810
-SubTopic 10
-Section 55
-Paragraph 4K
-Publisher FASB
-URI https://asc.fasb.org//1943274/2147481175/810-10-55-4K
| Name: |
us-gaap_ComprehensiveIncomeNetOfTaxIncludingPortionAttributableToNoncontrollingInterest |
| Namespace Prefix: |
us-gaap_ |
| Data Type: |
xbrli:monetaryItemType |
| Balance Type: |
credit |
| Period Type: |
duration |
|
| X |
- DefinitionAmount, after tax and reclassification, of gain (loss) from derivative instrument designated and qualifying as cash flow hedge included in assessment of hedge effectiveness. Reference 1: http://www.xbrl.org/2003/role/disclosureRef
-Topic 220
-SubTopic 10
-Name Accounting Standards Codification
-Section 45
-Paragraph 11
-Publisher FASB
-URI https://asc.fasb.org//1943274/2147482790/220-10-45-11
Reference 2: http://www.xbrl.org/2003/role/disclosureRef
-Topic 220
-SubTopic 10
-Name Accounting Standards Codification
-Section 45
-Paragraph 10A
-Subparagraph (d)
-Publisher FASB
-URI https://asc.fasb.org//1943274/2147482790/220-10-45-10A
| Name: |
us-gaap_OtherComprehensiveIncomeLossCashFlowHedgeGainLossAfterReclassificationAndTax |
| Namespace Prefix: |
us-gaap_ |
| Data Type: |
xbrli:monetaryItemType |
| Balance Type: |
credit |
| Period Type: |
duration |
|
| X |
- DefinitionThe consolidated profit or loss for the period, net of income taxes, including the portion attributable to the noncontrolling interest. Reference 1: http://www.xbrl.org/2003/role/disclosureRef
-Topic 235
-SubTopic 10
-Name Accounting Standards Codification
-Section S99
-Paragraph 1
-Subparagraph (SX 210.4-08(g)(1)(ii))
-Publisher FASB
-URI https://asc.fasb.org//1943274/2147480678/235-10-S99-1
Reference 2: http://www.xbrl.org/2003/role/disclosureRef
-Topic 323
-SubTopic 10
-Name Accounting Standards Codification
-Section 50
-Paragraph 3
-Subparagraph (c)
-Publisher FASB
-URI https://asc.fasb.org//1943274/2147481687/323-10-50-3
Reference 3: http://www.xbrl.org/2003/role/disclosureRef
-Topic 825
-SubTopic 10
-Name Accounting Standards Codification
-Section 50
-Paragraph 28
-Subparagraph (f)
-Publisher FASB
-URI https://asc.fasb.org//1943274/2147482907/825-10-50-28
Reference 4: http://www.xbrl.org/2003/role/disclosureRef
-Topic 250
-SubTopic 10
-Name Accounting Standards Codification
-Section 50
-Paragraph 1
-Subparagraph (b)(2)
-Publisher FASB
-URI https://asc.fasb.org//1943274/2147483443/250-10-50-1
Reference 5: http://www.xbrl.org/2003/role/disclosureRef
-Topic 815
-SubTopic 40
-Name Accounting Standards Codification
-Section 65
-Paragraph 1
-Subparagraph (f)
-Publisher FASB
-URI https://asc.fasb.org//1943274/2147480175/815-40-65-1
Reference 6: http://www.xbrl.org/2003/role/disclosureRef
-Topic 250
-SubTopic 10
-Name Accounting Standards Codification
-Section 50
-Paragraph 8
-Publisher FASB
-URI https://asc.fasb.org//1943274/2147483443/250-10-50-8
Reference 7: http://www.xbrl.org/2003/role/disclosureRef
-Topic 250
-SubTopic 10
-Name Accounting Standards Codification
-Section 50
-Paragraph 9
-Publisher FASB
-URI https://asc.fasb.org//1943274/2147483443/250-10-50-9
Reference 8: http://www.xbrl.org/2003/role/exampleRef
-Topic 946
-SubTopic 830
-Name Accounting Standards Codification
-Section 55
-Paragraph 11
-Publisher FASB
-URI https://asc.fasb.org//1943274/2147480167/946-830-55-11
Reference 9: http://www.xbrl.org/2003/role/disclosureRef
-Topic 946
-SubTopic 205
-Name Accounting Standards Codification
-Section 45
-Paragraph 3
-Subparagraph (a)
-Publisher FASB
-URI https://asc.fasb.org//1943274/2147480767/946-205-45-3
Reference 10: http://www.xbrl.org/2003/role/disclosureRef
-Topic 946
-SubTopic 220
-Name Accounting Standards Codification
-Section 45
-Paragraph 7
-Publisher FASB
-URI https://asc.fasb.org//1943274/2147483581/946-220-45-7
Reference 11: http://www.xbrl.org/2003/role/disclosureRef
-Topic 944
-SubTopic 220
-Name Accounting Standards Codification
-Section S99
-Paragraph 1
-Subparagraph (SX 210.7-04(16))
-Publisher FASB
-URI https://asc.fasb.org//1943274/2147483586/944-220-S99-1
Reference 12: http://www.xbrl.org/2003/role/disclosureRef
-Topic 280
-SubTopic 10
-Name Accounting Standards Codification
-Section 50
-Paragraph 22
-Publisher FASB
-URI https://asc.fasb.org//1943274/2147482810/280-10-50-22
Reference 13: http://www.xbrl.org/2003/role/disclosureRef
-Topic 946
-SubTopic 220
-Name Accounting Standards Codification
-Section S99
-Paragraph 1
-Subparagraph (SX 210.6-07(9))
-Publisher FASB
-URI https://asc.fasb.org//1943274/2147483575/946-220-S99-1
Reference 14: http://www.xbrl.org/2003/role/disclosureRef
-Topic 946
-SubTopic 220
-Name Accounting Standards Codification
-Section S99
-Paragraph 3
-Subparagraph (SX 210.6-09(1)(d))
-Publisher FASB
-URI https://asc.fasb.org//1943274/2147483575/946-220-S99-3
Reference 15: http://www.xbrl.org/2003/role/disclosureRef
-Topic 810
-SubTopic 10
-Name Accounting Standards Codification
-Section 45
-Paragraph 19
-Publisher FASB
-URI https://asc.fasb.org//1943274/2147481231/810-10-45-19
Reference 16: http://www.xbrl.org/2009/role/commonPracticeRef
-Topic 220
-SubTopic 10
-Name Accounting Standards Codification
-Section 50
-Paragraph 6
-Publisher FASB
-URI https://asc.fasb.org//1943274/2147482765/220-10-50-6
Reference 17: http://www.xbrl.org/2003/role/disclosureRef
-Topic 470
-SubTopic 10
-Name Accounting Standards Codification
-Section S99
-Paragraph 1A
-Subparagraph (SX 210.13-01(a)(4)(i))
-Publisher FASB
-URI https://asc.fasb.org//1943274/2147480097/470-10-S99-1A
Reference 18: http://www.xbrl.org/2009/role/commonPracticeRef
-Topic 470
-SubTopic 10
-Name Accounting Standards Codification
-Section S99
-Paragraph 1A
-Subparagraph (SX 210.13-01(a)(4)(ii))
-Publisher FASB
-URI https://asc.fasb.org//1943274/2147480097/470-10-S99-1A
Reference 19: http://www.xbrl.org/2003/role/disclosureRef
-Topic 470
-SubTopic 10
-Name Accounting Standards Codification
-Section S99
-Paragraph 1A
-Subparagraph (SX 210.13-01(a)(4)(iii)(A))
-Publisher FASB
-URI https://asc.fasb.org//1943274/2147480097/470-10-S99-1A
Reference 20: http://www.xbrl.org/2003/role/disclosureRef
-Topic 470
-SubTopic 10
-Name Accounting Standards Codification
-Section S99
-Paragraph 1A
-Subparagraph (SX 210.13-01(a)(4)(iv))
-Publisher FASB
-URI https://asc.fasb.org//1943274/2147480097/470-10-S99-1A
Reference 21: http://www.xbrl.org/2003/role/disclosureRef
-Topic 470
-SubTopic 10
-Name Accounting Standards Codification
-Section S99
-Paragraph 1A
-Subparagraph (SX 210.13-01(a)(5))
-Publisher FASB
-URI https://asc.fasb.org//1943274/2147480097/470-10-S99-1A
Reference 22: http://www.xbrl.org/2003/role/disclosureRef
-Topic 470
-SubTopic 10
-Name Accounting Standards Codification
-Section S99
-Paragraph 1B
-Subparagraph (SX 210.13-02(a)(4)(i))
-Publisher FASB
-URI https://asc.fasb.org//1943274/2147480097/470-10-S99-1B
Reference 23: http://www.xbrl.org/2003/role/disclosureRef
-Topic 470
-SubTopic 10
-Name Accounting Standards Codification
-Section S99
-Paragraph 1B
-Subparagraph (SX 210.13-02(a)(4)(iii)(A))
-Publisher FASB
-URI https://asc.fasb.org//1943274/2147480097/470-10-S99-1B
Reference 24: http://www.xbrl.org/2003/role/disclosureRef
-Topic 470
-SubTopic 10
-Name Accounting Standards Codification
-Section S99
-Paragraph 1B
-Subparagraph (SX 210.13-02(a)(4)(iii)(B))
-Publisher FASB
-URI https://asc.fasb.org//1943274/2147480097/470-10-S99-1B
Reference 25: http://www.xbrl.org/2003/role/disclosureRef
-Topic 470
-SubTopic 10
-Name Accounting Standards Codification
-Section S99
-Paragraph 1B
-Subparagraph (SX 210.13-02(a)(4)(iv))
-Publisher FASB
-URI https://asc.fasb.org//1943274/2147480097/470-10-S99-1B
Reference 26: http://www.xbrl.org/2003/role/disclosureRef
-Topic 470
-SubTopic 10
-Name Accounting Standards Codification
-Section S99
-Paragraph 1B
-Subparagraph (SX 210.13-02(a)(5))
-Publisher FASB
-URI https://asc.fasb.org//1943274/2147480097/470-10-S99-1B
Reference 27: http://www.xbrl.org/2003/role/disclosureRef
-Topic 280
-SubTopic 10
-Name Accounting Standards Codification
-Section 50
-Paragraph 30
-Subparagraph (b)
-Publisher FASB
-URI https://asc.fasb.org//1943274/2147482810/280-10-50-30
Reference 28: http://www.xbrl.org/2003/role/disclosureRef
-Topic 280
-SubTopic 10
-Name Accounting Standards Codification
-Section 50
-Paragraph 32
-Subparagraph (f)
-Publisher FASB
-URI https://asc.fasb.org//1943274/2147482810/280-10-50-32
Reference 29: http://www.xbrl.org/2003/role/exampleRef
-Topic 280
-SubTopic 10
-Name Accounting Standards Codification
-Section 50
-Paragraph 31
-Publisher FASB
-URI https://asc.fasb.org//1943274/2147482810/280-10-50-31
Reference 30: http://www.xbrl.org/2003/role/disclosureRef
-Topic 280
-SubTopic 10
-Name Accounting Standards Codification
-Section 50
-Paragraph 32
-Subparagraph (c)
-Publisher FASB
-URI https://asc.fasb.org//1943274/2147482810/280-10-50-32
Reference 31: http://www.xbrl.org/2003/role/disclosureRef
-Topic 942
-SubTopic 235
-Name Accounting Standards Codification
-Section S99
-Paragraph 1
-Subparagraph (SX 210.9-05(b)(2))
-Publisher FASB
-URI https://asc.fasb.org//1943274/2147479557/942-235-S99-1
Reference 32: http://www.xbrl.org/2003/role/disclosureRef
-Topic 205
-SubTopic 20
-Name Accounting Standards Codification
-Section 50
-Paragraph 7
-Publisher FASB
-URI https://asc.fasb.org//1943274/2147483499/205-20-50-7
Reference 33: http://www.xbrl.org/2003/role/exampleRef
-Topic 810
-SubTopic 10
-Name Accounting Standards Codification
-Section 55
-Paragraph 4J
-Publisher FASB
-URI https://asc.fasb.org//1943274/2147481175/810-10-55-4J
Reference 34: http://www.xbrl.org/2003/role/exampleRef
-Topic 810
-SubTopic 10
-Name Accounting Standards Codification
-Section 55
-Paragraph 4K
-Publisher FASB
-URI https://asc.fasb.org//1943274/2147481175/810-10-55-4K
Reference 35: http://www.xbrl.org/2003/role/disclosureRef
-Topic 220
-SubTopic 10
-Name Accounting Standards Codification
-Section 45
-Paragraph 1A
-Subparagraph (a)
-Publisher FASB
-URI https://asc.fasb.org//1943274/2147482790/220-10-45-1A
Reference 36: http://www.xbrl.org/2003/role/disclosureRef
-Topic 220
-SubTopic 10
-Name Accounting Standards Codification
-Section 45
-Paragraph 1B
-Subparagraph (a)
-Publisher FASB
-URI https://asc.fasb.org//1943274/2147482790/220-10-45-1B
Reference 37: http://www.xbrl.org/2003/role/disclosureRef
-Topic 230
-SubTopic 10
-Name Accounting Standards Codification
-Section 45
-Paragraph 2
-Publisher FASB
-URI https://asc.fasb.org//1943274/2147482740/230-10-45-2
Reference 38: http://www.xbrl.org/2003/role/disclosureRef
-Topic 810
-SubTopic 10
-Name Accounting Standards Codification
-Section 50
-Paragraph 1A
-Subparagraph (a)(1)
-Publisher FASB
-URI https://asc.fasb.org//1943274/2147481203/810-10-50-1A
Reference 39: http://www.xbrl.org/2003/role/disclosureRef
-Topic 810
-SubTopic 10
-Name Accounting Standards Codification
-Section 50
-Paragraph 1A
-Subparagraph (c)(1)
-Publisher FASB
-URI https://asc.fasb.org//1943274/2147481203/810-10-50-1A
| Name: |
us-gaap_ProfitLoss |
| Namespace Prefix: |
us-gaap_ |
| Data Type: |
xbrli:monetaryItemType |
| Balance Type: |
credit |
| Period Type: |
duration |
|
| X |
- References
+ Details
| Name: |
us-gaap_StatementOfIncomeAndComprehensiveIncomeAbstract |
| Namespace Prefix: |
us-gaap_ |
| Data Type: |
xbrli:stringItemType |
| Balance Type: |
na |
| Period Type: |
duration |
|
v3.23.3
Consolidated Statements of Equity - USD ($)
$ in Thousands |
Total |
Common Stock |
Additional Paid-in Capital |
Accumulated Other Comprehensive Income (Loss) |
Accumulated Deficit |
Noncontrolling Interests |
| Beginning balance (in shares) at Dec. 31, 2021 |
|
175,529,000
|
|
|
|
|
| Stockholders' Equity [Roll Forward] |
|
|
|
|
|
|
| Exchange of OP units for common stock (in shares) |
260,000
|
260,000
|
|
|
|
|
| Ending balance (in shares) at Sep. 30, 2022 |
|
175,789,000
|
|
|
|
|
| Beginning balance at Dec. 31, 2021 |
$ 3,986,553
|
$ 1,755
|
$ 3,488,886
|
$ (38,774)
|
$ (1,035,798)
|
$ 1,570,484
|
| Stockholders' Equity [Roll Forward] |
|
|
|
|
|
|
| Exchange of OP Units for common stock |
|
3
|
4,233
|
|
|
(4,236)
|
| Repurchases of OP Units with cash |
(336)
|
|
(176)
|
|
|
(160)
|
| Net (loss) income attributable to common stockholders |
1,534
|
|
|
|
72,843
|
|
| Dividends |
(147,656)
|
|
|
|
(147,656)
|
|
| Net (loss) income |
71,309
|
|
|
|
|
(1,534)
|
| Cash flow hedge adjustments |
342,628
|
|
|
238,423
|
|
104,205
|
| Contributions |
81,000
|
|
|
|
|
81,000
|
| Distributions |
(45,376)
|
|
|
|
|
(45,376)
|
| Stock-based compensation |
9,611
|
|
|
|
|
9,611
|
| Ending balance at Sep. 30, 2022 |
$ 4,297,733
|
$ 1,758
|
3,492,943
|
199,649
|
(1,110,611)
|
1,713,994
|
| Stockholders' Equity [Roll Forward] |
|
|
|
|
|
|
| Dividends declared per common share (in usd per share) |
$ 0.84
|
|
|
|
|
|
| Beginning balance (in shares) at Jun. 30, 2022 |
|
175,784,000
|
|
|
|
|
| Stockholders' Equity [Roll Forward] |
|
|
|
|
|
|
| Exchange of OP units for common stock (in shares) |
|
5,000
|
|
|
|
|
| Ending balance (in shares) at Sep. 30, 2022 |
|
175,789,000
|
|
|
|
|
| Beginning balance at Jun. 30, 2022 |
$ 4,228,951
|
$ 1,758
|
3,492,864
|
124,770
|
(1,084,346)
|
1,693,905
|
| Stockholders' Equity [Roll Forward] |
|
|
|
|
|
|
| Exchange of OP Units for common stock |
|
|
80
|
|
|
(80)
|
| Repurchases of OP Units with cash |
(6)
|
|
(1)
|
|
|
(5)
|
| Net (loss) income attributable to common stockholders |
1,742
|
|
|
|
22,955
|
|
| Dividends |
(49,220)
|
|
|
|
(49,220)
|
|
| Net (loss) income |
21,213
|
|
|
|
|
(1,742)
|
| Cash flow hedge adjustments |
108,352
|
|
|
74,879
|
|
33,473
|
| Distributions |
(14,649)
|
|
|
|
|
(14,649)
|
| Stock-based compensation |
3,092
|
|
|
|
|
3,092
|
| Ending balance at Sep. 30, 2022 |
$ 4,297,733
|
$ 1,758
|
3,492,943
|
199,649
|
(1,110,611)
|
1,713,994
|
| Stockholders' Equity [Roll Forward] |
|
|
|
|
|
|
| Dividends declared per common share (in usd per share) |
$ 0.28
|
|
|
|
|
|
| Beginning balance (in shares) at Dec. 31, 2022 |
175,809,682
|
175,810,000
|
|
|
|
|
| Stockholders' Equity [Roll Forward] |
|
|
|
|
|
|
| Repurchase of common stock (in shares) |
|
(9,072,000)
|
|
|
|
|
| Ending balance (in shares) at Sep. 30, 2023 |
166,737,730
|
166,738,000
|
|
|
|
|
| Beginning balance at Dec. 31, 2022 |
$ 4,275,783
|
$ 1,758
|
3,493,307
|
187,063
|
(1,119,714)
|
1,713,369
|
| Stockholders' Equity [Roll Forward] |
|
|
|
|
|
|
| Repurchases of OP Units with cash |
(367)
|
|
120
|
|
|
(487)
|
| Repurchases of common stock |
(109,233)
|
(91)
|
(109,142)
|
|
|
|
| Net (loss) income attributable to common stockholders |
17,681
|
|
|
|
(2,251)
|
|
| Dividends |
(96,492)
|
|
|
|
(96,492)
|
|
| Net (loss) income |
(19,932)
|
|
|
|
|
(17,681)
|
| Cash flow hedge adjustments |
(21,757)
|
|
|
(17,303)
|
|
(4,454)
|
| Contributions |
125
|
|
|
|
|
125
|
| Distributions |
(30,433)
|
|
|
|
|
(30,433)
|
| Stock-based compensation |
9,762
|
|
|
|
|
9,762
|
| Ending balance at Sep. 30, 2023 |
$ 4,007,456
|
$ 1,667
|
3,384,285
|
169,760
|
(1,218,457)
|
1,670,201
|
| Stockholders' Equity [Roll Forward] |
|
|
|
|
|
|
| Dividends declared per common share (in usd per share) |
$ 0.57
|
|
|
|
|
|
| Beginning balance (in shares) at Jun. 30, 2023 |
|
166,738,000
|
|
|
|
|
| Ending balance (in shares) at Sep. 30, 2023 |
166,737,730
|
166,738,000
|
|
|
|
|
| Beginning balance at Jun. 30, 2023 |
$ 4,074,318
|
$ 1,667
|
3,384,274
|
174,897
|
(1,173,415)
|
1,686,895
|
| Stockholders' Equity [Roll Forward] |
|
|
|
|
|
|
| Repurchases of OP Units with cash |
(46)
|
|
11
|
|
|
(57)
|
| Net (loss) income attributable to common stockholders |
7,663
|
|
|
|
(13,362)
|
|
| Dividends |
(31,680)
|
|
|
|
(31,680)
|
|
| Net (loss) income |
(21,025)
|
|
|
|
|
(7,663)
|
| Cash flow hedge adjustments |
(7,045)
|
|
|
(5,137)
|
|
(1,908)
|
| Distributions |
(10,145)
|
|
|
|
|
(10,145)
|
| Stock-based compensation |
3,079
|
|
|
|
|
3,079
|
| Ending balance at Sep. 30, 2023 |
$ 4,007,456
|
$ 1,667
|
$ 3,384,285
|
$ 169,760
|
$ (1,218,457)
|
$ 1,670,201
|
| Stockholders' Equity [Roll Forward] |
|
|
|
|
|
|
| Dividends declared per common share (in usd per share) |
$ 0.19
|
|
|
|
|
|
| X |
- DefinitionAmount of increase to additional paid-in capital (APIC) for recognition of cost for award under share-based payment arrangement. Reference 1: http://www.xbrl.org/2003/role/disclosureRef
-Topic 718
-SubTopic 10
-Name Accounting Standards Codification
-Section 35
-Paragraph 2
-Publisher FASB
-URI https://asc.fasb.org//1943274/2147480483/718-10-35-2
Reference 2: http://fasb.org/us-gaap/role/ref/legacyRef
-Name Accounting Standards Codification
-Topic 718
-SubTopic 20
-Section 55
-Paragraph 13
-Publisher FASB
-URI https://asc.fasb.org//1943274/2147481089/718-20-55-13
Reference 3: http://fasb.org/us-gaap/role/ref/legacyRef
-Name Accounting Standards Codification
-Topic 718
-SubTopic 20
-Section 55
-Paragraph 12
-Publisher FASB
-URI https://asc.fasb.org//1943274/2147481089/718-20-55-12
| Name: |
us-gaap_AdjustmentsToAdditionalPaidInCapitalSharebasedCompensationRequisiteServicePeriodRecognitionValue |
| Namespace Prefix: |
us-gaap_ |
| Data Type: |
xbrli:monetaryItemType |
| Balance Type: |
credit |
| Period Type: |
duration |
|
| X |
- DefinitionAggregate dividends declared during the period for each share of common stock outstanding. Reference 1: http://fasb.org/us-gaap/role/ref/legacyRef
-Topic 505
-SubTopic 10
-Name Accounting Standards Codification
-Section S99
-Paragraph 1
-Subparagraph (SX 210.3-04)
-Publisher FASB
-URI https://asc.fasb.org//1943274/2147480008/505-10-S99-1
| Name: |
us-gaap_CommonStockDividendsPerShareDeclared |
| Namespace Prefix: |
us-gaap_ |
| Data Type: |
dtr-types:perShareItemType |
| Balance Type: |
na |
| Period Type: |
duration |
|
| X |
- DefinitionNumber of shares of common stock outstanding. Common stock represent the ownership interest in a corporation. Reference 1: http://fasb.org/us-gaap/role/ref/legacyRef
-Name Accounting Standards Codification
-Section 50
-Paragraph 2
-SubTopic 10
-Topic 505
-Publisher FASB
-URI https://asc.fasb.org//1943274/2147481112/505-10-50-2
Reference 2: http://www.xbrl.org/2003/role/disclosureRef
-Topic 946
-SubTopic 210
-Name Accounting Standards Codification
-Section S99
-Paragraph 2
-Subparagraph (SX 210.6-05(4))
-Publisher FASB
-URI https://asc.fasb.org//1943274/2147479617/946-210-S99-2
Reference 3: http://www.xbrl.org/2009/role/commonPracticeRef
-Topic 946
-SubTopic 220
-Name Accounting Standards Codification
-Section S99
-Paragraph 3
-Subparagraph (SX 210.6-09(4)(b))
-Publisher FASB
-URI https://asc.fasb.org//1943274/2147483575/946-220-S99-3
Reference 4: http://www.xbrl.org/2003/role/disclosureRef
-Topic 946
-SubTopic 210
-Name Accounting Standards Codification
-Section S99
-Paragraph 1
-Subparagraph (SX 210.6-04(16)(a))
-Publisher FASB
-URI https://asc.fasb.org//1943274/2147479617/946-210-S99-1
Reference 5: http://www.xbrl.org/2009/role/commonPracticeRef
-Topic 946
-SubTopic 220
-Name Accounting Standards Codification
-Section S99
-Paragraph 3
-Subparagraph (SX 210.6-09(7))
-Publisher FASB
-URI https://asc.fasb.org//1943274/2147483575/946-220-S99-3
Reference 6: http://fasb.org/us-gaap/role/ref/legacyRef
-Topic 210
-SubTopic 10
-Name Accounting Standards Codification
-Section S99
-Paragraph 1
-Subparagraph (SX 210.5-02(29))
-Publisher FASB
-URI https://asc.fasb.org//1943274/2147480566/210-10-S99-1
| Name: |
us-gaap_CommonStockSharesOutstanding |
| Namespace Prefix: |
us-gaap_ |
| Data Type: |
xbrli:sharesItemType |
| Balance Type: |
na |
| Period Type: |
instant |
|
| X |
- DefinitionAmount of paid and unpaid common stock dividends declared with the form of settlement in cash. Reference 1: http://fasb.org/us-gaap/role/ref/legacyRef
-Topic 505
-SubTopic 10
-Name Accounting Standards Codification
-Section S99
-Paragraph 1
-Subparagraph (SX 210.3-04)
-Publisher FASB
-URI https://asc.fasb.org//1943274/2147480008/505-10-S99-1
| Name: |
us-gaap_DividendsCommonStockCash |
| Namespace Prefix: |
us-gaap_ |
| Data Type: |
xbrli:monetaryItemType |
| Balance Type: |
debit |
| Period Type: |
duration |
|
| X |
- DefinitionA roll forward is a reconciliation of a concept from the beginning of a period to the end of a period.
| Name: |
us-gaap_IncreaseDecreaseInStockholdersEquityRollForward |
| Namespace Prefix: |
us-gaap_ |
| Data Type: |
xbrli:stringItemType |
| Balance Type: |
na |
| Period Type: |
duration |
|
| X |
- DefinitionDecrease in noncontrolling interest balance from payment of dividends or other distributions by the non-wholly owned subsidiary or partially owned entity, included in the consolidation of the parent entity, to the noncontrolling interest holders. Reference 1: http://fasb.org/us-gaap/role/ref/legacyRef
-Topic 505
-SubTopic 10
-Name Accounting Standards Codification
-Section S99
-Paragraph 1
-Subparagraph (SX 210.3-04)
-Publisher FASB
-URI https://asc.fasb.org//1943274/2147480008/505-10-S99-1
| Name: |
us-gaap_MinorityInterestDecreaseFromDistributionsToNoncontrollingInterestHolders |
| Namespace Prefix: |
us-gaap_ |
| Data Type: |
xbrli:monetaryItemType |
| Balance Type: |
debit |
| Period Type: |
duration |
|
| X |
- DefinitionAmount of Net Income (Loss) attributable to noncontrolling interest. Reference 1: http://www.xbrl.org/2003/role/disclosureRef
-Topic 250
-SubTopic 10
-Name Accounting Standards Codification
-Section 50
-Paragraph 8
-Publisher FASB
-URI https://asc.fasb.org//1943274/2147483443/250-10-50-8
Reference 2: http://www.xbrl.org/2003/role/disclosureRef
-Topic 250
-SubTopic 10
-Name Accounting Standards Codification
-Section 50
-Paragraph 9
-Publisher FASB
-URI https://asc.fasb.org//1943274/2147483443/250-10-50-9
Reference 3: http://www.xbrl.org/2003/role/disclosureRef
-Topic 944
-SubTopic 220
-Name Accounting Standards Codification
-Section S99
-Paragraph 1
-Subparagraph (SX 210.7-04(17))
-Publisher FASB
-URI https://asc.fasb.org//1943274/2147483586/944-220-S99-1
Reference 4: http://www.xbrl.org/2009/role/commonPracticeRef
-Topic 220
-SubTopic 10
-Name Accounting Standards Codification
-Section 50
-Paragraph 6
-Publisher FASB
-URI https://asc.fasb.org//1943274/2147482765/220-10-50-6
Reference 5: http://fasb.org/us-gaap/role/ref/legacyRef
-Topic 810
-SubTopic 10
-Name Accounting Standards Codification
-Section 50
-Paragraph 1A
-Subparagraph (a)(2)
-Publisher FASB
-URI https://asc.fasb.org//1943274/2147481203/810-10-50-1A
Reference 6: http://fasb.org/us-gaap/role/ref/legacyRef
-Name Accounting Standards Codification
-Topic 810
-SubTopic 10
-Section 55
-Paragraph 4J
-Publisher FASB
-URI https://asc.fasb.org//1943274/2147481175/810-10-55-4J
Reference 7: http://www.xbrl.org/2003/role/disclosureRef
-Topic 220
-SubTopic 10
-Name Accounting Standards Codification
-Section 45
-Paragraph 1A
-Subparagraph (a)
-Publisher FASB
-URI https://asc.fasb.org//1943274/2147482790/220-10-45-1A
Reference 8: http://www.xbrl.org/2003/role/disclosureRef
-Topic 220
-SubTopic 10
-Name Accounting Standards Codification
-Section 45
-Paragraph 1B
-Subparagraph (a)
-Publisher FASB
-URI https://asc.fasb.org//1943274/2147482790/220-10-45-1B
| Name: |
us-gaap_NetIncomeLossAttributableToNoncontrollingInterest |
| Namespace Prefix: |
us-gaap_ |
| Data Type: |
xbrli:monetaryItemType |
| Balance Type: |
debit |
| Period Type: |
duration |
|
| X |
- DefinitionAmount of increase in noncontrolling interest from subsidiary issuance of equity interests to noncontrolling interest holders. Reference 1: http://fasb.org/us-gaap/role/ref/legacyRef
-Topic 810
-SubTopic 10
-Name Accounting Standards Codification
-Section 45
-Paragraph 23
-Publisher FASB
-URI https://asc.fasb.org//1943274/2147481231/810-10-45-23
Reference 2: http://fasb.org/us-gaap/role/ref/legacyRef
-Name Accounting Standards Codification
-Topic 505
-SubTopic 10
-Section S99
-Paragraph 1
-Publisher FASB
-URI https://asc.fasb.org//1943274/2147480008/505-10-S99-1
Reference 3: http://fasb.org/us-gaap/role/ref/legacyRef
-Name Accounting Standards Codification
-Section 50
-Paragraph 1A
-Subparagraph (c)(2)
-SubTopic 10
-Topic 810
-Publisher FASB
-URI https://asc.fasb.org//1943274/2147481203/810-10-50-1A
| Name: |
us-gaap_NoncontrollingInterestIncreaseFromSubsidiaryEquityIssuance |
| Namespace Prefix: |
us-gaap_ |
| Data Type: |
xbrli:monetaryItemType |
| Balance Type: |
credit |
| Period Type: |
duration |
|
| X |
- DefinitionAmount, after tax and reclassification, of gain (loss) from derivative instrument designated and qualifying as cash flow hedge included in assessment of hedge effectiveness. Reference 1: http://www.xbrl.org/2003/role/disclosureRef
-Topic 220
-SubTopic 10
-Name Accounting Standards Codification
-Section 45
-Paragraph 11
-Publisher FASB
-URI https://asc.fasb.org//1943274/2147482790/220-10-45-11
Reference 2: http://www.xbrl.org/2003/role/disclosureRef
-Topic 220
-SubTopic 10
-Name Accounting Standards Codification
-Section 45
-Paragraph 10A
-Subparagraph (d)
-Publisher FASB
-URI https://asc.fasb.org//1943274/2147482790/220-10-45-10A
| Name: |
us-gaap_OtherComprehensiveIncomeLossCashFlowHedgeGainLossAfterReclassificationAndTax |
| Namespace Prefix: |
us-gaap_ |
| Data Type: |
xbrli:monetaryItemType |
| Balance Type: |
credit |
| Period Type: |
duration |
|
| X |
- DefinitionTotal change in each class of partners' capital accounts during the year due to redemptions and adjustments to redemption value. All partners include general, limited and preferred partners. Reference 1: http://fasb.org/us-gaap/role/ref/legacyRef
-Topic 505
-SubTopic 10
-Name Accounting Standards Codification
-Section S99
-Paragraph 1
-Subparagraph (SX 210.3-04)
-Publisher FASB
-URI https://asc.fasb.org//1943274/2147480008/505-10-S99-1
Reference 2: http://fasb.org/us-gaap/role/ref/legacyRef
-Topic 505
-SubTopic 10
-Name Accounting Standards Codification
-Section S99
-Paragraph 5
-Subparagraph (SAB Topic 4.F)
-Publisher FASB
-URI https://asc.fasb.org//1943274/2147480008/505-10-S99-5
| Name: |
us-gaap_PartnersCapitalAccountRedemptions |
| Namespace Prefix: |
us-gaap_ |
| Data Type: |
xbrli:monetaryItemType |
| Balance Type: |
debit |
| Period Type: |
duration |
|
| X |
- DefinitionThe consolidated profit or loss for the period, net of income taxes, including the portion attributable to the noncontrolling interest. Reference 1: http://www.xbrl.org/2003/role/disclosureRef
-Topic 235
-SubTopic 10
-Name Accounting Standards Codification
-Section S99
-Paragraph 1
-Subparagraph (SX 210.4-08(g)(1)(ii))
-Publisher FASB
-URI https://asc.fasb.org//1943274/2147480678/235-10-S99-1
Reference 2: http://www.xbrl.org/2003/role/disclosureRef
-Topic 323
-SubTopic 10
-Name Accounting Standards Codification
-Section 50
-Paragraph 3
-Subparagraph (c)
-Publisher FASB
-URI https://asc.fasb.org//1943274/2147481687/323-10-50-3
Reference 3: http://www.xbrl.org/2003/role/disclosureRef
-Topic 825
-SubTopic 10
-Name Accounting Standards Codification
-Section 50
-Paragraph 28
-Subparagraph (f)
-Publisher FASB
-URI https://asc.fasb.org//1943274/2147482907/825-10-50-28
Reference 4: http://www.xbrl.org/2003/role/disclosureRef
-Topic 250
-SubTopic 10
-Name Accounting Standards Codification
-Section 50
-Paragraph 1
-Subparagraph (b)(2)
-Publisher FASB
-URI https://asc.fasb.org//1943274/2147483443/250-10-50-1
Reference 5: http://www.xbrl.org/2003/role/disclosureRef
-Topic 815
-SubTopic 40
-Name Accounting Standards Codification
-Section 65
-Paragraph 1
-Subparagraph (f)
-Publisher FASB
-URI https://asc.fasb.org//1943274/2147480175/815-40-65-1
Reference 6: http://www.xbrl.org/2003/role/disclosureRef
-Topic 250
-SubTopic 10
-Name Accounting Standards Codification
-Section 50
-Paragraph 8
-Publisher FASB
-URI https://asc.fasb.org//1943274/2147483443/250-10-50-8
Reference 7: http://www.xbrl.org/2003/role/disclosureRef
-Topic 250
-SubTopic 10
-Name Accounting Standards Codification
-Section 50
-Paragraph 9
-Publisher FASB
-URI https://asc.fasb.org//1943274/2147483443/250-10-50-9
Reference 8: http://www.xbrl.org/2003/role/exampleRef
-Topic 946
-SubTopic 830
-Name Accounting Standards Codification
-Section 55
-Paragraph 11
-Publisher FASB
-URI https://asc.fasb.org//1943274/2147480167/946-830-55-11
Reference 9: http://www.xbrl.org/2003/role/disclosureRef
-Topic 946
-SubTopic 205
-Name Accounting Standards Codification
-Section 45
-Paragraph 3
-Subparagraph (a)
-Publisher FASB
-URI https://asc.fasb.org//1943274/2147480767/946-205-45-3
Reference 10: http://www.xbrl.org/2003/role/disclosureRef
-Topic 946
-SubTopic 220
-Name Accounting Standards Codification
-Section 45
-Paragraph 7
-Publisher FASB
-URI https://asc.fasb.org//1943274/2147483581/946-220-45-7
Reference 11: http://www.xbrl.org/2003/role/disclosureRef
-Topic 944
-SubTopic 220
-Name Accounting Standards Codification
-Section S99
-Paragraph 1
-Subparagraph (SX 210.7-04(16))
-Publisher FASB
-URI https://asc.fasb.org//1943274/2147483586/944-220-S99-1
Reference 12: http://www.xbrl.org/2003/role/disclosureRef
-Topic 280
-SubTopic 10
-Name Accounting Standards Codification
-Section 50
-Paragraph 22
-Publisher FASB
-URI https://asc.fasb.org//1943274/2147482810/280-10-50-22
Reference 13: http://www.xbrl.org/2003/role/disclosureRef
-Topic 946
-SubTopic 220
-Name Accounting Standards Codification
-Section S99
-Paragraph 1
-Subparagraph (SX 210.6-07(9))
-Publisher FASB
-URI https://asc.fasb.org//1943274/2147483575/946-220-S99-1
Reference 14: http://www.xbrl.org/2003/role/disclosureRef
-Topic 946
-SubTopic 220
-Name Accounting Standards Codification
-Section S99
-Paragraph 3
-Subparagraph (SX 210.6-09(1)(d))
-Publisher FASB
-URI https://asc.fasb.org//1943274/2147483575/946-220-S99-3
Reference 15: http://www.xbrl.org/2003/role/disclosureRef
-Topic 810
-SubTopic 10
-Name Accounting Standards Codification
-Section 45
-Paragraph 19
-Publisher FASB
-URI https://asc.fasb.org//1943274/2147481231/810-10-45-19
Reference 16: http://www.xbrl.org/2009/role/commonPracticeRef
-Topic 220
-SubTopic 10
-Name Accounting Standards Codification
-Section 50
-Paragraph 6
-Publisher FASB
-URI https://asc.fasb.org//1943274/2147482765/220-10-50-6
Reference 17: http://www.xbrl.org/2003/role/disclosureRef
-Topic 470
-SubTopic 10
-Name Accounting Standards Codification
-Section S99
-Paragraph 1A
-Subparagraph (SX 210.13-01(a)(4)(i))
-Publisher FASB
-URI https://asc.fasb.org//1943274/2147480097/470-10-S99-1A
Reference 18: http://www.xbrl.org/2009/role/commonPracticeRef
-Topic 470
-SubTopic 10
-Name Accounting Standards Codification
-Section S99
-Paragraph 1A
-Subparagraph (SX 210.13-01(a)(4)(ii))
-Publisher FASB
-URI https://asc.fasb.org//1943274/2147480097/470-10-S99-1A
Reference 19: http://www.xbrl.org/2003/role/disclosureRef
-Topic 470
-SubTopic 10
-Name Accounting Standards Codification
-Section S99
-Paragraph 1A
-Subparagraph (SX 210.13-01(a)(4)(iii)(A))
-Publisher FASB
-URI https://asc.fasb.org//1943274/2147480097/470-10-S99-1A
Reference 20: http://www.xbrl.org/2003/role/disclosureRef
-Topic 470
-SubTopic 10
-Name Accounting Standards Codification
-Section S99
-Paragraph 1A
-Subparagraph (SX 210.13-01(a)(4)(iv))
-Publisher FASB
-URI https://asc.fasb.org//1943274/2147480097/470-10-S99-1A
Reference 21: http://www.xbrl.org/2003/role/disclosureRef
-Topic 470
-SubTopic 10
-Name Accounting Standards Codification
-Section S99
-Paragraph 1A
-Subparagraph (SX 210.13-01(a)(5))
-Publisher FASB
-URI https://asc.fasb.org//1943274/2147480097/470-10-S99-1A
Reference 22: http://www.xbrl.org/2003/role/disclosureRef
-Topic 470
-SubTopic 10
-Name Accounting Standards Codification
-Section S99
-Paragraph 1B
-Subparagraph (SX 210.13-02(a)(4)(i))
-Publisher FASB
-URI https://asc.fasb.org//1943274/2147480097/470-10-S99-1B
Reference 23: http://www.xbrl.org/2003/role/disclosureRef
-Topic 470
-SubTopic 10
-Name Accounting Standards Codification
-Section S99
-Paragraph 1B
-Subparagraph (SX 210.13-02(a)(4)(iii)(A))
-Publisher FASB
-URI https://asc.fasb.org//1943274/2147480097/470-10-S99-1B
Reference 24: http://www.xbrl.org/2003/role/disclosureRef
-Topic 470
-SubTopic 10
-Name Accounting Standards Codification
-Section S99
-Paragraph 1B
-Subparagraph (SX 210.13-02(a)(4)(iii)(B))
-Publisher FASB
-URI https://asc.fasb.org//1943274/2147480097/470-10-S99-1B
Reference 25: http://www.xbrl.org/2003/role/disclosureRef
-Topic 470
-SubTopic 10
-Name Accounting Standards Codification
-Section S99
-Paragraph 1B
-Subparagraph (SX 210.13-02(a)(4)(iv))
-Publisher FASB
-URI https://asc.fasb.org//1943274/2147480097/470-10-S99-1B
Reference 26: http://www.xbrl.org/2003/role/disclosureRef
-Topic 470
-SubTopic 10
-Name Accounting Standards Codification
-Section S99
-Paragraph 1B
-Subparagraph (SX 210.13-02(a)(5))
-Publisher FASB
-URI https://asc.fasb.org//1943274/2147480097/470-10-S99-1B
Reference 27: http://www.xbrl.org/2003/role/disclosureRef
-Topic 280
-SubTopic 10
-Name Accounting Standards Codification
-Section 50
-Paragraph 30
-Subparagraph (b)
-Publisher FASB
-URI https://asc.fasb.org//1943274/2147482810/280-10-50-30
Reference 28: http://www.xbrl.org/2003/role/disclosureRef
-Topic 280
-SubTopic 10
-Name Accounting Standards Codification
-Section 50
-Paragraph 32
-Subparagraph (f)
-Publisher FASB
-URI https://asc.fasb.org//1943274/2147482810/280-10-50-32
Reference 29: http://www.xbrl.org/2003/role/exampleRef
-Topic 280
-SubTopic 10
-Name Accounting Standards Codification
-Section 50
-Paragraph 31
-Publisher FASB
-URI https://asc.fasb.org//1943274/2147482810/280-10-50-31
Reference 30: http://www.xbrl.org/2003/role/disclosureRef
-Topic 280
-SubTopic 10
-Name Accounting Standards Codification
-Section 50
-Paragraph 32
-Subparagraph (c)
-Publisher FASB
-URI https://asc.fasb.org//1943274/2147482810/280-10-50-32
Reference 31: http://www.xbrl.org/2003/role/disclosureRef
-Topic 942
-SubTopic 235
-Name Accounting Standards Codification
-Section S99
-Paragraph 1
-Subparagraph (SX 210.9-05(b)(2))
-Publisher FASB
-URI https://asc.fasb.org//1943274/2147479557/942-235-S99-1
Reference 32: http://www.xbrl.org/2003/role/disclosureRef
-Topic 205
-SubTopic 20
-Name Accounting Standards Codification
-Section 50
-Paragraph 7
-Publisher FASB
-URI https://asc.fasb.org//1943274/2147483499/205-20-50-7
Reference 33: http://www.xbrl.org/2003/role/exampleRef
-Topic 810
-SubTopic 10
-Name Accounting Standards Codification
-Section 55
-Paragraph 4J
-Publisher FASB
-URI https://asc.fasb.org//1943274/2147481175/810-10-55-4J
Reference 34: http://www.xbrl.org/2003/role/exampleRef
-Topic 810
-SubTopic 10
-Name Accounting Standards Codification
-Section 55
-Paragraph 4K
-Publisher FASB
-URI https://asc.fasb.org//1943274/2147481175/810-10-55-4K
Reference 35: http://www.xbrl.org/2003/role/disclosureRef
-Topic 220
-SubTopic 10
-Name Accounting Standards Codification
-Section 45
-Paragraph 1A
-Subparagraph (a)
-Publisher FASB
-URI https://asc.fasb.org//1943274/2147482790/220-10-45-1A
Reference 36: http://www.xbrl.org/2003/role/disclosureRef
-Topic 220
-SubTopic 10
-Name Accounting Standards Codification
-Section 45
-Paragraph 1B
-Subparagraph (a)
-Publisher FASB
-URI https://asc.fasb.org//1943274/2147482790/220-10-45-1B
Reference 37: http://www.xbrl.org/2003/role/disclosureRef
-Topic 230
-SubTopic 10
-Name Accounting Standards Codification
-Section 45
-Paragraph 2
-Publisher FASB
-URI https://asc.fasb.org//1943274/2147482740/230-10-45-2
Reference 38: http://www.xbrl.org/2003/role/disclosureRef
-Topic 810
-SubTopic 10
-Name Accounting Standards Codification
-Section 50
-Paragraph 1A
-Subparagraph (a)(1)
-Publisher FASB
-URI https://asc.fasb.org//1943274/2147481203/810-10-50-1A
Reference 39: http://www.xbrl.org/2003/role/disclosureRef
-Topic 810
-SubTopic 10
-Name Accounting Standards Codification
-Section 50
-Paragraph 1A
-Subparagraph (c)(1)
-Publisher FASB
-URI https://asc.fasb.org//1943274/2147481203/810-10-50-1A
| Name: |
us-gaap_ProfitLoss |
| Namespace Prefix: |
us-gaap_ |
| Data Type: |
xbrli:monetaryItemType |
| Balance Type: |
credit |
| Period Type: |
duration |
|
| X |
- DefinitionThe number of shares issued during the period upon the conversion of units. An example of a convertible unit is an umbrella partnership real estate investment trust unit (UPREIT unit). Reference 1: http://fasb.org/us-gaap/role/ref/legacyRef
-Name Accounting Standards Codification
-Section 50
-Paragraph 2
-SubTopic 10
-Topic 505
-Publisher FASB
-URI https://asc.fasb.org//1943274/2147481112/505-10-50-2
Reference 2: http://fasb.org/us-gaap/role/ref/legacyRef
-Topic 210
-SubTopic 10
-Name Accounting Standards Codification
-Section S99
-Paragraph 1
-Subparagraph (SX 210.5-02(28))
-Publisher FASB
-URI https://asc.fasb.org//1943274/2147480566/210-10-S99-1
Reference 3: http://fasb.org/us-gaap/role/ref/legacyRef
-Topic 505
-SubTopic 10
-Name Accounting Standards Codification
-Section S99
-Paragraph 1
-Subparagraph (SX 210.3-04)
-Publisher FASB
-URI https://asc.fasb.org//1943274/2147480008/505-10-S99-1
Reference 4: http://fasb.org/us-gaap/role/ref/legacyRef
-Topic 210
-SubTopic 10
-Name Accounting Standards Codification
-Section S99
-Paragraph 1
-Subparagraph (SX 210.5-02(29))
-Publisher FASB
-URI https://asc.fasb.org//1943274/2147480566/210-10-S99-1
Reference 5: http://fasb.org/us-gaap/role/ref/legacyRef
-Name Accounting Standards Codification
-Topic 505
-SubTopic 10
-Section 50
-Paragraph 3
-Publisher FASB
-URI https://asc.fasb.org//1943274/2147481112/505-10-50-3
| Name: |
us-gaap_StockIssuedDuringPeriodSharesConversionOfUnits |
| Namespace Prefix: |
us-gaap_ |
| Data Type: |
xbrli:sharesItemType |
| Balance Type: |
na |
| Period Type: |
duration |
|
| X |
- DefinitionValue of stock issued during the period upon the conversion of units. An example of a convertible unit is an umbrella partnership real estate investment trust unit (UPREIT unit). Reference 1: http://fasb.org/us-gaap/role/ref/legacyRef
-Name Accounting Standards Codification
-Section 50
-Paragraph 2
-SubTopic 10
-Topic 505
-Publisher FASB
-URI https://asc.fasb.org//1943274/2147481112/505-10-50-2
Reference 2: http://fasb.org/us-gaap/role/ref/legacyRef
-Topic 505
-SubTopic 10
-Name Accounting Standards Codification
-Section S99
-Paragraph 1
-Subparagraph (SX 210.3-04)
-Publisher FASB
-URI https://asc.fasb.org//1943274/2147480008/505-10-S99-1
Reference 3: http://fasb.org/us-gaap/role/ref/legacyRef
-Name Accounting Standards Codification
-Topic 210
-SubTopic 10
-Section S99
-Paragraph 1
-Subparagraph (SX 210.5-02.29-31)
-Publisher FASB
-URI https://asc.fasb.org//1943274/2147480566/210-10-S99-1
| Name: |
us-gaap_StockIssuedDuringPeriodValueConversionOfUnits |
| Namespace Prefix: |
us-gaap_ |
| Data Type: |
xbrli:monetaryItemType |
| Balance Type: |
credit |
| Period Type: |
duration |
|
| X |
- DefinitionNumber of shares that have been repurchased and retired during the period. Reference 1: http://fasb.org/us-gaap/role/ref/legacyRef
-Name Accounting Standards Codification
-Section 50
-Paragraph 2
-SubTopic 10
-Topic 505
-Publisher FASB
-URI https://asc.fasb.org//1943274/2147481112/505-10-50-2
Reference 2: http://fasb.org/us-gaap/role/ref/legacyRef
-Topic 210
-SubTopic 10
-Name Accounting Standards Codification
-Section S99
-Paragraph 1
-Subparagraph (SX 210.5-02(28))
-Publisher FASB
-URI https://asc.fasb.org//1943274/2147480566/210-10-S99-1
Reference 3: http://fasb.org/us-gaap/role/ref/legacyRef
-Topic 505
-SubTopic 10
-Name Accounting Standards Codification
-Section S99
-Paragraph 1
-Subparagraph (SX 210.3-04)
-Publisher FASB
-URI https://asc.fasb.org//1943274/2147480008/505-10-S99-1
Reference 4: http://fasb.org/us-gaap/role/ref/legacyRef
-Topic 210
-SubTopic 10
-Name Accounting Standards Codification
-Section S99
-Paragraph 1
-Subparagraph (SX 210.5-02(29))
-Publisher FASB
-URI https://asc.fasb.org//1943274/2147480566/210-10-S99-1
| Name: |
us-gaap_StockRepurchasedAndRetiredDuringPeriodShares |
| Namespace Prefix: |
us-gaap_ |
| Data Type: |
xbrli:sharesItemType |
| Balance Type: |
na |
| Period Type: |
duration |
|
| X |
- DefinitionEquity impact of the value of stock that has been repurchased and retired during the period. The excess of the purchase price over par value can be charged against retained earnings (once the excess is fully allocated to additional paid in capital). Reference 1: http://fasb.org/us-gaap/role/ref/legacyRef
-Name Accounting Standards Codification
-Section 50
-Paragraph 2
-SubTopic 10
-Topic 505
-Publisher FASB
-URI https://asc.fasb.org//1943274/2147481112/505-10-50-2
Reference 2: http://fasb.org/us-gaap/role/ref/legacyRef
-Topic 210
-SubTopic 10
-Name Accounting Standards Codification
-Section S99
-Paragraph 1
-Subparagraph (SX 210.5-02(28))
-Publisher FASB
-URI https://asc.fasb.org//1943274/2147480566/210-10-S99-1
Reference 3: http://fasb.org/us-gaap/role/ref/legacyRef
-Topic 505
-SubTopic 10
-Name Accounting Standards Codification
-Section S99
-Paragraph 1
-Subparagraph (SX 210.3-04)
-Publisher FASB
-URI https://asc.fasb.org//1943274/2147480008/505-10-S99-1
Reference 4: http://fasb.org/us-gaap/role/ref/legacyRef
-Topic 210
-SubTopic 10
-Name Accounting Standards Codification
-Section S99
-Paragraph 1
-Subparagraph (SX 210.5-02(29))
-Publisher FASB
-URI https://asc.fasb.org//1943274/2147480566/210-10-S99-1
| Name: |
us-gaap_StockRepurchasedAndRetiredDuringPeriodValue |
| Namespace Prefix: |
us-gaap_ |
| Data Type: |
xbrli:monetaryItemType |
| Balance Type: |
debit |
| Period Type: |
duration |
|
| X |
- DefinitionAmount of equity (deficit) attributable to parent and noncontrolling interest. Excludes temporary equity. Reference 1: http://www.xbrl.org/2003/role/disclosureRef
-Topic 250
-SubTopic 10
-Name Accounting Standards Codification
-Section 45
-Paragraph 24
-Publisher FASB
-URI https://asc.fasb.org//1943274/2147483421/250-10-45-24
Reference 2: http://www.xbrl.org/2003/role/disclosureRef
-Topic 250
-SubTopic 10
-Name Accounting Standards Codification
-Section 45
-Paragraph 23
-Subparagraph (b)
-Publisher FASB
-URI https://asc.fasb.org//1943274/2147483421/250-10-45-23
Reference 3: http://www.xbrl.org/2003/role/disclosureRef
-Topic 250
-SubTopic 10
-Name Accounting Standards Codification
-Section 45
-Paragraph 5
-Subparagraph (b)
-Publisher FASB
-URI https://asc.fasb.org//1943274/2147483421/250-10-45-5
Reference 4: http://www.xbrl.org/2003/role/disclosureRef
-Topic 326
-SubTopic 10
-Name Accounting Standards Codification
-Section 65
-Paragraph 5
-Subparagraph (c)(2)
-Publisher FASB
-URI https://asc.fasb.org//1943274/2147479654/326-10-65-5
Reference 5: http://www.xbrl.org/2003/role/disclosureRef
-Topic 815
-SubTopic 20
-Name Accounting Standards Codification
-Section 65
-Paragraph 6
-Subparagraph (e)
-Publisher FASB
-URI https://asc.fasb.org//1943274/2147480528/815-20-65-6
Reference 6: http://www.xbrl.org/2003/role/disclosureRef
-Topic 815
-SubTopic 20
-Name Accounting Standards Codification
-Section 65
-Paragraph 6
-Subparagraph (h)(1)
-Publisher FASB
-URI https://asc.fasb.org//1943274/2147480528/815-20-65-6
Reference 7: http://www.xbrl.org/2003/role/disclosureRef
-Topic 815
-SubTopic 20
-Name Accounting Standards Codification
-Section 65
-Paragraph 6
-Subparagraph (h)(1)(i)
-Publisher FASB
-URI https://asc.fasb.org//1943274/2147480528/815-20-65-6
Reference 8: http://www.xbrl.org/2003/role/disclosureRef
-Topic 815
-SubTopic 20
-Name Accounting Standards Codification
-Section 65
-Paragraph 6
-Subparagraph (h)(1)(iii)
-Publisher FASB
-URI https://asc.fasb.org//1943274/2147480528/815-20-65-6
Reference 9: http://www.xbrl.org/2003/role/disclosureRef
-Topic 815
-SubTopic 20
-Name Accounting Standards Codification
-Section 65
-Paragraph 6
-Subparagraph (h)(1)(iv)
-Publisher FASB
-URI https://asc.fasb.org//1943274/2147480528/815-20-65-6
Reference 10: http://www.xbrl.org/2003/role/disclosureRef
-Topic 815
-SubTopic 20
-Name Accounting Standards Codification
-Section 65
-Paragraph 6
-Subparagraph (i)(3)
-Publisher FASB
-URI https://asc.fasb.org//1943274/2147480528/815-20-65-6
Reference 11: http://www.xbrl.org/2003/role/disclosureRef
-Topic 848
-SubTopic 10
-Name Accounting Standards Codification
-Section 65
-Paragraph 2
-Subparagraph (a)(3)(iii)(03)
-Publisher FASB
-URI https://asc.fasb.org//1943274/2147483550/848-10-65-2
Reference 12: http://www.xbrl.org/2003/role/disclosureRef
-Topic 105
-SubTopic 10
-Name Accounting Standards Codification
-Section 65
-Paragraph 6
-Subparagraph (c)
-Publisher FASB
-URI https://asc.fasb.org//1943274/2147479343/105-10-65-6
Reference 13: http://www.xbrl.org/2003/role/disclosureRef
-Topic 105
-SubTopic 10
-Name Accounting Standards Codification
-Section 65
-Paragraph 6
-Subparagraph (d)
-Publisher FASB
-URI https://asc.fasb.org//1943274/2147479343/105-10-65-6
Reference 14: http://www.xbrl.org/2003/role/disclosureRef
-Topic 944
-SubTopic 40
-Name Accounting Standards Codification
-Section 65
-Paragraph 2
-Subparagraph (f)(1)
-Publisher FASB
-URI https://asc.fasb.org//1943274/2147480016/944-40-65-2
Reference 15: http://www.xbrl.org/2003/role/disclosureRef
-Topic 944
-SubTopic 40
-Name Accounting Standards Codification
-Section 65
-Paragraph 2
-Subparagraph (f)(2)
-Publisher FASB
-URI https://asc.fasb.org//1943274/2147480016/944-40-65-2
Reference 16: http://www.xbrl.org/2003/role/disclosureRef
-Topic 740
-SubTopic 10
-Name Accounting Standards Codification
-Section 65
-Paragraph 8
-Subparagraph (d)(2)
-Publisher FASB
-URI https://asc.fasb.org//1943274/2147482615/740-10-65-8
Reference 17: http://www.xbrl.org/2003/role/disclosureRef
-Topic 740
-SubTopic 10
-Name Accounting Standards Codification
-Section 65
-Paragraph 8
-Subparagraph (d)(3)
-Publisher FASB
-URI https://asc.fasb.org//1943274/2147482615/740-10-65-8
Reference 18: http://www.xbrl.org/2003/role/disclosureRef
-Topic 326
-SubTopic 10
-Name Accounting Standards Codification
-Section 65
-Paragraph 4
-Subparagraph (d)
-Publisher FASB
-URI https://asc.fasb.org//1943274/2147479654/326-10-65-4
Reference 19: http://www.xbrl.org/2003/role/disclosureRef
-Topic 718
-SubTopic 10
-Name Accounting Standards Codification
-Section 65
-Paragraph 15
-Subparagraph (e)
-Publisher FASB
-URI https://asc.fasb.org//1943274/2147480336/718-10-65-15
Reference 20: http://www.xbrl.org/2003/role/disclosureRef
-Topic 718
-SubTopic 10
-Name Accounting Standards Codification
-Section 65
-Paragraph 15
-Subparagraph (f)(1)
-Publisher FASB
-URI https://asc.fasb.org//1943274/2147480336/718-10-65-15
Reference 21: http://www.xbrl.org/2003/role/disclosureRef
-Topic 718
-SubTopic 10
-Name Accounting Standards Codification
-Section 65
-Paragraph 15
-Subparagraph (f)(2)
-Publisher FASB
-URI https://asc.fasb.org//1943274/2147480336/718-10-65-15
Reference 22: http://www.xbrl.org/2003/role/disclosureRef
-Topic 250
-SubTopic 10
-Name Accounting Standards Codification
-Section 50
-Paragraph 1
-Subparagraph (b)(3)
-Publisher FASB
-URI https://asc.fasb.org//1943274/2147483443/250-10-50-1
Reference 23: http://www.xbrl.org/2003/role/disclosureRef
-Topic 815
-SubTopic 40
-Name Accounting Standards Codification
-Section 65
-Paragraph 1
-Subparagraph (e)(3)
-Publisher FASB
-URI https://asc.fasb.org//1943274/2147480175/815-40-65-1
Reference 24: http://www.xbrl.org/2003/role/disclosureRef
-Topic 250
-SubTopic 10
-Name Accounting Standards Codification
-Section 50
-Paragraph 7
-Subparagraph (b)
-Publisher FASB
-URI https://asc.fasb.org//1943274/2147483443/250-10-50-7
Reference 25: http://www.xbrl.org/2003/role/disclosureRef
-Topic 220
-SubTopic 10
-Name Accounting Standards Codification
-Section 50
-Paragraph 5
-Publisher FASB
-URI https://asc.fasb.org//1943274/2147482765/220-10-50-5
Reference 26: http://www.xbrl.org/2003/role/disclosureRef
-Topic 830
-SubTopic 30
-Name Accounting Standards Codification
-Section 50
-Paragraph 1
-Publisher FASB
-URI https://asc.fasb.org//1943274/2147481674/830-30-50-1
Reference 27: http://www.xbrl.org/2003/role/disclosureRef
-Topic 830
-SubTopic 30
-Name Accounting Standards Codification
-Section 45
-Paragraph 17
-Publisher FASB
-URI https://asc.fasb.org//1943274/2147481694/830-30-45-17
Reference 28: http://www.xbrl.org/2003/role/disclosureRef
-Topic 830
-SubTopic 30
-Name Accounting Standards Codification
-Section 45
-Paragraph 20
-Subparagraph (a)
-Publisher FASB
-URI https://asc.fasb.org//1943274/2147481694/830-30-45-20
Reference 29: http://www.xbrl.org/2003/role/exampleRef
-Topic 946
-SubTopic 830
-Name Accounting Standards Codification
-Section 55
-Paragraph 11
-Publisher FASB
-URI https://asc.fasb.org//1943274/2147480167/946-830-55-11
Reference 30: http://www.xbrl.org/2003/role/disclosureRef
-Topic 946
-SubTopic 205
-Name Accounting Standards Codification
-Section 45
-Paragraph 3
-Publisher FASB
-URI https://asc.fasb.org//1943274/2147480767/946-205-45-3
Reference 31: http://www.xbrl.org/2003/role/disclosureRef
-Topic 946
-SubTopic 505
-Name Accounting Standards Codification
-Section 50
-Paragraph 3
-Publisher FASB
-URI https://asc.fasb.org//1943274/2147481004/946-505-50-3
Reference 32: http://www.xbrl.org/2003/role/disclosureRef
-Topic 946
-SubTopic 210
-Name Accounting Standards Codification
-Section S99
-Paragraph 1
-Subparagraph (SX 210.6-04(19))
-Publisher FASB
-URI https://asc.fasb.org//1943274/2147479617/946-210-S99-1
Reference 33: http://www.xbrl.org/2003/role/disclosureRef
-Topic 946
-SubTopic 210
-Name Accounting Standards Codification
-Section S99
-Paragraph 2
-Subparagraph (SX 210.6-05(4))
-Publisher FASB
-URI https://asc.fasb.org//1943274/2147479617/946-210-S99-2
Reference 34: http://www.xbrl.org/2009/role/commonPracticeRef
-Topic 946
-SubTopic 220
-Name Accounting Standards Codification
-Section S99
-Paragraph 3
-Subparagraph (SX 210.6-09(4)(b))
-Publisher FASB
-URI https://asc.fasb.org//1943274/2147483575/946-220-S99-3
Reference 35: http://www.xbrl.org/2003/role/disclosureRef
-Topic 946
-SubTopic 220
-Name Accounting Standards Codification
-Section S99
-Paragraph 3
-Subparagraph (SX 210.6-09(6))
-Publisher FASB
-URI https://asc.fasb.org//1943274/2147483575/946-220-S99-3
Reference 36: http://www.xbrl.org/2003/role/disclosureRef
-Topic 946
-SubTopic 220
-Name Accounting Standards Codification
-Section S99
-Paragraph 3
-Subparagraph (SX 210.6-09(7))
-Publisher FASB
-URI https://asc.fasb.org//1943274/2147483575/946-220-S99-3
Reference 37: http://www.xbrl.org/2003/role/disclosureRef
-Topic 505
-SubTopic 10
-Name Accounting Standards Codification
-Section S99
-Paragraph 1
-Subparagraph (SX 210.3-04)
-Publisher FASB
-URI https://asc.fasb.org//1943274/2147480008/505-10-S99-1
Reference 38: http://www.xbrl.org/2009/role/commonPracticeRef
-Topic 235
-SubTopic 10
-Name Accounting Standards Codification
-Section S99
-Paragraph 1
-Subparagraph (SX 210.4-08(g)(1)(ii))
-Publisher FASB
-URI https://asc.fasb.org//1943274/2147480678/235-10-S99-1
Reference 39: http://www.xbrl.org/2009/role/commonPracticeRef
-Topic 323
-SubTopic 10
-Name Accounting Standards Codification
-Section 50
-Paragraph 3
-Subparagraph (c)
-Publisher FASB
-URI https://asc.fasb.org//1943274/2147481687/323-10-50-3
Reference 40: http://www.xbrl.org/2009/role/commonPracticeRef
-Topic 825
-SubTopic 10
-Name Accounting Standards Codification
-Section 50
-Paragraph 28
-Subparagraph (f)
-Publisher FASB
-URI https://asc.fasb.org//1943274/2147482907/825-10-50-28
Reference 41: http://fasb.org/us-gaap/role/ref/legacyRef
-Name Accounting Standards Codification
-Topic 810
-SubTopic 10
-Section 45
-Paragraph 15
-Publisher FASB
-URI https://asc.fasb.org//1943274/2147481231/810-10-45-15
Reference 42: http://fasb.org/us-gaap/role/ref/legacyRef
-Name Accounting Standards Codification
-Topic 810
-SubTopic 10
-Section 45
-Paragraph 16
-Publisher FASB
-URI https://asc.fasb.org//1943274/2147481231/810-10-45-16
Reference 43: http://fasb.org/us-gaap/role/ref/legacyRef
-Name Accounting Standards Codification
-Topic 810
-SubTopic 10
-Section 55
-Paragraph 4I
-Publisher FASB
-URI https://asc.fasb.org//1943274/2147481175/810-10-55-4I
| Name: |
us-gaap_StockholdersEquityIncludingPortionAttributableToNoncontrollingInterest |
| Namespace Prefix: |
us-gaap_ |
| Data Type: |
xbrli:monetaryItemType |
| Balance Type: |
credit |
| Period Type: |
instant |
|
v3.23.3
Consolidated Statements of Cash Flows - USD ($)
$ in Thousands |
9 Months Ended |
Sep. 30, 2023 |
Sep. 30, 2022 |
| Operating Activities |
|
|
| Net (loss) income |
$ (19,932)
|
$ 71,309
|
| Adjustments to reconcile net (loss) income to net cash provided by operating activities: |
|
|
| Income from unconsolidated Fund |
(1,177)
|
(921)
|
| Depreciation and amortization |
336,771
|
279,588
|
| Net accretion of acquired lease intangibles |
(8,156)
|
(8,050)
|
| Straight-line rent |
(2,007)
|
(880)
|
| Loan premium amortized and written off |
(344)
|
(344)
|
| Deferred loan costs amortized and written off |
6,623
|
5,908
|
| Amortization of stock-based compensation |
7,553
|
7,156
|
| Operating distributions from unconsolidated Fund |
957
|
921
|
| Purchase of interest rate caps |
(1,622)
|
0
|
| Change in working capital components: |
|
|
| Tenant receivables |
(1,676)
|
4,156
|
| Interest payable, accounts payable and deferred revenue |
41,277
|
31,825
|
| Security deposits |
974
|
4,508
|
| Other assets |
(27,032)
|
(13,507)
|
| Net cash provided by operating activities |
332,209
|
381,669
|
| Investing Activities |
|
|
| Capital expenditures for improvements to real estate |
(144,842)
|
(111,495)
|
| Capital expenditures for developments |
(37,297)
|
(60,762)
|
| Insurance recoveries for damage to real estate |
1,686
|
4,274
|
| Property acquisition |
0
|
(330,470)
|
| Capital distributions from unconsolidated Fund |
80
|
1,454
|
| Net cash used in investing activities |
(180,373)
|
(496,999)
|
| Financing Activities |
|
|
| Proceeds from borrowings |
505,000
|
230,000
|
| Repayment of borrowings |
(155,642)
|
(55,614)
|
| Loan cost payments |
(5,678)
|
(1,620)
|
| Purchase of interest rate caps |
0
|
(481)
|
| Proceeds from sale of interest rate cap |
0
|
444
|
| Contributions from noncontrolling interests in consolidated JVs |
125
|
81,000
|
| Distributions paid to noncontrolling interests |
(30,433)
|
(45,376)
|
| Dividends paid to common stockholders |
(98,215)
|
(147,584)
|
| Repurchases of OP Units |
(367)
|
(336)
|
| Repurchases of common stock |
(109,233)
|
0
|
| Net cash provided by financing activities |
105,557
|
60,433
|
| Increase (decrease) in cash and cash equivalents and restricted cash |
257,393
|
(54,897)
|
| Cash and cash equivalents and restricted cash - beginning balance |
268,938
|
336,006
|
| Cash and cash equivalents and restricted cash - ending balance |
526,331
|
281,109
|
| Cash and cash equivalents |
526,230
|
281,008
|
| Restricted cash |
101
|
101
|
| Cash and cash equivalents and restricted cash |
526,331
|
281,109
|
| Operating Activities |
|
|
| Cash paid for interest, net of capitalized interest |
141,081
|
103,666
|
| Capitalized interest paid |
1,296
|
7,357
|
| Non-cash Investing Transactions |
|
|
| Accrual for real estate and development capital expenditures |
19,261
|
19,508
|
| Capitalized stock-based compensation for improvements to real estate and developments |
2,209
|
2,455
|
| Removal of fully depreciated and amortized buildings, building improvements, tenant improvements and lease intangibles |
74,277
|
57,177
|
| Removal of fully amortized acquired lease intangible assets |
255
|
1,221
|
| Removal of fully accreted acquired lease intangible liabilities |
14,504
|
9,831
|
| Non-cash Financing Transactions |
|
|
| Gain recorded in AOCI |
83,157
|
318,408
|
| Dividends declared |
96,492
|
147,656
|
| Exchange of OP Units for common stock |
0
|
4,236
|
| Unconsolidated Funds |
|
|
| Non-cash Financing Transactions |
|
|
| Gain recorded in AOCI |
$ 1,185
|
$ 3,777
|
| X |
- DefinitionChange In Capital Expenditures Incurred But Not Yet Paid, Improvements To Real Estate
| Name: |
nysedei_ChangeInCapitalExpendituresIncurredButNotYetPaidImprovementsToRealEstate |
| Namespace Prefix: |
nysedei_ |
| Data Type: |
xbrli:monetaryItemType |
| Balance Type: |
credit |
| Period Type: |
duration |
|
| X |
- DefinitionFinite-Lived Intangible Asset, Off-market Lease, Favorable, Fully Amortized, Written Off
| Name: |
nysedei_FiniteLivedIntangibleAssetOffmarketLeaseFavorableFullyAmortizedWrittenOff |
| Namespace Prefix: |
nysedei_ |
| Data Type: |
xbrli:monetaryItemType |
| Balance Type: |
debit |
| Period Type: |
duration |
|
| X |
- DefinitionFinite-Lived Intangible Asset, Off-market Lease, Fully Accreted, Written Off
| Name: |
nysedei_FiniteLivedIntangibleAssetOffmarketLeaseFullyAccretedWrittenOff |
| Namespace Prefix: |
nysedei_ |
| Data Type: |
xbrli:monetaryItemType |
| Balance Type: |
debit |
| Period Type: |
duration |
|
| X |
- DefinitionPayments For Capital Development
| Name: |
nysedei_PaymentsForCapitalDevelopment |
| Namespace Prefix: |
nysedei_ |
| Data Type: |
xbrli:monetaryItemType |
| Balance Type: |
credit |
| Period Type: |
duration |
|
| X |
- DefinitionPayments for Derivative Instrument, Operating Activities
| Name: |
nysedei_PaymentsForDerivativeInstrumentOperatingActivities |
| Namespace Prefix: |
nysedei_ |
| Data Type: |
xbrli:monetaryItemType |
| Balance Type: |
credit |
| Period Type: |
duration |
|
| X |
- DefinitionTenant Improvements And Leasing Intangibles, Fully Depreciated And Amortized, Written Off
| Name: |
nysedei_TenantImprovementsAndLeasingIntangiblesFullyDepreciatedAndAmortizedWrittenOff |
| Namespace Prefix: |
nysedei_ |
| Data Type: |
xbrli:monetaryItemType |
| Balance Type: |
debit |
| Period Type: |
duration |
|
| X |
- References
+ Details
| Name: |
us-gaap_AdjustmentsToReconcileNetIncomeLossToCashProvidedByUsedInOperatingActivitiesAbstract |
| Namespace Prefix: |
us-gaap_ |
| Data Type: |
xbrli:stringItemType |
| Balance Type: |
na |
| Period Type: |
duration |
|
| X |
- DefinitionAmount of non-cash amortization of intangible asset (liability) for above and below market leases. Reference 1: http://www.xbrl.org/2009/role/commonPracticeRef
-Topic 230
-SubTopic 10
-Name Accounting Standards Codification
-Section 45
-Paragraph 28
-Subparagraph (b)
-Publisher FASB
-URI https://asc.fasb.org//1943274/2147482740/230-10-45-28
| Name: |
us-gaap_AmortizationOfAboveAndBelowMarketLeases |
| Namespace Prefix: |
us-gaap_ |
| Data Type: |
xbrli:monetaryItemType |
| Balance Type: |
debit |
| Period Type: |
duration |
|
| X |
- DefinitionAmount of noncash expense included in interest expense to amortize debt discount and premium associated with the related debt instruments. Excludes amortization of financing costs. Alternate captions include noncash interest expense. Reference 1: http://fasb.org/us-gaap/role/ref/legacyRef
-Name Accounting Standards Codification
-Section 45
-Paragraph 28
-Subparagraph (b)
-SubTopic 10
-Topic 230
-Publisher FASB
-URI https://asc.fasb.org//1943274/2147482740/230-10-45-28
Reference 2: http://www.xbrl.org/2003/role/disclosureRef
-Topic 470
-SubTopic 20
-Name Accounting Standards Codification
-Section 50
-Paragraph 1F
-Subparagraph (b)(2)
-Publisher FASB
-URI https://asc.fasb.org//1943274/2147481139/470-20-50-1F
Reference 3: http://fasb.org/us-gaap/role/ref/legacyRef
-Name Accounting Standards Codification
-Topic 835
-SubTopic 30
-Section 45
-Paragraph 1A
-Publisher FASB
-URI https://asc.fasb.org//1943274/2147482925/835-30-45-1A
Reference 4: http://fasb.org/us-gaap/role/ref/legacyRef
-Topic 220
-SubTopic 10
-Name Accounting Standards Codification
-Section S99
-Paragraph 2
-Subparagraph (SX 210.5-03.8)
-Publisher FASB
-URI https://asc.fasb.org//1943274/2147483621/220-10-S99-2
| Name: |
us-gaap_AmortizationOfDebtDiscountPremium |
| Namespace Prefix: |
us-gaap_ |
| Data Type: |
xbrli:monetaryItemType |
| Balance Type: |
debit |
| Period Type: |
duration |
|
| X |
- DefinitionAmount of amortization expense attributable to debt issuance costs. Reference 1: http://www.xbrl.org/2003/role/disclosureRef
-Topic 470
-SubTopic 20
-Name Accounting Standards Codification
-Section 50
-Paragraph 1F
-Subparagraph (b)(2)
-Publisher FASB
-URI https://asc.fasb.org//1943274/2147481139/470-20-50-1F
Reference 2: http://www.xbrl.org/2009/role/commonPracticeRef
-Topic 230
-SubTopic 10
-Name Accounting Standards Codification
-Section 45
-Paragraph 28
-Subparagraph (b)
-Publisher FASB
-URI https://asc.fasb.org//1943274/2147482740/230-10-45-28
Reference 3: http://www.xbrl.org/2003/role/disclosureRef
-Topic 835
-SubTopic 30
-Name Accounting Standards Codification
-Section 45
-Paragraph 3
-Publisher FASB
-URI https://asc.fasb.org//1943274/2147482925/835-30-45-3
Reference 4: http://fasb.org/us-gaap/role/ref/legacyRef
-Topic 220
-SubTopic 10
-Name Accounting Standards Codification
-Section S99
-Paragraph 2
-Subparagraph (SX 210.5-03(8))
-Publisher FASB
-URI https://asc.fasb.org//1943274/2147483621/220-10-S99-2
| Name: |
us-gaap_AmortizationOfFinancingCosts |
| Namespace Prefix: |
us-gaap_ |
| Data Type: |
xbrli:monetaryItemType |
| Balance Type: |
debit |
| Period Type: |
duration |
|
| X |
- DefinitionAmount of currency on hand as well as demand deposits with banks or financial institutions. Includes other kinds of accounts that have the general characteristics of demand deposits. Also includes short-term, highly liquid investments that are both readily convertible to known amounts of cash and so near their maturity that they present insignificant risk of changes in value because of changes in interest rates. Excludes cash and cash equivalents within disposal group and discontinued operation. Reference 1: http://www.xbrl.org/2003/role/disclosureRef
-Topic 210
-SubTopic 10
-Name Accounting Standards Codification
-Section S99
-Paragraph 1
-Subparagraph (SX 210.5-02(1))
-Publisher FASB
-URI https://asc.fasb.org//1943274/2147480566/210-10-S99-1
Reference 2: http://www.xbrl.org/2003/role/exampleRef
-Topic 210
-SubTopic 10
-Name Accounting Standards Codification
-Section 45
-Paragraph 1
-Subparagraph (a)
-Publisher FASB
-URI https://asc.fasb.org//1943274/2147483467/210-10-45-1
Reference 3: http://fasb.org/us-gaap/role/ref/legacyRef
-Name Accounting Standards Codification
-Topic 230
-SubTopic 10
-Section 45
-Paragraph 4
-Publisher FASB
-URI https://asc.fasb.org//1943274/2147482740/230-10-45-4
| Name: |
us-gaap_CashAndCashEquivalentsAtCarryingValue |
| Namespace Prefix: |
us-gaap_ |
| Data Type: |
xbrli:monetaryItemType |
| Balance Type: |
debit |
| Period Type: |
instant |
|
| X |
- DefinitionAmount of cash and cash equivalents, and cash and cash equivalents restricted to withdrawal or usage. Excludes amount for disposal group and discontinued operations. Cash includes, but is not limited to, currency on hand, demand deposits with banks or financial institutions, and other accounts with general characteristics of demand deposits. Cash equivalents include, but are not limited to, short-term, highly liquid investments that are both readily convertible to known amounts of cash and so near their maturity that they present insignificant risk of changes in value because of changes in interest rates. Reference 1: http://www.xbrl.org/2003/role/disclosureRef
-Topic 230
-SubTopic 10
-Name Accounting Standards Codification
-Section 50
-Paragraph 8
-Publisher FASB
-URI https://asc.fasb.org//1943274/2147482913/230-10-50-8
Reference 2: http://fasb.org/us-gaap/role/ref/legacyRef
-Topic 230
-SubTopic 10
-Name Accounting Standards Codification
-Section 45
-Paragraph 24
-Publisher FASB
-URI https://asc.fasb.org//1943274/2147482740/230-10-45-24
Reference 3: http://fasb.org/us-gaap/role/ref/legacyRef
-Name Accounting Standards Codification
-Topic 230
-SubTopic 10
-Section 45
-Paragraph 4
-Publisher FASB
-URI https://asc.fasb.org//1943274/2147482740/230-10-45-4
| Name: |
us-gaap_CashCashEquivalentsRestrictedCashAndRestrictedCashEquivalents |
| Namespace Prefix: |
us-gaap_ |
| Data Type: |
xbrli:monetaryItemType |
| Balance Type: |
debit |
| Period Type: |
instant |
|
| X |
- DefinitionAmount of increase (decrease) in cash, cash equivalents, and cash and cash equivalents restricted to withdrawal or usage; including effect from exchange rate change. Cash includes, but is not limited to, currency on hand, demand deposits with banks or financial institutions, and other accounts with general characteristics of demand deposits. Cash equivalents include, but are not limited to, short-term, highly liquid investments that are both readily convertible to known amounts of cash and so near their maturity that they present insignificant risk of changes in value because of changes in interest rates. Reference 1: http://fasb.org/us-gaap/role/ref/legacyRef
-Topic 230
-SubTopic 10
-Name Accounting Standards Codification
-Section 45
-Paragraph 24
-Publisher FASB
-URI https://asc.fasb.org//1943274/2147482740/230-10-45-24
Reference 2: http://fasb.org/us-gaap/role/ref/legacyRef
-Name Accounting Standards Codification
-Section 45
-Paragraph 1
-SubTopic 230
-Topic 830
-Publisher FASB
-URI https://asc.fasb.org//1943274/2147481877/830-230-45-1
| Name: |
us-gaap_CashCashEquivalentsRestrictedCashAndRestrictedCashEquivalentsPeriodIncreaseDecreaseIncludingExchangeRateEffect |
| Namespace Prefix: |
us-gaap_ |
| Data Type: |
xbrli:monetaryItemType |
| Balance Type: |
debit |
| Period Type: |
duration |
|
| X |
- References
+ Details
| Name: |
us-gaap_CashFlowNoncashInvestingAndFinancingActivitiesDisclosureAbstract |
| Namespace Prefix: |
us-gaap_ |
| Data Type: |
xbrli:stringItemType |
| Balance Type: |
na |
| Period Type: |
duration |
|
| X |
- DefinitionThe current period expense charged against earnings on long-lived, physical assets not used in production, and which are not intended for resale, to allocate or recognize the cost of such assets over their useful lives; or to record the reduction in book value of an intangible asset over the benefit period of such asset; or to reflect consumption during the period of an asset that is not used in production. Reference 1: http://fasb.org/us-gaap/role/ref/legacyRef
-Name Accounting Standards Codification
-Section 45
-Paragraph 28
-Subparagraph (b)
-SubTopic 10
-Topic 230
-Publisher FASB
-URI https://asc.fasb.org//1943274/2147482740/230-10-45-28
Reference 2: http://fasb.org/us-gaap/role/ref/legacyRef
-Name Accounting Standards Codification
-Topic 360
-SubTopic 10
-Section 50
-Paragraph 1
-Subparagraph (a)
-Publisher FASB
-URI https://asc.fasb.org//1943274/2147482099/360-10-50-1
| Name: |
us-gaap_DepreciationAndAmortization |
| Namespace Prefix: |
us-gaap_ |
| Data Type: |
xbrli:monetaryItemType |
| Balance Type: |
debit |
| Period Type: |
duration |
|
| X |
- DefinitionAmount of paid and unpaid cash dividends declared for classes of stock, for example, but not limited to, common and preferred. Reference 1: http://fasb.org/us-gaap/role/ref/legacyRef
-Topic 505
-SubTopic 10
-Name Accounting Standards Codification
-Section S99
-Paragraph 1
-Subparagraph (SX 210.3-04)
-Publisher FASB
-URI https://asc.fasb.org//1943274/2147480008/505-10-S99-1
Reference 2: http://fasb.org/us-gaap/role/ref/legacyRef
-Name Accounting Standards Codification
-Section 45
-Paragraph 2
-SubTopic 405
-Topic 942
-Publisher FASB
-URI https://asc.fasb.org//1943274/2147481071/942-405-45-2
| Name: |
us-gaap_DividendsCash |
| Namespace Prefix: |
us-gaap_ |
| Data Type: |
xbrli:monetaryItemType |
| Balance Type: |
debit |
| Period Type: |
duration |
|
| X |
- DefinitionAmount of cost capitalized for award under share-based payment arrangement. Reference 1: http://www.xbrl.org/2003/role/disclosureRef
-Topic 718
-SubTopic 10
-Name Accounting Standards Codification
-Section 50
-Paragraph 2
-Subparagraph (h)(1)(ii)
-Publisher FASB
-URI https://asc.fasb.org//1943274/2147480429/718-10-50-2
| Name: |
us-gaap_EmployeeServiceShareBasedCompensationAllocationOfRecognizedPeriodCostsCapitalizedAmount |
| Namespace Prefix: |
us-gaap_ |
| Data Type: |
xbrli:monetaryItemType |
| Balance Type: |
debit |
| Period Type: |
duration |
|
| X |
- DefinitionAmount of distribution received from equity method investee for return on investment, classified as operating activities. Excludes distribution for return of investment, classified as investing activities. Reference 1: http://fasb.org/us-gaap/role/ref/legacyRef
-Name Accounting Standards Codification
-Section 45
-Paragraph 28
-Subparagraph (b)
-SubTopic 10
-Topic 230
-Publisher FASB
-URI https://asc.fasb.org//1943274/2147482740/230-10-45-28
Reference 2: http://www.xbrl.org/2003/role/disclosureRef
-Topic 944
-SubTopic 220
-Name Accounting Standards Codification
-Section S99
-Paragraph 1
-Subparagraph (SX 210.7-04(10))
-Publisher FASB
-URI https://asc.fasb.org//1943274/2147483586/944-220-S99-1
Reference 3: http://fasb.org/us-gaap/role/ref/legacyRef
-Name Accounting Standards Codification
-Section 45
-Paragraph 21D
-SubTopic 10
-Topic 230
-Publisher FASB
-URI https://asc.fasb.org//1943274/2147482740/230-10-45-21D
Reference 4: http://fasb.org/us-gaap/role/ref/legacyRef
-Topic 220
-SubTopic 10
-Name Accounting Standards Codification
-Section S99
-Paragraph 2
-Subparagraph (SX 210.5-03(12))
-Publisher FASB
-URI https://asc.fasb.org//1943274/2147483621/220-10-S99-2
| Name: |
us-gaap_EquityMethodInvestmentDividendsOrDistributions |
| Namespace Prefix: |
us-gaap_ |
| Data Type: |
xbrli:monetaryItemType |
| Balance Type: |
debit |
| Period Type: |
duration |
|
| X |
- DefinitionAmount of income (loss) for proportionate share of equity method investee's income (loss). Reference 1: http://fasb.org/us-gaap/role/ref/legacyRef
-Name Accounting Standards Codification
-Section 45
-Paragraph 28
-Subparagraph (b)
-SubTopic 10
-Topic 230
-Publisher FASB
-URI https://asc.fasb.org//1943274/2147482740/230-10-45-28
Reference 2: http://www.xbrl.org/2003/role/disclosureRef
-Topic 944
-SubTopic 220
-Name Accounting Standards Codification
-Section S99
-Paragraph 1
-Subparagraph (SX 210.7-04(10))
-Publisher FASB
-URI https://asc.fasb.org//1943274/2147483586/944-220-S99-1
Reference 3: http://www.xbrl.org/2003/role/disclosureRef
-Topic 323
-SubTopic 10
-Name Accounting Standards Codification
-Section 45
-Paragraph 1
-Publisher FASB
-URI https://asc.fasb.org//1943274/2147481664/323-10-45-1
Reference 4: http://www.xbrl.org/2003/role/disclosureRef
-Topic 280
-SubTopic 10
-Name Accounting Standards Codification
-Section 50
-Paragraph 22
-Subparagraph (g)
-Publisher FASB
-URI https://asc.fasb.org//1943274/2147482810/280-10-50-22
Reference 5: http://fasb.org/us-gaap/role/ref/legacyRef
-Topic 220
-SubTopic 10
-Name Accounting Standards Codification
-Section S99
-Paragraph 2
-Subparagraph (SX 210.5-03(12))
-Publisher FASB
-URI https://asc.fasb.org//1943274/2147483621/220-10-S99-2
Reference 6: http://fasb.org/us-gaap/role/ref/legacyRef
-Topic 942
-SubTopic 220
-Name Accounting Standards Codification
-Section S99
-Paragraph 1
-Subparagraph (SX 210.9-04(13)(f))
-Publisher FASB
-URI https://asc.fasb.org//1943274/2147483589/942-220-S99-1
| Name: |
us-gaap_IncomeLossFromEquityMethodInvestments |
| Namespace Prefix: |
us-gaap_ |
| Data Type: |
xbrli:monetaryItemType |
| Balance Type: |
credit |
| Period Type: |
duration |
|
| X |
- DefinitionThe increase (decrease) during the reporting period in the amounts payable to vendors for goods and services received and the amount of obligations and expenses incurred but not paid. Reference 1: http://fasb.org/us-gaap/role/ref/legacyRef
-Name Accounting Standards Codification
-Section 45
-Paragraph 28
-Subparagraph (a)
-SubTopic 10
-Topic 230
-Publisher FASB
-URI https://asc.fasb.org//1943274/2147482740/230-10-45-28
| Name: |
us-gaap_IncreaseDecreaseInAccountsPayableAndAccruedLiabilities |
| Namespace Prefix: |
us-gaap_ |
| Data Type: |
xbrli:monetaryItemType |
| Balance Type: |
debit |
| Period Type: |
duration |
|
| X |
- DefinitionThe increase (decrease) during the reporting period in the amount due from lessees arising from lease agreements. Reference 1: http://fasb.org/us-gaap/role/ref/legacyRef
-Name Accounting Standards Codification
-Section 45
-Paragraph 28
-Subparagraph (a)
-SubTopic 10
-Topic 230
-Publisher FASB
-URI https://asc.fasb.org//1943274/2147482740/230-10-45-28
| Name: |
us-gaap_IncreaseDecreaseInLeasingReceivables |
| Namespace Prefix: |
us-gaap_ |
| Data Type: |
xbrli:monetaryItemType |
| Balance Type: |
credit |
| Period Type: |
duration |
|
| X |
- References
+ Details
| Name: |
us-gaap_IncreaseDecreaseInOperatingCapitalAbstract |
| Namespace Prefix: |
us-gaap_ |
| Data Type: |
xbrli:stringItemType |
| Balance Type: |
na |
| Period Type: |
duration |
|
| X |
- DefinitionAmount of increase (decrease) in operating assets classified as other. Reference 1: http://fasb.org/us-gaap/role/ref/legacyRef
-Name Accounting Standards Codification
-Section 45
-Paragraph 28
-Subparagraph (a)
-SubTopic 10
-Topic 230
-Publisher FASB
-URI https://asc.fasb.org//1943274/2147482740/230-10-45-28
| Name: |
us-gaap_IncreaseDecreaseInOtherOperatingAssets |
| Namespace Prefix: |
us-gaap_ |
| Data Type: |
xbrli:monetaryItemType |
| Balance Type: |
credit |
| Period Type: |
duration |
|
| X |
- DefinitionThe increase (decrease) during the reporting period in security deposits. Reference 1: http://fasb.org/us-gaap/role/ref/legacyRef
-Name Accounting Standards Codification
-Section 45
-Paragraph 28
-Subparagraph (a)
-SubTopic 10
-Topic 230
-Publisher FASB
-URI https://asc.fasb.org//1943274/2147482740/230-10-45-28
| Name: |
us-gaap_IncreaseDecreaseInSecurityDeposits |
| Namespace Prefix: |
us-gaap_ |
| Data Type: |
xbrli:monetaryItemType |
| Balance Type: |
debit |
| Period Type: |
duration |
|
| X |
- DefinitionAmount of cash paid for interest capitalized, classified as investing activity. Reference 1: http://www.xbrl.org/2003/role/exampleRef
-Topic 230
-SubTopic 10
-Name Accounting Standards Codification
-Section 45
-Paragraph 13
-Subparagraph (c)
-Publisher FASB
-URI https://asc.fasb.org//1943274/2147482740/230-10-45-13
Reference 2: http://www.xbrl.org/2009/role/commonPracticeRef
-Topic 230
-SubTopic 10
-Name Accounting Standards Codification
-Section 50
-Paragraph 2
-Publisher FASB
-URI https://asc.fasb.org//1943274/2147482913/230-10-50-2
| Name: |
us-gaap_InterestPaidCapitalized |
| Namespace Prefix: |
us-gaap_ |
| Data Type: |
xbrli:monetaryItemType |
| Balance Type: |
credit |
| Period Type: |
duration |
|
| X |
- DefinitionAmount of cash paid for interest, excluding capitalized interest, classified as operating activity. Includes, but is not limited to, payment to settle zero-coupon bond for accreted interest of debt discount and debt instrument with insignificant coupon interest rate in relation to effective interest rate of borrowing attributable to accreted interest of debt discount. Reference 1: http://www.xbrl.org/2003/role/disclosureRef
-Topic 230
-SubTopic 10
-Name Accounting Standards Codification
-Section 45
-Paragraph 17
-Subparagraph (d)
-Publisher FASB
-URI https://asc.fasb.org//1943274/2147482740/230-10-45-17
Reference 2: http://www.xbrl.org/2003/role/disclosureRef
-Topic 230
-SubTopic 10
-Name Accounting Standards Codification
-Section 45
-Paragraph 25
-Subparagraph (e)
-Publisher FASB
-URI https://asc.fasb.org//1943274/2147482740/230-10-45-25
Reference 3: http://www.xbrl.org/2003/role/disclosureRef
-Topic 230
-SubTopic 10
-Name Accounting Standards Codification
-Section 50
-Paragraph 2
-Publisher FASB
-URI https://asc.fasb.org//1943274/2147482913/230-10-50-2
| Name: |
us-gaap_InterestPaidNet |
| Namespace Prefix: |
us-gaap_ |
| Data Type: |
xbrli:monetaryItemType |
| Balance Type: |
credit |
| Period Type: |
duration |
|
| X |
- DefinitionAmount of cash inflow (outflow) from financing activities, including discontinued operations. Financing activity cash flows include obtaining resources from owners and providing them with a return on, and a return of, their investment; borrowing money and repaying amounts borrowed, or settling the obligation; and obtaining and paying for other resources obtained from creditors on long-term credit. Reference 1: http://www.xbrl.org/2003/role/disclosureRef
-Topic 230
-SubTopic 10
-Name Accounting Standards Codification
-Section 45
-Paragraph 24
-Publisher FASB
-URI https://asc.fasb.org//1943274/2147482740/230-10-45-24
| Name: |
us-gaap_NetCashProvidedByUsedInFinancingActivities |
| Namespace Prefix: |
us-gaap_ |
| Data Type: |
xbrli:monetaryItemType |
| Balance Type: |
debit |
| Period Type: |
duration |
|
| X |
- References
+ Details
| Name: |
us-gaap_NetCashProvidedByUsedInFinancingActivitiesAbstract |
| Namespace Prefix: |
us-gaap_ |
| Data Type: |
xbrli:stringItemType |
| Balance Type: |
na |
| Period Type: |
duration |
|
| X |
- DefinitionAmount of cash inflow (outflow) from investing activities, including discontinued operations. Investing activity cash flows include making and collecting loans and acquiring and disposing of debt or equity instruments and property, plant, and equipment and other productive assets. Reference 1: http://www.xbrl.org/2003/role/disclosureRef
-Topic 230
-SubTopic 10
-Name Accounting Standards Codification
-Section 45
-Paragraph 24
-Publisher FASB
-URI https://asc.fasb.org//1943274/2147482740/230-10-45-24
| Name: |
us-gaap_NetCashProvidedByUsedInInvestingActivities |
| Namespace Prefix: |
us-gaap_ |
| Data Type: |
xbrli:monetaryItemType |
| Balance Type: |
debit |
| Period Type: |
duration |
|
| X |
- References
+ Details
| Name: |
us-gaap_NetCashProvidedByUsedInInvestingActivitiesAbstract |
| Namespace Prefix: |
us-gaap_ |
| Data Type: |
xbrli:stringItemType |
| Balance Type: |
na |
| Period Type: |
duration |
|
| X |
- DefinitionAmount of cash inflow (outflow) from operating activities, including discontinued operations. Operating activity cash flows include transactions, adjustments, and changes in value not defined as investing or financing activities. Reference 1: http://fasb.org/us-gaap/role/ref/legacyRef
-Topic 230
-SubTopic 10
-Name Accounting Standards Codification
-Section 45
-Paragraph 28
-Publisher FASB
-URI https://asc.fasb.org//1943274/2147482740/230-10-45-28
Reference 2: http://fasb.org/us-gaap/role/ref/legacyRef
-Topic 230
-SubTopic 10
-Name Accounting Standards Codification
-Section 45
-Paragraph 24
-Publisher FASB
-URI https://asc.fasb.org//1943274/2147482740/230-10-45-24
Reference 3: http://fasb.org/us-gaap/role/ref/legacyRef
-Topic 230
-SubTopic 10
-Name Accounting Standards Codification
-Section 45
-Paragraph 25
-Publisher FASB
-URI https://asc.fasb.org//1943274/2147482740/230-10-45-25
| Name: |
us-gaap_NetCashProvidedByUsedInOperatingActivities |
| Namespace Prefix: |
us-gaap_ |
| Data Type: |
xbrli:monetaryItemType |
| Balance Type: |
na |
| Period Type: |
duration |
|
| X |
- References
+ Details
| Name: |
us-gaap_NetCashProvidedByUsedInOperatingActivitiesAbstract |
| Namespace Prefix: |
us-gaap_ |
| Data Type: |
xbrli:stringItemType |
| Balance Type: |
na |
| Period Type: |
duration |
|
| X |
- DefinitionAmount, after tax and before reclassification, of gain (loss) from derivative instrument designated and qualifying as cash flow hedge included in assessment of hedge effectiveness. Reference 1: http://www.xbrl.org/2003/role/disclosureRef
-Topic 220
-SubTopic 10
-Name Accounting Standards Codification
-Section 45
-Paragraph 11
-Publisher FASB
-URI https://asc.fasb.org//1943274/2147482790/220-10-45-11
Reference 2: http://www.xbrl.org/2003/role/disclosureRef
-Topic 220
-SubTopic 10
-Name Accounting Standards Codification
-Section 45
-Paragraph 10A
-Subparagraph (d)
-Publisher FASB
-URI https://asc.fasb.org//1943274/2147482790/220-10-45-10A
| Name: |
us-gaap_OtherComprehensiveIncomeLossCashFlowHedgeGainLossBeforeReclassificationAfterTax |
| Namespace Prefix: |
us-gaap_ |
| Data Type: |
xbrli:monetaryItemType |
| Balance Type: |
credit |
| Period Type: |
duration |
|
| X |
- References
+ Details
| Name: |
us-gaap_OtherNoncashInvestingAndFinancingItemsAbstract |
| Namespace Prefix: |
us-gaap_ |
| Data Type: |
xbrli:stringItemType |
| Balance Type: |
na |
| Period Type: |
duration |
|
| X |
- DefinitionThe cash outflow for acquisition of or capital improvements to properties held for investment (operating, managed, leased) or for use. Reference 1: http://fasb.org/us-gaap/role/ref/legacyRef
-Topic 230
-SubTopic 10
-Name Accounting Standards Codification
-Section 45
-Paragraph 13
-Subparagraph (c)
-Publisher FASB
-URI https://asc.fasb.org//1943274/2147482740/230-10-45-13
| Name: |
us-gaap_PaymentsForCapitalImprovements |
| Namespace Prefix: |
us-gaap_ |
| Data Type: |
xbrli:monetaryItemType |
| Balance Type: |
credit |
| Period Type: |
duration |
|
| X |
- DefinitionThe cash outflow for derivative instruments during the period, which are classified as financing activities, excluding those designated as hedging instruments. Reference 1: http://www.xbrl.org/2003/role/exampleRef
-Topic 230
-SubTopic 10
-Name Accounting Standards Codification
-Section 45
-Paragraph 23
-Publisher FASB
-URI https://asc.fasb.org//1943274/2147482740/230-10-45-23
Reference 2: http://www.xbrl.org/2003/role/disclosureRef
-Topic 230
-SubTopic 10
-Name Accounting Standards Codification
-Section 45
-Paragraph 15
-Subparagraph (d)
-Publisher FASB
-URI https://asc.fasb.org//1943274/2147482740/230-10-45-15
| Name: |
us-gaap_PaymentsForDerivativeInstrumentFinancingActivities |
| Namespace Prefix: |
us-gaap_ |
| Data Type: |
xbrli:monetaryItemType |
| Balance Type: |
credit |
| Period Type: |
duration |
|
| X |
- DefinitionThe cash outflow to reacquire common stock during the period. Reference 1: http://fasb.org/us-gaap/role/ref/legacyRef
-Name Accounting Standards Codification
-Topic 230
-SubTopic 10
-Section 45
-Paragraph 15
-Subparagraph (a)
-Publisher FASB
-URI https://asc.fasb.org//1943274/2147482740/230-10-45-15
| Name: |
us-gaap_PaymentsForRepurchaseOfCommonStock |
| Namespace Prefix: |
us-gaap_ |
| Data Type: |
xbrli:monetaryItemType |
| Balance Type: |
credit |
| Period Type: |
duration |
|
| X |
- DefinitionThe cash outflow during the period for redemption of redeemable noncontrolling interests. Reference 1: http://www.xbrl.org/2009/role/commonPracticeRef
-Topic 230
-SubTopic 10
-Name Accounting Standards Codification
-Section 45
-Paragraph 15
-Subparagraph (a)
-Publisher FASB
-URI https://asc.fasb.org//1943274/2147482740/230-10-45-15
| Name: |
us-gaap_PaymentsForRepurchaseOfRedeemableNoncontrollingInterest |
| Namespace Prefix: |
us-gaap_ |
| Data Type: |
xbrli:monetaryItemType |
| Balance Type: |
credit |
| Period Type: |
duration |
|
| X |
- DefinitionAmount of cash outflow in the form of ordinary dividends to common shareholders of the parent entity. Reference 1: http://fasb.org/us-gaap/role/ref/legacyRef
-Name Accounting Standards Codification
-Topic 230
-SubTopic 10
-Section 45
-Paragraph 15
-Subparagraph (a)
-Publisher FASB
-URI https://asc.fasb.org//1943274/2147482740/230-10-45-15
| Name: |
us-gaap_PaymentsOfDividendsCommonStock |
| Namespace Prefix: |
us-gaap_ |
| Data Type: |
xbrli:monetaryItemType |
| Balance Type: |
credit |
| Period Type: |
duration |
|
| X |
- DefinitionAmount of cash outflow in the form of ordinary dividends provided by the non-wholly owned subsidiary to noncontrolling interests. Reference 1: http://fasb.org/us-gaap/role/ref/legacyRef
-Name Accounting Standards Codification
-Topic 230
-SubTopic 10
-Section 45
-Paragraph 15
-Subparagraph (a)
-Publisher FASB
-URI https://asc.fasb.org//1943274/2147482740/230-10-45-15
| Name: |
us-gaap_PaymentsOfDividendsMinorityInterest |
| Namespace Prefix: |
us-gaap_ |
| Data Type: |
xbrli:monetaryItemType |
| Balance Type: |
credit |
| Period Type: |
duration |
|
| X |
- DefinitionThe cash outflow for loan and debt issuance costs. Reference 1: http://fasb.org/us-gaap/role/ref/legacyRef
-Name Accounting Standards Codification
-Topic 230
-SubTopic 10
-Section 45
-Paragraph 15
-Publisher FASB
-URI https://asc.fasb.org//1943274/2147482740/230-10-45-15
| Name: |
us-gaap_PaymentsOfFinancingCosts |
| Namespace Prefix: |
us-gaap_ |
| Data Type: |
xbrli:monetaryItemType |
| Balance Type: |
credit |
| Period Type: |
duration |
|
| X |
- DefinitionThe cash outflow from the acquisition of property as primarily intended to generate income for its owner. Reference 1: http://fasb.org/us-gaap/role/ref/legacyRef
-Topic 230
-SubTopic 10
-Name Accounting Standards Codification
-Section 45
-Paragraph 13
-Subparagraph (c)
-Publisher FASB
-URI https://asc.fasb.org//1943274/2147482740/230-10-45-13
| Name: |
us-gaap_PaymentsToAcquireCommercialRealEstate |
| Namespace Prefix: |
us-gaap_ |
| Data Type: |
xbrli:monetaryItemType |
| Balance Type: |
credit |
| Period Type: |
duration |
|
| X |
- DefinitionThe cash inflow provided by derivative instruments during the period, which are classified as financing activities, excluding those designated as hedging instruments. Reference 1: http://www.xbrl.org/2003/role/exampleRef
-Topic 230
-SubTopic 10
-Name Accounting Standards Codification
-Section 45
-Paragraph 23
-Publisher FASB
-URI https://asc.fasb.org//1943274/2147482740/230-10-45-23
Reference 2: http://www.xbrl.org/2003/role/disclosureRef
-Topic 230
-SubTopic 10
-Name Accounting Standards Codification
-Section 45
-Paragraph 14
-Subparagraph (d)
-Publisher FASB
-URI https://asc.fasb.org//1943274/2147482740/230-10-45-14
| Name: |
us-gaap_ProceedsFromDerivativeInstrumentFinancingActivities |
| Namespace Prefix: |
us-gaap_ |
| Data Type: |
xbrli:monetaryItemType |
| Balance Type: |
debit |
| Period Type: |
duration |
|
| X |
- DefinitionAmount of distribution received from equity method investee for return of investment, classified as investing activities. Excludes distribution for return on investment, classified as operating activities. Reference 1: http://www.xbrl.org/2009/role/commonPracticeRef
-Topic 230
-SubTopic 10
-Name Accounting Standards Codification
-Section 45
-Paragraph 12
-Subparagraph (b)
-Publisher FASB
-URI https://asc.fasb.org//1943274/2147482740/230-10-45-12
Reference 2: http://www.xbrl.org/2003/role/disclosureRef
-Topic 230
-SubTopic 10
-Name Accounting Standards Codification
-Section 45
-Paragraph 21D
-Publisher FASB
-URI https://asc.fasb.org//1943274/2147482740/230-10-45-21D
| Name: |
us-gaap_ProceedsFromEquityMethodInvestmentDividendsOrDistributionsReturnOfCapital |
| Namespace Prefix: |
us-gaap_ |
| Data Type: |
xbrli:monetaryItemType |
| Balance Type: |
debit |
| Period Type: |
duration |
|
| X |
- DefinitionAmount of cash inflow for proceeds from settlement of insurance claim, classified as investing activities. Excludes insurance settlement classified as operating activities. Reference 1: http://fasb.org/us-gaap/role/ref/legacyRef
-Name Accounting Standards Codification
-Topic 230
-SubTopic 10
-Section 45
-Paragraph 12
-Publisher FASB
-URI https://asc.fasb.org//1943274/2147482740/230-10-45-12
Reference 2: http://fasb.org/us-gaap/role/ref/legacyRef
-Name Accounting Standards Codification
-Section 45
-Paragraph 21B
-SubTopic 10
-Topic 230
-Publisher FASB
-URI https://asc.fasb.org//1943274/2147482740/230-10-45-21B
| Name: |
us-gaap_ProceedsFromInsuranceSettlementInvestingActivities |
| Namespace Prefix: |
us-gaap_ |
| Data Type: |
xbrli:monetaryItemType |
| Balance Type: |
debit |
| Period Type: |
duration |
|
| X |
- DefinitionThe cash inflow from amounts received from issuance of long-term debt that is wholly or partially secured by collateral. Excludes proceeds from tax exempt secured debt. Reference 1: http://fasb.org/us-gaap/role/ref/legacyRef
-Name Accounting Standards Codification
-Topic 230
-SubTopic 10
-Section 45
-Paragraph 14
-Subparagraph (b)
-Publisher FASB
-URI https://asc.fasb.org//1943274/2147482740/230-10-45-14
| Name: |
us-gaap_ProceedsFromIssuanceOfSecuredDebt |
| Namespace Prefix: |
us-gaap_ |
| Data Type: |
xbrli:monetaryItemType |
| Balance Type: |
debit |
| Period Type: |
duration |
|
| X |
- DefinitionAmount of cash inflow from a noncontrolling interest. Includes, but is not limited to, purchase of additional shares or other increase in noncontrolling interest ownership. Reference 1: http://fasb.org/us-gaap/role/ref/legacyRef
-Name Accounting Standards Codification
-Topic 230
-SubTopic 10
-Section 45
-Paragraph 14
-Publisher FASB
-URI https://asc.fasb.org//1943274/2147482740/230-10-45-14
| Name: |
us-gaap_ProceedsFromMinorityShareholders |
| Namespace Prefix: |
us-gaap_ |
| Data Type: |
xbrli:monetaryItemType |
| Balance Type: |
debit |
| Period Type: |
duration |
|
| X |
- DefinitionThe consolidated profit or loss for the period, net of income taxes, including the portion attributable to the noncontrolling interest. Reference 1: http://www.xbrl.org/2003/role/disclosureRef
-Topic 235
-SubTopic 10
-Name Accounting Standards Codification
-Section S99
-Paragraph 1
-Subparagraph (SX 210.4-08(g)(1)(ii))
-Publisher FASB
-URI https://asc.fasb.org//1943274/2147480678/235-10-S99-1
Reference 2: http://www.xbrl.org/2003/role/disclosureRef
-Topic 323
-SubTopic 10
-Name Accounting Standards Codification
-Section 50
-Paragraph 3
-Subparagraph (c)
-Publisher FASB
-URI https://asc.fasb.org//1943274/2147481687/323-10-50-3
Reference 3: http://www.xbrl.org/2003/role/disclosureRef
-Topic 825
-SubTopic 10
-Name Accounting Standards Codification
-Section 50
-Paragraph 28
-Subparagraph (f)
-Publisher FASB
-URI https://asc.fasb.org//1943274/2147482907/825-10-50-28
Reference 4: http://www.xbrl.org/2003/role/disclosureRef
-Topic 250
-SubTopic 10
-Name Accounting Standards Codification
-Section 50
-Paragraph 1
-Subparagraph (b)(2)
-Publisher FASB
-URI https://asc.fasb.org//1943274/2147483443/250-10-50-1
Reference 5: http://www.xbrl.org/2003/role/disclosureRef
-Topic 815
-SubTopic 40
-Name Accounting Standards Codification
-Section 65
-Paragraph 1
-Subparagraph (f)
-Publisher FASB
-URI https://asc.fasb.org//1943274/2147480175/815-40-65-1
Reference 6: http://www.xbrl.org/2003/role/disclosureRef
-Topic 250
-SubTopic 10
-Name Accounting Standards Codification
-Section 50
-Paragraph 8
-Publisher FASB
-URI https://asc.fasb.org//1943274/2147483443/250-10-50-8
Reference 7: http://www.xbrl.org/2003/role/disclosureRef
-Topic 250
-SubTopic 10
-Name Accounting Standards Codification
-Section 50
-Paragraph 9
-Publisher FASB
-URI https://asc.fasb.org//1943274/2147483443/250-10-50-9
Reference 8: http://www.xbrl.org/2003/role/exampleRef
-Topic 946
-SubTopic 830
-Name Accounting Standards Codification
-Section 55
-Paragraph 11
-Publisher FASB
-URI https://asc.fasb.org//1943274/2147480167/946-830-55-11
Reference 9: http://www.xbrl.org/2003/role/disclosureRef
-Topic 946
-SubTopic 205
-Name Accounting Standards Codification
-Section 45
-Paragraph 3
-Subparagraph (a)
-Publisher FASB
-URI https://asc.fasb.org//1943274/2147480767/946-205-45-3
Reference 10: http://www.xbrl.org/2003/role/disclosureRef
-Topic 946
-SubTopic 220
-Name Accounting Standards Codification
-Section 45
-Paragraph 7
-Publisher FASB
-URI https://asc.fasb.org//1943274/2147483581/946-220-45-7
Reference 11: http://www.xbrl.org/2003/role/disclosureRef
-Topic 944
-SubTopic 220
-Name Accounting Standards Codification
-Section S99
-Paragraph 1
-Subparagraph (SX 210.7-04(16))
-Publisher FASB
-URI https://asc.fasb.org//1943274/2147483586/944-220-S99-1
Reference 12: http://www.xbrl.org/2003/role/disclosureRef
-Topic 280
-SubTopic 10
-Name Accounting Standards Codification
-Section 50
-Paragraph 22
-Publisher FASB
-URI https://asc.fasb.org//1943274/2147482810/280-10-50-22
Reference 13: http://www.xbrl.org/2003/role/disclosureRef
-Topic 946
-SubTopic 220
-Name Accounting Standards Codification
-Section S99
-Paragraph 1
-Subparagraph (SX 210.6-07(9))
-Publisher FASB
-URI https://asc.fasb.org//1943274/2147483575/946-220-S99-1
Reference 14: http://www.xbrl.org/2003/role/disclosureRef
-Topic 946
-SubTopic 220
-Name Accounting Standards Codification
-Section S99
-Paragraph 3
-Subparagraph (SX 210.6-09(1)(d))
-Publisher FASB
-URI https://asc.fasb.org//1943274/2147483575/946-220-S99-3
Reference 15: http://www.xbrl.org/2003/role/disclosureRef
-Topic 810
-SubTopic 10
-Name Accounting Standards Codification
-Section 45
-Paragraph 19
-Publisher FASB
-URI https://asc.fasb.org//1943274/2147481231/810-10-45-19
Reference 16: http://www.xbrl.org/2009/role/commonPracticeRef
-Topic 220
-SubTopic 10
-Name Accounting Standards Codification
-Section 50
-Paragraph 6
-Publisher FASB
-URI https://asc.fasb.org//1943274/2147482765/220-10-50-6
Reference 17: http://www.xbrl.org/2003/role/disclosureRef
-Topic 470
-SubTopic 10
-Name Accounting Standards Codification
-Section S99
-Paragraph 1A
-Subparagraph (SX 210.13-01(a)(4)(i))
-Publisher FASB
-URI https://asc.fasb.org//1943274/2147480097/470-10-S99-1A
Reference 18: http://www.xbrl.org/2009/role/commonPracticeRef
-Topic 470
-SubTopic 10
-Name Accounting Standards Codification
-Section S99
-Paragraph 1A
-Subparagraph (SX 210.13-01(a)(4)(ii))
-Publisher FASB
-URI https://asc.fasb.org//1943274/2147480097/470-10-S99-1A
Reference 19: http://www.xbrl.org/2003/role/disclosureRef
-Topic 470
-SubTopic 10
-Name Accounting Standards Codification
-Section S99
-Paragraph 1A
-Subparagraph (SX 210.13-01(a)(4)(iii)(A))
-Publisher FASB
-URI https://asc.fasb.org//1943274/2147480097/470-10-S99-1A
Reference 20: http://www.xbrl.org/2003/role/disclosureRef
-Topic 470
-SubTopic 10
-Name Accounting Standards Codification
-Section S99
-Paragraph 1A
-Subparagraph (SX 210.13-01(a)(4)(iv))
-Publisher FASB
-URI https://asc.fasb.org//1943274/2147480097/470-10-S99-1A
Reference 21: http://www.xbrl.org/2003/role/disclosureRef
-Topic 470
-SubTopic 10
-Name Accounting Standards Codification
-Section S99
-Paragraph 1A
-Subparagraph (SX 210.13-01(a)(5))
-Publisher FASB
-URI https://asc.fasb.org//1943274/2147480097/470-10-S99-1A
Reference 22: http://www.xbrl.org/2003/role/disclosureRef
-Topic 470
-SubTopic 10
-Name Accounting Standards Codification
-Section S99
-Paragraph 1B
-Subparagraph (SX 210.13-02(a)(4)(i))
-Publisher FASB
-URI https://asc.fasb.org//1943274/2147480097/470-10-S99-1B
Reference 23: http://www.xbrl.org/2003/role/disclosureRef
-Topic 470
-SubTopic 10
-Name Accounting Standards Codification
-Section S99
-Paragraph 1B
-Subparagraph (SX 210.13-02(a)(4)(iii)(A))
-Publisher FASB
-URI https://asc.fasb.org//1943274/2147480097/470-10-S99-1B
Reference 24: http://www.xbrl.org/2003/role/disclosureRef
-Topic 470
-SubTopic 10
-Name Accounting Standards Codification
-Section S99
-Paragraph 1B
-Subparagraph (SX 210.13-02(a)(4)(iii)(B))
-Publisher FASB
-URI https://asc.fasb.org//1943274/2147480097/470-10-S99-1B
Reference 25: http://www.xbrl.org/2003/role/disclosureRef
-Topic 470
-SubTopic 10
-Name Accounting Standards Codification
-Section S99
-Paragraph 1B
-Subparagraph (SX 210.13-02(a)(4)(iv))
-Publisher FASB
-URI https://asc.fasb.org//1943274/2147480097/470-10-S99-1B
Reference 26: http://www.xbrl.org/2003/role/disclosureRef
-Topic 470
-SubTopic 10
-Name Accounting Standards Codification
-Section S99
-Paragraph 1B
-Subparagraph (SX 210.13-02(a)(5))
-Publisher FASB
-URI https://asc.fasb.org//1943274/2147480097/470-10-S99-1B
Reference 27: http://www.xbrl.org/2003/role/disclosureRef
-Topic 280
-SubTopic 10
-Name Accounting Standards Codification
-Section 50
-Paragraph 30
-Subparagraph (b)
-Publisher FASB
-URI https://asc.fasb.org//1943274/2147482810/280-10-50-30
Reference 28: http://www.xbrl.org/2003/role/disclosureRef
-Topic 280
-SubTopic 10
-Name Accounting Standards Codification
-Section 50
-Paragraph 32
-Subparagraph (f)
-Publisher FASB
-URI https://asc.fasb.org//1943274/2147482810/280-10-50-32
Reference 29: http://www.xbrl.org/2003/role/exampleRef
-Topic 280
-SubTopic 10
-Name Accounting Standards Codification
-Section 50
-Paragraph 31
-Publisher FASB
-URI https://asc.fasb.org//1943274/2147482810/280-10-50-31
Reference 30: http://www.xbrl.org/2003/role/disclosureRef
-Topic 280
-SubTopic 10
-Name Accounting Standards Codification
-Section 50
-Paragraph 32
-Subparagraph (c)
-Publisher FASB
-URI https://asc.fasb.org//1943274/2147482810/280-10-50-32
Reference 31: http://www.xbrl.org/2003/role/disclosureRef
-Topic 942
-SubTopic 235
-Name Accounting Standards Codification
-Section S99
-Paragraph 1
-Subparagraph (SX 210.9-05(b)(2))
-Publisher FASB
-URI https://asc.fasb.org//1943274/2147479557/942-235-S99-1
Reference 32: http://www.xbrl.org/2003/role/disclosureRef
-Topic 205
-SubTopic 20
-Name Accounting Standards Codification
-Section 50
-Paragraph 7
-Publisher FASB
-URI https://asc.fasb.org//1943274/2147483499/205-20-50-7
Reference 33: http://www.xbrl.org/2003/role/exampleRef
-Topic 810
-SubTopic 10
-Name Accounting Standards Codification
-Section 55
-Paragraph 4J
-Publisher FASB
-URI https://asc.fasb.org//1943274/2147481175/810-10-55-4J
Reference 34: http://www.xbrl.org/2003/role/exampleRef
-Topic 810
-SubTopic 10
-Name Accounting Standards Codification
-Section 55
-Paragraph 4K
-Publisher FASB
-URI https://asc.fasb.org//1943274/2147481175/810-10-55-4K
Reference 35: http://www.xbrl.org/2003/role/disclosureRef
-Topic 220
-SubTopic 10
-Name Accounting Standards Codification
-Section 45
-Paragraph 1A
-Subparagraph (a)
-Publisher FASB
-URI https://asc.fasb.org//1943274/2147482790/220-10-45-1A
Reference 36: http://www.xbrl.org/2003/role/disclosureRef
-Topic 220
-SubTopic 10
-Name Accounting Standards Codification
-Section 45
-Paragraph 1B
-Subparagraph (a)
-Publisher FASB
-URI https://asc.fasb.org//1943274/2147482790/220-10-45-1B
Reference 37: http://www.xbrl.org/2003/role/disclosureRef
-Topic 230
-SubTopic 10
-Name Accounting Standards Codification
-Section 45
-Paragraph 2
-Publisher FASB
-URI https://asc.fasb.org//1943274/2147482740/230-10-45-2
Reference 38: http://www.xbrl.org/2003/role/disclosureRef
-Topic 810
-SubTopic 10
-Name Accounting Standards Codification
-Section 50
-Paragraph 1A
-Subparagraph (a)(1)
-Publisher FASB
-URI https://asc.fasb.org//1943274/2147481203/810-10-50-1A
Reference 39: http://www.xbrl.org/2003/role/disclosureRef
-Topic 810
-SubTopic 10
-Name Accounting Standards Codification
-Section 50
-Paragraph 1A
-Subparagraph (c)(1)
-Publisher FASB
-URI https://asc.fasb.org//1943274/2147481203/810-10-50-1A
| Name: |
us-gaap_ProfitLoss |
| Namespace Prefix: |
us-gaap_ |
| Data Type: |
xbrli:monetaryItemType |
| Balance Type: |
credit |
| Period Type: |
duration |
|
| X |
- DefinitionThe cash outflow to repay long-term debt that is wholly or partially secured by collateral. Excludes repayments of tax exempt secured debt. Reference 1: http://fasb.org/us-gaap/role/ref/legacyRef
-Name Accounting Standards Codification
-Topic 230
-SubTopic 10
-Section 45
-Paragraph 15
-Subparagraph (b)
-Publisher FASB
-URI https://asc.fasb.org//1943274/2147482740/230-10-45-15
| Name: |
us-gaap_RepaymentsOfSecuredDebt |
| Namespace Prefix: |
us-gaap_ |
| Data Type: |
xbrli:monetaryItemType |
| Balance Type: |
credit |
| Period Type: |
duration |
|
| X |
- DefinitionAmount of cash and cash equivalents restricted as to withdrawal or usage. Cash includes, but is not limited to, currency on hand, demand deposits with banks or financial institutions, and other accounts with general characteristics of demand deposits. Cash equivalents include, but are not limited to, short-term, highly liquid investments that are both readily convertible to known amounts of cash and so near their maturity that they present insignificant risk of changes in value because of changes in interest rates. Reference 1: http://www.xbrl.org/2003/role/disclosureRef
-Topic 210
-SubTopic 10
-Name Accounting Standards Codification
-Section S99
-Paragraph 1
-Subparagraph (SX 210.5-02(1))
-Publisher FASB
-URI https://asc.fasb.org//1943274/2147480566/210-10-S99-1
Reference 2: http://www.xbrl.org/2003/role/disclosureRef
-Topic 944
-SubTopic 210
-Name Accounting Standards Codification
-Section S99
-Paragraph 1
-Subparagraph (SX 210.7-03(a)(2))
-Publisher FASB
-URI https://asc.fasb.org//1943274/2147479440/944-210-S99-1
Reference 3: http://www.xbrl.org/2003/role/disclosureRef
-Topic 230
-SubTopic 10
-Name Accounting Standards Codification
-Section 50
-Paragraph 8
-Publisher FASB
-URI https://asc.fasb.org//1943274/2147482913/230-10-50-8
Reference 4: http://fasb.org/us-gaap/role/ref/legacyRef
-Topic 942
-SubTopic 210
-Name Accounting Standards Codification
-Section S99
-Paragraph 1
-Subparagraph (SX 210.9-03(1)(a))
-Publisher FASB
-URI https://asc.fasb.org//1943274/2147479853/942-210-S99-1
Reference 5: http://fasb.org/us-gaap/role/ref/legacyRef
-Name Accounting Standards Codification
-Topic 230
-SubTopic 10
-Section 45
-Paragraph 4
-Publisher FASB
-URI https://asc.fasb.org//1943274/2147482740/230-10-45-4
| Name: |
us-gaap_RestrictedCashAndCashEquivalents |
| Namespace Prefix: |
us-gaap_ |
| Data Type: |
xbrli:monetaryItemType |
| Balance Type: |
debit |
| Period Type: |
instant |
|
| X |
- DefinitionAmount of noncash expense for share-based payment arrangement. Reference 1: http://fasb.org/us-gaap/role/ref/legacyRef
-Name Accounting Standards Codification
-Section 45
-Paragraph 28
-Subparagraph (a)
-SubTopic 10
-Topic 230
-Publisher FASB
-URI https://asc.fasb.org//1943274/2147482740/230-10-45-28
| Name: |
us-gaap_ShareBasedCompensation |
| Namespace Prefix: |
us-gaap_ |
| Data Type: |
xbrli:monetaryItemType |
| Balance Type: |
debit |
| Period Type: |
duration |
|
| X |
- DefinitionThe fair value of stock issued in noncash financing activities. Reference 1: http://fasb.org/us-gaap/role/ref/legacyRef
-Name Accounting Standards Codification
-Topic 230
-SubTopic 10
-Section 50
-Paragraph 4
-Publisher FASB
-URI https://asc.fasb.org//1943274/2147482913/230-10-50-4
Reference 2: http://fasb.org/us-gaap/role/ref/legacyRef
-Name Accounting Standards Codification
-Topic 230
-SubTopic 10
-Section 50
-Paragraph 3
-Publisher FASB
-URI https://asc.fasb.org//1943274/2147482913/230-10-50-3
Reference 3: http://fasb.org/us-gaap/role/ref/legacyRef
-Name Accounting Standards Codification
-Topic 230
-SubTopic 10
-Section 50
-Paragraph 5
-Publisher FASB
-URI https://asc.fasb.org//1943274/2147482913/230-10-50-5
| Name: |
us-gaap_StockIssued1 |
| Namespace Prefix: |
us-gaap_ |
| Data Type: |
xbrli:monetaryItemType |
| Balance Type: |
credit |
| Period Type: |
duration |
|
| X |
- DefinitionDifference between actual rental income due and rental income recognized on a straight-line basis. Reference 1: http://fasb.org/us-gaap/role/ref/legacyRef
-Name Accounting Standards Codification
-Section 45
-Paragraph 28
-Subparagraph (a)
-SubTopic 10
-Topic 230
-Publisher FASB
-URI https://asc.fasb.org//1943274/2147482740/230-10-45-28
| Name: |
us-gaap_StraightLineRent |
| Namespace Prefix: |
us-gaap_ |
| Data Type: |
xbrli:monetaryItemType |
| Balance Type: |
credit |
| Period Type: |
duration |
|
| X |
- Details
| Name: |
us-gaap_EquityMethodInvestmentNonconsolidatedInvesteeAxis=us-gaap_EquityMethodInvestmentNonconsolidatedInvesteeOrGroupOfInvesteesMember |
| Namespace Prefix: |
|
| Data Type: |
na |
| Balance Type: |
|
| Period Type: |
|
|
v3.23.3
Overview
|
9 Months Ended |
Sep. 30, 2023 |
|---|
| Organization, Consolidation and Presentation of Financial Statements [Abstract] |
|
| Overview |
Overview Organization and Business Description
Douglas Emmett, Inc. is a fully integrated, self-administered and self-managed REIT. We are one of the largest owners and operators of high-quality office and multifamily properties in Los Angeles County, California and Honolulu, Hawaii. Through our interest in our Operating Partnership and its subsidiaries, consolidated JVs and unconsolidated Fund, we focus on owning, acquiring, developing and managing a substantial market share of top-tier office properties and premier multifamily communities in neighborhoods that possess significant supply constraints, high-end executive housing and key lifestyle amenities. The terms "us," "we" and "our" as used in the consolidated financial statements refer to Douglas Emmett, Inc. and its subsidiaries on a consolidated basis. At September 30, 2023, our Consolidated Portfolio consisted of (i) a 17.6 million square foot office portfolio, (ii) 4,594 multifamily apartment units and (iii) fee interests in two parcels of land from which we receive rent under ground leases. We also manage and own an equity interest in an unconsolidated Fund which, at September 30, 2023, owned an additional 0.4 million square feet of office space. We manage our unconsolidated Fund alongside our Consolidated Portfolio, and we therefore present the statistics for our office portfolio on a Total Portfolio basis. As of September 30, 2023, our portfolio consisted of the following (including ancillary retail space and excluding two parcels of land from which we receive rent under ground leases): | | | | | | | | | | | | | | Consolidated Portfolio | | Total
Portfolio | | Office | | | | | Wholly-owned properties | 52 | | 52 | | Consolidated JV properties | 16 | | 16 | | Unconsolidated Fund properties | — | | 2 | | 68 | | 70 | | | | | | Multifamily | | | | | Wholly-owned properties | 12 | | 12 | | Consolidated JV properties | 2 | | 2 | | 14 | | 14 | | | | | | Total | 82 | | 84 |
Basis of Presentation
The accompanying consolidated financial statements are the consolidated financial statements of Douglas Emmett, Inc. and its subsidiaries, including our Operating Partnership and our consolidated JVs. All significant intercompany balances and transactions have been eliminated in our consolidated financial statements.
We consolidate entities in which we are considered to be the primary beneficiary of a VIE or have a majority of the voting interest of the entity. We are deemed to be the primary beneficiary of a VIE when we have (i) the power to direct the activities of that VIE that most significantly impact its economic performance, and (ii) the obligation to absorb losses or the right to receive benefits that could potentially be significant to the VIE. We do not consolidate entities in which the other parties have substantive kick-out rights to remove our power to direct the activities, most significantly impacting the economic performance, of that VIE. In determining whether we are the primary beneficiary, we consider factors such as ownership interest, management representation, authority to control decisions, and contractual and substantive participating rights of each party.
We consolidate our Operating Partnership through which we conduct substantially all of our business, and own, directly and through subsidiaries, substantially all of our assets, and are obligated to repay substantially all of our liabilities. The consolidated debt, excluding our consolidated JVs, was $3.76 billion as of September 30, 2023 and $3.41 billion as of December 31, 2022. See Note 8. We also consolidate four JVs through our Operating Partnership. We consolidate our Operating Partnership and our four JVs because they are VIEs and we or our Operating Partnership are the primary beneficiary for each. As of September 30, 2023, our consolidated VIE entities, excluding our Operating Partnership, had: •aggregate consolidated assets of $3.90 billion (of which $3.49 billion related to investment in real estate), and •aggregate consolidated liabilities of $1.89 billion (of which $1.81 billion related to debt).
As of December 31, 2022, our consolidated VIE entities, excluding our Operating Partnership, had: •aggregate consolidated assets of $3.94 billion (of which $3.54 billion related to investment in real estate), and •aggregate consolidated liabilities of $1.89 billion (of which $1.81 billion related to debt).
The accompanying unaudited interim consolidated financial statements have been prepared pursuant to the rules and regulations of the SEC in conformity with US GAAP as established by the FASB in the ASC. Certain information and footnote disclosures normally included in the consolidated financial statements prepared in conformity with US GAAP may have been condensed or omitted pursuant to SEC rules and regulations, although we believe that the disclosures are adequate to make their presentation not misleading. The accompanying unaudited interim consolidated financial statements include, in our opinion, all adjustments, consisting of normal recurring adjustments, necessary to present fairly the financial information set forth therein. The results of operations for the interim periods are not necessarily indicative of the results that may be expected for the year ending December 31, 2023. The interim consolidated financial statements should be read in conjunction with the consolidated financial statements in our 2022 Annual Report on Form 10-K and the notes thereto. Any references to the number or class of properties, square footage, per square footage amounts, apartment units and geography, are outside the scope of our independent registered public accounting firm’s review of our consolidated financial statements in accordance with the standards of the PCAOB.
|
| X |
- References
+ Details
| Name: |
us-gaap_OrganizationConsolidationAndPresentationOfFinancialStatementsAbstract |
| Namespace Prefix: |
us-gaap_ |
| Data Type: |
xbrli:stringItemType |
| Balance Type: |
na |
| Period Type: |
duration |
|
| X |
- DefinitionThe entire disclosure for organization, consolidation and basis of presentation of financial statements disclosure. Reference 1: http://www.xbrl.org/2003/role/disclosureRef
-Topic 946
-SubTopic 10
-Name Accounting Standards Codification
-Section 50
-Paragraph 1
-Publisher FASB
-URI https://asc.fasb.org//1943274/2147480424/946-10-50-1
Reference 2: http://www.xbrl.org/2003/role/disclosureRef
-Topic 946
-SubTopic 10
-Name Accounting Standards Codification
-Section 50
-Paragraph 2
-Publisher FASB
-URI https://asc.fasb.org//1943274/2147480424/946-10-50-2
Reference 3: http://fasb.org/us-gaap/role/ref/legacyRef
-Topic 810
-Name Accounting Standards Codification
-Publisher FASB
-URI https://asc.fasb.org//810/tableOfContent
Reference 4: http://fasb.org/us-gaap/role/ref/legacyRef
-Topic 205
-Name Accounting Standards Codification
-Publisher FASB
-URI https://asc.fasb.org//205/tableOfContent
| Name: |
us-gaap_OrganizationConsolidationAndPresentationOfFinancialStatementsDisclosureTextBlock |
| Namespace Prefix: |
us-gaap_ |
| Data Type: |
dtr-types:textBlockItemType |
| Balance Type: |
na |
| Period Type: |
duration |
|
v3.23.3
Summary of Significant Accounting Policies
|
9 Months Ended |
Sep. 30, 2023 |
|---|
| Accounting Policies [Abstract] |
|
| Summary of Significant Accounting Policies |
Summary of Significant Accounting Policies We have not made any changes to our significant accounting policies disclosed in our 2022 Annual Report on Form 10-K.
Use of Estimates
The preparation of consolidated financial statements in conformity with US GAAP requires management to make certain estimates that affect the reported amounts in the consolidated financial statements and accompanying notes. Actual results could differ materially from those estimates.
Revenue Recognition
Rental revenues and tenant recoveries
We account for our rental revenues and tenant recoveries in accordance with Topic 842 "Leases". Rental revenues and tenant recoveries are included in: (i) Rental revenues and tenant recoveries under Office rental, and (ii) Rental revenues under Multifamily rental, on our consolidated statements of operations.
Collectibility
In accordance with Topic 842, we perform an assessment as to whether or not substantially all of the amounts due under a tenant’s lease agreement is deemed probable of collection. This assessment involves using a methodology that requires judgment and estimates about matters that are uncertain at the time the estimates are made, including tenant specific factors, specific industry conditions, and general economic trends and conditions. For leases where we have concluded it is probable that we will collect substantially all the lease payments due under those leases, we continue to record lease income on a straight-line basis over the lease term. For leases where we have concluded that it is not probable that we will collect substantially all the lease payments due under those leases, we limit the lease income to the lesser of the income recognized on a straight-line basis or cash basis. We write-off tenant receivables and deferred rent receivables as a charge against rental revenues and tenant recoveries in the period we conclude that substantially all of the lease payments are not probable of collection. If we subsequently collect amounts that were previously written off then the amounts collected are recorded as an increase to our rental revenues and tenant recoveries in the period they are collected. If our conclusion of collectibility changes, we will record the difference between the lease income that would have been recognized on a straight-line basis and cash basis as a current-period adjustment to rental revenues and tenant recoveries. Charges for uncollectible office tenant receivables and deferred rent receivables, reduced our office revenues by: •$0.2 million and $0.1 million for the three months ended September 30, 2023 and 2022, respectively, and •$0.5 million and $0.3 million for the nine months ended September 30, 2023 and 2022, respectively.
We restored accrual basis accounting for certain office tenants that were previously determined to be uncollectible and accounted for on a cash basis of accounting, which increased our office revenues by: •$2.3 million and $1.6 million for the three months ended September 30, 2023 and 2022, respectively, and •$4.4 million and $3.3 million for the nine months ended September 30, 2023 and 2022, respectively.
Office parking revenues
We account for our office parking revenues in accordance with ASC 606 "Revenue from Contracts with Customers". Office parking revenues are included in Parking and other income under Office rental on our consolidated statements of operations. Our lease contracts generally make a specified number of parking spaces available to the tenant, and we bill and recognize parking revenues on a monthly basis in accordance with the lease agreements, generally using the monthly parking rates in effect at the time of billing.
Office parking revenues were: •$23.4 million and $22.1 million for the three months ended September 30, 2023, and 2022, respectively, and •$69.1 million and $62.6 million for the nine months ended September 30, 2023 and 2022, respectively. Office parking receivables, which are included in Tenant receivables on our consolidated balance sheets, were •$1.0 million as of September 30, 2023, and •$0.9 million as of December 31, 2022. Income Taxes
We have elected to be taxed as a REIT under the Code. Provided that we qualify for taxation as a REIT, we are generally not subject to corporate-level income tax on the earnings distributed currently to our stockholders that we derive from our REIT qualifying activities. We are subject to corporate-level tax on the earnings that we derive through our TRS.
New Accounting Pronouncements
Changes to US GAAP are implemented by the FASB in the form of ASUs. We consider the applicability and impact of all ASUs. As of the date of this Report, the FASB has not issued any ASUs that we expect to be applicable and have a material impact on our consolidated financial statements.
|
| X |
- References
+ Details
| Name: |
us-gaap_AccountingPoliciesAbstract |
| Namespace Prefix: |
us-gaap_ |
| Data Type: |
xbrli:stringItemType |
| Balance Type: |
na |
| Period Type: |
duration |
|
| X |
- DefinitionThe entire disclosure for all significant accounting policies of the reporting entity. Reference 1: http://www.xbrl.org/2003/role/disclosureRef
-Topic 235
-SubTopic 10
-Name Accounting Standards Codification
-Section 50
-Paragraph 1
-Publisher FASB
-URI https://asc.fasb.org//1943274/2147483426/235-10-50-1
Reference 2: http://fasb.org/us-gaap/role/ref/legacyRef
-Topic 235
-Name Accounting Standards Codification
-Publisher FASB
-URI https://asc.fasb.org//235/tableOfContent
| Name: |
us-gaap_SignificantAccountingPoliciesTextBlock |
| Namespace Prefix: |
us-gaap_ |
| Data Type: |
dtr-types:textBlockItemType |
| Balance Type: |
na |
| Period Type: |
duration |
|
v3.23.3
Investment in Real Estate
|
9 Months Ended |
Sep. 30, 2023 |
|---|
| Real Estate [Abstract] |
|
| Investment in Real Estate |
Investment in Real Estate The table below summarizes our investment in real estate:
| | | | | | | | | | | | | (In thousands) | September 30, 2023 | | December 31, 2022 | | | | | | Land | $ | 1,185,977 | | $ | 1,185,977 | Buildings and improvements(1) | 10,118,965 | | 10,055,499 | | Tenant improvements and lease intangibles | 1,011,310 | | 981,460 | Property under development(1) | 69,225 | | 70,037 | | Investment in real estate, gross | $ | 12,385,477 | | $ | 12,292,973 |
________________________________________________ (1) During the nine months ended September 30, 2023, Property under development balances transferred to Building and improvements for real estate placed into service was $34.0 million.
2022 Property Acquisition
Acquisition of 1221 Ocean Avenue
On April 26, 2022, we paid $330.0 million, excluding acquisition costs, to acquire a luxury multifamily apartment building with 120 units, located at 1221 Ocean Avenue in Santa Monica. We acquired the property through a new consolidated JV that we manage and in which we own a 55% interest. We accounted for the acquisition as an asset acquisition and the acquired property's operating results are included in our consolidated operating results from the date of acquisition. The table below summarizes the purchase price allocation for the acquisition. The contract price and the purchase price allocation total in the table below differ due to acquisition costs, prorations and similar adjustments:
| | | | | | | (In thousands) | Purchase Price Allocation | | | | Land | $ | 22,086 | | | Buildings and improvements | 319,666 | | | Tenant improvements and lease intangibles | 8,879 | | | Acquired below-market leases | (18,542) | | | Other liabilities assumed | (1,619) | | | Net assets and liabilities acquired | $ | 330,470 | |
Property to be Removed from Service
During the second quarter of 2023, we filed paperwork to remove our Barrington Plaza Apartments property in Los Angeles from the rental market because of city directives to install fire sprinklers and other life safety improvements. In connection with the removal of the aforementioned property from the rental market, we accelerated and recorded additional depreciation expense of $27.4 million for the three months ended September 30, 2023 and $54.8 million for the nine months ended September 30, 2023, which is included in Depreciation and amortization on our consolidated statements of operations.
|
| X |
- References
+ Details
| Name: |
us-gaap_RealEstateAbstract |
| Namespace Prefix: |
us-gaap_ |
| Data Type: |
xbrli:stringItemType |
| Balance Type: |
na |
| Period Type: |
duration |
|
| X |
- DefinitionThe entire disclosure for certain real estate investment financial statements, real estate investment trust operating support agreements, real estate owned, retail land sales, time share transactions, as well as other real estate related disclosures. Reference 1: http://fasb.org/us-gaap/role/ref/legacyRef
-Topic 976
-Name Accounting Standards Codification
-Publisher FASB
-URI https://asc.fasb.org//976/tableOfContent
Reference 2: http://fasb.org/us-gaap/role/ref/legacyRef
-Topic 978
-Name Accounting Standards Codification
-Publisher FASB
-URI https://asc.fasb.org//978/tableOfContent
Reference 3: http://fasb.org/us-gaap/role/ref/legacyRef
-Topic 970
-Name Accounting Standards Codification
-Publisher FASB
-URI https://asc.fasb.org//970/tableOfContent
Reference 4: http://fasb.org/us-gaap/role/ref/legacyRef
-Topic 972
-Name Accounting Standards Codification
-Publisher FASB
-URI https://asc.fasb.org//972/tableOfContent
Reference 5: http://fasb.org/us-gaap/role/ref/legacyRef
-Topic 974
-Name Accounting Standards Codification
-Publisher FASB
-URI https://asc.fasb.org//974/tableOfContent
| Name: |
us-gaap_RealEstateDisclosureTextBlock |
| Namespace Prefix: |
us-gaap_ |
| Data Type: |
dtr-types:textBlockItemType |
| Balance Type: |
na |
| Period Type: |
duration |
|
v3.23.3
Ground Lease
|
9 Months Ended |
Sep. 30, 2023 |
|---|
| Lessee Disclosure [Abstract] |
|
| Ground Lease |
Ground Lease We pay rent under a ground lease located in Honolulu, Hawaii, which expires on December 31, 2086. The rent is fixed at $733 thousand per year until February 28, 2029, after which it will reset to the greater of the existing ground rent or the market rent at the time.
As of September 30, 2023, the ground lease right-of-use asset carrying value was $7.4 million and the ground lease liability was $10.8 million.
Ground rent expense, which is included in Office expenses on our consolidated statements of operations, was: •$183 thousand for each of the three month periods ended September 30, 2023 and 2022, and •$549 thousand for each of the nine month periods ended September 30, 2023 and 2022.
The table below, which assumes that the ground rent payments will continue to be $733 thousand per year after February 28, 2029, presents the future minimum ground lease payments as of September 30, 2023: | | | | | | | Twelve months ending September 30: | (In thousands) | | | | 2024 | $ | 733 | | | 2025 | 733 | | | 2026 | 733 | | | 2027 | 733 | | | 2028 | 733 | | | Thereafter | 42,696 | | | Total future minimum lease payments | $ | 46,361 | |
|
| X |
- References
+ Details
| Name: |
us-gaap_LesseeDisclosureAbstract |
| Namespace Prefix: |
us-gaap_ |
| Data Type: |
xbrli:stringItemType |
| Balance Type: |
na |
| Period Type: |
duration |
|
| X |
- DefinitionThe entire disclosure for operating leases of lessee. Includes, but is not limited to, description of operating lease and maturity analysis of operating lease liability. Reference 1: http://www.xbrl.org/2003/role/disclosureRef
-Topic 842
-SubTopic 20
-Name Accounting Standards Codification
-Publisher FASB
-URI https://asc.fasb.org//842-20/tableOfContent
| Name: |
us-gaap_LesseeOperatingLeasesTextBlock |
| Namespace Prefix: |
us-gaap_ |
| Data Type: |
dtr-types:textBlockItemType |
| Balance Type: |
na |
| Period Type: |
duration |
|
v3.23.3
Acquired Lease Intangibles
|
9 Months Ended |
Sep. 30, 2023 |
|---|
| Goodwill and Intangible Assets Disclosure [Abstract] |
|
| Acquired Lease Intangibles |
Acquired Lease Intangibles Summary of our Acquired Lease Intangibles
| | | | | | | | | | | | | (In thousands) | September 30, 2023 | | December 31, 2022 | | | | | | Above-market tenant leases | $ | 4,712 | | | $ | 4,968 | | | Above-market tenant leases - accumulated amortization | (2,474) | | | (2,309) | | | Above-market ground lease where we are the lessor | 1,152 | | | 1,152 | | | Above-market ground lease - accumulated amortization | (287) | | | (275) | | | Acquired lease intangible assets, net | $ | 3,103 | | | $ | 3,536 | | | | | | | Below-market tenant leases | $ | 50,347 | | | $ | 64,851 | | | Below-market tenant leases - accumulated accretion | (27,572) | | | (33,487) | | | Acquired lease intangible liabilities, net | $ | 22,775 | | | $ | 31,364 | |
Impact on the Consolidated Statements of Operations
The table below summarizes the net amortization/accretion related to our above- and below-market leases:
| | | | | | | | | | | | | | | | | | | | | | | | | | Three Months Ended September 30, | | Nine Months Ended September 30, | | (In thousands) | 2023 | | 2022 | | 2023 | | 2022 | | | | | | | | | Net accretion of above- and below-market tenant lease assets and liabilities(1) | $ | 2,466 | | | $ | 3,348 | | | $ | 8,169 | | | $ | 8,063 | | Amortization of an above-market ground lease asset(2) | (5) | | | (5) | | | (13) | | | (13) | | | Total | $ | 2,461 | | | $ | 3,343 | | | $ | 8,156 | | | $ | 8,050 | |
______________________________________________ (1) Recorded as a net increase to office and multifamily rental revenues. (2) Recorded as a decrease to office parking and other income.
|
| X |
- References
+ Details
| Name: |
us-gaap_GoodwillAndIntangibleAssetsDisclosureAbstract |
| Namespace Prefix: |
us-gaap_ |
| Data Type: |
xbrli:stringItemType |
| Balance Type: |
na |
| Period Type: |
duration |
|
| X |
- DefinitionThe entire disclosure for all or part of the information related to intangible assets. Reference 1: http://www.xbrl.org/2003/role/disclosureRef
-Topic 350
-SubTopic 30
-Name Accounting Standards Codification
-Publisher FASB
-URI https://asc.fasb.org//350-30/tableOfContent
| Name: |
us-gaap_IntangibleAssetsDisclosureTextBlock |
| Namespace Prefix: |
us-gaap_ |
| Data Type: |
dtr-types:textBlockItemType |
| Balance Type: |
na |
| Period Type: |
duration |
|
v3.23.3
Investment in Unconsolidated Fund
|
9 Months Ended |
Sep. 30, 2023 |
|---|
| Real Estate Investments, Net [Abstract] |
|
| Investment in Unconsolidated Fund |
Investment in Unconsolidated Fund Description of our Fund
As of September 30, 2023 and 2022, we managed and owned an equity interest of 33.5% in an unconsolidated Fund, Partnership X, through which we and other investors in the Fund owned two office properties totaling 0.4 million square feet. Partnership X pays us fees and reimburses us for certain expenses related to property management and other services we provide, which are included in Other income on our consolidated statements of operations. We also receive distributions based on invested capital and on any profits that exceed certain specified cash returns to the investors. The table below presents the cash distributions we received from Partnership X: | | | | | | | | | | | | | Nine Months Ended September 30, | | (In thousands) | 2023 | | 2022 | | | | | | Operating distributions received | $ | 957 | | | $ | 921 | | | Capital distributions received | 80 | | | 1,454 | | | Total distributions received | $ | 1,037 | | | $ | 2,375 | |
Summarized Financial Information for Partnership X
The tables below present selected financial information for Partnership X. The amounts presented reflect 100% (not our pro-rata share) of the amounts related to the Fund, and are based upon historical book value:
| | | | | | | | | | | | | (In thousands) | September 30, 2023 | | December 31, 2022 | | | | | | Total assets | $ | 149,588 | | | $ | 147,853 | | | Total liabilities | $ | 118,942 | | | $ | 119,038 | | | Total equity | $ | 30,646 | | | $ | 28,815 | |
| | | | | | | | | | | | | | Nine Months Ended September 30, | | (In thousands) | 2023 | | 2022 | | | | | | Total revenues | $ | 14,929 | | | $ | 13,893 | | | Operating income | $ | 4,749 | | | $ | 4,361 | | | Net income | $ | 3,167 | | | $ | 2,387 | |
|
| X |
- DefinitionThe entire disclosure for equity method investments and joint ventures. Equity method investments are investments that give the investor the ability to exercise significant influence over the operating and financial policies of an investee. Joint ventures are entities owned and operated by a small group of businesses as a separate and specific business or project for the mutual benefit of the members of the group. Reference 1: http://www.xbrl.org/2003/role/disclosureRef
-Topic 323
-SubTopic 10
-Name Accounting Standards Codification
-Section 50
-Paragraph 3
-Subparagraph (a)(3)
-Publisher FASB
-URI https://asc.fasb.org//1943274/2147481687/323-10-50-3
Reference 2: http://www.xbrl.org/2003/role/disclosureRef
-Topic 323
-SubTopic 10
-Name Accounting Standards Codification
-Section 50
-Paragraph 3
-Subparagraph (d)
-Publisher FASB
-URI https://asc.fasb.org//1943274/2147481687/323-10-50-3
Reference 3: http://www.xbrl.org/2003/role/recommendedDisclosureRef
-Topic 323
-SubTopic 740
-Name Accounting Standards Codification
-Section 50
-Paragraph 2
-Subparagraph (f)
-Publisher FASB
-URI https://asc.fasb.org//1943274/2147481543/323-740-50-2
Reference 4: http://www.xbrl.org/2003/role/disclosureRef
-Name Accounting Standards Codification
-Topic 323
-Publisher FASB
-URI https://asc.fasb.org//323/tableOfContent
| Name: |
us-gaap_EquityMethodInvestmentsDisclosureTextBlock |
| Namespace Prefix: |
us-gaap_ |
| Data Type: |
dtr-types:textBlockItemType |
| Balance Type: |
na |
| Period Type: |
duration |
|
| X |
- References
+ Details
| Name: |
us-gaap_RealEstateInvestmentsAbstract |
| Namespace Prefix: |
us-gaap_ |
| Data Type: |
xbrli:stringItemType |
| Balance Type: |
na |
| Period Type: |
duration |
|
v3.23.3
Other Assets
|
9 Months Ended |
Sep. 30, 2023 |
|---|
| Other Assets [Abstract] |
|
| Other Assets |
Other Assets | | | | | | | | | | | | | (In thousands) | September 30, 2023 | | December 31, 2022 | | | | | | Restricted cash | $ | 101 | | | $ | 101 | | | Prepaid expenses | 30,811 | | | 19,871 | | | Indefinite-lived intangibles | 1,988 | | | 1,988 | | Deposit with lender(1) | 13,300 | | | — | | | Furniture, fixtures and equipment, net | 7,042 | | | 7,144 | | | Other | 7,152 | | | 4,837 | | | Total other assets | $ | 60,394 | | | $ | 33,941 | |
_______________________________________________________________________ (1) In connection with the Barrington Plaza loan, Barrington Plaza Apartments have been removed from the rental market. The lender is treating the debt as a construction loan. They have required a $13.3 million cash deposit, which we placed in a collateral account during the third quarter, and they are requiring a construction completion guarantee. See Note 8 for our debt disclosures.
|
| X |
- References
+ Details
| Name: |
us-gaap_OtherAssetsAbstract |
| Namespace Prefix: |
us-gaap_ |
| Data Type: |
xbrli:stringItemType |
| Balance Type: |
na |
| Period Type: |
duration |
|
| X |
- DefinitionThe entire disclosure for other assets. This disclosure includes other current assets and other noncurrent assets.
| Name: |
us-gaap_OtherAssetsDisclosureTextBlock |
| Namespace Prefix: |
us-gaap_ |
| Data Type: |
dtr-types:textBlockItemType |
| Balance Type: |
na |
| Period Type: |
duration |
|
v3.23.3
Secured Notes Payable, Net
|
9 Months Ended |
Sep. 30, 2023 |
|---|
| Debt Disclosure [Abstract] |
|
| Secured Notes Payable, Net |
Secured Notes Payable, Net | | | | | | | | | | | | | | | | | | | | | | | | | | | | | | | | | | | | | | | | Description | | Maturity Date(1) | | Principal Balance as of September 30, 2023 | | Principal Balance as of December 31, 2022 | | Variable Interest Rate(2) | | Fixed Interest Rate(3) | | Swap Maturity Date | | | | | | | | | | | | | | | | | | (In thousands) | | | | | | | | | | | | | | | | | | | | | Consolidated Wholly Owned Subsidiaries | Term loan(4)(5) | | 3/3/2025 | | $ | 335,000 | | | $ | 335,000 | | | SOFR + 1.41% | | N/A | | N/A | Fannie Mae loan(4)(5) | | 4/1/2025 | | 102,400 | | | 102,400 | | | SOFR + 1.36% | | N/A | | N/A | Term loan(4) | | 8/15/2026 | | 415,000 | | | 415,000 | | | SOFR + 1.20% | | 3.07% | | 8/1/2025 | Term loan(4) | | 9/19/2026 | | 400,000 | | | 400,000 | | | SOFR + 1.25% | | 2.44% | | 9/1/2024 | Term loan(4) | | 9/26/2026 | | 200,000 | | | 200,000 | | | SOFR + 1.30% | | 2.36% | | 10/1/2024 | Term loan(4) | | 11/1/2026 | | 400,000 | | | 400,000 | | | SOFR + 1.25% | | 2.31% | | 10/1/2024 | Fannie Mae loan(4)(6) | | 6/1/2027 | | 550,000 | | | 550,000 | | | SOFR + 1.48% | | N/A | | N/A | Term loan(4) | | 5/18/2028 | | 300,000 | | | 300,000 | | | SOFR + 1.51% | | 2.21% | | 6/1/2026 | Term loan(4) | | 1/1/2029 | | 300,000 | | | 300,000 | | | SOFR + 1.56% | | 2.66% | | 1/1/2027 | Fannie Mae loan(4) | | 6/1/2029 | | 255,000 | | | 255,000 | | | SOFR + 1.09% | | 3.26% | | 6/1/2027 | Fannie Mae loan(4) | | 6/1/2029 | | 125,000 | | | 125,000 | | | SOFR + 1.09% | | 3.25% | | 6/1/2027 | Fannie Mae loan(4)(7) | | 8/1/2033 | | 350,000 | | | — | | | SOFR + 1.37% | | N/A | | N/A | Term loan(8) | | 6/1/2038 | | 27,859 | | | 28,502 | | | N/A | | 4.55% | | N/A | | Total Wholly-Owned Subsidiary Debt | 3,760,259 | | | 3,410,902 | | | | | | | | | | | | | | | | | | | | | | Consolidated JVs | Term loan(4)(9) | | 12/19/2024 | | 400,000 | | | 400,000 | | | SOFR + 1.40% | | N/A | | N/A | Term loan(4) | | 5/15/2027 | | 450,000 | | | 450,000 | | | SOFR + 1.45% | | 2.26% | | 4/1/2025 | Term loan(4) | | 8/19/2028 | | 625,000 | | | 625,000 | | | SOFR + 1.45% | | 2.12% | | 6/1/2025 | Term loan(4) | | 4/26/2029 | | 175,000 | | | 175,000 | | | SOFR + 1.25% | | 3.90% | | 5/1/2026 | Fannie Mae loan(4) | | 6/1/2029 | | 160,000 | | | 160,000 | | | SOFR + 1.09% | | 3.25% | | 7/1/2027 | Total Consolidated Debt(10) | 5,570,259 | | | 5,220,902 | | | | | | | | Unamortized loan premium, net(11) | 3,203 | | | 3,547 | | | | | | | | Unamortized deferred loan costs, net(12) | (31,616) | | | (32,556) | | | | | | | | | Total Consolidated Debt, net | $ | 5,541,846 | | | $ | 5,191,893 | | | | | | | |
_______________________________________________________________________ Except as noted below, our loans: (i) are non-recourse, (ii) are secured by separate collateral pools consisting of one or more properties, (iii) require interest-only monthly payments with the outstanding principal due upon maturity, and (iv) contain certain financial covenants which could require us to deposit excess cash flow with the lender under certain circumstances unless we (at our option) either provide a guarantee or additional collateral or pay down the loan within certain parameters set forth in the loan documents. Certain loans with maturity date extension options require us to meet minimum financial thresholds in order to extend the loan maturity date. (1)Maturity dates include extension options. (2)LIBOR loans converted to SOFR during the third quarter include a small SOFR adjustment to calculate the interest payable to the lender, which are included in the spreads. The SOFR conversion did not change the swap-fixed interest rates for our swap-fixed loans. (3)Effective rate as of September 30, 2023. Includes the effect of interest rate swaps (if applicable) and excludes the effect of prepaid loan fees and loan premiums. See Note 10 for details of our interest rate swaps. See further below for details of our loan costs and loan premiums. (4)The loan agreement includes a zero-percent SOFR floor. If the loan is swap-fixed then the related swaps do not include such a floor. (5)The swaps expired on March 1, 2023. (6)The loan is secured by four residential properties. A portion of the loan totaling $472 million has a lender-required out-of-the-money interest rate cap at a weighted average of 8.99% until July 2026. Barrington Plaza Apartments have been removed from the rental market. See Note 3. For the portion of the loan relating to Barrington Plaza, the lender is treating the debt as a construction loan. They have required a $13.3 million cash deposit, which we placed in a collateral account during the third quarter, and they are requiring a construction completion guarantee. The lender will return the deposit at the earlier of August 2026 or when the loan is paid in full. The deposit is included in Other assets in our balance sheet. See Note 7. (7)We closed the loan during the third quarter of 2023. The loan has a lender-required out-of-the-money interest rate cap at an interest rate of 7.84% until August 2026. We used part of the proceeds from the loan to pay off the balance on our revolving credit facility, which expired in August 2023. There was no balance outstanding on the credit facility as of December 31, 2022. (8)The loan requires monthly payments of principal and interest. The principal amortization is based upon a 30-year amortization schedule. (9)The swaps expired on January 1, 2023. (10)The table does not include our unconsolidated Fund's loan - see Note 16. See Note 13 for our fair value disclosures. (11)Balances are net of accumulated amortization of $4.0 million and $3.7 million at September 30, 2023 and December 31, 2022, respectively. (12)Balances are net of accumulated amortization of $54.2 million and $54.1 million at September 30, 2023 and December 31, 2022, respectively.
Debt Statistics
The table below summarizes our consolidated fixed and floating rate debt: | | | | | | | | | | | | | | | | (In thousands) | | Principal Balance as of September 30, 2023 | | Principal Balance as of December 31, 2022 | | | | | | | Aggregate swapped to fixed rate loans | | $ | 3,805,000 | | | $ | 4,642,400 | | | Aggregate fixed rate loans | | 27,859 | | | 28,502 | | | Aggregate capped rate loans | | 822,000 | | | — | | | Aggregate floating rate loans | | 915,400 | | | 550,000 | | | Total Debt | | $ | 5,570,259 | | | $ | 5,220,902 | |
The table below summarizes certain consolidated debt statistics as of September 30, 2023: | | | | | | | | | | Statistics for consolidated loans with interest fixed under the terms of the loan or a swap | | | | | Principal balance (in billions) | | $3.83 | | Weighted average remaining life (including extension options) | | 4.3 years | | Weighted average remaining fixed interest period | | 2.1 years | | Weighted average annual interest rate | | 2.65% |
Future Principal Payments
At September 30, 2023, the minimum future principal payments due on our consolidated secured notes payable were as follows: | | | | | | | | | | Twelve months ending September 30: | | Including Maturity Extension Options(1) | | | | | | (In thousands) | | | | | 2024 | | $ | 891 | | | 2025 | | 838,333 | | | 2026 | | 1,015,976 | | | 2027 | | 1,401,022 | | | 2028 | | 926,069 | | | Thereafter | | 1,387,968 | | | Total future principal payments | | $ | 5,570,259 | |
________________________________________________ (1) Some of our loan agreements require that we meet certain minimum financial thresholds to be able to extend the loan maturity. Loan Premium and Loan Costs
The table below presents loan premium and loan costs, which are included in Interest expense on our consolidated statements of operations: | | | | | | | | | | | | | | | | | | | | | | | | | | Three Months Ended September 30, | | Nine Months Ended September 30, | | (In thousands) | 2023 | | 2022 | | 2023 | | 2022 | | | | | | | | | | Loan premium amortized and written off | $ | (116) | | | $ | (116) | | | $ | (344) | | | $ | (344) | | | Deferred loan costs amortized and written off | 2,261 | | | 2,030 | | | 6,623 | | | 5,908 | | | Loan costs expensed | 59 | | | 8 | | | 79 | | | 110 | | | Total | $ | 2,204 | | | $ | 1,922 | | | $ | 6,358 | | | $ | 5,674 | |
|
| X |
- References
+ Details
| Name: |
us-gaap_DebtDisclosureAbstract |
| Namespace Prefix: |
us-gaap_ |
| Data Type: |
xbrli:stringItemType |
| Balance Type: |
na |
| Period Type: |
duration |
|
| X |
- DefinitionThe entire disclosure for information about short-term and long-term debt arrangements, which includes amounts of borrowings under each line of credit, note payable, commercial paper issue, bonds indenture, debenture issue, own-share lending arrangements and any other contractual agreement to repay funds, and about the underlying arrangements, rationale for a classification as long-term, including repayment terms, interest rates, collateral provided, restrictions on use of assets and activities, whether or not in compliance with debt covenants, and other matters important to users of the financial statements, such as the effects of refinancing and noncompliance with debt covenants. Reference 1: http://www.xbrl.org/2003/role/disclosureRef
-Topic 470
-SubTopic 20
-Name Accounting Standards Codification
-Section 50
-Paragraph 1B
-Subparagraph (h)
-Publisher FASB
-URI https://asc.fasb.org//1943274/2147481139/470-20-50-1B
Reference 2: http://www.xbrl.org/2003/role/disclosureRef
-Topic 235
-SubTopic 10
-Name Accounting Standards Codification
-Section S99
-Paragraph 1
-Subparagraph (SX 210.4-08(c))
-Publisher FASB
-URI https://asc.fasb.org//1943274/2147480678/235-10-S99-1
Reference 3: http://fasb.org/us-gaap/role/ref/legacyRef
-Topic 470
-Name Accounting Standards Codification
-Publisher FASB
-URI https://asc.fasb.org//470/tableOfContent
Reference 4: http://www.xbrl.org/2003/role/disclosureRef
-Topic 470
-SubTopic 20
-Name Accounting Standards Codification
-Section 50
-Paragraph 1B
-Publisher FASB
-URI https://asc.fasb.org//1943274/2147481139/470-20-50-1B
Reference 5: http://www.xbrl.org/2003/role/disclosureRef
-Topic 470
-SubTopic 20
-Name Accounting Standards Codification
-Section 50
-Paragraph 1B
-Subparagraph (g)
-Publisher FASB
-URI https://asc.fasb.org//1943274/2147481139/470-20-50-1B
Reference 6: http://www.xbrl.org/2003/role/disclosureRef
-Topic 470
-SubTopic 20
-Name Accounting Standards Codification
-Section 50
-Paragraph 1B
-Subparagraph (i)
-Publisher FASB
-URI https://asc.fasb.org//1943274/2147481139/470-20-50-1B
Reference 7: http://www.xbrl.org/2003/role/disclosureRef
-Topic 470
-SubTopic 20
-Name Accounting Standards Codification
-Section 50
-Paragraph 1C
-Subparagraph (a)
-Publisher FASB
-URI https://asc.fasb.org//1943274/2147481139/470-20-50-1C
Reference 8: http://www.xbrl.org/2003/role/disclosureRef
-Topic 470
-SubTopic 20
-Name Accounting Standards Codification
-Section 50
-Paragraph 1C
-Subparagraph (b)
-Publisher FASB
-URI https://asc.fasb.org//1943274/2147481139/470-20-50-1C
Reference 9: http://www.xbrl.org/2003/role/disclosureRef
-Topic 470
-SubTopic 20
-Name Accounting Standards Codification
-Section 50
-Paragraph 1C
-Subparagraph (c)
-Publisher FASB
-URI https://asc.fasb.org//1943274/2147481139/470-20-50-1C
Reference 10: http://www.xbrl.org/2003/role/disclosureRef
-Topic 470
-SubTopic 20
-Name Accounting Standards Codification
-Section 50
-Paragraph 1E
-Subparagraph (b)
-Publisher FASB
-URI https://asc.fasb.org//1943274/2147481139/470-20-50-1E
Reference 11: http://www.xbrl.org/2003/role/disclosureRef
-Topic 470
-SubTopic 20
-Name Accounting Standards Codification
-Section 50
-Paragraph 1I
-Subparagraph (a)
-Publisher FASB
-URI https://asc.fasb.org//1943274/2147481139/470-20-50-1I
Reference 12: http://www.xbrl.org/2003/role/disclosureRef
-Topic 470
-SubTopic 20
-Name Accounting Standards Codification
-Section 50
-Paragraph 1I
-Subparagraph (b)
-Publisher FASB
-URI https://asc.fasb.org//1943274/2147481139/470-20-50-1I
Reference 13: http://www.xbrl.org/2003/role/disclosureRef
-Topic 470
-SubTopic 20
-Name Accounting Standards Codification
-Section 50
-Paragraph 1I
-Subparagraph (d)
-Publisher FASB
-URI https://asc.fasb.org//1943274/2147481139/470-20-50-1I
| Name: |
us-gaap_DebtDisclosureTextBlock |
| Namespace Prefix: |
us-gaap_ |
| Data Type: |
dtr-types:textBlockItemType |
| Balance Type: |
na |
| Period Type: |
duration |
|
v3.23.3
Interest Payable, Accounts Payable and Deferred Revenue
|
9 Months Ended |
Sep. 30, 2023 |
|---|
| Accounts Payable and Accrued Liabilities [Abstract] |
|
| Interest Payable, Accounts Payable and Deferred Revenue |
Interest Payable, Accounts Payable and Deferred Revenue | | | | | | | | | | | | | (In thousands) | September 30, 2023 | | December 31, 2022 | | | | | | Interest payable | $ | 18,028 | | | $ | 13,529 | | | Accounts payable and accrued liabilities | 99,805 | | | 80,244 | | | Deferred revenue | 51,236 | | | 47,152 | | | Total interest payable, accounts payable and deferred revenue | $ | 169,069 | | | $ | 140,925 | |
|
| X |
- References
+ Details
| Name: |
us-gaap_AccountsPayableAndAccruedLiabilitiesCurrentAndNoncurrentAbstract |
| Namespace Prefix: |
us-gaap_ |
| Data Type: |
xbrli:stringItemType |
| Balance Type: |
na |
| Period Type: |
duration |
|
| X |
- DefinitionThe entire disclosure for accounts payable and accrued liabilities at the end of the reporting period. Reference 1: http://fasb.org/us-gaap/role/ref/legacyRef
-Name Accounting Standards Codification
-Topic 210
-SubTopic 10
-Section S99
-Paragraph 1
-Subparagraph (SX 210.5-02.19(a),20,24)
-Publisher FASB
-URI https://asc.fasb.org//1943274/2147480566/210-10-S99-1
| Name: |
us-gaap_AccountsPayableAndAccruedLiabilitiesDisclosureTextBlock |
| Namespace Prefix: |
us-gaap_ |
| Data Type: |
dtr-types:textBlockItemType |
| Balance Type: |
na |
| Period Type: |
duration |
|
v3.23.3
Derivative Contracts
|
9 Months Ended |
Sep. 30, 2023 |
|---|
| Derivative Instruments and Hedging Activities Disclosure [Abstract] |
|
| Derivative Contracts |
Derivative Contracts We make use of interest rate swap and cap contracts to manage the risk associated with changes in interest rates on our floating-rate debt and to satisfy certain lender requirements. When we enter into a floating-rate term loan, we generally enter into an interest rate swap agreement for the equivalent principal amount, for a period covering the majority of the loan term, which effectively converts our floating-rate debt to a fixed-rate basis during that time. We also enter into interest rate cap agreements from time to time to cap the interest rates on our floating rate loans. We may enter into derivative contracts that are intended to hedge certain economic risks, even though hedge accounting does not apply or we elect to not apply hedge accounting. We do not speculate in derivatives and we do not make use of any other derivative instruments. See Note 8 regarding our debt and our consolidated JVs' debt that is hedged.
Derivative Summary
The table below summarizes our derivative contracts as of September 30, 2023: | | | | | | | | | | | | | Number of Interest Rate Contracts | | Notional
(In thousands) | | | | | | Derivatives Designated as Cash Flow Hedges: | | | | Consolidated derivatives - swaps(1)(2)(3) | 24 | | $ | 3,805,000 | | Consolidated derivatives - caps(2)(3)(4) | 5 | | $ | 822,000 | | Unconsolidated Fund's derivatives - swaps(2)(3)(5) | 2 | | $ | 115,000 | | | | | | | Derivatives Not Designated as Cash Flow Hedges: | | | | Consolidated derivatives - caps(6) | — | | $ | — | |
___________________________________________________ (1)The notional amount includes 100%, not our pro-rata share, of our consolidated JVs' derivatives. See Note 8 for more information about our hedged consolidated debt. (2)Our derivative contracts do not provide for right of offset between derivative contracts. (3)See Note 13 for our derivative fair value disclosures. (4)We purchased five interest rate caps with a notional amount of $822.0 million during the third quarter of 2023. See Note 8 for more information about our hedged consolidated debt. (5)The notional amount reflects 100%, not our pro-rata share, of our unconsolidated Fund's derivatives. See Note 6 for more information about our Fund, including our equity interest percentage. (6)Five interest rate caps with a total aggregate notional amount of $1.10 billion expired on July 1, 2023.
Counterparty Credit Risk
We are subject to credit risk from the counterparties on our interest rate swap and cap contract assets because we do not receive collateral. We seek to minimize that risk by entering into agreements with a variety of counterparties with investment grade ratings. The fair value of our interest rate swap and cap contract assets, including accrued interest and excluding credit risk adjustments, was as follows: | | | | | | | | | | | | | (In thousands) | September 30, 2023 | | December 31, 2022 | | | | | Consolidated derivatives(1) | $ | 262,322 | | | $ | 281,982 | | Unconsolidated Fund's derivatives(2) | $ | 12,877 | | | $ | 12,863 | |
___________________________________________________ (1)The amounts include 100%, not our pro-rata share, of our consolidated JVs' derivatives. (2)The amounts reflect 100%, not our pro-rata share, of our unconsolidated Fund's derivatives. For more information about our Fund, including our equity interest percentage, see Note 6. Impact of Hedges on AOCI and the Consolidated Statements of Operations
The table below presents the effect of our derivatives on our AOCI and the consolidated statements of operations:
| | | | | | | | | | | | | (In thousands) | Nine Months Ended September 30, | | | 2023 | | 2022 | | Derivatives Designated as Cash Flow Hedges: | | | | | | | | | Consolidated derivatives: | | | | Gains recorded in AOCI before reclassifications(1) | $ | 83,157 | | | $ | 318,408 | | (Gains) losses reclassified from AOCI to Interest Expense(1) | $ | (104,891) | | | $ | 20,505 | | | Interest expense presented on the consolidated statements of operations | $ | (151,859) | | | $ | (109,560) | | Unconsolidated Fund's derivatives (our share)(2): | | | | Gains recorded in AOCI before reclassifications(1) | $ | 1,185 | | | $ | 3,777 | | Gains reclassified from AOCI to Income from unconsolidated Fund(1) | $ | (1,208) | | | $ | (62) | | | Income from unconsolidated Fund presented on the consolidated statements of operations | $ | 1,177 | | | $ | 921 | | | Derivatives Not Designated as Cash Flow Hedges: | | | | | Consolidated derivatives: | | | | Loss recorded as interest expense(3) | $ | — | | | $ | 38 | |
___________________________________________________ (1)See Note 11 for our AOCI reconciliation. (2)We calculate our share by multiplying the total amount for the Fund by our equity interest in the Fund. For more information about our Fund, including our equity interest percentage, see Note 6. (3)Gains and losses from non-designated interest rate caps offset each other during the periods presented. The respective caps expired on July 1, 2023.
Future Reclassifications from AOCI
At September 30, 2023, our estimate of the AOCI related to derivatives designated as cash flow hedges that will be reclassified to earnings during the next twelve months is as follows:
| | | | | | | (In thousands) | | | | Consolidated derivatives: | | | Gains to be reclassified from AOCI to Interest Expense | $ | 150,054 | | Unconsolidated Fund's derivatives (our share)(1): | | | Gains to be reclassified from AOCI to Income from unconsolidated Fund | $ | 1,741 | |
___________________________________________________ (1) We calculate our share by multiplying the total amount for the Fund by our equity interest in the Fund. For more information about our Fund, including our equity interest percentage, see Note 6.
|
| X |
- References
+ Details
| Name: |
us-gaap_DerivativeInstrumentsAndHedgingActivitiesDisclosureAbstract |
| Namespace Prefix: |
us-gaap_ |
| Data Type: |
xbrli:stringItemType |
| Balance Type: |
na |
| Period Type: |
duration |
|
| X |
- DefinitionThe entire disclosure for derivative instruments and hedging activities including, but not limited to, risk management strategies, non-hedging derivative instruments, assets, liabilities, revenue and expenses, and methodologies and assumptions used in determining the amounts. Reference 1: http://www.xbrl.org/2003/role/disclosureRef
-Topic 815
-SubTopic 40
-Name Accounting Standards Codification
-Section 50
-Paragraph 5
-Subparagraph (f)
-Publisher FASB
-URI https://asc.fasb.org//1943274/2147480237/815-40-50-5
Reference 2: http://www.xbrl.org/2003/role/disclosureRef
-Topic 815
-SubTopic 10
-Name Accounting Standards Codification
-Section 50
-Paragraph 5C
-Subparagraph (b)
-Publisher FASB
-URI https://asc.fasb.org//1943274/2147480434/815-10-50-5C
Reference 3: http://fasb.org/us-gaap/role/ref/legacyRef
-Topic 815
-Name Accounting Standards Codification
-Publisher FASB
-URI https://asc.fasb.org//815/tableOfContent
| Name: |
us-gaap_DerivativeInstrumentsAndHedgingActivitiesDisclosureTextBlock |
| Namespace Prefix: |
us-gaap_ |
| Data Type: |
dtr-types:textBlockItemType |
| Balance Type: |
na |
| Period Type: |
duration |
|
v3.23.3
Equity
|
9 Months Ended |
Sep. 30, 2023 |
|---|
| Stockholders' Equity Note [Abstract] |
|
| Equity |
Equity Transactions During the Nine Months Ended September 30, 2023 •We repurchased 9.1 million shares of our common stock for $109.1 million in cash, excluding transaction costs, in open market transactions. The average purchase price was $12.03 per share. •We acquired 29 thousand OP Units for $367 thousand in cash.
During the Nine Months Ended September 30, 2022 •We acquired 260 thousand OP Units in exchange for issuing an equal number of shares of our common stock to the holders of the OP Units. •We acquired 10 thousand OP Units for $336 thousand in cash. •We acquired a multifamily apartment building through a new consolidated JV that we manage and in which we own a 55% interest. See Note 3 for more information regarding the property we purchased. We contributed $99.0 million to the JV and an outside investor contributed $81.0 million to the JV.
Noncontrolling Interests
Our noncontrolling interests consist of interests in our Operating Partnership and consolidated JVs which are not owned by us. As of September 30, 2023, noncontrolling interests in our Operating Partnership owned 32.5 million OP Units and fully-vested LTIP Units, which represented approximately 16.3% of our Operating Partnership's total outstanding interests, and we owned 166.7 million OP Units (to match our 166.7 million shares of outstanding common stock).
A share of our common stock, an OP Unit and an LTIP Unit (once vested and booked up) have essentially the same economic characteristics, sharing equally in the distributions from our Operating Partnership. Investors who own OP Units have the right to cause our Operating Partnership to acquire their OP Units for an amount of cash per unit equal to the market value of one share of our common stock at the date of acquisition, or, at our election, exchange their OP Units for shares of our common stock on a one-for-one basis. LTIP Units have been granted to our employees and non-employee directors as part of their compensation. These awards generally vest over a service period and once vested can generally be converted to OP Units provided our stock price increases by more than a specified hurdle.
Changes in our Ownership Interest in our Operating Partnership
The table below presents the effect on our equity from net (loss) income attributable to common stockholders and changes in our ownership interest in our Operating Partnership: | | | | | | | | | | | | | | Nine Months Ended September 30, | | (In thousands) | 2023 | | 2022 | | | | | | Net (loss) income attributable to common stockholders | $ | (2,251) | | | $ | 72,843 | | | | | | | Transfers from noncontrolling interests: | | | | | Exchange of OP Units with noncontrolling interests | — | | | 4,236 | | | Repurchases of OP Units from noncontrolling interests | 120 | | | (176) | | | Net transfers from noncontrolling interests | 120 | | | 4,060 | | | | | | | Change from net (loss) income attributable to common stockholders and transfers from noncontrolling interests | $ | (2,131) | | | $ | 76,903 | |
AOCI Reconciliation(1)
The table below presents a reconciliation of our AOCI, which consists solely of adjustments related to derivatives designated as cash flow hedges: | | | | | | | | | | | | | Nine Months Ended September 30, | | (In thousands) | 2023 | | 2022 | | | | | | Accumulated Other Comprehensive Income (Loss) - Beginning balance | $ | 187,063 | | | $ | (38,774) | | | Consolidated derivatives: | | | | | Other comprehensive income before reclassifications | 83,157 | | | 318,408 | | | Reclassification of (gains) losses from AOCI to Interest Expense | (104,891) | | | 20,505 | | Unconsolidated Fund's derivatives (our share)(2): | | | | | Other comprehensive income before reclassifications | 1,185 | | | 3,777 | | | Reclassification of gains from AOCI to Income from unconsolidated Fund | (1,208) | | | (62) | | | Net current period OCI | (21,757) | | | 342,628 | | | OCI attributable to noncontrolling interests | 4,454 | | | (104,205) | | | OCI attributable to common stockholders | (17,303) | | | 238,423 | | | | | | | Accumulated Other Comprehensive Income - Ending balance | $ | 169,760 | | | $ | 199,649 | |
___________________________________________________ (1)See Note 10 for the details of our derivatives and Note 13 for our derivative fair value disclosures. (2)We calculate our share by multiplying the total amount for our Fund by our equity interest in the Fund. For more information about our Fund, including our equity interest percentage, see Note 6.
Stock-Based Compensation
The Douglas Emmett, Inc. 2016 Omnibus Stock Incentive Plan, as amended (the "2016 Plan"), permits us to make grants of stock-based compensation awards to our directors, officers, employees and consultants. The plan is administered by the compensation committee of our board of directors. On May 24, 2023, we held our 2023 annual meeting of stockholders. At the annual meeting, our stockholders approved an amendment to the 2016 Plan to, among other things, increase the number of shares of common stock available for future awards by 19 million. As of September 30, 2023, we had an aggregate of 21.3 million shares of common stock available for future awards.
The table below presents our stock-based compensation expense: | | | | | | | | | | | | | | | | | | | | | | | | | Three Months Ended September 30, | | Nine Months Ended September 30, | | (In thousands) | 2023 | | 2022 | | 2023 | | 2022 | | | | | | | | | | Stock-based compensation expense | $ | 2,327 | | | $ | 2,266 | | | $ | 7,553 | | | $ | 7,156 | | | Capitalized stock-based compensation | $ | 752 | | | $ | 826 | | | $ | 2,209 | | | $ | 2,455 | |
|
| X |
- References
+ Details
| Name: |
us-gaap_StockholdersEquityNoteAbstract |
| Namespace Prefix: |
us-gaap_ |
| Data Type: |
xbrli:stringItemType |
| Balance Type: |
na |
| Period Type: |
duration |
|
| X |
- DefinitionThe entire disclosure for equity. Reference 1: http://www.xbrl.org/2003/role/disclosureRef
-Topic 505
-SubTopic 10
-Name Accounting Standards Codification
-Section 50
-Paragraph 13
-Subparagraph (b)
-Publisher FASB
-URI https://asc.fasb.org//1943274/2147481112/505-10-50-13
Reference 2: http://www.xbrl.org/2003/role/disclosureRef
-Topic 505
-SubTopic 10
-Name Accounting Standards Codification
-Section 50
-Paragraph 13
-Subparagraph (h)
-Publisher FASB
-URI https://asc.fasb.org//1943274/2147481112/505-10-50-13
Reference 3: http://www.xbrl.org/2003/role/disclosureRef
-Topic 505
-SubTopic 10
-Name Accounting Standards Codification
-Section 50
-Paragraph 14
-Subparagraph (b)
-Publisher FASB
-URI https://asc.fasb.org//1943274/2147481112/505-10-50-14
Reference 4: http://www.xbrl.org/2003/role/disclosureRef
-Topic 946
-SubTopic 235
-Name Accounting Standards Codification
-Section 50
-Paragraph 2
-Subparagraph (a)
-Publisher FASB
-URI https://asc.fasb.org//1943274/2147481062/946-235-50-2
Reference 5: http://www.xbrl.org/2003/role/disclosureRef
-Topic 946
-SubTopic 235
-Name Accounting Standards Codification
-Section 50
-Paragraph 2
-Subparagraph (d)
-Publisher FASB
-URI https://asc.fasb.org//1943274/2147481062/946-235-50-2
Reference 6: http://www.xbrl.org/2003/role/disclosureRef
-Topic 946
-SubTopic 505
-Name Accounting Standards Codification
-Section 50
-Paragraph 6
-Publisher FASB
-URI https://asc.fasb.org//1943274/2147481004/946-505-50-6
Reference 7: http://www.xbrl.org/2003/role/disclosureRef
-Topic 815
-SubTopic 40
-Name Accounting Standards Codification
-Section 50
-Paragraph 6
-Subparagraph (a)
-Publisher FASB
-URI https://asc.fasb.org//1943274/2147480237/815-40-50-6
Reference 8: http://www.xbrl.org/2003/role/disclosureRef
-Topic 505
-SubTopic 10
-Name Accounting Standards Codification
-Section S99
-Paragraph 1
-Subparagraph (SX 210.3-04)
-Publisher FASB
-URI https://asc.fasb.org//1943274/2147480008/505-10-S99-1
Reference 9: http://www.xbrl.org/2003/role/disclosureRef
-Topic 235
-SubTopic 10
-Name Accounting Standards Codification
-Section S99
-Paragraph 1
-Subparagraph (SX 210.4-08(e)(1))
-Publisher FASB
-URI https://asc.fasb.org//1943274/2147480678/235-10-S99-1
Reference 10: http://fasb.org/us-gaap/role/ref/legacyRef
-Topic 505
-Name Accounting Standards Codification
-Publisher FASB
-URI https://asc.fasb.org//505/tableOfContent
Reference 11: http://www.xbrl.org/2003/role/disclosureRef
-Topic 505
-SubTopic 10
-Name Accounting Standards Codification
-Section 50
-Paragraph 13
-Publisher FASB
-URI https://asc.fasb.org//1943274/2147481112/505-10-50-13
Reference 12: http://www.xbrl.org/2003/role/disclosureRef
-Topic 505
-SubTopic 10
-Name Accounting Standards Codification
-Section 50
-Paragraph 13
-Subparagraph (g)
-Publisher FASB
-URI https://asc.fasb.org//1943274/2147481112/505-10-50-13
Reference 13: http://www.xbrl.org/2003/role/disclosureRef
-Topic 505
-SubTopic 10
-Name Accounting Standards Codification
-Section 50
-Paragraph 13
-Subparagraph (i)
-Publisher FASB
-URI https://asc.fasb.org//1943274/2147481112/505-10-50-13
Reference 14: http://www.xbrl.org/2003/role/disclosureRef
-Topic 505
-SubTopic 10
-Name Accounting Standards Codification
-Section 50
-Paragraph 14
-Subparagraph (a)
-Publisher FASB
-URI https://asc.fasb.org//1943274/2147481112/505-10-50-14
Reference 15: http://www.xbrl.org/2003/role/disclosureRef
-Topic 505
-SubTopic 10
-Name Accounting Standards Codification
-Section 50
-Paragraph 14
-Subparagraph (c)
-Publisher FASB
-URI https://asc.fasb.org//1943274/2147481112/505-10-50-14
Reference 16: http://www.xbrl.org/2003/role/disclosureRef
-Topic 505
-SubTopic 10
-Name Accounting Standards Codification
-Section 50
-Paragraph 16
-Subparagraph (b)
-Publisher FASB
-URI https://asc.fasb.org//1943274/2147481112/505-10-50-16
Reference 17: http://www.xbrl.org/2003/role/disclosureRef
-Topic 505
-SubTopic 10
-Name Accounting Standards Codification
-Section 50
-Paragraph 18
-Subparagraph (a)
-Publisher FASB
-URI https://asc.fasb.org//1943274/2147481112/505-10-50-18
Reference 18: http://www.xbrl.org/2003/role/disclosureRef
-Topic 505
-SubTopic 10
-Name Accounting Standards Codification
-Section 50
-Paragraph 18
-Subparagraph (b)
-Publisher FASB
-URI https://asc.fasb.org//1943274/2147481112/505-10-50-18
Reference 19: http://www.xbrl.org/2003/role/disclosureRef
-Topic 505
-SubTopic 10
-Name Accounting Standards Codification
-Section 50
-Paragraph 18
-Subparagraph (d)
-Publisher FASB
-URI https://asc.fasb.org//1943274/2147481112/505-10-50-18
| Name: |
us-gaap_StockholdersEquityNoteDisclosureTextBlock |
| Namespace Prefix: |
us-gaap_ |
| Data Type: |
dtr-types:textBlockItemType |
| Balance Type: |
na |
| Period Type: |
duration |
|
v3.23.3
EPS
|
9 Months Ended |
Sep. 30, 2023 |
|---|
| Earnings Per Share [Abstract] |
|
| EPS |
EPS We calculate basic EPS by dividing the net income (loss) attributable to common stockholders for the period by the weighted average number of common shares outstanding during the period. We calculate diluted EPS by dividing the net income (loss) attributable to common stockholders for the period by the weighted average number of common shares and dilutive instruments outstanding during the period using the treasury stock method. We account for unvested LTIP awards that contain non-forfeitable rights to dividends as participating securities and include these securities in the computation of basic and diluted EPS using the two-class method. The table below presents the calculation of basic and diluted EPS:
| | | | | | | | | | | | | | | | | | | | | | | | | | Three Months Ended September 30, | | Nine Months Ended September 30, | | | 2023 | | 2022 | | 2023 | | 2022 | | Numerator (In thousands): | | | | | | | | | Net (loss) income attributable to common stockholders | $ | (13,362) | | | $ | 22,955 | | | $ | (2,251) | | | $ | 72,843 | | | Allocation to participating securities: Unvested LTIP Units | (271) | | | (218) | | | (831) | | | (666) | | | Net (loss) income attributable to common stockholders - basic and diluted | $ | (13,633) | | | $ | 22,737 | | | $ | (3,082) | | | $ | 72,177 | | | | | | | | | | | Denominator (In thousands): | | | | | | | | Weighted average shares of common stock outstanding - basic and diluted(1) | 166,738 | | | 175,784 | | | 170,553 | | | 175,742 | | | | | | | | | | | | | | | | | | | | | | | | | | | | | | | | | | | Net (loss) income per common share - basic and diluted | $ | (0.08) | | | $ | 0.13 | | | $ | (0.02) | | | $ | 0.41 | | | | | | | | | | | | | | | | | |
____________________________________________________ (1) Outstanding OP Units and vested LTIP Units are not included in the denominator in calculating diluted EPS, even though they may be exchanged under certain conditions for common stock on a one-for-one basis, because their associated net income or loss (equal on a per unit basis to the Net income or loss per common share - diluted) was already deducted in calculating Net income (loss) attributable to common stockholders. Accordingly, any exchange would not have any effect on diluted EPS. The table below presents the weighted average OP Units and vested LTIP Units outstanding for the respective periods:
| | | | | | | | | | | | | | | | | | | | | | | | | | Three Months Ended September 30, | | Nine Months Ended September 30, | | (In thousands) | 2023 | | 2022 | | 2023 | | 2022 | | | | | | | | | | OP Units | 31,698 | | | 30,158 | | | 30,720 | | | 29,626 | | | Vested LTIP Units | 851 | | | 690 | | | 1,816 | | | 1,255 | |
|
| X |
- References
+ Details
| Name: |
us-gaap_EarningsPerShareAbstract |
| Namespace Prefix: |
us-gaap_ |
| Data Type: |
xbrli:stringItemType |
| Balance Type: |
na |
| Period Type: |
duration |
|
| X |
- DefinitionThe entire disclosure for earnings per share. Reference 1: http://www.xbrl.org/2003/role/disclosureRef
-Topic 260
-SubTopic 10
-Name Accounting Standards Codification
-Section 50
-Paragraph 1
-Subparagraph (c)
-Publisher FASB
-URI https://asc.fasb.org//1943274/2147482662/260-10-50-1
Reference 2: http://www.xbrl.org/2003/role/disclosureRef
-Topic 260
-Name Accounting Standards Codification
-Publisher FASB
-URI https://asc.fasb.org//260/tableOfContent
Reference 3: http://www.xbrl.org/2003/role/disclosureRef
-Topic 260
-SubTopic 10
-Name Accounting Standards Codification
-Section 50
-Paragraph 2
-Publisher FASB
-URI https://asc.fasb.org//1943274/2147482662/260-10-50-2
Reference 4: http://www.xbrl.org/2003/role/disclosureRef
-Topic 260
-SubTopic 10
-Name Accounting Standards Codification
-Section 50
-Paragraph 3
-Publisher FASB
-URI https://asc.fasb.org//1943274/2147482662/260-10-50-3
| Name: |
us-gaap_EarningsPerShareTextBlock |
| Namespace Prefix: |
us-gaap_ |
| Data Type: |
dtr-types:textBlockItemType |
| Balance Type: |
na |
| Period Type: |
duration |
|
v3.23.3
Fair Value of Financial Instruments
|
9 Months Ended |
Sep. 30, 2023 |
|---|
| Fair Value Disclosures [Abstract] |
|
| Fair Value of Financial Instruments |
Fair Value of Financial Instruments Our estimates of the fair value of financial instruments were determined using available market information and widely used valuation methods. Considerable judgment is necessary to interpret market data and determine an estimated fair value. The use of different market assumptions or valuation methods may have a material effect on the estimated fair values. The FASB fair value framework hierarchy distinguishes between assumptions based on market data obtained from sources independent of the reporting entity, and the reporting entity’s own assumptions about market-based inputs. The hierarchy is as follows: Level 1 - inputs utilize unadjusted quoted prices in active markets for identical assets or liabilities. Level 2 - inputs are observable either directly or indirectly for similar assets and liabilities in active markets. Level 3 - inputs are unobservable assumptions generated by the reporting entity.
As of September 30, 2023, we did not have any fair value estimates of financial instruments using Level 3 inputs.
Financial instruments disclosed at fair value
Short term financial instruments
The carrying amounts for cash and cash equivalents, tenant receivables, interest payable, accounts payable, security deposits and dividends payable approximate fair value because of the short-term nature of these instruments.
Secured notes payable
See Note 8 for the details of our secured notes payable. We estimate the fair value of our consolidated secured notes payable by calculating the credit-adjusted present value of the principal and interest payments for each secured note payable. The calculation incorporates observable market interest rates which we consider to be Level 2 inputs, assumes that the loans will be outstanding through maturity, and includes any maturity extension options. The table below presents the estimated fair value and carrying value of our secured notes payable, the carrying value includes unamortized loan premium and excludes unamortized deferred loan fees:
| | | | | | | | | | | | | (In thousands) | September 30, 2023 | | December 31, 2022 | | | | | | Fair value | $ | 5,476,975 | | | $ | 5,115,548 | | | Carrying value | $ | 5,573,462 | | | $ | 5,224,449 | |
Ground lease liability
See Note 4 for the details of our ground lease. We estimate the fair value of our ground lease liability by calculating the present value of the future lease payments disclosed in Note 4 using our incremental borrowing rate. The calculation incorporates observable market interest rates which we consider to be Level 2 inputs. The table below presents the estimated fair value and carrying value of our ground lease liability:
| | | | | | | | | | | | | (In thousands) | September 30, 2023 | | December 31, 2022 | | | | | | Fair value | $ | 4,226 | | | $ | 4,466 | | | Carrying value | $ | 10,839 | | | $ | 10,848 | |
Financial instruments measured at fair value
Derivative instruments
See Note 10 for the details of our derivatives. We present our derivatives on our consolidated balance sheets at fair value, on a gross basis, excluding accrued interest. We estimate the fair value of our derivative instruments by calculating the credit-adjusted present value of the expected future cash flows of each derivative. The calculation incorporates the contractual terms of the derivatives, observable market interest rates which we consider to be Level 2 inputs, and credit risk adjustments to reflect the counterparty's as well as our own non-performance risk. Our derivatives are not subject to master netting arrangements.
The table below presents the estimated fair value of our derivatives:
| | | | | | | | | | | | | (In thousands) | September 30, 2023 | | December 31, 2022 | | Derivative Assets: | | | | Fair value - consolidated derivatives(1) | $ | 248,232 | | | $ | 270,234 | | Fair value - unconsolidated Fund's derivatives(2) | $ | 12,356 | | | $ | 12,426 | | | | | | | Derivative Liabilities: | | | | Fair value - consolidated derivatives(1) | $ | — | | | $ | 1,790 | | Fair value - unconsolidated Fund's derivatives(2) | $ | — | | | $ | — | |
____________________________________________________ (1) Consolidated derivatives, which include 100%, not our pro-rata share, of our consolidated JVs' derivatives, are included in interest rate contracts on our consolidated balance sheets. The fair values exclude accrued interest which is included in interest payable on our consolidated balance sheets. (2) The amounts reflect 100%, not our pro-rata share, of our unconsolidated Fund's derivatives. Our pro-rata share of the amounts related to the unconsolidated Fund's derivatives is included in our Investment in unconsolidated Fund on our consolidated balance sheets. Our unconsolidated Fund did not have any derivatives in a liability position for the periods presented. See Note 6 for more information about our Fund, including our equity interest percentage, and see "Guarantees" in Note 16 regarding our Fund's derivatives.
|
| X |
- References
+ Details
| Name: |
us-gaap_FairValueDisclosuresAbstract |
| Namespace Prefix: |
us-gaap_ |
| Data Type: |
xbrli:stringItemType |
| Balance Type: |
na |
| Period Type: |
duration |
|
| X |
- DefinitionThe entire disclosure for the fair value of financial instruments (as defined), including financial assets and financial liabilities (collectively, as defined), and the measurements of those instruments as well as disclosures related to the fair value of non-financial assets and liabilities. Such disclosures about the financial instruments, assets, and liabilities would include: (1) the fair value of the required items together with their carrying amounts (as appropriate); (2) for items for which it is not practicable to estimate fair value, disclosure would include: (a) information pertinent to estimating fair value (including, carrying amount, effective interest rate, and maturity, and (b) the reasons why it is not practicable to estimate fair value; (3) significant concentrations of credit risk including: (a) information about the activity, region, or economic characteristics identifying a concentration, (b) the maximum amount of loss the entity is exposed to based on the gross fair value of the related item, (c) policy for requiring collateral or other security and information as to accessing such collateral or security, and (d) the nature and brief description of such collateral or security; (4) quantitative information about market risks and how such risks are managed; (5) for items measured on both a recurring and nonrecurring basis information regarding the inputs used to develop the fair value measurement; and (6) for items presented in the financial statement for which fair value measurement is elected: (a) information necessary to understand the reasons for the election, (b) discussion of the effect of fair value changes on earnings, (c) a description of [similar groups] items for which the election is made and the relation thereof to the balance sheet, the aggregate carrying value of items included in the balance sheet that are not eligible for the election; (7) all other required (as defined) and desired information. Reference 1: http://www.xbrl.org/2003/role/disclosureRef
-Topic 820
-SubTopic 10
-Name Accounting Standards Codification
-Section 50
-Paragraph 2
-Publisher FASB
-URI https://asc.fasb.org//1943274/2147482106/820-10-50-2
| Name: |
us-gaap_FairValueDisclosuresTextBlock |
| Namespace Prefix: |
us-gaap_ |
| Data Type: |
dtr-types:textBlockItemType |
| Balance Type: |
na |
| Period Type: |
duration |
|
v3.23.3
Segment Reporting
|
9 Months Ended |
Sep. 30, 2023 |
|---|
| Segment Reporting [Abstract] |
|
| Segment Reporting |
Segment Reporting Segment information is prepared on the same basis that our management reviews information for operational decision-making purposes. We operate in two business segments: (i) the acquisition, development, ownership and management of office real estate and (ii) the acquisition, development, ownership and management of multifamily real estate. The services for our office segment primarily include rental of office space and other tenant services, including parking and storage space rental. The services for our multifamily segment include rental of apartments and other tenant services, including parking and storage space rental. Asset information by segment is not reported because we do not use this measure to assess performance or make decisions to allocate resources. Therefore, depreciation and amortization expense is not allocated among segments. General and administrative expenses and interest expense are not included in segment profit as our internal reporting addresses these items on a corporate level.
The table below presents the operating activity of our reportable segments:
| | | | | | | | | | | | | | | | | | | | | | | | | (In thousands) | Three Months Ended September 30, | | Nine Months Ended September 30, | | 2023 | | 2022 | | 2023 | | 2022 | | Office Segment | | | | | | | | | Total office revenues | $ | 208,823 | | | $ | 207,927 | | | $ | 617,614 | | | $ | 616,744 | | | Office expenses | (74,631) | | | (74,653) | | | (220,261) | | | (212,006) | | | Office segment profit | 134,192 | | | 133,274 | | | 397,353 | | | 404,738 | | | | | | | | | | | Multifamily Segment | | | | | | | | | Total multifamily revenues | 46,586 | | | 45,736 | | | 143,595 | | | 122,771 | | | Multifamily expenses | (17,256) | | | (13,661) | | | (50,470) | | | (35,729) | | | Multifamily segment profit | 29,330 | | | 32,075 | | | 93,125 | | | 87,042 | | | | | | | | | | | Total profit from all segments | $ | 163,522 | | | $ | 165,349 | | | $ | 490,478 | | | $ | 491,780 | |
The table below presents a reconciliation of the total profit from all segments to net (loss) income attributable to common stockholders:
| | | | | | | | | | | | | | | | | | | | | | | | | (In thousands) | Three Months Ended September 30, | | Nine Months Ended September 30, | | | 2023 | | 2022 | | 2023 | | 2022 | | | | | | | | | | Total profit from all segments | $ | 163,522 | | | $ | 165,349 | | | $ | 490,478 | | | $ | 491,780 | | | General and administrative expenses | (12,826) | | | (11,272) | | | (34,698) | | | (34,173) | | | Depreciation and amortization | (122,022) | | | (96,276) | | | (336,771) | | | (279,588) | | | Other income | 6,229 | | | 1,649 | | | 12,561 | | | 2,490 | | | Other expenses | (175) | | | (199) | | | (820) | | | (561) | | | Income from unconsolidated Fund | 290 | | | 356 | | | 1,177 | | | 921 | | | Interest expense | (56,043) | | | (38,394) | | | (151,859) | | | (109,560) | | | | | | | | | | | | | | | | | | | | | | | | | | | Net (loss) income | (21,025) | | | 21,213 | | | (19,932) | | | 71,309 | | | Net loss attributable to noncontrolling interests | 7,663 | | | 1,742 | | | 17,681 | | | 1,534 | | | Net (loss) income attributable to common stockholders | $ | (13,362) | | | $ | 22,955 | | | $ | (2,251) | | | $ | 72,843 | |
|
| X |
- References
+ Details
| Name: |
us-gaap_SegmentReportingAbstract |
| Namespace Prefix: |
us-gaap_ |
| Data Type: |
xbrli:stringItemType |
| Balance Type: |
na |
| Period Type: |
duration |
|
| X |
- DefinitionThe entire disclosure for reporting segments including data and tables. Reportable segments include those that meet any of the following quantitative thresholds a) it's reported revenue, including sales to external customers and intersegment sales or transfers is 10 percent or more of the combined revenue, internal and external, of all operating segments b) the absolute amount of its reported profit or loss is 10 percent or more of the greater, in absolute amount of 1) the combined reported profit of all operating segments that did not report a loss or 2) the combined reported loss of all operating segments that did report a loss c) its assets are 10 percent or more of the combined assets of all operating segments. Reference 1: http://www.xbrl.org/2003/role/disclosureRef
-Topic 280
-SubTopic 10
-Name Accounting Standards Codification
-Section 50
-Paragraph 22
-Publisher FASB
-URI https://asc.fasb.org//1943274/2147482810/280-10-50-22
Reference 2: http://www.xbrl.org/2003/role/disclosureRef
-Topic 280
-SubTopic 10
-Name Accounting Standards Codification
-Section 50
-Paragraph 15
-Publisher FASB
-URI https://asc.fasb.org//1943274/2147482810/280-10-50-15
Reference 3: http://www.xbrl.org/2003/role/disclosureRef
-Topic 280
-SubTopic 10
-Name Accounting Standards Codification
-Section 50
-Paragraph 31
-Publisher FASB
-URI https://asc.fasb.org//1943274/2147482810/280-10-50-31
Reference 4: http://www.xbrl.org/2003/role/disclosureRef
-Topic 280
-SubTopic 10
-Name Accounting Standards Codification
-Section 50
-Paragraph 32
-Subparagraph (d)
-Publisher FASB
-URI https://asc.fasb.org//1943274/2147482810/280-10-50-32
Reference 5: http://www.xbrl.org/2003/role/disclosureRef
-Topic 280
-SubTopic 10
-Name Accounting Standards Codification
-Section 50
-Paragraph 42
-Publisher FASB
-URI https://asc.fasb.org//1943274/2147482810/280-10-50-42
Reference 6: http://www.xbrl.org/2003/role/disclosureRef
-Topic 280
-SubTopic 10
-Name Accounting Standards Codification
-Section 50
-Paragraph 32
-Subparagraph (f)
-Publisher FASB
-URI https://asc.fasb.org//1943274/2147482810/280-10-50-32
Reference 7: http://www.xbrl.org/2003/role/disclosureRef
-Topic 280
-SubTopic 10
-Name Accounting Standards Codification
-Section 50
-Paragraph 40
-Publisher FASB
-URI https://asc.fasb.org//1943274/2147482810/280-10-50-40
Reference 8: http://www.xbrl.org/2003/role/disclosureRef
-Topic 280
-Name Accounting Standards Codification
-Publisher FASB
-URI https://asc.fasb.org//280/tableOfContent
Reference 9: http://www.xbrl.org/2003/role/disclosureRef
-Topic 280
-SubTopic 10
-Name Accounting Standards Codification
-Section 50
-Paragraph 26
-Publisher FASB
-URI https://asc.fasb.org//1943274/2147482810/280-10-50-26
Reference 10: http://www.xbrl.org/2003/role/disclosureRef
-Topic 280
-SubTopic 10
-Name Accounting Standards Codification
-Section 50
-Paragraph 34
-Publisher FASB
-URI https://asc.fasb.org//1943274/2147482810/280-10-50-34
Reference 11: http://www.xbrl.org/2003/role/disclosureRef
-Topic 280
-SubTopic 10
-Name Accounting Standards Codification
-Section 50
-Paragraph 41
-Publisher FASB
-URI https://asc.fasb.org//1943274/2147482810/280-10-50-41
Reference 12: http://www.xbrl.org/2003/role/disclosureRef
-Topic 280
-SubTopic 10
-Name Accounting Standards Codification
-Section 50
-Paragraph 21
-Subparagraph (a)
-Publisher FASB
-URI https://asc.fasb.org//1943274/2147482810/280-10-50-21
Reference 13: http://www.xbrl.org/2003/role/disclosureRef
-Topic 280
-SubTopic 10
-Name Accounting Standards Codification
-Section 50
-Paragraph 21
-Subparagraph (b)
-Publisher FASB
-URI https://asc.fasb.org//1943274/2147482810/280-10-50-21
Reference 14: http://www.xbrl.org/2003/role/disclosureRef
-Topic 280
-SubTopic 10
-Name Accounting Standards Codification
-Section 50
-Paragraph 32
-Subparagraph (e)
-Publisher FASB
-URI https://asc.fasb.org//1943274/2147482810/280-10-50-32
| Name: |
us-gaap_SegmentReportingDisclosureTextBlock |
| Namespace Prefix: |
us-gaap_ |
| Data Type: |
dtr-types:textBlockItemType |
| Balance Type: |
na |
| Period Type: |
duration |
|
v3.23.3
Future Minimum Lease Rental Receipts
|
9 Months Ended |
Sep. 30, 2023 |
|---|
| Lessor Disclosure [Abstract] |
|
| Future Minimum Lease Rental Receipts |
Future Minimum Lease Rental Receipts We lease space to tenants primarily under non-cancelable operating leases that generally contain provisions for a base rent plus reimbursement of certain operating expenses, and we own fee interests in two parcels of land from which we receive rent under ground leases. The table below presents the future minimum base rentals on our non-cancelable office tenant and ground leases for our consolidated properties at September 30, 2023: | | | | | | | Twelve months ending September 30: | (In thousands) | | | | 2024 | $ | 616,384 | | | 2025 | 507,320 | | | 2026 | 405,771 | | | 2027 | 321,408 | | | 2028 | 231,391 | | | Thereafter | 678,380 | | Total future minimum base rentals(1) | $ | 2,760,654 | |
___________________________________ (1) Does not include (i) residential leases, which typically have a term of one year or less, (ii) holdover rent, (iii) other types of rent such as storage and antenna rent, (iv) tenant reimbursements, (v) straight-line rent, (vi) amortization/accretion of acquired above/below-market lease intangibles and (vii) percentage rents. The amounts assume that early termination options held by tenants will not be exercised.
|
| X |
- References
+ Details
| Name: |
us-gaap_LessorDisclosureAbstract |
| Namespace Prefix: |
us-gaap_ |
| Data Type: |
xbrli:stringItemType |
| Balance Type: |
na |
| Period Type: |
duration |
|
| X |
- DefinitionThe entire disclosure for lessor's operating leases. Reference 1: http://www.xbrl.org/2003/role/disclosureRef
-Topic 842
-SubTopic 30
-Name Accounting Standards Codification
-Publisher FASB
-URI https://asc.fasb.org//842-30/tableOfContent
| Name: |
us-gaap_OperatingLeasesOfLessorDisclosureTextBlock |
| Namespace Prefix: |
us-gaap_ |
| Data Type: |
dtr-types:textBlockItemType |
| Balance Type: |
na |
| Period Type: |
duration |
|
v3.23.3
Commitments, Contingencies and Guarantees
|
9 Months Ended |
Sep. 30, 2023 |
|---|
| Commitments and Contingencies Disclosure [Abstract] |
|
| Commitments, Contingencies and Guarantees |
Commitments, Contingencies and Guarantees Legal Proceedings
From time to time, we are party to various lawsuits, claims and other legal proceedings that arise in the ordinary course of our business. We are currently in litigation with the insurance providers in 2020 for Barrington Plaza to recover certain costs associated with reconstruction. Excluding ordinary, routine litigation incidental to our business, we are not currently a party to any legal proceedings that we believe would reasonably be expected to have a materially adverse effect on our business, financial condition or results of operations.
Concentration of Risk
Tenant Receivables
We are subject to credit risk with respect to our tenant receivables and deferred rent receivables related to our tenant leases. Our tenants' ability to honor the terms of their respective leases remains dependent upon economic, regulatory and social factors. We seek to minimize our credit risk from our tenant leases by (i) targeting smaller, more affluent office tenants, from a diverse mix of industries, (ii) performing credit evaluations of prospective tenants and (iii) obtaining security deposits or letters of credit from our tenants. For the nine months ended September 30, 2023 and 2022, no tenant accounted for more than 10% of our total revenues. See our revenue recognition policy in Note 2 for the charges to revenue for uncollectible amounts for tenant receivables and deferred rent receivables.
Geographic Risk
All of our properties, including our consolidated JVs and our unconsolidated Fund's properties, are located in Los Angeles County, California and Honolulu, Hawaii, and we are therefore susceptible to adverse economic and regulatory developments, as well as natural disasters, in those markets. Derivative Counterparty Credit Risk
We are subject to credit risk with respect to our derivative counterparties. We do not post or receive collateral with respect to our derivative transactions. Our derivative contracts do not provide for right of offset between derivative contracts. See Note 10 for the details of our derivative contracts. We seek to minimize our credit risk by entering into agreements with a variety of counterparties with investment grade ratings.
Cash Balances
We have significant cash balances invested in a variety of short-term money market funds that are intended to preserve principal value and maintain a high degree of liquidity while providing current income. These investments are not insured against loss of principal and there is no guarantee that our investments in these funds will be redeemable at par value. We also have significant cash balances in bank accounts with high quality financial institutions with investment grade ratings. Interest bearing bank accounts at each U.S. banking institution are insured by the FDIC up to $250 thousand.
Asset Retirement Obligations
Conditional asset retirement obligations represent a legal obligation to perform an asset retirement activity in which the timing and/or method of settlement is conditional on a future event that may or may not be within our control. A liability for a conditional asset retirement obligation must be recorded if the fair value of the obligation can be reasonably estimated. Environmental site assessments have identified thirty-three buildings in our Consolidated Portfolio which contain asbestos, and would have to be removed in compliance with applicable environmental regulations if these properties are demolished or undergo major renovations. As of September 30, 2023, the obligations to remove the asbestos from properties which are currently undergoing major renovations, or that we plan to renovate in the future, are not material to our consolidated financial statements. As of September 30, 2023, the obligations to remove the asbestos from our other properties have indeterminable settlement dates, and we are unable to reasonably estimate the fair value of the associated conditional asset retirement obligations.
Contractual Commitments
Development Projects
In downtown Honolulu, we are converting a 25 story, 493,000 square foot office tower into approximately 493 apartments in phases over a number of years as the office space is vacated. As of September 30, 2023, we had an aggregate remaining contractual commitment for this development project and other development projects of approximately $19.3 million.
Other Contractual Commitments
As of September 30, 2023, we had an aggregate remaining contractual commitment for repositionings, capital expenditure projects and tenant improvements of approximately $15.0 million.
Guarantees
Unconsolidated Fund Guarantees Our unconsolidated Fund, Partnership X, has a $115.0 million floating-rate term loan that matures on September 14, 2028. The loan carries interest at SOFR + 1.46% (with a zero-percent SOFR floor), which has been effectively fixed at 2.19% until October 1, 2026 with interest rate swaps (which do not have zero-percent SOFR floors). The loan and related swaps were converted to SOFR from LIBOR during the third quarter of 2023, resulting in a small SOFR adjustment to calculate the interest payable to the lender (which is included in the loan spread above). The conversion to SOFR did not change the swap-fixed interest rate. The loan is secured by two properties held by Partnership X and is non-recourse. We have made certain environmental and other limited indemnities and guarantees covering customary non-recourse carve-outs for Partnership X's loan, and we have also guaranteed the related swaps. Partnership X has agreed to indemnify us for any amounts that we would be required to pay under these agreements. As of September 30, 2023, assuming that SOFR does not decrease below zero-percent, the maximum future interest payments for the swaps were $2.9 million. As of September 30, 2023, all of the obligations under the related loan and swap agreements have been performed in accordance with the terms of those agreements. As of September 30, 2023, we estimate the risk of loss for the various indemnities and guarantees to be low. See Note 6 for more information regarding Partnership X.
|
| X |
- References
+ Details
| Name: |
us-gaap_CommitmentsAndContingenciesDisclosureAbstract |
| Namespace Prefix: |
us-gaap_ |
| Data Type: |
xbrli:stringItemType |
| Balance Type: |
na |
| Period Type: |
duration |
|
| X |
- DefinitionThe entire disclosure for commitments, contingencies, and guarantees. Reference 1: http://www.xbrl.org/2009/role/commonPracticeRef
-Topic 450
-Name Accounting Standards Codification
-Publisher FASB
-URI https://asc.fasb.org//450/tableOfContent
Reference 2: http://fasb.org/us-gaap/role/ref/legacyRef
-Topic 440
-Name Accounting Standards Codification
-Publisher FASB
-URI https://asc.fasb.org//440/tableOfContent
Reference 3: http://fasb.org/us-gaap/role/ref/legacyRef
-Topic 460
-Name Accounting Standards Codification
-Publisher FASB
-URI https://asc.fasb.org//460/tableOfContent
| Name: |
us-gaap_CommitmentsContingenciesAndGuaranteesTextBlock |
| Namespace Prefix: |
us-gaap_ |
| Data Type: |
dtr-types:textBlockItemType |
| Balance Type: |
na |
| Period Type: |
duration |
|
v3.23.3
| X |
- ReferencesReference 1: http://www.xbrl.org/2003/role/presentationRef
-Publisher SEC
-Name Regulation S-K
-Number 229
-Section 402
-Subsection v
-Paragraph 1
| Name: |
ecd_PvpTable |
| Namespace Prefix: |
ecd_ |
| Data Type: |
xbrli:stringItemType |
| Balance Type: |
na |
| Period Type: |
duration |
|
| X |
- DefinitionThe portion of profit or loss for the period, net of income taxes, which is attributable to the parent. Reference 1: http://www.xbrl.org/2003/role/disclosureRef
-Topic 235
-SubTopic 10
-Name Accounting Standards Codification
-Section S99
-Paragraph 1
-Subparagraph (SX 210.4-08(g)(1)(ii))
-Publisher FASB
-URI https://asc.fasb.org//1943274/2147480678/235-10-S99-1
Reference 2: http://www.xbrl.org/2003/role/disclosureRef
-Topic 323
-SubTopic 10
-Name Accounting Standards Codification
-Section 50
-Paragraph 3
-Subparagraph (c)
-Publisher FASB
-URI https://asc.fasb.org//1943274/2147481687/323-10-50-3
Reference 3: http://www.xbrl.org/2003/role/disclosureRef
-Topic 825
-SubTopic 10
-Name Accounting Standards Codification
-Section 50
-Paragraph 28
-Subparagraph (f)
-Publisher FASB
-URI https://asc.fasb.org//1943274/2147482907/825-10-50-28
Reference 4: http://www.xbrl.org/2003/role/disclosureRef
-Topic 220
-SubTopic 10
-Name Accounting Standards Codification
-Section 50
-Paragraph 6
-Publisher FASB
-URI https://asc.fasb.org//1943274/2147482765/220-10-50-6
Reference 5: http://www.xbrl.org/2003/role/disclosureRef
-Topic 250
-SubTopic 10
-Name Accounting Standards Codification
-Section 50
-Paragraph 3
-Publisher FASB
-URI https://asc.fasb.org//1943274/2147483443/250-10-50-3
Reference 6: http://www.xbrl.org/2003/role/disclosureRef
-Topic 250
-SubTopic 10
-Name Accounting Standards Codification
-Section 50
-Paragraph 1
-Subparagraph (b)(2)
-Publisher FASB
-URI https://asc.fasb.org//1943274/2147483443/250-10-50-1
Reference 7: http://www.xbrl.org/2003/role/disclosureRef
-Topic 815
-SubTopic 40
-Name Accounting Standards Codification
-Section 65
-Paragraph 1
-Subparagraph (f)
-Publisher FASB
-URI https://asc.fasb.org//1943274/2147480175/815-40-65-1
Reference 8: http://www.xbrl.org/2003/role/disclosureRef
-Topic 250
-SubTopic 10
-Name Accounting Standards Codification
-Section 50
-Paragraph 8
-Publisher FASB
-URI https://asc.fasb.org//1943274/2147483443/250-10-50-8
Reference 9: http://www.xbrl.org/2003/role/disclosureRef
-Topic 250
-SubTopic 10
-Name Accounting Standards Codification
-Section 50
-Paragraph 9
-Publisher FASB
-URI https://asc.fasb.org//1943274/2147483443/250-10-50-9
Reference 10: http://www.xbrl.org/2003/role/disclosureRef
-Topic 250
-SubTopic 10
-Name Accounting Standards Codification
-Section 50
-Paragraph 11
-Subparagraph (a)
-Publisher FASB
-URI https://asc.fasb.org//1943274/2147483443/250-10-50-11
Reference 11: http://www.xbrl.org/2003/role/disclosureRef
-Topic 250
-SubTopic 10
-Name Accounting Standards Codification
-Section 50
-Paragraph 11
-Subparagraph (b)
-Publisher FASB
-URI https://asc.fasb.org//1943274/2147483443/250-10-50-11
Reference 12: http://www.xbrl.org/2003/role/disclosureRef
-Topic 250
-SubTopic 10
-Name Accounting Standards Codification
-Section 50
-Paragraph 4
-Publisher FASB
-URI https://asc.fasb.org//1943274/2147483443/250-10-50-4
Reference 13: http://www.xbrl.org/2003/role/exampleRef
-Topic 946
-SubTopic 830
-Name Accounting Standards Codification
-Section 55
-Paragraph 10
-Publisher FASB
-URI https://asc.fasb.org//1943274/2147480167/946-830-55-10
Reference 14: http://www.xbrl.org/2003/role/disclosureRef
-Topic 946
-SubTopic 220
-Name Accounting Standards Codification
-Section 45
-Paragraph 7
-Publisher FASB
-URI https://asc.fasb.org//1943274/2147483581/946-220-45-7
Reference 15: http://www.xbrl.org/2003/role/disclosureRef
-Topic 944
-SubTopic 220
-Name Accounting Standards Codification
-Section S99
-Paragraph 1
-Subparagraph (SX 210.7-04(18))
-Publisher FASB
-URI https://asc.fasb.org//1943274/2147483586/944-220-S99-1
Reference 16: http://www.xbrl.org/2003/role/disclosureRef
-Topic 280
-SubTopic 10
-Name Accounting Standards Codification
-Section 50
-Paragraph 22
-Publisher FASB
-URI https://asc.fasb.org//1943274/2147482810/280-10-50-22
Reference 17: http://www.xbrl.org/2003/role/disclosureRef
-Topic 946
-SubTopic 220
-Name Accounting Standards Codification
-Section S99
-Paragraph 1
-Subparagraph (SX 210.6-07(9))
-Publisher FASB
-URI https://asc.fasb.org//1943274/2147483575/946-220-S99-1
Reference 18: http://www.xbrl.org/2003/role/disclosureRef
-Topic 946
-SubTopic 220
-Name Accounting Standards Codification
-Section S99
-Paragraph 3
-Subparagraph (SX 210.6-09(1)(d))
-Publisher FASB
-URI https://asc.fasb.org//1943274/2147483575/946-220-S99-3
Reference 19: http://www.xbrl.org/2003/role/disclosureRef
-Topic 470
-SubTopic 10
-Name Accounting Standards Codification
-Section S99
-Paragraph 1A
-Subparagraph (SX 210.13-01(a)(4)(i))
-Publisher FASB
-URI https://asc.fasb.org//1943274/2147480097/470-10-S99-1A
Reference 20: http://www.xbrl.org/2009/role/commonPracticeRef
-Topic 470
-SubTopic 10
-Name Accounting Standards Codification
-Section S99
-Paragraph 1A
-Subparagraph (SX 210.13-01(a)(4)(ii))
-Publisher FASB
-URI https://asc.fasb.org//1943274/2147480097/470-10-S99-1A
Reference 21: http://www.xbrl.org/2003/role/disclosureRef
-Topic 470
-SubTopic 10
-Name Accounting Standards Codification
-Section S99
-Paragraph 1A
-Subparagraph (SX 210.13-01(a)(4)(iii)(A))
-Publisher FASB
-URI https://asc.fasb.org//1943274/2147480097/470-10-S99-1A
Reference 22: http://www.xbrl.org/2003/role/disclosureRef
-Topic 470
-SubTopic 10
-Name Accounting Standards Codification
-Section S99
-Paragraph 1A
-Subparagraph (SX 210.13-01(a)(4)(iv))
-Publisher FASB
-URI https://asc.fasb.org//1943274/2147480097/470-10-S99-1A
Reference 23: http://www.xbrl.org/2003/role/disclosureRef
-Topic 470
-SubTopic 10
-Name Accounting Standards Codification
-Section S99
-Paragraph 1A
-Subparagraph (SX 210.13-01(a)(5))
-Publisher FASB
-URI https://asc.fasb.org//1943274/2147480097/470-10-S99-1A
Reference 24: http://www.xbrl.org/2003/role/disclosureRef
-Topic 470
-SubTopic 10
-Name Accounting Standards Codification
-Section S99
-Paragraph 1B
-Subparagraph (SX 210.13-02(a)(4)(i))
-Publisher FASB
-URI https://asc.fasb.org//1943274/2147480097/470-10-S99-1B
Reference 25: http://www.xbrl.org/2003/role/disclosureRef
-Topic 470
-SubTopic 10
-Name Accounting Standards Codification
-Section S99
-Paragraph 1B
-Subparagraph (SX 210.13-02(a)(4)(iii)(A))
-Publisher FASB
-URI https://asc.fasb.org//1943274/2147480097/470-10-S99-1B
Reference 26: http://www.xbrl.org/2003/role/disclosureRef
-Topic 470
-SubTopic 10
-Name Accounting Standards Codification
-Section S99
-Paragraph 1B
-Subparagraph (SX 210.13-02(a)(4)(iii)(B))
-Publisher FASB
-URI https://asc.fasb.org//1943274/2147480097/470-10-S99-1B
Reference 27: http://www.xbrl.org/2003/role/disclosureRef
-Topic 470
-SubTopic 10
-Name Accounting Standards Codification
-Section S99
-Paragraph 1B
-Subparagraph (SX 210.13-02(a)(4)(iv))
-Publisher FASB
-URI https://asc.fasb.org//1943274/2147480097/470-10-S99-1B
Reference 28: http://www.xbrl.org/2003/role/disclosureRef
-Topic 470
-SubTopic 10
-Name Accounting Standards Codification
-Section S99
-Paragraph 1B
-Subparagraph (SX 210.13-02(a)(5))
-Publisher FASB
-URI https://asc.fasb.org//1943274/2147480097/470-10-S99-1B
Reference 29: http://www.xbrl.org/2003/role/disclosureRef
-Topic 280
-SubTopic 10
-Name Accounting Standards Codification
-Section 50
-Paragraph 30
-Subparagraph (b)
-Publisher FASB
-URI https://asc.fasb.org//1943274/2147482810/280-10-50-30
Reference 30: http://www.xbrl.org/2003/role/disclosureRef
-Topic 280
-SubTopic 10
-Name Accounting Standards Codification
-Section 50
-Paragraph 32
-Subparagraph (f)
-Publisher FASB
-URI https://asc.fasb.org//1943274/2147482810/280-10-50-32
Reference 31: http://www.xbrl.org/2003/role/disclosureRef
-Topic 260
-SubTopic 10
-Name Accounting Standards Codification
-Section 45
-Paragraph 60B
-Subparagraph (a)
-Publisher FASB
-URI https://asc.fasb.org//1943274/2147482689/260-10-45-60B
Reference 32: http://www.xbrl.org/2003/role/exampleRef
-Topic 280
-SubTopic 10
-Name Accounting Standards Codification
-Section 50
-Paragraph 31
-Publisher FASB
-URI https://asc.fasb.org//1943274/2147482810/280-10-50-31
Reference 33: http://www.xbrl.org/2003/role/disclosureRef
-Topic 280
-SubTopic 10
-Name Accounting Standards Codification
-Section 50
-Paragraph 32
-Subparagraph (c)
-Publisher FASB
-URI https://asc.fasb.org//1943274/2147482810/280-10-50-32
Reference 34: http://www.xbrl.org/2003/role/disclosureRef
-Topic 205
-SubTopic 20
-Name Accounting Standards Codification
-Section 50
-Paragraph 7
-Publisher FASB
-URI https://asc.fasb.org//1943274/2147483499/205-20-50-7
Reference 35: http://fasb.org/us-gaap/role/ref/legacyRef
-Topic 230
-SubTopic 10
-Name Accounting Standards Codification
-Section 45
-Paragraph 28
-Publisher FASB
-URI https://asc.fasb.org//1943274/2147482740/230-10-45-28
Reference 36: http://www.xbrl.org/2003/role/disclosureRef
-Topic 220
-SubTopic 10
-Name Accounting Standards Codification
-Section 45
-Paragraph 1A
-Subparagraph (a)
-Publisher FASB
-URI https://asc.fasb.org//1943274/2147482790/220-10-45-1A
Reference 37: http://www.xbrl.org/2003/role/disclosureRef
-Topic 220
-SubTopic 10
-Name Accounting Standards Codification
-Section 45
-Paragraph 1B
-Subparagraph (a)
-Publisher FASB
-URI https://asc.fasb.org//1943274/2147482790/220-10-45-1B
Reference 38: http://fasb.org/us-gaap/role/ref/legacyRef
-Topic 220
-SubTopic 10
-Name Accounting Standards Codification
-Section S99
-Paragraph 2
-Subparagraph (SX 210.5-03(20))
-Publisher FASB
-URI https://asc.fasb.org//1943274/2147483621/220-10-S99-2
Reference 39: http://fasb.org/us-gaap/role/ref/legacyRef
-Topic 942
-SubTopic 220
-Name Accounting Standards Codification
-Section S99
-Paragraph 1
-Subparagraph (SX 210.9-04(22))
-Publisher FASB
-URI https://asc.fasb.org//1943274/2147483589/942-220-S99-1
| Name: |
us-gaap_NetIncomeLoss |
| Namespace Prefix: |
us-gaap_ |
| Data Type: |
xbrli:monetaryItemType |
| Balance Type: |
credit |
| Period Type: |
duration |
|
v3.23.3
| X |
- ReferencesReference 1: http://www.xbrl.org/2003/role/presentationRef
-Publisher SEC
-Name Regulation S-K
-Number 229
-Section 408
-Subsection a
-Paragraph 1
| Name: |
ecd_NonRule10b51ArrAdoptedFlag |
| Namespace Prefix: |
ecd_ |
| Data Type: |
xbrli:booleanItemType |
| Balance Type: |
na |
| Period Type: |
duration |
|
| X |
- ReferencesReference 1: http://www.xbrl.org/2003/role/presentationRef
-Publisher SEC
-Name Regulation S-K
-Number 229
-Section 408
-Subsection a
-Paragraph 1
| Name: |
ecd_NonRule10b51ArrTrmntdFlag |
| Namespace Prefix: |
ecd_ |
| Data Type: |
xbrli:booleanItemType |
| Balance Type: |
na |
| Period Type: |
duration |
|
| X |
- ReferencesReference 1: http://www.xbrl.org/2003/role/presentationRef
-Publisher SEC
-Name Regulation S-K
-Number 229
-Section 408
-Subsection a
-Paragraph 1
| Name: |
ecd_Rule10b51ArrAdoptedFlag |
| Namespace Prefix: |
ecd_ |
| Data Type: |
xbrli:booleanItemType |
| Balance Type: |
na |
| Period Type: |
duration |
|
| X |
- ReferencesReference 1: http://www.xbrl.org/2003/role/presentationRef
-Publisher SEC
-Name Regulation S-K
-Number 229
-Section 408
-Subsection a
-Paragraph 1
| Name: |
ecd_Rule10b51ArrTrmntdFlag |
| Namespace Prefix: |
ecd_ |
| Data Type: |
xbrli:booleanItemType |
| Balance Type: |
na |
| Period Type: |
duration |
|
| X |
- ReferencesReference 1: http://www.xbrl.org/2003/role/presentationRef
-Publisher SEC
-Name Regulation S-K
-Number 229
-Section 408
-Subsection a
-Paragraph 2
-Subparagraph A
| Name: |
ecd_TradingArrByIndTable |
| Namespace Prefix: |
ecd_ |
| Data Type: |
xbrli:stringItemType |
| Balance Type: |
na |
| Period Type: |
duration |
|
v3.23.3
Summary of Significant Accounting Policies (Policies)
|
9 Months Ended |
Sep. 30, 2023 |
|---|
| Accounting Policies [Abstract] |
|
| Basis of Presentation |
Basis of Presentation
The accompanying consolidated financial statements are the consolidated financial statements of Douglas Emmett, Inc. and its subsidiaries, including our Operating Partnership and our consolidated JVs. All significant intercompany balances and transactions have been eliminated in our consolidated financial statements.
We consolidate entities in which we are considered to be the primary beneficiary of a VIE or have a majority of the voting interest of the entity. We are deemed to be the primary beneficiary of a VIE when we have (i) the power to direct the activities of that VIE that most significantly impact its economic performance, and (ii) the obligation to absorb losses or the right to receive benefits that could potentially be significant to the VIE. We do not consolidate entities in which the other parties have substantive kick-out rights to remove our power to direct the activities, most significantly impacting the economic performance, of that VIE. In determining whether we are the primary beneficiary, we consider factors such as ownership interest, management representation, authority to control decisions, and contractual and substantive participating rights of each party.
|
| Basis of Accounting |
The accompanying unaudited interim consolidated financial statements have been prepared pursuant to the rules and regulations of the SEC in conformity with US GAAP as established by the FASB in the ASC. Certain information and footnote disclosures normally included in the consolidated financial statements prepared in conformity with US GAAP may have been condensed or omitted pursuant to SEC rules and regulations, although we believe that the disclosures are adequate to make their presentation not misleading. The accompanying unaudited interim consolidated financial statements include, in our opinion, all adjustments, consisting of normal recurring adjustments, necessary to present fairly the financial information set forth therein. The results of operations for the interim periods are not necessarily indicative of the results that may be expected for the year ending December 31, 2023. The interim consolidated financial statements should be read in conjunction with the consolidated financial statements in our 2022 Annual Report on Form 10-K and the notes thereto. Any references to the number or class of properties, square footage, per square footage amounts, apartment units and geography, are outside the scope of our independent registered public accounting firm’s review of our consolidated financial statements in accordance with the standards of the PCAOB.
|
| Use of Estimates |
Use of Estimates
The preparation of consolidated financial statements in conformity with US GAAP requires management to make certain estimates that affect the reported amounts in the consolidated financial statements and accompanying notes. Actual results could differ materially from those estimates.
|
| Revenue Recognition |
Revenue Recognition
Rental revenues and tenant recoveries
We account for our rental revenues and tenant recoveries in accordance with Topic 842 "Leases". Rental revenues and tenant recoveries are included in: (i) Rental revenues and tenant recoveries under Office rental, and (ii) Rental revenues under Multifamily rental, on our consolidated statements of operations.
Collectibility
In accordance with Topic 842, we perform an assessment as to whether or not substantially all of the amounts due under a tenant’s lease agreement is deemed probable of collection. This assessment involves using a methodology that requires judgment and estimates about matters that are uncertain at the time the estimates are made, including tenant specific factors, specific industry conditions, and general economic trends and conditions. For leases where we have concluded it is probable that we will collect substantially all the lease payments due under those leases, we continue to record lease income on a straight-line basis over the lease term. For leases where we have concluded that it is not probable that we will collect substantially all the lease payments due under those leases, we limit the lease income to the lesser of the income recognized on a straight-line basis or cash basis. We write-off tenant receivables and deferred rent receivables as a charge against rental revenues and tenant recoveries in the period we conclude that substantially all of the lease payments are not probable of collection. If we subsequently collect amounts that were previously written off then the amounts collected are recorded as an increase to our rental revenues and tenant recoveries in the period they are collected. If our conclusion of collectibility changes, we will record the difference between the lease income that would have been recognized on a straight-line basis and cash basis as a current-period adjustment to rental revenues and tenant recoveries. Charges for uncollectible office tenant receivables and deferred rent receivables, reduced our office revenues by: •$0.2 million and $0.1 million for the three months ended September 30, 2023 and 2022, respectively, and •$0.5 million and $0.3 million for the nine months ended September 30, 2023 and 2022, respectively.
We restored accrual basis accounting for certain office tenants that were previously determined to be uncollectible and accounted for on a cash basis of accounting, which increased our office revenues by: •$2.3 million and $1.6 million for the three months ended September 30, 2023 and 2022, respectively, and •$4.4 million and $3.3 million for the nine months ended September 30, 2023 and 2022, respectively.
Office parking revenues
We account for our office parking revenues in accordance with ASC 606 "Revenue from Contracts with Customers". Office parking revenues are included in Parking and other income under Office rental on our consolidated statements of operations. Our lease contracts generally make a specified number of parking spaces available to the tenant, and we bill and recognize parking revenues on a monthly basis in accordance with the lease agreements, generally using the monthly parking rates in effect at the time of billing.
Office parking revenues were: •$23.4 million and $22.1 million for the three months ended September 30, 2023, and 2022, respectively, and •$69.1 million and $62.6 million for the nine months ended September 30, 2023 and 2022, respectively. Office parking receivables, which are included in Tenant receivables on our consolidated balance sheets, were •$1.0 million as of September 30, 2023, and •$0.9 million as of December 31, 2022.
|
| Income Taxes |
Income Taxes
We have elected to be taxed as a REIT under the Code. Provided that we qualify for taxation as a REIT, we are generally not subject to corporate-level income tax on the earnings distributed currently to our stockholders that we derive from our REIT qualifying activities. We are subject to corporate-level tax on the earnings that we derive through our TRS.
|
| New Accounting Pronouncements |
New Accounting Pronouncements
Changes to US GAAP are implemented by the FASB in the form of ASUs. We consider the applicability and impact of all ASUs. As of the date of this Report, the FASB has not issued any ASUs that we expect to be applicable and have a material impact on our consolidated financial statements.
|
| EPS |
We calculate basic EPS by dividing the net income (loss) attributable to common stockholders for the period by the weighted average number of common shares outstanding during the period. We calculate diluted EPS by dividing the net income (loss) attributable to common stockholders for the period by the weighted average number of common shares and dilutive instruments outstanding during the period using the treasury stock method. We account for unvested LTIP awards that contain non-forfeitable rights to dividends as participating securities and include these securities in the computation of basic and diluted EPS using the two-class method.
|
| Fair Value of Financial Instruments |
Fair Value of Financial Instruments Our estimates of the fair value of financial instruments were determined using available market information and widely used valuation methods. Considerable judgment is necessary to interpret market data and determine an estimated fair value. The use of different market assumptions or valuation methods may have a material effect on the estimated fair values. The FASB fair value framework hierarchy distinguishes between assumptions based on market data obtained from sources independent of the reporting entity, and the reporting entity’s own assumptions about market-based inputs. The hierarchy is as follows: Level 1 - inputs utilize unadjusted quoted prices in active markets for identical assets or liabilities. Level 2 - inputs are observable either directly or indirectly for similar assets and liabilities in active markets. Level 3 - inputs are unobservable assumptions generated by the reporting entity.
|
| X |
- References
+ Details
| Name: |
us-gaap_AccountingPoliciesAbstract |
| Namespace Prefix: |
us-gaap_ |
| Data Type: |
xbrli:stringItemType |
| Balance Type: |
na |
| Period Type: |
duration |
|
| X |
- DefinitionDisclosure of accounting policy for basis of accounting, or basis of presentation, used to prepare the financial statements (for example, US Generally Accepted Accounting Principles, Other Comprehensive Basis of Accounting, IFRS).
| Name: |
us-gaap_BasisOfAccountingPolicyPolicyTextBlock |
| Namespace Prefix: |
us-gaap_ |
| Data Type: |
dtr-types:textBlockItemType |
| Balance Type: |
na |
| Period Type: |
duration |
|
| X |
- DefinitionDisclosure of accounting policy regarding (1) the principles it follows in consolidating or combining the separate financial statements, including the principles followed in determining the inclusion or exclusion of subsidiaries or other entities in the consolidated or combined financial statements and (2) its treatment of interests (for example, common stock, a partnership interest or other means of exerting influence) in other entities, for example consolidation or use of the equity or cost methods of accounting. The accounting policy may also address the accounting treatment for intercompany accounts and transactions, noncontrolling interest, and the income statement treatment in consolidation for issuances of stock by a subsidiary. Reference 1: http://www.xbrl.org/2003/role/exampleRef
-Topic 235
-SubTopic 10
-Name Accounting Standards Codification
-Section 50
-Paragraph 4
-Subparagraph (a)
-Publisher FASB
-URI https://asc.fasb.org//1943274/2147483426/235-10-50-4
Reference 2: http://fasb.org/us-gaap/role/ref/legacyRef
-Name Accounting Standards Codification
-Topic 810
-SubTopic 10
-Section 50
-Paragraph 1
-Publisher FASB
-URI https://asc.fasb.org//1943274/2147481203/810-10-50-1
| Name: |
us-gaap_ConsolidationPolicyTextBlock |
| Namespace Prefix: |
us-gaap_ |
| Data Type: |
dtr-types:textBlockItemType |
| Balance Type: |
na |
| Period Type: |
duration |
|
| X |
- DefinitionDisclosure of accounting policy for computing basic and diluted earnings or loss per share for each class of common stock and participating security. Addresses all significant policy factors, including any antidilutive items that have been excluded from the computation and takes into account stock dividends, splits and reverse splits that occur after the balance sheet date of the latest reporting period but before the issuance of the financial statements. Reference 1: http://fasb.org/us-gaap/role/ref/legacyRef
-Name Accounting Standards Codification
-Topic 260
-SubTopic 10
-Section 50
-Paragraph 1
-Subparagraph (c)
-Publisher FASB
-URI https://asc.fasb.org//1943274/2147482662/260-10-50-1
Reference 2: http://fasb.org/us-gaap/role/ref/legacyRef
-Name Accounting Standards Codification
-Topic 260
-SubTopic 10
-Section 50
-Paragraph 2
-Publisher FASB
-URI https://asc.fasb.org//1943274/2147482662/260-10-50-2
| Name: |
us-gaap_EarningsPerSharePolicyTextBlock |
| Namespace Prefix: |
us-gaap_ |
| Data Type: |
dtr-types:textBlockItemType |
| Balance Type: |
na |
| Period Type: |
duration |
|
| X |
- DefinitionDisclosure of accounting policy for fair value measurements of financial and non-financial assets, liabilities and instruments classified in shareholders' equity. Disclosures include, but are not limited to, how an entity that manages a group of financial assets and liabilities on the basis of its net exposure measures the fair value of those assets and liabilities.
| Name: |
us-gaap_FairValueMeasurementPolicyPolicyTextBlock |
| Namespace Prefix: |
us-gaap_ |
| Data Type: |
dtr-types:textBlockItemType |
| Balance Type: |
na |
| Period Type: |
duration |
|
| X |
- DefinitionDisclosure of accounting policy for income taxes, which may include its accounting policies for recognizing and measuring deferred tax assets and liabilities and related valuation allowances, recognizing investment tax credits, operating loss carryforwards, tax credit carryforwards, and other carryforwards, methodologies for determining its effective income tax rate and the characterization of interest and penalties in the financial statements. Reference 1: http://www.xbrl.org/2003/role/disclosureRef
-Topic 946
-SubTopic 10
-Name Accounting Standards Codification
-Section S99
-Paragraph 3
-Subparagraph (SX 210.6-03(h)(1))
-Publisher FASB
-URI https://asc.fasb.org//1943274/2147479886/946-10-S99-3
Reference 2: http://www.xbrl.org/2003/role/disclosureRef
-Topic 740
-SubTopic 10
-Name Accounting Standards Codification
-Section 50
-Paragraph 17
-Subparagraph (b)
-Publisher FASB
-URI https://asc.fasb.org//1943274/2147482685/740-10-50-17
Reference 3: http://www.xbrl.org/2003/role/disclosureRef
-Topic 740
-SubTopic 10
-Name Accounting Standards Codification
-Section 50
-Paragraph 9
-Publisher FASB
-URI https://asc.fasb.org//1943274/2147482685/740-10-50-9
Reference 4: http://www.xbrl.org/2003/role/disclosureRef
-Topic 740
-SubTopic 10
-Name Accounting Standards Codification
-Section 45
-Paragraph 25
-Publisher FASB
-URI https://asc.fasb.org//1943274/2147482525/740-10-45-25
Reference 5: http://www.xbrl.org/2003/role/disclosureRef
-Topic 740
-SubTopic 10
-Name Accounting Standards Codification
-Section 45
-Paragraph 28
-Publisher FASB
-URI https://asc.fasb.org//1943274/2147482525/740-10-45-28
Reference 6: http://www.xbrl.org/2003/role/disclosureRef
-Topic 740
-SubTopic 10
-Name Accounting Standards Codification
-Section 50
-Paragraph 19
-Publisher FASB
-URI https://asc.fasb.org//1943274/2147482685/740-10-50-19
Reference 7: http://www.xbrl.org/2003/role/disclosureRef
-Topic 220
-SubTopic 10
-Name Accounting Standards Codification
-Section 50
-Paragraph 1
-Publisher FASB
-URI https://asc.fasb.org//1943274/2147482765/220-10-50-1
Reference 8: http://www.xbrl.org/2003/role/disclosureRef
-Topic 740
-SubTopic 10
-Name Accounting Standards Codification
-Section 50
-Paragraph 20
-Publisher FASB
-URI https://asc.fasb.org//1943274/2147482685/740-10-50-20
| Name: |
us-gaap_IncomeTaxPolicyTextBlock |
| Namespace Prefix: |
us-gaap_ |
| Data Type: |
dtr-types:textBlockItemType |
| Balance Type: |
na |
| Period Type: |
duration |
|
| X |
- DefinitionDisclosure of accounting policy pertaining to new accounting pronouncements that may impact the entity's financial reporting. Includes, but is not limited to, quantification of the expected or actual impact.
| Name: |
us-gaap_NewAccountingPronouncementsPolicyPolicyTextBlock |
| Namespace Prefix: |
us-gaap_ |
| Data Type: |
dtr-types:textBlockItemType |
| Balance Type: |
na |
| Period Type: |
duration |
|
| X |
- DefinitionDisclosure of accounting policy for revenue recognition for leases entered into by lessor. Reference 1: http://www.xbrl.org/2003/role/exampleRef
-Topic 235
-SubTopic 10
-Name Accounting Standards Codification
-Section 50
-Paragraph 4
-Subparagraph (f)
-Publisher FASB
-URI https://asc.fasb.org//1943274/2147483426/235-10-50-4
| Name: |
us-gaap_RevenueRecognitionLeases |
| Namespace Prefix: |
us-gaap_ |
| Data Type: |
dtr-types:textBlockItemType |
| Balance Type: |
na |
| Period Type: |
duration |
|
| X |
- DefinitionDisclosure of accounting policy for the use of estimates in the preparation of financial statements in conformity with generally accepted accounting principles. Reference 1: http://fasb.org/us-gaap/role/ref/legacyRef
-Name Accounting Standards Codification
-Topic 275
-SubTopic 10
-Section 50
-Paragraph 9
-Publisher FASB
-URI https://asc.fasb.org//1943274/2147482861/275-10-50-9
Reference 2: http://fasb.org/us-gaap/role/ref/legacyRef
-Name Accounting Standards Codification
-Topic 275
-SubTopic 10
-Section 50
-Paragraph 4
-Publisher FASB
-URI https://asc.fasb.org//1943274/2147482861/275-10-50-4
Reference 3: http://www.xbrl.org/2003/role/disclosureRef
-Name Accounting Standards Codification
-Section 50
-Paragraph 1
-Subparagraph (b)
-SubTopic 10
-Topic 275
-Publisher FASB
-URI https://asc.fasb.org//1943274/2147482861/275-10-50-1
Reference 4: http://www.xbrl.org/2003/role/disclosureRef
-Name Accounting Standards Codification
-Section 50
-Paragraph 1
-Subparagraph (c)
-SubTopic 10
-Topic 275
-Publisher FASB
-URI https://asc.fasb.org//1943274/2147482861/275-10-50-1
Reference 5: http://www.xbrl.org/2003/role/disclosureRef
-Name Accounting Standards Codification
-Section 50
-Paragraph 11
-SubTopic 10
-Topic 275
-Publisher FASB
-URI https://asc.fasb.org//1943274/2147482861/275-10-50-11
Reference 6: http://www.xbrl.org/2003/role/disclosureRef
-Name Accounting Standards Codification
-Section 50
-Paragraph 12
-SubTopic 10
-Topic 275
-Publisher FASB
-URI https://asc.fasb.org//1943274/2147482861/275-10-50-12
Reference 7: http://fasb.org/us-gaap/role/ref/legacyRef
-Name Accounting Standards Codification
-Topic 275
-SubTopic 10
-Section 50
-Paragraph 8
-Publisher FASB
-URI https://asc.fasb.org//1943274/2147482861/275-10-50-8
| Name: |
us-gaap_UseOfEstimates |
| Namespace Prefix: |
us-gaap_ |
| Data Type: |
dtr-types:textBlockItemType |
| Balance Type: |
na |
| Period Type: |
duration |
|
v3.23.3
| X |
- References
+ Details
| Name: |
us-gaap_OrganizationConsolidationAndPresentationOfFinancialStatementsAbstract |
| Namespace Prefix: |
us-gaap_ |
| Data Type: |
xbrli:stringItemType |
| Balance Type: |
na |
| Period Type: |
duration |
|
| X |
- DefinitionTabular disclosure of real estate properties and units in those properties that are included in the discussion of the nature of an entity's operations.
| Name: |
us-gaap_ScheduleOfRealEstatePropertiesTableTextBlock |
| Namespace Prefix: |
us-gaap_ |
| Data Type: |
dtr-types:textBlockItemType |
| Balance Type: |
na |
| Period Type: |
duration |
|
v3.23.3
Investment in Real Estate (Tables)
|
9 Months Ended |
Sep. 30, 2023 |
|---|
| Real Estate [Abstract] |
|
| Schedule of Investment in Real Estate |
The table below summarizes our investment in real estate:
| | | | | | | | | | | | | (In thousands) | September 30, 2023 | | December 31, 2022 | | | | | | Land | $ | 1,185,977 | | $ | 1,185,977 | Buildings and improvements(1) | 10,118,965 | | 10,055,499 | | Tenant improvements and lease intangibles | 1,011,310 | | 981,460 | Property under development(1) | 69,225 | | 70,037 | | Investment in real estate, gross | $ | 12,385,477 | | $ | 12,292,973 |
________________________________________________ (1) During the nine months ended September 30, 2023, Property under development balances transferred to Building and improvements for real estate placed into service was $34.0 million.
|
| Schedule of Purchase Price Allocation for Acquisition |
The contract price and the purchase price allocation total in the table below differ due to acquisition costs, prorations and similar adjustments: | | | | | | | (In thousands) | Purchase Price Allocation | | | | Land | $ | 22,086 | | | Buildings and improvements | 319,666 | | | Tenant improvements and lease intangibles | 8,879 | | | Acquired below-market leases | (18,542) | | | Other liabilities assumed | (1,619) | | | Net assets and liabilities acquired | $ | 330,470 | |
|
| X |
- DefinitionSchedule Of Asset Acquisitions Purchase Price Allocation
| Name: |
nysedei_ScheduleOfAssetAcquisitionsPurchasePriceAllocationTableTextBlock |
| Namespace Prefix: |
nysedei_ |
| Data Type: |
dtr-types1:textBlockItemType |
| Balance Type: |
na |
| Period Type: |
duration |
|
| X |
- DefinitionSchedule Of Investment In Real Estate
| Name: |
nysedei_ScheduleOfInvestmentInRealEstateTableTextBlock |
| Namespace Prefix: |
nysedei_ |
| Data Type: |
dtr-types1:textBlockItemType |
| Balance Type: |
na |
| Period Type: |
duration |
|
| X |
- References
+ Details
| Name: |
us-gaap_RealEstateAbstract |
| Namespace Prefix: |
us-gaap_ |
| Data Type: |
xbrli:stringItemType |
| Balance Type: |
na |
| Period Type: |
duration |
|
v3.23.3
Ground Lease (Tables)
|
9 Months Ended |
Sep. 30, 2023 |
|---|
| Lessee Disclosure [Abstract] |
|
| Schedule of Future Minimum Ground Lease Payments |
The table below, which assumes that the ground rent payments will continue to be $733 thousand per year after February 28, 2029, presents the future minimum ground lease payments as of September 30, 2023: | | | | | | | Twelve months ending September 30: | (In thousands) | | | | 2024 | $ | 733 | | | 2025 | 733 | | | 2026 | 733 | | | 2027 | 733 | | | 2028 | 733 | | | Thereafter | 42,696 | | | Total future minimum lease payments | $ | 46,361 | |
|
| X |
- References
+ Details
| Name: |
us-gaap_LesseeDisclosureAbstract |
| Namespace Prefix: |
us-gaap_ |
| Data Type: |
xbrli:stringItemType |
| Balance Type: |
na |
| Period Type: |
duration |
|
| X |
- DefinitionTabular disclosure of undiscounted cash flows of lessee's operating lease liability. Includes, but is not limited to, reconciliation of undiscounted cash flows to operating lease liability recognized in statement of financial position. Reference 1: http://www.xbrl.org/2009/role/commonPracticeRef
-Topic 842
-SubTopic 20
-Name Accounting Standards Codification
-Section 50
-Paragraph 6
-Publisher FASB
-URI https://asc.fasb.org//1943274/2147478964/842-20-50-6
| Name: |
us-gaap_LesseeOperatingLeaseLiabilityMaturityTableTextBlock |
| Namespace Prefix: |
us-gaap_ |
| Data Type: |
dtr-types:textBlockItemType |
| Balance Type: |
na |
| Period Type: |
duration |
|
v3.23.3
Acquired Lease Intangibles (Tables)
|
9 Months Ended |
Sep. 30, 2023 |
|---|
| Goodwill and Intangible Assets Disclosure [Abstract] |
|
| Schedule of Acquired Lease Intangibles |
Summary of our Acquired Lease Intangibles
| | | | | | | | | | | | | (In thousands) | September 30, 2023 | | December 31, 2022 | | | | | | Above-market tenant leases | $ | 4,712 | | | $ | 4,968 | | | Above-market tenant leases - accumulated amortization | (2,474) | | | (2,309) | | | Above-market ground lease where we are the lessor | 1,152 | | | 1,152 | | | Above-market ground lease - accumulated amortization | (287) | | | (275) | | | Acquired lease intangible assets, net | $ | 3,103 | | | $ | 3,536 | | | | | | | Below-market tenant leases | $ | 50,347 | | | $ | 64,851 | | | Below-market tenant leases - accumulated accretion | (27,572) | | | (33,487) | | | Acquired lease intangible liabilities, net | $ | 22,775 | | | $ | 31,364 | |
|
| Schedule of Net Amortization or Accretion of Above- and Below-Market Leases |
The table below summarizes the net amortization/accretion related to our above- and below-market leases:
| | | | | | | | | | | | | | | | | | | | | | | | | | Three Months Ended September 30, | | Nine Months Ended September 30, | | (In thousands) | 2023 | | 2022 | | 2023 | | 2022 | | | | | | | | | Net accretion of above- and below-market tenant lease assets and liabilities(1) | $ | 2,466 | | | $ | 3,348 | | | $ | 8,169 | | | $ | 8,063 | | Amortization of an above-market ground lease asset(2) | (5) | | | (5) | | | (13) | | | (13) | | | Total | $ | 2,461 | | | $ | 3,343 | | | $ | 8,156 | | | $ | 8,050 | |
______________________________________________ (1) Recorded as a net increase to office and multifamily rental revenues. (2) Recorded as a decrease to office parking and other income.
|
| X |
- DefinitionSchedule Of Net Amortization Or Accretion Of Above/Below-Market Leases [Table Text Block]
| Name: |
nysedei_ScheduleOfNetAmortizationOrAccretionOfAboveBelowMarketLeasesTableTextBlock |
| Namespace Prefix: |
nysedei_ |
| Data Type: |
dtr-types1:textBlockItemType |
| Balance Type: |
na |
| Period Type: |
duration |
|
| X |
- References
+ Details
| Name: |
us-gaap_GoodwillAndIntangibleAssetsDisclosureAbstract |
| Namespace Prefix: |
us-gaap_ |
| Data Type: |
xbrli:stringItemType |
| Balance Type: |
na |
| Period Type: |
duration |
|
| X |
- DefinitionTabular disclosure of assets, excluding financial assets and goodwill, lacking physical substance with a finite life, by either major class or business segment. Reference 1: http://fasb.org/us-gaap/role/ref/legacyRef
-Name Accounting Standards Codification
-Topic 350
-SubTopic 30
-Section 50
-Paragraph 1
-Subparagraph (a)
-Publisher FASB
-URI https://asc.fasb.org//1943274/2147482665/350-30-50-1
Reference 2: http://fasb.org/us-gaap/role/ref/legacyRef
-Name Accounting Standards Codification
-Topic 350
-SubTopic 30
-Section 50
-Paragraph 2
-Subparagraph (a)
-Publisher FASB
-URI https://asc.fasb.org//1943274/2147482665/350-30-50-2
| Name: |
us-gaap_ScheduleOfFiniteLivedIntangibleAssetsTableTextBlock |
| Namespace Prefix: |
us-gaap_ |
| Data Type: |
dtr-types:textBlockItemType |
| Balance Type: |
na |
| Period Type: |
duration |
|
v3.23.3
Investment in Unconsolidated Fund (Tables)
|
9 Months Ended |
Sep. 30, 2023 |
|---|
| Real Estate Investments, Net [Abstract] |
|
| Schedule of Statement of Operations for Investments in Unconsolidated Funds and Cash Received from Funds |
The table below presents the cash distributions we received from Partnership X: | | | | | | | | | | | | | Nine Months Ended September 30, | | (In thousands) | 2023 | | 2022 | | | | | | Operating distributions received | $ | 957 | | | $ | 921 | | | Capital distributions received | 80 | | | 1,454 | | | Total distributions received | $ | 1,037 | | | $ | 2,375 | |
The tables below present selected financial information for Partnership X. The amounts presented reflect 100% (not our pro-rata share) of the amounts related to the Fund, and are based upon historical book value:
| | | | | | | | | | | | | (In thousands) | September 30, 2023 | | December 31, 2022 | | | | | | Total assets | $ | 149,588 | | | $ | 147,853 | | | Total liabilities | $ | 118,942 | | | $ | 119,038 | | | Total equity | $ | 30,646 | | | $ | 28,815 | |
| | | | | | | | | | | | | | Nine Months Ended September 30, | | (In thousands) | 2023 | | 2022 | | | | | | Total revenues | $ | 14,929 | | | $ | 13,893 | | | Operating income | $ | 4,749 | | | $ | 4,361 | | | Net income | $ | 3,167 | | | $ | 2,387 | |
|
| X |
- DefinitionTabular disclosure of equity method investments including, but not limited to, name of each investee or group of investments, percentage ownership, difference between recorded amount of an investment and the value of the underlying equity in the net assets, and summarized financial information. Reference 1: http://www.xbrl.org/2003/role/disclosureRef
-Topic 323
-SubTopic 10
-Name Accounting Standards Codification
-Section 50
-Paragraph 3
-Publisher FASB
-URI https://asc.fasb.org//1943274/2147481687/323-10-50-3
| Name: |
us-gaap_EquityMethodInvestmentsTextBlock |
| Namespace Prefix: |
us-gaap_ |
| Data Type: |
dtr-types:textBlockItemType |
| Balance Type: |
na |
| Period Type: |
duration |
|
| X |
- References
+ Details
| Name: |
us-gaap_RealEstateInvestmentsAbstract |
| Namespace Prefix: |
us-gaap_ |
| Data Type: |
xbrli:stringItemType |
| Balance Type: |
na |
| Period Type: |
duration |
|
v3.23.3
Other Assets (Tables)
|
9 Months Ended |
Sep. 30, 2023 |
|---|
| Other Assets [Abstract] |
|
| Schedule of Other Assets |
| | | | | | | | | | | | | (In thousands) | September 30, 2023 | | December 31, 2022 | | | | | | Restricted cash | $ | 101 | | | $ | 101 | | | Prepaid expenses | 30,811 | | | 19,871 | | | Indefinite-lived intangibles | 1,988 | | | 1,988 | | Deposit with lender(1) | 13,300 | | | — | | | Furniture, fixtures and equipment, net | 7,042 | | | 7,144 | | | Other | 7,152 | | | 4,837 | | | Total other assets | $ | 60,394 | | | $ | 33,941 | |
_______________________________________________________________________ (1) In connection with the Barrington Plaza loan, Barrington Plaza Apartments have been removed from the rental market. The lender is treating the debt as a construction loan. They have required a $13.3 million cash deposit, which we placed in a collateral account during the third quarter, and they are requiring a construction completion guarantee. See Note 8 for our debt disclosures.
|
| X |
- References
+ Details
| Name: |
us-gaap_OtherAssetsAbstract |
| Namespace Prefix: |
us-gaap_ |
| Data Type: |
xbrli:stringItemType |
| Balance Type: |
na |
| Period Type: |
duration |
|
| X |
- DefinitionTabular disclosure of the carrying amounts of other assets. This disclosure includes other current assets and other noncurrent assets.
| Name: |
us-gaap_ScheduleOfOtherAssetsTableTextBlock |
| Namespace Prefix: |
us-gaap_ |
| Data Type: |
dtr-types:textBlockItemType |
| Balance Type: |
na |
| Period Type: |
duration |
|
v3.23.3
Secured Notes Payable, Net (Tables)
|
9 Months Ended |
Sep. 30, 2023 |
|---|
| Debt Disclosure [Abstract] |
|
| Schedule of Secured Notes Payable |
| | | | | | | | | | | | | | | | | | | | | | | | | | | | | | | | | | | | | | | | Description | | Maturity Date(1) | | Principal Balance as of September 30, 2023 | | Principal Balance as of December 31, 2022 | | Variable Interest Rate(2) | | Fixed Interest Rate(3) | | Swap Maturity Date | | | | | | | | | | | | | | | | | | (In thousands) | | | | | | | | | | | | | | | | | | | | | Consolidated Wholly Owned Subsidiaries | Term loan(4)(5) | | 3/3/2025 | | $ | 335,000 | | | $ | 335,000 | | | SOFR + 1.41% | | N/A | | N/A | Fannie Mae loan(4)(5) | | 4/1/2025 | | 102,400 | | | 102,400 | | | SOFR + 1.36% | | N/A | | N/A | Term loan(4) | | 8/15/2026 | | 415,000 | | | 415,000 | | | SOFR + 1.20% | | 3.07% | | 8/1/2025 | Term loan(4) | | 9/19/2026 | | 400,000 | | | 400,000 | | | SOFR + 1.25% | | 2.44% | | 9/1/2024 | Term loan(4) | | 9/26/2026 | | 200,000 | | | 200,000 | | | SOFR + 1.30% | | 2.36% | | 10/1/2024 | Term loan(4) | | 11/1/2026 | | 400,000 | | | 400,000 | | | SOFR + 1.25% | | 2.31% | | 10/1/2024 | Fannie Mae loan(4)(6) | | 6/1/2027 | | 550,000 | | | 550,000 | | | SOFR + 1.48% | | N/A | | N/A | Term loan(4) | | 5/18/2028 | | 300,000 | | | 300,000 | | | SOFR + 1.51% | | 2.21% | | 6/1/2026 | Term loan(4) | | 1/1/2029 | | 300,000 | | | 300,000 | | | SOFR + 1.56% | | 2.66% | | 1/1/2027 | Fannie Mae loan(4) | | 6/1/2029 | | 255,000 | | | 255,000 | | | SOFR + 1.09% | | 3.26% | | 6/1/2027 | Fannie Mae loan(4) | | 6/1/2029 | | 125,000 | | | 125,000 | | | SOFR + 1.09% | | 3.25% | | 6/1/2027 | Fannie Mae loan(4)(7) | | 8/1/2033 | | 350,000 | | | — | | | SOFR + 1.37% | | N/A | | N/A | Term loan(8) | | 6/1/2038 | | 27,859 | | | 28,502 | | | N/A | | 4.55% | | N/A | | Total Wholly-Owned Subsidiary Debt | 3,760,259 | | | 3,410,902 | | | | | | | | | | | | | | | | | | | | | | Consolidated JVs | Term loan(4)(9) | | 12/19/2024 | | 400,000 | | | 400,000 | | | SOFR + 1.40% | | N/A | | N/A | Term loan(4) | | 5/15/2027 | | 450,000 | | | 450,000 | | | SOFR + 1.45% | | 2.26% | | 4/1/2025 | Term loan(4) | | 8/19/2028 | | 625,000 | | | 625,000 | | | SOFR + 1.45% | | 2.12% | | 6/1/2025 | Term loan(4) | | 4/26/2029 | | 175,000 | | | 175,000 | | | SOFR + 1.25% | | 3.90% | | 5/1/2026 | Fannie Mae loan(4) | | 6/1/2029 | | 160,000 | | | 160,000 | | | SOFR + 1.09% | | 3.25% | | 7/1/2027 | Total Consolidated Debt(10) | 5,570,259 | | | 5,220,902 | | | | | | | | Unamortized loan premium, net(11) | 3,203 | | | 3,547 | | | | | | | | Unamortized deferred loan costs, net(12) | (31,616) | | | (32,556) | | | | | | | | | Total Consolidated Debt, net | $ | 5,541,846 | | | $ | 5,191,893 | | | | | | | |
_______________________________________________________________________ Except as noted below, our loans: (i) are non-recourse, (ii) are secured by separate collateral pools consisting of one or more properties, (iii) require interest-only monthly payments with the outstanding principal due upon maturity, and (iv) contain certain financial covenants which could require us to deposit excess cash flow with the lender under certain circumstances unless we (at our option) either provide a guarantee or additional collateral or pay down the loan within certain parameters set forth in the loan documents. Certain loans with maturity date extension options require us to meet minimum financial thresholds in order to extend the loan maturity date. (1)Maturity dates include extension options. (2)LIBOR loans converted to SOFR during the third quarter include a small SOFR adjustment to calculate the interest payable to the lender, which are included in the spreads. The SOFR conversion did not change the swap-fixed interest rates for our swap-fixed loans. (3)Effective rate as of September 30, 2023. Includes the effect of interest rate swaps (if applicable) and excludes the effect of prepaid loan fees and loan premiums. See Note 10 for details of our interest rate swaps. See further below for details of our loan costs and loan premiums. (4)The loan agreement includes a zero-percent SOFR floor. If the loan is swap-fixed then the related swaps do not include such a floor. (5)The swaps expired on March 1, 2023. (6)The loan is secured by four residential properties. A portion of the loan totaling $472 million has a lender-required out-of-the-money interest rate cap at a weighted average of 8.99% until July 2026. Barrington Plaza Apartments have been removed from the rental market. See Note 3. For the portion of the loan relating to Barrington Plaza, the lender is treating the debt as a construction loan. They have required a $13.3 million cash deposit, which we placed in a collateral account during the third quarter, and they are requiring a construction completion guarantee. The lender will return the deposit at the earlier of August 2026 or when the loan is paid in full. The deposit is included in Other assets in our balance sheet. See Note 7. (7)We closed the loan during the third quarter of 2023. The loan has a lender-required out-of-the-money interest rate cap at an interest rate of 7.84% until August 2026. We used part of the proceeds from the loan to pay off the balance on our revolving credit facility, which expired in August 2023. There was no balance outstanding on the credit facility as of December 31, 2022. (8)The loan requires monthly payments of principal and interest. The principal amortization is based upon a 30-year amortization schedule. (9)The swaps expired on January 1, 2023. (10)The table does not include our unconsolidated Fund's loan - see Note 16. See Note 13 for our fair value disclosures. (11)Balances are net of accumulated amortization of $4.0 million and $3.7 million at September 30, 2023 and December 31, 2022, respectively. (12)Balances are net of accumulated amortization of $54.2 million and $54.1 million at September 30, 2023 and December 31, 2022, respectively.
Debt Statistics
The table below summarizes our consolidated fixed and floating rate debt: | | | | | | | | | | | | | | | | (In thousands) | | Principal Balance as of September 30, 2023 | | Principal Balance as of December 31, 2022 | | | | | | | Aggregate swapped to fixed rate loans | | $ | 3,805,000 | | | $ | 4,642,400 | | | Aggregate fixed rate loans | | 27,859 | | | 28,502 | | | Aggregate capped rate loans | | 822,000 | | | — | | | Aggregate floating rate loans | | 915,400 | | | 550,000 | | | Total Debt | | $ | 5,570,259 | | | $ | 5,220,902 | |
The table below summarizes certain consolidated debt statistics as of September 30, 2023: | | | | | | | | | | Statistics for consolidated loans with interest fixed under the terms of the loan or a swap | | | | | Principal balance (in billions) | | $3.83 | | Weighted average remaining life (including extension options) | | 4.3 years | | Weighted average remaining fixed interest period | | 2.1 years | | Weighted average annual interest rate | | 2.65% |
|
| Schedule of Minimum Future Principal Payments |
At September 30, 2023, the minimum future principal payments due on our consolidated secured notes payable were as follows: | | | | | | | | | | Twelve months ending September 30: | | Including Maturity Extension Options(1) | | | | | | (In thousands) | | | | | 2024 | | $ | 891 | | | 2025 | | 838,333 | | | 2026 | | 1,015,976 | | | 2027 | | 1,401,022 | | | 2028 | | 926,069 | | | Thereafter | | 1,387,968 | | | Total future principal payments | | $ | 5,570,259 | |
________________________________________________ (1) Some of our loan agreements require that we meet certain minimum financial thresholds to be able to extend the loan maturity.
|
| Schedule of Loan Costs and Amortization of Deferred Loan Costs |
The table below presents loan premium and loan costs, which are included in Interest expense on our consolidated statements of operations: | | | | | | | | | | | | | | | | | | | | | | | | | | Three Months Ended September 30, | | Nine Months Ended September 30, | | (In thousands) | 2023 | | 2022 | | 2023 | | 2022 | | | | | | | | | | Loan premium amortized and written off | $ | (116) | | | $ | (116) | | | $ | (344) | | | $ | (344) | | | Deferred loan costs amortized and written off | 2,261 | | | 2,030 | | | 6,623 | | | 5,908 | | | Loan costs expensed | 59 | | | 8 | | | 79 | | | 110 | | | Total | $ | 2,204 | | | $ | 1,922 | | | $ | 6,358 | | | $ | 5,674 | |
|
| X |
- DefinitionSchedule of Loan Costs and Amortization of Deferred Loan Costs [Table Text Block]
| Name: |
nysedei_ScheduleOfLoanCostsAndAmortizationOfDeferredLoanCostsTableTextBlock |
| Namespace Prefix: |
nysedei_ |
| Data Type: |
dtr-types1:textBlockItemType |
| Balance Type: |
na |
| Period Type: |
duration |
|
| X |
- References
+ Details
| Name: |
us-gaap_DebtDisclosureAbstract |
| Namespace Prefix: |
us-gaap_ |
| Data Type: |
xbrli:stringItemType |
| Balance Type: |
na |
| Period Type: |
duration |
|
| X |
- DefinitionTabular disclosure of information pertaining to short-term and long-debt instruments or arrangements, including but not limited to identification of terms, features, collateral requirements and other information necessary to a fair presentation.
| Name: |
us-gaap_ScheduleOfDebtTableTextBlock |
| Namespace Prefix: |
us-gaap_ |
| Data Type: |
dtr-types:textBlockItemType |
| Balance Type: |
na |
| Period Type: |
duration |
|
| X |
- DefinitionTabular disclosure of maturity and sinking fund requirement for long-term debt. Reference 1: http://fasb.org/us-gaap/role/ref/legacyRef
-Name Accounting Standards Codification
-Section 50
-Paragraph 1
-SubTopic 10
-Topic 470
-Publisher FASB
-URI https://asc.fasb.org//1943274/2147481544/470-10-50-1
| Name: |
us-gaap_ScheduleOfMaturitiesOfLongTermDebtTableTextBlock |
| Namespace Prefix: |
us-gaap_ |
| Data Type: |
dtr-types:textBlockItemType |
| Balance Type: |
na |
| Period Type: |
duration |
|
v3.23.3
Interest Payable, Accounts Payable and Deferred Revenue (Tables)
|
9 Months Ended |
Sep. 30, 2023 |
|---|
| Accounts Payable and Accrued Liabilities [Abstract] |
|
| Schedule of Interest Payable, Accounts Payable and Deferred Revenue |
| | | | | | | | | | | | | (In thousands) | September 30, 2023 | | December 31, 2022 | | | | | | Interest payable | $ | 18,028 | | | $ | 13,529 | | | Accounts payable and accrued liabilities | 99,805 | | | 80,244 | | | Deferred revenue | 51,236 | | | 47,152 | | | Total interest payable, accounts payable and deferred revenue | $ | 169,069 | | | $ | 140,925 | |
|
| X |
- References
+ Details
| Name: |
us-gaap_AccountsPayableAndAccruedLiabilitiesCurrentAndNoncurrentAbstract |
| Namespace Prefix: |
us-gaap_ |
| Data Type: |
xbrli:stringItemType |
| Balance Type: |
na |
| Period Type: |
duration |
|
| X |
- DefinitionTabular disclosure of the (a) carrying value as of the balance sheet date of liabilities incurred (and for which invoices have typically been received) and payable to vendors for goods and services received that are used in an entity's business (accounts payable); (b) other payables; and (c) accrued liabilities. Examples include taxes, interest, rent and utilities. Used to reflect the current portion of the liabilities (due within one year or within the normal operating cycle if longer). An alternative caption includes accrued expenses.
| Name: |
us-gaap_ScheduleOfAccountsPayableAndAccruedLiabilitiesTableTextBlock |
| Namespace Prefix: |
us-gaap_ |
| Data Type: |
dtr-types:textBlockItemType |
| Balance Type: |
na |
| Period Type: |
duration |
|
v3.23.3
Derivative Contracts (Tables)
|
9 Months Ended |
Sep. 30, 2023 |
|---|
| Derivative Instruments and Hedging Activities Disclosure [Abstract] |
|
| Schedule of Interest Rate Swap Derivatives |
The table below summarizes our derivative contracts as of September 30, 2023: | | | | | | | | | | | | | Number of Interest Rate Contracts | | Notional
(In thousands) | | | | | | Derivatives Designated as Cash Flow Hedges: | | | | Consolidated derivatives - swaps(1)(2)(3) | 24 | | $ | 3,805,000 | | Consolidated derivatives - caps(2)(3)(4) | 5 | | $ | 822,000 | | Unconsolidated Fund's derivatives - swaps(2)(3)(5) | 2 | | $ | 115,000 | | | | | | | Derivatives Not Designated as Cash Flow Hedges: | | | | Consolidated derivatives - caps(6) | — | | $ | — | |
___________________________________________________ (1)The notional amount includes 100%, not our pro-rata share, of our consolidated JVs' derivatives. See Note 8 for more information about our hedged consolidated debt. (2)Our derivative contracts do not provide for right of offset between derivative contracts. (3)See Note 13 for our derivative fair value disclosures. (4)We purchased five interest rate caps with a notional amount of $822.0 million during the third quarter of 2023. See Note 8 for more information about our hedged consolidated debt. (5)The notional amount reflects 100%, not our pro-rata share, of our unconsolidated Fund's derivatives. See Note 6 for more information about our Fund, including our equity interest percentage. (6)Five interest rate caps with a total aggregate notional amount of $1.10 billion expired on July 1, 2023.
|
| Schedule of Derivative Assets at Fair Value |
The fair value of our interest rate swap and cap contract assets, including accrued interest and excluding credit risk adjustments, was as follows: | | | | | | | | | | | | | (In thousands) | September 30, 2023 | | December 31, 2022 | | | | | Consolidated derivatives(1) | $ | 262,322 | | | $ | 281,982 | | Unconsolidated Fund's derivatives(2) | $ | 12,877 | | | $ | 12,863 | |
___________________________________________________ (1)The amounts include 100%, not our pro-rata share, of our consolidated JVs' derivatives. (2)The amounts reflect 100%, not our pro-rata share, of our unconsolidated Fund's derivatives. For more information about our Fund, including our equity interest percentage, see Note 6.
|
| Schedule of Effect of Derivative Instruments on Consolidated Statements of Operations |
The table below presents the effect of our derivatives on our AOCI and the consolidated statements of operations:
| | | | | | | | | | | | | (In thousands) | Nine Months Ended September 30, | | | 2023 | | 2022 | | Derivatives Designated as Cash Flow Hedges: | | | | | | | | | Consolidated derivatives: | | | | Gains recorded in AOCI before reclassifications(1) | $ | 83,157 | | | $ | 318,408 | | (Gains) losses reclassified from AOCI to Interest Expense(1) | $ | (104,891) | | | $ | 20,505 | | | Interest expense presented on the consolidated statements of operations | $ | (151,859) | | | $ | (109,560) | | Unconsolidated Fund's derivatives (our share)(2): | | | | Gains recorded in AOCI before reclassifications(1) | $ | 1,185 | | | $ | 3,777 | | Gains reclassified from AOCI to Income from unconsolidated Fund(1) | $ | (1,208) | | | $ | (62) | | | Income from unconsolidated Fund presented on the consolidated statements of operations | $ | 1,177 | | | $ | 921 | | | Derivatives Not Designated as Cash Flow Hedges: | | | | | Consolidated derivatives: | | | | Loss recorded as interest expense(3) | $ | — | | | $ | 38 | |
___________________________________________________ (1)See Note 11 for our AOCI reconciliation. (2)We calculate our share by multiplying the total amount for the Fund by our equity interest in the Fund. For more information about our Fund, including our equity interest percentage, see Note 6. (3)Gains and losses from non-designated interest rate caps offset each other during the periods presented. The respective caps expired on July 1, 2023.
|
| Schedule of Future Reclassifications from AOCI |
At September 30, 2023, our estimate of the AOCI related to derivatives designated as cash flow hedges that will be reclassified to earnings during the next twelve months is as follows:
| | | | | | | (In thousands) | | | | Consolidated derivatives: | | | Gains to be reclassified from AOCI to Interest Expense | $ | 150,054 | | Unconsolidated Fund's derivatives (our share)(1): | | | Gains to be reclassified from AOCI to Income from unconsolidated Fund | $ | 1,741 | |
___________________________________________________ (1) We calculate our share by multiplying the total amount for the Fund by our equity interest in the Fund. For more information about our Fund, including our equity interest percentage, see Note 6.
|
| X |
- References
+ Details
| Name: |
us-gaap_DerivativeInstrumentsAndHedgingActivitiesDisclosureAbstract |
| Namespace Prefix: |
us-gaap_ |
| Data Type: |
xbrli:stringItemType |
| Balance Type: |
na |
| Period Type: |
duration |
|
| X |
- DefinitionTabular disclosure of gain (loss) on derivative and nonderivative instruments designated and qualifying as cash flow hedge recorded in accumulated other comprehensive income (AOCI) and reclassified into earnings. Reference 1: http://fasb.org/us-gaap/role/ref/legacyRef
-Name Accounting Standards Codification
-Topic 815
-SubTopic 10
-Section 50
-Paragraph 4C
-Subparagraph (c)
-Publisher FASB
-URI https://asc.fasb.org//1943274/2147480434/815-10-50-4C
| Name: |
us-gaap_ScheduleOfCashFlowHedgesIncludedInAccumulatedOtherComprehensiveIncomeLossTableTextBlock |
| Namespace Prefix: |
us-gaap_ |
| Data Type: |
dtr-types:textBlockItemType |
| Balance Type: |
na |
| Period Type: |
duration |
|
| X |
- DefinitionTabular disclosure of derivative assets at fair value.
| Name: |
us-gaap_ScheduleOfDerivativeAssetsAtFairValueTableTextBlock |
| Namespace Prefix: |
us-gaap_ |
| Data Type: |
dtr-types:textBlockItemType |
| Balance Type: |
na |
| Period Type: |
duration |
|
| X |
- DefinitionTabular disclosure of derivative instruments (including nonderivative instruments that are designated and qualify as hedging instruments) of (a) the location and amount of gains and losses reported in the statement of financial performance and (b) the location and fair value amounts of the instruments reported in the statement of financial position. Reference 1: http://fasb.org/us-gaap/role/ref/legacyRef
-Name Accounting Standards Codification
-Topic 815
-SubTopic 10
-Section 50
-Paragraph 4A
-Publisher FASB
-URI https://asc.fasb.org//1943274/2147480434/815-10-50-4A
| Name: |
us-gaap_ScheduleOfDerivativesInstrumentsStatementsOfFinancialPerformanceAndFinancialPositionLocationTableTextBlock |
| Namespace Prefix: |
us-gaap_ |
| Data Type: |
dtr-types:textBlockItemType |
| Balance Type: |
na |
| Period Type: |
duration |
|
| X |
- DefinitionTabular disclosure of the notional amounts of outstanding derivative positions. Reference 1: http://fasb.org/us-gaap/role/ref/legacyRef
-Name Accounting Standards Codification
-Topic 815
-SubTopic 10
-Section 50
-Paragraph 1A
-Subparagraph (d)
-Publisher FASB
-URI https://asc.fasb.org//1943274/2147480434/815-10-50-1A
| Name: |
us-gaap_ScheduleOfNotionalAmountsOfOutstandingDerivativePositionsTableTextBlock |
| Namespace Prefix: |
us-gaap_ |
| Data Type: |
dtr-types:textBlockItemType |
| Balance Type: |
na |
| Period Type: |
duration |
|
v3.23.3
Equity (Tables)
|
9 Months Ended |
Sep. 30, 2023 |
|---|
| Stockholders' Equity Note [Abstract] |
|
| Schedule of Net Income Attributable to Common Stockholders and Transfers (to) from Noncontrolling Interests |
The table below presents the effect on our equity from net (loss) income attributable to common stockholders and changes in our ownership interest in our Operating Partnership: | | | | | | | | | | | | | | Nine Months Ended September 30, | | (In thousands) | 2023 | | 2022 | | | | | | Net (loss) income attributable to common stockholders | $ | (2,251) | | | $ | 72,843 | | | | | | | Transfers from noncontrolling interests: | | | | | Exchange of OP Units with noncontrolling interests | — | | | 4,236 | | | Repurchases of OP Units from noncontrolling interests | 120 | | | (176) | | | Net transfers from noncontrolling interests | 120 | | | 4,060 | | | | | | | Change from net (loss) income attributable to common stockholders and transfers from noncontrolling interests | $ | (2,131) | | | $ | 76,903 | |
|
| Schedule of Accumulated Other Comprehensive Income (Loss) |
The table below presents a reconciliation of our AOCI, which consists solely of adjustments related to derivatives designated as cash flow hedges: | | | | | | | | | | | | | Nine Months Ended September 30, | | (In thousands) | 2023 | | 2022 | | | | | | Accumulated Other Comprehensive Income (Loss) - Beginning balance | $ | 187,063 | | | $ | (38,774) | | | Consolidated derivatives: | | | | | Other comprehensive income before reclassifications | 83,157 | | | 318,408 | | | Reclassification of (gains) losses from AOCI to Interest Expense | (104,891) | | | 20,505 | | Unconsolidated Fund's derivatives (our share)(2): | | | | | Other comprehensive income before reclassifications | 1,185 | | | 3,777 | | | Reclassification of gains from AOCI to Income from unconsolidated Fund | (1,208) | | | (62) | | | Net current period OCI | (21,757) | | | 342,628 | | | OCI attributable to noncontrolling interests | 4,454 | | | (104,205) | | | OCI attributable to common stockholders | (17,303) | | | 238,423 | | | | | | | Accumulated Other Comprehensive Income - Ending balance | $ | 169,760 | | | $ | 199,649 | |
___________________________________________________ (1)See Note 10 for the details of our derivatives and Note 13 for our derivative fair value disclosures. (2)We calculate our share by multiplying the total amount for our Fund by our equity interest in the Fund. For more information about our Fund, including our equity interest percentage, see Note 6.
|
| Schedule of Stock-based Compensation Expense |
The table below presents our stock-based compensation expense: | | | | | | | | | | | | | | | | | | | | | | | | | Three Months Ended September 30, | | Nine Months Ended September 30, | | (In thousands) | 2023 | | 2022 | | 2023 | | 2022 | | | | | | | | | | Stock-based compensation expense | $ | 2,327 | | | $ | 2,266 | | | $ | 7,553 | | | $ | 7,156 | | | Capitalized stock-based compensation | $ | 752 | | | $ | 826 | | | $ | 2,209 | | | $ | 2,455 | |
|
| X |
- DefinitionSchedule of Net Income Attributable to Common Stockholders and Transfers (to) from The Non-controlling Interests
| Name: |
nysedei_ScheduleOfNetIncomeAttributableToCommonStockholdersAndTransfersToFromTheNonControllingInterestsTableTextBlock |
| Namespace Prefix: |
nysedei_ |
| Data Type: |
dtr-types1:textBlockItemType |
| Balance Type: |
na |
| Period Type: |
duration |
|
| X |
- DefinitionTabular disclosure of the components of accumulated other comprehensive income (loss). Reference 1: http://fasb.org/us-gaap/role/ref/legacyRef
-Name Accounting Standards Codification
-Topic 220
-SubTopic 10
-Section 45
-Paragraph 14A
-Publisher FASB
-URI https://asc.fasb.org//1943274/2147482790/220-10-45-14A
Reference 2: http://www.xbrl.org/2009/role/commonPracticeRef
-Topic 830
-SubTopic 30
-Name Accounting Standards Codification
-Section 50
-Paragraph 1
-Publisher FASB
-URI https://asc.fasb.org//1943274/2147481674/830-30-50-1
Reference 3: http://www.xbrl.org/2009/role/commonPracticeRef
-Topic 830
-SubTopic 30
-Name Accounting Standards Codification
-Section 45
-Paragraph 20
-Publisher FASB
-URI https://asc.fasb.org//1943274/2147481694/830-30-45-20
| Name: |
us-gaap_ScheduleOfAccumulatedOtherComprehensiveIncomeLossTableTextBlock |
| Namespace Prefix: |
us-gaap_ |
| Data Type: |
dtr-types:textBlockItemType |
| Balance Type: |
na |
| Period Type: |
duration |
|
| X |
- DefinitionTabular disclosure of allocation of amount expensed and capitalized for award under share-based payment arrangement to statement of income or comprehensive income and statement of financial position. Includes, but is not limited to, corresponding line item in financial statement. Reference 1: http://fasb.org/us-gaap/role/ref/legacyRef
-Name Accounting Standards Codification
-Topic 718
-SubTopic 10
-Section 50
-Paragraph 2
-Subparagraph (h)(1)
-Publisher FASB
-URI https://asc.fasb.org//1943274/2147480429/718-10-50-2
| Name: |
us-gaap_ScheduleOfEmployeeServiceShareBasedCompensationAllocationOfRecognizedPeriodCostsTextBlock |
| Namespace Prefix: |
us-gaap_ |
| Data Type: |
dtr-types:textBlockItemType |
| Balance Type: |
na |
| Period Type: |
duration |
|
| X |
- References
+ Details
| Name: |
us-gaap_StockholdersEquityNoteAbstract |
| Namespace Prefix: |
us-gaap_ |
| Data Type: |
xbrli:stringItemType |
| Balance Type: |
na |
| Period Type: |
duration |
|
v3.23.3
EPS (Tables)
|
9 Months Ended |
Sep. 30, 2023 |
|---|
| Earnings Per Share [Abstract] |
|
| Schedule of Earnings Per Share, Basic and Diluted |
The table below presents the calculation of basic and diluted EPS: | | | | | | | | | | | | | | | | | | | | | | | | | | Three Months Ended September 30, | | Nine Months Ended September 30, | | | 2023 | | 2022 | | 2023 | | 2022 | | Numerator (In thousands): | | | | | | | | | Net (loss) income attributable to common stockholders | $ | (13,362) | | | $ | 22,955 | | | $ | (2,251) | | | $ | 72,843 | | | Allocation to participating securities: Unvested LTIP Units | (271) | | | (218) | | | (831) | | | (666) | | | Net (loss) income attributable to common stockholders - basic and diluted | $ | (13,633) | | | $ | 22,737 | | | $ | (3,082) | | | $ | 72,177 | | | | | | | | | | | Denominator (In thousands): | | | | | | | | Weighted average shares of common stock outstanding - basic and diluted(1) | 166,738 | | | 175,784 | | | 170,553 | | | 175,742 | | | | | | | | | | | | | | | | | | | | | | | | | | | | | | | | | | | Net (loss) income per common share - basic and diluted | $ | (0.08) | | | $ | 0.13 | | | $ | (0.02) | | | $ | 0.41 | | | | | | | | | | | | | | | | | |
____________________________________________________ (1) Outstanding OP Units and vested LTIP Units are not included in the denominator in calculating diluted EPS, even though they may be exchanged under certain conditions for common stock on a one-for-one basis, because their associated net income or loss (equal on a per unit basis to the Net income or loss per common share - diluted) was already deducted in calculating Net income (loss) attributable to common stockholders. Accordingly, any exchange would not have any effect on diluted EPS. The table below presents the weighted average OP Units and vested LTIP Units outstanding for the respective periods:
| | | | | | | | | | | | | | | | | | | | | | | | | | Three Months Ended September 30, | | Nine Months Ended September 30, | | (In thousands) | 2023 | | 2022 | | 2023 | | 2022 | | | | | | | | | | OP Units | 31,698 | | | 30,158 | | | 30,720 | | | 29,626 | | | Vested LTIP Units | 851 | | | 690 | | | 1,816 | | | 1,255 | |
|
| X |
- References
+ Details
| Name: |
us-gaap_EarningsPerShareAbstract |
| Namespace Prefix: |
us-gaap_ |
| Data Type: |
xbrli:stringItemType |
| Balance Type: |
na |
| Period Type: |
duration |
|
| X |
- DefinitionTabular disclosure of an entity's basic and diluted earnings per share calculations, including a reconciliation of numerators and denominators of the basic and diluted per-share computations for income from continuing operations. Reference 1: http://www.xbrl.org/2009/role/commonPracticeRef
-Topic 260
-SubTopic 10
-Name Accounting Standards Codification
-Section 50
-Paragraph 1
-Subparagraph (a)
-Publisher FASB
-URI https://asc.fasb.org//1943274/2147482662/260-10-50-1
| Name: |
us-gaap_ScheduleOfEarningsPerShareBasicAndDilutedTableTextBlock |
| Namespace Prefix: |
us-gaap_ |
| Data Type: |
dtr-types:textBlockItemType |
| Balance Type: |
na |
| Period Type: |
duration |
|
v3.23.3
Fair Value of Financial Instruments (Tables)
|
9 Months Ended |
Sep. 30, 2023 |
|---|
| Fair Value Disclosures [Abstract] |
|
| Schedule of Estimated Fair Value and Carrying Value of Liabilities |
The table below presents the estimated fair value and carrying value of our secured notes payable, the carrying value includes unamortized loan premium and excludes unamortized deferred loan fees: | | | | | | | | | | | | | (In thousands) | September 30, 2023 | | December 31, 2022 | | | | | | Fair value | $ | 5,476,975 | | | $ | 5,115,548 | | | Carrying value | $ | 5,573,462 | | | $ | 5,224,449 | |
The table below presents the estimated fair value and carrying value of our ground lease liability: | | | | | | | | | | | | | (In thousands) | September 30, 2023 | | December 31, 2022 | | | | | | Fair value | $ | 4,226 | | | $ | 4,466 | | | Carrying value | $ | 10,839 | | | $ | 10,848 | |
|
| Schedule of Financial Instruments Measured at Fair Value |
The table below presents the estimated fair value of our derivatives:
| | | | | | | | | | | | | (In thousands) | September 30, 2023 | | December 31, 2022 | | Derivative Assets: | | | | Fair value - consolidated derivatives(1) | $ | 248,232 | | | $ | 270,234 | | Fair value - unconsolidated Fund's derivatives(2) | $ | 12,356 | | | $ | 12,426 | | | | | | | Derivative Liabilities: | | | | Fair value - consolidated derivatives(1) | $ | — | | | $ | 1,790 | | Fair value - unconsolidated Fund's derivatives(2) | $ | — | | | $ | — | |
____________________________________________________ (1) Consolidated derivatives, which include 100%, not our pro-rata share, of our consolidated JVs' derivatives, are included in interest rate contracts on our consolidated balance sheets. The fair values exclude accrued interest which is included in interest payable on our consolidated balance sheets. (2) The amounts reflect 100%, not our pro-rata share, of our unconsolidated Fund's derivatives. Our pro-rata share of the amounts related to the unconsolidated Fund's derivatives is included in our Investment in unconsolidated Fund on our consolidated balance sheets. Our unconsolidated Fund did not have any derivatives in a liability position for the periods presented. See Note 6 for more information about our Fund, including our equity interest percentage, and see "Guarantees" in Note 16 regarding our Fund's derivatives.
|
| X |
- DefinitionTabular disclosure of the fair value of financial instruments, including financial assets and financial liabilities, and the measurements of those instruments, assets, and liabilities. Reference 1: http://fasb.org/us-gaap/role/ref/legacyRef
-Name Accounting Standards Codification
-Topic 820
-SubTopic 10
-Section 50
-Paragraph 2
-Subparagraph (a)
-Publisher FASB
-URI https://asc.fasb.org//1943274/2147482106/820-10-50-2
Reference 2: http://fasb.org/us-gaap/role/ref/legacyRef
-Name Accounting Standards Codification
-Topic 825
-SubTopic 10
-Section 50
-Paragraph 11
-Publisher FASB
-URI https://asc.fasb.org//1943274/2147482907/825-10-50-11
| Name: |
us-gaap_FairValueByBalanceSheetGroupingTextBlock |
| Namespace Prefix: |
us-gaap_ |
| Data Type: |
dtr-types:textBlockItemType |
| Balance Type: |
na |
| Period Type: |
duration |
|
| X |
- References
+ Details
| Name: |
us-gaap_FairValueDisclosuresAbstract |
| Namespace Prefix: |
us-gaap_ |
| Data Type: |
xbrli:stringItemType |
| Balance Type: |
na |
| Period Type: |
duration |
|
| X |
- DefinitionTabular disclosure of assets and liabilities, including [financial] instruments measured at fair value that are classified in stockholders' equity, if any, that are measured at fair value on a recurring basis. The disclosures contemplated herein include the fair value measurements at the reporting date by the level within the fair value hierarchy in which the fair value measurements in their entirety fall, segregating fair value measurements using quoted prices in active markets for identical assets (Level 1), significant other observable inputs (Level 2), and significant unobservable inputs (Level 3). Reference 1: http://www.xbrl.org/2003/role/disclosureRef
-Topic 820
-SubTopic 10
-Name Accounting Standards Codification
-Section 50
-Paragraph 2
-Subparagraph (a)
-Publisher FASB
-URI https://asc.fasb.org//1943274/2147482106/820-10-50-2
Reference 2: http://www.xbrl.org/2003/role/disclosureRef
-Topic 820
-SubTopic 10
-Name Accounting Standards Codification
-Section 50
-Paragraph 2
-Subparagraph (b)
-Publisher FASB
-URI https://asc.fasb.org//1943274/2147482106/820-10-50-2
| Name: |
us-gaap_ScheduleOfFairValueAssetsAndLiabilitiesMeasuredOnRecurringBasisTableTextBlock |
| Namespace Prefix: |
us-gaap_ |
| Data Type: |
dtr-types:textBlockItemType |
| Balance Type: |
na |
| Period Type: |
duration |
|
v3.23.3
Segment Reporting (Tables)
|
9 Months Ended |
Sep. 30, 2023 |
|---|
| Segment Reporting [Abstract] |
|
| Schedule of Operating Activity of Reportable Segments |
The table below presents the operating activity of our reportable segments:
| | | | | | | | | | | | | | | | | | | | | | | | | (In thousands) | Three Months Ended September 30, | | Nine Months Ended September 30, | | 2023 | | 2022 | | 2023 | | 2022 | | Office Segment | | | | | | | | | Total office revenues | $ | 208,823 | | | $ | 207,927 | | | $ | 617,614 | | | $ | 616,744 | | | Office expenses | (74,631) | | | (74,653) | | | (220,261) | | | (212,006) | | | Office segment profit | 134,192 | | | 133,274 | | | 397,353 | | | 404,738 | | | | | | | | | | | Multifamily Segment | | | | | | | | | Total multifamily revenues | 46,586 | | | 45,736 | | | 143,595 | | | 122,771 | | | Multifamily expenses | (17,256) | | | (13,661) | | | (50,470) | | | (35,729) | | | Multifamily segment profit | 29,330 | | | 32,075 | | | 93,125 | | | 87,042 | | | | | | | | | | | Total profit from all segments | $ | 163,522 | | | $ | 165,349 | | | $ | 490,478 | | | $ | 491,780 | |
|
| Schedule of Reconciliation of Segment Profit to Net (Loss) Income Attributable to Common Stockholders |
The table below presents a reconciliation of the total profit from all segments to net (loss) income attributable to common stockholders:
| | | | | | | | | | | | | | | | | | | | | | | | | (In thousands) | Three Months Ended September 30, | | Nine Months Ended September 30, | | | 2023 | | 2022 | | 2023 | | 2022 | | | | | | | | | | Total profit from all segments | $ | 163,522 | | | $ | 165,349 | | | $ | 490,478 | | | $ | 491,780 | | | General and administrative expenses | (12,826) | | | (11,272) | | | (34,698) | | | (34,173) | | | Depreciation and amortization | (122,022) | | | (96,276) | | | (336,771) | | | (279,588) | | | Other income | 6,229 | | | 1,649 | | | 12,561 | | | 2,490 | | | Other expenses | (175) | | | (199) | | | (820) | | | (561) | | | Income from unconsolidated Fund | 290 | | | 356 | | | 1,177 | | | 921 | | | Interest expense | (56,043) | | | (38,394) | | | (151,859) | | | (109,560) | | | | | | | | | | | | | | | | | | | | | | | | | | | Net (loss) income | (21,025) | | | 21,213 | | | (19,932) | | | 71,309 | | | Net loss attributable to noncontrolling interests | 7,663 | | | 1,742 | | | 17,681 | | | 1,534 | | | Net (loss) income attributable to common stockholders | $ | (13,362) | | | $ | 22,955 | | | $ | (2,251) | | | $ | 72,843 | |
|
| X |
- DefinitionTabular disclosure of the reconciliation of profit (loss) from reportable segments to the consolidated income (loss) before income tax expense (benefit) and discontinued operations. Includes, but is not limited to, reconciliation after income tax if income tax is allocated to the reportable segment. Reference 1: http://fasb.org/us-gaap/role/ref/legacyRef
-Name Accounting Standards Codification
-Topic 280
-SubTopic 10
-Section 50
-Paragraph 31
-Publisher FASB
-URI https://asc.fasb.org//1943274/2147482810/280-10-50-31
Reference 2: http://fasb.org/us-gaap/role/ref/legacyRef
-Name Accounting Standards Codification
-Topic 280
-SubTopic 10
-Section 50
-Paragraph 30
-Subparagraph (b)
-Publisher FASB
-URI https://asc.fasb.org//1943274/2147482810/280-10-50-30
| Name: |
us-gaap_ReconciliationOfOperatingProfitLossFromSegmentsToConsolidatedTextBlock |
| Namespace Prefix: |
us-gaap_ |
| Data Type: |
dtr-types:textBlockItemType |
| Balance Type: |
na |
| Period Type: |
duration |
|
| X |
- DefinitionTabular disclosure of the profit or loss and total assets for each reportable segment. An entity discloses certain information on each reportable segment if the amounts (a) are included in the measure of segment profit or loss reviewed by the chief operating decision maker or (b) are otherwise regularly provided to the chief operating decision maker, even if not included in that measure of segment profit or loss. Reference 1: http://fasb.org/us-gaap/role/ref/legacyRef
-Name Accounting Standards Codification
-Topic 350
-SubTopic 20
-Section 50
-Paragraph 1
-Publisher FASB
-URI https://asc.fasb.org//1943274/2147482573/350-20-50-1
Reference 2: http://fasb.org/us-gaap/role/ref/legacyRef
-Name Accounting Standards Codification
-Topic 280
-SubTopic 10
-Section 50
-Paragraph 25
-Publisher FASB
-URI https://asc.fasb.org//1943274/2147482810/280-10-50-25
Reference 3: http://fasb.org/us-gaap/role/ref/legacyRef
-Name Accounting Standards Codification
-Topic 280
-SubTopic 10
-Section 50
-Paragraph 22
-Publisher FASB
-URI https://asc.fasb.org//1943274/2147482810/280-10-50-22
Reference 4: http://fasb.org/us-gaap/role/ref/legacyRef
-Name Accounting Standards Codification
-Topic 280
-SubTopic 10
-Section 50
-Paragraph 30
-Publisher FASB
-URI https://asc.fasb.org//1943274/2147482810/280-10-50-30
| Name: |
us-gaap_ScheduleOfSegmentReportingInformationBySegmentTextBlock |
| Namespace Prefix: |
us-gaap_ |
| Data Type: |
dtr-types:textBlockItemType |
| Balance Type: |
na |
| Period Type: |
duration |
|
| X |
- References
+ Details
| Name: |
us-gaap_SegmentReportingAbstract |
| Namespace Prefix: |
us-gaap_ |
| Data Type: |
xbrli:stringItemType |
| Balance Type: |
na |
| Period Type: |
duration |
|
v3.23.3
Future Minimum Lease Rental Receipts (Tables)
|
9 Months Ended |
Sep. 30, 2023 |
|---|
| Lessor Disclosure [Abstract] |
|
| Schedule of Future Minimum Base Rentals on Non-Cancelable Office and Ground Operating Leases |
The table below presents the future minimum base rentals on our non-cancelable office tenant and ground leases for our consolidated properties at September 30, 2023: | | | | | | | Twelve months ending September 30: | (In thousands) | | | | 2024 | $ | 616,384 | | | 2025 | 507,320 | | | 2026 | 405,771 | | | 2027 | 321,408 | | | 2028 | 231,391 | | | Thereafter | 678,380 | | Total future minimum base rentals(1) | $ | 2,760,654 | |
___________________________________ (1) Does not include (i) residential leases, which typically have a term of one year or less, (ii) holdover rent, (iii) other types of rent such as storage and antenna rent, (iv) tenant reimbursements, (v) straight-line rent, (vi) amortization/accretion of acquired above/below-market lease intangibles and (vii) percentage rents. The amounts assume that early termination options held by tenants will not be exercised.
|
| X |
- References
+ Details
| Name: |
us-gaap_LessorDisclosureAbstract |
| Namespace Prefix: |
us-gaap_ |
| Data Type: |
xbrli:stringItemType |
| Balance Type: |
na |
| Period Type: |
duration |
|
| X |
- DefinitionTabular disclosure of maturity of undiscounted cash flows to be received by lessor on annual basis for operating lease. Reference 1: http://www.xbrl.org/2009/role/commonPracticeRef
-Topic 842
-SubTopic 30
-Name Accounting Standards Codification
-Section 50
-Paragraph 12
-Publisher FASB
-URI https://asc.fasb.org//1943274/2147479773/842-30-50-12
| Name: |
us-gaap_LessorOperatingLeasePaymentsToBeReceivedMaturityTableTextBlock |
| Namespace Prefix: |
us-gaap_ |
| Data Type: |
dtr-types:textBlockItemType |
| Balance Type: |
na |
| Period Type: |
duration |
|
v3.23.3
Overview - Narrative (Details)
$ in Thousands, ft² in Millions |
Sep. 30, 2023
USD ($)
ft²
unit
parcel
venture
|
Dec. 31, 2022
USD ($)
|
Sep. 30, 2022
ft²
|
Apr. 26, 2022
unit
|
| Real Estate Properties [Line Items] |
|
|
|
|
| Consolidated debt |
$ 5,570,259
|
$ 5,220,902
|
|
|
| Number of joint ventures consolidated | venture |
4
|
|
|
|
| Total assets |
$ 9,846,079
|
9,747,446
|
|
|
| Consolidated investment in real estate |
8,827,141
|
8,993,608
|
|
|
| Total liabilities |
5,838,623
|
5,471,663
|
|
|
| Consolidated investment in real estate |
5,541,846
|
5,191,893
|
|
|
| Subsidiaries |
|
|
|
|
| Real Estate Properties [Line Items] |
|
|
|
|
| Consolidated debt |
3,760,259
|
3,410,902
|
|
|
| Consolidated entities |
|
|
|
|
| Real Estate Properties [Line Items] |
|
|
|
|
| Total assets |
3,900,000
|
3,940,000
|
|
|
| Consolidated investment in real estate |
3,490,000
|
3,540,000
|
|
|
| Total liabilities |
1,890,000
|
1,890,000
|
|
|
| Consolidated investment in real estate |
$ 1,810,000
|
$ 1,810,000
|
|
|
| Wholly owned and Consolidated properties |
|
|
|
|
| Real Estate Properties [Line Items] |
|
|
|
|
| Number of land parcels subject to ground lease | parcel |
2
|
|
|
|
| Office | Wholly owned and Consolidated properties |
|
|
|
|
| Real Estate Properties [Line Items] |
|
|
|
|
| Area of real estate portfolio (sq ft) | ft² |
17.6
|
|
|
|
| Office | Unconsolidated Fund properties |
|
|
|
|
| Real Estate Properties [Line Items] |
|
|
|
|
| Area of real estate portfolio (sq ft) | ft² |
0.4
|
|
0.4
|
|
| Multifamily |
|
|
|
|
| Real Estate Properties [Line Items] |
|
|
|
|
| Number of multifamily apartment units | unit |
|
|
|
120
|
| Multifamily | Wholly owned and Consolidated properties |
|
|
|
|
| Real Estate Properties [Line Items] |
|
|
|
|
| Number of multifamily apartment units | unit |
4,594
|
|
|
|
| X |
- DefinitionArea Of Real Estate Portfolio
| Name: |
nysedei_AreaOfRealEstatePortfolio |
| Namespace Prefix: |
nysedei_ |
| Data Type: |
dtr-types1:areaItemType |
| Balance Type: |
na |
| Period Type: |
instant |
|
| X |
- DefinitionNumber Of Joint Ventures Consolidated
| Name: |
nysedei_NumberOfJointVenturesConsolidated |
| Namespace Prefix: |
nysedei_ |
| Data Type: |
xbrli:integerItemType |
| Balance Type: |
na |
| Period Type: |
instant |
|
| X |
- DefinitionNumber Of Units In Real Estate Portfolio
| Name: |
nysedei_NumberOfUnitsInRealEstatePortfolio |
| Namespace Prefix: |
nysedei_ |
| Data Type: |
xbrli:integerItemType |
| Balance Type: |
na |
| Period Type: |
instant |
|
| X |
- DefinitionSum of the carrying amounts as of the balance sheet date of all assets that are recognized. Assets are probable future economic benefits obtained or controlled by an entity as a result of past transactions or events. Reference 1: http://www.xbrl.org/2003/role/disclosureRef
-Topic 810
-SubTopic 10
-Name Accounting Standards Codification
-Section 50
-Paragraph 3
-Subparagraph (bb)
-Publisher FASB
-URI https://asc.fasb.org//1943274/2147481203/810-10-50-3
Reference 2: http://www.xbrl.org/2003/role/disclosureRef
-Topic 810
-SubTopic 10
-Name Accounting Standards Codification
-Section 45
-Paragraph 25
-Subparagraph (a)
-Publisher FASB
-URI https://asc.fasb.org//1943274/2147481231/810-10-45-25
Reference 3: http://www.xbrl.org/2003/role/disclosureRef
-Topic 235
-SubTopic 10
-Name Accounting Standards Codification
-Section S99
-Paragraph 1
-Subparagraph (SX 210.4-08(g)(1)(ii))
-Publisher FASB
-URI https://asc.fasb.org//1943274/2147480678/235-10-S99-1
Reference 4: http://www.xbrl.org/2003/role/disclosureRef
-Topic 323
-SubTopic 10
-Name Accounting Standards Codification
-Section 50
-Paragraph 3
-Subparagraph (c)
-Publisher FASB
-URI https://asc.fasb.org//1943274/2147481687/323-10-50-3
Reference 5: http://www.xbrl.org/2003/role/disclosureRef
-Topic 825
-SubTopic 10
-Name Accounting Standards Codification
-Section 50
-Paragraph 28
-Subparagraph (f)
-Publisher FASB
-URI https://asc.fasb.org//1943274/2147482907/825-10-50-28
Reference 6: http://www.xbrl.org/2003/role/exampleRef
-Topic 852
-SubTopic 10
-Name Accounting Standards Codification
-Section 55
-Paragraph 10
-Publisher FASB
-URI https://asc.fasb.org//1943274/2147481372/852-10-55-10
Reference 7: http://www.xbrl.org/2003/role/exampleRef
-Topic 946
-SubTopic 830
-Name Accounting Standards Codification
-Section 55
-Paragraph 12
-Publisher FASB
-URI https://asc.fasb.org//1943274/2147480167/946-830-55-12
Reference 8: http://www.xbrl.org/2003/role/disclosureRef
-Topic 944
-SubTopic 210
-Name Accounting Standards Codification
-Section S99
-Paragraph 1
-Subparagraph (SX 210.7-03(a)(12))
-Publisher FASB
-URI https://asc.fasb.org//1943274/2147479440/944-210-S99-1
Reference 9: http://www.xbrl.org/2003/role/disclosureRef
-Topic 280
-SubTopic 10
-Name Accounting Standards Codification
-Section 50
-Paragraph 22
-Publisher FASB
-URI https://asc.fasb.org//1943274/2147482810/280-10-50-22
Reference 10: http://www.xbrl.org/2003/role/disclosureRef
-Topic 946
-SubTopic 210
-Name Accounting Standards Codification
-Section S99
-Paragraph 1
-Subparagraph (SX 210.6-04(8))
-Publisher FASB
-URI https://asc.fasb.org//1943274/2147479617/946-210-S99-1
Reference 11: http://www.xbrl.org/2003/role/disclosureRef
-Topic 210
-SubTopic 10
-Name Accounting Standards Codification
-Section S99
-Paragraph 1
-Subparagraph (SX 210.5-02(18))
-Publisher FASB
-URI https://asc.fasb.org//1943274/2147480566/210-10-S99-1
Reference 12: http://www.xbrl.org/2003/role/disclosureRef
-Topic 470
-SubTopic 10
-Name Accounting Standards Codification
-Section S99
-Paragraph 1A
-Subparagraph (SX 210.13-01(a)(4)(i))
-Publisher FASB
-URI https://asc.fasb.org//1943274/2147480097/470-10-S99-1A
Reference 13: http://www.xbrl.org/2009/role/commonPracticeRef
-Topic 470
-SubTopic 10
-Name Accounting Standards Codification
-Section S99
-Paragraph 1A
-Subparagraph (SX 210.13-01(a)(4)(ii))
-Publisher FASB
-URI https://asc.fasb.org//1943274/2147480097/470-10-S99-1A
Reference 14: http://www.xbrl.org/2009/role/commonPracticeRef
-Topic 470
-SubTopic 10
-Name Accounting Standards Codification
-Section S99
-Paragraph 1A
-Subparagraph (SX 210.13-01(a)(4)(iii))
-Publisher FASB
-URI https://asc.fasb.org//1943274/2147480097/470-10-S99-1A
Reference 15: http://www.xbrl.org/2003/role/disclosureRef
-Topic 470
-SubTopic 10
-Name Accounting Standards Codification
-Section S99
-Paragraph 1A
-Subparagraph (SX 210.13-01(a)(4)(iii)(A))
-Publisher FASB
-URI https://asc.fasb.org//1943274/2147480097/470-10-S99-1A
Reference 16: http://www.xbrl.org/2003/role/disclosureRef
-Topic 470
-SubTopic 10
-Name Accounting Standards Codification
-Section S99
-Paragraph 1A
-Subparagraph (SX 210.13-01(a)(4)(iv))
-Publisher FASB
-URI https://asc.fasb.org//1943274/2147480097/470-10-S99-1A
Reference 17: http://www.xbrl.org/2003/role/disclosureRef
-Topic 470
-SubTopic 10
-Name Accounting Standards Codification
-Section S99
-Paragraph 1A
-Subparagraph (SX 210.13-01(a)(5))
-Publisher FASB
-URI https://asc.fasb.org//1943274/2147480097/470-10-S99-1A
Reference 18: http://www.xbrl.org/2003/role/disclosureRef
-Topic 470
-SubTopic 10
-Name Accounting Standards Codification
-Section S99
-Paragraph 1B
-Subparagraph (SX 210.13-02(a)(4)(i))
-Publisher FASB
-URI https://asc.fasb.org//1943274/2147480097/470-10-S99-1B
Reference 19: http://www.xbrl.org/2003/role/disclosureRef
-Topic 470
-SubTopic 10
-Name Accounting Standards Codification
-Section S99
-Paragraph 1B
-Subparagraph (SX 210.13-02(a)(4)(iii)(A))
-Publisher FASB
-URI https://asc.fasb.org//1943274/2147480097/470-10-S99-1B
Reference 20: http://www.xbrl.org/2003/role/disclosureRef
-Topic 470
-SubTopic 10
-Name Accounting Standards Codification
-Section S99
-Paragraph 1B
-Subparagraph (SX 210.13-02(a)(4)(iii)(B))
-Publisher FASB
-URI https://asc.fasb.org//1943274/2147480097/470-10-S99-1B
Reference 21: http://www.xbrl.org/2003/role/disclosureRef
-Topic 470
-SubTopic 10
-Name Accounting Standards Codification
-Section S99
-Paragraph 1B
-Subparagraph (SX 210.13-02(a)(4)(iv))
-Publisher FASB
-URI https://asc.fasb.org//1943274/2147480097/470-10-S99-1B
Reference 22: http://www.xbrl.org/2003/role/disclosureRef
-Topic 470
-SubTopic 10
-Name Accounting Standards Codification
-Section S99
-Paragraph 1B
-Subparagraph (SX 210.13-02(a)(5))
-Publisher FASB
-URI https://asc.fasb.org//1943274/2147480097/470-10-S99-1B
Reference 23: http://www.xbrl.org/2009/role/commonPracticeRef
-Topic 852
-SubTopic 10
-Name Accounting Standards Codification
-Section 50
-Paragraph 7
-Subparagraph (a)
-Publisher FASB
-URI https://asc.fasb.org//1943274/2147481404/852-10-50-7
Reference 24: http://www.xbrl.org/2003/role/disclosureRef
-Topic 280
-SubTopic 10
-Name Accounting Standards Codification
-Section 50
-Paragraph 30
-Subparagraph (c)
-Publisher FASB
-URI https://asc.fasb.org//1943274/2147482810/280-10-50-30
Reference 25: http://www.xbrl.org/2003/role/disclosureRef
-Topic 280
-SubTopic 10
-Name Accounting Standards Codification
-Section 50
-Paragraph 32
-Subparagraph (d)
-Publisher FASB
-URI https://asc.fasb.org//1943274/2147482810/280-10-50-32
Reference 26: http://fasb.org/us-gaap/role/ref/legacyRef
-Topic 942
-SubTopic 210
-Name Accounting Standards Codification
-Section S99
-Paragraph 1
-Subparagraph (SX 210.9-03(11))
-Publisher FASB
-URI https://asc.fasb.org//1943274/2147479853/942-210-S99-1
| Name: |
us-gaap_Assets |
| Namespace Prefix: |
us-gaap_ |
| Data Type: |
xbrli:monetaryItemType |
| Balance Type: |
debit |
| Period Type: |
instant |
|
| X |
- DefinitionAmount, before unamortized (discount) premium and debt issuance costs, of long-term debt. Includes, but is not limited to, notes payable, bonds payable, commercial loans, mortgage loans, convertible debt, subordinated debt and other types of debt. Reference 1: http://fasb.org/us-gaap/role/ref/legacyRef
-Name Accounting Standards Codification
-Section S99
-Paragraph 1
-Subparagraph (SX 210.5-02(22))
-SubTopic 10
-Topic 210
-Publisher FASB
-URI https://asc.fasb.org//1943274/2147480566/210-10-S99-1
Reference 2: http://fasb.org/us-gaap/role/ref/legacyRef
-Topic 942
-SubTopic 210
-Name Accounting Standards Codification
-Section S99
-Paragraph 1
-Subparagraph (SX 210.9-03(16))
-Publisher FASB
-URI https://asc.fasb.org//1943274/2147479853/942-210-S99-1
Reference 3: http://www.xbrl.org/2003/role/disclosureRef
-Topic 470
-SubTopic 20
-Name Accounting Standards Codification
-Section 50
-Paragraph 4
-Subparagraph (b)(1)
-Publisher FASB
-URI https://asc.fasb.org//1943274/2147481139/470-20-50-4
| Name: |
us-gaap_DebtInstrumentCarryingAmount |
| Namespace Prefix: |
us-gaap_ |
| Data Type: |
xbrli:monetaryItemType |
| Balance Type: |
credit |
| Period Type: |
instant |
|
| X |
- DefinitionSum of the carrying amounts as of the balance sheet date of all liabilities that are recognized. Liabilities are probable future sacrifices of economic benefits arising from present obligations of an entity to transfer assets or provide services to other entities in the future. Reference 1: http://www.xbrl.org/2003/role/disclosureRef
-Topic 810
-SubTopic 10
-Name Accounting Standards Codification
-Section 50
-Paragraph 3
-Subparagraph (c)
-Publisher FASB
-URI https://asc.fasb.org//1943274/2147481203/810-10-50-3
Reference 2: http://www.xbrl.org/2003/role/disclosureRef
-Topic 810
-SubTopic 10
-Name Accounting Standards Codification
-Section 45
-Paragraph 25
-Subparagraph (b)
-Publisher FASB
-URI https://asc.fasb.org//1943274/2147481231/810-10-45-25
Reference 3: http://www.xbrl.org/2003/role/disclosureRef
-Topic 810
-SubTopic 10
-Name Accounting Standards Codification
-Section 50
-Paragraph 3
-Subparagraph (bb)
-Publisher FASB
-URI https://asc.fasb.org//1943274/2147481203/810-10-50-3
Reference 4: http://www.xbrl.org/2003/role/disclosureRef
-Topic 235
-SubTopic 10
-Name Accounting Standards Codification
-Section S99
-Paragraph 1
-Subparagraph (SX 210.4-08(g)(1)(ii))
-Publisher FASB
-URI https://asc.fasb.org//1943274/2147480678/235-10-S99-1
Reference 5: http://www.xbrl.org/2003/role/disclosureRef
-Topic 323
-SubTopic 10
-Name Accounting Standards Codification
-Section 50
-Paragraph 3
-Subparagraph (c)
-Publisher FASB
-URI https://asc.fasb.org//1943274/2147481687/323-10-50-3
Reference 6: http://www.xbrl.org/2003/role/disclosureRef
-Topic 825
-SubTopic 10
-Name Accounting Standards Codification
-Section 50
-Paragraph 28
-Subparagraph (f)
-Publisher FASB
-URI https://asc.fasb.org//1943274/2147482907/825-10-50-28
Reference 7: http://www.xbrl.org/2003/role/exampleRef
-Topic 946
-SubTopic 830
-Name Accounting Standards Codification
-Section 55
-Paragraph 12
-Publisher FASB
-URI https://asc.fasb.org//1943274/2147480167/946-830-55-12
Reference 8: http://www.xbrl.org/2003/role/disclosureRef
-Topic 946
-SubTopic 210
-Name Accounting Standards Codification
-Section S99
-Paragraph 1
-Subparagraph (SX 210.6-04(14))
-Publisher FASB
-URI https://asc.fasb.org//1943274/2147479617/946-210-S99-1
Reference 9: http://www.xbrl.org/2003/role/disclosureRef
-Topic 470
-SubTopic 10
-Name Accounting Standards Codification
-Section S99
-Paragraph 1A
-Subparagraph (SX 210.13-01(a)(4)(i))
-Publisher FASB
-URI https://asc.fasb.org//1943274/2147480097/470-10-S99-1A
Reference 10: http://www.xbrl.org/2009/role/commonPracticeRef
-Topic 470
-SubTopic 10
-Name Accounting Standards Codification
-Section S99
-Paragraph 1A
-Subparagraph (SX 210.13-01(a)(4)(ii))
-Publisher FASB
-URI https://asc.fasb.org//1943274/2147480097/470-10-S99-1A
Reference 11: http://www.xbrl.org/2003/role/disclosureRef
-Topic 470
-SubTopic 10
-Name Accounting Standards Codification
-Section S99
-Paragraph 1A
-Subparagraph (SX 210.13-01(a)(4)(iii)(A))
-Publisher FASB
-URI https://asc.fasb.org//1943274/2147480097/470-10-S99-1A
Reference 12: http://www.xbrl.org/2003/role/disclosureRef
-Topic 470
-SubTopic 10
-Name Accounting Standards Codification
-Section S99
-Paragraph 1A
-Subparagraph (SX 210.13-01(a)(4)(iv))
-Publisher FASB
-URI https://asc.fasb.org//1943274/2147480097/470-10-S99-1A
Reference 13: http://www.xbrl.org/2003/role/disclosureRef
-Topic 470
-SubTopic 10
-Name Accounting Standards Codification
-Section S99
-Paragraph 1A
-Subparagraph (SX 210.13-01(a)(5))
-Publisher FASB
-URI https://asc.fasb.org//1943274/2147480097/470-10-S99-1A
Reference 14: http://www.xbrl.org/2003/role/disclosureRef
-Topic 470
-SubTopic 10
-Name Accounting Standards Codification
-Section S99
-Paragraph 1B
-Subparagraph (SX 210.13-02(a)(4)(i))
-Publisher FASB
-URI https://asc.fasb.org//1943274/2147480097/470-10-S99-1B
Reference 15: http://www.xbrl.org/2003/role/disclosureRef
-Topic 470
-SubTopic 10
-Name Accounting Standards Codification
-Section S99
-Paragraph 1B
-Subparagraph (SX 210.13-02(a)(4)(iii)(A))
-Publisher FASB
-URI https://asc.fasb.org//1943274/2147480097/470-10-S99-1B
Reference 16: http://www.xbrl.org/2003/role/disclosureRef
-Topic 470
-SubTopic 10
-Name Accounting Standards Codification
-Section S99
-Paragraph 1B
-Subparagraph (SX 210.13-02(a)(4)(iii)(B))
-Publisher FASB
-URI https://asc.fasb.org//1943274/2147480097/470-10-S99-1B
Reference 17: http://www.xbrl.org/2003/role/disclosureRef
-Topic 470
-SubTopic 10
-Name Accounting Standards Codification
-Section S99
-Paragraph 1B
-Subparagraph (SX 210.13-02(a)(4)(iv))
-Publisher FASB
-URI https://asc.fasb.org//1943274/2147480097/470-10-S99-1B
Reference 18: http://www.xbrl.org/2003/role/disclosureRef
-Topic 470
-SubTopic 10
-Name Accounting Standards Codification
-Section S99
-Paragraph 1B
-Subparagraph (SX 210.13-02(a)(5))
-Publisher FASB
-URI https://asc.fasb.org//1943274/2147480097/470-10-S99-1B
Reference 19: http://www.xbrl.org/2009/role/commonPracticeRef
-Topic 852
-SubTopic 10
-Name Accounting Standards Codification
-Section 50
-Paragraph 7
-Subparagraph (a)
-Publisher FASB
-URI https://asc.fasb.org//1943274/2147481404/852-10-50-7
Reference 20: http://www.xbrl.org/2009/role/commonPracticeRef
-Topic 852
-SubTopic 10
-Name Accounting Standards Codification
-Section 50
-Paragraph 7
-Subparagraph (b)
-Publisher FASB
-URI https://asc.fasb.org//1943274/2147481404/852-10-50-7
Reference 21: http://www.xbrl.org/2003/role/exampleRef
-Topic 280
-SubTopic 10
-Name Accounting Standards Codification
-Section 50
-Paragraph 30
-Subparagraph (d)
-Publisher FASB
-URI https://asc.fasb.org//1943274/2147482810/280-10-50-30
Reference 22: http://fasb.org/us-gaap/role/ref/legacyRef
-Name Accounting Standards Codification
-Topic 210
-SubTopic 10
-Section S99
-Paragraph 1
-Subparagraph (SX 210.5-02.19-26)
-Publisher FASB
-URI https://asc.fasb.org//1943274/2147480566/210-10-S99-1
| Name: |
us-gaap_Liabilities |
| Namespace Prefix: |
us-gaap_ |
| Data Type: |
xbrli:monetaryItemType |
| Balance Type: |
credit |
| Period Type: |
instant |
|
| X |
- DefinitionAmount, after deduction of unamortized premium (discount) and debt issuance cost, of long-term debt. Excludes lease obligation. Reference 1: http://fasb.org/us-gaap/role/ref/legacyRef
-Name Accounting Standards Codification
-Section S99
-Paragraph 1
-Subparagraph (SX 210.5-02(22))
-SubTopic 10
-Topic 210
-Publisher FASB
-URI https://asc.fasb.org//1943274/2147480566/210-10-S99-1
Reference 2: http://www.xbrl.org/2003/role/exampleRef
-Topic 470
-SubTopic 20
-Name Accounting Standards Codification
-Section 55
-Paragraph 69B
-Publisher FASB
-URI https://asc.fasb.org//1943274/2147481568/470-20-55-69B
Reference 3: http://www.xbrl.org/2003/role/exampleRef
-Topic 470
-SubTopic 20
-Name Accounting Standards Codification
-Section 55
-Paragraph 69C
-Publisher FASB
-URI https://asc.fasb.org//1943274/2147481568/470-20-55-69C
Reference 4: http://www.xbrl.org/2003/role/disclosureRef
-Topic 470
-SubTopic 20
-Name Accounting Standards Codification
-Section 50
-Paragraph 1D
-Subparagraph (b)
-Publisher FASB
-URI https://asc.fasb.org//1943274/2147481139/470-20-50-1D
Reference 5: http://www.xbrl.org/2009/role/commonPracticeRef
-Topic 944
-SubTopic 210
-Name Accounting Standards Codification
-Section S99
-Paragraph 1
-Subparagraph (SX 210.7-03(a)(16)(a)(2))
-Publisher FASB
-URI https://asc.fasb.org//1943274/2147479440/944-210-S99-1
Reference 6: http://fasb.org/us-gaap/role/ref/legacyRef
-Topic 942
-SubTopic 210
-Name Accounting Standards Codification
-Section S99
-Paragraph 1
-Subparagraph (SX 210.9-03(16))
-Publisher FASB
-URI https://asc.fasb.org//1943274/2147479853/942-210-S99-1
Reference 7: http://www.xbrl.org/2003/role/disclosureRef
-Topic 470
-SubTopic 20
-Name Accounting Standards Codification
-Section 50
-Paragraph 4
-Subparagraph (b)(3)
-Publisher FASB
-URI https://asc.fasb.org//1943274/2147481139/470-20-50-4
| Name: |
us-gaap_LongTermDebt |
| Namespace Prefix: |
us-gaap_ |
| Data Type: |
xbrli:monetaryItemType |
| Balance Type: |
credit |
| Period Type: |
instant |
|
| X |
- DefinitionNumber of separate real estate development properties located on land subject to ground leases. Reference 1: http://www.xbrl.org/2009/role/commonPracticeRef
-Topic 842
-SubTopic 20
-Name Accounting Standards Codification
-Section 50
-Paragraph 3
-Subparagraph (a)(1)
-Publisher FASB
-URI https://asc.fasb.org//1943274/2147478964/842-20-50-3
| Name: |
us-gaap_NumberOfPropertiesSubjectToGroundLeases |
| Namespace Prefix: |
us-gaap_ |
| Data Type: |
xbrli:integerItemType |
| Balance Type: |
na |
| Period Type: |
instant |
|
| X |
- DefinitionAmount of real estate investment property, net of accumulated depreciation, which may include the following: (1) land available-for-sale; (2) land available-for-development; (3) investments in building and building improvements; (4) tenant allowances; (5) developments in-process; (6) rental properties; and (7) other real estate investments. Reference 1: http://www.xbrl.org/2009/role/commonPracticeRef
-Topic 944
-SubTopic 210
-Name Accounting Standards Codification
-Section S99
-Paragraph 1
-Subparagraph (SX 210.7-03(a)(1)(d))
-Publisher FASB
-URI https://asc.fasb.org//1943274/2147479440/944-210-S99-1
| Name: |
us-gaap_RealEstateInvestmentPropertyNet |
| Namespace Prefix: |
us-gaap_ |
| Data Type: |
xbrli:monetaryItemType |
| Balance Type: |
debit |
| Period Type: |
instant |
|
| X |
- DefinitionLine items represent financial concepts included in a table. These concepts are used to disclose reportable information associated with domain members defined in one or many axes to the table.
| Name: |
us-gaap_RealEstatePropertiesLineItems |
| Namespace Prefix: |
us-gaap_ |
| Data Type: |
xbrli:stringItemType |
| Balance Type: |
na |
| Period Type: |
duration |
|
| X |
- Details
| Name: |
srt_ConsolidatedEntitiesAxis=srt_SubsidiariesMember |
| Namespace Prefix: |
|
| Data Type: |
na |
| Balance Type: |
|
| Period Type: |
|
|
| X |
- Details
| Name: |
srt_ConsolidatedEntitiesAxis=nysedei_SubsidiariesAndJointVenturesMember |
| Namespace Prefix: |
|
| Data Type: |
na |
| Balance Type: |
|
| Period Type: |
|
|
| X |
- Details
| Name: |
us-gaap_RealEstatePropertiesAxis=nysedei_WhollyOwnedAndConsolidatedPropertiesMember |
| Namespace Prefix: |
|
| Data Type: |
na |
| Balance Type: |
|
| Period Type: |
|
|
| X |
- Details
| Name: |
srt_MortgageLoansOnRealEstateDescriptionTypeOfPropertyAxis=srt_OfficeBuildingMember |
| Namespace Prefix: |
|
| Data Type: |
na |
| Balance Type: |
|
| Period Type: |
|
|
| X |
- Details
| Name: |
us-gaap_RealEstatePropertiesAxis=us-gaap_UnconsolidatedPropertiesMember |
| Namespace Prefix: |
|
| Data Type: |
na |
| Balance Type: |
|
| Period Type: |
|
|
| X |
- Details
| Name: |
srt_MortgageLoansOnRealEstateDescriptionTypeOfPropertyAxis=srt_MultifamilyMember |
| Namespace Prefix: |
|
| Data Type: |
na |
| Balance Type: |
|
| Period Type: |
|
|
v3.23.3
| X |
- DefinitionThe number of real estate properties owned as of the balance sheet date.
| Name: |
us-gaap_NumberOfRealEstateProperties |
| Namespace Prefix: |
us-gaap_ |
| Data Type: |
xbrli:integerItemType |
| Balance Type: |
na |
| Period Type: |
instant |
|
| X |
- DefinitionLine items represent financial concepts included in a table. These concepts are used to disclose reportable information associated with domain members defined in one or many axes to the table.
| Name: |
us-gaap_RealEstatePropertiesLineItems |
| Namespace Prefix: |
us-gaap_ |
| Data Type: |
xbrli:stringItemType |
| Balance Type: |
na |
| Period Type: |
duration |
|
| X |
- Details
| Name: |
srt_MortgageLoansOnRealEstateDescriptionTypeOfPropertyAxis=srt_OfficeBuildingMember |
| Namespace Prefix: |
|
| Data Type: |
na |
| Balance Type: |
|
| Period Type: |
|
|
| X |
- Details
| Name: |
us-gaap_RealEstatePropertiesAxis=us-gaap_WhollyOwnedPropertiesMember |
| Namespace Prefix: |
|
| Data Type: |
na |
| Balance Type: |
|
| Period Type: |
|
|
| X |
- Details
| Name: |
us-gaap_RealEstatePropertiesAxis=us-gaap_ConsolidatedPropertiesMember |
| Namespace Prefix: |
|
| Data Type: |
na |
| Balance Type: |
|
| Period Type: |
|
|
| X |
- Details
| Name: |
us-gaap_RealEstatePropertiesAxis=us-gaap_UnconsolidatedPropertiesMember |
| Namespace Prefix: |
|
| Data Type: |
na |
| Balance Type: |
|
| Period Type: |
|
|
| X |
- Details
| Name: |
srt_MortgageLoansOnRealEstateDescriptionTypeOfPropertyAxis=srt_MultifamilyMember |
| Namespace Prefix: |
|
| Data Type: |
na |
| Balance Type: |
|
| Period Type: |
|
|
| X |
- Details
| Name: |
srt_ConsolidationItemsAxis=srt_ReportableLegalEntitiesMember |
| Namespace Prefix: |
|
| Data Type: |
na |
| Balance Type: |
|
| Period Type: |
|
|
v3.23.3
| X |
- Definition
+ References
+ Details
| Name: |
nysedei_ParkingReceivables |
| Namespace Prefix: |
nysedei_ |
| Data Type: |
xbrli:monetaryItemType |
| Balance Type: |
debit |
| Period Type: |
instant |
|
| X |
- DefinitionRevenues, Amount Restored, Previously Uncollectable
| Name: |
nysedei_RevenuesAmountRestoredPreviouslyUncollectable |
| Namespace Prefix: |
nysedei_ |
| Data Type: |
xbrli:monetaryItemType |
| Balance Type: |
credit |
| Period Type: |
duration |
|
| X |
- DefinitionRevenues, Charge For Uncollectible Amounts
| Name: |
nysedei_RevenuesChargeForUncollectibleAmounts |
| Namespace Prefix: |
nysedei_ |
| Data Type: |
xbrli:monetaryItemType |
| Balance Type: |
debit |
| Period Type: |
duration |
|
| X |
- DefinitionLine items represent financial concepts included in a table. These concepts are used to disclose reportable information associated with domain members defined in one or many axes to the table.
| Name: |
us-gaap_RealEstatePropertiesLineItems |
| Namespace Prefix: |
us-gaap_ |
| Data Type: |
xbrli:stringItemType |
| Balance Type: |
na |
| Period Type: |
duration |
|
| X |
- DefinitionAmount, excluding tax collected from customer, of revenue from satisfaction of performance obligation by transferring promised good or service to customer. Tax collected from customer is tax assessed by governmental authority that is both imposed on and concurrent with specific revenue-producing transaction, including, but not limited to, sales, use, value added and excise. Reference 1: http://www.xbrl.org/2003/role/disclosureRef
-Topic 924
-SubTopic 10
-Name Accounting Standards Codification
-Section S99
-Paragraph 1
-Subparagraph (SAB Topic 11.L)
-Publisher FASB
-URI https://asc.fasb.org//1943274/2147479941/924-10-S99-1
Reference 2: http://www.xbrl.org/2003/role/disclosureRef
-Topic 606
-SubTopic 10
-Name Accounting Standards Codification
-Section 50
-Paragraph 5
-Publisher FASB
-URI https://asc.fasb.org//1943274/2147479806/606-10-50-5
Reference 3: http://www.xbrl.org/2003/role/disclosureRef
-Topic 280
-SubTopic 10
-Name Accounting Standards Codification
-Section 50
-Paragraph 30
-Subparagraph (a)
-Publisher FASB
-URI https://asc.fasb.org//1943274/2147482810/280-10-50-30
Reference 4: http://www.xbrl.org/2003/role/disclosureRef
-Topic 280
-SubTopic 10
-Name Accounting Standards Codification
-Section 50
-Paragraph 42
-Publisher FASB
-URI https://asc.fasb.org//1943274/2147482810/280-10-50-42
Reference 5: http://www.xbrl.org/2003/role/disclosureRef
-Topic 280
-SubTopic 10
-Name Accounting Standards Codification
-Section 50
-Paragraph 22
-Subparagraph (b)
-Publisher FASB
-URI https://asc.fasb.org//1943274/2147482810/280-10-50-22
Reference 6: http://www.xbrl.org/2003/role/disclosureRef
-Topic 280
-SubTopic 10
-Name Accounting Standards Codification
-Section 50
-Paragraph 32
-Subparagraph (b)
-Publisher FASB
-URI https://asc.fasb.org//1943274/2147482810/280-10-50-32
Reference 7: http://www.xbrl.org/2003/role/disclosureRef
-Topic 280
-SubTopic 10
-Name Accounting Standards Codification
-Section 50
-Paragraph 40
-Publisher FASB
-URI https://asc.fasb.org//1943274/2147482810/280-10-50-40
Reference 8: http://www.xbrl.org/2003/role/disclosureRef
-Topic 280
-SubTopic 10
-Name Accounting Standards Codification
-Section 50
-Paragraph 22
-Subparagraph (a)
-Publisher FASB
-URI https://asc.fasb.org//1943274/2147482810/280-10-50-22
Reference 9: http://www.xbrl.org/2003/role/disclosureRef
-Topic 280
-SubTopic 10
-Name Accounting Standards Codification
-Section 50
-Paragraph 32
-Subparagraph (a)
-Publisher FASB
-URI https://asc.fasb.org//1943274/2147482810/280-10-50-32
Reference 10: http://www.xbrl.org/2003/role/disclosureRef
-Topic 280
-SubTopic 10
-Name Accounting Standards Codification
-Section 50
-Paragraph 41
-Subparagraph (a)
-Publisher FASB
-URI https://asc.fasb.org//1943274/2147482810/280-10-50-41
Reference 11: http://www.xbrl.org/2003/role/disclosureRef
-Topic 606
-SubTopic 10
-Name Accounting Standards Codification
-Section 50
-Paragraph 4
-Subparagraph (a)
-Publisher FASB
-URI https://asc.fasb.org//1943274/2147479806/606-10-50-4
| Name: |
us-gaap_RevenueFromContractWithCustomerExcludingAssessedTax |
| Namespace Prefix: |
us-gaap_ |
| Data Type: |
xbrli:monetaryItemType |
| Balance Type: |
credit |
| Period Type: |
duration |
|
| X |
- Details
| Name: |
srt_ProductOrServiceAxis=nysedei_OfficeRevenuesMember |
| Namespace Prefix: |
|
| Data Type: |
na |
| Balance Type: |
|
| Period Type: |
|
|
v3.23.3
Investment in Real Estate - Summary of Investment in Real Estate (Details) - USD ($)
$ in Thousands |
Sep. 30, 2023 |
Dec. 31, 2022 |
| Schedule Of Asset Acquisitions [Line Items] |
|
|
| Land |
$ 1,185,977
|
$ 1,185,977
|
| Buildings and improvements |
10,118,965
|
10,055,499
|
| Tenant improvements and lease intangibles |
1,011,310
|
981,460
|
| Property under development |
69,225
|
70,037
|
| Investment in real estate, gross |
12,385,477
|
$ 12,292,973
|
| Building Improvements |
|
|
| Schedule Of Asset Acquisitions [Line Items] |
|
|
| Property under development balances transferred to Building and improvements for real estate placed into service |
$ 34,000
|
|
| X |
- DefinitionDevelopment Placed Into Service
| Name: |
nysedei_DevelopmentPlacedIntoService |
| Namespace Prefix: |
nysedei_ |
| Data Type: |
xbrli:monetaryItemType |
| Balance Type: |
debit |
| Period Type: |
instant |
|
| X |
- Definition[Line Items] for Schedule Of Asset Acquisitions [Table]
| Name: |
nysedei_ScheduleOfAssetAcquisitionsLineItems |
| Namespace Prefix: |
nysedei_ |
| Data Type: |
xbrli:stringItemType |
| Balance Type: |
na |
| Period Type: |
duration |
|
| X |
- DefinitionCarrying amount as of the balance sheet date of the following: (1) improvements having a life longer than one year that were made for the benefit of one or more tenants, (2) costs incurred by the lesser that are (a) costs to originate a lease incurred in transactions with independent third parties that (i) result directly from and are essential to acquire that lease and (ii) would not have been incurred had that leasing transaction not occurred and (b) certain costs directly related to specified activities performed by the lesser for that lease. Those activities are: evaluating the prospective lessee's financial condition; evaluating and recording guarantees, collateral, and other security arrangements; negotiating lease terms; preparing and processing lease documents and closing the transaction; and (3) the value allocated at acquisition to lease agreements which exist at acquisition of leased property, which excludes the market adjustment component of the value assigned for above or below-market leases acquired.
| Name: |
nysedei_TenantImprovementsAndLeaseIntangibles |
| Namespace Prefix: |
nysedei_ |
| Data Type: |
xbrli:monetaryItemType |
| Balance Type: |
debit |
| Period Type: |
instant |
|
| X |
- DefinitionThe current amount of expenditures for a real estate project that has not yet been completed. Reference 1: http://www.xbrl.org/2009/role/commonPracticeRef
-Topic 944
-SubTopic 210
-Name Accounting Standards Codification
-Section S99
-Paragraph 1
-Subparagraph (SX 210.7-03(a)(1)(d))
-Publisher FASB
-URI https://asc.fasb.org//1943274/2147479440/944-210-S99-1
| Name: |
us-gaap_DevelopmentInProcess |
| Namespace Prefix: |
us-gaap_ |
| Data Type: |
xbrli:monetaryItemType |
| Balance Type: |
debit |
| Period Type: |
instant |
|
| X |
- DefinitionAggregate of the carrying amounts as of the balance sheet date of investments in building and building improvements. Reference 1: http://www.xbrl.org/2009/role/commonPracticeRef
-Topic 944
-SubTopic 210
-Name Accounting Standards Codification
-Section S99
-Paragraph 1
-Subparagraph (SX 210.7-03(a)(1)(d))
-Publisher FASB
-URI https://asc.fasb.org//1943274/2147479440/944-210-S99-1
| Name: |
us-gaap_InvestmentBuildingAndBuildingImprovements |
| Namespace Prefix: |
us-gaap_ |
| Data Type: |
xbrli:monetaryItemType |
| Balance Type: |
debit |
| Period Type: |
instant |
|
| X |
- DefinitionAmount before accumulated depletion of real estate held for productive use, excluding land held for sale. Reference 1: http://www.xbrl.org/2009/role/commonPracticeRef
-Topic 210
-SubTopic 10
-Name Accounting Standards Codification
-Section S99
-Paragraph 1
-Subparagraph (SX 210.5-02(13))
-Publisher FASB
-URI https://asc.fasb.org//1943274/2147480566/210-10-S99-1
| Name: |
us-gaap_Land |
| Namespace Prefix: |
us-gaap_ |
| Data Type: |
xbrli:monetaryItemType |
| Balance Type: |
debit |
| Period Type: |
instant |
|
| X |
- DefinitionAmount of real estate investment property which may include the following: (1) land available-for-sale; (2) land available-for-development; (3) investments in building and building improvements; (4) tenant allowances; (5) developments in-process; (6) rental properties; and (7) other real estate investments. Reference 1: http://www.xbrl.org/2003/role/disclosureRef
-Topic 944
-SubTopic 210
-Name Accounting Standards Codification
-Section S99
-Paragraph 1
-Subparagraph (SX 210.7-03(a)(1)(d))
-Publisher FASB
-URI https://asc.fasb.org//1943274/2147479440/944-210-S99-1
| Name: |
us-gaap_RealEstateInvestmentPropertyAtCost |
| Namespace Prefix: |
us-gaap_ |
| Data Type: |
xbrli:monetaryItemType |
| Balance Type: |
debit |
| Period Type: |
instant |
|
| X |
- Details
| Name: |
us-gaap_PropertyPlantAndEquipmentByTypeAxis=us-gaap_BuildingImprovementsMember |
| Namespace Prefix: |
|
| Data Type: |
na |
| Balance Type: |
|
| Period Type: |
|
|
v3.23.3
| X |
- DefinitionNumber Of Units In Real Estate Portfolio
| Name: |
nysedei_NumberOfUnitsInRealEstatePortfolio |
| Namespace Prefix: |
nysedei_ |
| Data Type: |
xbrli:integerItemType |
| Balance Type: |
na |
| Period Type: |
instant |
|
| X |
- Definition[Line Items] for Schedule Of Asset Acquisitions [Table]
| Name: |
nysedei_ScheduleOfAssetAcquisitionsLineItems |
| Namespace Prefix: |
nysedei_ |
| Data Type: |
xbrli:stringItemType |
| Balance Type: |
na |
| Period Type: |
duration |
|
| X |
- DefinitionThe cash outflow from the acquisition of a piece of land, anything permanently fixed to it, including buildings, structures on it and so forth; includes real estate intended to generate income for the owner; excludes real estate acquired for use by the owner. Reference 1: http://fasb.org/us-gaap/role/ref/legacyRef
-Topic 230
-SubTopic 10
-Name Accounting Standards Codification
-Section 45
-Paragraph 13
-Subparagraph (c)
-Publisher FASB
-URI https://asc.fasb.org//1943274/2147482740/230-10-45-13
| Name: |
us-gaap_PaymentsToAcquireRealEstate |
| Namespace Prefix: |
us-gaap_ |
| Data Type: |
xbrli:monetaryItemType |
| Balance Type: |
credit |
| Period Type: |
duration |
|
| X |
- DefinitionAmount of accelerated depreciation charged against earnings associated with exit from or disposal of business activities or restructuring plan.
| Name: |
us-gaap_RestructuringReserveAcceleratedDepreciation |
| Namespace Prefix: |
us-gaap_ |
| Data Type: |
xbrli:monetaryItemType |
| Balance Type: |
debit |
| Period Type: |
duration |
|
| X |
- DefinitionPercentage of the Variable Interest Entity's (VIE) voting interest owned by (or beneficial interest in) the reporting entity (directly or indirectly). Reference 1: http://fasb.org/us-gaap/role/ref/legacyRef
-Name Accounting Standards Codification
-Topic 810
-SubTopic 10
-Section 50
-Paragraph 5A
-Subparagraph (d)
-Publisher FASB
-URI https://asc.fasb.org//1943274/2147481203/810-10-50-5A
| Name: |
us-gaap_VariableInterestEntityOwnershipPercentage |
| Namespace Prefix: |
us-gaap_ |
| Data Type: |
dtr-types:percentItemType |
| Balance Type: |
na |
| Period Type: |
duration |
|
| X |
- Details
| Name: |
srt_ConsolidatedEntitiesAxis=us-gaap_VariableInterestEntityPrimaryBeneficiaryMember |
| Namespace Prefix: |
|
| Data Type: |
na |
| Balance Type: |
|
| Period Type: |
|
|
| X |
- Details
| Name: |
srt_MortgageLoansOnRealEstateDescriptionTypeOfPropertyAxis=srt_MultifamilyMember |
| Namespace Prefix: |
|
| Data Type: |
na |
| Balance Type: |
|
| Period Type: |
|
|
v3.23.3
| X |
- DefinitionAcquired Below-Market Leases
| Name: |
nysedei_AcquiredBelowMarketLeases |
| Namespace Prefix: |
nysedei_ |
| Data Type: |
xbrli:monetaryItemType |
| Balance Type: |
credit |
| Period Type: |
duration |
|
| X |
- DefinitionAsset Acquisition, Assets Acquired And Liabilities Assumed, Net
| Name: |
nysedei_AssetAcquisitionAssetsAcquiredAndLiabilitiesAssumedNet |
| Namespace Prefix: |
nysedei_ |
| Data Type: |
xbrli:monetaryItemType |
| Balance Type: |
debit |
| Period Type: |
duration |
|
| X |
- DefinitionAsset Acquisition, Tenant Improvements And Lease Intangibles1
| Name: |
nysedei_AssetAcquisitionTenantImprovementsAndLeaseIntangibles1 |
| Namespace Prefix: |
nysedei_ |
| Data Type: |
xbrli:monetaryItemType |
| Balance Type: |
debit |
| Period Type: |
duration |
|
| X |
- DefinitionOther Liabilities Assumed
| Name: |
nysedei_OtherLiabilitiesAssumed |
| Namespace Prefix: |
nysedei_ |
| Data Type: |
xbrli:monetaryItemType |
| Balance Type: |
credit |
| Period Type: |
duration |
|
| X |
- Definition[Line Items] for Schedule Of Asset Acquisitions [Table]
| Name: |
nysedei_ScheduleOfAssetAcquisitionsLineItems |
| Namespace Prefix: |
nysedei_ |
| Data Type: |
xbrli:stringItemType |
| Balance Type: |
na |
| Period Type: |
duration |
|
| X |
- DefinitionAmount of acquisition of long-lived, physical assets used in the normal conduct of business and not intended for resale. Examples include, but are not limited to, land, buildings, machinery and equipment, office equipment, furniture and fixtures, and computer equipment.
| Name: |
us-gaap_PropertyPlantAndEquipmentAdditions |
| Namespace Prefix: |
us-gaap_ |
| Data Type: |
xbrli:monetaryItemType |
| Balance Type: |
debit |
| Period Type: |
duration |
|
| X |
- Details
| Name: |
us-gaap_AssetAcquisitionAxis=nysedei_A1221OceanAvenueMember |
| Namespace Prefix: |
|
| Data Type: |
na |
| Balance Type: |
|
| Period Type: |
|
|
| X |
- Details
| Name: |
us-gaap_PropertyPlantAndEquipmentByTypeAxis=us-gaap_LandMember |
| Namespace Prefix: |
|
| Data Type: |
na |
| Balance Type: |
|
| Period Type: |
|
|
| X |
- Details
| Name: |
us-gaap_PropertyPlantAndEquipmentByTypeAxis=us-gaap_BuildingAndBuildingImprovementsMember |
| Namespace Prefix: |
|
| Data Type: |
na |
| Balance Type: |
|
| Period Type: |
|
|
v3.23.3
Ground Lease - Narrative (Details) - USD ($)
$ in Thousands |
3 Months Ended |
9 Months Ended |
|
Sep. 30, 2023 |
Sep. 30, 2022 |
Sep. 30, 2023 |
Sep. 30, 2022 |
Dec. 31, 2022 |
| Lessee Disclosure [Abstract] |
|
|
|
|
|
| Fixed rent payments due per year on ground lease |
$ 733
|
|
$ 733
|
|
|
| Ground lease right-of-use asset |
7,449
|
|
7,449
|
|
$ 7,455
|
| Ground lease liability |
10,839
|
|
10,839
|
|
$ 10,848
|
| Ground rent expense |
$ 183
|
$ 183
|
$ 549
|
$ 549
|
|
| X |
- DefinitionLessee, Operating Lease, Liability, Payments Due Per Year
| Name: |
nysedei_LesseeOperatingLeaseLiabilityPaymentsDuePerYear |
| Namespace Prefix: |
nysedei_ |
| Data Type: |
xbrli:monetaryItemType |
| Balance Type: |
credit |
| Period Type: |
instant |
|
| X |
- References
+ Details
| Name: |
us-gaap_LesseeDisclosureAbstract |
| Namespace Prefix: |
us-gaap_ |
| Data Type: |
xbrli:stringItemType |
| Balance Type: |
na |
| Period Type: |
duration |
|
| X |
- DefinitionAmount of operating lease expense. Excludes sublease income. Reference 1: http://www.xbrl.org/2009/role/commonPracticeRef
-Topic 842
-SubTopic 20
-Name Accounting Standards Codification
-Section 45
-Paragraph 4
-Subparagraph (b)
-Publisher FASB
-URI https://asc.fasb.org//1943274/2147479041/842-20-45-4
| Name: |
us-gaap_OperatingLeaseExpense |
| Namespace Prefix: |
us-gaap_ |
| Data Type: |
xbrli:monetaryItemType |
| Balance Type: |
debit |
| Period Type: |
duration |
|
| X |
- DefinitionPresent value of lessee's discounted obligation for lease payments from operating lease. Reference 1: http://www.xbrl.org/2003/role/disclosureRef
-Topic 842
-SubTopic 20
-Name Accounting Standards Codification
-Section 45
-Paragraph 1
-Subparagraph (b)
-Publisher FASB
-URI https://asc.fasb.org//1943274/2147479041/842-20-45-1
| Name: |
us-gaap_OperatingLeaseLiability |
| Namespace Prefix: |
us-gaap_ |
| Data Type: |
xbrli:monetaryItemType |
| Balance Type: |
credit |
| Period Type: |
instant |
|
| X |
- DefinitionAmount of lessee's right to use underlying asset under operating lease. Reference 1: http://www.xbrl.org/2003/role/disclosureRef
-Topic 842
-SubTopic 20
-Name Accounting Standards Codification
-Section 45
-Paragraph 1
-Subparagraph (a)
-Publisher FASB
-URI https://asc.fasb.org//1943274/2147479041/842-20-45-1
| Name: |
us-gaap_OperatingLeaseRightOfUseAsset |
| Namespace Prefix: |
us-gaap_ |
| Data Type: |
xbrli:monetaryItemType |
| Balance Type: |
debit |
| Period Type: |
instant |
|
v3.23.3
| X |
- DefinitionAmount of lessee's undiscounted obligation for lease payment for operating lease. Reference 1: http://www.xbrl.org/2003/role/disclosureRef
-Topic 842
-SubTopic 20
-Name Accounting Standards Codification
-Section 50
-Paragraph 6
-Publisher FASB
-URI https://asc.fasb.org//1943274/2147478964/842-20-50-6
| Name: |
us-gaap_LesseeOperatingLeaseLiabilityPaymentsDue |
| Namespace Prefix: |
us-gaap_ |
| Data Type: |
xbrli:monetaryItemType |
| Balance Type: |
credit |
| Period Type: |
instant |
|
| X |
- DefinitionAmount of lessee's undiscounted obligation for lease payments for operating lease, due after fifth rolling twelve months following latest statement of financial position date. For interim and annual periods when interim periods are reported on rolling approach, from latest statement of financial position date. Reference 1: http://www.xbrl.org/2009/role/commonPracticeRef
-Topic 842
-SubTopic 20
-Name Accounting Standards Codification
-Section 50
-Paragraph 6
-Publisher FASB
-URI https://asc.fasb.org//1943274/2147478964/842-20-50-6
| Name: |
us-gaap_LesseeOperatingLeaseLiabilityPaymentsDueAfterRollingYearFive |
| Namespace Prefix: |
us-gaap_ |
| Data Type: |
xbrli:monetaryItemType |
| Balance Type: |
credit |
| Period Type: |
instant |
|
| X |
- DefinitionAmount of lessee's undiscounted obligation for lease payments for operating lease, due in fifth rolling twelve months following latest statement of financial position date. For interim and annual periods when interim periods are reported on a rolling approach, from latest statement of financial position date. Reference 1: http://www.xbrl.org/2009/role/commonPracticeRef
-Topic 842
-SubTopic 20
-Name Accounting Standards Codification
-Section 50
-Paragraph 6
-Publisher FASB
-URI https://asc.fasb.org//1943274/2147478964/842-20-50-6
| Name: |
us-gaap_LesseeOperatingLeaseLiabilityPaymentsDueInRollingYearFive |
| Namespace Prefix: |
us-gaap_ |
| Data Type: |
xbrli:monetaryItemType |
| Balance Type: |
credit |
| Period Type: |
instant |
|
| X |
- DefinitionAmount of lessee's undiscounted obligation for lease payments for operating lease, due in fourth rolling twelve months following latest statement of financial position date. For interim and annual periods when interim periods are reported on a rolling approach, from latest statement of financial position date. Reference 1: http://www.xbrl.org/2009/role/commonPracticeRef
-Topic 842
-SubTopic 20
-Name Accounting Standards Codification
-Section 50
-Paragraph 6
-Publisher FASB
-URI https://asc.fasb.org//1943274/2147478964/842-20-50-6
| Name: |
us-gaap_LesseeOperatingLeaseLiabilityPaymentsDueInRollingYearFour |
| Namespace Prefix: |
us-gaap_ |
| Data Type: |
xbrli:monetaryItemType |
| Balance Type: |
credit |
| Period Type: |
instant |
|
| X |
- DefinitionAmount of lessee's undiscounted obligation for lease payments for operating lease, due in third rolling twelve months following latest statement of financial position date. For interim and annual periods when interim periods are reported on a rolling approach, from latest statement of financial position date. Reference 1: http://www.xbrl.org/2009/role/commonPracticeRef
-Topic 842
-SubTopic 20
-Name Accounting Standards Codification
-Section 50
-Paragraph 6
-Publisher FASB
-URI https://asc.fasb.org//1943274/2147478964/842-20-50-6
| Name: |
us-gaap_LesseeOperatingLeaseLiabilityPaymentsDueInRollingYearThree |
| Namespace Prefix: |
us-gaap_ |
| Data Type: |
xbrli:monetaryItemType |
| Balance Type: |
credit |
| Period Type: |
instant |
|
| X |
- DefinitionAmount of lessee's undiscounted obligation for lease payments for operating lease, due in second rolling twelve months following latest statement of financial position date. For interim and annual periods when interim periods are reported on a rolling approach, from latest statement of financial position date. Reference 1: http://www.xbrl.org/2009/role/commonPracticeRef
-Topic 842
-SubTopic 20
-Name Accounting Standards Codification
-Section 50
-Paragraph 6
-Publisher FASB
-URI https://asc.fasb.org//1943274/2147478964/842-20-50-6
| Name: |
us-gaap_LesseeOperatingLeaseLiabilityPaymentsDueInRollingYearTwo |
| Namespace Prefix: |
us-gaap_ |
| Data Type: |
xbrli:monetaryItemType |
| Balance Type: |
credit |
| Period Type: |
instant |
|
| X |
- DefinitionAmount of lessee's undiscounted obligation for lease payments for operating lease, due in next rolling twelve months following latest statement of financial position date. For interim and annual periods when interim periods are reported on a rolling approach, from latest statement of financial position date. Reference 1: http://www.xbrl.org/2009/role/commonPracticeRef
-Topic 842
-SubTopic 20
-Name Accounting Standards Codification
-Section 50
-Paragraph 6
-Publisher FASB
-URI https://asc.fasb.org//1943274/2147478964/842-20-50-6
| Name: |
us-gaap_LesseeOperatingLeaseLiabilityPaymentsDueNextRollingTwelveMonths |
| Namespace Prefix: |
us-gaap_ |
| Data Type: |
xbrli:monetaryItemType |
| Balance Type: |
credit |
| Period Type: |
instant |
|
| X |
- References
+ Details
| Name: |
us-gaap_OperatingLeaseLiabilitiesPaymentsDueAbstract |
| Namespace Prefix: |
us-gaap_ |
| Data Type: |
xbrli:stringItemType |
| Balance Type: |
na |
| Period Type: |
duration |
|
v3.23.3
Acquired Lease Intangibles - Summary of Acquired Lease Intangibles (Details) - USD ($)
$ in Thousands |
Sep. 30, 2023 |
Dec. 31, 2022 |
| Acquired Finite-Lived Intangible Assets [Line Items] |
|
|
| Acquired lease intangible assets, net |
$ 3,103
|
$ 3,536
|
| Acquired lease intangible liabilities, net |
22,775
|
31,364
|
| Above-market tenant leases |
|
|
| Acquired Finite-Lived Intangible Assets [Line Items] |
|
|
| Off-market lease, assets |
4,712
|
4,968
|
| Accumulated amortization |
(2,474)
|
(2,309)
|
| Above-market ground lease where we are the lessor |
|
|
| Acquired Finite-Lived Intangible Assets [Line Items] |
|
|
| Off-market lease, assets |
1,152
|
1,152
|
| Accumulated amortization |
(287)
|
(275)
|
| Below-market tenant leases |
|
|
| Acquired Finite-Lived Intangible Assets [Line Items] |
|
|
| Below-market tenant leases |
50,347
|
64,851
|
| Below-market tenant leases - accumulated accretion |
$ (27,572)
|
$ (33,487)
|
| X |
- DefinitionAcquired in Place Leases Off Market Leases Unfavorable Accumulated Accretion
| Name: |
nysedei_AcquiredInPlaceLeasesOffMarketLeasesUnfavorableAccumulatedAccretion |
| Namespace Prefix: |
nysedei_ |
| Data Type: |
xbrli:monetaryItemType |
| Balance Type: |
debit |
| Period Type: |
instant |
|
| X |
- DefinitionAcquired In Place Leases, Off Market Leases, Unfavorable Gross
| Name: |
nysedei_AcquiredInPlaceLeasesOffMarketLeasesUnfavorableGross |
| Namespace Prefix: |
nysedei_ |
| Data Type: |
xbrli:monetaryItemType |
| Balance Type: |
credit |
| Period Type: |
instant |
|
| X |
- DefinitionLine items represent financial concepts included in a table. These concepts are used to disclose reportable information associated with domain members defined in one or many axes to the table.
| Name: |
us-gaap_AcquiredFiniteLivedIntangibleAssetsLineItems |
| Namespace Prefix: |
us-gaap_ |
| Data Type: |
xbrli:stringItemType |
| Balance Type: |
na |
| Period Type: |
duration |
|
| X |
- DefinitionThis element represents the identifiable intangible asset established upon acquisition based on a favorable difference between the terms of an acquired lease and the current market terms for that lease at the acquisition date. Reference 1: http://www.xbrl.org/2009/role/commonPracticeRef
-Topic 210
-SubTopic 10
-Name Accounting Standards Codification
-Section S99
-Paragraph 1
-Subparagraph (SX 210.5-02(15))
-Publisher FASB
-URI https://asc.fasb.org//1943274/2147480566/210-10-S99-1
| Name: |
us-gaap_FiniteLivedIntangibleAssetOffMarketLeaseFavorableGross |
| Namespace Prefix: |
us-gaap_ |
| Data Type: |
xbrli:monetaryItemType |
| Balance Type: |
debit |
| Period Type: |
instant |
|
| X |
- DefinitionAccumulated amount of amortization of assets, excluding financial assets and goodwill, lacking physical substance with a finite life. Reference 1: http://www.xbrl.org/2003/role/disclosureRef
-Topic 210
-SubTopic 10
-Name Accounting Standards Codification
-Section S99
-Paragraph 1
-Subparagraph (SX 210.5-02(16))
-Publisher FASB
-URI https://asc.fasb.org//1943274/2147480566/210-10-S99-1
Reference 2: http://www.xbrl.org/2003/role/disclosureRef
-Topic 350
-SubTopic 30
-Name Accounting Standards Codification
-Section 50
-Paragraph 2
-Subparagraph (a)(1)
-Publisher FASB
-URI https://asc.fasb.org//1943274/2147482665/350-30-50-2
| Name: |
us-gaap_FiniteLivedIntangibleAssetsAccumulatedAmortization |
| Namespace Prefix: |
us-gaap_ |
| Data Type: |
xbrli:monetaryItemType |
| Balance Type: |
credit |
| Period Type: |
instant |
|
| X |
- DefinitionAmount after amortization of assets, excluding financial assets and goodwill, lacking physical substance with a finite life. Reference 1: http://www.xbrl.org/2003/role/disclosureRef
-Topic 926
-SubTopic 20
-Name Accounting Standards Codification
-Section 50
-Paragraph 5
-Publisher FASB
-URI https://asc.fasb.org//1943274/2147483154/926-20-50-5
Reference 2: http://fasb.org/us-gaap/role/ref/legacyRef
-Topic 350
-SubTopic 30
-Name Accounting Standards Codification
-Section 50
-Paragraph 2
-Subparagraph (a)(1)
-Publisher FASB
-URI https://asc.fasb.org//1943274/2147482665/350-30-50-2
| Name: |
us-gaap_FiniteLivedIntangibleAssetsNet |
| Namespace Prefix: |
us-gaap_ |
| Data Type: |
xbrli:monetaryItemType |
| Balance Type: |
debit |
| Period Type: |
instant |
|
| X |
- DefinitionThis element represents a liability associated with the acquisition of an off-market lease when the terms of the lease are unfavorable to the market terms for the lease at the date of acquisition. Reference 1: http://fasb.org/us-gaap/role/ref/legacyRef
-Name Accounting Standards Codification
-Topic 210
-SubTopic 10
-Section S99
-Paragraph 1
-Subparagraph (SX 210.5-02.24)
-Publisher FASB
-URI https://asc.fasb.org//1943274/2147480566/210-10-S99-1
| Name: |
us-gaap_OffMarketLeaseUnfavorable |
| Namespace Prefix: |
us-gaap_ |
| Data Type: |
xbrli:monetaryItemType |
| Balance Type: |
credit |
| Period Type: |
instant |
|
| X |
- Details
| Name: |
us-gaap_FiniteLivedIntangibleAssetsByMajorClassAxis=nysedei_AboveMarketTenantLeasesMember |
| Namespace Prefix: |
|
| Data Type: |
na |
| Balance Type: |
|
| Period Type: |
|
|
| X |
- Details
| Name: |
us-gaap_FiniteLivedIntangibleAssetsByMajorClassAxis=nysedei_AboveMarketGroundLeasesMember |
| Namespace Prefix: |
|
| Data Type: |
na |
| Balance Type: |
|
| Period Type: |
|
|
| X |
- Details
| Name: |
us-gaap_FiniteLivedIntangibleAssetsByMajorClassAxis=nysedei_BelowMarketTenantLeasesMember |
| Namespace Prefix: |
|
| Data Type: |
na |
| Balance Type: |
|
| Period Type: |
|
|
v3.23.3
Acquired Lease Intangibles - Impact on Consolidated Statements of Operations (Details) - USD ($)
$ in Thousands |
3 Months Ended |
9 Months Ended |
Sep. 30, 2023 |
Sep. 30, 2022 |
Sep. 30, 2023 |
Sep. 30, 2022 |
| Acquired Finite-Lived Intangible Assets [Line Items] |
|
|
|
|
| Total |
$ 2,461
|
$ 3,343
|
$ 8,156
|
$ 8,050
|
| Rental revenues | Tenant Lease |
|
|
|
|
| Acquired Finite-Lived Intangible Assets [Line Items] |
|
|
|
|
| Total |
2,466
|
3,348
|
8,169
|
8,063
|
| Office parking and other income | Above-market ground lease where we are the lessor |
|
|
|
|
| Acquired Finite-Lived Intangible Assets [Line Items] |
|
|
|
|
| Total |
$ (5)
|
$ (5)
|
$ (13)
|
$ (13)
|
| X |
- DefinitionLine items represent financial concepts included in a table. These concepts are used to disclose reportable information associated with domain members defined in one or many axes to the table.
| Name: |
us-gaap_AcquiredFiniteLivedIntangibleAssetsLineItems |
| Namespace Prefix: |
us-gaap_ |
| Data Type: |
xbrli:stringItemType |
| Balance Type: |
na |
| Period Type: |
duration |
|
| X |
- DefinitionAmount of non-cash amortization of intangible asset (liability) for above and below market leases. Reference 1: http://www.xbrl.org/2009/role/commonPracticeRef
-Topic 230
-SubTopic 10
-Name Accounting Standards Codification
-Section 45
-Paragraph 28
-Subparagraph (b)
-Publisher FASB
-URI https://asc.fasb.org//1943274/2147482740/230-10-45-28
| Name: |
us-gaap_AmortizationOfAboveAndBelowMarketLeases |
| Namespace Prefix: |
us-gaap_ |
| Data Type: |
xbrli:monetaryItemType |
| Balance Type: |
debit |
| Period Type: |
duration |
|
| X |
- Details
| Name: |
us-gaap_IncomeStatementLocationAxis=nysedei_OperatingLeaseRevenueMember |
| Namespace Prefix: |
|
| Data Type: |
na |
| Balance Type: |
|
| Period Type: |
|
|
| X |
- Details
| Name: |
us-gaap_FiniteLivedIntangibleAssetsByMajorClassAxis=nysedei_TenantLeaseMember |
| Namespace Prefix: |
|
| Data Type: |
na |
| Balance Type: |
|
| Period Type: |
|
|
| X |
- Details
| Name: |
us-gaap_IncomeStatementLocationAxis=nysedei_OfficeParkingAndOtherIncomeMember |
| Namespace Prefix: |
|
| Data Type: |
na |
| Balance Type: |
|
| Period Type: |
|
|
| X |
- Details
| Name: |
us-gaap_FiniteLivedIntangibleAssetsByMajorClassAxis=nysedei_AboveMarketGroundLeasesMember |
| Namespace Prefix: |
|
| Data Type: |
na |
| Balance Type: |
|
| Period Type: |
|
|
v3.23.3
| X |
- DefinitionArea Of Real Estate Portfolio
| Name: |
nysedei_AreaOfRealEstatePortfolio |
| Namespace Prefix: |
nysedei_ |
| Data Type: |
dtr-types1:areaItemType |
| Balance Type: |
na |
| Period Type: |
instant |
|
| X |
- DefinitionThe percentage of ownership of common stock or equity participation in the investee accounted for under the equity method of accounting. Reference 1: http://www.xbrl.org/2003/role/disclosureRef
-Topic 323
-SubTopic 10
-Name Accounting Standards Codification
-Section 50
-Paragraph 3
-Subparagraph (a)(1)
-Publisher FASB
-URI https://asc.fasb.org//1943274/2147481687/323-10-50-3
| Name: |
us-gaap_EquityMethodInvestmentOwnershipPercentage |
| Namespace Prefix: |
us-gaap_ |
| Data Type: |
dtr-types:percentItemType |
| Balance Type: |
na |
| Period Type: |
instant |
|
| X |
- DefinitionThe number of real estate properties owned as of the balance sheet date.
| Name: |
us-gaap_NumberOfRealEstateProperties |
| Namespace Prefix: |
us-gaap_ |
| Data Type: |
xbrli:integerItemType |
| Balance Type: |
na |
| Period Type: |
instant |
|
| X |
- DefinitionLine items represent financial concepts included in a table. These concepts are used to disclose reportable information associated with domain members defined in one or many axes to the table. Reference 1: http://www.xbrl.org/2003/role/disclosureRef
-Topic 235
-SubTopic 10
-Name Accounting Standards Codification
-Section S99
-Paragraph 1
-Subparagraph (SX 210.4-08(g)(1)(ii))
-Publisher FASB
-URI https://asc.fasb.org//1943274/2147480678/235-10-S99-1
Reference 2: http://www.xbrl.org/2003/role/disclosureRef
-Topic 323
-SubTopic 10
-Name Accounting Standards Codification
-Section 50
-Paragraph 3
-Subparagraph (c)
-Publisher FASB
-URI https://asc.fasb.org//1943274/2147481687/323-10-50-3
Reference 3: http://www.xbrl.org/2003/role/disclosureRef
-Topic 825
-SubTopic 10
-Name Accounting Standards Codification
-Section 50
-Paragraph 28
-Subparagraph (f)
-Publisher FASB
-URI https://asc.fasb.org//1943274/2147482907/825-10-50-28
Reference 4: http://www.xbrl.org/2003/role/disclosureRef
-Topic 323
-SubTopic 10
-Name Accounting Standards Codification
-Section 50
-Paragraph 3
-Subparagraph (a)(1)
-Publisher FASB
-URI https://asc.fasb.org//1943274/2147481687/323-10-50-3
Reference 5: http://www.xbrl.org/2003/role/disclosureRef
-Topic 323
-SubTopic 10
-Name Accounting Standards Codification
-Section 50
-Paragraph 3
-Subparagraph (a)(2)
-Publisher FASB
-URI https://asc.fasb.org//1943274/2147481687/323-10-50-3
Reference 6: http://www.xbrl.org/2003/role/disclosureRef
-Topic 323
-SubTopic 10
-Name Accounting Standards Codification
-Section 50
-Paragraph 3
-Subparagraph (b)
-Publisher FASB
-URI https://asc.fasb.org//1943274/2147481687/323-10-50-3
| Name: |
us-gaap_ScheduleOfEquityMethodInvestmentsLineItems |
| Namespace Prefix: |
us-gaap_ |
| Data Type: |
xbrli:stringItemType |
| Balance Type: |
na |
| Period Type: |
duration |
|
| X |
- Details
| Name: |
srt_MortgageLoansOnRealEstateDescriptionTypeOfPropertyAxis=srt_OfficeBuildingMember |
| Namespace Prefix: |
|
| Data Type: |
na |
| Balance Type: |
|
| Period Type: |
|
|
| X |
- Details
| Name: |
us-gaap_RealEstatePropertiesAxis=us-gaap_UnconsolidatedPropertiesMember |
| Namespace Prefix: |
|
| Data Type: |
na |
| Balance Type: |
|
| Period Type: |
|
|
| X |
- Details
| Name: |
srt_ScheduleOfEquityMethodInvestmentEquityMethodInvesteeNameAxis=nysedei_PartnershipXMember |
| Namespace Prefix: |
|
| Data Type: |
na |
| Balance Type: |
|
| Period Type: |
|
|
v3.23.3
| X |
- DefinitionProceeds From Equity Method Investment, Capital Distributions
| Name: |
nysedei_ProceedsFromEquityMethodInvestmentCapitalDistributions |
| Namespace Prefix: |
nysedei_ |
| Data Type: |
xbrli:monetaryItemType |
| Balance Type: |
debit |
| Period Type: |
duration |
|
| X |
- DefinitionProceeds From Equity Method Investment, Operating Distributions
| Name: |
nysedei_ProceedsFromEquityMethodInvestmentOperatingDistributions |
| Namespace Prefix: |
nysedei_ |
| Data Type: |
xbrli:monetaryItemType |
| Balance Type: |
debit |
| Period Type: |
duration |
|
| X |
- DefinitionTotal Equity Method Distributions Received
| Name: |
nysedei_TotalEquityMethodDistributionsReceived |
| Namespace Prefix: |
nysedei_ |
| Data Type: |
xbrli:monetaryItemType |
| Balance Type: |
debit |
| Period Type: |
duration |
|
| X |
- References
+ Details
| Name: |
us-gaap_RealEstateInvestmentsAbstract |
| Namespace Prefix: |
us-gaap_ |
| Data Type: |
xbrli:stringItemType |
| Balance Type: |
na |
| Period Type: |
duration |
|
v3.23.3
Investments in Unconsolidated Funds - Summary of Statement of Financial Position Information for Funds (Details) - USD ($)
$ in Thousands |
Sep. 30, 2023 |
Dec. 31, 2022 |
| Schedule of Equity Method Investments [Line Items] |
|
|
| Total assets |
$ 9,846,079
|
$ 9,747,446
|
| Total liabilities |
5,838,623
|
5,471,663
|
| Total equity |
2,337,255
|
2,562,414
|
| Unconsolidated Funds |
|
|
| Schedule of Equity Method Investments [Line Items] |
|
|
| Total assets |
149,588
|
147,853
|
| Total liabilities |
118,942
|
119,038
|
| Total equity |
$ 30,646
|
$ 28,815
|
| X |
- DefinitionSum of the carrying amounts as of the balance sheet date of all assets that are recognized. Assets are probable future economic benefits obtained or controlled by an entity as a result of past transactions or events. Reference 1: http://www.xbrl.org/2003/role/disclosureRef
-Topic 810
-SubTopic 10
-Name Accounting Standards Codification
-Section 50
-Paragraph 3
-Subparagraph (bb)
-Publisher FASB
-URI https://asc.fasb.org//1943274/2147481203/810-10-50-3
Reference 2: http://www.xbrl.org/2003/role/disclosureRef
-Topic 810
-SubTopic 10
-Name Accounting Standards Codification
-Section 45
-Paragraph 25
-Subparagraph (a)
-Publisher FASB
-URI https://asc.fasb.org//1943274/2147481231/810-10-45-25
Reference 3: http://www.xbrl.org/2003/role/disclosureRef
-Topic 235
-SubTopic 10
-Name Accounting Standards Codification
-Section S99
-Paragraph 1
-Subparagraph (SX 210.4-08(g)(1)(ii))
-Publisher FASB
-URI https://asc.fasb.org//1943274/2147480678/235-10-S99-1
Reference 4: http://www.xbrl.org/2003/role/disclosureRef
-Topic 323
-SubTopic 10
-Name Accounting Standards Codification
-Section 50
-Paragraph 3
-Subparagraph (c)
-Publisher FASB
-URI https://asc.fasb.org//1943274/2147481687/323-10-50-3
Reference 5: http://www.xbrl.org/2003/role/disclosureRef
-Topic 825
-SubTopic 10
-Name Accounting Standards Codification
-Section 50
-Paragraph 28
-Subparagraph (f)
-Publisher FASB
-URI https://asc.fasb.org//1943274/2147482907/825-10-50-28
Reference 6: http://www.xbrl.org/2003/role/exampleRef
-Topic 852
-SubTopic 10
-Name Accounting Standards Codification
-Section 55
-Paragraph 10
-Publisher FASB
-URI https://asc.fasb.org//1943274/2147481372/852-10-55-10
Reference 7: http://www.xbrl.org/2003/role/exampleRef
-Topic 946
-SubTopic 830
-Name Accounting Standards Codification
-Section 55
-Paragraph 12
-Publisher FASB
-URI https://asc.fasb.org//1943274/2147480167/946-830-55-12
Reference 8: http://www.xbrl.org/2003/role/disclosureRef
-Topic 944
-SubTopic 210
-Name Accounting Standards Codification
-Section S99
-Paragraph 1
-Subparagraph (SX 210.7-03(a)(12))
-Publisher FASB
-URI https://asc.fasb.org//1943274/2147479440/944-210-S99-1
Reference 9: http://www.xbrl.org/2003/role/disclosureRef
-Topic 280
-SubTopic 10
-Name Accounting Standards Codification
-Section 50
-Paragraph 22
-Publisher FASB
-URI https://asc.fasb.org//1943274/2147482810/280-10-50-22
Reference 10: http://www.xbrl.org/2003/role/disclosureRef
-Topic 946
-SubTopic 210
-Name Accounting Standards Codification
-Section S99
-Paragraph 1
-Subparagraph (SX 210.6-04(8))
-Publisher FASB
-URI https://asc.fasb.org//1943274/2147479617/946-210-S99-1
Reference 11: http://www.xbrl.org/2003/role/disclosureRef
-Topic 210
-SubTopic 10
-Name Accounting Standards Codification
-Section S99
-Paragraph 1
-Subparagraph (SX 210.5-02(18))
-Publisher FASB
-URI https://asc.fasb.org//1943274/2147480566/210-10-S99-1
Reference 12: http://www.xbrl.org/2003/role/disclosureRef
-Topic 470
-SubTopic 10
-Name Accounting Standards Codification
-Section S99
-Paragraph 1A
-Subparagraph (SX 210.13-01(a)(4)(i))
-Publisher FASB
-URI https://asc.fasb.org//1943274/2147480097/470-10-S99-1A
Reference 13: http://www.xbrl.org/2009/role/commonPracticeRef
-Topic 470
-SubTopic 10
-Name Accounting Standards Codification
-Section S99
-Paragraph 1A
-Subparagraph (SX 210.13-01(a)(4)(ii))
-Publisher FASB
-URI https://asc.fasb.org//1943274/2147480097/470-10-S99-1A
Reference 14: http://www.xbrl.org/2009/role/commonPracticeRef
-Topic 470
-SubTopic 10
-Name Accounting Standards Codification
-Section S99
-Paragraph 1A
-Subparagraph (SX 210.13-01(a)(4)(iii))
-Publisher FASB
-URI https://asc.fasb.org//1943274/2147480097/470-10-S99-1A
Reference 15: http://www.xbrl.org/2003/role/disclosureRef
-Topic 470
-SubTopic 10
-Name Accounting Standards Codification
-Section S99
-Paragraph 1A
-Subparagraph (SX 210.13-01(a)(4)(iii)(A))
-Publisher FASB
-URI https://asc.fasb.org//1943274/2147480097/470-10-S99-1A
Reference 16: http://www.xbrl.org/2003/role/disclosureRef
-Topic 470
-SubTopic 10
-Name Accounting Standards Codification
-Section S99
-Paragraph 1A
-Subparagraph (SX 210.13-01(a)(4)(iv))
-Publisher FASB
-URI https://asc.fasb.org//1943274/2147480097/470-10-S99-1A
Reference 17: http://www.xbrl.org/2003/role/disclosureRef
-Topic 470
-SubTopic 10
-Name Accounting Standards Codification
-Section S99
-Paragraph 1A
-Subparagraph (SX 210.13-01(a)(5))
-Publisher FASB
-URI https://asc.fasb.org//1943274/2147480097/470-10-S99-1A
Reference 18: http://www.xbrl.org/2003/role/disclosureRef
-Topic 470
-SubTopic 10
-Name Accounting Standards Codification
-Section S99
-Paragraph 1B
-Subparagraph (SX 210.13-02(a)(4)(i))
-Publisher FASB
-URI https://asc.fasb.org//1943274/2147480097/470-10-S99-1B
Reference 19: http://www.xbrl.org/2003/role/disclosureRef
-Topic 470
-SubTopic 10
-Name Accounting Standards Codification
-Section S99
-Paragraph 1B
-Subparagraph (SX 210.13-02(a)(4)(iii)(A))
-Publisher FASB
-URI https://asc.fasb.org//1943274/2147480097/470-10-S99-1B
Reference 20: http://www.xbrl.org/2003/role/disclosureRef
-Topic 470
-SubTopic 10
-Name Accounting Standards Codification
-Section S99
-Paragraph 1B
-Subparagraph (SX 210.13-02(a)(4)(iii)(B))
-Publisher FASB
-URI https://asc.fasb.org//1943274/2147480097/470-10-S99-1B
Reference 21: http://www.xbrl.org/2003/role/disclosureRef
-Topic 470
-SubTopic 10
-Name Accounting Standards Codification
-Section S99
-Paragraph 1B
-Subparagraph (SX 210.13-02(a)(4)(iv))
-Publisher FASB
-URI https://asc.fasb.org//1943274/2147480097/470-10-S99-1B
Reference 22: http://www.xbrl.org/2003/role/disclosureRef
-Topic 470
-SubTopic 10
-Name Accounting Standards Codification
-Section S99
-Paragraph 1B
-Subparagraph (SX 210.13-02(a)(5))
-Publisher FASB
-URI https://asc.fasb.org//1943274/2147480097/470-10-S99-1B
Reference 23: http://www.xbrl.org/2009/role/commonPracticeRef
-Topic 852
-SubTopic 10
-Name Accounting Standards Codification
-Section 50
-Paragraph 7
-Subparagraph (a)
-Publisher FASB
-URI https://asc.fasb.org//1943274/2147481404/852-10-50-7
Reference 24: http://www.xbrl.org/2003/role/disclosureRef
-Topic 280
-SubTopic 10
-Name Accounting Standards Codification
-Section 50
-Paragraph 30
-Subparagraph (c)
-Publisher FASB
-URI https://asc.fasb.org//1943274/2147482810/280-10-50-30
Reference 25: http://www.xbrl.org/2003/role/disclosureRef
-Topic 280
-SubTopic 10
-Name Accounting Standards Codification
-Section 50
-Paragraph 32
-Subparagraph (d)
-Publisher FASB
-URI https://asc.fasb.org//1943274/2147482810/280-10-50-32
Reference 26: http://fasb.org/us-gaap/role/ref/legacyRef
-Topic 942
-SubTopic 210
-Name Accounting Standards Codification
-Section S99
-Paragraph 1
-Subparagraph (SX 210.9-03(11))
-Publisher FASB
-URI https://asc.fasb.org//1943274/2147479853/942-210-S99-1
| Name: |
us-gaap_Assets |
| Namespace Prefix: |
us-gaap_ |
| Data Type: |
xbrli:monetaryItemType |
| Balance Type: |
debit |
| Period Type: |
instant |
|
| X |
- DefinitionSum of the carrying amounts as of the balance sheet date of all liabilities that are recognized. Liabilities are probable future sacrifices of economic benefits arising from present obligations of an entity to transfer assets or provide services to other entities in the future. Reference 1: http://www.xbrl.org/2003/role/disclosureRef
-Topic 810
-SubTopic 10
-Name Accounting Standards Codification
-Section 50
-Paragraph 3
-Subparagraph (c)
-Publisher FASB
-URI https://asc.fasb.org//1943274/2147481203/810-10-50-3
Reference 2: http://www.xbrl.org/2003/role/disclosureRef
-Topic 810
-SubTopic 10
-Name Accounting Standards Codification
-Section 45
-Paragraph 25
-Subparagraph (b)
-Publisher FASB
-URI https://asc.fasb.org//1943274/2147481231/810-10-45-25
Reference 3: http://www.xbrl.org/2003/role/disclosureRef
-Topic 810
-SubTopic 10
-Name Accounting Standards Codification
-Section 50
-Paragraph 3
-Subparagraph (bb)
-Publisher FASB
-URI https://asc.fasb.org//1943274/2147481203/810-10-50-3
Reference 4: http://www.xbrl.org/2003/role/disclosureRef
-Topic 235
-SubTopic 10
-Name Accounting Standards Codification
-Section S99
-Paragraph 1
-Subparagraph (SX 210.4-08(g)(1)(ii))
-Publisher FASB
-URI https://asc.fasb.org//1943274/2147480678/235-10-S99-1
Reference 5: http://www.xbrl.org/2003/role/disclosureRef
-Topic 323
-SubTopic 10
-Name Accounting Standards Codification
-Section 50
-Paragraph 3
-Subparagraph (c)
-Publisher FASB
-URI https://asc.fasb.org//1943274/2147481687/323-10-50-3
Reference 6: http://www.xbrl.org/2003/role/disclosureRef
-Topic 825
-SubTopic 10
-Name Accounting Standards Codification
-Section 50
-Paragraph 28
-Subparagraph (f)
-Publisher FASB
-URI https://asc.fasb.org//1943274/2147482907/825-10-50-28
Reference 7: http://www.xbrl.org/2003/role/exampleRef
-Topic 946
-SubTopic 830
-Name Accounting Standards Codification
-Section 55
-Paragraph 12
-Publisher FASB
-URI https://asc.fasb.org//1943274/2147480167/946-830-55-12
Reference 8: http://www.xbrl.org/2003/role/disclosureRef
-Topic 946
-SubTopic 210
-Name Accounting Standards Codification
-Section S99
-Paragraph 1
-Subparagraph (SX 210.6-04(14))
-Publisher FASB
-URI https://asc.fasb.org//1943274/2147479617/946-210-S99-1
Reference 9: http://www.xbrl.org/2003/role/disclosureRef
-Topic 470
-SubTopic 10
-Name Accounting Standards Codification
-Section S99
-Paragraph 1A
-Subparagraph (SX 210.13-01(a)(4)(i))
-Publisher FASB
-URI https://asc.fasb.org//1943274/2147480097/470-10-S99-1A
Reference 10: http://www.xbrl.org/2009/role/commonPracticeRef
-Topic 470
-SubTopic 10
-Name Accounting Standards Codification
-Section S99
-Paragraph 1A
-Subparagraph (SX 210.13-01(a)(4)(ii))
-Publisher FASB
-URI https://asc.fasb.org//1943274/2147480097/470-10-S99-1A
Reference 11: http://www.xbrl.org/2003/role/disclosureRef
-Topic 470
-SubTopic 10
-Name Accounting Standards Codification
-Section S99
-Paragraph 1A
-Subparagraph (SX 210.13-01(a)(4)(iii)(A))
-Publisher FASB
-URI https://asc.fasb.org//1943274/2147480097/470-10-S99-1A
Reference 12: http://www.xbrl.org/2003/role/disclosureRef
-Topic 470
-SubTopic 10
-Name Accounting Standards Codification
-Section S99
-Paragraph 1A
-Subparagraph (SX 210.13-01(a)(4)(iv))
-Publisher FASB
-URI https://asc.fasb.org//1943274/2147480097/470-10-S99-1A
Reference 13: http://www.xbrl.org/2003/role/disclosureRef
-Topic 470
-SubTopic 10
-Name Accounting Standards Codification
-Section S99
-Paragraph 1A
-Subparagraph (SX 210.13-01(a)(5))
-Publisher FASB
-URI https://asc.fasb.org//1943274/2147480097/470-10-S99-1A
Reference 14: http://www.xbrl.org/2003/role/disclosureRef
-Topic 470
-SubTopic 10
-Name Accounting Standards Codification
-Section S99
-Paragraph 1B
-Subparagraph (SX 210.13-02(a)(4)(i))
-Publisher FASB
-URI https://asc.fasb.org//1943274/2147480097/470-10-S99-1B
Reference 15: http://www.xbrl.org/2003/role/disclosureRef
-Topic 470
-SubTopic 10
-Name Accounting Standards Codification
-Section S99
-Paragraph 1B
-Subparagraph (SX 210.13-02(a)(4)(iii)(A))
-Publisher FASB
-URI https://asc.fasb.org//1943274/2147480097/470-10-S99-1B
Reference 16: http://www.xbrl.org/2003/role/disclosureRef
-Topic 470
-SubTopic 10
-Name Accounting Standards Codification
-Section S99
-Paragraph 1B
-Subparagraph (SX 210.13-02(a)(4)(iii)(B))
-Publisher FASB
-URI https://asc.fasb.org//1943274/2147480097/470-10-S99-1B
Reference 17: http://www.xbrl.org/2003/role/disclosureRef
-Topic 470
-SubTopic 10
-Name Accounting Standards Codification
-Section S99
-Paragraph 1B
-Subparagraph (SX 210.13-02(a)(4)(iv))
-Publisher FASB
-URI https://asc.fasb.org//1943274/2147480097/470-10-S99-1B
Reference 18: http://www.xbrl.org/2003/role/disclosureRef
-Topic 470
-SubTopic 10
-Name Accounting Standards Codification
-Section S99
-Paragraph 1B
-Subparagraph (SX 210.13-02(a)(5))
-Publisher FASB
-URI https://asc.fasb.org//1943274/2147480097/470-10-S99-1B
Reference 19: http://www.xbrl.org/2009/role/commonPracticeRef
-Topic 852
-SubTopic 10
-Name Accounting Standards Codification
-Section 50
-Paragraph 7
-Subparagraph (a)
-Publisher FASB
-URI https://asc.fasb.org//1943274/2147481404/852-10-50-7
Reference 20: http://www.xbrl.org/2009/role/commonPracticeRef
-Topic 852
-SubTopic 10
-Name Accounting Standards Codification
-Section 50
-Paragraph 7
-Subparagraph (b)
-Publisher FASB
-URI https://asc.fasb.org//1943274/2147481404/852-10-50-7
Reference 21: http://www.xbrl.org/2003/role/exampleRef
-Topic 280
-SubTopic 10
-Name Accounting Standards Codification
-Section 50
-Paragraph 30
-Subparagraph (d)
-Publisher FASB
-URI https://asc.fasb.org//1943274/2147482810/280-10-50-30
Reference 22: http://fasb.org/us-gaap/role/ref/legacyRef
-Name Accounting Standards Codification
-Topic 210
-SubTopic 10
-Section S99
-Paragraph 1
-Subparagraph (SX 210.5-02.19-26)
-Publisher FASB
-URI https://asc.fasb.org//1943274/2147480566/210-10-S99-1
| Name: |
us-gaap_Liabilities |
| Namespace Prefix: |
us-gaap_ |
| Data Type: |
xbrli:monetaryItemType |
| Balance Type: |
credit |
| Period Type: |
instant |
|
| X |
- DefinitionLine items represent financial concepts included in a table. These concepts are used to disclose reportable information associated with domain members defined in one or many axes to the table. Reference 1: http://www.xbrl.org/2003/role/disclosureRef
-Topic 235
-SubTopic 10
-Name Accounting Standards Codification
-Section S99
-Paragraph 1
-Subparagraph (SX 210.4-08(g)(1)(ii))
-Publisher FASB
-URI https://asc.fasb.org//1943274/2147480678/235-10-S99-1
Reference 2: http://www.xbrl.org/2003/role/disclosureRef
-Topic 323
-SubTopic 10
-Name Accounting Standards Codification
-Section 50
-Paragraph 3
-Subparagraph (c)
-Publisher FASB
-URI https://asc.fasb.org//1943274/2147481687/323-10-50-3
Reference 3: http://www.xbrl.org/2003/role/disclosureRef
-Topic 825
-SubTopic 10
-Name Accounting Standards Codification
-Section 50
-Paragraph 28
-Subparagraph (f)
-Publisher FASB
-URI https://asc.fasb.org//1943274/2147482907/825-10-50-28
Reference 4: http://www.xbrl.org/2003/role/disclosureRef
-Topic 323
-SubTopic 10
-Name Accounting Standards Codification
-Section 50
-Paragraph 3
-Subparagraph (a)(1)
-Publisher FASB
-URI https://asc.fasb.org//1943274/2147481687/323-10-50-3
Reference 5: http://www.xbrl.org/2003/role/disclosureRef
-Topic 323
-SubTopic 10
-Name Accounting Standards Codification
-Section 50
-Paragraph 3
-Subparagraph (a)(2)
-Publisher FASB
-URI https://asc.fasb.org//1943274/2147481687/323-10-50-3
Reference 6: http://www.xbrl.org/2003/role/disclosureRef
-Topic 323
-SubTopic 10
-Name Accounting Standards Codification
-Section 50
-Paragraph 3
-Subparagraph (b)
-Publisher FASB
-URI https://asc.fasb.org//1943274/2147481687/323-10-50-3
| Name: |
us-gaap_ScheduleOfEquityMethodInvestmentsLineItems |
| Namespace Prefix: |
us-gaap_ |
| Data Type: |
xbrli:stringItemType |
| Balance Type: |
na |
| Period Type: |
duration |
|
| X |
- DefinitionAmount of equity (deficit) attributable to parent. Excludes temporary equity and equity attributable to noncontrolling interest. Reference 1: http://www.xbrl.org/2003/role/exampleRef
-Topic 852
-SubTopic 10
-Name Accounting Standards Codification
-Section 55
-Paragraph 10
-Publisher FASB
-URI https://asc.fasb.org//1943274/2147481372/852-10-55-10
Reference 2: http://www.xbrl.org/2003/role/exampleRef
-Topic 946
-SubTopic 830
-Name Accounting Standards Codification
-Section 55
-Paragraph 12
-Publisher FASB
-URI https://asc.fasb.org//1943274/2147480167/946-830-55-12
Reference 3: http://www.xbrl.org/2003/role/disclosureRef
-Topic 946
-SubTopic 210
-Name Accounting Standards Codification
-Section S99
-Paragraph 1
-Subparagraph (SX 210.6-04(19))
-Publisher FASB
-URI https://asc.fasb.org//1943274/2147479617/946-210-S99-1
Reference 4: http://www.xbrl.org/2003/role/disclosureRef
-Topic 946
-SubTopic 210
-Name Accounting Standards Codification
-Section S99
-Paragraph 2
-Subparagraph (SX 210.6-05(4))
-Publisher FASB
-URI https://asc.fasb.org//1943274/2147479617/946-210-S99-2
Reference 5: http://www.xbrl.org/2009/role/commonPracticeRef
-Topic 946
-SubTopic 220
-Name Accounting Standards Codification
-Section S99
-Paragraph 3
-Subparagraph (SX 210.6-09(4)(b))
-Publisher FASB
-URI https://asc.fasb.org//1943274/2147483575/946-220-S99-3
Reference 6: http://www.xbrl.org/2003/role/disclosureRef
-Topic 946
-SubTopic 220
-Name Accounting Standards Codification
-Section S99
-Paragraph 3
-Subparagraph (SX 210.6-09(6))
-Publisher FASB
-URI https://asc.fasb.org//1943274/2147483575/946-220-S99-3
Reference 7: http://www.xbrl.org/2003/role/disclosureRef
-Topic 946
-SubTopic 220
-Name Accounting Standards Codification
-Section S99
-Paragraph 3
-Subparagraph (SX 210.6-09(7))
-Publisher FASB
-URI https://asc.fasb.org//1943274/2147483575/946-220-S99-3
Reference 8: http://www.xbrl.org/2009/role/commonPracticeRef
-Topic 235
-SubTopic 10
-Name Accounting Standards Codification
-Section S99
-Paragraph 1
-Subparagraph (SX 210.4-08(g)(1)(ii))
-Publisher FASB
-URI https://asc.fasb.org//1943274/2147480678/235-10-S99-1
Reference 9: http://www.xbrl.org/2009/role/commonPracticeRef
-Topic 323
-SubTopic 10
-Name Accounting Standards Codification
-Section 50
-Paragraph 3
-Subparagraph (c)
-Publisher FASB
-URI https://asc.fasb.org//1943274/2147481687/323-10-50-3
Reference 10: http://www.xbrl.org/2009/role/commonPracticeRef
-Topic 825
-SubTopic 10
-Name Accounting Standards Codification
-Section 50
-Paragraph 28
-Subparagraph (f)
-Publisher FASB
-URI https://asc.fasb.org//1943274/2147482907/825-10-50-28
Reference 11: http://fasb.org/us-gaap/role/ref/legacyRef
-Topic 210
-SubTopic 10
-Name Accounting Standards Codification
-Section S99
-Paragraph 1
-Subparagraph (SX 210.5-02(29))
-Publisher FASB
-URI https://asc.fasb.org//1943274/2147480566/210-10-S99-1
Reference 12: http://fasb.org/us-gaap/role/ref/legacyRef
-Topic 210
-SubTopic 10
-Name Accounting Standards Codification
-Section S99
-Paragraph 1
-Subparagraph (SX 210.5-02(31))
-Publisher FASB
-URI https://asc.fasb.org//1943274/2147480566/210-10-S99-1
Reference 13: http://fasb.org/us-gaap/role/ref/legacyRef
-Topic 210
-SubTopic 10
-Name Accounting Standards Codification
-Section S99
-Paragraph 1
-Subparagraph (SX 210.5-02(30))
-Publisher FASB
-URI https://asc.fasb.org//1943274/2147480566/210-10-S99-1
Reference 14: http://fasb.org/us-gaap/role/ref/legacyRef
-Topic 310
-SubTopic 10
-Name Accounting Standards Codification
-Section S99
-Paragraph 2
-Subparagraph (SAB Topic 4.E)
-Publisher FASB
-URI https://asc.fasb.org//1943274/2147480418/310-10-S99-2
| Name: |
us-gaap_StockholdersEquity |
| Namespace Prefix: |
us-gaap_ |
| Data Type: |
xbrli:monetaryItemType |
| Balance Type: |
credit |
| Period Type: |
instant |
|
| X |
- Details
| Name: |
us-gaap_EquityMethodInvestmentNonconsolidatedInvesteeAxis=us-gaap_EquityMethodInvestmentNonconsolidatedInvesteeOrGroupOfInvesteesMember |
| Namespace Prefix: |
|
| Data Type: |
na |
| Balance Type: |
|
| Period Type: |
|
|
v3.23.3
Investments in Unconsolidated Funds - Summary of Statement of Operations Information for Funds (Details) - USD ($)
$ in Thousands |
3 Months Ended |
9 Months Ended |
Sep. 30, 2023 |
Sep. 30, 2022 |
Sep. 30, 2023 |
Sep. 30, 2022 |
| Schedule of Equity Method Investments [Line Items] |
|
|
|
|
| Total revenues |
$ 255,409
|
$ 253,663
|
$ 761,209
|
$ 739,515
|
| Net income |
$ (13,362)
|
$ 22,955
|
(2,251)
|
72,843
|
| Unconsolidated Funds |
|
|
|
|
| Schedule of Equity Method Investments [Line Items] |
|
|
|
|
| Total revenues |
|
|
14,929
|
13,893
|
| Operating income |
|
|
4,749
|
4,361
|
| Net income |
|
|
$ 3,167
|
$ 2,387
|
| X |
- DefinitionThe portion of profit or loss for the period, net of income taxes, which is attributable to the parent. Reference 1: http://www.xbrl.org/2003/role/disclosureRef
-Topic 235
-SubTopic 10
-Name Accounting Standards Codification
-Section S99
-Paragraph 1
-Subparagraph (SX 210.4-08(g)(1)(ii))
-Publisher FASB
-URI https://asc.fasb.org//1943274/2147480678/235-10-S99-1
Reference 2: http://www.xbrl.org/2003/role/disclosureRef
-Topic 323
-SubTopic 10
-Name Accounting Standards Codification
-Section 50
-Paragraph 3
-Subparagraph (c)
-Publisher FASB
-URI https://asc.fasb.org//1943274/2147481687/323-10-50-3
Reference 3: http://www.xbrl.org/2003/role/disclosureRef
-Topic 825
-SubTopic 10
-Name Accounting Standards Codification
-Section 50
-Paragraph 28
-Subparagraph (f)
-Publisher FASB
-URI https://asc.fasb.org//1943274/2147482907/825-10-50-28
Reference 4: http://www.xbrl.org/2003/role/disclosureRef
-Topic 220
-SubTopic 10
-Name Accounting Standards Codification
-Section 50
-Paragraph 6
-Publisher FASB
-URI https://asc.fasb.org//1943274/2147482765/220-10-50-6
Reference 5: http://www.xbrl.org/2003/role/disclosureRef
-Topic 250
-SubTopic 10
-Name Accounting Standards Codification
-Section 50
-Paragraph 3
-Publisher FASB
-URI https://asc.fasb.org//1943274/2147483443/250-10-50-3
Reference 6: http://www.xbrl.org/2003/role/disclosureRef
-Topic 250
-SubTopic 10
-Name Accounting Standards Codification
-Section 50
-Paragraph 1
-Subparagraph (b)(2)
-Publisher FASB
-URI https://asc.fasb.org//1943274/2147483443/250-10-50-1
Reference 7: http://www.xbrl.org/2003/role/disclosureRef
-Topic 815
-SubTopic 40
-Name Accounting Standards Codification
-Section 65
-Paragraph 1
-Subparagraph (f)
-Publisher FASB
-URI https://asc.fasb.org//1943274/2147480175/815-40-65-1
Reference 8: http://www.xbrl.org/2003/role/disclosureRef
-Topic 250
-SubTopic 10
-Name Accounting Standards Codification
-Section 50
-Paragraph 8
-Publisher FASB
-URI https://asc.fasb.org//1943274/2147483443/250-10-50-8
Reference 9: http://www.xbrl.org/2003/role/disclosureRef
-Topic 250
-SubTopic 10
-Name Accounting Standards Codification
-Section 50
-Paragraph 9
-Publisher FASB
-URI https://asc.fasb.org//1943274/2147483443/250-10-50-9
Reference 10: http://www.xbrl.org/2003/role/disclosureRef
-Topic 250
-SubTopic 10
-Name Accounting Standards Codification
-Section 50
-Paragraph 11
-Subparagraph (a)
-Publisher FASB
-URI https://asc.fasb.org//1943274/2147483443/250-10-50-11
Reference 11: http://www.xbrl.org/2003/role/disclosureRef
-Topic 250
-SubTopic 10
-Name Accounting Standards Codification
-Section 50
-Paragraph 11
-Subparagraph (b)
-Publisher FASB
-URI https://asc.fasb.org//1943274/2147483443/250-10-50-11
Reference 12: http://www.xbrl.org/2003/role/disclosureRef
-Topic 250
-SubTopic 10
-Name Accounting Standards Codification
-Section 50
-Paragraph 4
-Publisher FASB
-URI https://asc.fasb.org//1943274/2147483443/250-10-50-4
Reference 13: http://www.xbrl.org/2003/role/exampleRef
-Topic 946
-SubTopic 830
-Name Accounting Standards Codification
-Section 55
-Paragraph 10
-Publisher FASB
-URI https://asc.fasb.org//1943274/2147480167/946-830-55-10
Reference 14: http://www.xbrl.org/2003/role/disclosureRef
-Topic 946
-SubTopic 220
-Name Accounting Standards Codification
-Section 45
-Paragraph 7
-Publisher FASB
-URI https://asc.fasb.org//1943274/2147483581/946-220-45-7
Reference 15: http://www.xbrl.org/2003/role/disclosureRef
-Topic 944
-SubTopic 220
-Name Accounting Standards Codification
-Section S99
-Paragraph 1
-Subparagraph (SX 210.7-04(18))
-Publisher FASB
-URI https://asc.fasb.org//1943274/2147483586/944-220-S99-1
Reference 16: http://www.xbrl.org/2003/role/disclosureRef
-Topic 280
-SubTopic 10
-Name Accounting Standards Codification
-Section 50
-Paragraph 22
-Publisher FASB
-URI https://asc.fasb.org//1943274/2147482810/280-10-50-22
Reference 17: http://www.xbrl.org/2003/role/disclosureRef
-Topic 946
-SubTopic 220
-Name Accounting Standards Codification
-Section S99
-Paragraph 1
-Subparagraph (SX 210.6-07(9))
-Publisher FASB
-URI https://asc.fasb.org//1943274/2147483575/946-220-S99-1
Reference 18: http://www.xbrl.org/2003/role/disclosureRef
-Topic 946
-SubTopic 220
-Name Accounting Standards Codification
-Section S99
-Paragraph 3
-Subparagraph (SX 210.6-09(1)(d))
-Publisher FASB
-URI https://asc.fasb.org//1943274/2147483575/946-220-S99-3
Reference 19: http://www.xbrl.org/2003/role/disclosureRef
-Topic 470
-SubTopic 10
-Name Accounting Standards Codification
-Section S99
-Paragraph 1A
-Subparagraph (SX 210.13-01(a)(4)(i))
-Publisher FASB
-URI https://asc.fasb.org//1943274/2147480097/470-10-S99-1A
Reference 20: http://www.xbrl.org/2009/role/commonPracticeRef
-Topic 470
-SubTopic 10
-Name Accounting Standards Codification
-Section S99
-Paragraph 1A
-Subparagraph (SX 210.13-01(a)(4)(ii))
-Publisher FASB
-URI https://asc.fasb.org//1943274/2147480097/470-10-S99-1A
Reference 21: http://www.xbrl.org/2003/role/disclosureRef
-Topic 470
-SubTopic 10
-Name Accounting Standards Codification
-Section S99
-Paragraph 1A
-Subparagraph (SX 210.13-01(a)(4)(iii)(A))
-Publisher FASB
-URI https://asc.fasb.org//1943274/2147480097/470-10-S99-1A
Reference 22: http://www.xbrl.org/2003/role/disclosureRef
-Topic 470
-SubTopic 10
-Name Accounting Standards Codification
-Section S99
-Paragraph 1A
-Subparagraph (SX 210.13-01(a)(4)(iv))
-Publisher FASB
-URI https://asc.fasb.org//1943274/2147480097/470-10-S99-1A
Reference 23: http://www.xbrl.org/2003/role/disclosureRef
-Topic 470
-SubTopic 10
-Name Accounting Standards Codification
-Section S99
-Paragraph 1A
-Subparagraph (SX 210.13-01(a)(5))
-Publisher FASB
-URI https://asc.fasb.org//1943274/2147480097/470-10-S99-1A
Reference 24: http://www.xbrl.org/2003/role/disclosureRef
-Topic 470
-SubTopic 10
-Name Accounting Standards Codification
-Section S99
-Paragraph 1B
-Subparagraph (SX 210.13-02(a)(4)(i))
-Publisher FASB
-URI https://asc.fasb.org//1943274/2147480097/470-10-S99-1B
Reference 25: http://www.xbrl.org/2003/role/disclosureRef
-Topic 470
-SubTopic 10
-Name Accounting Standards Codification
-Section S99
-Paragraph 1B
-Subparagraph (SX 210.13-02(a)(4)(iii)(A))
-Publisher FASB
-URI https://asc.fasb.org//1943274/2147480097/470-10-S99-1B
Reference 26: http://www.xbrl.org/2003/role/disclosureRef
-Topic 470
-SubTopic 10
-Name Accounting Standards Codification
-Section S99
-Paragraph 1B
-Subparagraph (SX 210.13-02(a)(4)(iii)(B))
-Publisher FASB
-URI https://asc.fasb.org//1943274/2147480097/470-10-S99-1B
Reference 27: http://www.xbrl.org/2003/role/disclosureRef
-Topic 470
-SubTopic 10
-Name Accounting Standards Codification
-Section S99
-Paragraph 1B
-Subparagraph (SX 210.13-02(a)(4)(iv))
-Publisher FASB
-URI https://asc.fasb.org//1943274/2147480097/470-10-S99-1B
Reference 28: http://www.xbrl.org/2003/role/disclosureRef
-Topic 470
-SubTopic 10
-Name Accounting Standards Codification
-Section S99
-Paragraph 1B
-Subparagraph (SX 210.13-02(a)(5))
-Publisher FASB
-URI https://asc.fasb.org//1943274/2147480097/470-10-S99-1B
Reference 29: http://www.xbrl.org/2003/role/disclosureRef
-Topic 280
-SubTopic 10
-Name Accounting Standards Codification
-Section 50
-Paragraph 30
-Subparagraph (b)
-Publisher FASB
-URI https://asc.fasb.org//1943274/2147482810/280-10-50-30
Reference 30: http://www.xbrl.org/2003/role/disclosureRef
-Topic 280
-SubTopic 10
-Name Accounting Standards Codification
-Section 50
-Paragraph 32
-Subparagraph (f)
-Publisher FASB
-URI https://asc.fasb.org//1943274/2147482810/280-10-50-32
Reference 31: http://www.xbrl.org/2003/role/disclosureRef
-Topic 260
-SubTopic 10
-Name Accounting Standards Codification
-Section 45
-Paragraph 60B
-Subparagraph (a)
-Publisher FASB
-URI https://asc.fasb.org//1943274/2147482689/260-10-45-60B
Reference 32: http://www.xbrl.org/2003/role/exampleRef
-Topic 280
-SubTopic 10
-Name Accounting Standards Codification
-Section 50
-Paragraph 31
-Publisher FASB
-URI https://asc.fasb.org//1943274/2147482810/280-10-50-31
Reference 33: http://www.xbrl.org/2003/role/disclosureRef
-Topic 280
-SubTopic 10
-Name Accounting Standards Codification
-Section 50
-Paragraph 32
-Subparagraph (c)
-Publisher FASB
-URI https://asc.fasb.org//1943274/2147482810/280-10-50-32
Reference 34: http://www.xbrl.org/2003/role/disclosureRef
-Topic 205
-SubTopic 20
-Name Accounting Standards Codification
-Section 50
-Paragraph 7
-Publisher FASB
-URI https://asc.fasb.org//1943274/2147483499/205-20-50-7
Reference 35: http://fasb.org/us-gaap/role/ref/legacyRef
-Topic 230
-SubTopic 10
-Name Accounting Standards Codification
-Section 45
-Paragraph 28
-Publisher FASB
-URI https://asc.fasb.org//1943274/2147482740/230-10-45-28
Reference 36: http://www.xbrl.org/2003/role/disclosureRef
-Topic 220
-SubTopic 10
-Name Accounting Standards Codification
-Section 45
-Paragraph 1A
-Subparagraph (a)
-Publisher FASB
-URI https://asc.fasb.org//1943274/2147482790/220-10-45-1A
Reference 37: http://www.xbrl.org/2003/role/disclosureRef
-Topic 220
-SubTopic 10
-Name Accounting Standards Codification
-Section 45
-Paragraph 1B
-Subparagraph (a)
-Publisher FASB
-URI https://asc.fasb.org//1943274/2147482790/220-10-45-1B
Reference 38: http://fasb.org/us-gaap/role/ref/legacyRef
-Topic 220
-SubTopic 10
-Name Accounting Standards Codification
-Section S99
-Paragraph 2
-Subparagraph (SX 210.5-03(20))
-Publisher FASB
-URI https://asc.fasb.org//1943274/2147483621/220-10-S99-2
Reference 39: http://fasb.org/us-gaap/role/ref/legacyRef
-Topic 942
-SubTopic 220
-Name Accounting Standards Codification
-Section S99
-Paragraph 1
-Subparagraph (SX 210.9-04(22))
-Publisher FASB
-URI https://asc.fasb.org//1943274/2147483589/942-220-S99-1
| Name: |
us-gaap_NetIncomeLoss |
| Namespace Prefix: |
us-gaap_ |
| Data Type: |
xbrli:monetaryItemType |
| Balance Type: |
credit |
| Period Type: |
duration |
|
| X |
- DefinitionThe net result for the period of deducting operating expenses from operating revenues. Reference 1: http://www.xbrl.org/2003/role/disclosureRef
-Topic 280
-SubTopic 10
-Name Accounting Standards Codification
-Section 50
-Paragraph 22
-Publisher FASB
-URI https://asc.fasb.org//1943274/2147482810/280-10-50-22
Reference 2: http://www.xbrl.org/2003/role/disclosureRef
-Topic 280
-SubTopic 10
-Name Accounting Standards Codification
-Section 50
-Paragraph 30
-Subparagraph (b)
-Publisher FASB
-URI https://asc.fasb.org//1943274/2147482810/280-10-50-30
Reference 3: http://www.xbrl.org/2003/role/disclosureRef
-Topic 280
-SubTopic 10
-Name Accounting Standards Codification
-Section 50
-Paragraph 32
-Subparagraph (f)
-Publisher FASB
-URI https://asc.fasb.org//1943274/2147482810/280-10-50-32
Reference 4: http://www.xbrl.org/2003/role/exampleRef
-Topic 280
-SubTopic 10
-Name Accounting Standards Codification
-Section 50
-Paragraph 31
-Publisher FASB
-URI https://asc.fasb.org//1943274/2147482810/280-10-50-31
Reference 5: http://www.xbrl.org/2003/role/disclosureRef
-Topic 280
-SubTopic 10
-Name Accounting Standards Codification
-Section 50
-Paragraph 32
-Subparagraph (c)
-Publisher FASB
-URI https://asc.fasb.org//1943274/2147482810/280-10-50-32
| Name: |
us-gaap_OperatingIncomeLoss |
| Namespace Prefix: |
us-gaap_ |
| Data Type: |
xbrli:monetaryItemType |
| Balance Type: |
credit |
| Period Type: |
duration |
|
| X |
- DefinitionAmount of revenue recognized from goods sold, services rendered, insurance premiums, or other activities that constitute an earning process. Includes, but is not limited to, investment and interest income before deduction of interest expense when recognized as a component of revenue, and sales and trading gain (loss). Reference 1: http://www.xbrl.org/2003/role/disclosureRef
-Topic 235
-SubTopic 10
-Name Accounting Standards Codification
-Section S99
-Paragraph 1
-Subparagraph (SX 210.4-08(g)(1)(ii))
-Publisher FASB
-URI https://asc.fasb.org//1943274/2147480678/235-10-S99-1
Reference 2: http://www.xbrl.org/2003/role/disclosureRef
-Topic 323
-SubTopic 10
-Name Accounting Standards Codification
-Section 50
-Paragraph 3
-Subparagraph (c)
-Publisher FASB
-URI https://asc.fasb.org//1943274/2147481687/323-10-50-3
Reference 3: http://www.xbrl.org/2003/role/disclosureRef
-Topic 825
-SubTopic 10
-Name Accounting Standards Codification
-Section 50
-Paragraph 28
-Subparagraph (f)
-Publisher FASB
-URI https://asc.fasb.org//1943274/2147482907/825-10-50-28
Reference 4: http://www.xbrl.org/2003/role/disclosureRef
-Topic 220
-SubTopic 10
-Name Accounting Standards Codification
-Section S99
-Paragraph 2
-Subparagraph (SX 210.5-03(1))
-Publisher FASB
-URI https://asc.fasb.org//1943274/2147483621/220-10-S99-2
Reference 5: http://www.xbrl.org/2003/role/disclosureRef
-Topic 470
-SubTopic 10
-Name Accounting Standards Codification
-Section S99
-Paragraph 1A
-Subparagraph (SX 210.13-01(a)(4)(i))
-Publisher FASB
-URI https://asc.fasb.org//1943274/2147480097/470-10-S99-1A
Reference 6: http://www.xbrl.org/2009/role/commonPracticeRef
-Topic 470
-SubTopic 10
-Name Accounting Standards Codification
-Section S99
-Paragraph 1A
-Subparagraph (SX 210.13-01(a)(4)(ii))
-Publisher FASB
-URI https://asc.fasb.org//1943274/2147480097/470-10-S99-1A
Reference 7: http://www.xbrl.org/2003/role/disclosureRef
-Topic 470
-SubTopic 10
-Name Accounting Standards Codification
-Section S99
-Paragraph 1A
-Subparagraph (SX 210.13-01(a)(4)(iii)(A))
-Publisher FASB
-URI https://asc.fasb.org//1943274/2147480097/470-10-S99-1A
Reference 8: http://www.xbrl.org/2003/role/disclosureRef
-Topic 470
-SubTopic 10
-Name Accounting Standards Codification
-Section S99
-Paragraph 1A
-Subparagraph (SX 210.13-01(a)(4)(iv))
-Publisher FASB
-URI https://asc.fasb.org//1943274/2147480097/470-10-S99-1A
Reference 9: http://www.xbrl.org/2003/role/disclosureRef
-Topic 470
-SubTopic 10
-Name Accounting Standards Codification
-Section S99
-Paragraph 1A
-Subparagraph (SX 210.13-01(a)(5))
-Publisher FASB
-URI https://asc.fasb.org//1943274/2147480097/470-10-S99-1A
Reference 10: http://www.xbrl.org/2003/role/disclosureRef
-Topic 470
-SubTopic 10
-Name Accounting Standards Codification
-Section S99
-Paragraph 1B
-Subparagraph (SX 210.13-02(a)(4)(i))
-Publisher FASB
-URI https://asc.fasb.org//1943274/2147480097/470-10-S99-1B
Reference 11: http://www.xbrl.org/2003/role/disclosureRef
-Topic 470
-SubTopic 10
-Name Accounting Standards Codification
-Section S99
-Paragraph 1B
-Subparagraph (SX 210.13-02(a)(4)(iii)(A))
-Publisher FASB
-URI https://asc.fasb.org//1943274/2147480097/470-10-S99-1B
Reference 12: http://www.xbrl.org/2003/role/disclosureRef
-Topic 470
-SubTopic 10
-Name Accounting Standards Codification
-Section S99
-Paragraph 1B
-Subparagraph (SX 210.13-02(a)(4)(iii)(B))
-Publisher FASB
-URI https://asc.fasb.org//1943274/2147480097/470-10-S99-1B
Reference 13: http://www.xbrl.org/2003/role/disclosureRef
-Topic 470
-SubTopic 10
-Name Accounting Standards Codification
-Section S99
-Paragraph 1B
-Subparagraph (SX 210.13-02(a)(4)(iv))
-Publisher FASB
-URI https://asc.fasb.org//1943274/2147480097/470-10-S99-1B
Reference 14: http://www.xbrl.org/2003/role/disclosureRef
-Topic 470
-SubTopic 10
-Name Accounting Standards Codification
-Section S99
-Paragraph 1B
-Subparagraph (SX 210.13-02(a)(5))
-Publisher FASB
-URI https://asc.fasb.org//1943274/2147480097/470-10-S99-1B
Reference 15: http://www.xbrl.org/2003/role/disclosureRef
-Topic 280
-SubTopic 10
-Name Accounting Standards Codification
-Section 50
-Paragraph 30
-Subparagraph (a)
-Publisher FASB
-URI https://asc.fasb.org//1943274/2147482810/280-10-50-30
Reference 16: http://www.xbrl.org/2003/role/disclosureRef
-Topic 280
-SubTopic 10
-Name Accounting Standards Codification
-Section 50
-Paragraph 42
-Publisher FASB
-URI https://asc.fasb.org//1943274/2147482810/280-10-50-42
Reference 17: http://www.xbrl.org/2003/role/disclosureRef
-Topic 280
-SubTopic 10
-Name Accounting Standards Codification
-Section 50
-Paragraph 22
-Subparagraph (b)
-Publisher FASB
-URI https://asc.fasb.org//1943274/2147482810/280-10-50-22
Reference 18: http://www.xbrl.org/2003/role/disclosureRef
-Topic 280
-SubTopic 10
-Name Accounting Standards Codification
-Section 50
-Paragraph 32
-Subparagraph (b)
-Publisher FASB
-URI https://asc.fasb.org//1943274/2147482810/280-10-50-32
Reference 19: http://www.xbrl.org/2003/role/disclosureRef
-Topic 280
-SubTopic 10
-Name Accounting Standards Codification
-Section 50
-Paragraph 40
-Publisher FASB
-URI https://asc.fasb.org//1943274/2147482810/280-10-50-40
Reference 20: http://www.xbrl.org/2003/role/disclosureRef
-Topic 280
-SubTopic 10
-Name Accounting Standards Codification
-Section 50
-Paragraph 22
-Subparagraph (a)
-Publisher FASB
-URI https://asc.fasb.org//1943274/2147482810/280-10-50-22
Reference 21: http://www.xbrl.org/2003/role/disclosureRef
-Topic 280
-SubTopic 10
-Name Accounting Standards Codification
-Section 50
-Paragraph 32
-Subparagraph (a)
-Publisher FASB
-URI https://asc.fasb.org//1943274/2147482810/280-10-50-32
Reference 22: http://www.xbrl.org/2003/role/disclosureRef
-Topic 280
-SubTopic 10
-Name Accounting Standards Codification
-Section 50
-Paragraph 41
-Subparagraph (a)
-Publisher FASB
-URI https://asc.fasb.org//1943274/2147482810/280-10-50-41
Reference 23: http://www.xbrl.org/2003/role/disclosureRef
-Topic 942
-SubTopic 235
-Name Accounting Standards Codification
-Section S99
-Paragraph 1
-Subparagraph (SX 210.9-05(b)(2))
-Publisher FASB
-URI https://asc.fasb.org//1943274/2147479557/942-235-S99-1
| Name: |
us-gaap_Revenues |
| Namespace Prefix: |
us-gaap_ |
| Data Type: |
xbrli:monetaryItemType |
| Balance Type: |
credit |
| Period Type: |
duration |
|
| X |
- DefinitionLine items represent financial concepts included in a table. These concepts are used to disclose reportable information associated with domain members defined in one or many axes to the table. Reference 1: http://www.xbrl.org/2003/role/disclosureRef
-Topic 235
-SubTopic 10
-Name Accounting Standards Codification
-Section S99
-Paragraph 1
-Subparagraph (SX 210.4-08(g)(1)(ii))
-Publisher FASB
-URI https://asc.fasb.org//1943274/2147480678/235-10-S99-1
Reference 2: http://www.xbrl.org/2003/role/disclosureRef
-Topic 323
-SubTopic 10
-Name Accounting Standards Codification
-Section 50
-Paragraph 3
-Subparagraph (c)
-Publisher FASB
-URI https://asc.fasb.org//1943274/2147481687/323-10-50-3
Reference 3: http://www.xbrl.org/2003/role/disclosureRef
-Topic 825
-SubTopic 10
-Name Accounting Standards Codification
-Section 50
-Paragraph 28
-Subparagraph (f)
-Publisher FASB
-URI https://asc.fasb.org//1943274/2147482907/825-10-50-28
Reference 4: http://www.xbrl.org/2003/role/disclosureRef
-Topic 323
-SubTopic 10
-Name Accounting Standards Codification
-Section 50
-Paragraph 3
-Subparagraph (a)(1)
-Publisher FASB
-URI https://asc.fasb.org//1943274/2147481687/323-10-50-3
Reference 5: http://www.xbrl.org/2003/role/disclosureRef
-Topic 323
-SubTopic 10
-Name Accounting Standards Codification
-Section 50
-Paragraph 3
-Subparagraph (a)(2)
-Publisher FASB
-URI https://asc.fasb.org//1943274/2147481687/323-10-50-3
Reference 6: http://www.xbrl.org/2003/role/disclosureRef
-Topic 323
-SubTopic 10
-Name Accounting Standards Codification
-Section 50
-Paragraph 3
-Subparagraph (b)
-Publisher FASB
-URI https://asc.fasb.org//1943274/2147481687/323-10-50-3
| Name: |
us-gaap_ScheduleOfEquityMethodInvestmentsLineItems |
| Namespace Prefix: |
us-gaap_ |
| Data Type: |
xbrli:stringItemType |
| Balance Type: |
na |
| Period Type: |
duration |
|
| X |
- Details
| Name: |
us-gaap_EquityMethodInvestmentNonconsolidatedInvesteeAxis=us-gaap_EquityMethodInvestmentNonconsolidatedInvesteeOrGroupOfInvesteesMember |
| Namespace Prefix: |
|
| Data Type: |
na |
| Balance Type: |
|
| Period Type: |
|
|
v3.23.3
Other Assets (Details) - USD ($)
$ in Thousands |
Sep. 30, 2023 |
Dec. 31, 2022 |
Sep. 30, 2022 |
| Debt Instrument [Line Items] |
|
|
|
| Restricted cash |
$ 101
|
$ 101
|
$ 101
|
| Prepaid expenses |
30,811
|
19,871
|
|
| Indefinite-lived intangibles |
1,988
|
1,988
|
|
| Deposits with lender |
13,300
|
0
|
|
| Furniture, fixtures and equipment, net |
7,042
|
7,144
|
|
| Other |
7,152
|
4,837
|
|
| Total other assets |
60,394
|
33,941
|
|
| Cash deposit |
13,300
|
$ 0
|
|
| Subsidiaries | Fannie Mae Loan - June 1, 2027 Maturity | Secured Debt |
|
|
|
| Debt Instrument [Line Items] |
|
|
|
| Deposits with lender |
13,300
|
|
|
| Cash deposit |
$ 13,300
|
|
|
| X |
- DefinitionAmount of assets pledged to secure a debt instrument. Reference 1: http://fasb.org/us-gaap/role/ref/legacyRef
-Name Accounting Standards Codification
-Topic 942
-SubTopic 470
-Section 50
-Paragraph 3
-Subparagraph (d)
-Publisher FASB
-URI https://asc.fasb.org//1943274/2147480848/942-470-50-3
| Name: |
us-gaap_DebtInstrumentCollateralAmount |
| Namespace Prefix: |
us-gaap_ |
| Data Type: |
xbrli:monetaryItemType |
| Balance Type: |
debit |
| Period Type: |
instant |
|
| X |
- DefinitionLine items represent financial concepts included in a table. These concepts are used to disclose reportable information associated with domain members defined in one or many axes to the table. Reference 1: http://www.xbrl.org/2003/role/disclosureRef
-Topic 835
-SubTopic 30
-Name Accounting Standards Codification
-Section 50
-Paragraph 1
-Publisher FASB
-URI https://asc.fasb.org//1943274/2147482900/835-30-50-1
Reference 2: http://www.xbrl.org/2009/role/commonPracticeRef
-Topic 235
-SubTopic 10
-Name Accounting Standards Codification
-Section S99
-Paragraph 1
-Subparagraph (SX 210.4-08(f))
-Publisher FASB
-URI https://asc.fasb.org//1943274/2147480678/235-10-S99-1
Reference 3: http://www.xbrl.org/2003/role/disclosureRef
-Topic 235
-SubTopic 10
-Name Accounting Standards Codification
-Section S99
-Paragraph 3
-Subparagraph (SX 210.12-04(a))
-Publisher FASB
-URI https://asc.fasb.org//1943274/2147480678/235-10-S99-3
Reference 4: http://www.xbrl.org/2003/role/disclosureRef
-Topic 470
-SubTopic 20
-Name Accounting Standards Codification
-Section 50
-Paragraph 1B
-Subparagraph (a)
-Publisher FASB
-URI https://asc.fasb.org//1943274/2147481139/470-20-50-1B
Reference 5: http://www.xbrl.org/2003/role/exampleRef
-Topic 470
-SubTopic 20
-Name Accounting Standards Codification
-Section 55
-Paragraph 69B
-Publisher FASB
-URI https://asc.fasb.org//1943274/2147481568/470-20-55-69B
Reference 6: http://www.xbrl.org/2003/role/exampleRef
-Topic 470
-SubTopic 20
-Name Accounting Standards Codification
-Section 55
-Paragraph 69C
-Publisher FASB
-URI https://asc.fasb.org//1943274/2147481568/470-20-55-69C
Reference 7: http://www.xbrl.org/2003/role/exampleRef
-Topic 470
-SubTopic 20
-Name Accounting Standards Codification
-Section 55
-Paragraph 69E
-Publisher FASB
-URI https://asc.fasb.org//1943274/2147481568/470-20-55-69E
Reference 8: http://www.xbrl.org/2003/role/exampleRef
-Topic 470
-SubTopic 20
-Name Accounting Standards Codification
-Section 55
-Paragraph 69F
-Publisher FASB
-URI https://asc.fasb.org//1943274/2147481568/470-20-55-69F
Reference 9: http://www.xbrl.org/2003/role/disclosureRef
-Topic 470
-SubTopic 20
-Name Accounting Standards Codification
-Section 50
-Paragraph 1B
-Subparagraph (b)
-Publisher FASB
-URI https://asc.fasb.org//1943274/2147481139/470-20-50-1B
Reference 10: http://www.xbrl.org/2003/role/disclosureRef
-Topic 470
-SubTopic 20
-Name Accounting Standards Codification
-Section 50
-Paragraph 1B
-Subparagraph (c)
-Publisher FASB
-URI https://asc.fasb.org//1943274/2147481139/470-20-50-1B
Reference 11: http://www.xbrl.org/2003/role/exampleRef
-Topic 470
-SubTopic 20
-Name Accounting Standards Codification
-Section 50
-Paragraph 1B
-Subparagraph (d)
-Publisher FASB
-URI https://asc.fasb.org//1943274/2147481139/470-20-50-1B
Reference 12: http://www.xbrl.org/2003/role/disclosureRef
-Topic 470
-SubTopic 20
-Name Accounting Standards Codification
-Section 50
-Paragraph 1B
-Subparagraph (e)
-Publisher FASB
-URI https://asc.fasb.org//1943274/2147481139/470-20-50-1B
Reference 13: http://www.xbrl.org/2003/role/disclosureRef
-Topic 470
-SubTopic 20
-Name Accounting Standards Codification
-Section 50
-Paragraph 1B
-Subparagraph (f)
-Publisher FASB
-URI https://asc.fasb.org//1943274/2147481139/470-20-50-1B
Reference 14: http://www.xbrl.org/2003/role/disclosureRef
-Topic 470
-SubTopic 20
-Name Accounting Standards Codification
-Section 50
-Paragraph 1B
-Subparagraph (h)
-Publisher FASB
-URI https://asc.fasb.org//1943274/2147481139/470-20-50-1B
Reference 15: http://www.xbrl.org/2003/role/disclosureRef
-Topic 470
-SubTopic 20
-Name Accounting Standards Codification
-Section 50
-Paragraph 1D
-Subparagraph (a)
-Publisher FASB
-URI https://asc.fasb.org//1943274/2147481139/470-20-50-1D
Reference 16: http://www.xbrl.org/2003/role/disclosureRef
-Topic 470
-SubTopic 20
-Name Accounting Standards Codification
-Section 50
-Paragraph 1D
-Subparagraph (b)
-Publisher FASB
-URI https://asc.fasb.org//1943274/2147481139/470-20-50-1D
Reference 17: http://www.xbrl.org/2003/role/disclosureRef
-Topic 470
-SubTopic 20
-Name Accounting Standards Codification
-Section 50
-Paragraph 1D
-Subparagraph (c)
-Publisher FASB
-URI https://asc.fasb.org//1943274/2147481139/470-20-50-1D
Reference 18: http://www.xbrl.org/2003/role/disclosureRef
-Topic 470
-SubTopic 20
-Name Accounting Standards Codification
-Section 50
-Paragraph 1E
-Subparagraph (a)
-Publisher FASB
-URI https://asc.fasb.org//1943274/2147481139/470-20-50-1E
Reference 19: http://www.xbrl.org/2003/role/disclosureRef
-Topic 470
-SubTopic 20
-Name Accounting Standards Codification
-Section 50
-Paragraph 1E
-Subparagraph (c)
-Publisher FASB
-URI https://asc.fasb.org//1943274/2147481139/470-20-50-1E
Reference 20: http://www.xbrl.org/2003/role/disclosureRef
-Topic 470
-SubTopic 20
-Name Accounting Standards Codification
-Section 50
-Paragraph 1E
-Subparagraph (d)
-Publisher FASB
-URI https://asc.fasb.org//1943274/2147481139/470-20-50-1E
Reference 21: http://www.xbrl.org/2003/role/disclosureRef
-Topic 470
-SubTopic 20
-Name Accounting Standards Codification
-Section 50
-Paragraph 1F
-Subparagraph (a)
-Publisher FASB
-URI https://asc.fasb.org//1943274/2147481139/470-20-50-1F
Reference 22: http://www.xbrl.org/2003/role/disclosureRef
-Topic 470
-SubTopic 20
-Name Accounting Standards Codification
-Section 50
-Paragraph 1F
-Subparagraph (b)
-Publisher FASB
-URI https://asc.fasb.org//1943274/2147481139/470-20-50-1F
Reference 23: http://www.xbrl.org/2003/role/disclosureRef
-Topic 470
-SubTopic 20
-Name Accounting Standards Codification
-Section 50
-Paragraph 1F
-Subparagraph (b)(1)
-Publisher FASB
-URI https://asc.fasb.org//1943274/2147481139/470-20-50-1F
Reference 24: http://www.xbrl.org/2003/role/disclosureRef
-Topic 470
-SubTopic 20
-Name Accounting Standards Codification
-Section 50
-Paragraph 1F
-Subparagraph (b)(2)
-Publisher FASB
-URI https://asc.fasb.org//1943274/2147481139/470-20-50-1F
Reference 25: http://www.xbrl.org/2003/role/disclosureRef
-Topic 470
-SubTopic 20
-Name Accounting Standards Codification
-Section 50
-Paragraph 1I
-Subparagraph (c)
-Publisher FASB
-URI https://asc.fasb.org//1943274/2147481139/470-20-50-1I
| Name: |
us-gaap_DebtInstrumentLineItems |
| Namespace Prefix: |
us-gaap_ |
| Data Type: |
xbrli:stringItemType |
| Balance Type: |
na |
| Period Type: |
duration |
|
| X |
- DefinitionAmount of assets classified as other. Reference 1: http://www.xbrl.org/2003/role/exampleRef
-Topic 946
-SubTopic 830
-Name Accounting Standards Codification
-Section 55
-Paragraph 12
-Publisher FASB
-URI https://asc.fasb.org//1943274/2147480167/946-830-55-12
Reference 2: http://www.xbrl.org/2003/role/disclosureRef
-Topic 944
-SubTopic 210
-Name Accounting Standards Codification
-Section S99
-Paragraph 1
-Subparagraph (SX 210.7-03(a)(10))
-Publisher FASB
-URI https://asc.fasb.org//1943274/2147479440/944-210-S99-1
Reference 3: http://www.xbrl.org/2003/role/disclosureRef
-Topic 210
-SubTopic 10
-Name Accounting Standards Codification
-Section S99
-Paragraph 1
-Subparagraph (SX 210.5-02(17))
-Publisher FASB
-URI https://asc.fasb.org//1943274/2147480566/210-10-S99-1
Reference 4: http://fasb.org/us-gaap/role/ref/legacyRef
-Topic 942
-SubTopic 210
-Name Accounting Standards Codification
-Section S99
-Paragraph 1
-Subparagraph (SX 210.9-03(10))
-Publisher FASB
-URI https://asc.fasb.org//1943274/2147479853/942-210-S99-1
| Name: |
us-gaap_OtherAssets |
| Namespace Prefix: |
us-gaap_ |
| Data Type: |
xbrli:monetaryItemType |
| Balance Type: |
debit |
| Period Type: |
instant |
|
| X |
- DefinitionAmount after impairment of indefinite-lived intangible assets classified as other. Excludes financial assets and goodwill. Reference 1: http://fasb.org/us-gaap/role/ref/legacyRef
-Topic 350
-SubTopic 30
-Name Accounting Standards Codification
-Section 50
-Paragraph 2
-Subparagraph (b)
-Publisher FASB
-URI https://asc.fasb.org//1943274/2147482665/350-30-50-2
| Name: |
us-gaap_OtherIndefiniteLivedIntangibleAssets |
| Namespace Prefix: |
us-gaap_ |
| Data Type: |
xbrli:monetaryItemType |
| Balance Type: |
debit |
| Period Type: |
instant |
|
| X |
- DefinitionAmount of asset related to consideration paid in advance for costs that provide economic benefits in future periods, and amount of other assets.
| Name: |
us-gaap_PrepaidExpenseAndOtherAssets |
| Namespace Prefix: |
us-gaap_ |
| Data Type: |
xbrli:monetaryItemType |
| Balance Type: |
debit |
| Period Type: |
instant |
|
| X |
- DefinitionCarrying amount as of the balance sheet date of expenditures made in advance of when the economic benefit of the cost will be realized, and which will be expensed in future periods with the passage of time or when a triggering event occurs. Reference 1: http://www.xbrl.org/2009/role/commonPracticeRef
-Topic 944
-SubTopic 210
-Name Accounting Standards Codification
-Section S99
-Paragraph 1
-Subparagraph (SX 210.7-03(a)(10))
-Publisher FASB
-URI https://asc.fasb.org//1943274/2147479440/944-210-S99-1
Reference 2: http://www.xbrl.org/2003/role/disclosureRef
-Topic 946
-SubTopic 210
-Name Accounting Standards Codification
-Section S99
-Paragraph 1
-Subparagraph (SX 210.6-04(7)(a))
-Publisher FASB
-URI https://asc.fasb.org//1943274/2147479617/946-210-S99-1
Reference 3: http://www.xbrl.org/2003/role/disclosureRef
-Topic 210
-SubTopic 10
-Name Accounting Standards Codification
-Section S99
-Paragraph 1
-Subparagraph (SX 210.5-02(7))
-Publisher FASB
-URI https://asc.fasb.org//1943274/2147480566/210-10-S99-1
Reference 4: http://fasb.org/us-gaap/role/ref/legacyRef
-Name Accounting Standards Codification
-Topic 942
-SubTopic 210
-Section S99
-Paragraph 1
-Subparagraph (SX 210.9-03.10)
-Publisher FASB
-URI https://asc.fasb.org//1943274/2147479853/942-210-S99-1
| Name: |
us-gaap_PrepaidExpenseCurrentAndNoncurrent |
| Namespace Prefix: |
us-gaap_ |
| Data Type: |
xbrli:monetaryItemType |
| Balance Type: |
debit |
| Period Type: |
instant |
|
| X |
- DefinitionAmount after accumulated depreciation, depletion and amortization of physical assets used in the normal conduct of business to produce goods and services and not intended for resale. Examples include, but are not limited to, land, buildings, machinery and equipment, office equipment, and furniture and fixtures. Reference 1: http://fasb.org/us-gaap/role/ref/legacyRef
-Name Accounting Standards Codification
-Section 50
-Paragraph 1
-SubTopic 10
-Topic 360
-Publisher FASB
-URI https://asc.fasb.org//1943274/2147482099/360-10-50-1
Reference 2: http://www.xbrl.org/2003/role/exampleRef
-Topic 852
-SubTopic 10
-Name Accounting Standards Codification
-Section 55
-Paragraph 10
-Publisher FASB
-URI https://asc.fasb.org//1943274/2147481372/852-10-55-10
Reference 3: http://www.xbrl.org/2003/role/disclosureRef
-Topic 944
-SubTopic 210
-Name Accounting Standards Codification
-Section S99
-Paragraph 1
-Subparagraph (SX 210.7-03(a)(8))
-Publisher FASB
-URI https://asc.fasb.org//1943274/2147479440/944-210-S99-1
Reference 4: http://www.xbrl.org/2003/role/disclosureRef
-Topic 942
-SubTopic 360
-Name Accounting Standards Codification
-Section 50
-Paragraph 1
-Publisher FASB
-URI https://asc.fasb.org//1943274/2147480842/942-360-50-1
| Name: |
us-gaap_PropertyPlantAndEquipmentNet |
| Namespace Prefix: |
us-gaap_ |
| Data Type: |
xbrli:monetaryItemType |
| Balance Type: |
debit |
| Period Type: |
instant |
|
| X |
- DefinitionAmount of cash and cash equivalents restricted as to withdrawal or usage. Cash includes, but is not limited to, currency on hand, demand deposits with banks or financial institutions, and other accounts with general characteristics of demand deposits. Cash equivalents include, but are not limited to, short-term, highly liquid investments that are both readily convertible to known amounts of cash and so near their maturity that they present insignificant risk of changes in value because of changes in interest rates. Reference 1: http://www.xbrl.org/2003/role/disclosureRef
-Topic 210
-SubTopic 10
-Name Accounting Standards Codification
-Section S99
-Paragraph 1
-Subparagraph (SX 210.5-02(1))
-Publisher FASB
-URI https://asc.fasb.org//1943274/2147480566/210-10-S99-1
Reference 2: http://www.xbrl.org/2003/role/disclosureRef
-Topic 944
-SubTopic 210
-Name Accounting Standards Codification
-Section S99
-Paragraph 1
-Subparagraph (SX 210.7-03(a)(2))
-Publisher FASB
-URI https://asc.fasb.org//1943274/2147479440/944-210-S99-1
Reference 3: http://www.xbrl.org/2003/role/disclosureRef
-Topic 230
-SubTopic 10
-Name Accounting Standards Codification
-Section 50
-Paragraph 8
-Publisher FASB
-URI https://asc.fasb.org//1943274/2147482913/230-10-50-8
Reference 4: http://fasb.org/us-gaap/role/ref/legacyRef
-Topic 942
-SubTopic 210
-Name Accounting Standards Codification
-Section S99
-Paragraph 1
-Subparagraph (SX 210.9-03(1)(a))
-Publisher FASB
-URI https://asc.fasb.org//1943274/2147479853/942-210-S99-1
Reference 5: http://fasb.org/us-gaap/role/ref/legacyRef
-Name Accounting Standards Codification
-Topic 230
-SubTopic 10
-Section 45
-Paragraph 4
-Publisher FASB
-URI https://asc.fasb.org//1943274/2147482740/230-10-45-4
| Name: |
us-gaap_RestrictedCashAndCashEquivalents |
| Namespace Prefix: |
us-gaap_ |
| Data Type: |
xbrli:monetaryItemType |
| Balance Type: |
debit |
| Period Type: |
instant |
|
| X |
- Details
| Name: |
srt_ConsolidatedEntitiesAxis=srt_SubsidiariesMember |
| Namespace Prefix: |
|
| Data Type: |
na |
| Balance Type: |
|
| Period Type: |
|
|
| X |
- Details
| Name: |
us-gaap_DebtInstrumentAxis=nysedei_FannieMaeLoanJune12027MaturityMember |
| Namespace Prefix: |
|
| Data Type: |
na |
| Balance Type: |
|
| Period Type: |
|
|
| X |
- Details
| Name: |
us-gaap_LongtermDebtTypeAxis=us-gaap_SecuredDebtMember |
| Namespace Prefix: |
|
| Data Type: |
na |
| Balance Type: |
|
| Period Type: |
|
|
v3.23.3
Secured Notes Payable, Net - Summary (Details)
$ in Thousands |
9 Months Ended |
|
|
Sep. 30, 2023
USD ($)
property
|
Dec. 31, 2022
USD ($)
|
| Debt Instrument [Line Items] |
|
|
| Principal balance |
$ 5,570,259
|
$ 5,220,902
|
| Unamortized loan premium, net |
3,203
|
3,547
|
| Unamortized deferred loan costs, net |
(31,616)
|
(32,556)
|
| Total Consolidated Debt, net |
$ 5,541,846
|
5,191,893
|
| Minimum number of separate collateral pools used to secure loans | property |
1
|
|
| Cash deposit |
$ 13,300
|
0
|
| Loan premium accumulated amortization |
4,000
|
3,700
|
| Accumulated amortization on deferred loan costs |
$ 54,200
|
54,100
|
| Secured Debt | SOFR |
|
|
| Debt Instrument [Line Items] |
|
|
| Loan agreement SOFR floor |
0
|
|
| Secured Debt | Term Loan - Fixed - June 1, 2038 Maturity |
|
|
| Debt Instrument [Line Items] |
|
|
| Principal amortization period (in years) |
30 years
|
|
| Subsidiaries |
|
|
| Debt Instrument [Line Items] |
|
|
| Principal balance |
$ 3,760,259
|
3,410,902
|
| Subsidiaries | Fannie Mae Loan - June 1, 2027 Maturity |
|
|
| Debt Instrument [Line Items] |
|
|
| Interest rate |
8.99%
|
|
| Subsidiaries | Fannie Mae Loan - August 1, 2033 Maturity |
|
|
| Debt Instrument [Line Items] |
|
|
| Interest rate |
7.84%
|
|
| Subsidiaries | Secured Debt | Term Loan - March 3, 2025 Maturity |
|
|
| Debt Instrument [Line Items] |
|
|
| Maturity date |
Mar. 03, 2025
|
|
| Principal balance |
$ 335,000
|
335,000
|
| Subsidiaries | Secured Debt | Term Loan - March 3, 2025 Maturity | SOFR |
|
|
| Debt Instrument [Line Items] |
|
|
| Variable Interest Rate |
1.41%
|
|
| Subsidiaries | Secured Debt | Fannie Mae Loan - April 1, 2025 Maturity |
|
|
| Debt Instrument [Line Items] |
|
|
| Maturity date |
Apr. 01, 2025
|
|
| Principal balance |
$ 102,400
|
102,400
|
| Subsidiaries | Secured Debt | Fannie Mae Loan - April 1, 2025 Maturity | SOFR |
|
|
| Debt Instrument [Line Items] |
|
|
| Variable Interest Rate |
1.36%
|
|
| Subsidiaries | Secured Debt | Term Loan - Aug 15, 2026 Maturity |
|
|
| Debt Instrument [Line Items] |
|
|
| Maturity date |
Aug. 15, 2026
|
|
| Principal balance |
$ 415,000
|
415,000
|
| Fixed interest rate |
3.07%
|
|
| Swap Maturity Date |
Aug. 01, 2025
|
|
| Subsidiaries | Secured Debt | Term Loan - Aug 15, 2026 Maturity | SOFR |
|
|
| Debt Instrument [Line Items] |
|
|
| Variable Interest Rate |
1.20%
|
|
| Subsidiaries | Secured Debt | Term Loan - Sep 19, 2026 Maturity |
|
|
| Debt Instrument [Line Items] |
|
|
| Maturity date |
Sep. 19, 2026
|
|
| Principal balance |
$ 400,000
|
400,000
|
| Fixed interest rate |
2.44%
|
|
| Swap Maturity Date |
Sep. 01, 2024
|
|
| Subsidiaries | Secured Debt | Term Loan - Sep 19, 2026 Maturity | SOFR |
|
|
| Debt Instrument [Line Items] |
|
|
| Variable Interest Rate |
1.25%
|
|
| Subsidiaries | Secured Debt | Term Loan - Sep 26, 2026 Maturity |
|
|
| Debt Instrument [Line Items] |
|
|
| Maturity date |
Sep. 26, 2026
|
|
| Principal balance |
$ 200,000
|
200,000
|
| Fixed interest rate |
2.36%
|
|
| Swap Maturity Date |
Oct. 01, 2024
|
|
| Subsidiaries | Secured Debt | Term Loan - Sep 26, 2026 Maturity | SOFR |
|
|
| Debt Instrument [Line Items] |
|
|
| Variable Interest Rate |
1.30%
|
|
| Subsidiaries | Secured Debt | Term Loan - Nov 1, 2026 Maturity |
|
|
| Debt Instrument [Line Items] |
|
|
| Maturity date |
Nov. 01, 2026
|
|
| Principal balance |
$ 400,000
|
400,000
|
| Fixed interest rate |
2.31%
|
|
| Swap Maturity Date |
Oct. 01, 2024
|
|
| Subsidiaries | Secured Debt | Term Loan - Nov 1, 2026 Maturity | SOFR |
|
|
| Debt Instrument [Line Items] |
|
|
| Variable Interest Rate |
1.25%
|
|
| Subsidiaries | Secured Debt | Fannie Mae Loan - June 1, 2027 Maturity |
|
|
| Debt Instrument [Line Items] |
|
|
| Maturity date |
Jun. 01, 2027
|
|
| Principal balance |
$ 550,000
|
550,000
|
| Number of residential properties | property |
4
|
|
| Debt instrument, face amount |
$ 472,000
|
|
| Cash deposit |
$ 13,300
|
|
| Subsidiaries | Secured Debt | Fannie Mae Loan - June 1, 2027 Maturity | SOFR |
|
|
| Debt Instrument [Line Items] |
|
|
| Variable Interest Rate |
1.48%
|
|
| Subsidiaries | Secured Debt | Term Loan - May 18, 2028 Maturity |
|
|
| Debt Instrument [Line Items] |
|
|
| Maturity date |
May 18, 2028
|
|
| Principal balance |
$ 300,000
|
300,000
|
| Fixed interest rate |
2.21%
|
|
| Swap Maturity Date |
Jun. 01, 2026
|
|
| Subsidiaries | Secured Debt | Term Loan - May 18, 2028 Maturity | SOFR |
|
|
| Debt Instrument [Line Items] |
|
|
| Variable Interest Rate |
1.51%
|
|
| Subsidiaries | Secured Debt | Term Loan - January 1, 2029 Maturity |
|
|
| Debt Instrument [Line Items] |
|
|
| Maturity date |
Jan. 01, 2029
|
|
| Principal balance |
$ 300,000
|
300,000
|
| Fixed interest rate |
2.66%
|
|
| Swap Maturity Date |
Jan. 01, 2027
|
|
| Subsidiaries | Secured Debt | Term Loan - January 1, 2029 Maturity | SOFR |
|
|
| Debt Instrument [Line Items] |
|
|
| Variable Interest Rate |
1.56%
|
|
| Subsidiaries | Secured Debt | Fannie Mae Loan (MHA) - June 1, 2029 Maturity |
|
|
| Debt Instrument [Line Items] |
|
|
| Maturity date |
Jun. 01, 2029
|
|
| Principal balance |
$ 255,000
|
255,000
|
| Fixed interest rate |
3.26%
|
|
| Swap Maturity Date |
Jun. 01, 2027
|
|
| Subsidiaries | Secured Debt | Fannie Mae Loan (MHA) - June 1, 2029 Maturity | SOFR |
|
|
| Debt Instrument [Line Items] |
|
|
| Variable Interest Rate |
1.09%
|
|
| Subsidiaries | Secured Debt | Fannie Mae Loans (Boutiques) - June 1, 2029 Maturity |
|
|
| Debt Instrument [Line Items] |
|
|
| Maturity date |
Jun. 01, 2029
|
|
| Principal balance |
$ 125,000
|
125,000
|
| Fixed interest rate |
3.25%
|
|
| Swap Maturity Date |
Jun. 01, 2027
|
|
| Subsidiaries | Secured Debt | Fannie Mae Loans (Boutiques) - June 1, 2029 Maturity | SOFR |
|
|
| Debt Instrument [Line Items] |
|
|
| Variable Interest Rate |
1.09%
|
|
| Subsidiaries | Secured Debt | Fannie Mae Loan - August 1, 2033 Maturity |
|
|
| Debt Instrument [Line Items] |
|
|
| Maturity date |
Aug. 01, 2033
|
|
| Principal balance |
$ 350,000
|
0
|
| Subsidiaries | Secured Debt | Fannie Mae Loan - August 1, 2033 Maturity | SOFR |
|
|
| Debt Instrument [Line Items] |
|
|
| Variable Interest Rate |
1.37%
|
|
| Subsidiaries | Secured Debt | Term Loan - Fixed - June 1, 2038 Maturity |
|
|
| Debt Instrument [Line Items] |
|
|
| Maturity date |
Jun. 01, 2038
|
|
| Principal balance |
$ 27,859
|
28,502
|
| Fixed interest rate |
455.00%
|
|
| Consolidated JV | Secured Debt | Term Loan - December 19, 2024 Maturity |
|
|
| Debt Instrument [Line Items] |
|
|
| Maturity date |
Dec. 19, 2024
|
|
| Principal balance |
$ 400,000
|
400,000
|
| Consolidated JV | Secured Debt | Term Loan - December 19, 2024 Maturity | SOFR |
|
|
| Debt Instrument [Line Items] |
|
|
| Variable Interest Rate |
1.40%
|
|
| Consolidated JV | Secured Debt | Term Loan - May 15, 2027 Maturity |
|
|
| Debt Instrument [Line Items] |
|
|
| Maturity date |
May 15, 2027
|
|
| Principal balance |
$ 450,000
|
450,000
|
| Fixed interest rate |
2.26%
|
|
| Swap Maturity Date |
Apr. 01, 2025
|
|
| Consolidated JV | Secured Debt | Term Loan - May 15, 2027 Maturity | SOFR |
|
|
| Debt Instrument [Line Items] |
|
|
| Variable Interest Rate |
1.45%
|
|
| Consolidated JV | Secured Debt | Term Loan - August 19, 2028 Maturity |
|
|
| Debt Instrument [Line Items] |
|
|
| Maturity date |
Aug. 19, 2028
|
|
| Principal balance |
$ 625,000
|
625,000
|
| Fixed interest rate |
2.12%
|
|
| Swap Maturity Date |
Jun. 01, 2025
|
|
| Consolidated JV | Secured Debt | Term Loan - August 19, 2028 Maturity | SOFR |
|
|
| Debt Instrument [Line Items] |
|
|
| Variable Interest Rate |
1.45%
|
|
| Consolidated JV | Secured Debt | Term Loan - April 26, 2029 Maturity |
|
|
| Debt Instrument [Line Items] |
|
|
| Maturity date |
Apr. 26, 2029
|
|
| Principal balance |
$ 175,000
|
175,000
|
| Fixed interest rate |
3.90%
|
|
| Swap Maturity Date |
May 01, 2026
|
|
| Consolidated JV | Secured Debt | Term Loan - April 26, 2029 Maturity | SOFR |
|
|
| Debt Instrument [Line Items] |
|
|
| Variable Interest Rate |
1.25%
|
|
| Consolidated JV | Secured Debt | Fannie Mae Loan - June 1, 2029 Maturity |
|
|
| Debt Instrument [Line Items] |
|
|
| Maturity date |
Jun. 01, 2029
|
|
| Principal balance |
$ 160,000
|
$ 160,000
|
| Fixed interest rate |
3.25%
|
|
| Swap Maturity Date |
Jul. 01, 2027
|
|
| Consolidated JV | Secured Debt | Fannie Mae Loan - June 1, 2029 Maturity | SOFR |
|
|
| Debt Instrument [Line Items] |
|
|
| Variable Interest Rate |
1.09%
|
|
| X |
- DefinitionAccumulated Amortization, Loan Premium
| Name: |
nysedei_AccumulatedAmortizationLoanPremium |
| Namespace Prefix: |
nysedei_ |
| Data Type: |
xbrli:monetaryItemType |
| Balance Type: |
debit |
| Period Type: |
instant |
|
| X |
- DefinitionDebt Instrument, SOFR Floor Interest Rate
| Name: |
nysedei_DebtInstrumentSOFRFloorInterestRate |
| Namespace Prefix: |
nysedei_ |
| Data Type: |
xbrli:pureItemType |
| Balance Type: |
na |
| Period Type: |
duration |
|
| X |
- DefinitionFixed Rate Debt Amortization Period
| Name: |
nysedei_FixedRateDebtAmortizationPeriod |
| Namespace Prefix: |
nysedei_ |
| Data Type: |
xbrli:durationItemType |
| Balance Type: |
na |
| Period Type: |
duration |
|
| X |
- DefinitionNumber of Collateral Pools Used to Secure Loans, Minimum
| Name: |
nysedei_NumberOfCollateralPoolsUsedToSecureLoansMinimum |
| Namespace Prefix: |
nysedei_ |
| Data Type: |
xbrli:integerItemType |
| Balance Type: |
na |
| Period Type: |
duration |
|
| X |
- DefinitionNumber of Residential Properties
| Name: |
nysedei_NumberOfResidentialProperties |
| Namespace Prefix: |
nysedei_ |
| Data Type: |
xbrli:integerItemType |
| Balance Type: |
na |
| Period Type: |
instant |
|
| X |
- DefinitionAmount of accumulated amortization of debt issuance costs. Reference 1: http://fasb.org/us-gaap/role/ref/legacyRef
-Name Accounting Standards Codification
-Topic 835
-SubTopic 30
-Section 45
-Paragraph 3
-Publisher FASB
-URI https://asc.fasb.org//1943274/2147482925/835-30-45-3
| Name: |
us-gaap_AccumulatedAmortizationDeferredFinanceCosts |
| Namespace Prefix: |
us-gaap_ |
| Data Type: |
xbrli:monetaryItemType |
| Balance Type: |
credit |
| Period Type: |
instant |
|
| X |
- DefinitionPercentage points added to the reference rate to compute the variable rate on the debt instrument.
| Name: |
us-gaap_DebtInstrumentBasisSpreadOnVariableRate1 |
| Namespace Prefix: |
us-gaap_ |
| Data Type: |
dtr-types:percentItemType |
| Balance Type: |
na |
| Period Type: |
duration |
|
| X |
- DefinitionAmount, before unamortized (discount) premium and debt issuance costs, of long-term debt. Includes, but is not limited to, notes payable, bonds payable, commercial loans, mortgage loans, convertible debt, subordinated debt and other types of debt. Reference 1: http://fasb.org/us-gaap/role/ref/legacyRef
-Name Accounting Standards Codification
-Section S99
-Paragraph 1
-Subparagraph (SX 210.5-02(22))
-SubTopic 10
-Topic 210
-Publisher FASB
-URI https://asc.fasb.org//1943274/2147480566/210-10-S99-1
Reference 2: http://fasb.org/us-gaap/role/ref/legacyRef
-Topic 942
-SubTopic 210
-Name Accounting Standards Codification
-Section S99
-Paragraph 1
-Subparagraph (SX 210.9-03(16))
-Publisher FASB
-URI https://asc.fasb.org//1943274/2147479853/942-210-S99-1
Reference 3: http://www.xbrl.org/2003/role/disclosureRef
-Topic 470
-SubTopic 20
-Name Accounting Standards Codification
-Section 50
-Paragraph 4
-Subparagraph (b)(1)
-Publisher FASB
-URI https://asc.fasb.org//1943274/2147481139/470-20-50-4
| Name: |
us-gaap_DebtInstrumentCarryingAmount |
| Namespace Prefix: |
us-gaap_ |
| Data Type: |
xbrli:monetaryItemType |
| Balance Type: |
credit |
| Period Type: |
instant |
|
| X |
- DefinitionAmount of assets pledged to secure a debt instrument. Reference 1: http://fasb.org/us-gaap/role/ref/legacyRef
-Name Accounting Standards Codification
-Topic 942
-SubTopic 470
-Section 50
-Paragraph 3
-Subparagraph (d)
-Publisher FASB
-URI https://asc.fasb.org//1943274/2147480848/942-470-50-3
| Name: |
us-gaap_DebtInstrumentCollateralAmount |
| Namespace Prefix: |
us-gaap_ |
| Data Type: |
xbrli:monetaryItemType |
| Balance Type: |
debit |
| Period Type: |
instant |
|
| X |
- DefinitionFace (par) amount of debt instrument at time of issuance. Reference 1: http://www.xbrl.org/2003/role/disclosureRef
-Topic 835
-SubTopic 30
-Name Accounting Standards Codification
-Section 50
-Paragraph 1
-Publisher FASB
-URI https://asc.fasb.org//1943274/2147482900/835-30-50-1
Reference 2: http://www.xbrl.org/2003/role/disclosureRef
-Topic 470
-SubTopic 20
-Name Accounting Standards Codification
-Section 50
-Paragraph 1B
-Subparagraph (a)
-Publisher FASB
-URI https://asc.fasb.org//1943274/2147481139/470-20-50-1B
Reference 3: http://www.xbrl.org/2003/role/exampleRef
-Topic 470
-SubTopic 20
-Name Accounting Standards Codification
-Section 55
-Paragraph 69B
-Publisher FASB
-URI https://asc.fasb.org//1943274/2147481568/470-20-55-69B
Reference 4: http://www.xbrl.org/2003/role/exampleRef
-Topic 470
-SubTopic 20
-Name Accounting Standards Codification
-Section 55
-Paragraph 69C
-Publisher FASB
-URI https://asc.fasb.org//1943274/2147481568/470-20-55-69C
Reference 5: http://fasb.org/us-gaap/role/ref/legacyRef
-Name Accounting Standards Codification
-Topic 835
-SubTopic 30
-Section 45
-Paragraph 2
-Publisher FASB
-URI https://asc.fasb.org//1943274/2147482925/835-30-45-2
Reference 6: http://fasb.org/us-gaap/role/ref/legacyRef
-Name Accounting Standards Codification
-Topic 835
-SubTopic 30
-Section 55
-Paragraph 8
-Publisher FASB
-URI https://asc.fasb.org//1943274/2147482949/835-30-55-8
| Name: |
us-gaap_DebtInstrumentFaceAmount |
| Namespace Prefix: |
us-gaap_ |
| Data Type: |
xbrli:monetaryItemType |
| Balance Type: |
credit |
| Period Type: |
instant |
|
| X |
- DefinitionLine items represent financial concepts included in a table. These concepts are used to disclose reportable information associated with domain members defined in one or many axes to the table. Reference 1: http://www.xbrl.org/2003/role/disclosureRef
-Topic 835
-SubTopic 30
-Name Accounting Standards Codification
-Section 50
-Paragraph 1
-Publisher FASB
-URI https://asc.fasb.org//1943274/2147482900/835-30-50-1
Reference 2: http://www.xbrl.org/2009/role/commonPracticeRef
-Topic 235
-SubTopic 10
-Name Accounting Standards Codification
-Section S99
-Paragraph 1
-Subparagraph (SX 210.4-08(f))
-Publisher FASB
-URI https://asc.fasb.org//1943274/2147480678/235-10-S99-1
Reference 3: http://www.xbrl.org/2003/role/disclosureRef
-Topic 235
-SubTopic 10
-Name Accounting Standards Codification
-Section S99
-Paragraph 3
-Subparagraph (SX 210.12-04(a))
-Publisher FASB
-URI https://asc.fasb.org//1943274/2147480678/235-10-S99-3
Reference 4: http://www.xbrl.org/2003/role/disclosureRef
-Topic 470
-SubTopic 20
-Name Accounting Standards Codification
-Section 50
-Paragraph 1B
-Subparagraph (a)
-Publisher FASB
-URI https://asc.fasb.org//1943274/2147481139/470-20-50-1B
Reference 5: http://www.xbrl.org/2003/role/exampleRef
-Topic 470
-SubTopic 20
-Name Accounting Standards Codification
-Section 55
-Paragraph 69B
-Publisher FASB
-URI https://asc.fasb.org//1943274/2147481568/470-20-55-69B
Reference 6: http://www.xbrl.org/2003/role/exampleRef
-Topic 470
-SubTopic 20
-Name Accounting Standards Codification
-Section 55
-Paragraph 69C
-Publisher FASB
-URI https://asc.fasb.org//1943274/2147481568/470-20-55-69C
Reference 7: http://www.xbrl.org/2003/role/exampleRef
-Topic 470
-SubTopic 20
-Name Accounting Standards Codification
-Section 55
-Paragraph 69E
-Publisher FASB
-URI https://asc.fasb.org//1943274/2147481568/470-20-55-69E
Reference 8: http://www.xbrl.org/2003/role/exampleRef
-Topic 470
-SubTopic 20
-Name Accounting Standards Codification
-Section 55
-Paragraph 69F
-Publisher FASB
-URI https://asc.fasb.org//1943274/2147481568/470-20-55-69F
Reference 9: http://www.xbrl.org/2003/role/disclosureRef
-Topic 470
-SubTopic 20
-Name Accounting Standards Codification
-Section 50
-Paragraph 1B
-Subparagraph (b)
-Publisher FASB
-URI https://asc.fasb.org//1943274/2147481139/470-20-50-1B
Reference 10: http://www.xbrl.org/2003/role/disclosureRef
-Topic 470
-SubTopic 20
-Name Accounting Standards Codification
-Section 50
-Paragraph 1B
-Subparagraph (c)
-Publisher FASB
-URI https://asc.fasb.org//1943274/2147481139/470-20-50-1B
Reference 11: http://www.xbrl.org/2003/role/exampleRef
-Topic 470
-SubTopic 20
-Name Accounting Standards Codification
-Section 50
-Paragraph 1B
-Subparagraph (d)
-Publisher FASB
-URI https://asc.fasb.org//1943274/2147481139/470-20-50-1B
Reference 12: http://www.xbrl.org/2003/role/disclosureRef
-Topic 470
-SubTopic 20
-Name Accounting Standards Codification
-Section 50
-Paragraph 1B
-Subparagraph (e)
-Publisher FASB
-URI https://asc.fasb.org//1943274/2147481139/470-20-50-1B
Reference 13: http://www.xbrl.org/2003/role/disclosureRef
-Topic 470
-SubTopic 20
-Name Accounting Standards Codification
-Section 50
-Paragraph 1B
-Subparagraph (f)
-Publisher FASB
-URI https://asc.fasb.org//1943274/2147481139/470-20-50-1B
Reference 14: http://www.xbrl.org/2003/role/disclosureRef
-Topic 470
-SubTopic 20
-Name Accounting Standards Codification
-Section 50
-Paragraph 1B
-Subparagraph (h)
-Publisher FASB
-URI https://asc.fasb.org//1943274/2147481139/470-20-50-1B
Reference 15: http://www.xbrl.org/2003/role/disclosureRef
-Topic 470
-SubTopic 20
-Name Accounting Standards Codification
-Section 50
-Paragraph 1D
-Subparagraph (a)
-Publisher FASB
-URI https://asc.fasb.org//1943274/2147481139/470-20-50-1D
Reference 16: http://www.xbrl.org/2003/role/disclosureRef
-Topic 470
-SubTopic 20
-Name Accounting Standards Codification
-Section 50
-Paragraph 1D
-Subparagraph (b)
-Publisher FASB
-URI https://asc.fasb.org//1943274/2147481139/470-20-50-1D
Reference 17: http://www.xbrl.org/2003/role/disclosureRef
-Topic 470
-SubTopic 20
-Name Accounting Standards Codification
-Section 50
-Paragraph 1D
-Subparagraph (c)
-Publisher FASB
-URI https://asc.fasb.org//1943274/2147481139/470-20-50-1D
Reference 18: http://www.xbrl.org/2003/role/disclosureRef
-Topic 470
-SubTopic 20
-Name Accounting Standards Codification
-Section 50
-Paragraph 1E
-Subparagraph (a)
-Publisher FASB
-URI https://asc.fasb.org//1943274/2147481139/470-20-50-1E
Reference 19: http://www.xbrl.org/2003/role/disclosureRef
-Topic 470
-SubTopic 20
-Name Accounting Standards Codification
-Section 50
-Paragraph 1E
-Subparagraph (c)
-Publisher FASB
-URI https://asc.fasb.org//1943274/2147481139/470-20-50-1E
Reference 20: http://www.xbrl.org/2003/role/disclosureRef
-Topic 470
-SubTopic 20
-Name Accounting Standards Codification
-Section 50
-Paragraph 1E
-Subparagraph (d)
-Publisher FASB
-URI https://asc.fasb.org//1943274/2147481139/470-20-50-1E
Reference 21: http://www.xbrl.org/2003/role/disclosureRef
-Topic 470
-SubTopic 20
-Name Accounting Standards Codification
-Section 50
-Paragraph 1F
-Subparagraph (a)
-Publisher FASB
-URI https://asc.fasb.org//1943274/2147481139/470-20-50-1F
Reference 22: http://www.xbrl.org/2003/role/disclosureRef
-Topic 470
-SubTopic 20
-Name Accounting Standards Codification
-Section 50
-Paragraph 1F
-Subparagraph (b)
-Publisher FASB
-URI https://asc.fasb.org//1943274/2147481139/470-20-50-1F
Reference 23: http://www.xbrl.org/2003/role/disclosureRef
-Topic 470
-SubTopic 20
-Name Accounting Standards Codification
-Section 50
-Paragraph 1F
-Subparagraph (b)(1)
-Publisher FASB
-URI https://asc.fasb.org//1943274/2147481139/470-20-50-1F
Reference 24: http://www.xbrl.org/2003/role/disclosureRef
-Topic 470
-SubTopic 20
-Name Accounting Standards Codification
-Section 50
-Paragraph 1F
-Subparagraph (b)(2)
-Publisher FASB
-URI https://asc.fasb.org//1943274/2147481139/470-20-50-1F
Reference 25: http://www.xbrl.org/2003/role/disclosureRef
-Topic 470
-SubTopic 20
-Name Accounting Standards Codification
-Section 50
-Paragraph 1I
-Subparagraph (c)
-Publisher FASB
-URI https://asc.fasb.org//1943274/2147481139/470-20-50-1I
| Name: |
us-gaap_DebtInstrumentLineItems |
| Namespace Prefix: |
us-gaap_ |
| Data Type: |
xbrli:stringItemType |
| Balance Type: |
na |
| Period Type: |
duration |
|
| X |
- DefinitionDate when the debt instrument is scheduled to be fully repaid, in YYYY-MM-DD format. Reference 1: http://www.xbrl.org/2003/role/exampleRef
-Topic 470
-SubTopic 20
-Name Accounting Standards Codification
-Section 50
-Paragraph 1B
-Subparagraph (d)
-Publisher FASB
-URI https://asc.fasb.org//1943274/2147481139/470-20-50-1B
Reference 2: http://www.xbrl.org/2009/role/commonPracticeRef
-Topic 820
-SubTopic 10
-Name Accounting Standards Codification
-Section 50
-Paragraph 2
-Subparagraph (bbb)(2)
-Publisher FASB
-URI https://asc.fasb.org//1943274/2147482106/820-10-50-2
Reference 3: http://www.xbrl.org/2003/role/disclosureRef
-Name Accounting Standards Codification
-Section S99
-Paragraph 1
-Subparagraph (SX 210.5-02.22(a)(2))
-SubTopic 10
-Topic 210
-Publisher FASB
-URI https://asc.fasb.org//1943274/2147480566/210-10-S99-1
| Name: |
us-gaap_DebtInstrumentMaturityDate |
| Namespace Prefix: |
us-gaap_ |
| Data Type: |
xbrli:dateItemType |
| Balance Type: |
na |
| Period Type: |
duration |
|
| X |
- DefinitionAmount, after accumulated amortization, of debt premium. Reference 1: http://fasb.org/us-gaap/role/ref/legacyRef
-Name Accounting Standards Codification
-Topic 835
-SubTopic 30
-Section 45
-Paragraph 1A
-Publisher FASB
-URI https://asc.fasb.org//1943274/2147482925/835-30-45-1A
Reference 2: http://fasb.org/us-gaap/role/ref/legacyRef
-Name Accounting Standards Codification
-Topic 835
-SubTopic 30
-Section 55
-Paragraph 8
-Publisher FASB
-URI https://asc.fasb.org//1943274/2147482949/835-30-55-8
Reference 3: http://www.xbrl.org/2009/role/commonPracticeRef
-Topic 470
-SubTopic 20
-Name Accounting Standards Codification
-Section 50
-Paragraph 1D
-Subparagraph (a)
-Publisher FASB
-URI https://asc.fasb.org//1943274/2147481139/470-20-50-1D
| Name: |
us-gaap_DebtInstrumentUnamortizedPremium |
| Namespace Prefix: |
us-gaap_ |
| Data Type: |
xbrli:monetaryItemType |
| Balance Type: |
credit |
| Period Type: |
instant |
|
| X |
- DefinitionAmount, after accumulated amortization, of debt issuance costs. Includes, but is not limited to, legal, accounting, underwriting, printing, and registration costs. Reference 1: http://fasb.org/us-gaap/role/ref/legacyRef
-Name Accounting Standards Codification
-Topic 835
-SubTopic 30
-Section 45
-Paragraph 3
-Publisher FASB
-URI https://asc.fasb.org//1943274/2147482925/835-30-45-3
Reference 2: http://www.xbrl.org/2009/role/commonPracticeRef
-Topic 470
-SubTopic 20
-Name Accounting Standards Codification
-Section 50
-Paragraph 1D
-Subparagraph (a)
-Publisher FASB
-URI https://asc.fasb.org//1943274/2147481139/470-20-50-1D
| Name: |
us-gaap_DeferredFinanceCostsNet |
| Namespace Prefix: |
us-gaap_ |
| Data Type: |
xbrli:monetaryItemType |
| Balance Type: |
debit |
| Period Type: |
instant |
|
| X |
- DefinitionAverage cap rate on a group of interest rate derivatives, such as interest rate caps or collars. If market rates exceed the cap rate, a payment or receipt is triggered on the contract.
| Name: |
us-gaap_DerivativeAverageCapInterestRate |
| Namespace Prefix: |
us-gaap_ |
| Data Type: |
dtr-types:percentItemType |
| Balance Type: |
na |
| Period Type: |
instant |
|
| X |
- DefinitionFixed interest rate related to the interest rate derivative.
| Name: |
us-gaap_DerivativeFixedInterestRate |
| Namespace Prefix: |
us-gaap_ |
| Data Type: |
dtr-types:percentItemType |
| Balance Type: |
na |
| Period Type: |
instant |
|
| X |
- DefinitionDate derivative contract ends, in YYYY-MM-DD format. Reference 1: http://www.xbrl.org/2003/role/disclosureRef
-Topic 946
-SubTopic 210
-Name Accounting Standards Codification
-Section 50
-Paragraph 6
-Subparagraph (e)
-Publisher FASB
-URI https://asc.fasb.org//1943274/2147480524/946-210-50-6
Reference 2: http://www.xbrl.org/2003/role/exampleRef
-Topic 946
-SubTopic 210
-Name Accounting Standards Codification
-Section 55
-Paragraph 1
-Publisher FASB
-URI https://asc.fasb.org//1943274/2147480493/946-210-55-1
Reference 3: http://www.xbrl.org/2003/role/disclosureRef
-Topic 946
-SubTopic 210
-Name Accounting Standards Codification
-Section 50
-Paragraph 6
-Subparagraph (f)
-Publisher FASB
-URI https://asc.fasb.org//1943274/2147480524/946-210-50-6
Reference 4: http://www.xbrl.org/2003/role/disclosureRef
-Topic 946
-SubTopic 320
-Name Accounting Standards Codification
-Section S99
-Paragraph 5
-Subparagraph (SX 210.12-13(Column A)(Footnote 3))
-Publisher FASB
-URI https://asc.fasb.org//1943274/2147480032/946-320-S99-5
Reference 5: http://www.xbrl.org/2003/role/disclosureRef
-Topic 946
-SubTopic 320
-Name Accounting Standards Codification
-Section S99
-Paragraph 5C
-Subparagraph (SX 210.12-13C(Column D))
-Publisher FASB
-URI https://asc.fasb.org//1943274/2147480032/946-320-S99-5C
Reference 6: http://www.xbrl.org/2003/role/disclosureRef
-Topic 946
-SubTopic 320
-Name Accounting Standards Codification
-Section S99
-Paragraph 5
-Subparagraph (SX 210.12-13(Column F))
-Publisher FASB
-URI https://asc.fasb.org//1943274/2147480032/946-320-S99-5
Reference 7: http://www.xbrl.org/2003/role/disclosureRef
-Topic 946
-SubTopic 320
-Name Accounting Standards Codification
-Section S99
-Paragraph 5A
-Subparagraph (SX 210.12-13A(Column C))
-Publisher FASB
-URI https://asc.fasb.org//1943274/2147480032/946-320-S99-5A
Reference 8: http://www.xbrl.org/2003/role/disclosureRef
-Topic 946
-SubTopic 320
-Name Accounting Standards Codification
-Section S99
-Paragraph 5B
-Subparagraph (SX 210.12-13B(Column D))
-Publisher FASB
-URI https://asc.fasb.org//1943274/2147480032/946-320-S99-5B
| Name: |
us-gaap_DerivativeMaturityDates |
| Namespace Prefix: |
us-gaap_ |
| Data Type: |
xbrli:dateItemType |
| Balance Type: |
na |
| Period Type: |
duration |
|
| X |
- DefinitionAmount, after deduction of unamortized premium (discount) and debt issuance cost, of long-term debt. Excludes lease obligation. Reference 1: http://fasb.org/us-gaap/role/ref/legacyRef
-Name Accounting Standards Codification
-Section S99
-Paragraph 1
-Subparagraph (SX 210.5-02(22))
-SubTopic 10
-Topic 210
-Publisher FASB
-URI https://asc.fasb.org//1943274/2147480566/210-10-S99-1
Reference 2: http://www.xbrl.org/2003/role/exampleRef
-Topic 470
-SubTopic 20
-Name Accounting Standards Codification
-Section 55
-Paragraph 69B
-Publisher FASB
-URI https://asc.fasb.org//1943274/2147481568/470-20-55-69B
Reference 3: http://www.xbrl.org/2003/role/exampleRef
-Topic 470
-SubTopic 20
-Name Accounting Standards Codification
-Section 55
-Paragraph 69C
-Publisher FASB
-URI https://asc.fasb.org//1943274/2147481568/470-20-55-69C
Reference 4: http://www.xbrl.org/2003/role/disclosureRef
-Topic 470
-SubTopic 20
-Name Accounting Standards Codification
-Section 50
-Paragraph 1D
-Subparagraph (b)
-Publisher FASB
-URI https://asc.fasb.org//1943274/2147481139/470-20-50-1D
Reference 5: http://www.xbrl.org/2009/role/commonPracticeRef
-Topic 944
-SubTopic 210
-Name Accounting Standards Codification
-Section S99
-Paragraph 1
-Subparagraph (SX 210.7-03(a)(16)(a)(2))
-Publisher FASB
-URI https://asc.fasb.org//1943274/2147479440/944-210-S99-1
Reference 6: http://fasb.org/us-gaap/role/ref/legacyRef
-Topic 942
-SubTopic 210
-Name Accounting Standards Codification
-Section S99
-Paragraph 1
-Subparagraph (SX 210.9-03(16))
-Publisher FASB
-URI https://asc.fasb.org//1943274/2147479853/942-210-S99-1
Reference 7: http://www.xbrl.org/2003/role/disclosureRef
-Topic 470
-SubTopic 20
-Name Accounting Standards Codification
-Section 50
-Paragraph 4
-Subparagraph (b)(3)
-Publisher FASB
-URI https://asc.fasb.org//1943274/2147481139/470-20-50-4
| Name: |
us-gaap_LongTermDebt |
| Namespace Prefix: |
us-gaap_ |
| Data Type: |
xbrli:monetaryItemType |
| Balance Type: |
credit |
| Period Type: |
instant |
|
| X |
- Details
| Name: |
us-gaap_LongtermDebtTypeAxis=us-gaap_SecuredDebtMember |
| Namespace Prefix: |
|
| Data Type: |
na |
| Balance Type: |
|
| Period Type: |
|
|
| X |
- Details
| Name: |
us-gaap_VariableRateAxis=nysedei_SecuredOvernightFinancingRateSOFRMember |
| Namespace Prefix: |
|
| Data Type: |
na |
| Balance Type: |
|
| Period Type: |
|
|
| X |
- Details
| Name: |
us-gaap_DebtInstrumentAxis=nysedei_TermLoanFixedJune12038MaturityMember |
| Namespace Prefix: |
|
| Data Type: |
na |
| Balance Type: |
|
| Period Type: |
|
|
| X |
- Details
| Name: |
srt_ConsolidatedEntitiesAxis=srt_SubsidiariesMember |
| Namespace Prefix: |
|
| Data Type: |
na |
| Balance Type: |
|
| Period Type: |
|
|
| X |
- Details
| Name: |
us-gaap_DebtInstrumentAxis=nysedei_FannieMaeLoanJune12027MaturityMember |
| Namespace Prefix: |
|
| Data Type: |
na |
| Balance Type: |
|
| Period Type: |
|
|
| X |
- Details
| Name: |
us-gaap_DebtInstrumentAxis=nysedei_FannieMaeLoanAugust12033MaturityMember |
| Namespace Prefix: |
|
| Data Type: |
na |
| Balance Type: |
|
| Period Type: |
|
|
| X |
- Details
| Name: |
us-gaap_DebtInstrumentAxis=nysedei_TermLoanMarch32025MaturityMember |
| Namespace Prefix: |
|
| Data Type: |
na |
| Balance Type: |
|
| Period Type: |
|
|
| X |
- Details
| Name: |
us-gaap_DebtInstrumentAxis=nysedei_FannieMaeLoanApril12025MaturityMember |
| Namespace Prefix: |
|
| Data Type: |
na |
| Balance Type: |
|
| Period Type: |
|
|
| X |
- Details
| Name: |
us-gaap_DebtInstrumentAxis=nysedei_TermLoanAug152026MaturityMember |
| Namespace Prefix: |
|
| Data Type: |
na |
| Balance Type: |
|
| Period Type: |
|
|
| X |
- Details
| Name: |
us-gaap_DebtInstrumentAxis=nysedei_TermLoanSep192026MaturityMember |
| Namespace Prefix: |
|
| Data Type: |
na |
| Balance Type: |
|
| Period Type: |
|
|
| X |
- Details
| Name: |
us-gaap_DebtInstrumentAxis=nysedei_TermLoanSep262026MaturityMember |
| Namespace Prefix: |
|
| Data Type: |
na |
| Balance Type: |
|
| Period Type: |
|
|
| X |
- Details
| Name: |
us-gaap_DebtInstrumentAxis=nysedei_TermLoanNov12026MaturityMember |
| Namespace Prefix: |
|
| Data Type: |
na |
| Balance Type: |
|
| Period Type: |
|
|
| X |
- Details
| Name: |
us-gaap_DebtInstrumentAxis=nysedei_TermLoanMay182028MaturityMember |
| Namespace Prefix: |
|
| Data Type: |
na |
| Balance Type: |
|
| Period Type: |
|
|
| X |
- Details
| Name: |
us-gaap_DebtInstrumentAxis=nysedei_TermLoanJanuary12029MaturityMember |
| Namespace Prefix: |
|
| Data Type: |
na |
| Balance Type: |
|
| Period Type: |
|
|
| X |
- Details
| Name: |
us-gaap_DebtInstrumentAxis=nysedei_FannieMaeLoanMHAJune12029MaturityMember |
| Namespace Prefix: |
|
| Data Type: |
na |
| Balance Type: |
|
| Period Type: |
|
|
| X |
- Details
| Name: |
us-gaap_DebtInstrumentAxis=nysedei_FannieMaeLoansBoutiquesJune12029MaturityMember |
| Namespace Prefix: |
|
| Data Type: |
na |
| Balance Type: |
|
| Period Type: |
|
|
| X |
- Details
| Name: |
srt_ConsolidatedEntitiesAxis=srt_AffiliatedEntityMember |
| Namespace Prefix: |
|
| Data Type: |
na |
| Balance Type: |
|
| Period Type: |
|
|
| X |
- Details
| Name: |
us-gaap_DebtInstrumentAxis=nysedei_TermLoanDecember192024MaturityMember |
| Namespace Prefix: |
|
| Data Type: |
na |
| Balance Type: |
|
| Period Type: |
|
|
| X |
- Details
| Name: |
us-gaap_DebtInstrumentAxis=nysedei_TermLoanMay152027MaturityMember |
| Namespace Prefix: |
|
| Data Type: |
na |
| Balance Type: |
|
| Period Type: |
|
|
| X |
- Details
| Name: |
us-gaap_DebtInstrumentAxis=nysedei_TermLoanAugust192028MaturityMember |
| Namespace Prefix: |
|
| Data Type: |
na |
| Balance Type: |
|
| Period Type: |
|
|
| X |
- Details
| Name: |
us-gaap_DebtInstrumentAxis=nysedei_TermLoanApril262029MaturityMember |
| Namespace Prefix: |
|
| Data Type: |
na |
| Balance Type: |
|
| Period Type: |
|
|
| X |
- Details
| Name: |
us-gaap_DebtInstrumentAxis=nysedei_FannieMaeLoanJune12029MaturityMember |
| Namespace Prefix: |
|
| Data Type: |
na |
| Balance Type: |
|
| Period Type: |
|
|
v3.23.3
Secured Notes Payable, Net - Debt by Type (Details) - USD ($)
$ in Thousands |
9 Months Ended |
|
Sep. 30, 2023 |
Dec. 31, 2022 |
| Debt Instrument [Line Items] |
|
|
| Consolidated debt |
$ 5,570,259
|
$ 5,220,902
|
| Principal balance (in billions) |
$ 3,830,000
|
|
| Weighted average remaining life (including extension options) |
4 years 3 months 18 days
|
|
| Weighted average remaining fixed interest period |
2 years 1 month 6 days
|
|
| Weighted average annual interest rate |
2.65%
|
|
| Aggregate swapped to fixed rate loans |
|
|
| Debt Instrument [Line Items] |
|
|
| Consolidated debt |
$ 3,805,000
|
4,642,400
|
| Aggregate fixed rate loans |
|
|
| Debt Instrument [Line Items] |
|
|
| Consolidated debt |
27,859
|
28,502
|
| Aggregate capped rate loans |
|
|
| Debt Instrument [Line Items] |
|
|
| Consolidated debt |
822,000
|
0
|
| Aggregate floating rate loans |
|
|
| Debt Instrument [Line Items] |
|
|
| Consolidated debt |
$ 915,400
|
$ 550,000
|
| X |
- DefinitionLong-Term Debt, Weighted Average Remaining Fixed interest Period
| Name: |
nysedei_LongTermDebtWeightedAverageRemainingFixedInterestPeriod |
| Namespace Prefix: |
nysedei_ |
| Data Type: |
xbrli:durationItemType |
| Balance Type: |
na |
| Period Type: |
duration |
|
| X |
- DefinitionLong-Term Debt, Weighted Average Remaining Life
| Name: |
nysedei_LongTermDebtWeightedAverageRemainingLife |
| Namespace Prefix: |
nysedei_ |
| Data Type: |
xbrli:durationItemType |
| Balance Type: |
na |
| Period Type: |
duration |
|
| X |
- DefinitionAmount, before unamortized (discount) premium and debt issuance costs, of long-term debt. Includes, but is not limited to, notes payable, bonds payable, commercial loans, mortgage loans, convertible debt, subordinated debt and other types of debt. Reference 1: http://fasb.org/us-gaap/role/ref/legacyRef
-Name Accounting Standards Codification
-Section S99
-Paragraph 1
-Subparagraph (SX 210.5-02(22))
-SubTopic 10
-Topic 210
-Publisher FASB
-URI https://asc.fasb.org//1943274/2147480566/210-10-S99-1
Reference 2: http://fasb.org/us-gaap/role/ref/legacyRef
-Topic 942
-SubTopic 210
-Name Accounting Standards Codification
-Section S99
-Paragraph 1
-Subparagraph (SX 210.9-03(16))
-Publisher FASB
-URI https://asc.fasb.org//1943274/2147479853/942-210-S99-1
Reference 3: http://www.xbrl.org/2003/role/disclosureRef
-Topic 470
-SubTopic 20
-Name Accounting Standards Codification
-Section 50
-Paragraph 4
-Subparagraph (b)(1)
-Publisher FASB
-URI https://asc.fasb.org//1943274/2147481139/470-20-50-4
| Name: |
us-gaap_DebtInstrumentCarryingAmount |
| Namespace Prefix: |
us-gaap_ |
| Data Type: |
xbrli:monetaryItemType |
| Balance Type: |
credit |
| Period Type: |
instant |
|
| X |
- DefinitionLine items represent financial concepts included in a table. These concepts are used to disclose reportable information associated with domain members defined in one or many axes to the table. Reference 1: http://www.xbrl.org/2003/role/disclosureRef
-Topic 835
-SubTopic 30
-Name Accounting Standards Codification
-Section 50
-Paragraph 1
-Publisher FASB
-URI https://asc.fasb.org//1943274/2147482900/835-30-50-1
Reference 2: http://www.xbrl.org/2009/role/commonPracticeRef
-Topic 235
-SubTopic 10
-Name Accounting Standards Codification
-Section S99
-Paragraph 1
-Subparagraph (SX 210.4-08(f))
-Publisher FASB
-URI https://asc.fasb.org//1943274/2147480678/235-10-S99-1
Reference 3: http://www.xbrl.org/2003/role/disclosureRef
-Topic 235
-SubTopic 10
-Name Accounting Standards Codification
-Section S99
-Paragraph 3
-Subparagraph (SX 210.12-04(a))
-Publisher FASB
-URI https://asc.fasb.org//1943274/2147480678/235-10-S99-3
Reference 4: http://www.xbrl.org/2003/role/disclosureRef
-Topic 470
-SubTopic 20
-Name Accounting Standards Codification
-Section 50
-Paragraph 1B
-Subparagraph (a)
-Publisher FASB
-URI https://asc.fasb.org//1943274/2147481139/470-20-50-1B
Reference 5: http://www.xbrl.org/2003/role/exampleRef
-Topic 470
-SubTopic 20
-Name Accounting Standards Codification
-Section 55
-Paragraph 69B
-Publisher FASB
-URI https://asc.fasb.org//1943274/2147481568/470-20-55-69B
Reference 6: http://www.xbrl.org/2003/role/exampleRef
-Topic 470
-SubTopic 20
-Name Accounting Standards Codification
-Section 55
-Paragraph 69C
-Publisher FASB
-URI https://asc.fasb.org//1943274/2147481568/470-20-55-69C
Reference 7: http://www.xbrl.org/2003/role/exampleRef
-Topic 470
-SubTopic 20
-Name Accounting Standards Codification
-Section 55
-Paragraph 69E
-Publisher FASB
-URI https://asc.fasb.org//1943274/2147481568/470-20-55-69E
Reference 8: http://www.xbrl.org/2003/role/exampleRef
-Topic 470
-SubTopic 20
-Name Accounting Standards Codification
-Section 55
-Paragraph 69F
-Publisher FASB
-URI https://asc.fasb.org//1943274/2147481568/470-20-55-69F
Reference 9: http://www.xbrl.org/2003/role/disclosureRef
-Topic 470
-SubTopic 20
-Name Accounting Standards Codification
-Section 50
-Paragraph 1B
-Subparagraph (b)
-Publisher FASB
-URI https://asc.fasb.org//1943274/2147481139/470-20-50-1B
Reference 10: http://www.xbrl.org/2003/role/disclosureRef
-Topic 470
-SubTopic 20
-Name Accounting Standards Codification
-Section 50
-Paragraph 1B
-Subparagraph (c)
-Publisher FASB
-URI https://asc.fasb.org//1943274/2147481139/470-20-50-1B
Reference 11: http://www.xbrl.org/2003/role/exampleRef
-Topic 470
-SubTopic 20
-Name Accounting Standards Codification
-Section 50
-Paragraph 1B
-Subparagraph (d)
-Publisher FASB
-URI https://asc.fasb.org//1943274/2147481139/470-20-50-1B
Reference 12: http://www.xbrl.org/2003/role/disclosureRef
-Topic 470
-SubTopic 20
-Name Accounting Standards Codification
-Section 50
-Paragraph 1B
-Subparagraph (e)
-Publisher FASB
-URI https://asc.fasb.org//1943274/2147481139/470-20-50-1B
Reference 13: http://www.xbrl.org/2003/role/disclosureRef
-Topic 470
-SubTopic 20
-Name Accounting Standards Codification
-Section 50
-Paragraph 1B
-Subparagraph (f)
-Publisher FASB
-URI https://asc.fasb.org//1943274/2147481139/470-20-50-1B
Reference 14: http://www.xbrl.org/2003/role/disclosureRef
-Topic 470
-SubTopic 20
-Name Accounting Standards Codification
-Section 50
-Paragraph 1B
-Subparagraph (h)
-Publisher FASB
-URI https://asc.fasb.org//1943274/2147481139/470-20-50-1B
Reference 15: http://www.xbrl.org/2003/role/disclosureRef
-Topic 470
-SubTopic 20
-Name Accounting Standards Codification
-Section 50
-Paragraph 1D
-Subparagraph (a)
-Publisher FASB
-URI https://asc.fasb.org//1943274/2147481139/470-20-50-1D
Reference 16: http://www.xbrl.org/2003/role/disclosureRef
-Topic 470
-SubTopic 20
-Name Accounting Standards Codification
-Section 50
-Paragraph 1D
-Subparagraph (b)
-Publisher FASB
-URI https://asc.fasb.org//1943274/2147481139/470-20-50-1D
Reference 17: http://www.xbrl.org/2003/role/disclosureRef
-Topic 470
-SubTopic 20
-Name Accounting Standards Codification
-Section 50
-Paragraph 1D
-Subparagraph (c)
-Publisher FASB
-URI https://asc.fasb.org//1943274/2147481139/470-20-50-1D
Reference 18: http://www.xbrl.org/2003/role/disclosureRef
-Topic 470
-SubTopic 20
-Name Accounting Standards Codification
-Section 50
-Paragraph 1E
-Subparagraph (a)
-Publisher FASB
-URI https://asc.fasb.org//1943274/2147481139/470-20-50-1E
Reference 19: http://www.xbrl.org/2003/role/disclosureRef
-Topic 470
-SubTopic 20
-Name Accounting Standards Codification
-Section 50
-Paragraph 1E
-Subparagraph (c)
-Publisher FASB
-URI https://asc.fasb.org//1943274/2147481139/470-20-50-1E
Reference 20: http://www.xbrl.org/2003/role/disclosureRef
-Topic 470
-SubTopic 20
-Name Accounting Standards Codification
-Section 50
-Paragraph 1E
-Subparagraph (d)
-Publisher FASB
-URI https://asc.fasb.org//1943274/2147481139/470-20-50-1E
Reference 21: http://www.xbrl.org/2003/role/disclosureRef
-Topic 470
-SubTopic 20
-Name Accounting Standards Codification
-Section 50
-Paragraph 1F
-Subparagraph (a)
-Publisher FASB
-URI https://asc.fasb.org//1943274/2147481139/470-20-50-1F
Reference 22: http://www.xbrl.org/2003/role/disclosureRef
-Topic 470
-SubTopic 20
-Name Accounting Standards Codification
-Section 50
-Paragraph 1F
-Subparagraph (b)
-Publisher FASB
-URI https://asc.fasb.org//1943274/2147481139/470-20-50-1F
Reference 23: http://www.xbrl.org/2003/role/disclosureRef
-Topic 470
-SubTopic 20
-Name Accounting Standards Codification
-Section 50
-Paragraph 1F
-Subparagraph (b)(1)
-Publisher FASB
-URI https://asc.fasb.org//1943274/2147481139/470-20-50-1F
Reference 24: http://www.xbrl.org/2003/role/disclosureRef
-Topic 470
-SubTopic 20
-Name Accounting Standards Codification
-Section 50
-Paragraph 1F
-Subparagraph (b)(2)
-Publisher FASB
-URI https://asc.fasb.org//1943274/2147481139/470-20-50-1F
Reference 25: http://www.xbrl.org/2003/role/disclosureRef
-Topic 470
-SubTopic 20
-Name Accounting Standards Codification
-Section 50
-Paragraph 1I
-Subparagraph (c)
-Publisher FASB
-URI https://asc.fasb.org//1943274/2147481139/470-20-50-1I
| Name: |
us-gaap_DebtInstrumentLineItems |
| Namespace Prefix: |
us-gaap_ |
| Data Type: |
xbrli:stringItemType |
| Balance Type: |
na |
| Period Type: |
duration |
|
| X |
- DefinitionWeighted average interest rate of debt outstanding.
| Name: |
us-gaap_DebtWeightedAverageInterestRate |
| Namespace Prefix: |
us-gaap_ |
| Data Type: |
dtr-types:percentItemType |
| Balance Type: |
na |
| Period Type: |
instant |
|
| X |
- DefinitionThe portion of the carrying amount of long-term borrowings outstanding as of the balance sheet date, including current maturities, which accrues interest at a set, unchanging rate.
| Name: |
us-gaap_LongtermDebtPercentageBearingFixedInterestAmount |
| Namespace Prefix: |
us-gaap_ |
| Data Type: |
xbrli:monetaryItemType |
| Balance Type: |
credit |
| Period Type: |
instant |
|
| X |
- Details
| Name: |
us-gaap_DebtInstrumentAxis=nysedei_EffectiveFixedRateLoansMember |
| Namespace Prefix: |
|
| Data Type: |
na |
| Balance Type: |
|
| Period Type: |
|
|
| X |
- Details
| Name: |
us-gaap_DebtInstrumentAxis=nysedei_FixedRateLoansMember |
| Namespace Prefix: |
|
| Data Type: |
na |
| Balance Type: |
|
| Period Type: |
|
|
| X |
- Details
| Name: |
us-gaap_DebtInstrumentAxis=nysedei_CappedRateLoansMember |
| Namespace Prefix: |
|
| Data Type: |
na |
| Balance Type: |
|
| Period Type: |
|
|
| X |
- Details
| Name: |
us-gaap_DebtInstrumentAxis=nysedei_VariableRateLoansMember |
| Namespace Prefix: |
|
| Data Type: |
na |
| Balance Type: |
|
| Period Type: |
|
|
v3.23.3
Secured Notes Payable, Net - Future Principal Payments (Details) - USD ($)
$ in Thousands |
Sep. 30, 2023 |
Dec. 31, 2022 |
| Minimum Future Principal Payments Due |
|
|
| 2024 |
$ 891
|
|
| 2025 |
838,333
|
|
| 2026 |
1,015,976
|
|
| 2027 |
1,401,022
|
|
| 2028 |
926,069
|
|
| Thereafter |
1,387,968
|
|
| Total future principal payments |
$ 5,570,259
|
$ 5,220,902
|
| X |
- DefinitionAmount, before unamortized (discount) premium and debt issuance costs, of long-term debt. Includes, but is not limited to, notes payable, bonds payable, commercial loans, mortgage loans, convertible debt, subordinated debt and other types of debt. Reference 1: http://fasb.org/us-gaap/role/ref/legacyRef
-Name Accounting Standards Codification
-Section S99
-Paragraph 1
-Subparagraph (SX 210.5-02(22))
-SubTopic 10
-Topic 210
-Publisher FASB
-URI https://asc.fasb.org//1943274/2147480566/210-10-S99-1
Reference 2: http://fasb.org/us-gaap/role/ref/legacyRef
-Topic 942
-SubTopic 210
-Name Accounting Standards Codification
-Section S99
-Paragraph 1
-Subparagraph (SX 210.9-03(16))
-Publisher FASB
-URI https://asc.fasb.org//1943274/2147479853/942-210-S99-1
Reference 3: http://www.xbrl.org/2003/role/disclosureRef
-Topic 470
-SubTopic 20
-Name Accounting Standards Codification
-Section 50
-Paragraph 4
-Subparagraph (b)(1)
-Publisher FASB
-URI https://asc.fasb.org//1943274/2147481139/470-20-50-4
| Name: |
us-gaap_DebtInstrumentCarryingAmount |
| Namespace Prefix: |
us-gaap_ |
| Data Type: |
xbrli:monetaryItemType |
| Balance Type: |
credit |
| Period Type: |
instant |
|
| X |
- References
+ Details
| Name: |
us-gaap_LongTermDebtByMaturityAbstract |
| Namespace Prefix: |
us-gaap_ |
| Data Type: |
xbrli:stringItemType |
| Balance Type: |
na |
| Period Type: |
duration |
|
| X |
- DefinitionAmount of long-term debt payable, sinking fund requirements, and other securities issued that are redeemable by holder at fixed or determinable prices and dates maturing in the next rolling twelve months following the latest balance sheet. For interim and annual periods when interim periods are reported on a rolling approach, from latest balance sheet date. Reference 1: http://www.xbrl.org/2009/role/commonPracticeRef
-Topic 235
-SubTopic 10
-Name Accounting Standards Codification
-Section S99
-Paragraph 3
-Subparagraph (SX 210.12-04(a))
-Publisher FASB
-URI https://asc.fasb.org//1943274/2147480678/235-10-S99-3
| Name: |
us-gaap_LongTermDebtMaturitiesRepaymentsOfPrincipalInNextRollingTwelveMonths |
| Namespace Prefix: |
us-gaap_ |
| Data Type: |
xbrli:monetaryItemType |
| Balance Type: |
credit |
| Period Type: |
instant |
|
| X |
- DefinitionAmount of long-term debt payable, sinking fund requirements, and other securities issued that are redeemable by holder at fixed or determinable prices and dates maturing after the fifth rolling twelve months following the latest balance sheet. For interim and annual periods when interim periods are reported on a rolling approach, from latest balance sheet date. Reference 1: http://www.xbrl.org/2009/role/commonPracticeRef
-Topic 235
-SubTopic 10
-Name Accounting Standards Codification
-Section S99
-Paragraph 3
-Subparagraph (SX 210.12-04(a))
-Publisher FASB
-URI https://asc.fasb.org//1943274/2147480678/235-10-S99-3
| Name: |
us-gaap_LongTermDebtMaturitiesRepaymentsOfPrincipalInRollingAfterYearFive |
| Namespace Prefix: |
us-gaap_ |
| Data Type: |
xbrli:monetaryItemType |
| Balance Type: |
credit |
| Period Type: |
instant |
|
| X |
- DefinitionAmount of long-term debt payable, sinking fund requirements, and other securities issued that are redeemable by holder at fixed or determinable prices and dates maturing in the fifth rolling twelve months following the latest balance sheet. For interim and annual periods when interim periods are reported on a rolling approach, from latest balance sheet date. Reference 1: http://www.xbrl.org/2009/role/commonPracticeRef
-Topic 235
-SubTopic 10
-Name Accounting Standards Codification
-Section S99
-Paragraph 3
-Subparagraph (SX 210.12-04(a))
-Publisher FASB
-URI https://asc.fasb.org//1943274/2147480678/235-10-S99-3
| Name: |
us-gaap_LongTermDebtMaturitiesRepaymentsOfPrincipalInRollingYearFive |
| Namespace Prefix: |
us-gaap_ |
| Data Type: |
xbrli:monetaryItemType |
| Balance Type: |
credit |
| Period Type: |
instant |
|
| X |
- DefinitionAmount of long-term debt payable, sinking fund requirements, and other securities issued that are redeemable by holder at fixed or determinable prices and dates maturing in the fourth rolling twelve months following the latest balance sheet. For interim and annual periods when interim periods are reported on a rolling approach, from latest balance sheet date. Reference 1: http://www.xbrl.org/2009/role/commonPracticeRef
-Topic 235
-SubTopic 10
-Name Accounting Standards Codification
-Section S99
-Paragraph 3
-Subparagraph (SX 210.12-04(a))
-Publisher FASB
-URI https://asc.fasb.org//1943274/2147480678/235-10-S99-3
| Name: |
us-gaap_LongTermDebtMaturitiesRepaymentsOfPrincipalInRollingYearFour |
| Namespace Prefix: |
us-gaap_ |
| Data Type: |
xbrli:monetaryItemType |
| Balance Type: |
credit |
| Period Type: |
instant |
|
| X |
- DefinitionAmount of long-term debt payable, sinking fund requirements, and other securities issued that are redeemable by holder at fixed or determinable prices and dates maturing in the third rolling twelve months following the latest balance sheet. For interim and annual periods when interim periods are reported on a rolling approach, from latest balance sheet date. Reference 1: http://www.xbrl.org/2009/role/commonPracticeRef
-Topic 235
-SubTopic 10
-Name Accounting Standards Codification
-Section S99
-Paragraph 3
-Subparagraph (SX 210.12-04(a))
-Publisher FASB
-URI https://asc.fasb.org//1943274/2147480678/235-10-S99-3
| Name: |
us-gaap_LongTermDebtMaturitiesRepaymentsOfPrincipalInRollingYearThree |
| Namespace Prefix: |
us-gaap_ |
| Data Type: |
xbrli:monetaryItemType |
| Balance Type: |
credit |
| Period Type: |
instant |
|
| X |
- DefinitionAmount of long-term debt payable, sinking fund requirements, and other securities issued that are redeemable by holder at fixed or determinable prices and dates maturing in the second rolling twelve months following the latest balance sheet. For interim and annual periods when interim periods are reported on a rolling approach, from latest balance sheet date. Reference 1: http://www.xbrl.org/2009/role/commonPracticeRef
-Topic 235
-SubTopic 10
-Name Accounting Standards Codification
-Section S99
-Paragraph 3
-Subparagraph (SX 210.12-04(a))
-Publisher FASB
-URI https://asc.fasb.org//1943274/2147480678/235-10-S99-3
| Name: |
us-gaap_LongTermDebtMaturitiesRepaymentsOfPrincipalInRollingYearTwo |
| Namespace Prefix: |
us-gaap_ |
| Data Type: |
xbrli:monetaryItemType |
| Balance Type: |
credit |
| Period Type: |
instant |
|
v3.23.3
Secured Notes Payable, Net - Loan Costs and Accumulated Amortization (Details) - USD ($)
$ in Thousands |
3 Months Ended |
9 Months Ended |
Sep. 30, 2023 |
Sep. 30, 2022 |
Sep. 30, 2023 |
Sep. 30, 2022 |
| Loan Costs Included In Interest Expense |
|
|
|
|
| Loan premium amortized and written off |
|
|
$ (344)
|
$ (344)
|
| Interest Expense |
|
|
|
|
| Loan Costs Included In Interest Expense |
|
|
|
|
| Loan premium amortized and written off |
$ (116)
|
$ (116)
|
(344)
|
(344)
|
| Deferred loan costs amortized and written off |
2,261
|
2,030
|
6,623
|
5,908
|
| Loan costs expensed |
59
|
8
|
79
|
110
|
| Total |
$ 2,204
|
$ 1,922
|
$ 6,358
|
$ 5,674
|
| X |
- DefinitionDeferred Loan Costs Amortized and Written Off
| Name: |
nysedei_DeferredLoanCostsAmortizedAndWrittenOff |
| Namespace Prefix: |
nysedei_ |
| Data Type: |
xbrli:monetaryItemType |
| Balance Type: |
debit |
| Period Type: |
duration |
|
| X |
- DefinitionLoan Costs, Amortization Of Discount (Premium), Debt Issuance Cost, Write-offs, And Expense
| Name: |
nysedei_LoanCostsAmortizationOfDiscountPremiumDebtIssuanceCostWriteOffsAndExpense |
| Namespace Prefix: |
nysedei_ |
| Data Type: |
xbrli:monetaryItemType |
| Balance Type: |
debit |
| Period Type: |
duration |
|
| X |
- Definition
+ References
+ Details
| Name: |
nysedei_LoanCostsExpensed |
| Namespace Prefix: |
nysedei_ |
| Data Type: |
xbrli:monetaryItemType |
| Balance Type: |
debit |
| Period Type: |
duration |
|
| X |
- DefinitionLoan Costs Included In Interest Expense [Abstract]
| Name: |
nysedei_LoanCostsIncludedInInterestExpenseAbstract |
| Namespace Prefix: |
nysedei_ |
| Data Type: |
xbrli:stringItemType |
| Balance Type: |
na |
| Period Type: |
duration |
|
| X |
- DefinitionAmount of noncash expense included in interest expense to amortize debt discount and premium associated with the related debt instruments. Excludes amortization of financing costs. Alternate captions include noncash interest expense. Reference 1: http://fasb.org/us-gaap/role/ref/legacyRef
-Name Accounting Standards Codification
-Section 45
-Paragraph 28
-Subparagraph (b)
-SubTopic 10
-Topic 230
-Publisher FASB
-URI https://asc.fasb.org//1943274/2147482740/230-10-45-28
Reference 2: http://www.xbrl.org/2003/role/disclosureRef
-Topic 470
-SubTopic 20
-Name Accounting Standards Codification
-Section 50
-Paragraph 1F
-Subparagraph (b)(2)
-Publisher FASB
-URI https://asc.fasb.org//1943274/2147481139/470-20-50-1F
Reference 3: http://fasb.org/us-gaap/role/ref/legacyRef
-Name Accounting Standards Codification
-Topic 835
-SubTopic 30
-Section 45
-Paragraph 1A
-Publisher FASB
-URI https://asc.fasb.org//1943274/2147482925/835-30-45-1A
Reference 4: http://fasb.org/us-gaap/role/ref/legacyRef
-Topic 220
-SubTopic 10
-Name Accounting Standards Codification
-Section S99
-Paragraph 2
-Subparagraph (SX 210.5-03.8)
-Publisher FASB
-URI https://asc.fasb.org//1943274/2147483621/220-10-S99-2
| Name: |
us-gaap_AmortizationOfDebtDiscountPremium |
| Namespace Prefix: |
us-gaap_ |
| Data Type: |
xbrli:monetaryItemType |
| Balance Type: |
debit |
| Period Type: |
duration |
|
| X |
- Details
| Name: |
us-gaap_IncomeStatementLocationAxis=us-gaap_InterestExpenseMember |
| Namespace Prefix: |
|
| Data Type: |
na |
| Balance Type: |
|
| Period Type: |
|
|
v3.23.3
Interest Payable, Accounts Payable and Deferred Revenue (Details) - USD ($)
$ in Thousands |
Sep. 30, 2023 |
Dec. 31, 2022 |
| Accounts Payable and Accrued Liabilities [Abstract] |
|
|
| Interest payable |
$ 18,028
|
$ 13,529
|
| Accounts payable and accrued liabilities |
99,805
|
80,244
|
| Deferred revenue |
51,236
|
47,152
|
| Total interest payable, accounts payable and deferred revenue |
$ 169,069
|
$ 140,925
|
| X |
- DefinitionSum of the carrying values as of the balance sheet date of obligations incurred through that date, including liabilities incurred and payable to vendors for goods and services received, taxes, interest, rent and utilities, compensation costs, payroll taxes and fringe benefits (other than pension and postretirement obligations), contractual rights and obligations, and statutory obligations. Reference 1: http://fasb.org/us-gaap/role/ref/legacyRef
-Name Accounting Standards Codification
-Topic 942
-SubTopic 210
-Section S99
-Paragraph 1
-Subparagraph (SX 210.9-03.15(1),(5))
-Publisher FASB
-URI https://asc.fasb.org//1943274/2147479853/942-210-S99-1
| Name: |
us-gaap_AccountsPayableAndAccruedLiabilitiesCurrentAndNoncurrent |
| Namespace Prefix: |
us-gaap_ |
| Data Type: |
xbrli:monetaryItemType |
| Balance Type: |
credit |
| Period Type: |
instant |
|
| X |
- References
+ Details
| Name: |
us-gaap_AccountsPayableAndAccruedLiabilitiesCurrentAndNoncurrentAbstract |
| Namespace Prefix: |
us-gaap_ |
| Data Type: |
xbrli:stringItemType |
| Balance Type: |
na |
| Period Type: |
duration |
|
| X |
- DefinitionAmount of liabilities incurred and payable to vendors for goods and services received, and accrued liabilities classified as other. Reference 1: http://www.xbrl.org/2003/role/disclosureRef
-Topic 946
-SubTopic 210
-Name Accounting Standards Codification
-Section S99
-Paragraph 1
-Subparagraph (SX 210.6-04(10)(d))
-Publisher FASB
-URI https://asc.fasb.org//1943274/2147479617/946-210-S99-1
| Name: |
us-gaap_AccountsPayableAndOtherAccruedLiabilities |
| Namespace Prefix: |
us-gaap_ |
| Data Type: |
xbrli:monetaryItemType |
| Balance Type: |
credit |
| Period Type: |
instant |
|
| X |
- DefinitionAmount of obligation to transfer good or service to customer for which consideration has been received or is receivable. Reference 1: http://www.xbrl.org/2003/role/disclosureRef
-Topic 606
-SubTopic 10
-Name Accounting Standards Codification
-Section 45
-Paragraph 1
-Publisher FASB
-URI https://asc.fasb.org//1943274/2147479837/606-10-45-1
Reference 2: http://www.xbrl.org/2003/role/disclosureRef
-Topic 606
-SubTopic 10
-Name Accounting Standards Codification
-Section 50
-Paragraph 8
-Subparagraph (a)
-Publisher FASB
-URI https://asc.fasb.org//1943274/2147479806/606-10-50-8
Reference 3: http://www.xbrl.org/2003/role/disclosureRef
-Topic 606
-SubTopic 10
-Name Accounting Standards Codification
-Section 45
-Paragraph 2
-Publisher FASB
-URI https://asc.fasb.org//1943274/2147479837/606-10-45-2
| Name: |
us-gaap_ContractWithCustomerLiability |
| Namespace Prefix: |
us-gaap_ |
| Data Type: |
xbrli:monetaryItemType |
| Balance Type: |
credit |
| Period Type: |
instant |
|
| X |
- DefinitionAmount of interest payable on debt, including, but not limited to, trade payables. Reference 1: http://www.xbrl.org/2009/role/commonPracticeRef
-Topic 944
-SubTopic 210
-Name Accounting Standards Codification
-Section S99
-Paragraph 1
-Subparagraph (SX 210.7-03(a)(15)(a))
-Publisher FASB
-URI https://asc.fasb.org//1943274/2147479440/944-210-S99-1
Reference 2: http://fasb.org/us-gaap/role/ref/legacyRef
-Name Accounting Standards Codification
-Topic 942
-SubTopic 210
-Section S99
-Paragraph 1
-Subparagraph (SX 210.9-03.15(5))
-Publisher FASB
-URI https://asc.fasb.org//1943274/2147479853/942-210-S99-1
| Name: |
us-gaap_InterestPayableCurrentAndNoncurrent |
| Namespace Prefix: |
us-gaap_ |
| Data Type: |
xbrli:monetaryItemType |
| Balance Type: |
credit |
| Period Type: |
instant |
|
v3.23.3
Derivative Contracts - Summary of Derivatives (Details)
|
Sep. 30, 2023
USD ($)
instrument
|
Jun. 30, 2023
USD ($)
instrument
|
| Derivative [Line Items] |
|
|
| Percentage of notional amount disclosed |
100.00%
|
|
| Unconsolidated Funds |
|
|
| Derivative [Line Items] |
|
|
| Percentage of notional amount disclosed |
100.00%
|
|
| Interest Rate Swap | Derivatives Designated as Cash Flow Hedges | Cash Flow Hedging |
|
|
| Derivative [Line Items] |
|
|
| Number of Interest Rate Contracts | instrument |
24
|
|
| Notional | $ |
$ 3,805,000,000
|
|
| Percentage of notional amount disclosed |
100.00%
|
|
| Interest Rate Swap | Derivatives Designated as Cash Flow Hedges | Cash Flow Hedging | Unconsolidated Funds |
|
|
| Derivative [Line Items] |
|
|
| Number of Interest Rate Contracts | instrument |
2
|
|
| Notional | $ |
$ 115,000,000
|
|
| Percentage of notional amount disclosed |
100.00%
|
|
| Interest Rate Cap | Derivatives Designated as Cash Flow Hedges | Cash Flow Hedging |
|
|
| Derivative [Line Items] |
|
|
| Number of Interest Rate Contracts | instrument |
5
|
|
| Notional | $ |
$ 822,000,000
|
|
| Interest Rate Cap | Derivatives Designated as Cash Flow Hedges | Cash Flow Hedging | Interest Rate Cap, Purchased Notional Amount |
|
|
| Derivative [Line Items] |
|
|
| Number of Interest Rate Contracts | instrument |
5
|
|
| Notional | $ |
$ 822,000,000
|
|
| Interest Rate Cap | Derivatives Not Designated as Cash Flow Hedges |
|
|
| Derivative [Line Items] |
|
|
| Number of Interest Rate Contracts | instrument |
0
|
|
| Notional | $ |
$ 0
|
|
| Interest Rate Cap | Derivatives Not Designated as Cash Flow Hedges | Interest Rate Cap, Expired Notional Amount |
|
|
| Derivative [Line Items] |
|
|
| Number of Interest Rate Contracts | instrument |
|
5
|
| Notional | $ |
|
$ 1,100,000,000
|
| X |
- DefinitionPercentage Of Notional Amount Of Derivative Disclosed
| Name: |
nysedei_PercentageOfNotionalAmountOfDerivativeDisclosed |
| Namespace Prefix: |
nysedei_ |
| Data Type: |
dtr-types1:percentItemType |
| Balance Type: |
na |
| Period Type: |
instant |
|
| X |
- DefinitionLine items represent financial concepts included in a table. These concepts are used to disclose reportable information associated with domain members defined in one or many axes to the table. Reference 1: http://www.xbrl.org/2003/role/disclosureRef
-Topic 815
-SubTopic 40
-Name Accounting Standards Codification
-Section 50
-Paragraph 5
-Subparagraph (f)
-Publisher FASB
-URI https://asc.fasb.org//1943274/2147480237/815-40-50-5
| Name: |
us-gaap_DerivativeLineItems |
| Namespace Prefix: |
us-gaap_ |
| Data Type: |
xbrli:stringItemType |
| Balance Type: |
na |
| Period Type: |
duration |
|
| X |
- DefinitionNominal or face amount used to calculate payment on derivative. Reference 1: http://www.xbrl.org/2009/role/commonPracticeRef
-Topic 815
-SubTopic 10
-Name Accounting Standards Codification
-Section 50
-Paragraph 1B
-Publisher FASB
-URI https://asc.fasb.org//1943274/2147480434/815-10-50-1B
Reference 2: http://www.xbrl.org/2009/role/commonPracticeRef
-Topic 815
-SubTopic 10
-Name Accounting Standards Codification
-Section 50
-Paragraph 1A
-Subparagraph (d)
-Publisher FASB
-URI https://asc.fasb.org//1943274/2147480434/815-10-50-1A
| Name: |
us-gaap_DerivativeNotionalAmount |
| Namespace Prefix: |
us-gaap_ |
| Data Type: |
xbrli:monetaryItemType |
| Balance Type: |
na |
| Period Type: |
instant |
|
| X |
- DefinitionNumber of interest rate derivative instruments held by the entity at the reporting date. Reference 1: http://fasb.org/us-gaap/role/ref/legacyRef
-Name Accounting Standards Codification
-Topic 815
-SubTopic 10
-Section 50
-Paragraph 1B
-Publisher FASB
-URI https://asc.fasb.org//1943274/2147480434/815-10-50-1B
Reference 2: http://fasb.org/us-gaap/role/ref/legacyRef
-Name Accounting Standards Codification
-Topic 815
-SubTopic 10
-Section 50
-Paragraph 1A
-Subparagraph (d)
-Publisher FASB
-URI https://asc.fasb.org//1943274/2147480434/815-10-50-1A
| Name: |
us-gaap_NumberOfInterestRateDerivativesHeld |
| Namespace Prefix: |
us-gaap_ |
| Data Type: |
xbrli:integerItemType |
| Balance Type: |
na |
| Period Type: |
instant |
|
| X |
- Details
| Name: |
us-gaap_EquityMethodInvestmentNonconsolidatedInvesteeAxis=us-gaap_EquityMethodInvestmentNonconsolidatedInvesteeOrGroupOfInvesteesMember |
| Namespace Prefix: |
|
| Data Type: |
na |
| Balance Type: |
|
| Period Type: |
|
|
| X |
- Details
| Name: |
us-gaap_DerivativeInstrumentRiskAxis=us-gaap_InterestRateSwapMember |
| Namespace Prefix: |
|
| Data Type: |
na |
| Balance Type: |
|
| Period Type: |
|
|
| X |
- Details
| Name: |
us-gaap_HedgingDesignationAxis=us-gaap_DesignatedAsHedgingInstrumentMember |
| Namespace Prefix: |
|
| Data Type: |
na |
| Balance Type: |
|
| Period Type: |
|
|
| X |
- Details
| Name: |
us-gaap_DerivativeInstrumentsGainLossByHedgingRelationshipAxis=us-gaap_CashFlowHedgingMember |
| Namespace Prefix: |
|
| Data Type: |
na |
| Balance Type: |
|
| Period Type: |
|
|
| X |
- Details
| Name: |
us-gaap_DerivativeInstrumentRiskAxis=us-gaap_InterestRateCapMember |
| Namespace Prefix: |
|
| Data Type: |
na |
| Balance Type: |
|
| Period Type: |
|
|
| X |
- Details
| Name: |
us-gaap_FinancialInstrumentAxis=nysedei_InterestRateCapPurchasedNotionalAmountMember |
| Namespace Prefix: |
|
| Data Type: |
na |
| Balance Type: |
|
| Period Type: |
|
|
| X |
- Details
| Name: |
us-gaap_HedgingDesignationAxis=us-gaap_NondesignatedMember |
| Namespace Prefix: |
|
| Data Type: |
na |
| Balance Type: |
|
| Period Type: |
|
|
| X |
- Details
| Name: |
us-gaap_FinancialInstrumentAxis=nysedei_InterestRateCapExpiredNotionalAmountMember |
| Namespace Prefix: |
|
| Data Type: |
na |
| Balance Type: |
|
| Period Type: |
|
|
v3.23.3
Derivative Contracts - Counterparty Credit Risk (Details) - USD ($)
$ in Thousands |
Sep. 30, 2023 |
Dec. 31, 2022 |
| Derivative Instruments, Gain (Loss) [Line Items] |
|
|
| Fair value of derivatives in an asset position |
$ 248,232
|
$ 270,234
|
| Percentage of notional amount disclosed |
100.00%
|
|
| Unconsolidated Funds |
|
|
| Derivative Instruments, Gain (Loss) [Line Items] |
|
|
| Percentage of notional amount disclosed |
100.00%
|
|
| Interest Rate Swap | Derivatives Designated as Cash Flow Hedges | Cash Flow Hedging |
|
|
| Derivative Instruments, Gain (Loss) [Line Items] |
|
|
| Fair value of derivatives in an asset position |
$ 262,322
|
281,982
|
| Percentage of notional amount disclosed |
100.00%
|
|
| Interest Rate Swap | Derivatives Designated as Cash Flow Hedges | Cash Flow Hedging | Unconsolidated Funds |
|
|
| Derivative Instruments, Gain (Loss) [Line Items] |
|
|
| Fair value of derivatives in an asset position |
$ 12,877
|
$ 12,863
|
| Percentage of notional amount disclosed |
100.00%
|
|
| X |
- DefinitionPercentage Of Notional Amount Of Derivative Disclosed
| Name: |
nysedei_PercentageOfNotionalAmountOfDerivativeDisclosed |
| Namespace Prefix: |
nysedei_ |
| Data Type: |
dtr-types1:percentItemType |
| Balance Type: |
na |
| Period Type: |
instant |
|
| X |
- DefinitionFair value, after the effects of master netting arrangements, of a financial asset or other contract with one or more underlyings, notional amount or payment provision or both, and the contract can be net settled by means outside the contract or delivery of an asset. Includes assets not subject to a master netting arrangement and not elected to be offset. Reference 1: http://www.xbrl.org/2003/role/disclosureRef
-Topic 946
-SubTopic 210
-Name Accounting Standards Codification
-Section 50
-Paragraph 12
-Publisher FASB
-URI https://asc.fasb.org//1943274/2147480524/946-210-50-12
Reference 2: http://www.xbrl.org/2003/role/disclosureRef
-Topic 946
-SubTopic 210
-Name Accounting Standards Codification
-Section 50
-Paragraph 6
-Subparagraph (e)
-Publisher FASB
-URI https://asc.fasb.org//1943274/2147480524/946-210-50-6
Reference 3: http://www.xbrl.org/2003/role/exampleRef
-Topic 946
-SubTopic 210
-Name Accounting Standards Codification
-Section 55
-Paragraph 1
-Publisher FASB
-URI https://asc.fasb.org//1943274/2147480493/946-210-55-1
Reference 4: http://www.xbrl.org/2003/role/disclosureRef
-Topic 946
-SubTopic 210
-Name Accounting Standards Codification
-Section 50
-Paragraph 6
-Subparagraph (a)(1)
-Publisher FASB
-URI https://asc.fasb.org//1943274/2147480524/946-210-50-6
Reference 5: http://www.xbrl.org/2003/role/disclosureRef
-Topic 946
-SubTopic 210
-Name Accounting Standards Codification
-Section 50
-Paragraph 6
-Subparagraph (a)(2)
-Publisher FASB
-URI https://asc.fasb.org//1943274/2147480524/946-210-50-6
Reference 6: http://www.xbrl.org/2003/role/disclosureRef
-Topic 946
-SubTopic 210
-Name Accounting Standards Codification
-Section 50
-Paragraph 6
-Subparagraph (a)(4)
-Publisher FASB
-URI https://asc.fasb.org//1943274/2147480524/946-210-50-6
Reference 7: http://www.xbrl.org/2003/role/disclosureRef
-Topic 946
-SubTopic 210
-Name Accounting Standards Codification
-Section 50
-Paragraph 1
-Subparagraph (a)(1)
-Publisher FASB
-URI https://asc.fasb.org//1943274/2147480524/946-210-50-1
Reference 8: http://www.xbrl.org/2003/role/disclosureRef
-Topic 946
-SubTopic 210
-Name Accounting Standards Codification
-Section 50
-Paragraph 1
-Subparagraph (b)(1)
-Publisher FASB
-URI https://asc.fasb.org//1943274/2147480524/946-210-50-1
Reference 9: http://www.xbrl.org/2003/role/disclosureRef
-Topic 946
-SubTopic 210
-Name Accounting Standards Codification
-Section 50
-Paragraph 1
-Subparagraph (b)(2)
-Publisher FASB
-URI https://asc.fasb.org//1943274/2147480524/946-210-50-1
Reference 10: http://www.xbrl.org/2003/role/disclosureRef
-Topic 946
-SubTopic 210
-Name Accounting Standards Codification
-Section 50
-Paragraph 1
-Subparagraph (c)(2)
-Publisher FASB
-URI https://asc.fasb.org//1943274/2147480524/946-210-50-1
Reference 11: http://www.xbrl.org/2003/role/disclosureRef
-Topic 946
-SubTopic 210
-Name Accounting Standards Codification
-Section 50
-Paragraph 6
-Subparagraph (f)
-Publisher FASB
-URI https://asc.fasb.org//1943274/2147480524/946-210-50-6
Reference 12: http://www.xbrl.org/2009/role/commonPracticeRef
-Topic 946
-SubTopic 210
-Name Accounting Standards Codification
-Section 50
-Paragraph 6
-Subparagraph (a)(3)
-Publisher FASB
-URI https://asc.fasb.org//1943274/2147480524/946-210-50-6
Reference 13: http://www.xbrl.org/2003/role/disclosureRef
-Topic 946
-SubTopic 210
-Name Accounting Standards Codification
-Section S99
-Paragraph 1
-Subparagraph (SX 210.6-04(3)(c))
-Publisher FASB
-URI https://asc.fasb.org//1943274/2147479617/946-210-S99-1
Reference 14: http://www.xbrl.org/2003/role/disclosureRef
-Topic 946
-SubTopic 320
-Name Accounting Standards Codification
-Section S99
-Paragraph 5C
-Subparagraph (SX 210.12-13C(Column H)(Footnote 7))
-Publisher FASB
-URI https://asc.fasb.org//1943274/2147480032/946-320-S99-5C
Reference 15: http://www.xbrl.org/2003/role/disclosureRef
-Topic 946
-SubTopic 210
-Name Accounting Standards Codification
-Section S99
-Paragraph 1
-Subparagraph (SX 210.6-04(3)(b))
-Publisher FASB
-URI https://asc.fasb.org//1943274/2147479617/946-210-S99-1
Reference 16: http://www.xbrl.org/2003/role/disclosureRef
-Topic 946
-SubTopic 320
-Name Accounting Standards Codification
-Section S99
-Paragraph 5
-Subparagraph (SX 210.12-13(Column A)(Footnote 3))
-Publisher FASB
-URI https://asc.fasb.org//1943274/2147480032/946-320-S99-5
Reference 17: http://www.xbrl.org/2003/role/disclosureRef
-Topic 946
-SubTopic 320
-Name Accounting Standards Codification
-Section S99
-Paragraph 5C
-Subparagraph (SX 210.12-13C(Column H))
-Publisher FASB
-URI https://asc.fasb.org//1943274/2147480032/946-320-S99-5C
Reference 18: http://www.xbrl.org/2003/role/disclosureRef
-Topic 946
-SubTopic 320
-Name Accounting Standards Codification
-Section S99
-Paragraph 5A
-Subparagraph (SX 210.12-13A(Column E))
-Publisher FASB
-URI https://asc.fasb.org//1943274/2147480032/946-320-S99-5A
Reference 19: http://www.xbrl.org/2003/role/disclosureRef
-Topic 946
-SubTopic 320
-Name Accounting Standards Codification
-Section S99
-Paragraph 5B
-Subparagraph (SX 210.12-13B(Column E))
-Publisher FASB
-URI https://asc.fasb.org//1943274/2147480032/946-320-S99-5B
Reference 20: http://www.xbrl.org/2003/role/disclosureRef
-Topic 946
-SubTopic 320
-Name Accounting Standards Codification
-Section S99
-Paragraph 5B
-Subparagraph (SX 210.12-13B(Column E)(Footnote 4))
-Publisher FASB
-URI https://asc.fasb.org//1943274/2147480032/946-320-S99-5B
Reference 21: http://www.xbrl.org/2003/role/disclosureRef
-Topic 210
-SubTopic 20
-Name Accounting Standards Codification
-Section 50
-Paragraph 3
-Subparagraph (c)
-Publisher FASB
-URI https://asc.fasb.org//1943274/2147483466/210-20-50-3
Reference 22: http://www.xbrl.org/2003/role/exampleRef
-Topic 210
-SubTopic 20
-Name Accounting Standards Codification
-Section 55
-Paragraph 22
-Publisher FASB
-URI https://asc.fasb.org//1943274/2147483444/210-20-55-22
Reference 23: http://www.xbrl.org/2003/role/disclosureRef
-Topic 210
-SubTopic 20
-Name Accounting Standards Codification
-Section 55
-Paragraph 10
-Publisher FASB
-URI https://asc.fasb.org//1943274/2147483444/210-20-55-10
Reference 24: http://www.xbrl.org/2003/role/disclosureRef
-Topic 825
-SubTopic 10
-Name Accounting Standards Codification
-Section 50
-Paragraph 10
-Publisher FASB
-URI https://asc.fasb.org//1943274/2147482907/825-10-50-10
| Name: |
us-gaap_DerivativeAssets |
| Namespace Prefix: |
us-gaap_ |
| Data Type: |
xbrli:monetaryItemType |
| Balance Type: |
debit |
| Period Type: |
instant |
|
| X |
- DefinitionLine items represent financial concepts included in a table. These concepts are used to disclose reportable information associated with domain members defined in one or many axes to the table. Reference 1: http://www.xbrl.org/2003/role/disclosureRef
-Topic 815
-SubTopic 10
-Name Accounting Standards Codification
-Section 50
-Paragraph 4E
-Publisher FASB
-URI https://asc.fasb.org//1943274/2147480434/815-10-50-4E
| Name: |
us-gaap_DerivativeInstrumentsGainLossLineItems |
| Namespace Prefix: |
us-gaap_ |
| Data Type: |
xbrli:stringItemType |
| Balance Type: |
na |
| Period Type: |
duration |
|
| X |
- Details
| Name: |
us-gaap_EquityMethodInvestmentNonconsolidatedInvesteeAxis=us-gaap_EquityMethodInvestmentNonconsolidatedInvesteeOrGroupOfInvesteesMember |
| Namespace Prefix: |
|
| Data Type: |
na |
| Balance Type: |
|
| Period Type: |
|
|
| X |
- Details
| Name: |
us-gaap_DerivativeInstrumentRiskAxis=us-gaap_InterestRateSwapMember |
| Namespace Prefix: |
|
| Data Type: |
na |
| Balance Type: |
|
| Period Type: |
|
|
| X |
- Details
| Name: |
us-gaap_HedgingDesignationAxis=us-gaap_DesignatedAsHedgingInstrumentMember |
| Namespace Prefix: |
|
| Data Type: |
na |
| Balance Type: |
|
| Period Type: |
|
|
| X |
- Details
| Name: |
us-gaap_DerivativeInstrumentsGainLossByHedgingRelationshipAxis=us-gaap_CashFlowHedgingMember |
| Namespace Prefix: |
|
| Data Type: |
na |
| Balance Type: |
|
| Period Type: |
|
|
v3.23.3
Derivative Contracts - Impact of Hedges on AOCI and Consolidated Statements of Operations (Details) - USD ($)
$ in Thousands |
3 Months Ended |
9 Months Ended |
Sep. 30, 2023 |
Sep. 30, 2022 |
Sep. 30, 2023 |
Sep. 30, 2022 |
| Derivative [Line Items] |
|
|
|
|
| Gains recorded in AOCI before reclassifications |
|
|
$ 83,157
|
$ 318,408
|
| Interest expense presented on the consolidated statements of operations |
$ (56,043)
|
$ (38,394)
|
(151,859)
|
(109,560)
|
| Income from unconsolidated Fund presented on the consolidated statements of operations |
$ 290
|
$ 356
|
1,177
|
921
|
| Unconsolidated Funds |
|
|
|
|
| Derivative [Line Items] |
|
|
|
|
| Gains recorded in AOCI before reclassifications |
|
|
1,185
|
3,777
|
| Cash Flow Hedging | Derivatives Designated as Cash Flow Hedges |
|
|
|
|
| Derivative [Line Items] |
|
|
|
|
| Gains recorded in AOCI before reclassifications |
|
|
83,157
|
318,408
|
| (Gains) losses reclassified from AOCI to Interest Expense and Income from Unconsolidated Fund |
|
|
(104,891)
|
20,505
|
| Cash Flow Hedging | Derivatives Designated as Cash Flow Hedges | Unconsolidated Funds |
|
|
|
|
| Derivative [Line Items] |
|
|
|
|
| Gains recorded in AOCI before reclassifications |
|
|
1,185
|
3,777
|
| (Gains) losses reclassified from AOCI to Interest Expense and Income from Unconsolidated Fund |
|
|
(1,208)
|
(62)
|
| Cash Flow Hedging | Derivatives Not Designated as Cash Flow Hedges | Interest Expense |
|
|
|
|
| Derivative [Line Items] |
|
|
|
|
| Loss recorded as interest expense |
|
|
$ 0
|
$ 38
|
| X |
- DefinitionAmount of realized and unrealized gain (loss) of derivative instruments not designated or qualifying as hedging instruments. Reference 1: http://fasb.org/us-gaap/role/ref/legacyRef
-Name Accounting Standards Codification
-Topic 815
-SubTopic 10
-Section 50
-Paragraph 4C
-Subparagraph (e)
-Publisher FASB
-URI https://asc.fasb.org//1943274/2147480434/815-10-50-4C
Reference 2: http://www.xbrl.org/2009/role/commonPracticeRef
-Name Accounting Standards Codification
-Section 50
-Paragraph 4CC
-SubTopic 10
-Topic 815
-Publisher FASB
-URI https://asc.fasb.org//1943274/2147480434/815-10-50-4CC
| Name: |
us-gaap_DerivativeInstrumentsNotDesignatedAsHedgingInstrumentsGainLossNet |
| Namespace Prefix: |
us-gaap_ |
| Data Type: |
xbrli:monetaryItemType |
| Balance Type: |
credit |
| Period Type: |
duration |
|
| X |
- DefinitionLine items represent financial concepts included in a table. These concepts are used to disclose reportable information associated with domain members defined in one or many axes to the table. Reference 1: http://www.xbrl.org/2003/role/disclosureRef
-Topic 815
-SubTopic 40
-Name Accounting Standards Codification
-Section 50
-Paragraph 5
-Subparagraph (f)
-Publisher FASB
-URI https://asc.fasb.org//1943274/2147480237/815-40-50-5
| Name: |
us-gaap_DerivativeLineItems |
| Namespace Prefix: |
us-gaap_ |
| Data Type: |
xbrli:stringItemType |
| Balance Type: |
na |
| Period Type: |
duration |
|
| X |
- DefinitionAmount of income (loss) for proportionate share of equity method investee's income (loss). Reference 1: http://fasb.org/us-gaap/role/ref/legacyRef
-Name Accounting Standards Codification
-Section 45
-Paragraph 28
-Subparagraph (b)
-SubTopic 10
-Topic 230
-Publisher FASB
-URI https://asc.fasb.org//1943274/2147482740/230-10-45-28
Reference 2: http://www.xbrl.org/2003/role/disclosureRef
-Topic 944
-SubTopic 220
-Name Accounting Standards Codification
-Section S99
-Paragraph 1
-Subparagraph (SX 210.7-04(10))
-Publisher FASB
-URI https://asc.fasb.org//1943274/2147483586/944-220-S99-1
Reference 3: http://www.xbrl.org/2003/role/disclosureRef
-Topic 323
-SubTopic 10
-Name Accounting Standards Codification
-Section 45
-Paragraph 1
-Publisher FASB
-URI https://asc.fasb.org//1943274/2147481664/323-10-45-1
Reference 4: http://www.xbrl.org/2003/role/disclosureRef
-Topic 280
-SubTopic 10
-Name Accounting Standards Codification
-Section 50
-Paragraph 22
-Subparagraph (g)
-Publisher FASB
-URI https://asc.fasb.org//1943274/2147482810/280-10-50-22
Reference 5: http://fasb.org/us-gaap/role/ref/legacyRef
-Topic 220
-SubTopic 10
-Name Accounting Standards Codification
-Section S99
-Paragraph 2
-Subparagraph (SX 210.5-03(12))
-Publisher FASB
-URI https://asc.fasb.org//1943274/2147483621/220-10-S99-2
Reference 6: http://fasb.org/us-gaap/role/ref/legacyRef
-Topic 942
-SubTopic 220
-Name Accounting Standards Codification
-Section S99
-Paragraph 1
-Subparagraph (SX 210.9-04(13)(f))
-Publisher FASB
-URI https://asc.fasb.org//1943274/2147483589/942-220-S99-1
| Name: |
us-gaap_IncomeLossFromEquityMethodInvestments |
| Namespace Prefix: |
us-gaap_ |
| Data Type: |
xbrli:monetaryItemType |
| Balance Type: |
credit |
| Period Type: |
duration |
|
| X |
- DefinitionAmount of the cost of borrowed funds accounted for as interest expense. Reference 1: http://www.xbrl.org/2003/role/exampleRef
-Topic 946
-SubTopic 830
-Name Accounting Standards Codification
-Section 55
-Paragraph 10
-Publisher FASB
-URI https://asc.fasb.org//1943274/2147480167/946-830-55-10
Reference 2: http://www.xbrl.org/2009/role/commonPracticeRef
-Topic 946
-SubTopic 220
-Name Accounting Standards Codification
-Section 45
-Paragraph 3
-Subparagraph (i)
-Publisher FASB
-URI https://asc.fasb.org//1943274/2147483581/946-220-45-3
Reference 3: http://www.xbrl.org/2003/role/disclosureRef
-Topic 946
-SubTopic 220
-Name Accounting Standards Codification
-Section S99
-Paragraph 1
-Subparagraph (SX 210.6-07(3))
-Publisher FASB
-URI https://asc.fasb.org//1943274/2147483575/946-220-S99-1
Reference 4: http://www.xbrl.org/2003/role/disclosureRef
-Topic 280
-SubTopic 10
-Name Accounting Standards Codification
-Section 50
-Paragraph 22
-Subparagraph (d)
-Publisher FASB
-URI https://asc.fasb.org//1943274/2147482810/280-10-50-22
Reference 5: http://fasb.org/us-gaap/role/ref/legacyRef
-Name Accounting Standards Codification
-Topic 835
-SubTopic 30
-Section 45
-Paragraph 3
-Publisher FASB
-URI https://asc.fasb.org//1943274/2147482925/835-30-45-3
Reference 6: http://fasb.org/us-gaap/role/ref/legacyRef
-Topic 942
-SubTopic 220
-Name Accounting Standards Codification
-Section S99
-Paragraph 1
-Subparagraph (SX 210.9-04.9)
-Publisher FASB
-URI https://asc.fasb.org//1943274/2147483589/942-220-S99-1
Reference 7: http://www.xbrl.org/2003/role/disclosureRef
-Topic 220
-SubTopic 10
-Name Accounting Standards Codification
-Section S99
-Paragraph 2
-Subparagraph (210.5-03(11))
-Publisher FASB
-URI https://asc.fasb.org//1943274/2147483621/220-10-S99-2
Reference 8: http://www.xbrl.org/2003/role/disclosureRef
-Topic 835
-SubTopic 20
-Name Accounting Standards Codification
-Section 50
-Paragraph 1
-Subparagraph (a)
-Publisher FASB
-URI https://asc.fasb.org//1943274/2147483013/835-20-50-1
| Name: |
us-gaap_InterestExpense |
| Namespace Prefix: |
us-gaap_ |
| Data Type: |
xbrli:monetaryItemType |
| Balance Type: |
debit |
| Period Type: |
duration |
|
| X |
- DefinitionAmount, after tax and before reclassification, of gain (loss) from derivative instrument designated and qualifying as cash flow hedge included in assessment of hedge effectiveness. Reference 1: http://www.xbrl.org/2003/role/disclosureRef
-Topic 220
-SubTopic 10
-Name Accounting Standards Codification
-Section 45
-Paragraph 11
-Publisher FASB
-URI https://asc.fasb.org//1943274/2147482790/220-10-45-11
Reference 2: http://www.xbrl.org/2003/role/disclosureRef
-Topic 220
-SubTopic 10
-Name Accounting Standards Codification
-Section 45
-Paragraph 10A
-Subparagraph (d)
-Publisher FASB
-URI https://asc.fasb.org//1943274/2147482790/220-10-45-10A
| Name: |
us-gaap_OtherComprehensiveIncomeLossCashFlowHedgeGainLossBeforeReclassificationAfterTax |
| Namespace Prefix: |
us-gaap_ |
| Data Type: |
xbrli:monetaryItemType |
| Balance Type: |
credit |
| Period Type: |
duration |
|
| X |
- DefinitionAmount, after tax, of reclassification of gain (loss) from accumulated other comprehensive income (AOCI) for derivative instrument designated and qualifying as cash flow hedge included in assessment of hedge effectiveness. Reference 1: http://www.xbrl.org/2003/role/disclosureRef
-Topic 220
-SubTopic 10
-Name Accounting Standards Codification
-Section 45
-Paragraph 11
-Publisher FASB
-URI https://asc.fasb.org//1943274/2147482790/220-10-45-11
Reference 2: http://www.xbrl.org/2003/role/disclosureRef
-Topic 220
-SubTopic 10
-Name Accounting Standards Codification
-Section 45
-Paragraph 15
-Publisher FASB
-URI https://asc.fasb.org//1943274/2147482790/220-10-45-15
| Name: |
us-gaap_OtherComprehensiveIncomeLossCashFlowHedgeGainLossReclassificationAfterTax |
| Namespace Prefix: |
us-gaap_ |
| Data Type: |
xbrli:monetaryItemType |
| Balance Type: |
debit |
| Period Type: |
duration |
|
| X |
- Details
| Name: |
us-gaap_EquityMethodInvestmentNonconsolidatedInvesteeAxis=us-gaap_EquityMethodInvestmentNonconsolidatedInvesteeOrGroupOfInvesteesMember |
| Namespace Prefix: |
|
| Data Type: |
na |
| Balance Type: |
|
| Period Type: |
|
|
| X |
- Details
| Name: |
us-gaap_DerivativeInstrumentsGainLossByHedgingRelationshipAxis=us-gaap_CashFlowHedgingMember |
| Namespace Prefix: |
|
| Data Type: |
na |
| Balance Type: |
|
| Period Type: |
|
|
| X |
- Details
| Name: |
us-gaap_HedgingDesignationAxis=us-gaap_DesignatedAsHedgingInstrumentMember |
| Namespace Prefix: |
|
| Data Type: |
na |
| Balance Type: |
|
| Period Type: |
|
|
| X |
- Details
| Name: |
us-gaap_HedgingDesignationAxis=us-gaap_NondesignatedMember |
| Namespace Prefix: |
|
| Data Type: |
na |
| Balance Type: |
|
| Period Type: |
|
|
| X |
- Details
| Name: |
us-gaap_IncomeStatementLocationAxis=us-gaap_InterestExpenseMember |
| Namespace Prefix: |
|
| Data Type: |
na |
| Balance Type: |
|
| Period Type: |
|
|
v3.23.3
| X |
- DefinitionLine items represent financial concepts included in a table. These concepts are used to disclose reportable information associated with domain members defined in one or many axes to the table. Reference 1: http://www.xbrl.org/2003/role/disclosureRef
-Topic 815
-SubTopic 40
-Name Accounting Standards Codification
-Section 50
-Paragraph 5
-Subparagraph (f)
-Publisher FASB
-URI https://asc.fasb.org//1943274/2147480237/815-40-50-5
| Name: |
us-gaap_DerivativeLineItems |
| Namespace Prefix: |
us-gaap_ |
| Data Type: |
xbrli:stringItemType |
| Balance Type: |
na |
| Period Type: |
duration |
|
| X |
- DefinitionThe estimated net amount of unrealized gains or losses on interest rate cash flow hedges as of the balance sheet date expected to be reclassified to earnings within the next twelve months. Reference 1: http://fasb.org/us-gaap/role/ref/legacyRef
-Name Accounting Standards Codification
-Topic 815
-SubTopic 30
-Section 50
-Paragraph 1
-Subparagraph (c)
-Publisher FASB
-URI https://asc.fasb.org//1943274/2147480870/815-30-50-1
| Name: |
us-gaap_InterestRateCashFlowHedgeGainLossToBeReclassifiedDuringNext12MonthsNet |
| Namespace Prefix: |
us-gaap_ |
| Data Type: |
xbrli:monetaryItemType |
| Balance Type: |
credit |
| Period Type: |
instant |
|
| X |
- Details
| Name: |
us-gaap_EquityMethodInvestmentNonconsolidatedInvesteeAxis=nysedei_UnconsolidatedFundsMember |
| Namespace Prefix: |
|
| Data Type: |
na |
| Balance Type: |
|
| Period Type: |
|
|
v3.23.3
Equity - Narrative (Details) - USD ($)
$ / shares in Units, $ in Thousands |
|
3 Months Ended |
9 Months Ended |
|
|
|
|
|
Apr. 26, 2022 |
Sep. 30, 2023 |
Sep. 30, 2022 |
Sep. 30, 2023 |
Sep. 30, 2022 |
Jun. 30, 2023 |
May 24, 2023 |
Dec. 31, 2022 |
Jun. 30, 2022 |
Dec. 31, 2021 |
| Schedule of Equity Method Investments [Line Items] |
|
|
|
|
|
|
|
|
|
|
| Number of OP units redeemed (in shares) |
|
|
|
29,000
|
10,000
|
|
|
|
|
|
| OP Units redeemed with cash |
|
$ 46
|
$ 6
|
$ 367
|
$ 336
|
|
|
|
|
|
| Number of OP units converted to shares of common stock (in shares) |
|
|
|
|
260,000
|
|
|
|
|
|
| Outstanding common stock (in shares) |
|
166,737,730
|
|
166,737,730
|
|
|
|
175,809,682
|
|
|
| Number of shares of common stock issued upon redemption of one OP unit (in shares) |
|
|
|
1
|
|
|
|
|
|
|
| OP unit conversion rate |
|
1
|
|
1
|
|
|
|
|
|
|
| Shares of common stock available for future awards |
|
|
|
|
|
|
$ 19,000
|
|
|
|
| Common stock shares for future awards |
|
21,300,000
|
|
21,300,000
|
|
|
|
|
|
|
| Operating Partnership |
|
|
|
|
|
|
|
|
|
|
| Schedule of Equity Method Investments [Line Items] |
|
|
|
|
|
|
|
|
|
|
| Noncontrolling interests units ownership in Operating Partnership (in units) |
|
32,500,000
|
|
32,500,000
|
|
|
|
|
|
|
| Investors' ownership in joint venture (percent) |
|
16.30%
|
|
16.30%
|
|
|
|
|
|
|
| Multifamily |
|
|
|
|
|
|
|
|
|
|
| Schedule of Equity Method Investments [Line Items] |
|
|
|
|
|
|
|
|
|
|
| Amount contributed to JV |
|
|
|
|
$ 99,000
|
|
|
|
|
|
| Multifamily | Investor |
|
|
|
|
|
|
|
|
|
|
| Schedule of Equity Method Investments [Line Items] |
|
|
|
|
|
|
|
|
|
|
| Amount contributed to JV |
|
|
|
|
$ 81,000
|
|
|
|
|
|
| Variable Interest Entity, Primary Beneficiary |
|
|
|
|
|
|
|
|
|
|
| Schedule of Equity Method Investments [Line Items] |
|
|
|
|
|
|
|
|
|
|
| Capital interest in consolidated JV (percent) |
55.00%
|
|
|
|
55.00%
|
|
|
|
|
|
| Common Stock |
|
|
|
|
|
|
|
|
|
|
| Schedule of Equity Method Investments [Line Items] |
|
|
|
|
|
|
|
|
|
|
| Repurchase of common stock (in shares) |
|
|
|
9,100,000
|
|
|
|
|
|
|
| Cash excluding transaction costs |
|
|
|
$ 109,100
|
|
|
|
|
|
|
| Purchase price paid (in usd per share) |
|
|
|
$ 12.03
|
|
|
|
|
|
|
| Number of OP units converted to shares of common stock (in shares) |
|
|
5,000
|
|
260,000
|
|
|
|
|
|
| Outstanding common stock (in shares) |
|
166,738,000
|
175,789,000
|
166,738,000
|
175,789,000
|
166,738,000
|
|
175,810,000
|
175,784,000
|
175,529,000
|
| X |
- DefinitionCapital Stock, Capital Shares Reserved For Future Issuance, Increase Amount
| Name: |
nysedei_CapitalStockCapitalSharesReservedForFutureIssuanceIncreaseAmount |
| Namespace Prefix: |
nysedei_ |
| Data Type: |
xbrli:monetaryItemType |
| Balance Type: |
credit |
| Period Type: |
instant |
|
| X |
- DefinitionNumber of shares of common stock issued upon redemption of one OP unit.
| Name: |
nysedei_NumberOfSharesOfCommonStockIssuedUponRedemptionOfOneOPUnit |
| Namespace Prefix: |
nysedei_ |
| Data Type: |
xbrli:sharesItemType |
| Balance Type: |
na |
| Period Type: |
duration |
|
| X |
- DefinitionOperating Partnership, Conversion Rate
| Name: |
nysedei_OperatingPartnershipConversionRate |
| Namespace Prefix: |
nysedei_ |
| Data Type: |
xbrli:pureItemType |
| Balance Type: |
na |
| Period Type: |
instant |
|
| X |
- DefinitionAggregate number of common shares reserved for future issuance. Reference 1: http://fasb.org/us-gaap/role/ref/legacyRef
-Name Accounting Standards Codification
-Topic 210
-SubTopic 10
-Section S99
-Paragraph 1
-Subparagraph (SX 210.5-02.29)
-Publisher FASB
-URI https://asc.fasb.org//1943274/2147480566/210-10-S99-1
| Name: |
us-gaap_CommonStockCapitalSharesReservedForFutureIssuance |
| Namespace Prefix: |
us-gaap_ |
| Data Type: |
xbrli:sharesItemType |
| Balance Type: |
na |
| Period Type: |
instant |
|
| X |
- DefinitionNumber of shares of common stock outstanding. Common stock represent the ownership interest in a corporation. Reference 1: http://fasb.org/us-gaap/role/ref/legacyRef
-Name Accounting Standards Codification
-Section 50
-Paragraph 2
-SubTopic 10
-Topic 505
-Publisher FASB
-URI https://asc.fasb.org//1943274/2147481112/505-10-50-2
Reference 2: http://www.xbrl.org/2003/role/disclosureRef
-Topic 946
-SubTopic 210
-Name Accounting Standards Codification
-Section S99
-Paragraph 2
-Subparagraph (SX 210.6-05(4))
-Publisher FASB
-URI https://asc.fasb.org//1943274/2147479617/946-210-S99-2
Reference 3: http://www.xbrl.org/2009/role/commonPracticeRef
-Topic 946
-SubTopic 220
-Name Accounting Standards Codification
-Section S99
-Paragraph 3
-Subparagraph (SX 210.6-09(4)(b))
-Publisher FASB
-URI https://asc.fasb.org//1943274/2147483575/946-220-S99-3
Reference 4: http://www.xbrl.org/2003/role/disclosureRef
-Topic 946
-SubTopic 210
-Name Accounting Standards Codification
-Section S99
-Paragraph 1
-Subparagraph (SX 210.6-04(16)(a))
-Publisher FASB
-URI https://asc.fasb.org//1943274/2147479617/946-210-S99-1
Reference 5: http://www.xbrl.org/2009/role/commonPracticeRef
-Topic 946
-SubTopic 220
-Name Accounting Standards Codification
-Section S99
-Paragraph 3
-Subparagraph (SX 210.6-09(7))
-Publisher FASB
-URI https://asc.fasb.org//1943274/2147483575/946-220-S99-3
Reference 6: http://fasb.org/us-gaap/role/ref/legacyRef
-Topic 210
-SubTopic 10
-Name Accounting Standards Codification
-Section S99
-Paragraph 1
-Subparagraph (SX 210.5-02(29))
-Publisher FASB
-URI https://asc.fasb.org//1943274/2147480566/210-10-S99-1
| Name: |
us-gaap_CommonStockSharesOutstanding |
| Namespace Prefix: |
us-gaap_ |
| Data Type: |
xbrli:sharesItemType |
| Balance Type: |
na |
| Period Type: |
instant |
|
| X |
- DefinitionThe equity interest of noncontrolling shareholders, partners or other equity holders in consolidated entity.
| Name: |
us-gaap_MinorityInterestOwnershipPercentageByNoncontrollingOwners |
| Namespace Prefix: |
us-gaap_ |
| Data Type: |
dtr-types:percentItemType |
| Balance Type: |
na |
| Period Type: |
instant |
|
| X |
- DefinitionTotal change in each class of partners' capital accounts during the year due to redemptions and adjustments to redemption value. All partners include general, limited and preferred partners. Reference 1: http://fasb.org/us-gaap/role/ref/legacyRef
-Topic 505
-SubTopic 10
-Name Accounting Standards Codification
-Section S99
-Paragraph 1
-Subparagraph (SX 210.3-04)
-Publisher FASB
-URI https://asc.fasb.org//1943274/2147480008/505-10-S99-1
Reference 2: http://fasb.org/us-gaap/role/ref/legacyRef
-Topic 505
-SubTopic 10
-Name Accounting Standards Codification
-Section S99
-Paragraph 5
-Subparagraph (SAB Topic 4.F)
-Publisher FASB
-URI https://asc.fasb.org//1943274/2147480008/505-10-S99-5
| Name: |
us-gaap_PartnersCapitalAccountRedemptions |
| Namespace Prefix: |
us-gaap_ |
| Data Type: |
xbrli:monetaryItemType |
| Balance Type: |
debit |
| Period Type: |
duration |
|
| X |
- DefinitionThe number of units redeemed during the year of each class of partners' capital account. Units represent shares of ownership of the general, limited, and preferred partners. Reference 1: http://fasb.org/us-gaap/role/ref/legacyRef
-Topic 505
-SubTopic 10
-Name Accounting Standards Codification
-Section S99
-Paragraph 1
-Subparagraph (SX 210.3-04)
-Publisher FASB
-URI https://asc.fasb.org//1943274/2147480008/505-10-S99-1
Reference 2: http://fasb.org/us-gaap/role/ref/legacyRef
-Topic 505
-SubTopic 10
-Name Accounting Standards Codification
-Section S99
-Paragraph 5
-Subparagraph (SAB Topic 4.F)
-Publisher FASB
-URI https://asc.fasb.org//1943274/2147480008/505-10-S99-5
| Name: |
us-gaap_PartnersCapitalAccountUnitsRedeemed |
| Namespace Prefix: |
us-gaap_ |
| Data Type: |
xbrli:sharesItemType |
| Balance Type: |
na |
| Period Type: |
duration |
|
| X |
- DefinitionLine items represent financial concepts included in a table. These concepts are used to disclose reportable information associated with domain members defined in one or many axes to the table. Reference 1: http://www.xbrl.org/2003/role/disclosureRef
-Topic 235
-SubTopic 10
-Name Accounting Standards Codification
-Section S99
-Paragraph 1
-Subparagraph (SX 210.4-08(g)(1)(ii))
-Publisher FASB
-URI https://asc.fasb.org//1943274/2147480678/235-10-S99-1
Reference 2: http://www.xbrl.org/2003/role/disclosureRef
-Topic 323
-SubTopic 10
-Name Accounting Standards Codification
-Section 50
-Paragraph 3
-Subparagraph (c)
-Publisher FASB
-URI https://asc.fasb.org//1943274/2147481687/323-10-50-3
Reference 3: http://www.xbrl.org/2003/role/disclosureRef
-Topic 825
-SubTopic 10
-Name Accounting Standards Codification
-Section 50
-Paragraph 28
-Subparagraph (f)
-Publisher FASB
-URI https://asc.fasb.org//1943274/2147482907/825-10-50-28
Reference 4: http://www.xbrl.org/2003/role/disclosureRef
-Topic 323
-SubTopic 10
-Name Accounting Standards Codification
-Section 50
-Paragraph 3
-Subparagraph (a)(1)
-Publisher FASB
-URI https://asc.fasb.org//1943274/2147481687/323-10-50-3
Reference 5: http://www.xbrl.org/2003/role/disclosureRef
-Topic 323
-SubTopic 10
-Name Accounting Standards Codification
-Section 50
-Paragraph 3
-Subparagraph (a)(2)
-Publisher FASB
-URI https://asc.fasb.org//1943274/2147481687/323-10-50-3
Reference 6: http://www.xbrl.org/2003/role/disclosureRef
-Topic 323
-SubTopic 10
-Name Accounting Standards Codification
-Section 50
-Paragraph 3
-Subparagraph (b)
-Publisher FASB
-URI https://asc.fasb.org//1943274/2147481687/323-10-50-3
| Name: |
us-gaap_ScheduleOfEquityMethodInvestmentsLineItems |
| Namespace Prefix: |
us-gaap_ |
| Data Type: |
xbrli:stringItemType |
| Balance Type: |
na |
| Period Type: |
duration |
|
| X |
- DefinitionThe number of shares issued during the period upon the conversion of units. An example of a convertible unit is an umbrella partnership real estate investment trust unit (UPREIT unit). Reference 1: http://fasb.org/us-gaap/role/ref/legacyRef
-Name Accounting Standards Codification
-Section 50
-Paragraph 2
-SubTopic 10
-Topic 505
-Publisher FASB
-URI https://asc.fasb.org//1943274/2147481112/505-10-50-2
Reference 2: http://fasb.org/us-gaap/role/ref/legacyRef
-Topic 210
-SubTopic 10
-Name Accounting Standards Codification
-Section S99
-Paragraph 1
-Subparagraph (SX 210.5-02(28))
-Publisher FASB
-URI https://asc.fasb.org//1943274/2147480566/210-10-S99-1
Reference 3: http://fasb.org/us-gaap/role/ref/legacyRef
-Topic 505
-SubTopic 10
-Name Accounting Standards Codification
-Section S99
-Paragraph 1
-Subparagraph (SX 210.3-04)
-Publisher FASB
-URI https://asc.fasb.org//1943274/2147480008/505-10-S99-1
Reference 4: http://fasb.org/us-gaap/role/ref/legacyRef
-Topic 210
-SubTopic 10
-Name Accounting Standards Codification
-Section S99
-Paragraph 1
-Subparagraph (SX 210.5-02(29))
-Publisher FASB
-URI https://asc.fasb.org//1943274/2147480566/210-10-S99-1
Reference 5: http://fasb.org/us-gaap/role/ref/legacyRef
-Name Accounting Standards Codification
-Topic 505
-SubTopic 10
-Section 50
-Paragraph 3
-Publisher FASB
-URI https://asc.fasb.org//1943274/2147481112/505-10-50-3
| Name: |
us-gaap_StockIssuedDuringPeriodSharesConversionOfUnits |
| Namespace Prefix: |
us-gaap_ |
| Data Type: |
xbrli:sharesItemType |
| Balance Type: |
na |
| Period Type: |
duration |
|
| X |
- DefinitionNumber of shares that have been repurchased during the period and have not been retired and are not held in treasury. Some state laws may govern the circumstances under which an entity may acquire its own stock and prescribe the accounting treatment therefore. This element is used when state law does not recognize treasury stock. Reference 1: http://fasb.org/us-gaap/role/ref/legacyRef
-Name Accounting Standards Codification
-Section 50
-Paragraph 2
-SubTopic 10
-Topic 505
-Publisher FASB
-URI https://asc.fasb.org//1943274/2147481112/505-10-50-2
Reference 2: http://www.xbrl.org/2003/role/disclosureRef
-Topic 946
-SubTopic 505
-Name Accounting Standards Codification
-Section 50
-Paragraph 2
-Subparagraph (c)
-Publisher FASB
-URI https://asc.fasb.org//1943274/2147481004/946-505-50-2
Reference 3: http://www.xbrl.org/2003/role/disclosureRef
-Topic 946
-SubTopic 220
-Name Accounting Standards Codification
-Section S99
-Paragraph 3
-Subparagraph (SX 210.6-09(4)(b))
-Publisher FASB
-URI https://asc.fasb.org//1943274/2147483575/946-220-S99-3
Reference 4: http://www.xbrl.org/2003/role/disclosureRef
-Topic 946
-SubTopic 10
-Name Accounting Standards Codification
-Section S99
-Paragraph 3
-Subparagraph (SX 210.6-03(i)(2))
-Publisher FASB
-URI https://asc.fasb.org//1943274/2147479886/946-10-S99-3
Reference 5: http://fasb.org/us-gaap/role/ref/legacyRef
-Topic 210
-SubTopic 10
-Name Accounting Standards Codification
-Section S99
-Paragraph 1
-Subparagraph (SX 210.5-02(28))
-Publisher FASB
-URI https://asc.fasb.org//1943274/2147480566/210-10-S99-1
Reference 6: http://fasb.org/us-gaap/role/ref/legacyRef
-Topic 505
-SubTopic 10
-Name Accounting Standards Codification
-Section S99
-Paragraph 1
-Subparagraph (SX 210.3-04)
-Publisher FASB
-URI https://asc.fasb.org//1943274/2147480008/505-10-S99-1
Reference 7: http://fasb.org/us-gaap/role/ref/legacyRef
-Topic 210
-SubTopic 10
-Name Accounting Standards Codification
-Section S99
-Paragraph 1
-Subparagraph (SX 210.5-02(29))
-Publisher FASB
-URI https://asc.fasb.org//1943274/2147480566/210-10-S99-1
| Name: |
us-gaap_StockRepurchasedDuringPeriodShares |
| Namespace Prefix: |
us-gaap_ |
| Data Type: |
xbrli:sharesItemType |
| Balance Type: |
na |
| Period Type: |
duration |
|
| X |
- DefinitionEquity impact of the value of stock that has been repurchased during the period and has not been retired and is not held in treasury. Some state laws may mandate the circumstances under which an entity may acquire its own stock and prescribe the accounting treatment therefore. This element is used when state law does not recognize treasury stock. Reference 1: http://fasb.org/us-gaap/role/ref/legacyRef
-Name Accounting Standards Codification
-Section 50
-Paragraph 2
-SubTopic 10
-Topic 505
-Publisher FASB
-URI https://asc.fasb.org//1943274/2147481112/505-10-50-2
Reference 2: http://www.xbrl.org/2003/role/exampleRef
-Topic 946
-SubTopic 830
-Name Accounting Standards Codification
-Section 55
-Paragraph 11
-Publisher FASB
-URI https://asc.fasb.org//1943274/2147480167/946-830-55-11
Reference 3: http://www.xbrl.org/2003/role/disclosureRef
-Topic 946
-SubTopic 205
-Name Accounting Standards Codification
-Section 45
-Paragraph 4
-Subparagraph (a)
-Publisher FASB
-URI https://asc.fasb.org//1943274/2147480767/946-205-45-4
Reference 4: http://www.xbrl.org/2003/role/disclosureRef
-Topic 946
-SubTopic 505
-Name Accounting Standards Codification
-Section 50
-Paragraph 2
-Subparagraph (c)
-Publisher FASB
-URI https://asc.fasb.org//1943274/2147481004/946-505-50-2
Reference 5: http://www.xbrl.org/2003/role/disclosureRef
-Topic 946
-SubTopic 220
-Name Accounting Standards Codification
-Section S99
-Paragraph 3
-Subparagraph (SX 210.6-09(4)(b))
-Publisher FASB
-URI https://asc.fasb.org//1943274/2147483575/946-220-S99-3
Reference 6: http://fasb.org/us-gaap/role/ref/legacyRef
-Topic 210
-SubTopic 10
-Name Accounting Standards Codification
-Section S99
-Paragraph 1
-Subparagraph (SX 210.5-02(28))
-Publisher FASB
-URI https://asc.fasb.org//1943274/2147480566/210-10-S99-1
Reference 7: http://fasb.org/us-gaap/role/ref/legacyRef
-Topic 505
-SubTopic 10
-Name Accounting Standards Codification
-Section S99
-Paragraph 1
-Subparagraph (SX 210.3-04)
-Publisher FASB
-URI https://asc.fasb.org//1943274/2147480008/505-10-S99-1
Reference 8: http://fasb.org/us-gaap/role/ref/legacyRef
-Topic 210
-SubTopic 10
-Name Accounting Standards Codification
-Section S99
-Paragraph 1
-Subparagraph (SX 210.5-02(29))
-Publisher FASB
-URI https://asc.fasb.org//1943274/2147480566/210-10-S99-1
| Name: |
us-gaap_StockRepurchasedDuringPeriodValue |
| Namespace Prefix: |
us-gaap_ |
| Data Type: |
xbrli:monetaryItemType |
| Balance Type: |
debit |
| Period Type: |
duration |
|
| X |
- DefinitionTotal cost of shares repurchased divided by the total number of shares repurchased. Reference 1: http://fasb.org/us-gaap/role/ref/legacyRef
-Name Accounting Standards Codification
-Topic 505
-SubTopic 30
-Section 45
-Paragraph 1
-Publisher FASB
-URI https://asc.fasb.org//1943274/2147481549/505-30-45-1
| Name: |
us-gaap_TreasuryStockAcquiredAverageCostPerShare |
| Namespace Prefix: |
us-gaap_ |
| Data Type: |
dtr-types:perShareItemType |
| Balance Type: |
na |
| Period Type: |
duration |
|
| X |
- DefinitionThe amount of financial or other support the reporting entity has provided (explicitly or implicitly) to the Variable Interest Entity (VIE) that it was not previously contractually required to provide or that the reporting entity intends to provide, including, for example, situations in which the reporting entity assisted the VIE in obtaining another type of support. Reference 1: http://fasb.org/us-gaap/role/ref/legacyRef
-Name Accounting Standards Codification
-Topic 810
-SubTopic 10
-Section 50
-Paragraph 5A
-Subparagraph (c)
-Publisher FASB
-URI https://asc.fasb.org//1943274/2147481203/810-10-50-5A
| Name: |
us-gaap_VariableInterestEntityFinancialOrOtherSupportAmount |
| Namespace Prefix: |
us-gaap_ |
| Data Type: |
xbrli:monetaryItemType |
| Balance Type: |
debit |
| Period Type: |
duration |
|
| X |
- DefinitionPercentage of the Variable Interest Entity's (VIE) voting interest owned by (or beneficial interest in) the reporting entity (directly or indirectly). Reference 1: http://fasb.org/us-gaap/role/ref/legacyRef
-Name Accounting Standards Codification
-Topic 810
-SubTopic 10
-Section 50
-Paragraph 5A
-Subparagraph (d)
-Publisher FASB
-URI https://asc.fasb.org//1943274/2147481203/810-10-50-5A
| Name: |
us-gaap_VariableInterestEntityOwnershipPercentage |
| Namespace Prefix: |
us-gaap_ |
| Data Type: |
dtr-types:percentItemType |
| Balance Type: |
na |
| Period Type: |
duration |
|
| X |
- Details
| Name: |
srt_OwnershipAxis=nysedei_DouglasEmmettOperatingPartnershipMember |
| Namespace Prefix: |
|
| Data Type: |
na |
| Balance Type: |
|
| Period Type: |
|
|
| X |
- Details
| Name: |
srt_MortgageLoansOnRealEstateDescriptionTypeOfPropertyAxis=srt_MultifamilyMember |
| Namespace Prefix: |
|
| Data Type: |
na |
| Balance Type: |
|
| Period Type: |
|
|
| X |
- Details
| Name: |
srt_ConsolidatedEntitiesAxis=us-gaap_VariableInterestEntityPrimaryBeneficiaryMember |
| Namespace Prefix: |
|
| Data Type: |
na |
| Balance Type: |
|
| Period Type: |
|
|
| X |
- Details
| Name: |
us-gaap_StatementEquityComponentsAxis=us-gaap_CommonStockMember |
| Namespace Prefix: |
|
| Data Type: |
na |
| Balance Type: |
|
| Period Type: |
|
|
v3.23.3
Equity - Net Income Attributable to Common Stockholders and Transfers (to) from Noncontrolling Interests (Details) - USD ($)
$ in Thousands |
3 Months Ended |
9 Months Ended |
Sep. 30, 2023 |
Sep. 30, 2022 |
Sep. 30, 2023 |
Sep. 30, 2022 |
| Stockholders' Equity Note [Abstract] |
|
|
|
|
| Net (loss) income attributable to common stockholders |
$ (13,362)
|
$ 22,955
|
$ (2,251)
|
$ 72,843
|
| Transfers from noncontrolling interests: |
|
|
|
|
| Exchange of OP Units with noncontrolling interests |
|
|
0
|
4,236
|
| Repurchases of OP Units from noncontrolling interests |
|
|
120
|
(176)
|
| Net transfers from noncontrolling interests |
|
|
120
|
4,060
|
| Change from net (loss) income attributable to common stockholders and transfers from noncontrolling interests |
|
|
$ (2,131)
|
$ 76,903
|
| X |
- DefinitionConsolidation, Less Than Wholly Owned Subsidiary, Parent Ownership Interest, Changes, Exchange Of Interest Units By Parent
| Name: |
nysedei_ConsolidationLessThanWhollyOwnedSubsidiaryParentOwnershipInterestChangesExchangeOfInterestUnitsByParent |
| Namespace Prefix: |
nysedei_ |
| Data Type: |
xbrli:monetaryItemType |
| Balance Type: |
credit |
| Period Type: |
duration |
|
| X |
- DefinitionConsolidation, Less than Wholly Owned Subsidiary, Parent Ownership Interest, Changes Increase (Decrease), Purchase of Interest by Parent
| Name: |
nysedei_ConsolidationLessThanWhollyOwnedSubsidiaryParentOwnershipInterestChangesIncreaseDecreasePurchaseOfInterestByParent |
| Namespace Prefix: |
nysedei_ |
| Data Type: |
xbrli:monetaryItemType |
| Balance Type: |
debit |
| Period Type: |
duration |
|
| X |
- DefinitionTransfers From Noncontrolling Interest [Abstract]
| Name: |
nysedei_TransfersFromNoncontrollingInterestAbstract |
| Namespace Prefix: |
nysedei_ |
| Data Type: |
xbrli:stringItemType |
| Balance Type: |
na |
| Period Type: |
duration |
|
| X |
- DefinitionThis element represents the total net income attributable to the parent for the period and the effect of net changes during the period impacting the parent's ownership interest in a subsidiary as it relates to the total (consolidated) equity attributable to the parent. The changes to the parent's ownership interest in a subsidiary represented by this element did not result in a deconsolidation of the subsidiary from the consolidated financial statements. Reference 1: http://fasb.org/us-gaap/role/ref/legacyRef
-Name Accounting Standards Codification
-Topic 810
-SubTopic 10
-Section 55
-Paragraph 4M
-Publisher FASB
-URI https://asc.fasb.org//1943274/2147481175/810-10-55-4M
Reference 2: http://fasb.org/us-gaap/role/ref/legacyRef
-Name Accounting Standards Codification
-Topic 505
-SubTopic 10
-Section S99
-Paragraph 1
-Publisher FASB
-URI https://asc.fasb.org//1943274/2147480008/505-10-S99-1
Reference 3: http://fasb.org/us-gaap/role/ref/legacyRef
-Name Accounting Standards Codification
-Section 50
-Paragraph 1A
-Subparagraph (d)
-SubTopic 10
-Topic 810
-Publisher FASB
-URI https://asc.fasb.org//1943274/2147481203/810-10-50-1A
| Name: |
us-gaap_ConsolidationLessThanWhollyOwnedSubsidiaryParentOwnershipInterestChangeDueToNetIncomeAttributableToParentAndEffectsOfChangesNet |
| Namespace Prefix: |
us-gaap_ |
| Data Type: |
xbrli:monetaryItemType |
| Balance Type: |
credit |
| Period Type: |
duration |
|
| X |
- DefinitionThe increase (decrease) during the period impacting the parent's ownership interest in a subsidiary as it relates to the total (consolidated) equity attributable to the parent. The changes to the parent's ownership interest in a subsidiary represented by this element did not arise in a deconsolidation of the subsidiary from the consolidated financial statements. Reference 1: http://fasb.org/us-gaap/role/ref/legacyRef
-Name Accounting Standards Codification
-Topic 810
-SubTopic 10
-Section 55
-Paragraph 4M
-Publisher FASB
-URI https://asc.fasb.org//1943274/2147481175/810-10-55-4M
Reference 2: http://fasb.org/us-gaap/role/ref/legacyRef
-Name Accounting Standards Codification
-Topic 505
-SubTopic 10
-Section S99
-Paragraph 1
-Publisher FASB
-URI https://asc.fasb.org//1943274/2147480008/505-10-S99-1
Reference 3: http://fasb.org/us-gaap/role/ref/legacyRef
-Name Accounting Standards Codification
-Section 50
-Paragraph 1A
-Subparagraph (d)
-SubTopic 10
-Topic 810
-Publisher FASB
-URI https://asc.fasb.org//1943274/2147481203/810-10-50-1A
| Name: |
us-gaap_ConsolidationLessThanWhollyOwnedSubsidiaryParentOwnershipInterestChangesNet |
| Namespace Prefix: |
us-gaap_ |
| Data Type: |
xbrli:monetaryItemType |
| Balance Type: |
credit |
| Period Type: |
duration |
|
| X |
- DefinitionThe portion of profit or loss for the period, net of income taxes, which is attributable to the parent. Reference 1: http://www.xbrl.org/2003/role/disclosureRef
-Topic 235
-SubTopic 10
-Name Accounting Standards Codification
-Section S99
-Paragraph 1
-Subparagraph (SX 210.4-08(g)(1)(ii))
-Publisher FASB
-URI https://asc.fasb.org//1943274/2147480678/235-10-S99-1
Reference 2: http://www.xbrl.org/2003/role/disclosureRef
-Topic 323
-SubTopic 10
-Name Accounting Standards Codification
-Section 50
-Paragraph 3
-Subparagraph (c)
-Publisher FASB
-URI https://asc.fasb.org//1943274/2147481687/323-10-50-3
Reference 3: http://www.xbrl.org/2003/role/disclosureRef
-Topic 825
-SubTopic 10
-Name Accounting Standards Codification
-Section 50
-Paragraph 28
-Subparagraph (f)
-Publisher FASB
-URI https://asc.fasb.org//1943274/2147482907/825-10-50-28
Reference 4: http://www.xbrl.org/2003/role/disclosureRef
-Topic 220
-SubTopic 10
-Name Accounting Standards Codification
-Section 50
-Paragraph 6
-Publisher FASB
-URI https://asc.fasb.org//1943274/2147482765/220-10-50-6
Reference 5: http://www.xbrl.org/2003/role/disclosureRef
-Topic 250
-SubTopic 10
-Name Accounting Standards Codification
-Section 50
-Paragraph 3
-Publisher FASB
-URI https://asc.fasb.org//1943274/2147483443/250-10-50-3
Reference 6: http://www.xbrl.org/2003/role/disclosureRef
-Topic 250
-SubTopic 10
-Name Accounting Standards Codification
-Section 50
-Paragraph 1
-Subparagraph (b)(2)
-Publisher FASB
-URI https://asc.fasb.org//1943274/2147483443/250-10-50-1
Reference 7: http://www.xbrl.org/2003/role/disclosureRef
-Topic 815
-SubTopic 40
-Name Accounting Standards Codification
-Section 65
-Paragraph 1
-Subparagraph (f)
-Publisher FASB
-URI https://asc.fasb.org//1943274/2147480175/815-40-65-1
Reference 8: http://www.xbrl.org/2003/role/disclosureRef
-Topic 250
-SubTopic 10
-Name Accounting Standards Codification
-Section 50
-Paragraph 8
-Publisher FASB
-URI https://asc.fasb.org//1943274/2147483443/250-10-50-8
Reference 9: http://www.xbrl.org/2003/role/disclosureRef
-Topic 250
-SubTopic 10
-Name Accounting Standards Codification
-Section 50
-Paragraph 9
-Publisher FASB
-URI https://asc.fasb.org//1943274/2147483443/250-10-50-9
Reference 10: http://www.xbrl.org/2003/role/disclosureRef
-Topic 250
-SubTopic 10
-Name Accounting Standards Codification
-Section 50
-Paragraph 11
-Subparagraph (a)
-Publisher FASB
-URI https://asc.fasb.org//1943274/2147483443/250-10-50-11
Reference 11: http://www.xbrl.org/2003/role/disclosureRef
-Topic 250
-SubTopic 10
-Name Accounting Standards Codification
-Section 50
-Paragraph 11
-Subparagraph (b)
-Publisher FASB
-URI https://asc.fasb.org//1943274/2147483443/250-10-50-11
Reference 12: http://www.xbrl.org/2003/role/disclosureRef
-Topic 250
-SubTopic 10
-Name Accounting Standards Codification
-Section 50
-Paragraph 4
-Publisher FASB
-URI https://asc.fasb.org//1943274/2147483443/250-10-50-4
Reference 13: http://www.xbrl.org/2003/role/exampleRef
-Topic 946
-SubTopic 830
-Name Accounting Standards Codification
-Section 55
-Paragraph 10
-Publisher FASB
-URI https://asc.fasb.org//1943274/2147480167/946-830-55-10
Reference 14: http://www.xbrl.org/2003/role/disclosureRef
-Topic 946
-SubTopic 220
-Name Accounting Standards Codification
-Section 45
-Paragraph 7
-Publisher FASB
-URI https://asc.fasb.org//1943274/2147483581/946-220-45-7
Reference 15: http://www.xbrl.org/2003/role/disclosureRef
-Topic 944
-SubTopic 220
-Name Accounting Standards Codification
-Section S99
-Paragraph 1
-Subparagraph (SX 210.7-04(18))
-Publisher FASB
-URI https://asc.fasb.org//1943274/2147483586/944-220-S99-1
Reference 16: http://www.xbrl.org/2003/role/disclosureRef
-Topic 280
-SubTopic 10
-Name Accounting Standards Codification
-Section 50
-Paragraph 22
-Publisher FASB
-URI https://asc.fasb.org//1943274/2147482810/280-10-50-22
Reference 17: http://www.xbrl.org/2003/role/disclosureRef
-Topic 946
-SubTopic 220
-Name Accounting Standards Codification
-Section S99
-Paragraph 1
-Subparagraph (SX 210.6-07(9))
-Publisher FASB
-URI https://asc.fasb.org//1943274/2147483575/946-220-S99-1
Reference 18: http://www.xbrl.org/2003/role/disclosureRef
-Topic 946
-SubTopic 220
-Name Accounting Standards Codification
-Section S99
-Paragraph 3
-Subparagraph (SX 210.6-09(1)(d))
-Publisher FASB
-URI https://asc.fasb.org//1943274/2147483575/946-220-S99-3
Reference 19: http://www.xbrl.org/2003/role/disclosureRef
-Topic 470
-SubTopic 10
-Name Accounting Standards Codification
-Section S99
-Paragraph 1A
-Subparagraph (SX 210.13-01(a)(4)(i))
-Publisher FASB
-URI https://asc.fasb.org//1943274/2147480097/470-10-S99-1A
Reference 20: http://www.xbrl.org/2009/role/commonPracticeRef
-Topic 470
-SubTopic 10
-Name Accounting Standards Codification
-Section S99
-Paragraph 1A
-Subparagraph (SX 210.13-01(a)(4)(ii))
-Publisher FASB
-URI https://asc.fasb.org//1943274/2147480097/470-10-S99-1A
Reference 21: http://www.xbrl.org/2003/role/disclosureRef
-Topic 470
-SubTopic 10
-Name Accounting Standards Codification
-Section S99
-Paragraph 1A
-Subparagraph (SX 210.13-01(a)(4)(iii)(A))
-Publisher FASB
-URI https://asc.fasb.org//1943274/2147480097/470-10-S99-1A
Reference 22: http://www.xbrl.org/2003/role/disclosureRef
-Topic 470
-SubTopic 10
-Name Accounting Standards Codification
-Section S99
-Paragraph 1A
-Subparagraph (SX 210.13-01(a)(4)(iv))
-Publisher FASB
-URI https://asc.fasb.org//1943274/2147480097/470-10-S99-1A
Reference 23: http://www.xbrl.org/2003/role/disclosureRef
-Topic 470
-SubTopic 10
-Name Accounting Standards Codification
-Section S99
-Paragraph 1A
-Subparagraph (SX 210.13-01(a)(5))
-Publisher FASB
-URI https://asc.fasb.org//1943274/2147480097/470-10-S99-1A
Reference 24: http://www.xbrl.org/2003/role/disclosureRef
-Topic 470
-SubTopic 10
-Name Accounting Standards Codification
-Section S99
-Paragraph 1B
-Subparagraph (SX 210.13-02(a)(4)(i))
-Publisher FASB
-URI https://asc.fasb.org//1943274/2147480097/470-10-S99-1B
Reference 25: http://www.xbrl.org/2003/role/disclosureRef
-Topic 470
-SubTopic 10
-Name Accounting Standards Codification
-Section S99
-Paragraph 1B
-Subparagraph (SX 210.13-02(a)(4)(iii)(A))
-Publisher FASB
-URI https://asc.fasb.org//1943274/2147480097/470-10-S99-1B
Reference 26: http://www.xbrl.org/2003/role/disclosureRef
-Topic 470
-SubTopic 10
-Name Accounting Standards Codification
-Section S99
-Paragraph 1B
-Subparagraph (SX 210.13-02(a)(4)(iii)(B))
-Publisher FASB
-URI https://asc.fasb.org//1943274/2147480097/470-10-S99-1B
Reference 27: http://www.xbrl.org/2003/role/disclosureRef
-Topic 470
-SubTopic 10
-Name Accounting Standards Codification
-Section S99
-Paragraph 1B
-Subparagraph (SX 210.13-02(a)(4)(iv))
-Publisher FASB
-URI https://asc.fasb.org//1943274/2147480097/470-10-S99-1B
Reference 28: http://www.xbrl.org/2003/role/disclosureRef
-Topic 470
-SubTopic 10
-Name Accounting Standards Codification
-Section S99
-Paragraph 1B
-Subparagraph (SX 210.13-02(a)(5))
-Publisher FASB
-URI https://asc.fasb.org//1943274/2147480097/470-10-S99-1B
Reference 29: http://www.xbrl.org/2003/role/disclosureRef
-Topic 280
-SubTopic 10
-Name Accounting Standards Codification
-Section 50
-Paragraph 30
-Subparagraph (b)
-Publisher FASB
-URI https://asc.fasb.org//1943274/2147482810/280-10-50-30
Reference 30: http://www.xbrl.org/2003/role/disclosureRef
-Topic 280
-SubTopic 10
-Name Accounting Standards Codification
-Section 50
-Paragraph 32
-Subparagraph (f)
-Publisher FASB
-URI https://asc.fasb.org//1943274/2147482810/280-10-50-32
Reference 31: http://www.xbrl.org/2003/role/disclosureRef
-Topic 260
-SubTopic 10
-Name Accounting Standards Codification
-Section 45
-Paragraph 60B
-Subparagraph (a)
-Publisher FASB
-URI https://asc.fasb.org//1943274/2147482689/260-10-45-60B
Reference 32: http://www.xbrl.org/2003/role/exampleRef
-Topic 280
-SubTopic 10
-Name Accounting Standards Codification
-Section 50
-Paragraph 31
-Publisher FASB
-URI https://asc.fasb.org//1943274/2147482810/280-10-50-31
Reference 33: http://www.xbrl.org/2003/role/disclosureRef
-Topic 280
-SubTopic 10
-Name Accounting Standards Codification
-Section 50
-Paragraph 32
-Subparagraph (c)
-Publisher FASB
-URI https://asc.fasb.org//1943274/2147482810/280-10-50-32
Reference 34: http://www.xbrl.org/2003/role/disclosureRef
-Topic 205
-SubTopic 20
-Name Accounting Standards Codification
-Section 50
-Paragraph 7
-Publisher FASB
-URI https://asc.fasb.org//1943274/2147483499/205-20-50-7
Reference 35: http://fasb.org/us-gaap/role/ref/legacyRef
-Topic 230
-SubTopic 10
-Name Accounting Standards Codification
-Section 45
-Paragraph 28
-Publisher FASB
-URI https://asc.fasb.org//1943274/2147482740/230-10-45-28
Reference 36: http://www.xbrl.org/2003/role/disclosureRef
-Topic 220
-SubTopic 10
-Name Accounting Standards Codification
-Section 45
-Paragraph 1A
-Subparagraph (a)
-Publisher FASB
-URI https://asc.fasb.org//1943274/2147482790/220-10-45-1A
Reference 37: http://www.xbrl.org/2003/role/disclosureRef
-Topic 220
-SubTopic 10
-Name Accounting Standards Codification
-Section 45
-Paragraph 1B
-Subparagraph (a)
-Publisher FASB
-URI https://asc.fasb.org//1943274/2147482790/220-10-45-1B
Reference 38: http://fasb.org/us-gaap/role/ref/legacyRef
-Topic 220
-SubTopic 10
-Name Accounting Standards Codification
-Section S99
-Paragraph 2
-Subparagraph (SX 210.5-03(20))
-Publisher FASB
-URI https://asc.fasb.org//1943274/2147483621/220-10-S99-2
Reference 39: http://fasb.org/us-gaap/role/ref/legacyRef
-Topic 942
-SubTopic 220
-Name Accounting Standards Codification
-Section S99
-Paragraph 1
-Subparagraph (SX 210.9-04(22))
-Publisher FASB
-URI https://asc.fasb.org//1943274/2147483589/942-220-S99-1
| Name: |
us-gaap_NetIncomeLoss |
| Namespace Prefix: |
us-gaap_ |
| Data Type: |
xbrli:monetaryItemType |
| Balance Type: |
credit |
| Period Type: |
duration |
|
| X |
- References
+ Details
| Name: |
us-gaap_StockholdersEquityNoteAbstract |
| Namespace Prefix: |
us-gaap_ |
| Data Type: |
xbrli:stringItemType |
| Balance Type: |
na |
| Period Type: |
duration |
|
v3.23.3
Equity - Accumulated Other Comprehensive Income Schedule (Details) - USD ($)
$ in Thousands |
9 Months Ended |
Sep. 30, 2023 |
Sep. 30, 2022 |
| AOCI Including Portion Attributable to Noncontrolling Interest, Net of Tax [Roll Forward] |
|
|
| Beginning balance |
$ 4,275,783
|
$ 3,986,553
|
| Other comprehensive income before reclassifications |
83,157
|
318,408
|
| Reclassification of (gains) losses from AOCI to income from unconsolidated funds/ interest expense |
(104,891)
|
20,505
|
| Net current period OCI |
(21,757)
|
342,628
|
| OCI attributable to noncontrolling interests |
4,454
|
(104,205)
|
| OCI attributable to common stockholders |
(17,303)
|
238,423
|
| Ending balance |
4,007,456
|
4,297,733
|
| Unconsolidated Funds |
|
|
| AOCI Including Portion Attributable to Noncontrolling Interest, Net of Tax [Roll Forward] |
|
|
| Other comprehensive income before reclassifications |
1,185
|
3,777
|
| Reclassification of (gains) losses from AOCI to income from unconsolidated funds/ interest expense |
(1,208)
|
(62)
|
| Accumulated Other Comprehensive Income (Loss) |
|
|
| AOCI Including Portion Attributable to Noncontrolling Interest, Net of Tax [Roll Forward] |
|
|
| Beginning balance |
187,063
|
(38,774)
|
| Ending balance |
$ 169,760
|
$ 199,649
|
| X |
- DefinitionAmount after tax, before reclassification adjustments of other comprehensive income (loss). Reference 1: http://fasb.org/us-gaap/role/ref/legacyRef
-Name Accounting Standards Codification
-Topic 220
-SubTopic 10
-Section 45
-Paragraph 14A
-Publisher FASB
-URI https://asc.fasb.org//1943274/2147482790/220-10-45-14A
Reference 2: http://www.xbrl.org/2003/role/disclosureRef
-Topic 220
-SubTopic 10
-Name Accounting Standards Codification
-Section 50
-Paragraph 5
-Publisher FASB
-URI https://asc.fasb.org//1943274/2147482765/220-10-50-5
Reference 3: http://www.xbrl.org/2003/role/disclosureRef
-Topic 830
-SubTopic 30
-Name Accounting Standards Codification
-Section 50
-Paragraph 1
-Publisher FASB
-URI https://asc.fasb.org//1943274/2147481674/830-30-50-1
Reference 4: http://www.xbrl.org/2003/role/disclosureRef
-Topic 830
-SubTopic 30
-Name Accounting Standards Codification
-Section 45
-Paragraph 17
-Publisher FASB
-URI https://asc.fasb.org//1943274/2147481694/830-30-45-17
Reference 5: http://www.xbrl.org/2003/role/disclosureRef
-Topic 830
-SubTopic 30
-Name Accounting Standards Codification
-Section 45
-Paragraph 20
-Subparagraph (b)
-Publisher FASB
-URI https://asc.fasb.org//1943274/2147481694/830-30-45-20
Reference 6: http://www.xbrl.org/2009/role/commonPracticeRef
-Topic 220
-SubTopic 10
-Name Accounting Standards Codification
-Section 50
-Paragraph 4
-Publisher FASB
-URI https://asc.fasb.org//1943274/2147482765/220-10-50-4
Reference 7: http://fasb.org/us-gaap/role/ref/legacyRef
-Name Accounting Standards Codification
-Section 55
-Paragraph 15
-SubTopic 10
-Topic 220
-Publisher FASB
-URI https://asc.fasb.org//1943274/2147482739/220-10-55-15
| Name: |
us-gaap_OtherComprehensiveIncomeLossBeforeReclassificationsNetOfTax |
| Namespace Prefix: |
us-gaap_ |
| Data Type: |
xbrli:monetaryItemType |
| Balance Type: |
credit |
| Period Type: |
duration |
|
| X |
- DefinitionAmount after tax and reclassification adjustments of other comprehensive income (loss). Reference 1: http://fasb.org/us-gaap/role/ref/legacyRef
-Name Accounting Standards Codification
-Section 50
-Paragraph 2
-SubTopic 10
-Topic 505
-Publisher FASB
-URI https://asc.fasb.org//1943274/2147481112/505-10-50-2
Reference 2: http://www.xbrl.org/2003/role/disclosureRef
-Topic 830
-SubTopic 30
-Name Accounting Standards Codification
-Section 50
-Paragraph 1
-Publisher FASB
-URI https://asc.fasb.org//1943274/2147481674/830-30-50-1
Reference 3: http://www.xbrl.org/2003/role/disclosureRef
-Topic 830
-SubTopic 30
-Name Accounting Standards Codification
-Section 45
-Paragraph 17
-Publisher FASB
-URI https://asc.fasb.org//1943274/2147481694/830-30-45-17
Reference 4: http://www.xbrl.org/2003/role/disclosureRef
-Topic 944
-SubTopic 220
-Name Accounting Standards Codification
-Section S99
-Paragraph 1
-Subparagraph (SX 210.7-04(19))
-Publisher FASB
-URI https://asc.fasb.org//1943274/2147483586/944-220-S99-1
Reference 5: http://www.xbrl.org/2009/role/commonPracticeRef
-Topic 220
-SubTopic 10
-Name Accounting Standards Codification
-Section 50
-Paragraph 4
-Publisher FASB
-URI https://asc.fasb.org//1943274/2147482765/220-10-50-4
Reference 6: http://www.xbrl.org/2009/role/commonPracticeRef
-Topic 220
-SubTopic 10
-Name Accounting Standards Codification
-Section 50
-Paragraph 5
-Publisher FASB
-URI https://asc.fasb.org//1943274/2147482765/220-10-50-5
Reference 7: http://www.xbrl.org/2003/role/disclosureRef
-Topic 830
-SubTopic 30
-Name Accounting Standards Codification
-Section 45
-Paragraph 20
-Publisher FASB
-URI https://asc.fasb.org//1943274/2147481694/830-30-45-20
Reference 8: http://www.xbrl.org/2003/role/disclosureRef
-Topic 220
-SubTopic 10
-Name Accounting Standards Codification
-Section S99
-Paragraph 2
-Subparagraph (SX 210.5-03(21))
-Publisher FASB
-URI https://asc.fasb.org//1943274/2147483621/220-10-S99-2
Reference 9: http://www.xbrl.org/2003/role/disclosureRef
-Topic 942
-SubTopic 220
-Name Accounting Standards Codification
-Section S99
-Paragraph 1
-Subparagraph (SX 210.9-04(23))
-Publisher FASB
-URI https://asc.fasb.org//1943274/2147483589/942-220-S99-1
Reference 10: http://www.xbrl.org/2003/role/disclosureRef
-Topic 220
-SubTopic 10
-Name Accounting Standards Codification
-Section 45
-Paragraph 1B
-Subparagraph (b)
-Publisher FASB
-URI https://asc.fasb.org//1943274/2147482790/220-10-45-1B
Reference 11: http://fasb.org/us-gaap/role/ref/legacyRef
-Name Accounting Standards Codification
-Section 55
-Paragraph 15
-SubTopic 10
-Topic 220
-Publisher FASB
-URI https://asc.fasb.org//1943274/2147482739/220-10-55-15
Reference 12: http://www.xbrl.org/2003/role/disclosureRef
-Topic 220
-SubTopic 10
-Name Accounting Standards Codification
-Section 45
-Paragraph 1A
-Subparagraph (b)
-Publisher FASB
-URI https://asc.fasb.org//1943274/2147482790/220-10-45-1A
| Name: |
us-gaap_OtherComprehensiveIncomeLossNetOfTax |
| Namespace Prefix: |
us-gaap_ |
| Data Type: |
xbrli:monetaryItemType |
| Balance Type: |
credit |
| Period Type: |
duration |
|
| X |
- DefinitionAmount after tax of other comprehensive income (loss) attributable to noncontrolling interests. Reference 1: http://fasb.org/us-gaap/role/ref/legacyRef
-Topic 810
-SubTopic 10
-Name Accounting Standards Codification
-Section 45
-Paragraph 19
-Publisher FASB
-URI https://asc.fasb.org//1943274/2147481231/810-10-45-19
Reference 2: http://fasb.org/us-gaap/role/ref/legacyRef
-Name Accounting Standards Codification
-Section 45
-Paragraph 20
-SubTopic 10
-Topic 810
-Publisher FASB
-URI https://asc.fasb.org//1943274/2147481231/810-10-45-20
Reference 3: http://fasb.org/us-gaap/role/ref/legacyRef
-Name Accounting Standards Codification
-Section 50
-Paragraph 1A
-Subparagraph (c)(3)
-SubTopic 10
-Topic 810
-Publisher FASB
-URI https://asc.fasb.org//1943274/2147481203/810-10-50-1A
Reference 4: http://www.xbrl.org/2003/role/disclosureRef
-Topic 220
-SubTopic 10
-Name Accounting Standards Codification
-Section 45
-Paragraph 1B
-Subparagraph (b)
-Publisher FASB
-URI https://asc.fasb.org//1943274/2147482790/220-10-45-1B
Reference 5: http://www.xbrl.org/2003/role/disclosureRef
-Topic 220
-SubTopic 10
-Name Accounting Standards Codification
-Section 45
-Paragraph 1A
-Subparagraph (b)
-Publisher FASB
-URI https://asc.fasb.org//1943274/2147482790/220-10-45-1A
| Name: |
us-gaap_OtherComprehensiveIncomeLossNetOfTaxPortionAttributableToNoncontrollingInterest |
| Namespace Prefix: |
us-gaap_ |
| Data Type: |
xbrli:monetaryItemType |
| Balance Type: |
debit |
| Period Type: |
duration |
|
| X |
- DefinitionAmount after tax of other comprehensive income (loss) attributable to parent entity. Reference 1: http://fasb.org/us-gaap/role/ref/legacyRef
-Topic 810
-SubTopic 10
-Name Accounting Standards Codification
-Section 45
-Paragraph 19
-Publisher FASB
-URI https://asc.fasb.org//1943274/2147481231/810-10-45-19
Reference 2: http://fasb.org/us-gaap/role/ref/legacyRef
-Name Accounting Standards Codification
-Section 45
-Paragraph 20
-SubTopic 10
-Topic 810
-Publisher FASB
-URI https://asc.fasb.org//1943274/2147481231/810-10-45-20
Reference 3: http://fasb.org/us-gaap/role/ref/legacyRef
-Name Accounting Standards Codification
-Section 50
-Paragraph 1A
-Subparagraph (c)(3)
-SubTopic 10
-Topic 810
-Publisher FASB
-URI https://asc.fasb.org//1943274/2147481203/810-10-50-1A
Reference 4: http://www.xbrl.org/2003/role/disclosureRef
-Topic 220
-SubTopic 10
-Name Accounting Standards Codification
-Section 45
-Paragraph 1B
-Subparagraph (b)
-Publisher FASB
-URI https://asc.fasb.org//1943274/2147482790/220-10-45-1B
Reference 5: http://www.xbrl.org/2003/role/disclosureRef
-Topic 220
-SubTopic 10
-Name Accounting Standards Codification
-Section 45
-Paragraph 1A
-Subparagraph (b)
-Publisher FASB
-URI https://asc.fasb.org//1943274/2147482790/220-10-45-1A
| Name: |
us-gaap_OtherComprehensiveIncomeLossNetOfTaxPortionAttributableToParent |
| Namespace Prefix: |
us-gaap_ |
| Data Type: |
xbrli:monetaryItemType |
| Balance Type: |
credit |
| Period Type: |
duration |
|
| X |
- DefinitionAmount after tax of reclassification adjustments of other comprehensive income (loss). Reference 1: http://fasb.org/us-gaap/role/ref/legacyRef
-Name Accounting Standards Codification
-Topic 220
-SubTopic 10
-Section 45
-Paragraph 14A
-Publisher FASB
-URI https://asc.fasb.org//1943274/2147482790/220-10-45-14A
Reference 2: http://www.xbrl.org/2003/role/disclosureRef
-Topic 220
-SubTopic 10
-Name Accounting Standards Codification
-Section 50
-Paragraph 5
-Publisher FASB
-URI https://asc.fasb.org//1943274/2147482765/220-10-50-5
Reference 3: http://www.xbrl.org/2003/role/disclosureRef
-Topic 830
-SubTopic 30
-Name Accounting Standards Codification
-Section 50
-Paragraph 1
-Publisher FASB
-URI https://asc.fasb.org//1943274/2147481674/830-30-50-1
Reference 4: http://www.xbrl.org/2003/role/disclosureRef
-Topic 830
-SubTopic 30
-Name Accounting Standards Codification
-Section 45
-Paragraph 17
-Publisher FASB
-URI https://asc.fasb.org//1943274/2147481694/830-30-45-17
Reference 5: http://www.xbrl.org/2003/role/disclosureRef
-Topic 830
-SubTopic 30
-Name Accounting Standards Codification
-Section 45
-Paragraph 20
-Subparagraph (d)
-Publisher FASB
-URI https://asc.fasb.org//1943274/2147481694/830-30-45-20
Reference 6: http://www.xbrl.org/2009/role/commonPracticeRef
-Topic 220
-SubTopic 10
-Name Accounting Standards Codification
-Section 50
-Paragraph 4
-Publisher FASB
-URI https://asc.fasb.org//1943274/2147482765/220-10-50-4
Reference 7: http://fasb.org/us-gaap/role/ref/legacyRef
-Name Accounting Standards Codification
-Section 55
-Paragraph 15
-SubTopic 10
-Topic 220
-Publisher FASB
-URI https://asc.fasb.org//1943274/2147482739/220-10-55-15
| Name: |
us-gaap_ReclassificationFromAccumulatedOtherComprehensiveIncomeCurrentPeriodNetOfTax |
| Namespace Prefix: |
us-gaap_ |
| Data Type: |
xbrli:monetaryItemType |
| Balance Type: |
debit |
| Period Type: |
duration |
|
| X |
- DefinitionA roll forward is a reconciliation of a concept from the beginning of a period to the end of a period.
| Name: |
us-gaap_ReclassificationFromAccumulatedOtherComprehensiveIncomeCurrentPeriodNetOfTaxAbstract |
| Namespace Prefix: |
us-gaap_ |
| Data Type: |
xbrli:stringItemType |
| Balance Type: |
na |
| Period Type: |
duration |
|
| X |
- DefinitionAmount of equity (deficit) attributable to parent and noncontrolling interest. Excludes temporary equity. Reference 1: http://www.xbrl.org/2003/role/disclosureRef
-Topic 250
-SubTopic 10
-Name Accounting Standards Codification
-Section 45
-Paragraph 24
-Publisher FASB
-URI https://asc.fasb.org//1943274/2147483421/250-10-45-24
Reference 2: http://www.xbrl.org/2003/role/disclosureRef
-Topic 250
-SubTopic 10
-Name Accounting Standards Codification
-Section 45
-Paragraph 23
-Subparagraph (b)
-Publisher FASB
-URI https://asc.fasb.org//1943274/2147483421/250-10-45-23
Reference 3: http://www.xbrl.org/2003/role/disclosureRef
-Topic 250
-SubTopic 10
-Name Accounting Standards Codification
-Section 45
-Paragraph 5
-Subparagraph (b)
-Publisher FASB
-URI https://asc.fasb.org//1943274/2147483421/250-10-45-5
Reference 4: http://www.xbrl.org/2003/role/disclosureRef
-Topic 326
-SubTopic 10
-Name Accounting Standards Codification
-Section 65
-Paragraph 5
-Subparagraph (c)(2)
-Publisher FASB
-URI https://asc.fasb.org//1943274/2147479654/326-10-65-5
Reference 5: http://www.xbrl.org/2003/role/disclosureRef
-Topic 815
-SubTopic 20
-Name Accounting Standards Codification
-Section 65
-Paragraph 6
-Subparagraph (e)
-Publisher FASB
-URI https://asc.fasb.org//1943274/2147480528/815-20-65-6
Reference 6: http://www.xbrl.org/2003/role/disclosureRef
-Topic 815
-SubTopic 20
-Name Accounting Standards Codification
-Section 65
-Paragraph 6
-Subparagraph (h)(1)
-Publisher FASB
-URI https://asc.fasb.org//1943274/2147480528/815-20-65-6
Reference 7: http://www.xbrl.org/2003/role/disclosureRef
-Topic 815
-SubTopic 20
-Name Accounting Standards Codification
-Section 65
-Paragraph 6
-Subparagraph (h)(1)(i)
-Publisher FASB
-URI https://asc.fasb.org//1943274/2147480528/815-20-65-6
Reference 8: http://www.xbrl.org/2003/role/disclosureRef
-Topic 815
-SubTopic 20
-Name Accounting Standards Codification
-Section 65
-Paragraph 6
-Subparagraph (h)(1)(iii)
-Publisher FASB
-URI https://asc.fasb.org//1943274/2147480528/815-20-65-6
Reference 9: http://www.xbrl.org/2003/role/disclosureRef
-Topic 815
-SubTopic 20
-Name Accounting Standards Codification
-Section 65
-Paragraph 6
-Subparagraph (h)(1)(iv)
-Publisher FASB
-URI https://asc.fasb.org//1943274/2147480528/815-20-65-6
Reference 10: http://www.xbrl.org/2003/role/disclosureRef
-Topic 815
-SubTopic 20
-Name Accounting Standards Codification
-Section 65
-Paragraph 6
-Subparagraph (i)(3)
-Publisher FASB
-URI https://asc.fasb.org//1943274/2147480528/815-20-65-6
Reference 11: http://www.xbrl.org/2003/role/disclosureRef
-Topic 848
-SubTopic 10
-Name Accounting Standards Codification
-Section 65
-Paragraph 2
-Subparagraph (a)(3)(iii)(03)
-Publisher FASB
-URI https://asc.fasb.org//1943274/2147483550/848-10-65-2
Reference 12: http://www.xbrl.org/2003/role/disclosureRef
-Topic 105
-SubTopic 10
-Name Accounting Standards Codification
-Section 65
-Paragraph 6
-Subparagraph (c)
-Publisher FASB
-URI https://asc.fasb.org//1943274/2147479343/105-10-65-6
Reference 13: http://www.xbrl.org/2003/role/disclosureRef
-Topic 105
-SubTopic 10
-Name Accounting Standards Codification
-Section 65
-Paragraph 6
-Subparagraph (d)
-Publisher FASB
-URI https://asc.fasb.org//1943274/2147479343/105-10-65-6
Reference 14: http://www.xbrl.org/2003/role/disclosureRef
-Topic 944
-SubTopic 40
-Name Accounting Standards Codification
-Section 65
-Paragraph 2
-Subparagraph (f)(1)
-Publisher FASB
-URI https://asc.fasb.org//1943274/2147480016/944-40-65-2
Reference 15: http://www.xbrl.org/2003/role/disclosureRef
-Topic 944
-SubTopic 40
-Name Accounting Standards Codification
-Section 65
-Paragraph 2
-Subparagraph (f)(2)
-Publisher FASB
-URI https://asc.fasb.org//1943274/2147480016/944-40-65-2
Reference 16: http://www.xbrl.org/2003/role/disclosureRef
-Topic 740
-SubTopic 10
-Name Accounting Standards Codification
-Section 65
-Paragraph 8
-Subparagraph (d)(2)
-Publisher FASB
-URI https://asc.fasb.org//1943274/2147482615/740-10-65-8
Reference 17: http://www.xbrl.org/2003/role/disclosureRef
-Topic 740
-SubTopic 10
-Name Accounting Standards Codification
-Section 65
-Paragraph 8
-Subparagraph (d)(3)
-Publisher FASB
-URI https://asc.fasb.org//1943274/2147482615/740-10-65-8
Reference 18: http://www.xbrl.org/2003/role/disclosureRef
-Topic 326
-SubTopic 10
-Name Accounting Standards Codification
-Section 65
-Paragraph 4
-Subparagraph (d)
-Publisher FASB
-URI https://asc.fasb.org//1943274/2147479654/326-10-65-4
Reference 19: http://www.xbrl.org/2003/role/disclosureRef
-Topic 718
-SubTopic 10
-Name Accounting Standards Codification
-Section 65
-Paragraph 15
-Subparagraph (e)
-Publisher FASB
-URI https://asc.fasb.org//1943274/2147480336/718-10-65-15
Reference 20: http://www.xbrl.org/2003/role/disclosureRef
-Topic 718
-SubTopic 10
-Name Accounting Standards Codification
-Section 65
-Paragraph 15
-Subparagraph (f)(1)
-Publisher FASB
-URI https://asc.fasb.org//1943274/2147480336/718-10-65-15
Reference 21: http://www.xbrl.org/2003/role/disclosureRef
-Topic 718
-SubTopic 10
-Name Accounting Standards Codification
-Section 65
-Paragraph 15
-Subparagraph (f)(2)
-Publisher FASB
-URI https://asc.fasb.org//1943274/2147480336/718-10-65-15
Reference 22: http://www.xbrl.org/2003/role/disclosureRef
-Topic 250
-SubTopic 10
-Name Accounting Standards Codification
-Section 50
-Paragraph 1
-Subparagraph (b)(3)
-Publisher FASB
-URI https://asc.fasb.org//1943274/2147483443/250-10-50-1
Reference 23: http://www.xbrl.org/2003/role/disclosureRef
-Topic 815
-SubTopic 40
-Name Accounting Standards Codification
-Section 65
-Paragraph 1
-Subparagraph (e)(3)
-Publisher FASB
-URI https://asc.fasb.org//1943274/2147480175/815-40-65-1
Reference 24: http://www.xbrl.org/2003/role/disclosureRef
-Topic 250
-SubTopic 10
-Name Accounting Standards Codification
-Section 50
-Paragraph 7
-Subparagraph (b)
-Publisher FASB
-URI https://asc.fasb.org//1943274/2147483443/250-10-50-7
Reference 25: http://www.xbrl.org/2003/role/disclosureRef
-Topic 220
-SubTopic 10
-Name Accounting Standards Codification
-Section 50
-Paragraph 5
-Publisher FASB
-URI https://asc.fasb.org//1943274/2147482765/220-10-50-5
Reference 26: http://www.xbrl.org/2003/role/disclosureRef
-Topic 830
-SubTopic 30
-Name Accounting Standards Codification
-Section 50
-Paragraph 1
-Publisher FASB
-URI https://asc.fasb.org//1943274/2147481674/830-30-50-1
Reference 27: http://www.xbrl.org/2003/role/disclosureRef
-Topic 830
-SubTopic 30
-Name Accounting Standards Codification
-Section 45
-Paragraph 17
-Publisher FASB
-URI https://asc.fasb.org//1943274/2147481694/830-30-45-17
Reference 28: http://www.xbrl.org/2003/role/disclosureRef
-Topic 830
-SubTopic 30
-Name Accounting Standards Codification
-Section 45
-Paragraph 20
-Subparagraph (a)
-Publisher FASB
-URI https://asc.fasb.org//1943274/2147481694/830-30-45-20
Reference 29: http://www.xbrl.org/2003/role/exampleRef
-Topic 946
-SubTopic 830
-Name Accounting Standards Codification
-Section 55
-Paragraph 11
-Publisher FASB
-URI https://asc.fasb.org//1943274/2147480167/946-830-55-11
Reference 30: http://www.xbrl.org/2003/role/disclosureRef
-Topic 946
-SubTopic 205
-Name Accounting Standards Codification
-Section 45
-Paragraph 3
-Publisher FASB
-URI https://asc.fasb.org//1943274/2147480767/946-205-45-3
Reference 31: http://www.xbrl.org/2003/role/disclosureRef
-Topic 946
-SubTopic 505
-Name Accounting Standards Codification
-Section 50
-Paragraph 3
-Publisher FASB
-URI https://asc.fasb.org//1943274/2147481004/946-505-50-3
Reference 32: http://www.xbrl.org/2003/role/disclosureRef
-Topic 946
-SubTopic 210
-Name Accounting Standards Codification
-Section S99
-Paragraph 1
-Subparagraph (SX 210.6-04(19))
-Publisher FASB
-URI https://asc.fasb.org//1943274/2147479617/946-210-S99-1
Reference 33: http://www.xbrl.org/2003/role/disclosureRef
-Topic 946
-SubTopic 210
-Name Accounting Standards Codification
-Section S99
-Paragraph 2
-Subparagraph (SX 210.6-05(4))
-Publisher FASB
-URI https://asc.fasb.org//1943274/2147479617/946-210-S99-2
Reference 34: http://www.xbrl.org/2009/role/commonPracticeRef
-Topic 946
-SubTopic 220
-Name Accounting Standards Codification
-Section S99
-Paragraph 3
-Subparagraph (SX 210.6-09(4)(b))
-Publisher FASB
-URI https://asc.fasb.org//1943274/2147483575/946-220-S99-3
Reference 35: http://www.xbrl.org/2003/role/disclosureRef
-Topic 946
-SubTopic 220
-Name Accounting Standards Codification
-Section S99
-Paragraph 3
-Subparagraph (SX 210.6-09(6))
-Publisher FASB
-URI https://asc.fasb.org//1943274/2147483575/946-220-S99-3
Reference 36: http://www.xbrl.org/2003/role/disclosureRef
-Topic 946
-SubTopic 220
-Name Accounting Standards Codification
-Section S99
-Paragraph 3
-Subparagraph (SX 210.6-09(7))
-Publisher FASB
-URI https://asc.fasb.org//1943274/2147483575/946-220-S99-3
Reference 37: http://www.xbrl.org/2003/role/disclosureRef
-Topic 505
-SubTopic 10
-Name Accounting Standards Codification
-Section S99
-Paragraph 1
-Subparagraph (SX 210.3-04)
-Publisher FASB
-URI https://asc.fasb.org//1943274/2147480008/505-10-S99-1
Reference 38: http://www.xbrl.org/2009/role/commonPracticeRef
-Topic 235
-SubTopic 10
-Name Accounting Standards Codification
-Section S99
-Paragraph 1
-Subparagraph (SX 210.4-08(g)(1)(ii))
-Publisher FASB
-URI https://asc.fasb.org//1943274/2147480678/235-10-S99-1
Reference 39: http://www.xbrl.org/2009/role/commonPracticeRef
-Topic 323
-SubTopic 10
-Name Accounting Standards Codification
-Section 50
-Paragraph 3
-Subparagraph (c)
-Publisher FASB
-URI https://asc.fasb.org//1943274/2147481687/323-10-50-3
Reference 40: http://www.xbrl.org/2009/role/commonPracticeRef
-Topic 825
-SubTopic 10
-Name Accounting Standards Codification
-Section 50
-Paragraph 28
-Subparagraph (f)
-Publisher FASB
-URI https://asc.fasb.org//1943274/2147482907/825-10-50-28
Reference 41: http://fasb.org/us-gaap/role/ref/legacyRef
-Name Accounting Standards Codification
-Topic 810
-SubTopic 10
-Section 45
-Paragraph 15
-Publisher FASB
-URI https://asc.fasb.org//1943274/2147481231/810-10-45-15
Reference 42: http://fasb.org/us-gaap/role/ref/legacyRef
-Name Accounting Standards Codification
-Topic 810
-SubTopic 10
-Section 45
-Paragraph 16
-Publisher FASB
-URI https://asc.fasb.org//1943274/2147481231/810-10-45-16
Reference 43: http://fasb.org/us-gaap/role/ref/legacyRef
-Name Accounting Standards Codification
-Topic 810
-SubTopic 10
-Section 55
-Paragraph 4I
-Publisher FASB
-URI https://asc.fasb.org//1943274/2147481175/810-10-55-4I
| Name: |
us-gaap_StockholdersEquityIncludingPortionAttributableToNoncontrollingInterest |
| Namespace Prefix: |
us-gaap_ |
| Data Type: |
xbrli:monetaryItemType |
| Balance Type: |
credit |
| Period Type: |
instant |
|
| X |
- Details
| Name: |
us-gaap_EquityMethodInvestmentNonconsolidatedInvesteeAxis=us-gaap_EquityMethodInvestmentNonconsolidatedInvesteeOrGroupOfInvesteesMember |
| Namespace Prefix: |
|
| Data Type: |
na |
| Balance Type: |
|
| Period Type: |
|
|
| X |
- Details
| Name: |
us-gaap_StatementEquityComponentsAxis=us-gaap_AccumulatedOtherComprehensiveIncomeMember |
| Namespace Prefix: |
|
| Data Type: |
na |
| Balance Type: |
|
| Period Type: |
|
|
v3.23.3
Equity - Equity Compensation (Details) - USD ($)
$ in Thousands |
3 Months Ended |
9 Months Ended |
Sep. 30, 2023 |
Sep. 30, 2022 |
Sep. 30, 2023 |
Sep. 30, 2022 |
| Stockholders' Equity Note [Abstract] |
|
|
|
|
| Stock-based compensation expense |
$ 2,327
|
$ 2,266
|
$ 7,553
|
$ 7,156
|
| Capitalized stock-based compensation |
$ 752
|
$ 826
|
$ 2,209
|
$ 2,455
|
| X |
- DefinitionAmount of cost capitalized for award under share-based payment arrangement. Reference 1: http://www.xbrl.org/2003/role/disclosureRef
-Topic 718
-SubTopic 10
-Name Accounting Standards Codification
-Section 50
-Paragraph 2
-Subparagraph (h)(1)(ii)
-Publisher FASB
-URI https://asc.fasb.org//1943274/2147480429/718-10-50-2
| Name: |
us-gaap_EmployeeServiceShareBasedCompensationAllocationOfRecognizedPeriodCostsCapitalizedAmount |
| Namespace Prefix: |
us-gaap_ |
| Data Type: |
xbrli:monetaryItemType |
| Balance Type: |
debit |
| Period Type: |
duration |
|
| X |
- DefinitionAmount of noncash expense for share-based payment arrangement. Reference 1: http://fasb.org/us-gaap/role/ref/legacyRef
-Name Accounting Standards Codification
-Section 45
-Paragraph 28
-Subparagraph (a)
-SubTopic 10
-Topic 230
-Publisher FASB
-URI https://asc.fasb.org//1943274/2147482740/230-10-45-28
| Name: |
us-gaap_ShareBasedCompensation |
| Namespace Prefix: |
us-gaap_ |
| Data Type: |
xbrli:monetaryItemType |
| Balance Type: |
debit |
| Period Type: |
duration |
|
| X |
- References
+ Details
| Name: |
us-gaap_StockholdersEquityNoteAbstract |
| Namespace Prefix: |
us-gaap_ |
| Data Type: |
xbrli:stringItemType |
| Balance Type: |
na |
| Period Type: |
duration |
|
v3.23.3
EPS (Details) - USD ($)
$ / shares in Units, $ in Thousands |
3 Months Ended |
9 Months Ended |
Sep. 30, 2023 |
Sep. 30, 2022 |
Sep. 30, 2023 |
Sep. 30, 2022 |
| Earnings Per Share [Abstract] |
|
|
|
|
| Net (loss) income attributable to common stockholders |
$ (13,362)
|
$ 22,955
|
$ (2,251)
|
$ 72,843
|
| Allocation to participating securities: Unvested LTIP Units |
(271)
|
(218)
|
(831)
|
(666)
|
| Net (loss) income attributable to common stockholders - basic |
(13,633)
|
22,737
|
(3,082)
|
72,177
|
| Net (loss) income attributable to common stockholders - diluted |
$ (13,633)
|
$ 22,737
|
$ (3,082)
|
$ 72,177
|
| Weighted average shares of common stock outstanding, basic (in shares) |
166,738,000
|
175,784,000
|
170,553,000
|
175,742,000
|
| Weighted average shares of common stock outstanding, diluted (in shares) |
166,738,000
|
175,784,000
|
170,553,000
|
175,742,000
|
| Net (loss) income per common share - basic (in usd per share) |
$ (0.08)
|
$ 0.13
|
$ (0.02)
|
$ 0.41
|
| Net (loss) income per common share – diluted (in usd per share) |
$ (0.08)
|
$ 0.13
|
$ (0.02)
|
$ 0.41
|
| Number of shares of common stock issued upon exchange of one OP unit or one vested LTIP unit (in shares) |
|
|
1
|
1
|
| OP Units |
|
|
|
|
| Antidilutive Securities Excluded from Computation of Earnings Per Share [Line Items] |
|
|
|
|
| Anti-dilutive securities excluded from the computation of weighted average diluted shares (in shares) |
31,698,000
|
30,158,000
|
30,720,000
|
29,626,000
|
| Vested LTIP Units |
|
|
|
|
| Antidilutive Securities Excluded from Computation of Earnings Per Share [Line Items] |
|
|
|
|
| Anti-dilutive securities excluded from the computation of weighted average diluted shares (in shares) |
851,000
|
690,000
|
1,816,000
|
1,255,000
|
| X |
- DefinitionNumber Of Shares Of Common Stock Issued Upon Redemption Of One OP Unit Or One Vested LTIP Unit
| Name: |
nysedei_NumberOfSharesOfCommonStockIssuedUponRedemptionOfOneOPUnitOrOneVestedLTIPUnit |
| Namespace Prefix: |
nysedei_ |
| Data Type: |
xbrli:sharesItemType |
| Balance Type: |
na |
| Period Type: |
duration |
|
| X |
- DefinitionSecurities (including those issuable pursuant to contingent stock agreements) that could potentially dilute basic earnings per share (EPS) or earnings per unit (EPU) in the future that were not included in the computation of diluted EPS or EPU because to do so would increase EPS or EPU amounts or decrease loss per share or unit amounts for the period presented. Reference 1: http://www.xbrl.org/2003/role/disclosureRef
-Topic 260
-SubTopic 10
-Name Accounting Standards Codification
-Section 50
-Paragraph 1
-Subparagraph (c)
-Publisher FASB
-URI https://asc.fasb.org//1943274/2147482662/260-10-50-1
| Name: |
us-gaap_AntidilutiveSecuritiesExcludedFromComputationOfEarningsPerShareAmount |
| Namespace Prefix: |
us-gaap_ |
| Data Type: |
xbrli:sharesItemType |
| Balance Type: |
na |
| Period Type: |
duration |
|
| X |
- DefinitionLine items represent financial concepts included in a table. These concepts are used to disclose reportable information associated with domain members defined in one or many axes to the table.
| Name: |
us-gaap_AntidilutiveSecuritiesExcludedFromComputationOfEarningsPerShareLineItems |
| Namespace Prefix: |
us-gaap_ |
| Data Type: |
xbrli:stringItemType |
| Balance Type: |
na |
| Period Type: |
duration |
|
| X |
- References
+ Details
| Name: |
us-gaap_EarningsPerShareAbstract |
| Namespace Prefix: |
us-gaap_ |
| Data Type: |
xbrli:stringItemType |
| Balance Type: |
na |
| Period Type: |
duration |
|
| X |
- DefinitionThe amount of net income (loss) for the period per each share of common stock or unit outstanding during the reporting period. Reference 1: http://www.xbrl.org/2003/role/disclosureRef
-Topic 250
-SubTopic 10
-Name Accounting Standards Codification
-Section 50
-Paragraph 3
-Publisher FASB
-URI https://asc.fasb.org//1943274/2147483443/250-10-50-3
Reference 2: http://www.xbrl.org/2003/role/disclosureRef
-Topic 260
-SubTopic 10
-Name Accounting Standards Codification
-Section 55
-Paragraph 15
-Publisher FASB
-URI https://asc.fasb.org//1943274/2147482635/260-10-55-15
Reference 3: http://www.xbrl.org/2003/role/disclosureRef
-Topic 815
-SubTopic 40
-Name Accounting Standards Codification
-Section 65
-Paragraph 1
-Subparagraph (e)(4)
-Publisher FASB
-URI https://asc.fasb.org//1943274/2147480175/815-40-65-1
Reference 4: http://www.xbrl.org/2003/role/disclosureRef
-Topic 815
-SubTopic 40
-Name Accounting Standards Codification
-Section 65
-Paragraph 1
-Subparagraph (f)
-Publisher FASB
-URI https://asc.fasb.org//1943274/2147480175/815-40-65-1
Reference 5: http://www.xbrl.org/2003/role/disclosureRef
-Topic 250
-SubTopic 10
-Name Accounting Standards Codification
-Section 50
-Paragraph 11
-Subparagraph (a)
-Publisher FASB
-URI https://asc.fasb.org//1943274/2147483443/250-10-50-11
Reference 6: http://www.xbrl.org/2003/role/disclosureRef
-Topic 250
-SubTopic 10
-Name Accounting Standards Codification
-Section 50
-Paragraph 11
-Subparagraph (b)
-Publisher FASB
-URI https://asc.fasb.org//1943274/2147483443/250-10-50-11
Reference 7: http://www.xbrl.org/2003/role/disclosureRef
-Topic 250
-SubTopic 10
-Name Accounting Standards Codification
-Section 50
-Paragraph 7
-Subparagraph (a)
-Publisher FASB
-URI https://asc.fasb.org//1943274/2147483443/250-10-50-7
Reference 8: http://www.xbrl.org/2003/role/disclosureRef
-Topic 260
-SubTopic 10
-Name Accounting Standards Codification
-Section 45
-Paragraph 2
-Publisher FASB
-URI https://asc.fasb.org//1943274/2147482689/260-10-45-2
Reference 9: http://www.xbrl.org/2003/role/disclosureRef
-Topic 260
-SubTopic 10
-Name Accounting Standards Codification
-Section 45
-Paragraph 60B
-Subparagraph (d)
-Publisher FASB
-URI https://asc.fasb.org//1943274/2147482689/260-10-45-60B
Reference 10: http://www.xbrl.org/2003/role/disclosureRef
-Topic 250
-SubTopic 10
-Name Accounting Standards Codification
-Section 50
-Paragraph 4
-Publisher FASB
-URI https://asc.fasb.org//1943274/2147483443/250-10-50-4
Reference 11: http://www.xbrl.org/2003/role/disclosureRef
-Topic 260
-SubTopic 10
-Name Accounting Standards Codification
-Section 50
-Paragraph 1
-Subparagraph (a)
-Publisher FASB
-URI https://asc.fasb.org//1943274/2147482662/260-10-50-1
Reference 12: http://www.xbrl.org/2003/role/disclosureRef
-Topic 260
-SubTopic 10
-Name Accounting Standards Codification
-Section 45
-Paragraph 10
-Publisher FASB
-URI https://asc.fasb.org//1943274/2147482689/260-10-45-10
Reference 13: http://www.xbrl.org/2003/role/disclosureRef
-Topic 220
-SubTopic 10
-Name Accounting Standards Codification
-Section S99
-Paragraph 2
-Subparagraph (SX 210.5-03(25))
-Publisher FASB
-URI https://asc.fasb.org//1943274/2147483621/220-10-S99-2
Reference 14: http://www.xbrl.org/2003/role/disclosureRef
-Topic 942
-SubTopic 220
-Name Accounting Standards Codification
-Section S99
-Paragraph 1
-Subparagraph (SX 210.9-04(27))
-Publisher FASB
-URI https://asc.fasb.org//1943274/2147483589/942-220-S99-1
Reference 15: http://www.xbrl.org/2003/role/disclosureRef
-Topic 944
-SubTopic 220
-Name Accounting Standards Codification
-Section S99
-Paragraph 1
-Subparagraph (SX 210.7-04(23))
-Publisher FASB
-URI https://asc.fasb.org//1943274/2147483586/944-220-S99-1
Reference 16: http://www.xbrl.org/2003/role/exampleRef
-Topic 260
-SubTopic 10
-Name Accounting Standards Codification
-Section 55
-Paragraph 52
-Publisher FASB
-URI https://asc.fasb.org//1943274/2147482635/260-10-55-52
Reference 17: http://www.xbrl.org/2003/role/disclosureRef
-Topic 260
-SubTopic 10
-Name Accounting Standards Codification
-Section 45
-Paragraph 7
-Publisher FASB
-URI https://asc.fasb.org//1943274/2147482689/260-10-45-7
| Name: |
us-gaap_EarningsPerShareBasic |
| Namespace Prefix: |
us-gaap_ |
| Data Type: |
dtr-types:perShareItemType |
| Balance Type: |
na |
| Period Type: |
duration |
|
| X |
- DefinitionThe amount of net income (loss) for the period available to each share of common stock or common unit outstanding during the reporting period and to each share or unit that would have been outstanding assuming the issuance of common shares or units for all dilutive potential common shares or units outstanding during the reporting period. Reference 1: http://www.xbrl.org/2003/role/disclosureRef
-Topic 250
-SubTopic 10
-Name Accounting Standards Codification
-Section 50
-Paragraph 3
-Publisher FASB
-URI https://asc.fasb.org//1943274/2147483443/250-10-50-3
Reference 2: http://www.xbrl.org/2003/role/disclosureRef
-Topic 260
-SubTopic 10
-Name Accounting Standards Codification
-Section 55
-Paragraph 15
-Publisher FASB
-URI https://asc.fasb.org//1943274/2147482635/260-10-55-15
Reference 3: http://www.xbrl.org/2003/role/disclosureRef
-Topic 815
-SubTopic 40
-Name Accounting Standards Codification
-Section 65
-Paragraph 1
-Subparagraph (e)(4)
-Publisher FASB
-URI https://asc.fasb.org//1943274/2147480175/815-40-65-1
Reference 4: http://www.xbrl.org/2003/role/disclosureRef
-Topic 815
-SubTopic 40
-Name Accounting Standards Codification
-Section 65
-Paragraph 1
-Subparagraph (f)
-Publisher FASB
-URI https://asc.fasb.org//1943274/2147480175/815-40-65-1
Reference 5: http://www.xbrl.org/2003/role/disclosureRef
-Topic 250
-SubTopic 10
-Name Accounting Standards Codification
-Section 50
-Paragraph 11
-Subparagraph (a)
-Publisher FASB
-URI https://asc.fasb.org//1943274/2147483443/250-10-50-11
Reference 6: http://www.xbrl.org/2003/role/disclosureRef
-Topic 250
-SubTopic 10
-Name Accounting Standards Codification
-Section 50
-Paragraph 11
-Subparagraph (b)
-Publisher FASB
-URI https://asc.fasb.org//1943274/2147483443/250-10-50-11
Reference 7: http://www.xbrl.org/2003/role/disclosureRef
-Topic 250
-SubTopic 10
-Name Accounting Standards Codification
-Section 50
-Paragraph 7
-Subparagraph (a)
-Publisher FASB
-URI https://asc.fasb.org//1943274/2147483443/250-10-50-7
Reference 8: http://www.xbrl.org/2003/role/disclosureRef
-Topic 260
-SubTopic 10
-Name Accounting Standards Codification
-Section 45
-Paragraph 2
-Publisher FASB
-URI https://asc.fasb.org//1943274/2147482689/260-10-45-2
Reference 9: http://www.xbrl.org/2003/role/disclosureRef
-Topic 260
-SubTopic 10
-Name Accounting Standards Codification
-Section 45
-Paragraph 60B
-Subparagraph (d)
-Publisher FASB
-URI https://asc.fasb.org//1943274/2147482689/260-10-45-60B
Reference 10: http://www.xbrl.org/2003/role/disclosureRef
-Topic 250
-SubTopic 10
-Name Accounting Standards Codification
-Section 50
-Paragraph 4
-Publisher FASB
-URI https://asc.fasb.org//1943274/2147483443/250-10-50-4
Reference 11: http://www.xbrl.org/2003/role/disclosureRef
-Topic 260
-SubTopic 10
-Name Accounting Standards Codification
-Section 50
-Paragraph 1
-Subparagraph (a)
-Publisher FASB
-URI https://asc.fasb.org//1943274/2147482662/260-10-50-1
Reference 12: http://www.xbrl.org/2003/role/disclosureRef
-Topic 220
-SubTopic 10
-Name Accounting Standards Codification
-Section S99
-Paragraph 2
-Subparagraph (SX 210.5-03(25))
-Publisher FASB
-URI https://asc.fasb.org//1943274/2147483621/220-10-S99-2
Reference 13: http://www.xbrl.org/2003/role/disclosureRef
-Topic 942
-SubTopic 220
-Name Accounting Standards Codification
-Section S99
-Paragraph 1
-Subparagraph (SX 210.9-04(27))
-Publisher FASB
-URI https://asc.fasb.org//1943274/2147483589/942-220-S99-1
Reference 14: http://www.xbrl.org/2003/role/disclosureRef
-Topic 944
-SubTopic 220
-Name Accounting Standards Codification
-Section S99
-Paragraph 1
-Subparagraph (SX 210.7-04(23))
-Publisher FASB
-URI https://asc.fasb.org//1943274/2147483586/944-220-S99-1
Reference 15: http://www.xbrl.org/2003/role/exampleRef
-Topic 260
-SubTopic 10
-Name Accounting Standards Codification
-Section 55
-Paragraph 52
-Publisher FASB
-URI https://asc.fasb.org//1943274/2147482635/260-10-55-52
Reference 16: http://www.xbrl.org/2003/role/disclosureRef
-Topic 260
-SubTopic 10
-Name Accounting Standards Codification
-Section 45
-Paragraph 7
-Publisher FASB
-URI https://asc.fasb.org//1943274/2147482689/260-10-45-7
| Name: |
us-gaap_EarningsPerShareDiluted |
| Namespace Prefix: |
us-gaap_ |
| Data Type: |
dtr-types:perShareItemType |
| Balance Type: |
na |
| Period Type: |
duration |
|
| X |
- DefinitionThe portion of profit or loss for the period, net of income taxes, which is attributable to the parent. Reference 1: http://www.xbrl.org/2003/role/disclosureRef
-Topic 235
-SubTopic 10
-Name Accounting Standards Codification
-Section S99
-Paragraph 1
-Subparagraph (SX 210.4-08(g)(1)(ii))
-Publisher FASB
-URI https://asc.fasb.org//1943274/2147480678/235-10-S99-1
Reference 2: http://www.xbrl.org/2003/role/disclosureRef
-Topic 323
-SubTopic 10
-Name Accounting Standards Codification
-Section 50
-Paragraph 3
-Subparagraph (c)
-Publisher FASB
-URI https://asc.fasb.org//1943274/2147481687/323-10-50-3
Reference 3: http://www.xbrl.org/2003/role/disclosureRef
-Topic 825
-SubTopic 10
-Name Accounting Standards Codification
-Section 50
-Paragraph 28
-Subparagraph (f)
-Publisher FASB
-URI https://asc.fasb.org//1943274/2147482907/825-10-50-28
Reference 4: http://www.xbrl.org/2003/role/disclosureRef
-Topic 220
-SubTopic 10
-Name Accounting Standards Codification
-Section 50
-Paragraph 6
-Publisher FASB
-URI https://asc.fasb.org//1943274/2147482765/220-10-50-6
Reference 5: http://www.xbrl.org/2003/role/disclosureRef
-Topic 250
-SubTopic 10
-Name Accounting Standards Codification
-Section 50
-Paragraph 3
-Publisher FASB
-URI https://asc.fasb.org//1943274/2147483443/250-10-50-3
Reference 6: http://www.xbrl.org/2003/role/disclosureRef
-Topic 250
-SubTopic 10
-Name Accounting Standards Codification
-Section 50
-Paragraph 1
-Subparagraph (b)(2)
-Publisher FASB
-URI https://asc.fasb.org//1943274/2147483443/250-10-50-1
Reference 7: http://www.xbrl.org/2003/role/disclosureRef
-Topic 815
-SubTopic 40
-Name Accounting Standards Codification
-Section 65
-Paragraph 1
-Subparagraph (f)
-Publisher FASB
-URI https://asc.fasb.org//1943274/2147480175/815-40-65-1
Reference 8: http://www.xbrl.org/2003/role/disclosureRef
-Topic 250
-SubTopic 10
-Name Accounting Standards Codification
-Section 50
-Paragraph 8
-Publisher FASB
-URI https://asc.fasb.org//1943274/2147483443/250-10-50-8
Reference 9: http://www.xbrl.org/2003/role/disclosureRef
-Topic 250
-SubTopic 10
-Name Accounting Standards Codification
-Section 50
-Paragraph 9
-Publisher FASB
-URI https://asc.fasb.org//1943274/2147483443/250-10-50-9
Reference 10: http://www.xbrl.org/2003/role/disclosureRef
-Topic 250
-SubTopic 10
-Name Accounting Standards Codification
-Section 50
-Paragraph 11
-Subparagraph (a)
-Publisher FASB
-URI https://asc.fasb.org//1943274/2147483443/250-10-50-11
Reference 11: http://www.xbrl.org/2003/role/disclosureRef
-Topic 250
-SubTopic 10
-Name Accounting Standards Codification
-Section 50
-Paragraph 11
-Subparagraph (b)
-Publisher FASB
-URI https://asc.fasb.org//1943274/2147483443/250-10-50-11
Reference 12: http://www.xbrl.org/2003/role/disclosureRef
-Topic 250
-SubTopic 10
-Name Accounting Standards Codification
-Section 50
-Paragraph 4
-Publisher FASB
-URI https://asc.fasb.org//1943274/2147483443/250-10-50-4
Reference 13: http://www.xbrl.org/2003/role/exampleRef
-Topic 946
-SubTopic 830
-Name Accounting Standards Codification
-Section 55
-Paragraph 10
-Publisher FASB
-URI https://asc.fasb.org//1943274/2147480167/946-830-55-10
Reference 14: http://www.xbrl.org/2003/role/disclosureRef
-Topic 946
-SubTopic 220
-Name Accounting Standards Codification
-Section 45
-Paragraph 7
-Publisher FASB
-URI https://asc.fasb.org//1943274/2147483581/946-220-45-7
Reference 15: http://www.xbrl.org/2003/role/disclosureRef
-Topic 944
-SubTopic 220
-Name Accounting Standards Codification
-Section S99
-Paragraph 1
-Subparagraph (SX 210.7-04(18))
-Publisher FASB
-URI https://asc.fasb.org//1943274/2147483586/944-220-S99-1
Reference 16: http://www.xbrl.org/2003/role/disclosureRef
-Topic 280
-SubTopic 10
-Name Accounting Standards Codification
-Section 50
-Paragraph 22
-Publisher FASB
-URI https://asc.fasb.org//1943274/2147482810/280-10-50-22
Reference 17: http://www.xbrl.org/2003/role/disclosureRef
-Topic 946
-SubTopic 220
-Name Accounting Standards Codification
-Section S99
-Paragraph 1
-Subparagraph (SX 210.6-07(9))
-Publisher FASB
-URI https://asc.fasb.org//1943274/2147483575/946-220-S99-1
Reference 18: http://www.xbrl.org/2003/role/disclosureRef
-Topic 946
-SubTopic 220
-Name Accounting Standards Codification
-Section S99
-Paragraph 3
-Subparagraph (SX 210.6-09(1)(d))
-Publisher FASB
-URI https://asc.fasb.org//1943274/2147483575/946-220-S99-3
Reference 19: http://www.xbrl.org/2003/role/disclosureRef
-Topic 470
-SubTopic 10
-Name Accounting Standards Codification
-Section S99
-Paragraph 1A
-Subparagraph (SX 210.13-01(a)(4)(i))
-Publisher FASB
-URI https://asc.fasb.org//1943274/2147480097/470-10-S99-1A
Reference 20: http://www.xbrl.org/2009/role/commonPracticeRef
-Topic 470
-SubTopic 10
-Name Accounting Standards Codification
-Section S99
-Paragraph 1A
-Subparagraph (SX 210.13-01(a)(4)(ii))
-Publisher FASB
-URI https://asc.fasb.org//1943274/2147480097/470-10-S99-1A
Reference 21: http://www.xbrl.org/2003/role/disclosureRef
-Topic 470
-SubTopic 10
-Name Accounting Standards Codification
-Section S99
-Paragraph 1A
-Subparagraph (SX 210.13-01(a)(4)(iii)(A))
-Publisher FASB
-URI https://asc.fasb.org//1943274/2147480097/470-10-S99-1A
Reference 22: http://www.xbrl.org/2003/role/disclosureRef
-Topic 470
-SubTopic 10
-Name Accounting Standards Codification
-Section S99
-Paragraph 1A
-Subparagraph (SX 210.13-01(a)(4)(iv))
-Publisher FASB
-URI https://asc.fasb.org//1943274/2147480097/470-10-S99-1A
Reference 23: http://www.xbrl.org/2003/role/disclosureRef
-Topic 470
-SubTopic 10
-Name Accounting Standards Codification
-Section S99
-Paragraph 1A
-Subparagraph (SX 210.13-01(a)(5))
-Publisher FASB
-URI https://asc.fasb.org//1943274/2147480097/470-10-S99-1A
Reference 24: http://www.xbrl.org/2003/role/disclosureRef
-Topic 470
-SubTopic 10
-Name Accounting Standards Codification
-Section S99
-Paragraph 1B
-Subparagraph (SX 210.13-02(a)(4)(i))
-Publisher FASB
-URI https://asc.fasb.org//1943274/2147480097/470-10-S99-1B
Reference 25: http://www.xbrl.org/2003/role/disclosureRef
-Topic 470
-SubTopic 10
-Name Accounting Standards Codification
-Section S99
-Paragraph 1B
-Subparagraph (SX 210.13-02(a)(4)(iii)(A))
-Publisher FASB
-URI https://asc.fasb.org//1943274/2147480097/470-10-S99-1B
Reference 26: http://www.xbrl.org/2003/role/disclosureRef
-Topic 470
-SubTopic 10
-Name Accounting Standards Codification
-Section S99
-Paragraph 1B
-Subparagraph (SX 210.13-02(a)(4)(iii)(B))
-Publisher FASB
-URI https://asc.fasb.org//1943274/2147480097/470-10-S99-1B
Reference 27: http://www.xbrl.org/2003/role/disclosureRef
-Topic 470
-SubTopic 10
-Name Accounting Standards Codification
-Section S99
-Paragraph 1B
-Subparagraph (SX 210.13-02(a)(4)(iv))
-Publisher FASB
-URI https://asc.fasb.org//1943274/2147480097/470-10-S99-1B
Reference 28: http://www.xbrl.org/2003/role/disclosureRef
-Topic 470
-SubTopic 10
-Name Accounting Standards Codification
-Section S99
-Paragraph 1B
-Subparagraph (SX 210.13-02(a)(5))
-Publisher FASB
-URI https://asc.fasb.org//1943274/2147480097/470-10-S99-1B
Reference 29: http://www.xbrl.org/2003/role/disclosureRef
-Topic 280
-SubTopic 10
-Name Accounting Standards Codification
-Section 50
-Paragraph 30
-Subparagraph (b)
-Publisher FASB
-URI https://asc.fasb.org//1943274/2147482810/280-10-50-30
Reference 30: http://www.xbrl.org/2003/role/disclosureRef
-Topic 280
-SubTopic 10
-Name Accounting Standards Codification
-Section 50
-Paragraph 32
-Subparagraph (f)
-Publisher FASB
-URI https://asc.fasb.org//1943274/2147482810/280-10-50-32
Reference 31: http://www.xbrl.org/2003/role/disclosureRef
-Topic 260
-SubTopic 10
-Name Accounting Standards Codification
-Section 45
-Paragraph 60B
-Subparagraph (a)
-Publisher FASB
-URI https://asc.fasb.org//1943274/2147482689/260-10-45-60B
Reference 32: http://www.xbrl.org/2003/role/exampleRef
-Topic 280
-SubTopic 10
-Name Accounting Standards Codification
-Section 50
-Paragraph 31
-Publisher FASB
-URI https://asc.fasb.org//1943274/2147482810/280-10-50-31
Reference 33: http://www.xbrl.org/2003/role/disclosureRef
-Topic 280
-SubTopic 10
-Name Accounting Standards Codification
-Section 50
-Paragraph 32
-Subparagraph (c)
-Publisher FASB
-URI https://asc.fasb.org//1943274/2147482810/280-10-50-32
Reference 34: http://www.xbrl.org/2003/role/disclosureRef
-Topic 205
-SubTopic 20
-Name Accounting Standards Codification
-Section 50
-Paragraph 7
-Publisher FASB
-URI https://asc.fasb.org//1943274/2147483499/205-20-50-7
Reference 35: http://fasb.org/us-gaap/role/ref/legacyRef
-Topic 230
-SubTopic 10
-Name Accounting Standards Codification
-Section 45
-Paragraph 28
-Publisher FASB
-URI https://asc.fasb.org//1943274/2147482740/230-10-45-28
Reference 36: http://www.xbrl.org/2003/role/disclosureRef
-Topic 220
-SubTopic 10
-Name Accounting Standards Codification
-Section 45
-Paragraph 1A
-Subparagraph (a)
-Publisher FASB
-URI https://asc.fasb.org//1943274/2147482790/220-10-45-1A
Reference 37: http://www.xbrl.org/2003/role/disclosureRef
-Topic 220
-SubTopic 10
-Name Accounting Standards Codification
-Section 45
-Paragraph 1B
-Subparagraph (a)
-Publisher FASB
-URI https://asc.fasb.org//1943274/2147482790/220-10-45-1B
Reference 38: http://fasb.org/us-gaap/role/ref/legacyRef
-Topic 220
-SubTopic 10
-Name Accounting Standards Codification
-Section S99
-Paragraph 2
-Subparagraph (SX 210.5-03(20))
-Publisher FASB
-URI https://asc.fasb.org//1943274/2147483621/220-10-S99-2
Reference 39: http://fasb.org/us-gaap/role/ref/legacyRef
-Topic 942
-SubTopic 220
-Name Accounting Standards Codification
-Section S99
-Paragraph 1
-Subparagraph (SX 210.9-04(22))
-Publisher FASB
-URI https://asc.fasb.org//1943274/2147483589/942-220-S99-1
| Name: |
us-gaap_NetIncomeLoss |
| Namespace Prefix: |
us-gaap_ |
| Data Type: |
xbrli:monetaryItemType |
| Balance Type: |
credit |
| Period Type: |
duration |
|
| X |
- DefinitionAmount, after deduction of tax, noncontrolling interests, dividends on preferred stock and participating securities; of income (loss) available to common shareholders. Reference 1: http://www.xbrl.org/2003/role/disclosureRef
-Topic 250
-SubTopic 10
-Name Accounting Standards Codification
-Section 50
-Paragraph 3
-Publisher FASB
-URI https://asc.fasb.org//1943274/2147483443/250-10-50-3
Reference 2: http://www.xbrl.org/2003/role/disclosureRef
-Topic 250
-SubTopic 10
-Name Accounting Standards Codification
-Section 50
-Paragraph 11
-Subparagraph (a)
-Publisher FASB
-URI https://asc.fasb.org//1943274/2147483443/250-10-50-11
Reference 3: http://www.xbrl.org/2003/role/disclosureRef
-Topic 250
-SubTopic 10
-Name Accounting Standards Codification
-Section 50
-Paragraph 11
-Subparagraph (b)
-Publisher FASB
-URI https://asc.fasb.org//1943274/2147483443/250-10-50-11
Reference 4: http://www.xbrl.org/2003/role/disclosureRef
-Topic 250
-SubTopic 10
-Name Accounting Standards Codification
-Section 50
-Paragraph 4
-Publisher FASB
-URI https://asc.fasb.org//1943274/2147483443/250-10-50-4
Reference 5: http://www.xbrl.org/2003/role/disclosureRef
-Topic 220
-SubTopic 10
-Name Accounting Standards Codification
-Section S99
-Paragraph 5
-Subparagraph (SAB Topic 6.B)
-Publisher FASB
-URI https://asc.fasb.org//1943274/2147483621/220-10-S99-5
Reference 6: http://www.xbrl.org/2003/role/disclosureRef
-Topic 280
-SubTopic 10
-Name Accounting Standards Codification
-Section 50
-Paragraph 22
-Publisher FASB
-URI https://asc.fasb.org//1943274/2147482810/280-10-50-22
Reference 7: http://www.xbrl.org/2003/role/disclosureRef
-Topic 260
-SubTopic 10
-Name Accounting Standards Codification
-Section 50
-Paragraph 1
-Subparagraph (a)
-Publisher FASB
-URI https://asc.fasb.org//1943274/2147482662/260-10-50-1
Reference 8: http://www.xbrl.org/2003/role/disclosureRef
-Topic 280
-SubTopic 10
-Name Accounting Standards Codification
-Section 50
-Paragraph 30
-Subparagraph (b)
-Publisher FASB
-URI https://asc.fasb.org//1943274/2147482810/280-10-50-30
Reference 9: http://www.xbrl.org/2003/role/disclosureRef
-Topic 280
-SubTopic 10
-Name Accounting Standards Codification
-Section 50
-Paragraph 32
-Subparagraph (f)
-Publisher FASB
-URI https://asc.fasb.org//1943274/2147482810/280-10-50-32
Reference 10: http://www.xbrl.org/2003/role/disclosureRef
-Topic 260
-SubTopic 10
-Name Accounting Standards Codification
-Section 45
-Paragraph 10
-Publisher FASB
-URI https://asc.fasb.org//1943274/2147482689/260-10-45-10
Reference 11: http://www.xbrl.org/2003/role/exampleRef
-Topic 280
-SubTopic 10
-Name Accounting Standards Codification
-Section 50
-Paragraph 31
-Publisher FASB
-URI https://asc.fasb.org//1943274/2147482810/280-10-50-31
Reference 12: http://www.xbrl.org/2003/role/disclosureRef
-Topic 280
-SubTopic 10
-Name Accounting Standards Codification
-Section 50
-Paragraph 32
-Subparagraph (c)
-Publisher FASB
-URI https://asc.fasb.org//1943274/2147482810/280-10-50-32
Reference 13: http://www.xbrl.org/2003/role/disclosureRef
-Topic 260
-SubTopic 10
-Name Accounting Standards Codification
-Section 45
-Paragraph 11
-Publisher FASB
-URI https://asc.fasb.org//1943274/2147482689/260-10-45-11
Reference 14: http://www.xbrl.org/2003/role/disclosureRef
-Topic 260
-SubTopic 10
-Name Accounting Standards Codification
-Section 45
-Paragraph 60B
-Subparagraph (c)
-Publisher FASB
-URI https://asc.fasb.org//1943274/2147482689/260-10-45-60B
| Name: |
us-gaap_NetIncomeLossAvailableToCommonStockholdersBasic |
| Namespace Prefix: |
us-gaap_ |
| Data Type: |
xbrli:monetaryItemType |
| Balance Type: |
credit |
| Period Type: |
duration |
|
| X |
- DefinitionAmount, after deduction of tax, noncontrolling interests, dividends on preferred stock and participating securities, and addition from assumption of issuance of common shares for dilutive potential common shares; of income (loss) available to common shareholders. Reference 1: http://www.xbrl.org/2003/role/disclosureRef
-Topic 220
-SubTopic 10
-Name Accounting Standards Codification
-Section S99
-Paragraph 5
-Subparagraph (SAB Topic 6.B)
-Publisher FASB
-URI https://asc.fasb.org//1943274/2147483621/220-10-S99-5
Reference 2: http://www.xbrl.org/2003/role/disclosureRef
-Topic 260
-SubTopic 10
-Name Accounting Standards Codification
-Section 50
-Paragraph 1
-Subparagraph (a)
-Publisher FASB
-URI https://asc.fasb.org//1943274/2147482662/260-10-50-1
Reference 3: http://www.xbrl.org/2003/role/disclosureRef
-Topic 260
-SubTopic 10
-Name Accounting Standards Codification
-Section 45
-Paragraph 16
-Publisher FASB
-URI https://asc.fasb.org//1943274/2147482689/260-10-45-16
Reference 4: http://www.xbrl.org/2003/role/disclosureRef
-Topic 260
-SubTopic 10
-Name Accounting Standards Codification
-Section 45
-Paragraph 40
-Subparagraph (b)(1)
-Publisher FASB
-URI https://asc.fasb.org//1943274/2147482689/260-10-45-40
Reference 5: http://www.xbrl.org/2003/role/disclosureRef
-Topic 260
-SubTopic 10
-Name Accounting Standards Codification
-Section 45
-Paragraph 60B
-Subparagraph (c)
-Publisher FASB
-URI https://asc.fasb.org//1943274/2147482689/260-10-45-60B
Reference 6: http://www.xbrl.org/2003/role/disclosureRef
-Topic 260
-SubTopic 10
-Name Accounting Standards Codification
-Section 45
-Paragraph 40
-Subparagraph (a)
-Publisher FASB
-URI https://asc.fasb.org//1943274/2147482689/260-10-45-40
Reference 7: http://www.xbrl.org/2003/role/disclosureRef
-Topic 260
-SubTopic 10
-Name Accounting Standards Codification
-Section 45
-Paragraph 40
-Subparagraph (b)(2)
-Publisher FASB
-URI https://asc.fasb.org//1943274/2147482689/260-10-45-40
Reference 8: http://www.xbrl.org/2003/role/disclosureRef
-Topic 260
-SubTopic 10
-Name Accounting Standards Codification
-Section 45
-Paragraph 40
-Subparagraph (b)(3)
-Publisher FASB
-URI https://asc.fasb.org//1943274/2147482689/260-10-45-40
| Name: |
us-gaap_NetIncomeLossAvailableToCommonStockholdersDiluted |
| Namespace Prefix: |
us-gaap_ |
| Data Type: |
xbrli:monetaryItemType |
| Balance Type: |
credit |
| Period Type: |
duration |
|
| X |
- DefinitionAmount of earnings (loss) distributed and earnings (loss) allocated to participating securities for the basic earnings (loss) per share or per unit calculation under the two-class method. Reference 1: http://www.xbrl.org/2003/role/disclosureRef
-Topic 260
-SubTopic 10
-Name Accounting Standards Codification
-Section 45
-Paragraph 60B
-Subparagraph (c)
-Publisher FASB
-URI https://asc.fasb.org//1943274/2147482689/260-10-45-60B
Reference 2: http://www.xbrl.org/2003/role/recommendedDisclosureRef
-Topic 260
-SubTopic 10
-Name Accounting Standards Codification
-Section 45
-Paragraph 60
-Publisher FASB
-URI https://asc.fasb.org//1943274/2147482689/260-10-45-60
| Name: |
us-gaap_ParticipatingSecuritiesDistributedAndUndistributedEarningsLossBasic |
| Namespace Prefix: |
us-gaap_ |
| Data Type: |
xbrli:monetaryItemType |
| Balance Type: |
debit |
| Period Type: |
duration |
|
| X |
- DefinitionThe average number of shares or units issued and outstanding that are used in calculating diluted EPS or earnings per unit (EPU), determined based on the timing of issuance of shares or units in the period. Reference 1: http://www.xbrl.org/2003/role/disclosureRef
-Topic 260
-SubTopic 10
-Name Accounting Standards Codification
-Section 50
-Paragraph 1
-Subparagraph (a)
-Publisher FASB
-URI https://asc.fasb.org//1943274/2147482662/260-10-50-1
Reference 2: http://www.xbrl.org/2003/role/disclosureRef
-Topic 260
-SubTopic 10
-Name Accounting Standards Codification
-Section 45
-Paragraph 16
-Publisher FASB
-URI https://asc.fasb.org//1943274/2147482689/260-10-45-16
| Name: |
us-gaap_WeightedAverageNumberOfDilutedSharesOutstanding |
| Namespace Prefix: |
us-gaap_ |
| Data Type: |
xbrli:sharesItemType |
| Balance Type: |
na |
| Period Type: |
duration |
|
| X |
- DefinitionNumber of [basic] shares or units, after adjustment for contingently issuable shares or units and other shares or units not deemed outstanding, determined by relating the portion of time within a reporting period that common shares or units have been outstanding to the total time in that period. Reference 1: http://www.xbrl.org/2003/role/disclosureRef
-Topic 260
-SubTopic 10
-Name Accounting Standards Codification
-Section 50
-Paragraph 1
-Subparagraph (a)
-Publisher FASB
-URI https://asc.fasb.org//1943274/2147482662/260-10-50-1
Reference 2: http://www.xbrl.org/2003/role/disclosureRef
-Topic 260
-SubTopic 10
-Name Accounting Standards Codification
-Section 45
-Paragraph 10
-Publisher FASB
-URI https://asc.fasb.org//1943274/2147482689/260-10-45-10
| Name: |
us-gaap_WeightedAverageNumberOfSharesOutstandingBasic |
| Namespace Prefix: |
us-gaap_ |
| Data Type: |
xbrli:sharesItemType |
| Balance Type: |
na |
| Period Type: |
duration |
|
| X |
- Details
| Name: |
us-gaap_AntidilutiveSecuritiesExcludedFromComputationOfEarningsPerShareByAntidilutiveSecuritiesAxis=nysedei_OperatingPartnershipUnitsMember |
| Namespace Prefix: |
|
| Data Type: |
na |
| Balance Type: |
|
| Period Type: |
|
|
| X |
- Details
| Name: |
us-gaap_AntidilutiveSecuritiesExcludedFromComputationOfEarningsPerShareByAntidilutiveSecuritiesAxis=nysedei_VestedLongTermIncentivePlanLTIPUnitsMember |
| Namespace Prefix: |
|
| Data Type: |
na |
| Balance Type: |
|
| Period Type: |
|
|
v3.23.3
Fair Value of Financial Instruments - Estimated Fair Value of Secured Notes Payable (Details) - USD ($)
$ in Thousands |
Sep. 30, 2023 |
Dec. 31, 2022 |
| Fair Value, Assets and Liabilities Measured on Recurring and Nonrecurring Basis [Line Items] |
|
|
| Ground lease liability |
$ 10,839
|
$ 10,848
|
| Fair value | Level 2 |
|
|
| Fair Value, Assets and Liabilities Measured on Recurring and Nonrecurring Basis [Line Items] |
|
|
| Secured notes payable |
5,476,975
|
5,115,548
|
| Ground lease liability |
4,226
|
4,466
|
| Carrying value | Level 2 |
|
|
| Fair Value, Assets and Liabilities Measured on Recurring and Nonrecurring Basis [Line Items] |
|
|
| Secured notes payable |
5,573,462
|
5,224,449
|
| Ground lease liability |
$ 10,839
|
$ 10,848
|
| X |
- DefinitionLine items represent financial concepts included in a table. These concepts are used to disclose reportable information associated with domain members defined in one or many axes to the table. Reference 1: http://www.xbrl.org/2003/role/disclosureRef
-Topic 820
-SubTopic 10
-Name Accounting Standards Codification
-Section 50
-Paragraph 2
-Subparagraph (a)
-Publisher FASB
-URI https://asc.fasb.org//1943274/2147482106/820-10-50-2
Reference 2: http://www.xbrl.org/2003/role/disclosureRef
-Topic 820
-SubTopic 10
-Name Accounting Standards Codification
-Section 50
-Paragraph 2
-Subparagraph (b)
-Publisher FASB
-URI https://asc.fasb.org//1943274/2147482106/820-10-50-2
Reference 3: http://www.xbrl.org/2003/role/disclosureRef
-Topic 820
-SubTopic 10
-Name Accounting Standards Codification
-Section 50
-Paragraph 3
-Publisher FASB
-URI https://asc.fasb.org//1943274/2147482106/820-10-50-3
| Name: |
us-gaap_FairValueAssetsAndLiabilitiesMeasuredOnRecurringAndNonrecurringBasisLineItems |
| Namespace Prefix: |
us-gaap_ |
| Data Type: |
xbrli:stringItemType |
| Balance Type: |
na |
| Period Type: |
duration |
|
| X |
- DefinitionThe fair value amount of long-term debt whether such amount is presented as a separate caption or as a parenthetical disclosure. Additionally, this element may be used in connection with the fair value disclosures required in the footnote disclosures to the financial statements. The element may be used in both the balance sheet and disclosure in the same submission.
| Name: |
us-gaap_LongTermDebtFairValue |
| Namespace Prefix: |
us-gaap_ |
| Data Type: |
xbrli:monetaryItemType |
| Balance Type: |
credit |
| Period Type: |
instant |
|
| X |
- DefinitionPresent value of lessee's discounted obligation for lease payments from operating lease. Reference 1: http://www.xbrl.org/2003/role/disclosureRef
-Topic 842
-SubTopic 20
-Name Accounting Standards Codification
-Section 45
-Paragraph 1
-Subparagraph (b)
-Publisher FASB
-URI https://asc.fasb.org//1943274/2147479041/842-20-45-1
| Name: |
us-gaap_OperatingLeaseLiability |
| Namespace Prefix: |
us-gaap_ |
| Data Type: |
xbrli:monetaryItemType |
| Balance Type: |
credit |
| Period Type: |
instant |
|
| X |
- Details
| Name: |
us-gaap_FairValueByMeasurementBasisAxis=us-gaap_EstimateOfFairValueFairValueDisclosureMember |
| Namespace Prefix: |
|
| Data Type: |
na |
| Balance Type: |
|
| Period Type: |
|
|
| X |
- Details
| Name: |
us-gaap_FairValueByMeasurementBasisAxis=us-gaap_CarryingReportedAmountFairValueDisclosureMember |
| Namespace Prefix: |
|
| Data Type: |
na |
| Balance Type: |
|
| Period Type: |
|
|
v3.23.3
Fair Value of Financial Instruments - Financial Instruments Measured at Fair Value (Details) - USD ($)
$ in Thousands |
Sep. 30, 2023 |
Dec. 31, 2022 |
| Derivative Assets: |
|
|
| Fair value - derivatives |
$ 248,232
|
$ 270,234
|
| Derivative Liabilities: |
|
|
| Fair value - derivatives |
$ 0
|
1,790
|
| Percentage of notional amount disclosed |
100.00%
|
|
| Unconsolidated Funds |
|
|
| Derivative Liabilities: |
|
|
| Percentage of notional amount disclosed |
100.00%
|
|
| Level 2 |
|
|
| Derivative Assets: |
|
|
| Fair value - derivatives |
$ 248,232
|
270,234
|
| Derivative Liabilities: |
|
|
| Fair value - derivatives |
0
|
1,790
|
| Level 2 | Unconsolidated Funds |
|
|
| Derivative Assets: |
|
|
| Fair value - derivatives |
12,356
|
12,426
|
| Derivative Liabilities: |
|
|
| Fair value - derivatives |
$ 0
|
$ 0
|
| X |
- DefinitionPercentage Of Notional Amount Of Derivative Disclosed
| Name: |
nysedei_PercentageOfNotionalAmountOfDerivativeDisclosed |
| Namespace Prefix: |
nysedei_ |
| Data Type: |
dtr-types1:percentItemType |
| Balance Type: |
na |
| Period Type: |
instant |
|
| X |
- References
+ Details
| Name: |
us-gaap_AssetsFairValueDisclosureAbstract |
| Namespace Prefix: |
us-gaap_ |
| Data Type: |
xbrli:stringItemType |
| Balance Type: |
na |
| Period Type: |
duration |
|
| X |
- DefinitionFair value, after the effects of master netting arrangements, of a financial asset or other contract with one or more underlyings, notional amount or payment provision or both, and the contract can be net settled by means outside the contract or delivery of an asset. Includes assets not subject to a master netting arrangement and not elected to be offset. Reference 1: http://www.xbrl.org/2003/role/disclosureRef
-Topic 946
-SubTopic 210
-Name Accounting Standards Codification
-Section 50
-Paragraph 12
-Publisher FASB
-URI https://asc.fasb.org//1943274/2147480524/946-210-50-12
Reference 2: http://www.xbrl.org/2003/role/disclosureRef
-Topic 946
-SubTopic 210
-Name Accounting Standards Codification
-Section 50
-Paragraph 6
-Subparagraph (e)
-Publisher FASB
-URI https://asc.fasb.org//1943274/2147480524/946-210-50-6
Reference 3: http://www.xbrl.org/2003/role/exampleRef
-Topic 946
-SubTopic 210
-Name Accounting Standards Codification
-Section 55
-Paragraph 1
-Publisher FASB
-URI https://asc.fasb.org//1943274/2147480493/946-210-55-1
Reference 4: http://www.xbrl.org/2003/role/disclosureRef
-Topic 946
-SubTopic 210
-Name Accounting Standards Codification
-Section 50
-Paragraph 6
-Subparagraph (a)(1)
-Publisher FASB
-URI https://asc.fasb.org//1943274/2147480524/946-210-50-6
Reference 5: http://www.xbrl.org/2003/role/disclosureRef
-Topic 946
-SubTopic 210
-Name Accounting Standards Codification
-Section 50
-Paragraph 6
-Subparagraph (a)(2)
-Publisher FASB
-URI https://asc.fasb.org//1943274/2147480524/946-210-50-6
Reference 6: http://www.xbrl.org/2003/role/disclosureRef
-Topic 946
-SubTopic 210
-Name Accounting Standards Codification
-Section 50
-Paragraph 6
-Subparagraph (a)(4)
-Publisher FASB
-URI https://asc.fasb.org//1943274/2147480524/946-210-50-6
Reference 7: http://www.xbrl.org/2003/role/disclosureRef
-Topic 946
-SubTopic 210
-Name Accounting Standards Codification
-Section 50
-Paragraph 1
-Subparagraph (a)(1)
-Publisher FASB
-URI https://asc.fasb.org//1943274/2147480524/946-210-50-1
Reference 8: http://www.xbrl.org/2003/role/disclosureRef
-Topic 946
-SubTopic 210
-Name Accounting Standards Codification
-Section 50
-Paragraph 1
-Subparagraph (b)(1)
-Publisher FASB
-URI https://asc.fasb.org//1943274/2147480524/946-210-50-1
Reference 9: http://www.xbrl.org/2003/role/disclosureRef
-Topic 946
-SubTopic 210
-Name Accounting Standards Codification
-Section 50
-Paragraph 1
-Subparagraph (b)(2)
-Publisher FASB
-URI https://asc.fasb.org//1943274/2147480524/946-210-50-1
Reference 10: http://www.xbrl.org/2003/role/disclosureRef
-Topic 946
-SubTopic 210
-Name Accounting Standards Codification
-Section 50
-Paragraph 1
-Subparagraph (c)(2)
-Publisher FASB
-URI https://asc.fasb.org//1943274/2147480524/946-210-50-1
Reference 11: http://www.xbrl.org/2003/role/disclosureRef
-Topic 946
-SubTopic 210
-Name Accounting Standards Codification
-Section 50
-Paragraph 6
-Subparagraph (f)
-Publisher FASB
-URI https://asc.fasb.org//1943274/2147480524/946-210-50-6
Reference 12: http://www.xbrl.org/2009/role/commonPracticeRef
-Topic 946
-SubTopic 210
-Name Accounting Standards Codification
-Section 50
-Paragraph 6
-Subparagraph (a)(3)
-Publisher FASB
-URI https://asc.fasb.org//1943274/2147480524/946-210-50-6
Reference 13: http://www.xbrl.org/2003/role/disclosureRef
-Topic 946
-SubTopic 210
-Name Accounting Standards Codification
-Section S99
-Paragraph 1
-Subparagraph (SX 210.6-04(3)(c))
-Publisher FASB
-URI https://asc.fasb.org//1943274/2147479617/946-210-S99-1
Reference 14: http://www.xbrl.org/2003/role/disclosureRef
-Topic 946
-SubTopic 320
-Name Accounting Standards Codification
-Section S99
-Paragraph 5C
-Subparagraph (SX 210.12-13C(Column H)(Footnote 7))
-Publisher FASB
-URI https://asc.fasb.org//1943274/2147480032/946-320-S99-5C
Reference 15: http://www.xbrl.org/2003/role/disclosureRef
-Topic 946
-SubTopic 210
-Name Accounting Standards Codification
-Section S99
-Paragraph 1
-Subparagraph (SX 210.6-04(3)(b))
-Publisher FASB
-URI https://asc.fasb.org//1943274/2147479617/946-210-S99-1
Reference 16: http://www.xbrl.org/2003/role/disclosureRef
-Topic 946
-SubTopic 320
-Name Accounting Standards Codification
-Section S99
-Paragraph 5
-Subparagraph (SX 210.12-13(Column A)(Footnote 3))
-Publisher FASB
-URI https://asc.fasb.org//1943274/2147480032/946-320-S99-5
Reference 17: http://www.xbrl.org/2003/role/disclosureRef
-Topic 946
-SubTopic 320
-Name Accounting Standards Codification
-Section S99
-Paragraph 5C
-Subparagraph (SX 210.12-13C(Column H))
-Publisher FASB
-URI https://asc.fasb.org//1943274/2147480032/946-320-S99-5C
Reference 18: http://www.xbrl.org/2003/role/disclosureRef
-Topic 946
-SubTopic 320
-Name Accounting Standards Codification
-Section S99
-Paragraph 5A
-Subparagraph (SX 210.12-13A(Column E))
-Publisher FASB
-URI https://asc.fasb.org//1943274/2147480032/946-320-S99-5A
Reference 19: http://www.xbrl.org/2003/role/disclosureRef
-Topic 946
-SubTopic 320
-Name Accounting Standards Codification
-Section S99
-Paragraph 5B
-Subparagraph (SX 210.12-13B(Column E))
-Publisher FASB
-URI https://asc.fasb.org//1943274/2147480032/946-320-S99-5B
Reference 20: http://www.xbrl.org/2003/role/disclosureRef
-Topic 946
-SubTopic 320
-Name Accounting Standards Codification
-Section S99
-Paragraph 5B
-Subparagraph (SX 210.12-13B(Column E)(Footnote 4))
-Publisher FASB
-URI https://asc.fasb.org//1943274/2147480032/946-320-S99-5B
Reference 21: http://www.xbrl.org/2003/role/disclosureRef
-Topic 210
-SubTopic 20
-Name Accounting Standards Codification
-Section 50
-Paragraph 3
-Subparagraph (c)
-Publisher FASB
-URI https://asc.fasb.org//1943274/2147483466/210-20-50-3
Reference 22: http://www.xbrl.org/2003/role/exampleRef
-Topic 210
-SubTopic 20
-Name Accounting Standards Codification
-Section 55
-Paragraph 22
-Publisher FASB
-URI https://asc.fasb.org//1943274/2147483444/210-20-55-22
Reference 23: http://www.xbrl.org/2003/role/disclosureRef
-Topic 210
-SubTopic 20
-Name Accounting Standards Codification
-Section 55
-Paragraph 10
-Publisher FASB
-URI https://asc.fasb.org//1943274/2147483444/210-20-55-10
Reference 24: http://www.xbrl.org/2003/role/disclosureRef
-Topic 825
-SubTopic 10
-Name Accounting Standards Codification
-Section 50
-Paragraph 10
-Publisher FASB
-URI https://asc.fasb.org//1943274/2147482907/825-10-50-10
| Name: |
us-gaap_DerivativeAssets |
| Namespace Prefix: |
us-gaap_ |
| Data Type: |
xbrli:monetaryItemType |
| Balance Type: |
debit |
| Period Type: |
instant |
|
| X |
- DefinitionFair value, after the effects of master netting arrangements, of a financial liability or contract with one or more underlyings, notional amount or payment provision or both, and the contract can be net settled by means outside the contract or delivery of an asset. Includes liabilities not subject to a master netting arrangement and not elected to be offset. Reference 1: http://www.xbrl.org/2003/role/disclosureRef
-Topic 946
-SubTopic 210
-Name Accounting Standards Codification
-Section 50
-Paragraph 6
-Subparagraph (e)
-Publisher FASB
-URI https://asc.fasb.org//1943274/2147480524/946-210-50-6
Reference 2: http://www.xbrl.org/2003/role/disclosureRef
-Topic 946
-SubTopic 210
-Name Accounting Standards Codification
-Section 50
-Paragraph 6
-Subparagraph (a)(1)
-Publisher FASB
-URI https://asc.fasb.org//1943274/2147480524/946-210-50-6
Reference 3: http://www.xbrl.org/2003/role/disclosureRef
-Topic 946
-SubTopic 210
-Name Accounting Standards Codification
-Section 50
-Paragraph 6
-Subparagraph (a)(2)
-Publisher FASB
-URI https://asc.fasb.org//1943274/2147480524/946-210-50-6
Reference 4: http://www.xbrl.org/2003/role/disclosureRef
-Topic 946
-SubTopic 210
-Name Accounting Standards Codification
-Section 50
-Paragraph 6
-Subparagraph (a)(4)
-Publisher FASB
-URI https://asc.fasb.org//1943274/2147480524/946-210-50-6
Reference 5: http://www.xbrl.org/2003/role/disclosureRef
-Topic 946
-SubTopic 210
-Name Accounting Standards Codification
-Section 50
-Paragraph 1
-Subparagraph (a)(1)
-Publisher FASB
-URI https://asc.fasb.org//1943274/2147480524/946-210-50-1
Reference 6: http://www.xbrl.org/2003/role/disclosureRef
-Topic 946
-SubTopic 210
-Name Accounting Standards Codification
-Section 50
-Paragraph 1
-Subparagraph (b)(1)
-Publisher FASB
-URI https://asc.fasb.org//1943274/2147480524/946-210-50-1
Reference 7: http://www.xbrl.org/2003/role/disclosureRef
-Topic 946
-SubTopic 210
-Name Accounting Standards Codification
-Section 50
-Paragraph 1
-Subparagraph (b)(2)
-Publisher FASB
-URI https://asc.fasb.org//1943274/2147480524/946-210-50-1
Reference 8: http://www.xbrl.org/2003/role/disclosureRef
-Topic 946
-SubTopic 210
-Name Accounting Standards Codification
-Section 50
-Paragraph 1
-Subparagraph (c)(2)
-Publisher FASB
-URI https://asc.fasb.org//1943274/2147480524/946-210-50-1
Reference 9: http://www.xbrl.org/2003/role/disclosureRef
-Topic 946
-SubTopic 210
-Name Accounting Standards Codification
-Section 50
-Paragraph 6
-Subparagraph (f)
-Publisher FASB
-URI https://asc.fasb.org//1943274/2147480524/946-210-50-6
Reference 10: http://www.xbrl.org/2009/role/commonPracticeRef
-Topic 946
-SubTopic 210
-Name Accounting Standards Codification
-Section 50
-Paragraph 6
-Subparagraph (a)(3)
-Publisher FASB
-URI https://asc.fasb.org//1943274/2147480524/946-210-50-6
Reference 11: http://www.xbrl.org/2003/role/disclosureRef
-Topic 946
-SubTopic 210
-Name Accounting Standards Codification
-Section S99
-Paragraph 1
-Subparagraph (SX 210.6-04(9)(e))
-Publisher FASB
-URI https://asc.fasb.org//1943274/2147479617/946-210-S99-1
Reference 12: http://www.xbrl.org/2003/role/disclosureRef
-Topic 946
-SubTopic 320
-Name Accounting Standards Codification
-Section S99
-Paragraph 5C
-Subparagraph (SX 210.12-13C(Column H)(Footnote 7))
-Publisher FASB
-URI https://asc.fasb.org//1943274/2147480032/946-320-S99-5C
Reference 13: http://www.xbrl.org/2003/role/disclosureRef
-Topic 946
-SubTopic 210
-Name Accounting Standards Codification
-Section S99
-Paragraph 1
-Subparagraph (SX 210.6-04(9)(b))
-Publisher FASB
-URI https://asc.fasb.org//1943274/2147479617/946-210-S99-1
Reference 14: http://www.xbrl.org/2003/role/disclosureRef
-Topic 946
-SubTopic 210
-Name Accounting Standards Codification
-Section S99
-Paragraph 1
-Subparagraph (SX 210.6-04(9)(d))
-Publisher FASB
-URI https://asc.fasb.org//1943274/2147479617/946-210-S99-1
Reference 15: http://www.xbrl.org/2003/role/disclosureRef
-Topic 946
-SubTopic 320
-Name Accounting Standards Codification
-Section S99
-Paragraph 5
-Subparagraph (SX 210.12-13(Column G)(Footnote 8))
-Publisher FASB
-URI https://asc.fasb.org//1943274/2147480032/946-320-S99-5
Reference 16: http://www.xbrl.org/2003/role/disclosureRef
-Topic 946
-SubTopic 320
-Name Accounting Standards Codification
-Section S99
-Paragraph 5C
-Subparagraph (SX 210.12-13C(Column H))
-Publisher FASB
-URI https://asc.fasb.org//1943274/2147480032/946-320-S99-5C
Reference 17: http://www.xbrl.org/2003/role/disclosureRef
-Topic 946
-SubTopic 320
-Name Accounting Standards Codification
-Section S99
-Paragraph 5
-Subparagraph (SX 210.12-13(Column G))
-Publisher FASB
-URI https://asc.fasb.org//1943274/2147480032/946-320-S99-5
Reference 18: http://www.xbrl.org/2003/role/disclosureRef
-Topic 946
-SubTopic 320
-Name Accounting Standards Codification
-Section S99
-Paragraph 5A
-Subparagraph (SX 210.12-13A(Column E))
-Publisher FASB
-URI https://asc.fasb.org//1943274/2147480032/946-320-S99-5A
Reference 19: http://www.xbrl.org/2003/role/disclosureRef
-Topic 946
-SubTopic 320
-Name Accounting Standards Codification
-Section S99
-Paragraph 5B
-Subparagraph (SX 210.12-13B(Column E))
-Publisher FASB
-URI https://asc.fasb.org//1943274/2147480032/946-320-S99-5B
Reference 20: http://www.xbrl.org/2003/role/disclosureRef
-Topic 946
-SubTopic 320
-Name Accounting Standards Codification
-Section S99
-Paragraph 5B
-Subparagraph (SX 210.12-13B(Column E)(Footnote 4))
-Publisher FASB
-URI https://asc.fasb.org//1943274/2147480032/946-320-S99-5B
Reference 21: http://www.xbrl.org/2003/role/disclosureRef
-Topic 210
-SubTopic 20
-Name Accounting Standards Codification
-Section 50
-Paragraph 3
-Subparagraph (c)
-Publisher FASB
-URI https://asc.fasb.org//1943274/2147483466/210-20-50-3
Reference 22: http://www.xbrl.org/2003/role/exampleRef
-Topic 210
-SubTopic 20
-Name Accounting Standards Codification
-Section 55
-Paragraph 22
-Publisher FASB
-URI https://asc.fasb.org//1943274/2147483444/210-20-55-22
Reference 23: http://www.xbrl.org/2003/role/disclosureRef
-Topic 210
-SubTopic 20
-Name Accounting Standards Codification
-Section 55
-Paragraph 10
-Publisher FASB
-URI https://asc.fasb.org//1943274/2147483444/210-20-55-10
Reference 24: http://www.xbrl.org/2003/role/disclosureRef
-Topic 825
-SubTopic 10
-Name Accounting Standards Codification
-Section 50
-Paragraph 10
-Publisher FASB
-URI https://asc.fasb.org//1943274/2147482907/825-10-50-10
| Name: |
us-gaap_DerivativeLiabilities |
| Namespace Prefix: |
us-gaap_ |
| Data Type: |
xbrli:monetaryItemType |
| Balance Type: |
credit |
| Period Type: |
instant |
|
| X |
- References
+ Details
| Name: |
us-gaap_LiabilitiesFairValueDisclosureAbstract |
| Namespace Prefix: |
us-gaap_ |
| Data Type: |
xbrli:stringItemType |
| Balance Type: |
na |
| Period Type: |
duration |
|
| X |
- Details
| Name: |
us-gaap_EquityMethodInvestmentNonconsolidatedInvesteeAxis=us-gaap_EquityMethodInvestmentNonconsolidatedInvesteeOrGroupOfInvesteesMember |
| Namespace Prefix: |
|
| Data Type: |
na |
| Balance Type: |
|
| Period Type: |
|
|
v3.23.3
| X |
- DefinitionNumber of segments reported by the entity. A reportable segment is a component of an entity for which there is an accounting requirement to report separate financial information on that component in the entity's financial statements. Reference 1: http://www.xbrl.org/2009/role/commonPracticeRef
-Topic 280
-SubTopic 10
-Name Accounting Standards Codification
-Section 50
-Paragraph 18
-Publisher FASB
-URI https://asc.fasb.org//1943274/2147482810/280-10-50-18
| Name: |
us-gaap_NumberOfReportableSegments |
| Namespace Prefix: |
us-gaap_ |
| Data Type: |
xbrli:integerItemType |
| Balance Type: |
na |
| Period Type: |
duration |
|
| X |
- References
+ Details
| Name: |
us-gaap_SegmentReportingAbstract |
| Namespace Prefix: |
us-gaap_ |
| Data Type: |
xbrli:stringItemType |
| Balance Type: |
na |
| Period Type: |
duration |
|
v3.23.3
Segment Reporting - Operating Activity Within Reportable Segments (Details) - USD ($)
$ in Thousands |
3 Months Ended |
9 Months Ended |
Sep. 30, 2023 |
Sep. 30, 2022 |
Sep. 30, 2023 |
Sep. 30, 2022 |
| Segment Reporting Information [Line Items] |
|
|
|
|
| Total revenues |
$ 255,409
|
$ 253,663
|
$ 761,209
|
$ 739,515
|
| Total profit from all segments |
163,522
|
165,349
|
490,478
|
491,780
|
| Office Segment |
|
|
|
|
| Segment Reporting Information [Line Items] |
|
|
|
|
| Total revenues |
208,823
|
207,927
|
617,614
|
616,744
|
| Operating expenses |
(74,631)
|
(74,653)
|
(220,261)
|
(212,006)
|
| Multifamily Segment |
|
|
|
|
| Segment Reporting Information [Line Items] |
|
|
|
|
| Total revenues |
46,586
|
45,736
|
143,595
|
122,771
|
| Operating expenses |
(17,256)
|
(13,661)
|
(50,470)
|
(35,729)
|
| Reportable Segments |
|
|
|
|
| Segment Reporting Information [Line Items] |
|
|
|
|
| Total profit from all segments |
163,522
|
165,349
|
490,478
|
491,780
|
| Reportable Segments | Office Segment |
|
|
|
|
| Segment Reporting Information [Line Items] |
|
|
|
|
| Total revenues |
208,823
|
207,927
|
617,614
|
616,744
|
| Operating expenses |
(74,631)
|
(74,653)
|
(220,261)
|
(212,006)
|
| Total profit from all segments |
134,192
|
133,274
|
397,353
|
404,738
|
| Reportable Segments | Multifamily Segment |
|
|
|
|
| Segment Reporting Information [Line Items] |
|
|
|
|
| Total revenues |
46,586
|
45,736
|
143,595
|
122,771
|
| Operating expenses |
(17,256)
|
(13,661)
|
(50,470)
|
(35,729)
|
| Total profit from all segments |
$ 29,330
|
$ 32,075
|
$ 93,125
|
$ 87,042
|
| X |
- DefinitionThe aggregate cost of goods produced and sold and services rendered during the reporting period. Reference 1: http://www.xbrl.org/2003/role/disclosureRef
-Topic 235
-SubTopic 10
-Name Accounting Standards Codification
-Section S99
-Paragraph 1
-Subparagraph (SX 210.4-08(g)(1)(ii))
-Publisher FASB
-URI https://asc.fasb.org//1943274/2147480678/235-10-S99-1
Reference 2: http://www.xbrl.org/2003/role/disclosureRef
-Topic 323
-SubTopic 10
-Name Accounting Standards Codification
-Section 50
-Paragraph 3
-Subparagraph (c)
-Publisher FASB
-URI https://asc.fasb.org//1943274/2147481687/323-10-50-3
Reference 3: http://www.xbrl.org/2003/role/disclosureRef
-Topic 825
-SubTopic 10
-Name Accounting Standards Codification
-Section 50
-Paragraph 28
-Subparagraph (f)
-Publisher FASB
-URI https://asc.fasb.org//1943274/2147482907/825-10-50-28
Reference 4: http://www.xbrl.org/2003/role/disclosureRef
-Topic 470
-SubTopic 10
-Name Accounting Standards Codification
-Section S99
-Paragraph 1A
-Subparagraph (SX 210.13-01(a)(4)(i))
-Publisher FASB
-URI https://asc.fasb.org//1943274/2147480097/470-10-S99-1A
Reference 5: http://www.xbrl.org/2009/role/commonPracticeRef
-Topic 470
-SubTopic 10
-Name Accounting Standards Codification
-Section S99
-Paragraph 1A
-Subparagraph (SX 210.13-01(a)(4)(ii))
-Publisher FASB
-URI https://asc.fasb.org//1943274/2147480097/470-10-S99-1A
Reference 6: http://www.xbrl.org/2003/role/disclosureRef
-Topic 470
-SubTopic 10
-Name Accounting Standards Codification
-Section S99
-Paragraph 1A
-Subparagraph (SX 210.13-01(a)(4)(iii)(A))
-Publisher FASB
-URI https://asc.fasb.org//1943274/2147480097/470-10-S99-1A
Reference 7: http://www.xbrl.org/2003/role/disclosureRef
-Topic 470
-SubTopic 10
-Name Accounting Standards Codification
-Section S99
-Paragraph 1A
-Subparagraph (SX 210.13-01(a)(4)(iv))
-Publisher FASB
-URI https://asc.fasb.org//1943274/2147480097/470-10-S99-1A
Reference 8: http://www.xbrl.org/2003/role/disclosureRef
-Topic 470
-SubTopic 10
-Name Accounting Standards Codification
-Section S99
-Paragraph 1A
-Subparagraph (SX 210.13-01(a)(5))
-Publisher FASB
-URI https://asc.fasb.org//1943274/2147480097/470-10-S99-1A
Reference 9: http://www.xbrl.org/2003/role/disclosureRef
-Topic 470
-SubTopic 10
-Name Accounting Standards Codification
-Section S99
-Paragraph 1B
-Subparagraph (SX 210.13-02(a)(4)(i))
-Publisher FASB
-URI https://asc.fasb.org//1943274/2147480097/470-10-S99-1B
Reference 10: http://www.xbrl.org/2003/role/disclosureRef
-Topic 470
-SubTopic 10
-Name Accounting Standards Codification
-Section S99
-Paragraph 1B
-Subparagraph (SX 210.13-02(a)(4)(iii)(A))
-Publisher FASB
-URI https://asc.fasb.org//1943274/2147480097/470-10-S99-1B
Reference 11: http://www.xbrl.org/2003/role/disclosureRef
-Topic 470
-SubTopic 10
-Name Accounting Standards Codification
-Section S99
-Paragraph 1B
-Subparagraph (SX 210.13-02(a)(4)(iii)(B))
-Publisher FASB
-URI https://asc.fasb.org//1943274/2147480097/470-10-S99-1B
Reference 12: http://www.xbrl.org/2003/role/disclosureRef
-Topic 470
-SubTopic 10
-Name Accounting Standards Codification
-Section S99
-Paragraph 1B
-Subparagraph (SX 210.13-02(a)(4)(iv))
-Publisher FASB
-URI https://asc.fasb.org//1943274/2147480097/470-10-S99-1B
Reference 13: http://www.xbrl.org/2003/role/disclosureRef
-Topic 470
-SubTopic 10
-Name Accounting Standards Codification
-Section S99
-Paragraph 1B
-Subparagraph (SX 210.13-02(a)(5))
-Publisher FASB
-URI https://asc.fasb.org//1943274/2147480097/470-10-S99-1B
Reference 14: http://fasb.org/us-gaap/role/ref/legacyRef
-Topic 220
-SubTopic 10
-Name Accounting Standards Codification
-Section S99
-Paragraph 2
-Subparagraph (SX 210.5-03.2)
-Publisher FASB
-URI https://asc.fasb.org//1943274/2147483621/220-10-S99-2
| Name: |
us-gaap_CostOfRevenue |
| Namespace Prefix: |
us-gaap_ |
| Data Type: |
xbrli:monetaryItemType |
| Balance Type: |
debit |
| Period Type: |
duration |
|
| X |
- DefinitionAggregate revenue less cost of goods and services sold or operating expenses directly attributable to the revenue generation activity. Reference 1: http://www.xbrl.org/2003/role/disclosureRef
-Topic 235
-SubTopic 10
-Name Accounting Standards Codification
-Section S99
-Paragraph 1
-Subparagraph (SX 210.4-08(g)(1)(ii))
-Publisher FASB
-URI https://asc.fasb.org//1943274/2147480678/235-10-S99-1
Reference 2: http://www.xbrl.org/2003/role/disclosureRef
-Topic 323
-SubTopic 10
-Name Accounting Standards Codification
-Section 50
-Paragraph 3
-Subparagraph (c)
-Publisher FASB
-URI https://asc.fasb.org//1943274/2147481687/323-10-50-3
Reference 3: http://www.xbrl.org/2003/role/disclosureRef
-Topic 825
-SubTopic 10
-Name Accounting Standards Codification
-Section 50
-Paragraph 28
-Subparagraph (f)
-Publisher FASB
-URI https://asc.fasb.org//1943274/2147482907/825-10-50-28
Reference 4: http://www.xbrl.org/2003/role/disclosureRef
-Topic 280
-SubTopic 10
-Name Accounting Standards Codification
-Section 50
-Paragraph 22
-Publisher FASB
-URI https://asc.fasb.org//1943274/2147482810/280-10-50-22
Reference 5: http://www.xbrl.org/2003/role/disclosureRef
-Topic 470
-SubTopic 10
-Name Accounting Standards Codification
-Section S99
-Paragraph 1A
-Subparagraph (SX 210.13-01(a)(4)(i))
-Publisher FASB
-URI https://asc.fasb.org//1943274/2147480097/470-10-S99-1A
Reference 6: http://www.xbrl.org/2009/role/commonPracticeRef
-Topic 470
-SubTopic 10
-Name Accounting Standards Codification
-Section S99
-Paragraph 1A
-Subparagraph (SX 210.13-01(a)(4)(ii))
-Publisher FASB
-URI https://asc.fasb.org//1943274/2147480097/470-10-S99-1A
Reference 7: http://www.xbrl.org/2003/role/disclosureRef
-Topic 470
-SubTopic 10
-Name Accounting Standards Codification
-Section S99
-Paragraph 1A
-Subparagraph (SX 210.13-01(a)(4)(iii)(A))
-Publisher FASB
-URI https://asc.fasb.org//1943274/2147480097/470-10-S99-1A
Reference 8: http://www.xbrl.org/2003/role/disclosureRef
-Topic 470
-SubTopic 10
-Name Accounting Standards Codification
-Section S99
-Paragraph 1A
-Subparagraph (SX 210.13-01(a)(4)(iv))
-Publisher FASB
-URI https://asc.fasb.org//1943274/2147480097/470-10-S99-1A
Reference 9: http://www.xbrl.org/2003/role/disclosureRef
-Topic 470
-SubTopic 10
-Name Accounting Standards Codification
-Section S99
-Paragraph 1A
-Subparagraph (SX 210.13-01(a)(5))
-Publisher FASB
-URI https://asc.fasb.org//1943274/2147480097/470-10-S99-1A
Reference 10: http://www.xbrl.org/2003/role/disclosureRef
-Topic 470
-SubTopic 10
-Name Accounting Standards Codification
-Section S99
-Paragraph 1B
-Subparagraph (SX 210.13-02(a)(4)(i))
-Publisher FASB
-URI https://asc.fasb.org//1943274/2147480097/470-10-S99-1B
Reference 11: http://www.xbrl.org/2003/role/disclosureRef
-Topic 470
-SubTopic 10
-Name Accounting Standards Codification
-Section S99
-Paragraph 1B
-Subparagraph (SX 210.13-02(a)(4)(iii)(A))
-Publisher FASB
-URI https://asc.fasb.org//1943274/2147480097/470-10-S99-1B
Reference 12: http://www.xbrl.org/2003/role/disclosureRef
-Topic 470
-SubTopic 10
-Name Accounting Standards Codification
-Section S99
-Paragraph 1B
-Subparagraph (SX 210.13-02(a)(4)(iii)(B))
-Publisher FASB
-URI https://asc.fasb.org//1943274/2147480097/470-10-S99-1B
Reference 13: http://www.xbrl.org/2003/role/disclosureRef
-Topic 470
-SubTopic 10
-Name Accounting Standards Codification
-Section S99
-Paragraph 1B
-Subparagraph (SX 210.13-02(a)(4)(iv))
-Publisher FASB
-URI https://asc.fasb.org//1943274/2147480097/470-10-S99-1B
Reference 14: http://www.xbrl.org/2003/role/disclosureRef
-Topic 470
-SubTopic 10
-Name Accounting Standards Codification
-Section S99
-Paragraph 1B
-Subparagraph (SX 210.13-02(a)(5))
-Publisher FASB
-URI https://asc.fasb.org//1943274/2147480097/470-10-S99-1B
Reference 15: http://www.xbrl.org/2003/role/disclosureRef
-Topic 280
-SubTopic 10
-Name Accounting Standards Codification
-Section 50
-Paragraph 30
-Subparagraph (b)
-Publisher FASB
-URI https://asc.fasb.org//1943274/2147482810/280-10-50-30
Reference 16: http://www.xbrl.org/2003/role/disclosureRef
-Topic 280
-SubTopic 10
-Name Accounting Standards Codification
-Section 50
-Paragraph 32
-Subparagraph (f)
-Publisher FASB
-URI https://asc.fasb.org//1943274/2147482810/280-10-50-32
Reference 17: http://www.xbrl.org/2003/role/exampleRef
-Topic 280
-SubTopic 10
-Name Accounting Standards Codification
-Section 50
-Paragraph 31
-Publisher FASB
-URI https://asc.fasb.org//1943274/2147482810/280-10-50-31
Reference 18: http://www.xbrl.org/2003/role/disclosureRef
-Topic 280
-SubTopic 10
-Name Accounting Standards Codification
-Section 50
-Paragraph 32
-Subparagraph (c)
-Publisher FASB
-URI https://asc.fasb.org//1943274/2147482810/280-10-50-32
Reference 19: http://fasb.org/us-gaap/role/ref/legacyRef
-Topic 220
-SubTopic 10
-Name Accounting Standards Codification
-Section S99
-Paragraph 2
-Subparagraph (SX 210.5-03.1,2)
-Publisher FASB
-URI https://asc.fasb.org//1943274/2147483621/220-10-S99-2
| Name: |
us-gaap_GrossProfit |
| Namespace Prefix: |
us-gaap_ |
| Data Type: |
xbrli:monetaryItemType |
| Balance Type: |
credit |
| Period Type: |
duration |
|
| X |
- DefinitionAmount of revenue recognized from goods sold, services rendered, insurance premiums, or other activities that constitute an earning process. Includes, but is not limited to, investment and interest income before deduction of interest expense when recognized as a component of revenue, and sales and trading gain (loss). Reference 1: http://www.xbrl.org/2003/role/disclosureRef
-Topic 235
-SubTopic 10
-Name Accounting Standards Codification
-Section S99
-Paragraph 1
-Subparagraph (SX 210.4-08(g)(1)(ii))
-Publisher FASB
-URI https://asc.fasb.org//1943274/2147480678/235-10-S99-1
Reference 2: http://www.xbrl.org/2003/role/disclosureRef
-Topic 323
-SubTopic 10
-Name Accounting Standards Codification
-Section 50
-Paragraph 3
-Subparagraph (c)
-Publisher FASB
-URI https://asc.fasb.org//1943274/2147481687/323-10-50-3
Reference 3: http://www.xbrl.org/2003/role/disclosureRef
-Topic 825
-SubTopic 10
-Name Accounting Standards Codification
-Section 50
-Paragraph 28
-Subparagraph (f)
-Publisher FASB
-URI https://asc.fasb.org//1943274/2147482907/825-10-50-28
Reference 4: http://www.xbrl.org/2003/role/disclosureRef
-Topic 220
-SubTopic 10
-Name Accounting Standards Codification
-Section S99
-Paragraph 2
-Subparagraph (SX 210.5-03(1))
-Publisher FASB
-URI https://asc.fasb.org//1943274/2147483621/220-10-S99-2
Reference 5: http://www.xbrl.org/2003/role/disclosureRef
-Topic 470
-SubTopic 10
-Name Accounting Standards Codification
-Section S99
-Paragraph 1A
-Subparagraph (SX 210.13-01(a)(4)(i))
-Publisher FASB
-URI https://asc.fasb.org//1943274/2147480097/470-10-S99-1A
Reference 6: http://www.xbrl.org/2009/role/commonPracticeRef
-Topic 470
-SubTopic 10
-Name Accounting Standards Codification
-Section S99
-Paragraph 1A
-Subparagraph (SX 210.13-01(a)(4)(ii))
-Publisher FASB
-URI https://asc.fasb.org//1943274/2147480097/470-10-S99-1A
Reference 7: http://www.xbrl.org/2003/role/disclosureRef
-Topic 470
-SubTopic 10
-Name Accounting Standards Codification
-Section S99
-Paragraph 1A
-Subparagraph (SX 210.13-01(a)(4)(iii)(A))
-Publisher FASB
-URI https://asc.fasb.org//1943274/2147480097/470-10-S99-1A
Reference 8: http://www.xbrl.org/2003/role/disclosureRef
-Topic 470
-SubTopic 10
-Name Accounting Standards Codification
-Section S99
-Paragraph 1A
-Subparagraph (SX 210.13-01(a)(4)(iv))
-Publisher FASB
-URI https://asc.fasb.org//1943274/2147480097/470-10-S99-1A
Reference 9: http://www.xbrl.org/2003/role/disclosureRef
-Topic 470
-SubTopic 10
-Name Accounting Standards Codification
-Section S99
-Paragraph 1A
-Subparagraph (SX 210.13-01(a)(5))
-Publisher FASB
-URI https://asc.fasb.org//1943274/2147480097/470-10-S99-1A
Reference 10: http://www.xbrl.org/2003/role/disclosureRef
-Topic 470
-SubTopic 10
-Name Accounting Standards Codification
-Section S99
-Paragraph 1B
-Subparagraph (SX 210.13-02(a)(4)(i))
-Publisher FASB
-URI https://asc.fasb.org//1943274/2147480097/470-10-S99-1B
Reference 11: http://www.xbrl.org/2003/role/disclosureRef
-Topic 470
-SubTopic 10
-Name Accounting Standards Codification
-Section S99
-Paragraph 1B
-Subparagraph (SX 210.13-02(a)(4)(iii)(A))
-Publisher FASB
-URI https://asc.fasb.org//1943274/2147480097/470-10-S99-1B
Reference 12: http://www.xbrl.org/2003/role/disclosureRef
-Topic 470
-SubTopic 10
-Name Accounting Standards Codification
-Section S99
-Paragraph 1B
-Subparagraph (SX 210.13-02(a)(4)(iii)(B))
-Publisher FASB
-URI https://asc.fasb.org//1943274/2147480097/470-10-S99-1B
Reference 13: http://www.xbrl.org/2003/role/disclosureRef
-Topic 470
-SubTopic 10
-Name Accounting Standards Codification
-Section S99
-Paragraph 1B
-Subparagraph (SX 210.13-02(a)(4)(iv))
-Publisher FASB
-URI https://asc.fasb.org//1943274/2147480097/470-10-S99-1B
Reference 14: http://www.xbrl.org/2003/role/disclosureRef
-Topic 470
-SubTopic 10
-Name Accounting Standards Codification
-Section S99
-Paragraph 1B
-Subparagraph (SX 210.13-02(a)(5))
-Publisher FASB
-URI https://asc.fasb.org//1943274/2147480097/470-10-S99-1B
Reference 15: http://www.xbrl.org/2003/role/disclosureRef
-Topic 280
-SubTopic 10
-Name Accounting Standards Codification
-Section 50
-Paragraph 30
-Subparagraph (a)
-Publisher FASB
-URI https://asc.fasb.org//1943274/2147482810/280-10-50-30
Reference 16: http://www.xbrl.org/2003/role/disclosureRef
-Topic 280
-SubTopic 10
-Name Accounting Standards Codification
-Section 50
-Paragraph 42
-Publisher FASB
-URI https://asc.fasb.org//1943274/2147482810/280-10-50-42
Reference 17: http://www.xbrl.org/2003/role/disclosureRef
-Topic 280
-SubTopic 10
-Name Accounting Standards Codification
-Section 50
-Paragraph 22
-Subparagraph (b)
-Publisher FASB
-URI https://asc.fasb.org//1943274/2147482810/280-10-50-22
Reference 18: http://www.xbrl.org/2003/role/disclosureRef
-Topic 280
-SubTopic 10
-Name Accounting Standards Codification
-Section 50
-Paragraph 32
-Subparagraph (b)
-Publisher FASB
-URI https://asc.fasb.org//1943274/2147482810/280-10-50-32
Reference 19: http://www.xbrl.org/2003/role/disclosureRef
-Topic 280
-SubTopic 10
-Name Accounting Standards Codification
-Section 50
-Paragraph 40
-Publisher FASB
-URI https://asc.fasb.org//1943274/2147482810/280-10-50-40
Reference 20: http://www.xbrl.org/2003/role/disclosureRef
-Topic 280
-SubTopic 10
-Name Accounting Standards Codification
-Section 50
-Paragraph 22
-Subparagraph (a)
-Publisher FASB
-URI https://asc.fasb.org//1943274/2147482810/280-10-50-22
Reference 21: http://www.xbrl.org/2003/role/disclosureRef
-Topic 280
-SubTopic 10
-Name Accounting Standards Codification
-Section 50
-Paragraph 32
-Subparagraph (a)
-Publisher FASB
-URI https://asc.fasb.org//1943274/2147482810/280-10-50-32
Reference 22: http://www.xbrl.org/2003/role/disclosureRef
-Topic 280
-SubTopic 10
-Name Accounting Standards Codification
-Section 50
-Paragraph 41
-Subparagraph (a)
-Publisher FASB
-URI https://asc.fasb.org//1943274/2147482810/280-10-50-41
Reference 23: http://www.xbrl.org/2003/role/disclosureRef
-Topic 942
-SubTopic 235
-Name Accounting Standards Codification
-Section S99
-Paragraph 1
-Subparagraph (SX 210.9-05(b)(2))
-Publisher FASB
-URI https://asc.fasb.org//1943274/2147479557/942-235-S99-1
| Name: |
us-gaap_Revenues |
| Namespace Prefix: |
us-gaap_ |
| Data Type: |
xbrli:monetaryItemType |
| Balance Type: |
credit |
| Period Type: |
duration |
|
| X |
- Details
| Name: |
us-gaap_StatementBusinessSegmentsAxis=nysedei_OfficeSegmentMember |
| Namespace Prefix: |
|
| Data Type: |
na |
| Balance Type: |
|
| Period Type: |
|
|
| X |
- Details
| Name: |
us-gaap_StatementBusinessSegmentsAxis=nysedei_MultifamilySegmentMember |
| Namespace Prefix: |
|
| Data Type: |
na |
| Balance Type: |
|
| Period Type: |
|
|
| X |
- Details
| Name: |
srt_ConsolidationItemsAxis=us-gaap_OperatingSegmentsMember |
| Namespace Prefix: |
|
| Data Type: |
na |
| Balance Type: |
|
| Period Type: |
|
|
v3.23.3
Segment Reporting - Reconciliation of Segment Profit to Net Income Attributable to Common Stockholders (Details) - USD ($)
$ in Thousands |
3 Months Ended |
9 Months Ended |
Sep. 30, 2023 |
Sep. 30, 2022 |
Sep. 30, 2023 |
Sep. 30, 2022 |
| Segment Reporting [Abstract] |
|
|
|
|
| Total profit from all segments |
$ 163,522
|
$ 165,349
|
$ 490,478
|
$ 491,780
|
| General and administrative expenses |
(12,826)
|
(11,272)
|
(34,698)
|
(34,173)
|
| Depreciation and amortization |
(122,022)
|
(96,276)
|
(336,771)
|
(279,588)
|
| Other income |
6,229
|
1,649
|
12,561
|
2,490
|
| Other expenses |
(175)
|
(199)
|
(820)
|
(561)
|
| Income from unconsolidated Fund |
290
|
356
|
1,177
|
921
|
| Interest expense |
(56,043)
|
(38,394)
|
(151,859)
|
(109,560)
|
| Net (loss) income |
(21,025)
|
21,213
|
(19,932)
|
71,309
|
| Net loss attributable to noncontrolling interests |
7,663
|
1,742
|
17,681
|
1,534
|
| Net (loss) income attributable to common stockholders |
$ (13,362)
|
$ 22,955
|
$ (2,251)
|
$ 72,843
|
| X |
- DefinitionThe current period expense charged against earnings on long-lived, physical assets not used in production, and which are not intended for resale, to allocate or recognize the cost of such assets over their useful lives; or to record the reduction in book value of an intangible asset over the benefit period of such asset; or to reflect consumption during the period of an asset that is not used in production. Reference 1: http://fasb.org/us-gaap/role/ref/legacyRef
-Name Accounting Standards Codification
-Section 45
-Paragraph 28
-Subparagraph (b)
-SubTopic 10
-Topic 230
-Publisher FASB
-URI https://asc.fasb.org//1943274/2147482740/230-10-45-28
Reference 2: http://fasb.org/us-gaap/role/ref/legacyRef
-Name Accounting Standards Codification
-Topic 360
-SubTopic 10
-Section 50
-Paragraph 1
-Subparagraph (a)
-Publisher FASB
-URI https://asc.fasb.org//1943274/2147482099/360-10-50-1
| Name: |
us-gaap_DepreciationAndAmortization |
| Namespace Prefix: |
us-gaap_ |
| Data Type: |
xbrli:monetaryItemType |
| Balance Type: |
debit |
| Period Type: |
duration |
|
| X |
- DefinitionThe aggregate total of expenses of managing and administering the affairs of an entity, including affiliates of the reporting entity, which are not directly or indirectly associated with the manufacture, sale or creation of a product or product line. Reference 1: http://www.xbrl.org/2003/role/disclosureRef
-Topic 946
-SubTopic 220
-Name Accounting Standards Codification
-Section S99
-Paragraph 1
-Subparagraph (SX 210.6-07(2)(a))
-Publisher FASB
-URI https://asc.fasb.org//1943274/2147483575/946-220-S99-1
Reference 2: http://fasb.org/us-gaap/role/ref/legacyRef
-Topic 220
-SubTopic 10
-Name Accounting Standards Codification
-Section S99
-Paragraph 2
-Subparagraph (SX 210.5-03.4)
-Publisher FASB
-URI https://asc.fasb.org//1943274/2147483621/220-10-S99-2
| Name: |
us-gaap_GeneralAndAdministrativeExpense |
| Namespace Prefix: |
us-gaap_ |
| Data Type: |
xbrli:monetaryItemType |
| Balance Type: |
debit |
| Period Type: |
duration |
|
| X |
- DefinitionAggregate revenue less cost of goods and services sold or operating expenses directly attributable to the revenue generation activity. Reference 1: http://www.xbrl.org/2003/role/disclosureRef
-Topic 235
-SubTopic 10
-Name Accounting Standards Codification
-Section S99
-Paragraph 1
-Subparagraph (SX 210.4-08(g)(1)(ii))
-Publisher FASB
-URI https://asc.fasb.org//1943274/2147480678/235-10-S99-1
Reference 2: http://www.xbrl.org/2003/role/disclosureRef
-Topic 323
-SubTopic 10
-Name Accounting Standards Codification
-Section 50
-Paragraph 3
-Subparagraph (c)
-Publisher FASB
-URI https://asc.fasb.org//1943274/2147481687/323-10-50-3
Reference 3: http://www.xbrl.org/2003/role/disclosureRef
-Topic 825
-SubTopic 10
-Name Accounting Standards Codification
-Section 50
-Paragraph 28
-Subparagraph (f)
-Publisher FASB
-URI https://asc.fasb.org//1943274/2147482907/825-10-50-28
Reference 4: http://www.xbrl.org/2003/role/disclosureRef
-Topic 280
-SubTopic 10
-Name Accounting Standards Codification
-Section 50
-Paragraph 22
-Publisher FASB
-URI https://asc.fasb.org//1943274/2147482810/280-10-50-22
Reference 5: http://www.xbrl.org/2003/role/disclosureRef
-Topic 470
-SubTopic 10
-Name Accounting Standards Codification
-Section S99
-Paragraph 1A
-Subparagraph (SX 210.13-01(a)(4)(i))
-Publisher FASB
-URI https://asc.fasb.org//1943274/2147480097/470-10-S99-1A
Reference 6: http://www.xbrl.org/2009/role/commonPracticeRef
-Topic 470
-SubTopic 10
-Name Accounting Standards Codification
-Section S99
-Paragraph 1A
-Subparagraph (SX 210.13-01(a)(4)(ii))
-Publisher FASB
-URI https://asc.fasb.org//1943274/2147480097/470-10-S99-1A
Reference 7: http://www.xbrl.org/2003/role/disclosureRef
-Topic 470
-SubTopic 10
-Name Accounting Standards Codification
-Section S99
-Paragraph 1A
-Subparagraph (SX 210.13-01(a)(4)(iii)(A))
-Publisher FASB
-URI https://asc.fasb.org//1943274/2147480097/470-10-S99-1A
Reference 8: http://www.xbrl.org/2003/role/disclosureRef
-Topic 470
-SubTopic 10
-Name Accounting Standards Codification
-Section S99
-Paragraph 1A
-Subparagraph (SX 210.13-01(a)(4)(iv))
-Publisher FASB
-URI https://asc.fasb.org//1943274/2147480097/470-10-S99-1A
Reference 9: http://www.xbrl.org/2003/role/disclosureRef
-Topic 470
-SubTopic 10
-Name Accounting Standards Codification
-Section S99
-Paragraph 1A
-Subparagraph (SX 210.13-01(a)(5))
-Publisher FASB
-URI https://asc.fasb.org//1943274/2147480097/470-10-S99-1A
Reference 10: http://www.xbrl.org/2003/role/disclosureRef
-Topic 470
-SubTopic 10
-Name Accounting Standards Codification
-Section S99
-Paragraph 1B
-Subparagraph (SX 210.13-02(a)(4)(i))
-Publisher FASB
-URI https://asc.fasb.org//1943274/2147480097/470-10-S99-1B
Reference 11: http://www.xbrl.org/2003/role/disclosureRef
-Topic 470
-SubTopic 10
-Name Accounting Standards Codification
-Section S99
-Paragraph 1B
-Subparagraph (SX 210.13-02(a)(4)(iii)(A))
-Publisher FASB
-URI https://asc.fasb.org//1943274/2147480097/470-10-S99-1B
Reference 12: http://www.xbrl.org/2003/role/disclosureRef
-Topic 470
-SubTopic 10
-Name Accounting Standards Codification
-Section S99
-Paragraph 1B
-Subparagraph (SX 210.13-02(a)(4)(iii)(B))
-Publisher FASB
-URI https://asc.fasb.org//1943274/2147480097/470-10-S99-1B
Reference 13: http://www.xbrl.org/2003/role/disclosureRef
-Topic 470
-SubTopic 10
-Name Accounting Standards Codification
-Section S99
-Paragraph 1B
-Subparagraph (SX 210.13-02(a)(4)(iv))
-Publisher FASB
-URI https://asc.fasb.org//1943274/2147480097/470-10-S99-1B
Reference 14: http://www.xbrl.org/2003/role/disclosureRef
-Topic 470
-SubTopic 10
-Name Accounting Standards Codification
-Section S99
-Paragraph 1B
-Subparagraph (SX 210.13-02(a)(5))
-Publisher FASB
-URI https://asc.fasb.org//1943274/2147480097/470-10-S99-1B
Reference 15: http://www.xbrl.org/2003/role/disclosureRef
-Topic 280
-SubTopic 10
-Name Accounting Standards Codification
-Section 50
-Paragraph 30
-Subparagraph (b)
-Publisher FASB
-URI https://asc.fasb.org//1943274/2147482810/280-10-50-30
Reference 16: http://www.xbrl.org/2003/role/disclosureRef
-Topic 280
-SubTopic 10
-Name Accounting Standards Codification
-Section 50
-Paragraph 32
-Subparagraph (f)
-Publisher FASB
-URI https://asc.fasb.org//1943274/2147482810/280-10-50-32
Reference 17: http://www.xbrl.org/2003/role/exampleRef
-Topic 280
-SubTopic 10
-Name Accounting Standards Codification
-Section 50
-Paragraph 31
-Publisher FASB
-URI https://asc.fasb.org//1943274/2147482810/280-10-50-31
Reference 18: http://www.xbrl.org/2003/role/disclosureRef
-Topic 280
-SubTopic 10
-Name Accounting Standards Codification
-Section 50
-Paragraph 32
-Subparagraph (c)
-Publisher FASB
-URI https://asc.fasb.org//1943274/2147482810/280-10-50-32
Reference 19: http://fasb.org/us-gaap/role/ref/legacyRef
-Topic 220
-SubTopic 10
-Name Accounting Standards Codification
-Section S99
-Paragraph 2
-Subparagraph (SX 210.5-03.1,2)
-Publisher FASB
-URI https://asc.fasb.org//1943274/2147483621/220-10-S99-2
| Name: |
us-gaap_GrossProfit |
| Namespace Prefix: |
us-gaap_ |
| Data Type: |
xbrli:monetaryItemType |
| Balance Type: |
credit |
| Period Type: |
duration |
|
| X |
- DefinitionAmount of income (loss) for proportionate share of equity method investee's income (loss). Reference 1: http://fasb.org/us-gaap/role/ref/legacyRef
-Name Accounting Standards Codification
-Section 45
-Paragraph 28
-Subparagraph (b)
-SubTopic 10
-Topic 230
-Publisher FASB
-URI https://asc.fasb.org//1943274/2147482740/230-10-45-28
Reference 2: http://www.xbrl.org/2003/role/disclosureRef
-Topic 944
-SubTopic 220
-Name Accounting Standards Codification
-Section S99
-Paragraph 1
-Subparagraph (SX 210.7-04(10))
-Publisher FASB
-URI https://asc.fasb.org//1943274/2147483586/944-220-S99-1
Reference 3: http://www.xbrl.org/2003/role/disclosureRef
-Topic 323
-SubTopic 10
-Name Accounting Standards Codification
-Section 45
-Paragraph 1
-Publisher FASB
-URI https://asc.fasb.org//1943274/2147481664/323-10-45-1
Reference 4: http://www.xbrl.org/2003/role/disclosureRef
-Topic 280
-SubTopic 10
-Name Accounting Standards Codification
-Section 50
-Paragraph 22
-Subparagraph (g)
-Publisher FASB
-URI https://asc.fasb.org//1943274/2147482810/280-10-50-22
Reference 5: http://fasb.org/us-gaap/role/ref/legacyRef
-Topic 220
-SubTopic 10
-Name Accounting Standards Codification
-Section S99
-Paragraph 2
-Subparagraph (SX 210.5-03(12))
-Publisher FASB
-URI https://asc.fasb.org//1943274/2147483621/220-10-S99-2
Reference 6: http://fasb.org/us-gaap/role/ref/legacyRef
-Topic 942
-SubTopic 220
-Name Accounting Standards Codification
-Section S99
-Paragraph 1
-Subparagraph (SX 210.9-04(13)(f))
-Publisher FASB
-URI https://asc.fasb.org//1943274/2147483589/942-220-S99-1
| Name: |
us-gaap_IncomeLossFromEquityMethodInvestments |
| Namespace Prefix: |
us-gaap_ |
| Data Type: |
xbrli:monetaryItemType |
| Balance Type: |
credit |
| Period Type: |
duration |
|
| X |
- DefinitionAmount of the cost of borrowed funds accounted for as interest expense. Reference 1: http://www.xbrl.org/2003/role/exampleRef
-Topic 946
-SubTopic 830
-Name Accounting Standards Codification
-Section 55
-Paragraph 10
-Publisher FASB
-URI https://asc.fasb.org//1943274/2147480167/946-830-55-10
Reference 2: http://www.xbrl.org/2009/role/commonPracticeRef
-Topic 946
-SubTopic 220
-Name Accounting Standards Codification
-Section 45
-Paragraph 3
-Subparagraph (i)
-Publisher FASB
-URI https://asc.fasb.org//1943274/2147483581/946-220-45-3
Reference 3: http://www.xbrl.org/2003/role/disclosureRef
-Topic 946
-SubTopic 220
-Name Accounting Standards Codification
-Section S99
-Paragraph 1
-Subparagraph (SX 210.6-07(3))
-Publisher FASB
-URI https://asc.fasb.org//1943274/2147483575/946-220-S99-1
Reference 4: http://www.xbrl.org/2003/role/disclosureRef
-Topic 280
-SubTopic 10
-Name Accounting Standards Codification
-Section 50
-Paragraph 22
-Subparagraph (d)
-Publisher FASB
-URI https://asc.fasb.org//1943274/2147482810/280-10-50-22
Reference 5: http://fasb.org/us-gaap/role/ref/legacyRef
-Name Accounting Standards Codification
-Topic 835
-SubTopic 30
-Section 45
-Paragraph 3
-Publisher FASB
-URI https://asc.fasb.org//1943274/2147482925/835-30-45-3
Reference 6: http://fasb.org/us-gaap/role/ref/legacyRef
-Topic 942
-SubTopic 220
-Name Accounting Standards Codification
-Section S99
-Paragraph 1
-Subparagraph (SX 210.9-04.9)
-Publisher FASB
-URI https://asc.fasb.org//1943274/2147483589/942-220-S99-1
Reference 7: http://www.xbrl.org/2003/role/disclosureRef
-Topic 220
-SubTopic 10
-Name Accounting Standards Codification
-Section S99
-Paragraph 2
-Subparagraph (210.5-03(11))
-Publisher FASB
-URI https://asc.fasb.org//1943274/2147483621/220-10-S99-2
Reference 8: http://www.xbrl.org/2003/role/disclosureRef
-Topic 835
-SubTopic 20
-Name Accounting Standards Codification
-Section 50
-Paragraph 1
-Subparagraph (a)
-Publisher FASB
-URI https://asc.fasb.org//1943274/2147483013/835-20-50-1
| Name: |
us-gaap_InterestExpense |
| Namespace Prefix: |
us-gaap_ |
| Data Type: |
xbrli:monetaryItemType |
| Balance Type: |
debit |
| Period Type: |
duration |
|
| X |
- DefinitionThe portion of profit or loss for the period, net of income taxes, which is attributable to the parent. Reference 1: http://www.xbrl.org/2003/role/disclosureRef
-Topic 235
-SubTopic 10
-Name Accounting Standards Codification
-Section S99
-Paragraph 1
-Subparagraph (SX 210.4-08(g)(1)(ii))
-Publisher FASB
-URI https://asc.fasb.org//1943274/2147480678/235-10-S99-1
Reference 2: http://www.xbrl.org/2003/role/disclosureRef
-Topic 323
-SubTopic 10
-Name Accounting Standards Codification
-Section 50
-Paragraph 3
-Subparagraph (c)
-Publisher FASB
-URI https://asc.fasb.org//1943274/2147481687/323-10-50-3
Reference 3: http://www.xbrl.org/2003/role/disclosureRef
-Topic 825
-SubTopic 10
-Name Accounting Standards Codification
-Section 50
-Paragraph 28
-Subparagraph (f)
-Publisher FASB
-URI https://asc.fasb.org//1943274/2147482907/825-10-50-28
Reference 4: http://www.xbrl.org/2003/role/disclosureRef
-Topic 220
-SubTopic 10
-Name Accounting Standards Codification
-Section 50
-Paragraph 6
-Publisher FASB
-URI https://asc.fasb.org//1943274/2147482765/220-10-50-6
Reference 5: http://www.xbrl.org/2003/role/disclosureRef
-Topic 250
-SubTopic 10
-Name Accounting Standards Codification
-Section 50
-Paragraph 3
-Publisher FASB
-URI https://asc.fasb.org//1943274/2147483443/250-10-50-3
Reference 6: http://www.xbrl.org/2003/role/disclosureRef
-Topic 250
-SubTopic 10
-Name Accounting Standards Codification
-Section 50
-Paragraph 1
-Subparagraph (b)(2)
-Publisher FASB
-URI https://asc.fasb.org//1943274/2147483443/250-10-50-1
Reference 7: http://www.xbrl.org/2003/role/disclosureRef
-Topic 815
-SubTopic 40
-Name Accounting Standards Codification
-Section 65
-Paragraph 1
-Subparagraph (f)
-Publisher FASB
-URI https://asc.fasb.org//1943274/2147480175/815-40-65-1
Reference 8: http://www.xbrl.org/2003/role/disclosureRef
-Topic 250
-SubTopic 10
-Name Accounting Standards Codification
-Section 50
-Paragraph 8
-Publisher FASB
-URI https://asc.fasb.org//1943274/2147483443/250-10-50-8
Reference 9: http://www.xbrl.org/2003/role/disclosureRef
-Topic 250
-SubTopic 10
-Name Accounting Standards Codification
-Section 50
-Paragraph 9
-Publisher FASB
-URI https://asc.fasb.org//1943274/2147483443/250-10-50-9
Reference 10: http://www.xbrl.org/2003/role/disclosureRef
-Topic 250
-SubTopic 10
-Name Accounting Standards Codification
-Section 50
-Paragraph 11
-Subparagraph (a)
-Publisher FASB
-URI https://asc.fasb.org//1943274/2147483443/250-10-50-11
Reference 11: http://www.xbrl.org/2003/role/disclosureRef
-Topic 250
-SubTopic 10
-Name Accounting Standards Codification
-Section 50
-Paragraph 11
-Subparagraph (b)
-Publisher FASB
-URI https://asc.fasb.org//1943274/2147483443/250-10-50-11
Reference 12: http://www.xbrl.org/2003/role/disclosureRef
-Topic 250
-SubTopic 10
-Name Accounting Standards Codification
-Section 50
-Paragraph 4
-Publisher FASB
-URI https://asc.fasb.org//1943274/2147483443/250-10-50-4
Reference 13: http://www.xbrl.org/2003/role/exampleRef
-Topic 946
-SubTopic 830
-Name Accounting Standards Codification
-Section 55
-Paragraph 10
-Publisher FASB
-URI https://asc.fasb.org//1943274/2147480167/946-830-55-10
Reference 14: http://www.xbrl.org/2003/role/disclosureRef
-Topic 946
-SubTopic 220
-Name Accounting Standards Codification
-Section 45
-Paragraph 7
-Publisher FASB
-URI https://asc.fasb.org//1943274/2147483581/946-220-45-7
Reference 15: http://www.xbrl.org/2003/role/disclosureRef
-Topic 944
-SubTopic 220
-Name Accounting Standards Codification
-Section S99
-Paragraph 1
-Subparagraph (SX 210.7-04(18))
-Publisher FASB
-URI https://asc.fasb.org//1943274/2147483586/944-220-S99-1
Reference 16: http://www.xbrl.org/2003/role/disclosureRef
-Topic 280
-SubTopic 10
-Name Accounting Standards Codification
-Section 50
-Paragraph 22
-Publisher FASB
-URI https://asc.fasb.org//1943274/2147482810/280-10-50-22
Reference 17: http://www.xbrl.org/2003/role/disclosureRef
-Topic 946
-SubTopic 220
-Name Accounting Standards Codification
-Section S99
-Paragraph 1
-Subparagraph (SX 210.6-07(9))
-Publisher FASB
-URI https://asc.fasb.org//1943274/2147483575/946-220-S99-1
Reference 18: http://www.xbrl.org/2003/role/disclosureRef
-Topic 946
-SubTopic 220
-Name Accounting Standards Codification
-Section S99
-Paragraph 3
-Subparagraph (SX 210.6-09(1)(d))
-Publisher FASB
-URI https://asc.fasb.org//1943274/2147483575/946-220-S99-3
Reference 19: http://www.xbrl.org/2003/role/disclosureRef
-Topic 470
-SubTopic 10
-Name Accounting Standards Codification
-Section S99
-Paragraph 1A
-Subparagraph (SX 210.13-01(a)(4)(i))
-Publisher FASB
-URI https://asc.fasb.org//1943274/2147480097/470-10-S99-1A
Reference 20: http://www.xbrl.org/2009/role/commonPracticeRef
-Topic 470
-SubTopic 10
-Name Accounting Standards Codification
-Section S99
-Paragraph 1A
-Subparagraph (SX 210.13-01(a)(4)(ii))
-Publisher FASB
-URI https://asc.fasb.org//1943274/2147480097/470-10-S99-1A
Reference 21: http://www.xbrl.org/2003/role/disclosureRef
-Topic 470
-SubTopic 10
-Name Accounting Standards Codification
-Section S99
-Paragraph 1A
-Subparagraph (SX 210.13-01(a)(4)(iii)(A))
-Publisher FASB
-URI https://asc.fasb.org//1943274/2147480097/470-10-S99-1A
Reference 22: http://www.xbrl.org/2003/role/disclosureRef
-Topic 470
-SubTopic 10
-Name Accounting Standards Codification
-Section S99
-Paragraph 1A
-Subparagraph (SX 210.13-01(a)(4)(iv))
-Publisher FASB
-URI https://asc.fasb.org//1943274/2147480097/470-10-S99-1A
Reference 23: http://www.xbrl.org/2003/role/disclosureRef
-Topic 470
-SubTopic 10
-Name Accounting Standards Codification
-Section S99
-Paragraph 1A
-Subparagraph (SX 210.13-01(a)(5))
-Publisher FASB
-URI https://asc.fasb.org//1943274/2147480097/470-10-S99-1A
Reference 24: http://www.xbrl.org/2003/role/disclosureRef
-Topic 470
-SubTopic 10
-Name Accounting Standards Codification
-Section S99
-Paragraph 1B
-Subparagraph (SX 210.13-02(a)(4)(i))
-Publisher FASB
-URI https://asc.fasb.org//1943274/2147480097/470-10-S99-1B
Reference 25: http://www.xbrl.org/2003/role/disclosureRef
-Topic 470
-SubTopic 10
-Name Accounting Standards Codification
-Section S99
-Paragraph 1B
-Subparagraph (SX 210.13-02(a)(4)(iii)(A))
-Publisher FASB
-URI https://asc.fasb.org//1943274/2147480097/470-10-S99-1B
Reference 26: http://www.xbrl.org/2003/role/disclosureRef
-Topic 470
-SubTopic 10
-Name Accounting Standards Codification
-Section S99
-Paragraph 1B
-Subparagraph (SX 210.13-02(a)(4)(iii)(B))
-Publisher FASB
-URI https://asc.fasb.org//1943274/2147480097/470-10-S99-1B
Reference 27: http://www.xbrl.org/2003/role/disclosureRef
-Topic 470
-SubTopic 10
-Name Accounting Standards Codification
-Section S99
-Paragraph 1B
-Subparagraph (SX 210.13-02(a)(4)(iv))
-Publisher FASB
-URI https://asc.fasb.org//1943274/2147480097/470-10-S99-1B
Reference 28: http://www.xbrl.org/2003/role/disclosureRef
-Topic 470
-SubTopic 10
-Name Accounting Standards Codification
-Section S99
-Paragraph 1B
-Subparagraph (SX 210.13-02(a)(5))
-Publisher FASB
-URI https://asc.fasb.org//1943274/2147480097/470-10-S99-1B
Reference 29: http://www.xbrl.org/2003/role/disclosureRef
-Topic 280
-SubTopic 10
-Name Accounting Standards Codification
-Section 50
-Paragraph 30
-Subparagraph (b)
-Publisher FASB
-URI https://asc.fasb.org//1943274/2147482810/280-10-50-30
Reference 30: http://www.xbrl.org/2003/role/disclosureRef
-Topic 280
-SubTopic 10
-Name Accounting Standards Codification
-Section 50
-Paragraph 32
-Subparagraph (f)
-Publisher FASB
-URI https://asc.fasb.org//1943274/2147482810/280-10-50-32
Reference 31: http://www.xbrl.org/2003/role/disclosureRef
-Topic 260
-SubTopic 10
-Name Accounting Standards Codification
-Section 45
-Paragraph 60B
-Subparagraph (a)
-Publisher FASB
-URI https://asc.fasb.org//1943274/2147482689/260-10-45-60B
Reference 32: http://www.xbrl.org/2003/role/exampleRef
-Topic 280
-SubTopic 10
-Name Accounting Standards Codification
-Section 50
-Paragraph 31
-Publisher FASB
-URI https://asc.fasb.org//1943274/2147482810/280-10-50-31
Reference 33: http://www.xbrl.org/2003/role/disclosureRef
-Topic 280
-SubTopic 10
-Name Accounting Standards Codification
-Section 50
-Paragraph 32
-Subparagraph (c)
-Publisher FASB
-URI https://asc.fasb.org//1943274/2147482810/280-10-50-32
Reference 34: http://www.xbrl.org/2003/role/disclosureRef
-Topic 205
-SubTopic 20
-Name Accounting Standards Codification
-Section 50
-Paragraph 7
-Publisher FASB
-URI https://asc.fasb.org//1943274/2147483499/205-20-50-7
Reference 35: http://fasb.org/us-gaap/role/ref/legacyRef
-Topic 230
-SubTopic 10
-Name Accounting Standards Codification
-Section 45
-Paragraph 28
-Publisher FASB
-URI https://asc.fasb.org//1943274/2147482740/230-10-45-28
Reference 36: http://www.xbrl.org/2003/role/disclosureRef
-Topic 220
-SubTopic 10
-Name Accounting Standards Codification
-Section 45
-Paragraph 1A
-Subparagraph (a)
-Publisher FASB
-URI https://asc.fasb.org//1943274/2147482790/220-10-45-1A
Reference 37: http://www.xbrl.org/2003/role/disclosureRef
-Topic 220
-SubTopic 10
-Name Accounting Standards Codification
-Section 45
-Paragraph 1B
-Subparagraph (a)
-Publisher FASB
-URI https://asc.fasb.org//1943274/2147482790/220-10-45-1B
Reference 38: http://fasb.org/us-gaap/role/ref/legacyRef
-Topic 220
-SubTopic 10
-Name Accounting Standards Codification
-Section S99
-Paragraph 2
-Subparagraph (SX 210.5-03(20))
-Publisher FASB
-URI https://asc.fasb.org//1943274/2147483621/220-10-S99-2
Reference 39: http://fasb.org/us-gaap/role/ref/legacyRef
-Topic 942
-SubTopic 220
-Name Accounting Standards Codification
-Section S99
-Paragraph 1
-Subparagraph (SX 210.9-04(22))
-Publisher FASB
-URI https://asc.fasb.org//1943274/2147483589/942-220-S99-1
| Name: |
us-gaap_NetIncomeLoss |
| Namespace Prefix: |
us-gaap_ |
| Data Type: |
xbrli:monetaryItemType |
| Balance Type: |
credit |
| Period Type: |
duration |
|
| X |
- DefinitionAmount of Net Income (Loss) attributable to noncontrolling interest. Reference 1: http://www.xbrl.org/2003/role/disclosureRef
-Topic 250
-SubTopic 10
-Name Accounting Standards Codification
-Section 50
-Paragraph 8
-Publisher FASB
-URI https://asc.fasb.org//1943274/2147483443/250-10-50-8
Reference 2: http://www.xbrl.org/2003/role/disclosureRef
-Topic 250
-SubTopic 10
-Name Accounting Standards Codification
-Section 50
-Paragraph 9
-Publisher FASB
-URI https://asc.fasb.org//1943274/2147483443/250-10-50-9
Reference 3: http://www.xbrl.org/2003/role/disclosureRef
-Topic 944
-SubTopic 220
-Name Accounting Standards Codification
-Section S99
-Paragraph 1
-Subparagraph (SX 210.7-04(17))
-Publisher FASB
-URI https://asc.fasb.org//1943274/2147483586/944-220-S99-1
Reference 4: http://www.xbrl.org/2009/role/commonPracticeRef
-Topic 220
-SubTopic 10
-Name Accounting Standards Codification
-Section 50
-Paragraph 6
-Publisher FASB
-URI https://asc.fasb.org//1943274/2147482765/220-10-50-6
Reference 5: http://fasb.org/us-gaap/role/ref/legacyRef
-Topic 810
-SubTopic 10
-Name Accounting Standards Codification
-Section 50
-Paragraph 1A
-Subparagraph (a)(2)
-Publisher FASB
-URI https://asc.fasb.org//1943274/2147481203/810-10-50-1A
Reference 6: http://fasb.org/us-gaap/role/ref/legacyRef
-Name Accounting Standards Codification
-Topic 810
-SubTopic 10
-Section 55
-Paragraph 4J
-Publisher FASB
-URI https://asc.fasb.org//1943274/2147481175/810-10-55-4J
Reference 7: http://www.xbrl.org/2003/role/disclosureRef
-Topic 220
-SubTopic 10
-Name Accounting Standards Codification
-Section 45
-Paragraph 1A
-Subparagraph (a)
-Publisher FASB
-URI https://asc.fasb.org//1943274/2147482790/220-10-45-1A
Reference 8: http://www.xbrl.org/2003/role/disclosureRef
-Topic 220
-SubTopic 10
-Name Accounting Standards Codification
-Section 45
-Paragraph 1B
-Subparagraph (a)
-Publisher FASB
-URI https://asc.fasb.org//1943274/2147482790/220-10-45-1B
| Name: |
us-gaap_NetIncomeLossAttributableToNoncontrollingInterest |
| Namespace Prefix: |
us-gaap_ |
| Data Type: |
xbrli:monetaryItemType |
| Balance Type: |
debit |
| Period Type: |
duration |
|
| X |
- DefinitionThe aggregate amount of income or expense from ancillary business-related activities (that is to say, excluding major activities considered part of the normal operations of the business). Reference 1: http://fasb.org/us-gaap/role/ref/legacyRef
-Topic 220
-SubTopic 10
-Name Accounting Standards Codification
-Section S99
-Paragraph 2
-Subparagraph (SX 210.5-03.7)
-Publisher FASB
-URI https://asc.fasb.org//1943274/2147483621/220-10-S99-2
| Name: |
us-gaap_NonoperatingIncomeExpense |
| Namespace Prefix: |
us-gaap_ |
| Data Type: |
xbrli:monetaryItemType |
| Balance Type: |
credit |
| Period Type: |
duration |
|
| X |
- DefinitionAmount of expense classified as other. Reference 1: http://fasb.org/us-gaap/role/ref/legacyRef
-Topic 220
-SubTopic 10
-Name Accounting Standards Codification
-Section S99
-Paragraph 2
-Subparagraph (SX 210.5-03.4,6)
-Publisher FASB
-URI https://asc.fasb.org//1943274/2147483621/220-10-S99-2
| Name: |
us-gaap_OtherExpenses |
| Namespace Prefix: |
us-gaap_ |
| Data Type: |
xbrli:monetaryItemType |
| Balance Type: |
debit |
| Period Type: |
duration |
|
| X |
- DefinitionThe consolidated profit or loss for the period, net of income taxes, including the portion attributable to the noncontrolling interest. Reference 1: http://www.xbrl.org/2003/role/disclosureRef
-Topic 235
-SubTopic 10
-Name Accounting Standards Codification
-Section S99
-Paragraph 1
-Subparagraph (SX 210.4-08(g)(1)(ii))
-Publisher FASB
-URI https://asc.fasb.org//1943274/2147480678/235-10-S99-1
Reference 2: http://www.xbrl.org/2003/role/disclosureRef
-Topic 323
-SubTopic 10
-Name Accounting Standards Codification
-Section 50
-Paragraph 3
-Subparagraph (c)
-Publisher FASB
-URI https://asc.fasb.org//1943274/2147481687/323-10-50-3
Reference 3: http://www.xbrl.org/2003/role/disclosureRef
-Topic 825
-SubTopic 10
-Name Accounting Standards Codification
-Section 50
-Paragraph 28
-Subparagraph (f)
-Publisher FASB
-URI https://asc.fasb.org//1943274/2147482907/825-10-50-28
Reference 4: http://www.xbrl.org/2003/role/disclosureRef
-Topic 250
-SubTopic 10
-Name Accounting Standards Codification
-Section 50
-Paragraph 1
-Subparagraph (b)(2)
-Publisher FASB
-URI https://asc.fasb.org//1943274/2147483443/250-10-50-1
Reference 5: http://www.xbrl.org/2003/role/disclosureRef
-Topic 815
-SubTopic 40
-Name Accounting Standards Codification
-Section 65
-Paragraph 1
-Subparagraph (f)
-Publisher FASB
-URI https://asc.fasb.org//1943274/2147480175/815-40-65-1
Reference 6: http://www.xbrl.org/2003/role/disclosureRef
-Topic 250
-SubTopic 10
-Name Accounting Standards Codification
-Section 50
-Paragraph 8
-Publisher FASB
-URI https://asc.fasb.org//1943274/2147483443/250-10-50-8
Reference 7: http://www.xbrl.org/2003/role/disclosureRef
-Topic 250
-SubTopic 10
-Name Accounting Standards Codification
-Section 50
-Paragraph 9
-Publisher FASB
-URI https://asc.fasb.org//1943274/2147483443/250-10-50-9
Reference 8: http://www.xbrl.org/2003/role/exampleRef
-Topic 946
-SubTopic 830
-Name Accounting Standards Codification
-Section 55
-Paragraph 11
-Publisher FASB
-URI https://asc.fasb.org//1943274/2147480167/946-830-55-11
Reference 9: http://www.xbrl.org/2003/role/disclosureRef
-Topic 946
-SubTopic 205
-Name Accounting Standards Codification
-Section 45
-Paragraph 3
-Subparagraph (a)
-Publisher FASB
-URI https://asc.fasb.org//1943274/2147480767/946-205-45-3
Reference 10: http://www.xbrl.org/2003/role/disclosureRef
-Topic 946
-SubTopic 220
-Name Accounting Standards Codification
-Section 45
-Paragraph 7
-Publisher FASB
-URI https://asc.fasb.org//1943274/2147483581/946-220-45-7
Reference 11: http://www.xbrl.org/2003/role/disclosureRef
-Topic 944
-SubTopic 220
-Name Accounting Standards Codification
-Section S99
-Paragraph 1
-Subparagraph (SX 210.7-04(16))
-Publisher FASB
-URI https://asc.fasb.org//1943274/2147483586/944-220-S99-1
Reference 12: http://www.xbrl.org/2003/role/disclosureRef
-Topic 280
-SubTopic 10
-Name Accounting Standards Codification
-Section 50
-Paragraph 22
-Publisher FASB
-URI https://asc.fasb.org//1943274/2147482810/280-10-50-22
Reference 13: http://www.xbrl.org/2003/role/disclosureRef
-Topic 946
-SubTopic 220
-Name Accounting Standards Codification
-Section S99
-Paragraph 1
-Subparagraph (SX 210.6-07(9))
-Publisher FASB
-URI https://asc.fasb.org//1943274/2147483575/946-220-S99-1
Reference 14: http://www.xbrl.org/2003/role/disclosureRef
-Topic 946
-SubTopic 220
-Name Accounting Standards Codification
-Section S99
-Paragraph 3
-Subparagraph (SX 210.6-09(1)(d))
-Publisher FASB
-URI https://asc.fasb.org//1943274/2147483575/946-220-S99-3
Reference 15: http://www.xbrl.org/2003/role/disclosureRef
-Topic 810
-SubTopic 10
-Name Accounting Standards Codification
-Section 45
-Paragraph 19
-Publisher FASB
-URI https://asc.fasb.org//1943274/2147481231/810-10-45-19
Reference 16: http://www.xbrl.org/2009/role/commonPracticeRef
-Topic 220
-SubTopic 10
-Name Accounting Standards Codification
-Section 50
-Paragraph 6
-Publisher FASB
-URI https://asc.fasb.org//1943274/2147482765/220-10-50-6
Reference 17: http://www.xbrl.org/2003/role/disclosureRef
-Topic 470
-SubTopic 10
-Name Accounting Standards Codification
-Section S99
-Paragraph 1A
-Subparagraph (SX 210.13-01(a)(4)(i))
-Publisher FASB
-URI https://asc.fasb.org//1943274/2147480097/470-10-S99-1A
Reference 18: http://www.xbrl.org/2009/role/commonPracticeRef
-Topic 470
-SubTopic 10
-Name Accounting Standards Codification
-Section S99
-Paragraph 1A
-Subparagraph (SX 210.13-01(a)(4)(ii))
-Publisher FASB
-URI https://asc.fasb.org//1943274/2147480097/470-10-S99-1A
Reference 19: http://www.xbrl.org/2003/role/disclosureRef
-Topic 470
-SubTopic 10
-Name Accounting Standards Codification
-Section S99
-Paragraph 1A
-Subparagraph (SX 210.13-01(a)(4)(iii)(A))
-Publisher FASB
-URI https://asc.fasb.org//1943274/2147480097/470-10-S99-1A
Reference 20: http://www.xbrl.org/2003/role/disclosureRef
-Topic 470
-SubTopic 10
-Name Accounting Standards Codification
-Section S99
-Paragraph 1A
-Subparagraph (SX 210.13-01(a)(4)(iv))
-Publisher FASB
-URI https://asc.fasb.org//1943274/2147480097/470-10-S99-1A
Reference 21: http://www.xbrl.org/2003/role/disclosureRef
-Topic 470
-SubTopic 10
-Name Accounting Standards Codification
-Section S99
-Paragraph 1A
-Subparagraph (SX 210.13-01(a)(5))
-Publisher FASB
-URI https://asc.fasb.org//1943274/2147480097/470-10-S99-1A
Reference 22: http://www.xbrl.org/2003/role/disclosureRef
-Topic 470
-SubTopic 10
-Name Accounting Standards Codification
-Section S99
-Paragraph 1B
-Subparagraph (SX 210.13-02(a)(4)(i))
-Publisher FASB
-URI https://asc.fasb.org//1943274/2147480097/470-10-S99-1B
Reference 23: http://www.xbrl.org/2003/role/disclosureRef
-Topic 470
-SubTopic 10
-Name Accounting Standards Codification
-Section S99
-Paragraph 1B
-Subparagraph (SX 210.13-02(a)(4)(iii)(A))
-Publisher FASB
-URI https://asc.fasb.org//1943274/2147480097/470-10-S99-1B
Reference 24: http://www.xbrl.org/2003/role/disclosureRef
-Topic 470
-SubTopic 10
-Name Accounting Standards Codification
-Section S99
-Paragraph 1B
-Subparagraph (SX 210.13-02(a)(4)(iii)(B))
-Publisher FASB
-URI https://asc.fasb.org//1943274/2147480097/470-10-S99-1B
Reference 25: http://www.xbrl.org/2003/role/disclosureRef
-Topic 470
-SubTopic 10
-Name Accounting Standards Codification
-Section S99
-Paragraph 1B
-Subparagraph (SX 210.13-02(a)(4)(iv))
-Publisher FASB
-URI https://asc.fasb.org//1943274/2147480097/470-10-S99-1B
Reference 26: http://www.xbrl.org/2003/role/disclosureRef
-Topic 470
-SubTopic 10
-Name Accounting Standards Codification
-Section S99
-Paragraph 1B
-Subparagraph (SX 210.13-02(a)(5))
-Publisher FASB
-URI https://asc.fasb.org//1943274/2147480097/470-10-S99-1B
Reference 27: http://www.xbrl.org/2003/role/disclosureRef
-Topic 280
-SubTopic 10
-Name Accounting Standards Codification
-Section 50
-Paragraph 30
-Subparagraph (b)
-Publisher FASB
-URI https://asc.fasb.org//1943274/2147482810/280-10-50-30
Reference 28: http://www.xbrl.org/2003/role/disclosureRef
-Topic 280
-SubTopic 10
-Name Accounting Standards Codification
-Section 50
-Paragraph 32
-Subparagraph (f)
-Publisher FASB
-URI https://asc.fasb.org//1943274/2147482810/280-10-50-32
Reference 29: http://www.xbrl.org/2003/role/exampleRef
-Topic 280
-SubTopic 10
-Name Accounting Standards Codification
-Section 50
-Paragraph 31
-Publisher FASB
-URI https://asc.fasb.org//1943274/2147482810/280-10-50-31
Reference 30: http://www.xbrl.org/2003/role/disclosureRef
-Topic 280
-SubTopic 10
-Name Accounting Standards Codification
-Section 50
-Paragraph 32
-Subparagraph (c)
-Publisher FASB
-URI https://asc.fasb.org//1943274/2147482810/280-10-50-32
Reference 31: http://www.xbrl.org/2003/role/disclosureRef
-Topic 942
-SubTopic 235
-Name Accounting Standards Codification
-Section S99
-Paragraph 1
-Subparagraph (SX 210.9-05(b)(2))
-Publisher FASB
-URI https://asc.fasb.org//1943274/2147479557/942-235-S99-1
Reference 32: http://www.xbrl.org/2003/role/disclosureRef
-Topic 205
-SubTopic 20
-Name Accounting Standards Codification
-Section 50
-Paragraph 7
-Publisher FASB
-URI https://asc.fasb.org//1943274/2147483499/205-20-50-7
Reference 33: http://www.xbrl.org/2003/role/exampleRef
-Topic 810
-SubTopic 10
-Name Accounting Standards Codification
-Section 55
-Paragraph 4J
-Publisher FASB
-URI https://asc.fasb.org//1943274/2147481175/810-10-55-4J
Reference 34: http://www.xbrl.org/2003/role/exampleRef
-Topic 810
-SubTopic 10
-Name Accounting Standards Codification
-Section 55
-Paragraph 4K
-Publisher FASB
-URI https://asc.fasb.org//1943274/2147481175/810-10-55-4K
Reference 35: http://www.xbrl.org/2003/role/disclosureRef
-Topic 220
-SubTopic 10
-Name Accounting Standards Codification
-Section 45
-Paragraph 1A
-Subparagraph (a)
-Publisher FASB
-URI https://asc.fasb.org//1943274/2147482790/220-10-45-1A
Reference 36: http://www.xbrl.org/2003/role/disclosureRef
-Topic 220
-SubTopic 10
-Name Accounting Standards Codification
-Section 45
-Paragraph 1B
-Subparagraph (a)
-Publisher FASB
-URI https://asc.fasb.org//1943274/2147482790/220-10-45-1B
Reference 37: http://www.xbrl.org/2003/role/disclosureRef
-Topic 230
-SubTopic 10
-Name Accounting Standards Codification
-Section 45
-Paragraph 2
-Publisher FASB
-URI https://asc.fasb.org//1943274/2147482740/230-10-45-2
Reference 38: http://www.xbrl.org/2003/role/disclosureRef
-Topic 810
-SubTopic 10
-Name Accounting Standards Codification
-Section 50
-Paragraph 1A
-Subparagraph (a)(1)
-Publisher FASB
-URI https://asc.fasb.org//1943274/2147481203/810-10-50-1A
Reference 39: http://www.xbrl.org/2003/role/disclosureRef
-Topic 810
-SubTopic 10
-Name Accounting Standards Codification
-Section 50
-Paragraph 1A
-Subparagraph (c)(1)
-Publisher FASB
-URI https://asc.fasb.org//1943274/2147481203/810-10-50-1A
| Name: |
us-gaap_ProfitLoss |
| Namespace Prefix: |
us-gaap_ |
| Data Type: |
xbrli:monetaryItemType |
| Balance Type: |
credit |
| Period Type: |
duration |
|
| X |
- References
+ Details
| Name: |
us-gaap_SegmentReportingAbstract |
| Namespace Prefix: |
us-gaap_ |
| Data Type: |
xbrli:stringItemType |
| Balance Type: |
na |
| Period Type: |
duration |
|
v3.23.3
| X |
- DefinitionLessor Operating Leases Not Included In Future Minimum Payments Receivable Maximum Term
| Name: |
nysedei_LessorOperatingLeasesNotIncludedInFutureMinimumPaymentsReceivableMaximumTerm |
| Namespace Prefix: |
nysedei_ |
| Data Type: |
xbrli:durationItemType |
| Balance Type: |
na |
| Period Type: |
duration |
|
| X |
- DefinitionLine items represent financial concepts included in a table. These concepts are used to disclose reportable information associated with domain members defined in one or many axes to the table. Reference 1: http://www.xbrl.org/2003/role/disclosureRef
-Topic 842
-SubTopic 30
-Name Accounting Standards Codification
-Section 50
-Paragraph 3
-Publisher FASB
-URI https://asc.fasb.org//1943274/2147479773/842-30-50-3
| Name: |
us-gaap_LessorLeaseDescriptionLineItems |
| Namespace Prefix: |
us-gaap_ |
| Data Type: |
xbrli:stringItemType |
| Balance Type: |
na |
| Period Type: |
duration |
|
| X |
- DefinitionNumber of separate real estate development properties located on land subject to ground leases. Reference 1: http://www.xbrl.org/2009/role/commonPracticeRef
-Topic 842
-SubTopic 20
-Name Accounting Standards Codification
-Section 50
-Paragraph 3
-Subparagraph (a)(1)
-Publisher FASB
-URI https://asc.fasb.org//1943274/2147478964/842-20-50-3
| Name: |
us-gaap_NumberOfPropertiesSubjectToGroundLeases |
| Namespace Prefix: |
us-gaap_ |
| Data Type: |
xbrli:integerItemType |
| Balance Type: |
na |
| Period Type: |
instant |
|
| X |
- Details
| Name: |
us-gaap_RealEstatePropertiesAxis=us-gaap_WhollyOwnedPropertiesMember |
| Namespace Prefix: |
|
| Data Type: |
na |
| Balance Type: |
|
| Period Type: |
|
|
v3.23.3
| X |
- References
+ Details
| Name: |
us-gaap_LessorOperatingLeasePaymentsRollingMaturityAbstract |
| Namespace Prefix: |
us-gaap_ |
| Data Type: |
xbrli:stringItemType |
| Balance Type: |
na |
| Period Type: |
duration |
|
| X |
- DefinitionAmount of lease payments to be received by lessor for operating lease. Reference 1: http://www.xbrl.org/2003/role/disclosureRef
-Topic 842
-SubTopic 30
-Name Accounting Standards Codification
-Section 50
-Paragraph 12
-Publisher FASB
-URI https://asc.fasb.org//1943274/2147479773/842-30-50-12
| Name: |
us-gaap_LessorOperatingLeasePaymentsToBeReceived |
| Namespace Prefix: |
us-gaap_ |
| Data Type: |
xbrli:monetaryItemType |
| Balance Type: |
debit |
| Period Type: |
instant |
|
| X |
- DefinitionAmount of lease payments to be received by lessor in period after fifth rolling twelve months following latest statement of financial position date for operating lease. For interim and annual periods when interim periods are reported on rolling approach, from latest statement of financial position date. Reference 1: http://www.xbrl.org/2009/role/commonPracticeRef
-Topic 842
-SubTopic 30
-Name Accounting Standards Codification
-Section 50
-Paragraph 12
-Publisher FASB
-URI https://asc.fasb.org//1943274/2147479773/842-30-50-12
| Name: |
us-gaap_LessorOperatingLeasePaymentsToBeReceivedAfterRollingYearFive |
| Namespace Prefix: |
us-gaap_ |
| Data Type: |
xbrli:monetaryItemType |
| Balance Type: |
debit |
| Period Type: |
instant |
|
| X |
- DefinitionAmount of lease payments to be received by lessor in next rolling twelve months following latest statement of financial position date for operating lease. For interim and annual periods when interim periods are reported on rolling approach, from latest statement of financial position date. Reference 1: http://www.xbrl.org/2009/role/commonPracticeRef
-Topic 842
-SubTopic 30
-Name Accounting Standards Codification
-Section 50
-Paragraph 12
-Publisher FASB
-URI https://asc.fasb.org//1943274/2147479773/842-30-50-12
| Name: |
us-gaap_LessorOperatingLeasePaymentsToBeReceivedNextRollingTwelveMonths |
| Namespace Prefix: |
us-gaap_ |
| Data Type: |
xbrli:monetaryItemType |
| Balance Type: |
debit |
| Period Type: |
instant |
|
| X |
- DefinitionAmount of lease payments to be received by lessor in fifth rolling twelve months following latest statement of financial position date for operating lease. For interim and annual periods when interim periods are reported on rolling approach, from latest statement of financial position date. Reference 1: http://www.xbrl.org/2009/role/commonPracticeRef
-Topic 842
-SubTopic 30
-Name Accounting Standards Codification
-Section 50
-Paragraph 12
-Publisher FASB
-URI https://asc.fasb.org//1943274/2147479773/842-30-50-12
| Name: |
us-gaap_LessorOperatingLeasePaymentsToBeReceivedRollingYearFive |
| Namespace Prefix: |
us-gaap_ |
| Data Type: |
xbrli:monetaryItemType |
| Balance Type: |
debit |
| Period Type: |
instant |
|
| X |
- DefinitionAmount of lease payments to be received by lessor in fourth rolling twelve months following latest statement of financial position date for operating lease. For interim and annual periods when interim periods are reported on rolling approach, from latest statement of financial position date. Reference 1: http://www.xbrl.org/2009/role/commonPracticeRef
-Topic 842
-SubTopic 30
-Name Accounting Standards Codification
-Section 50
-Paragraph 12
-Publisher FASB
-URI https://asc.fasb.org//1943274/2147479773/842-30-50-12
| Name: |
us-gaap_LessorOperatingLeasePaymentsToBeReceivedRollingYearFour |
| Namespace Prefix: |
us-gaap_ |
| Data Type: |
xbrli:monetaryItemType |
| Balance Type: |
debit |
| Period Type: |
instant |
|
| X |
- DefinitionAmount of lease payments to be received by lessor in third rolling twelve months following latest statement of financial position date for operating lease. For interim and annual periods when interim periods are reported on rolling approach, from latest statement of financial position date. Reference 1: http://www.xbrl.org/2009/role/commonPracticeRef
-Topic 842
-SubTopic 30
-Name Accounting Standards Codification
-Section 50
-Paragraph 12
-Publisher FASB
-URI https://asc.fasb.org//1943274/2147479773/842-30-50-12
| Name: |
us-gaap_LessorOperatingLeasePaymentsToBeReceivedRollingYearThree |
| Namespace Prefix: |
us-gaap_ |
| Data Type: |
xbrli:monetaryItemType |
| Balance Type: |
debit |
| Period Type: |
instant |
|
| X |
- DefinitionAmount of lease payments to be received by lessor in second rolling twelve months following latest statement of financial position date for operating lease. For interim and annual periods when interim periods are reported on rolling approach, from latest statement of financial position date. Reference 1: http://www.xbrl.org/2009/role/commonPracticeRef
-Topic 842
-SubTopic 30
-Name Accounting Standards Codification
-Section 50
-Paragraph 12
-Publisher FASB
-URI https://asc.fasb.org//1943274/2147479773/842-30-50-12
| Name: |
us-gaap_LessorOperatingLeasePaymentsToBeReceivedRollingYearTwo |
| Namespace Prefix: |
us-gaap_ |
| Data Type: |
xbrli:monetaryItemType |
| Balance Type: |
debit |
| Period Type: |
instant |
|
v3.23.3
Commitments, Contingencies and Guarantees - Narrative (Details)
ft² in Thousands, $ in Thousands |
9 Months Ended |
|
|
Sep. 30, 2023
USD ($)
ft²
property
apartment
building
|
Dec. 31, 2022
USD ($)
|
| Other Commitments [Line Items] |
|
|
| Number of buildings containing asbestos | building |
33
|
|
| Principal balance |
$ 5,570,259
|
$ 5,220,902
|
| Partnership X |
|
|
| Other Commitments [Line Items] |
|
|
| Maximum future payments under swap agreement |
2,900
|
|
| Partnership X | Floating rate term loan |
|
|
| Other Commitments [Line Items] |
|
|
| Principal balance |
$ 115,000
|
|
| Maturity date |
Sep. 14, 2028
|
|
| Loan agreement SOFR floor |
0
|
|
| Number of properties to secure loan | property |
2
|
|
| Partnership X | Floating rate term loan | Interest Rate Swap |
|
|
| Other Commitments [Line Items] |
|
|
| Fixed interest rate |
2.19%
|
|
| Swap Maturity Date |
Oct. 01, 2026
|
|
| Partnership X | Floating rate term loan | SOFR |
|
|
| Other Commitments [Line Items] |
|
|
| Variable interest rate |
1.46%
|
|
| Repositionings, Capital Expenditure Projects, and Tenant Improvements |
|
|
| Other Commitments [Line Items] |
|
|
| Aggregate remaining contractual commitment |
$ 15,000
|
|
| Development Projects |
|
|
| Other Commitments [Line Items] |
|
|
| Aggregate remaining contractual commitment |
$ 19,300
|
|
| Development Projects | Hawaii |
|
|
| Other Commitments [Line Items] |
|
|
| Retail square footage (sq ft) | ft² |
493
|
|
| Number of apartments under construction | apartment |
493
|
|
| X |
- DefinitionDebt Instrument, Collateral, Number Of Properties
| Name: |
nysedei_DebtInstrumentCollateralNumberOfProperties |
| Namespace Prefix: |
nysedei_ |
| Data Type: |
xbrli:integerItemType |
| Balance Type: |
na |
| Period Type: |
instant |
|
| X |
- DefinitionDebt Instrument, SOFR Floor Interest Rate
| Name: |
nysedei_DebtInstrumentSOFRFloorInterestRate |
| Namespace Prefix: |
nysedei_ |
| Data Type: |
xbrli:pureItemType |
| Balance Type: |
na |
| Period Type: |
duration |
|
| X |
- DefinitionNumber Of Apartments Under Construction
| Name: |
nysedei_NumberOfApartmentsUnderConstruction |
| Namespace Prefix: |
nysedei_ |
| Data Type: |
xbrli:integerItemType |
| Balance Type: |
na |
| Period Type: |
duration |
|
| X |
- DefinitionNumber Of Properties Containing Asbestos
| Name: |
nysedei_NumberOfPropertiesContainingAsbestos |
| Namespace Prefix: |
nysedei_ |
| Data Type: |
xbrli:integerItemType |
| Balance Type: |
na |
| Period Type: |
duration |
|
| X |
- DefinitionArea of a real estate property.
| Name: |
us-gaap_AreaOfRealEstateProperty |
| Namespace Prefix: |
us-gaap_ |
| Data Type: |
dtr-types:areaItemType |
| Balance Type: |
na |
| Period Type: |
instant |
|
| X |
- DefinitionAmount of contractual obligation, including, but not limited to, long-term debt, lease obligation, purchase obligation, and other commitments. Reference 1: http://www.xbrl.org/2009/role/commonPracticeRef
-Topic 235
-SubTopic 10
-Name Accounting Standards Codification
-Section S99
-Paragraph 3
-Publisher FASB
-URI https://asc.fasb.org//1943274/2147480678/235-10-S99-3
| Name: |
us-gaap_ContractualObligation |
| Namespace Prefix: |
us-gaap_ |
| Data Type: |
xbrli:monetaryItemType |
| Balance Type: |
credit |
| Period Type: |
instant |
|
| X |
- DefinitionPercentage points added to the reference rate to compute the variable rate on the debt instrument.
| Name: |
us-gaap_DebtInstrumentBasisSpreadOnVariableRate1 |
| Namespace Prefix: |
us-gaap_ |
| Data Type: |
dtr-types:percentItemType |
| Balance Type: |
na |
| Period Type: |
duration |
|
| X |
- DefinitionAmount, before unamortized (discount) premium and debt issuance costs, of long-term debt. Includes, but is not limited to, notes payable, bonds payable, commercial loans, mortgage loans, convertible debt, subordinated debt and other types of debt. Reference 1: http://fasb.org/us-gaap/role/ref/legacyRef
-Name Accounting Standards Codification
-Section S99
-Paragraph 1
-Subparagraph (SX 210.5-02(22))
-SubTopic 10
-Topic 210
-Publisher FASB
-URI https://asc.fasb.org//1943274/2147480566/210-10-S99-1
Reference 2: http://fasb.org/us-gaap/role/ref/legacyRef
-Topic 942
-SubTopic 210
-Name Accounting Standards Codification
-Section S99
-Paragraph 1
-Subparagraph (SX 210.9-03(16))
-Publisher FASB
-URI https://asc.fasb.org//1943274/2147479853/942-210-S99-1
Reference 3: http://www.xbrl.org/2003/role/disclosureRef
-Topic 470
-SubTopic 20
-Name Accounting Standards Codification
-Section 50
-Paragraph 4
-Subparagraph (b)(1)
-Publisher FASB
-URI https://asc.fasb.org//1943274/2147481139/470-20-50-4
| Name: |
us-gaap_DebtInstrumentCarryingAmount |
| Namespace Prefix: |
us-gaap_ |
| Data Type: |
xbrli:monetaryItemType |
| Balance Type: |
credit |
| Period Type: |
instant |
|
| X |
- DefinitionDate when the debt instrument is scheduled to be fully repaid, in YYYY-MM-DD format. Reference 1: http://www.xbrl.org/2003/role/exampleRef
-Topic 470
-SubTopic 20
-Name Accounting Standards Codification
-Section 50
-Paragraph 1B
-Subparagraph (d)
-Publisher FASB
-URI https://asc.fasb.org//1943274/2147481139/470-20-50-1B
Reference 2: http://www.xbrl.org/2009/role/commonPracticeRef
-Topic 820
-SubTopic 10
-Name Accounting Standards Codification
-Section 50
-Paragraph 2
-Subparagraph (bbb)(2)
-Publisher FASB
-URI https://asc.fasb.org//1943274/2147482106/820-10-50-2
Reference 3: http://www.xbrl.org/2003/role/disclosureRef
-Name Accounting Standards Codification
-Section S99
-Paragraph 1
-Subparagraph (SX 210.5-02.22(a)(2))
-SubTopic 10
-Topic 210
-Publisher FASB
-URI https://asc.fasb.org//1943274/2147480566/210-10-S99-1
| Name: |
us-gaap_DebtInstrumentMaturityDate |
| Namespace Prefix: |
us-gaap_ |
| Data Type: |
xbrli:dateItemType |
| Balance Type: |
na |
| Period Type: |
duration |
|
| X |
- DefinitionFixed interest rate related to the interest rate derivative.
| Name: |
us-gaap_DerivativeFixedInterestRate |
| Namespace Prefix: |
us-gaap_ |
| Data Type: |
dtr-types:percentItemType |
| Balance Type: |
na |
| Period Type: |
instant |
|
| X |
- DefinitionDate derivative contract ends, in YYYY-MM-DD format. Reference 1: http://www.xbrl.org/2003/role/disclosureRef
-Topic 946
-SubTopic 210
-Name Accounting Standards Codification
-Section 50
-Paragraph 6
-Subparagraph (e)
-Publisher FASB
-URI https://asc.fasb.org//1943274/2147480524/946-210-50-6
Reference 2: http://www.xbrl.org/2003/role/exampleRef
-Topic 946
-SubTopic 210
-Name Accounting Standards Codification
-Section 55
-Paragraph 1
-Publisher FASB
-URI https://asc.fasb.org//1943274/2147480493/946-210-55-1
Reference 3: http://www.xbrl.org/2003/role/disclosureRef
-Topic 946
-SubTopic 210
-Name Accounting Standards Codification
-Section 50
-Paragraph 6
-Subparagraph (f)
-Publisher FASB
-URI https://asc.fasb.org//1943274/2147480524/946-210-50-6
Reference 4: http://www.xbrl.org/2003/role/disclosureRef
-Topic 946
-SubTopic 320
-Name Accounting Standards Codification
-Section S99
-Paragraph 5
-Subparagraph (SX 210.12-13(Column A)(Footnote 3))
-Publisher FASB
-URI https://asc.fasb.org//1943274/2147480032/946-320-S99-5
Reference 5: http://www.xbrl.org/2003/role/disclosureRef
-Topic 946
-SubTopic 320
-Name Accounting Standards Codification
-Section S99
-Paragraph 5C
-Subparagraph (SX 210.12-13C(Column D))
-Publisher FASB
-URI https://asc.fasb.org//1943274/2147480032/946-320-S99-5C
Reference 6: http://www.xbrl.org/2003/role/disclosureRef
-Topic 946
-SubTopic 320
-Name Accounting Standards Codification
-Section S99
-Paragraph 5
-Subparagraph (SX 210.12-13(Column F))
-Publisher FASB
-URI https://asc.fasb.org//1943274/2147480032/946-320-S99-5
Reference 7: http://www.xbrl.org/2003/role/disclosureRef
-Topic 946
-SubTopic 320
-Name Accounting Standards Codification
-Section S99
-Paragraph 5A
-Subparagraph (SX 210.12-13A(Column C))
-Publisher FASB
-URI https://asc.fasb.org//1943274/2147480032/946-320-S99-5A
Reference 8: http://www.xbrl.org/2003/role/disclosureRef
-Topic 946
-SubTopic 320
-Name Accounting Standards Codification
-Section S99
-Paragraph 5B
-Subparagraph (SX 210.12-13B(Column D))
-Publisher FASB
-URI https://asc.fasb.org//1943274/2147480032/946-320-S99-5B
| Name: |
us-gaap_DerivativeMaturityDates |
| Namespace Prefix: |
us-gaap_ |
| Data Type: |
xbrli:dateItemType |
| Balance Type: |
na |
| Period Type: |
duration |
|
| X |
- DefinitionMaximum potential amount of future payments (undiscounted) the guarantor could be required to make under the guarantee or each group of similar guarantees before reduction for potential recoveries under recourse or collateralization provisions. Reference 1: http://www.xbrl.org/2003/role/disclosureRef
-Topic 460
-SubTopic 10
-Name Accounting Standards Codification
-Section 50
-Paragraph 4
-Subparagraph (b)(1)
-Publisher FASB
-URI https://asc.fasb.org//1943274/2147482425/460-10-50-4
| Name: |
us-gaap_GuaranteeObligationsMaximumExposure |
| Namespace Prefix: |
us-gaap_ |
| Data Type: |
xbrli:monetaryItemType |
| Balance Type: |
credit |
| Period Type: |
instant |
|
| X |
- DefinitionLine items represent financial concepts included in a table. These concepts are used to disclose reportable information associated with domain members defined in one or many axes to the table.
| Name: |
us-gaap_OtherCommitmentsLineItems |
| Namespace Prefix: |
us-gaap_ |
| Data Type: |
xbrli:stringItemType |
| Balance Type: |
na |
| Period Type: |
duration |
|
| X |
- Details
| Name: |
srt_ScheduleOfEquityMethodInvestmentEquityMethodInvesteeNameAxis=nysedei_PartnershipXMember |
| Namespace Prefix: |
|
| Data Type: |
na |
| Balance Type: |
|
| Period Type: |
|
|
| X |
- Details
| Name: |
us-gaap_LongtermDebtTypeAxis=us-gaap_LoansPayableMember |
| Namespace Prefix: |
|
| Data Type: |
na |
| Balance Type: |
|
| Period Type: |
|
|
| X |
- Details
| Name: |
us-gaap_DerivativeInstrumentRiskAxis=us-gaap_InterestRateSwapMember |
| Namespace Prefix: |
|
| Data Type: |
na |
| Balance Type: |
|
| Period Type: |
|
|
| X |
- Details
| Name: |
us-gaap_VariableRateAxis=nysedei_SecuredOvernightFinancingRateSOFRMember |
| Namespace Prefix: |
|
| Data Type: |
na |
| Balance Type: |
|
| Period Type: |
|
|
| X |
- Details
| Name: |
us-gaap_OtherCommitmentsAxis=nysedei_RepositioningsCapitalExpenditureProjectsAndTenantImprovementsMember |
| Namespace Prefix: |
|
| Data Type: |
na |
| Balance Type: |
|
| Period Type: |
|
|
| X |
- Details
| Name: |
srt_MortgageLoansOnRealEstateDescriptionTypeOfPropertyAxis=nysedei_DevelopmentProjectsMember |
| Namespace Prefix: |
|
| Data Type: |
na |
| Balance Type: |
|
| Period Type: |
|
|
| X |
- Details
| Name: |
srt_StatementGeographicalAxis=stpr_HI |
| Namespace Prefix: |
|
| Data Type: |
na |
| Balance Type: |
|
| Period Type: |
|
|
Douglas Emmett (NYSE:DEI)
Historical Stock Chart
From Mar 2024 to Apr 2024

Douglas Emmett (NYSE:DEI)
Historical Stock Chart
From Apr 2023 to Apr 2024
