0000025475
false
0000025475
2023-09-14
2023-09-14
0000025475
us-gaap:CommonClassAMember
2023-09-14
2023-09-14
0000025475
us-gaap:CommonClassBMember
2023-09-14
2023-09-14
iso4217:USD
xbrli:shares
iso4217:USD
xbrli:shares
UNITED STATES
SECURITIES AND EXCHANGE COMMISSION
Washington, D.C. 20549
FORM 8-K
CURRENT REPORT
Pursuant to Section 13 or 15(d) of the Securities Exchange Act of 1934
Date of report (Date of earliest event reported): September 14, 2023
CRAWFORD & COMPANY
(Exact name of registrant as specified
in its charter)
| Georgia |
|
1-10356 |
|
58-0506554 |
|
(State or other jurisdiction
of incorporation) |
|
(Commission File Number) |
|
(IRS employer
Identification No.) |
| 5335 Triangle Parkway, Peachtree Corners, Georgia |
|
30092 |
| (Address of principal executive offices) |
|
(Zip Code) |
Registrant’s telephone number, including area code: (404) 300-1000
N/A
(Former name or former address, if changed
since last report)
Check the appropriate box below if the Form 8-K filing is intended
to simultaneously satisfy the filing obligation of the registrant under any of the following provisions:
|
¨ |
Written communications pursuant to Rule 425 under the Securities Act (17 CFR 230.425) |
|
¨ |
Soliciting material pursuant to Rule 14a-12 under the Exchange Act (17 CFR 240.14a-12) |
|
¨ |
Pre-commencement communications pursuant to Rule 14d-2(b) under the Exchange Act (17 CFR 240.14d-2(b)) |
|
¨ |
Pre-commencement communications pursuant to Rule 13e-4(c) under the Exchange Act (17 CFR 240.13e-4(c)) |
Securities Registered Pursuant to Section 12(b) of the Act:
| Title of each class |
Trading Symbol(s) |
Name of each exchange on which registered |
| Class
A Common Stock — $1.00 Par Value |
CRD-A |
New York Stock Exchange, Inc. |
| Class
B Common Stock — $1.00 Par Value |
CRD-B |
New York Stock Exchange, Inc. |
Indicate by check mark whether the registrant is an emerging
growth company as defined in Rule 405 of the Securities Act of 1933 (§230.405 of this chapter) or Rule 12b-2 of the Securities
Exchange Act of 1934 (§240.12b-2 of this chapter).
Emerging growth company ¨
If an emerging growth company, indicate by check mark if the
registrant has elected not to use the extended transition period for complying with any new or revised financial accounting standards
provided pursuant to Section 13(a) of the Exchange Act. ¨
Item 7.01. Regulation FD Disclosure.
At a conference on Thursday September 14, 2023, members of executive
management of Crawford & Company (the “Company”) are expected to present information about the Company to certain investors,
potential investors, and other interested parties. Attached as Exhibit 99.1 is a copy of the slide presentation that will be discussed
during the presentations. These materials may also be used by the Company at one or more subsequent conferences with investors, potential
investors or other interested parties after the date hereof.
Item 9.01. Financial Statements and Exhibits.
| (a) | Exhibits. The following exhibit is filed with this Report: |
The information contained in this current report on Form 8-K and in
the accompanying exhibits shall not be incorporated by reference into any filing of the Company with the SEC, whether made before or after
the date hereof, regardless of any general incorporation by reference language in such filing, unless expressly incorporated by specific
reference to such filing. The information, including the exhibits hereto, shall not be deemed to be “filed” for purposes of
Section 18 of the Securities Exchange Act of 1934, as amended, or otherwise subject to the liabilities of that section or Sections 11
and 12(a)(2) of the Securities Act of 1933, as amended.
SIGNATURES
Pursuant to the requirements of the Securities
Exchange Act of 1934, the registrant has duly caused this report to be signed on its behalf by the undersigned hereunto duly authorized.
| |
CRAWFORD & COMPANY |
| |
|
| |
By: |
/s/ W. BRUCE SWAIN |
| |
|
Name: W. Bruce Swain |
| |
|
Title:
Executive Vice President - Chief Financial Officer |
Date: September 14, 2023
Exhibit 99.1

September 2023 CRD - A & CRD - B (NYSE) ® Investor Presentation

2 Forward - Looking Statements & Additional Information SEPTEMBER 2023 Forward - Looking Statements This presentation contains forward - looking statements, including statements about the expected future financial condition, results of operations and earnings outlook of Crawford & Company. Statements, both qualitative and quantitative, that are not statements of historical fact may be "forward - looking statements" as defined in the Private Securities Litigation Reform Act of 1995 and other securities laws. Forward - looking statements involve a number of risks and uncertainties that could cause actual results to differ materially from historical experience or Crawford & Company's present expectations. Accordingly, no one should place undue reliance on forward - looking statements, which speak only as of the date on which they are made. Crawford & Company does not undertake to update forward - looking statements to reflect the impact of circumstances or events that may arise or not arise after the date the forward - looking statements are made. Results for any interim period presented herein are not necessarily indicative of results to be expected for the full year or for any other future period. For further information regarding Crawford & Company, and the risks and uncertainties involved in forward - looking statements, please read Crawford & Company's reports filed with the Securities and Exchange Commission and available at www.sec.gov or in the Investor Relations portion of Crawford & Company's website at https:// ir.crawco.com . Crawford's business is dependent, to a significant extent, on case volumes. The Company cannot predict the future trend of ca se volumes for a number of reasons, including the fact that the frequency and severity of weather - related claims and the occurrence of natural and man - made disasters, which are a significant source of cases and revenue for the Company, are generally not subject to accurate forecasting. Revenues Before Reimbursements ("Revenues") Revenues Before Reimbursements are referred to as "Revenues" in both consolidated and segment charts, bullets and tables throughout this presentation. Segment and Consolidated Operating Earnings Under the Financial Accounting Standards Board's Accounting Standards Codification ("ASC") Topic 280, "Segment Reporting," the Company has defined segment operating earnings as the primary measure used by the Company to evaluate the results of each of its four operating segments. Segment operating earnings represent segment earnings, including the direct and indirect costs of certain administrative functions required to operate our business, but excludes unallocated corporate and shared costs and credits, n et corporate interest expense, stock option expense, amortization of customer - relationship intangible assets, contingent earnout adjustments, non - service pension costs and credit s, income taxes and net income or loss attributable to noncontrolling interests. Earnings Per Share The Company's two classes of stock are substantially identical, except with respect to voting rights for the Class B Common Stock (CRD - B) and protections for the non - voting Class A Common Stock (CRD - A). More information available on the Company’s website. The two - class method is an earnings allocation method under which earnings per share ("EPS") is calculated for each class of common stock considering both dividends declared and participation rights in undistributed earnings as if all such earnings had been distributed during the period. As a result, t he Company may report different EPS for each class of stock due to the two - class method of computing EPS as required by ASC Topic 260 - "Earnings Per Share". Segment Gross Profit Segment gross profit is defined as revenues, less direct costs, which exclude indirect centralized administrative support cos ts allocated to the business. Indirect expenses consist of centralized administrative support costs, regional and local shared services that are allocated to each segment based on usage. Non - GAAP Financial Information For additional information about certain non - GAAP financial information presented herein, see the Appendix following this presentation.

3 3 The world’s largest publicly listed independent provider of global claims management solutions 63% ⎹ US 11% ⎹ UK 7% ⎹ Canada 7% ⎹ Australia 12% ⎹ Rest of the world BY MARKET¹ BY GLOBAL SERVICE LINES 35% ⎹ Corporations 65% ⎹ Carriers 2 0 % ⎹ Platform Solutions (US - only) 30 % ⎹ International Operations 2 6 % ⎹ Broadspire (US - only) 2 4 % ⎹ North America Loss Adjusting BY G EOGRAPHY SEPTEMBER 2023 (1) Reflects FY 2022; figures are approximate

4 4 Countries 70 Employees 10,000 50,000 Field Resources 1.6M Claims Handled Worldwide Global Reach; Trusted Partner SEPTEMBER 2023
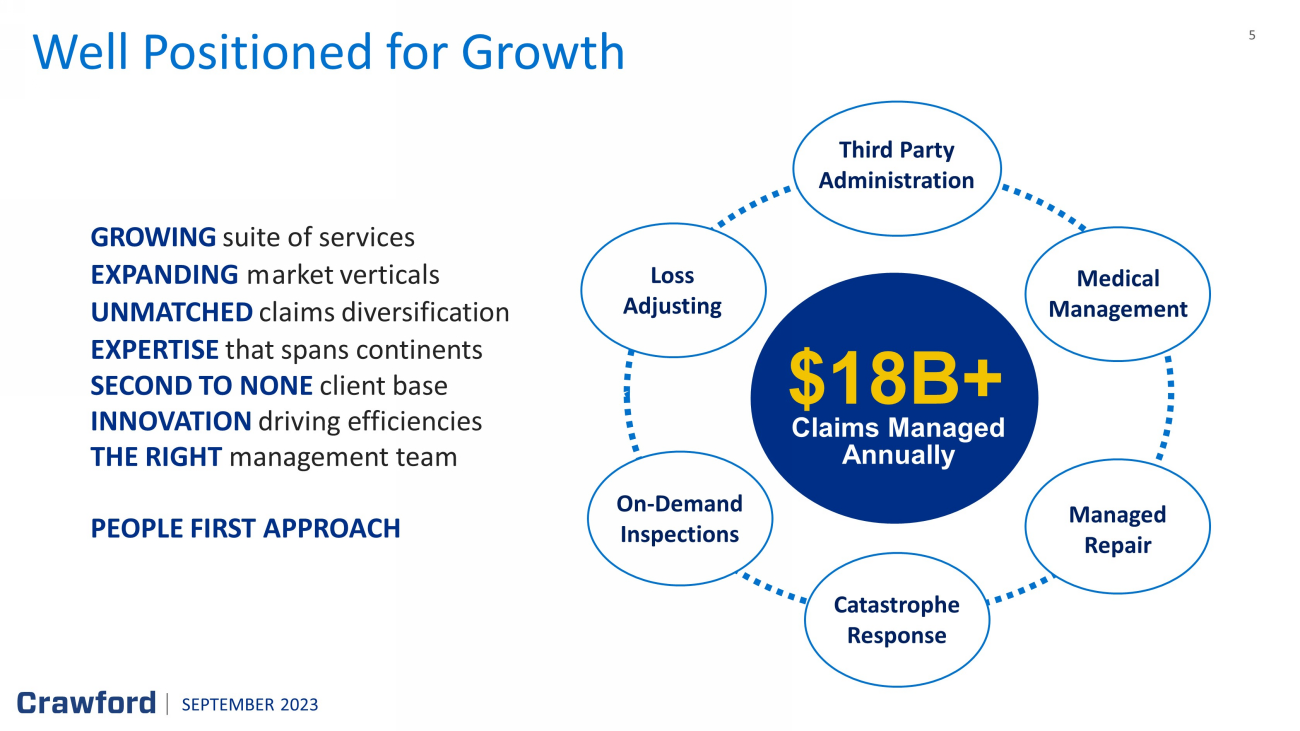
5 GROWING suite of services EXPANDING m arket verticals UNMATCHED claims diversification EXPERTISE that spans continents SECOND TO NONE client base INNOVATION driving efficiencies THE RIGHT management team PEOPLE FIRST APPROACH Managed Repair On - Demand Inspections Loss Adjusting Catastrophe Response Claims Managed Annually $18B+ Third Party Administration Medical Management SEPTEMBER 2023 Well Positioned for Growth

6 Financial Snapshot (1) See earnings presentation appendix for non - GAAP explanation and reconciliation of non - GAAP measures 8.0% EBITDA Margin $ 61.9M Operating Earnings $ 1.2B Revenues Before Reimbursements $ 27.6M Operating Cash Flow $ 94.7M Adjusted EBITDA $0.67 EPS for CRD - A & CRD - B FY 2022 GAAP 1H 2023 GAAP FY 2022 NON - GAAP 1 1H 2023 NON - GAAP 1 10.2% EBITDA Margin $ 47.7M Operating Earnings $ 633.7M Revenues Before Reimbursements $ 27.2M Operating Cash Flow $ 64.4M Adjusted EBITDA SEPTEMBER 2023 $0.52 EPS for CRD - A $0.53 EPS for CRD - B

7 Market Opportunity SEPTEMBER 2023

8 8 Climate change continues to drive global demand in weather - related claims Gaining market share within fragmented U.S. independent loss adjusting market Industry - leading Insurtech capabilities creating significant growth Growing and strengthening strategic partnerships across business segments Increased presence in rapidly growing P&C insurance markets with strong outsourced claims processing tailwinds Multiple Growth Drivers Benefitting Crawford SEPTEMBER 2023

9 $22B Damage from Western and Central drought / heat wave in 2022 2 7.6M U.S. acres burnt by wildfires in 2022 3 $313B 2022 economic losses due to global natural disasters 1 $50 - 55B Insured loss from Hurricane Ian; 2 nd costliest natural disaster for insurers on record 1 More Frequent and Destructive CAT Events Leading to Heightened Insured Losses Lahaina, HI, post - fire, obtained through MAXAR's High - Resolution Satellite Imagery SEPTEMBER 2023 Crawford uniquely positioned as insurance industry seeks cost effective solutions to address surge events that exceed their capacity 1 AON, 2023 Weather, Climate and Catastophe Insight 2 Climate.gov , Beyond the Data, January 2023 3 Congressional research service report, June 2023

10 10 92% 65% 15% 3% 17% SEPTEMBER 2023 C arriers find themselves at an inflection point as they face a continuing cycle of external and internal challenges: Crawford’s technology - enabled BPO platform solutions enable partners to achieve personalized customer interactions, reduce costs and conserve resources – allowing them to stay competitive in the new digital era • Inflation • G eopolitical headwinds • E nvironmental challenges • C apital constraints • Lack of geographic spread • Inability to drive technology innovation • Severe talent and expertise gap Fragmented P&C Market Driving Demand for Outsourcing Solutions

11 Contractor Network 2% Traditional 80% Network Low Touch Traditional 2022 Traditional: 70% Network/Virtual Desk: 30% Contractor Network 40% Virtual/On Demand 40% Traditional 20% 2030 Traditional: 20% Network/Virtual Desk: 80% Source: Crawford Internal Estimates Technology Advancements Driving Industry Transformation Contractor Network 20% Virtual/On Demand 10% Traditional 70% SEPTEMBER 2023 Traditional 8 0% Contractor Network 2% Fast Track Desk 18 % 2000 Traditional: 80% Network/Fast Track Desk: 20% Crawford is building a more efficient, data - driven, customer - focused future

12 Operational Overview SEPTEMBER 2023

13 13 International Operations Comprised of All Reported Service Lines Outside of North America: • UK • Europe • Australia • Asia • Latin America • Legal Services 30% of YTD revenues Broadspire (U.S. - only) Platform Solutions (U.S. - only) Third Party Administration for: • Workers' Compensation • Auto and Liability • Claims • Medical Management • Disability • RMIS • Accident and Health Service Lines Include: • Contractor Connection • Networks • Catastrophe • WeGoLook • Subrogation (Praxis) Comprised of the Following North American Service Lines: • US GTS • US Field Ops • Canada Loss Adjusting • Canada TPA • Canada Contractor Connection • edjuster North America Loss Adjusting 24% of YTD revenues 26% of YTD revenues 20% of YTD revenues Operating Segments SEPTEMBER 2023
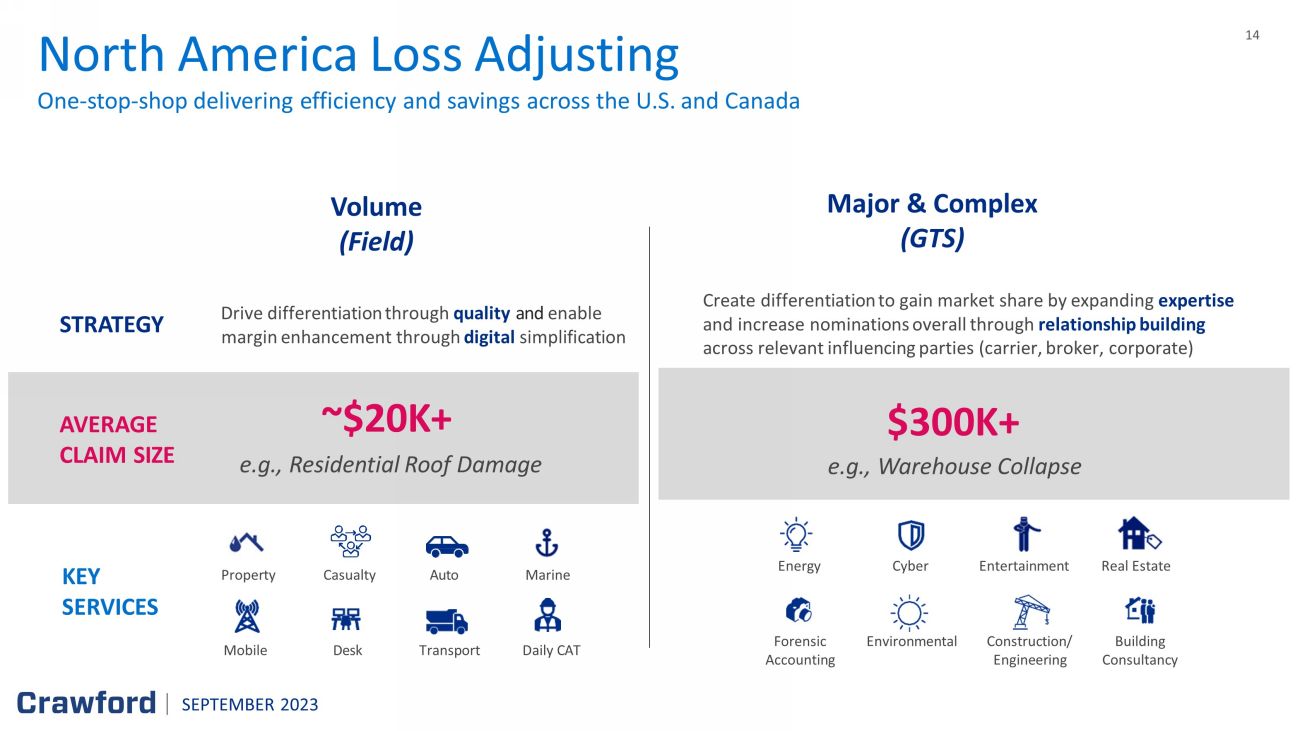
14 O ne - stop - shop delivering efficiency and savings across the U.S. and Canada North America Loss Adjusting STRATEGY Drive differentiation through quality and enable margin enhancement through digital simplification Create differentiation to gain market share by expanding expertise and increase nominations overall through relationship building across relevant influencing parties (carrier, broker, corporate) AVERAGE CLAIM SIZE KEY SERVICES Major & Complex (GTS) Volume (Field) Energy Construction/ Engineering Cyber Real Estate Environmental Forensic Accounting Entertainment Building Consultancy Property Transport Casualty Marine Desk Mobile Auto Daily CAT ~ $ 20 K + e.g., Residential Roof Damage $300K+ e.g., Warehouse Collapse SEPTEMBER 2023

15 15 Volume Claims A Growing & Engaged Adjuster Network Long - term strategy focused on becoming the industry benchmark in quality and expertise • Drive differentiation and enable margin enhancement using a combination of quality and digital simplification • High growth areas like mid - tier commercial $20 - $100K losses provide ample share gain opportunities driven by client need for a technical and relational adjuster skill set complemented by select use of technology solutions Exceeded our goal of 200+ expert hires in less than three years 1 Major and Complex Claims • Grow organically by creating differentiation to gain market share by expanding expertise and increasing nominations through brokers • Relatively price inelastic and driven by unique expertise (1) Includes International Loss Adjusting SEPTEMBER 2023 FY 2021 FY 2022 1H 202 3 86 109 49 244

16 International Operations : One Crawford Sharing expertise & capabilities across geographies SEPTEMBER 2023 Crawford revenue by geographic region UK • TPA business spearheading growth AUS • Frequency and severity of natural disasters continues to increase • Efficiency improvement measures in Europe driving increased margins EU • Thailand large losses plus volume improvements in Hong Kong and Singapore leading to increase in profitability ASIA • Strong performance in Chile & Brazil driving region’s growth LATAM 3% 11% 7% 7% 2% 70%

17 * Figures are approximat e C lient - centric integrated outsourced solutions powered by innovation and data science Broadspire (U.S. - only) Clients Scope & Scale Value Proposition Corporations, municipalities • MGAs, Program Managers, Captives • Carriers of all sizes • 50%+ U.S. Fortune 250 corp . • $1.0B+ Managed medical spend • $3B+ Claims paid • ~500,000 Claims managed • Strengthen differentiation through product innovation, digitization & scaling SEPTEMBER 2023 Workers Compensation Auto/ Motor Accident & Health Affinity/ Warranty General Liability Product Liability & Recall Employers Liability Medical Management Disability & Leave Technology Solutions

18 Platform Solutions Investing to Drive Innovation and Accelerate Growth

19 Technology enabled network of resources reduces allocated adjustment expense Automated triage channeling & segmentation of claims to best resource E nables virtual adjusting, indemnity management & estimate accuracy which positively impact s loss ratio Digital claim intake leveraging AI for efficiency SEPTEMBER 2023 Platform Solutions : Next Generation Crawford FY 2022 Segment Operating Margin Transformational Driver Targeting double - digit growth over the next 3 - 5 years $243.7M FY 2022 Segment Revenue 14.7% Digital First Notice of Loss Digital Assist Inspection Services

20 20 Reimagining the Claims Process • Reduced claim lifecycle • Enhanced data / analytics • Improved quality • Increased transparency • Cost savings Key benefits: Delivering a turnkey experience: • Rapid intake • Seamless processing • Detailed reporting • Compliance and regulatory support IoT Robotic process a utomation API integrations Data visualization t ools Portals Machine learning IoT sensors / telematics / A lexa integration 3D virtual realities SEPTEMBER 2023

21 21 Advancing claims management through acquisitions, partnerships and proprietary technology Owned YouGoLook ® Partnerships Renovo ® SEPTEMBER 2023

22 Making the claim journey better A better customer experience Settle claims more quickly and improve the visibility of claim status Better operational efficiency Deliver more accuracy, lower cost and shorter processing times Richer data, better insights Uncover trends, manage risk and deliver better outcomes Ease of integration Connect seamlessly to technology solutions for any part of the claim’s lifecycle

23 Financial Update SEPTEMBER 2023 Q2 2023 Results

24 24 • 11 th consecutive quarter of revenue growth • Revenue growth across ALL business segments • Net income increased by nearly 50% YoY • Operating earnings up 85% YoY • Margin expansion and improved profitability • Added $26 million in new and enhanced business • $40 million increase in operating cash flow • Returning capital to shareholders; raised quarterly dividend to $0.07 per share for the third quarter YoY Revenue Growth Q2 2023 Highlights 9% YoY Non - GAAP Adjusted Operating Earnings Growth* 85% $293M $321M $12M $ 23M * See Appendix for non - GAAP explanation and reconciliation 2Q ‘22 2Q ‘23 2Q ‘22 2Q ‘23 SEPTEMBER 2023

25 25 Margin Improvement Strategy Driving Results Q2 2023 Increased YoY Operating Margins Across Business Segments International Operations 3.9% +463 bps Broadspire 9.7% +14 bps North America Loss Adjusting 5.1% +112 bps +380bps 12.3% Platform Solutions 1. Align pricing with the value we deliver 2. Aggressively address low productivity pockets 3. Optimize cost structure to current market dynamics 4. Roll out new systems and improved processes for efficiency gains SEPTEMBER 2023
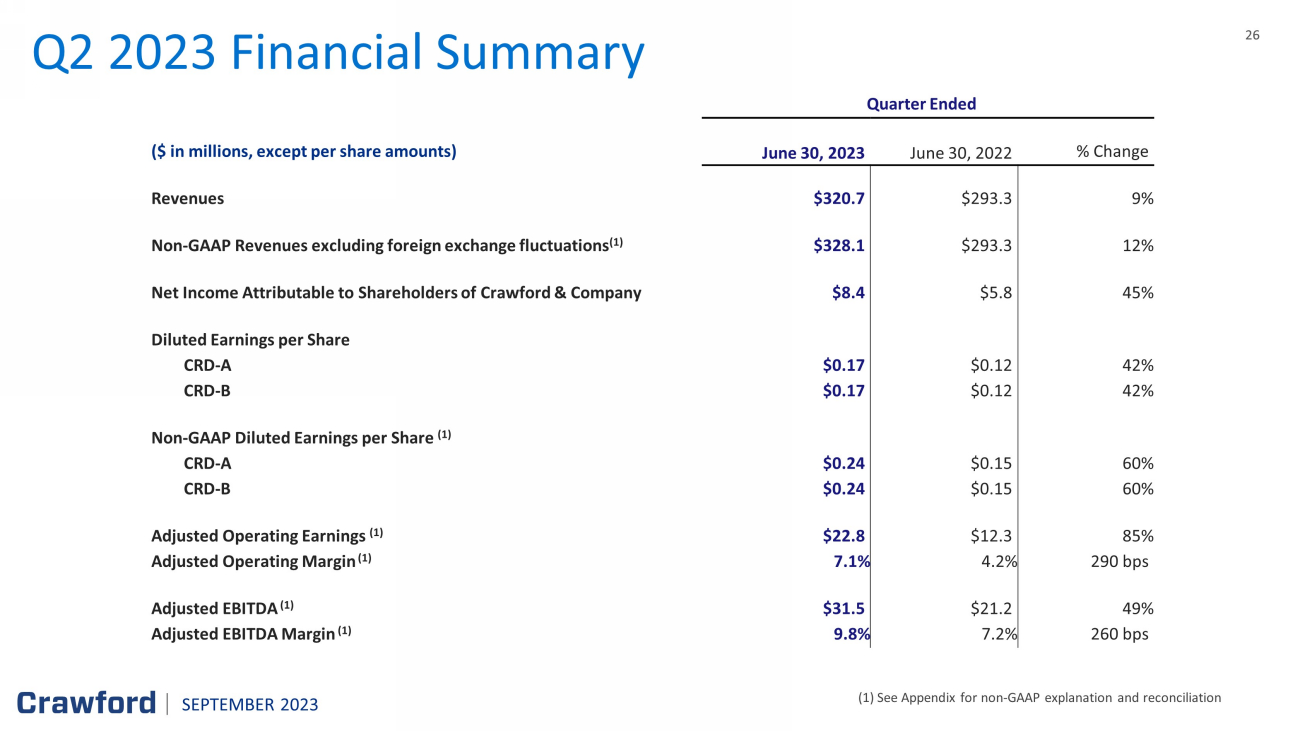
26 26 Q2 2023 Financial Summary (1) See Appendix for non - GAAP explanation and reconciliation Quarter Ended ($ in millions, except per share amounts) June 30 , 2023 June 30 , 2022 % Change Revenues $ 320.7 $ 293.3 9% Non - GAAP Revenues excluding foreign exchange fluctuations (1) $ 328.1 $ 293.3 12% Net Income Attributable to Shareholders of Crawford & Company $ 8.4 $5.8 45% Diluted Earnings per Share CRD - A $ 0.17 $0.12 42% CRD - B $ 0.17 $ 0.12 42% Non - GAAP Diluted Earnings per Share ( 1 ) CRD - A $ 0.24 $ 0.15 60% CRD - B $ 0.24 $ 0.15 60% Adjusted Operating Earnings (1) $ 22.8 $ 12.3 85% Adjusted Operating Margin (1) 7.1 % 4.2 % 290 bps Adjusted EBITDA (1) $ 31.5 $ 21.2 49% Adjusted EBITDA Margin (1) 9.8 % 7.2 % 260 b p s SEPTEMBER 2023

27 27 North America Loss Adjusting Three months ended (in thousands, except percentages) June 30, 2023 June 30, 2022 Variance Revenues $ 75,827 $ 65,775 15.3 % Direct expenses 62,469 54,507 14.6 % Gross profit 13,358 11,268 18.5 % Indirect expenses 9,458 8,619 9.7% Operating earnings $ 3,900 $2,649 47.2% Gross profit margin 17.6% 17.1% 0.5 % Operating margin 5.1% 4.0% 1.1 % Total cases received 73,685 76,419 (3.6) % Full time equivalent employees 2,055 1,992 3.2% SEPTEMBER 2023

28 28 International Operations Three months ended (in thousands, except percentages) June 30, 2023 June 30, 2022 Variance Revenues $ 95,312 $ 93,710 1.7% Direct expenses 78,281 80,297 (2.5)% Gross profit 17,031 13,413 27.0% Indirect expenses 13,289 14,074 (5.6)% Operating earnings (loss) $ 3,742 $(661) nm Gross profit margin 17.9% 14.3% 3.6% Operating margin 3.9% (0.7)% 4.6% Total cases received 114,073 147,297 (22.6) % Full time equivalent employees 3,643 3,625 0.5 % SEPTEMBER 2023

29 29 Broadspire Three months ended (in thousands, except percentages) June 30, 2023 June 30, 2022 Variance Revenues $ 83,888 $ 80,114 4.7 % Direct expenses 64,128 62,383 2.8% Gross profit 19,760 17,731 11.4% Indirect expenses 11,612 10,064 15.4% Operating earnings $ 8,148 $ 7,667 6.3% Gross profit margin 23.6% 22.1% 1.5% Operating margin 9.7% 9.6% 0.1% Total cases received 143,448 139,123 3.1% Full time equivalent employees 2,614 2,463 6.1 % SEPTEMBER 2023

30 30 Platform Solutions Three months ended (in thousands, except percentages) June 30, 2023 June 30, 2022 Variance Revenues $ 65,638 $ 53,746 22.1% Direct expenses 51,726 43,895 17.8% Gross profit 13,912 9,851 41.2% Indirect expenses 5,806 5,255 10.5% Operating earnings $ 8,106 $ 4,596 76.4 % Gross profit margin 21.2% 18.3% 2.9 % Operating margin 12.3% 8.6% 3.7 % Total cases received 116,131 117,867 (1.5)% Full time equivalent employees 1,473 1,224 20.3 % SEPTEMBER 2023

31 31 Balance Sheet Highlights (1) See Appendix for non - GAAP explanation and reconciliation Unaudited ($ in thousands) June 30, 2023 Dec 31, 20 22 Change Cash and cash equivalents $ 47,479 $ 46,007 $ 1,472 Accounts receivable, net 160,333 141,106 19,227 Unbilled revenues, net 129,121 126,274 2,847 Total receivables 289,454 267,380 22,074 Goodwill 76,720 76,622 98 Intangible assets arising from business acquisitions, net 86,852 88,039 (1,187 ) Deferred revenues 59,422 54,019 5,403 Pension liabilities 25,250 25,914 (664 ) Short - term borrowings and current portion of finance leases 30,552 27,048 3,504 Long - term debt, less current portion 212,217 211,810 407 Total debt 242,769 238,858 3,911 Total stockholders' equity attributable to Crawford & Company 151,358 124,543 26,815 Net debt (1) 195,290 192,851 2,439 SEPTEMBER 2023

32 32 Net Debt and Pension Liability - 50,000 100,000 150,000 200,000 250,000 2017 2018 2019 2020 2021 2022 Q2 2023 Net Debt $195.3M Net debt at $195.3 million $171.7M Leverage Ratio of 1.80x EBITDA at end of Q2 2023 - 10,000 20,000 30,000 40,000 50,000 60,000 70,000 80,000 90,000 100,000 2017 2018 2019 2020 2021 2022 Q2 2023 Pension Liability $25.3M Pension liability at $25.3 million $87.0M Funded Ratio of US pension plan is 93.4% at end of Q2 2023 SEPTEMBER 2023

33 33 Operating and Free Cash Flow (1) See Appendix for non - GAAP explanation and reconciliation Unaudited ($ in thousands) 20 23 20 22 Change Net Income Attributable to Shareholders of Crawford & Company $ 19,108 $ 10,926 $ 8,182 Depreciation and Other Non - Cash Operating Items 20,817 21,932 (1,115 ) Loss (Gain) on Disposals of Property and Equipment, net 116 (1,544) 1,660 Contingent Earnout Adjustments 973 2,359 (1,386 ) Billed Receivables Change (15,107 ) 1,241 (16,348 ) Unbilled Receivables Change 1,828 (27,557 ) 29,385 Change in Accrued Compensation , 401K , and Other Payroll (5,563 ) (16,805 ) 11,242 Change in Accrued and Prepaid Income Taxes (1,217 ) (5,275 ) 4,058 Other Working Capital Changes 7,239 2,296 4,943 U.K. Pension Contributions ( 1,025 ) (325 ) (700 ) Cash Flows from Operating Activities 27,169 (12,752 ) 39,921 Property & Equipment Purchases, net (1,914 ) (3,123 ) 1,209 Capitalized Software (internal and external costs) ( 16,031 ) (12,561 ) (3,470 ) Free Cash Flow (1) $ 9,224 $ (28,436 ) $ 37,660 SEPTEMBER 2023

34 34 Our Capital Allocation Strategy Committed to Employing a Disciplined Approach to Capital Allocation Investing in long - term growth through Cap Ex and M&A Debt Repayment Reduce leverage (1.80x EBITDA in Q2 2023) Raised quarterly dividend to $0.07 per share for CRD - A and CRD - B Returned over $120 million of capital to shareholders through share buybacks and dividends since 2019 SEPTEMBER 2023

35 M&A Overview Our M&A is aligned to the three pillars of our strategy Digital • Bring digital enablement • Short circuit lead times • Differentiated and entrenched • Improve customer experience Quality • Enhance the quality value proposition • Usually in tandem with Digital or Expertise Expertise • Special capability in the claims ' ecosystem • People or process based HBA Legal Crawford Carvallo BosBoon R.P. van Dijk B.V. Complement primary organic growth Increase customer stickiness and deepen market share Deliver improved profitability and productivity SEPTEMBER 2023

36 36 Financial strength and liquidity provide flexibility to pursue market opportunities Leveraging established relationships with carriers to create “sticky” revenue Positioned to capitalize on the changing landscape due to climate change and demographic shifts Leading the industry with next generation Insurtech capabilities Summary SEPTEMBER 2023

37 Appendix: Non - GAAP Financial Information 37 SEPTEMBER 2023

38 38 Non - GAAP Financial Information Measurements of financial performance not calculated in accordance with GAAP should be considered as supplements to, and not sub stitutes for, performance measurements calculated or derived in accordance with GAAP. Any such measures are not necessarily comparable to o the r similarly - titled measurements employed by other companies. Reimbursements for Out - of - Pocket Expenses In the normal course of our business, our operating segments incur certain out - of - pocket expenses that are thereafter reimbursed by our clients. Under GAAP, these out - of - pocket expenses and associated reimbursements are required to be included when reporting expenses and revenue s, respectively, in our consolidated results of operations. In this presentation, we do not believe it is informative to include in reported r eve nues the amounts of reimbursed expenses and related revenues, as they offset each other in our consolidated results of operations with no impact to our net income or operating earnings. As a result, unless noted in this presentation, revenue and expense amounts exclude reimbursements for ou t - o f - pocket expenses. Net Debt Net debt is computed as the sum of long - term debt, capital leases and short - term borrowings less cash and cash equivalents. Mana gement believes that net debt is useful because it provides investors with an estimate of what the Company's debt would be if all available c ash was used to pay down the debt of the Company. The measure is not meant to imply that management plans to use all available cash to pay down debt . Free Cash Flow Management believes free cash flow is useful to investors as it presents the amount of cash the Company has generated that ca n b e used for other purposes, including additional contributions to the Company's defined benefit pension plans, discretionary prepayments of out sta nding borrowings under our credit agreement, and return of capital to shareholders, among other purposes. It does not represent the residual c ash flow of the Company available for discretionary expenditures. SEPTEMBER 2023

39 39 Non - GAAP Financial Information (cont.) Segment and Consolidated Operating Earnings Operating earnings is the primary financial performance measure used by our senior management and chief operating decision ma ker to evaluate the financial performance of our Company and operating segments and make resource allocation and certain compensation decisions. Management be lieves operating earnings is useful to others in that it allows them to evaluate segment and consolidated operating performance using the same cr iteria our management and chief operating decision maker use. Consolidated operating earnings represent segment earnings including certain unallocated cor porate and shared costs and credits, but before net corporate interest expense, stock option expense, amortization of customer - relationship intangible asset s, contingent earnout adjustments, non - service pension costs and credits, income taxes and net income or loss attributable to noncontrolling interests . Segment and Consolidated Gross Profit Gross profit is defined as revenues less direct expenses which exclude indirect overhead expenses allocated to the business. Ind irect expenses consist of centralized administrative support costs, regional and local shared services that are allocated to each segment based on usag e. Adjusted EBITDA Adjusted EBITDA is used by management to evaluate, assess and benchmark our operational results and the Company believes that ad justed EBITDA is relevant and useful information widely used by analysts, investors and other interested parties. Adjusted EBITDA is defined as net inc ome attributable to shareholders of the Company with recurring adjustments for depreciation and amortization, net corporate interest expense, contingent earnout adj ustments, non - service pension costs and credits, income taxes and stock - based compensation expense. Adjusted EBITDA is not a term defined by GAAP and as a result our measure of adjusted EBITDA might not be comparable to similarly titled measures used by other companies. Adjusted Revenue, Operating Earnings, Pretax Earnings, Net Income, Diluted Earnings per Share and EBITDA Included in non - GAAP adjusted measurements as an add back or subtraction to GAAP measurements, are impacts of amortization of cu stomer - relationship intangible assets, contingent earnout adjustments, and non - service pension costs and credits, which arise from non - core items no t directly related to our normal business or operations, or our future performance. Management believes it is useful to exclude these charges when comp ari ng net income and diluted earnings per share across periods, as these charges are not from ordinary operations. SEPTEMBER 2023

40 40 The following table illustrates revenue as a percentage of total revenue in the major currencies of the geographic areas in which Crawford does business: 2Q YTD ‘23 Total Revenue Before Reimbursements by Major Currency Six Months Ended ( in thousands ) June 30, 2023 June 30, 2022 Geographic Area Currency USD equivalent % of total USD equivalent % of total U.S. USD $ 398,014 62.8% $ 340,452 59.5% U.K. GBP 67,849 10.7% 67,485 11.8% Canada CAD 48,468 7.7% 48,936 8.5% Australia AUD 45,920 7.2 % 42,360 7.4% Europe EUR 28,339 4.5% 28,910 5.1% Rest of World Various 45,067 7.1% 44,227 7.7% Total Revenues, before reimbursements $ 633,657 100.0% $ 572,370 100.0% SEPTEMBER 2023

41 41 Revenues and Costs of Services Provided 2Q ‘23 Reconciliation of Non - GAAP Items Quarter Ended Quarter Ended Unaudited ($ in thousands) June 30 , 2023 June 30, 2022 Revenues Before Reimbursements Total Revenues $ 333,738 $ 303,651 Reimbursements (13,073 ) ( 10,306 ) Revenues Before Reimbursements 320,665 293,345 Costs of Services Provided, Before Reimbursements Total Costs of Services 247,104 228,440 Reimbursements ( 13,073 ) ( 10,306 ) Costs of Services Provided, Before Reimbursements $ 234,031 $ 218,134 SEPTEMBER 2023

42 42 Operating Earnings 2Q ‘23 Reconciliation of Non - GAAP Items (cont.) Quarter Ended Quarter Ended June 30 , 2023 June 30,2022 Unaudited ($ in thousands) North America Loss Adjusting $ 3,900 $ 2,649 International Operations 3,742 (661 ) Broadspire 8,148 7,667 Platform Solutions 8,106 4,596 Unallocated corporate and shared costs and credits, net (1,098 ) (1,945 ) Consolidated Operating Earnings 22,798 12,306 (Deduct) Add: Net corporate interest expense ( 4,309 ) (1,780 ) Stock option expense ( 139 ) ( 130 ) Amortization expense (1,979 ) ( 2,060 ) Non - service pension costs and credits (2,095 ) 572 Contingent earnout adjustments (725 ) (303 ) Income ta x provision (5,206 ) (2,768 ) Net loss (income) attributable to noncontrolling interests 82 (7 ) Net Inc ome Attributable to Shareholders of Crawford & Company $ 8,427 $ 5,830 SEPTEMBER 2023

43 43 Adjusted EBITDA 2Q ‘23 Reconciliation of Non - GAAP items (cont.) Quarter Ended Quarter Ended June 30 , 2023 June 30 , 2022 Unaudited ($ in thousands) Net income attributable to shareholders of Crawford & Company $ 8,427 $ 5,830 Add (Deduct) : Depreciation and amortization 9,191 9,356 Stock - based compensation 1,586 1,750 Net corporate interest expense 4,309 1,780 Non - service pension costs and credits 2,095 (572 ) Contingent earnout adjustments 725 303 Income tax provision 5,206 2,768 Adjusted EBITDA $ 31,539 $ 21,215 SEPTEMBER 2023

44 44 Net Debt 2Q ‘23 Non - GAAP Financial Information (cont.) June 30 , 2023 Dec 31, 2022 Unaudited ($ in thousands) Short - term borrowings $ 30,494 $ 26,990 Current installments of finance leases and other obligations 58 58 Long - term debt and finance leases, less current installments 212,217 211,810 Total debt 242,769 238,858 Less: Cash and cash equivalents 47,479 46,007 Net debt $ 195,290 $ 192,851 SEPTEMBER 2023

45 45 Segment Gross Profit 2Q ‘23 Non - GAAP Financial Information (cont.) Three months ended ( $ in thousands) June 30, 2023 June 30, 2022 North America Loss Adjusting $ 13,358 $ 11,268 International Operations 17,031 13,413 Broadspire 19,760 17,731 Platform Solutions 13,912 9,851 Segment gross profit 64,061 52,263 Segment indirect costs: North America Loss Adjusting ( 9,458 ) ( 8,619 ) International Operations ( 13,289 ) ( 14,074 ) Broadspire (11,612 ) ( 10,064 ) Platform Solutions (5,806 ) (5,255 ) Unallocated corporate and shared costs, net (1,098 ) (1,945 ) Consolidated operating earnings 22,798 12,306 Net corporate interest expense ( 4,309 ) ( 1,780 ) Stock option expense ( 139 ) ( 130 ) Amortization expense (1,979 ) ( 2,060 ) Non - service pension costs and credits (2,095 ) 572 Contingent earnout adjustments (725 ) (303 ) Income tax provision (5,206 ) (2,768 ) Net loss (income) attributable to noncontrolling interests 82 (7 ) Net income attributable to shareholders of Crawford & Company $ 8,427 $ 5,830 SEPTEMBER 2023

46 46 Operating Earnings 2Q YTD ‘23 Reconciliation of Non - GAAP Items Six Months Ended Six Months Ended June 30 , 2023 June 30,2022 Unaudited ($ in thousands) North America Loss Adjusting $ 11,965 $ 6,783 International Operations 6,777 (3,726 ) Broadspire 16,075 14,101 Platform Solutions 18,072 12,633 Unallocated corporate and shared costs and credits, net (5,217 ) (4,940 ) Consolidated Operating Earnings 47,672 24,851 (Deduct) Add: Net corporate interest expense ( 8,708 ) (3,298 ) Stock option expense ( 295 ) ( 336 ) Amortization expense (3,878 ) ( 3,786 ) Non - service pension costs and credits (4,266 ) 1,115 Contingent earnout adjustments (973 ) (2,359 ) Income ta x provision (10,477 ) (5,194 ) Net loss (income) attributable to noncontrolling interests 33 (67 ) Net Inc ome Attributable to Shareholders of Crawford & Company $ 19,108 $ 10,926 SEPTEMBER 2023

47 47 Adjusted EBITDA 2Q YTD ‘23 Reconciliation of Non - GAAP items (cont.) Six Months Ended Six Months Ended June 30 , 2023 June 30 , 2022 Unaudited ($ in thousands) Net income attributable to shareholders of Crawford & Company $ 19,108 $ 10,926 Add (Deduct) : Depreciation and amortization 18,241 18,455 Stock - based compensation 2,609 3,410 Net corporate interest expense 8,708 3,298 Non - service pension costs and credits 4,266 (1,115 ) Contingent earnout adjustments 973 2,359 Income tax provision 10,477 5,194 Adjusted EBITDA $ 64,382 $ 42,527 SEPTEMBER 2023

48 48 Operating Earnings 2022 Reconciliation of Non - GAAP Items Year Ended December 31, 2022 Unaudited ($ in thousands) North America Loss Adjusting $ 19,431 International Operations (13,269 ) Broadspire 27,021 Platform Solutions 35,746 Unallocated corporate and shared costs and credits, net (7,050 ) Consolidated Operating Earnings 61,879 (Deduct) Add: Net corporate interest expense (10,311 ) Stock option expense ( 548 ) Amortization expense ( 7,836 ) Goodwill impairment (36,808 ) Non - service pension credits 1,591 Contingent earnout adjustments (2,921 ) Reserves on certain income tax assets (11,767 ) Income ta x provision (11,811 ) Net loss attributable to noncontrolling interests 227 Net Loss Attributable to Shareholders of Crawford & Company $ (18,305 ) SEPTEMBER 2023

49 49 Adjusted EBITDA 2022 Reconciliation of Non - GAAP items (cont.) Year Ended December 31 , 2022 Unaudited ($ in thousands) Net loss attributable to shareholders of Crawford & Company $ (18,305 ) Add (Deduct) : Depreciation and amortization 36,098 Stock - based compensation 4,923 Net corporate interest expense 10,311 Goodwill impairment 36,808 Contingent earnout adjustments 2,921 Non - service pension credits (1,591 ) Reserves on certain income tax assets 11,767 Income tax provision 11,811 Adjusted EBITDA $ 94,743 SEPTEMBER 2023

50 50 Reconciliation of 2Q ‘23 Non - GAAP Results Three Months Ended June 30, 2023 Unaudited ($ in thousands) Pretax Earnings Net Income Attributable to Crawford & Company Diluted Earnings per CRD - A Share Diluted Earnings per CRD - B Share GAAP $ 13,551 $ 8,427 $ 0.17 $ 0.17 Adjustments: Amortization of intangible assets 1,979 1,484 0. 03 0. 03 Non - service - related pension costs 2,095 1,557 0.03 0.03 Contingent earnout adjustments 725 537 0.01 0.01 Non - GAAP Adjusted $ 18,350 $ 12,005 $ 0. 24 $ 0. 24 Three Months Ended June 30, 2022 Unaudited ($ in thousands) Pretax Earnings Net Income Attributable to Crawford & Company Diluted Earnings per CRD - A Share (1) Diluted Earnings per CRD - B Share (1) GAAP $ 8,605 $ 5,830 $ 0.12 $ 0.12 Adjustments: Amortization of intangible assets 2,060 1,545 0.03 0.03 Non - service - related pension credits (572 ) (444 ) (0.01 ) (0.01 ) Contingent earnout adjustments 303 224 — — Non - GAAP Adjusted $ 10,396 $ 7,155 $ 0. 15 $ 0.15 (1) Sum of reconciling items may differ from total due to rounding of individual components SEPTEMBER 2023
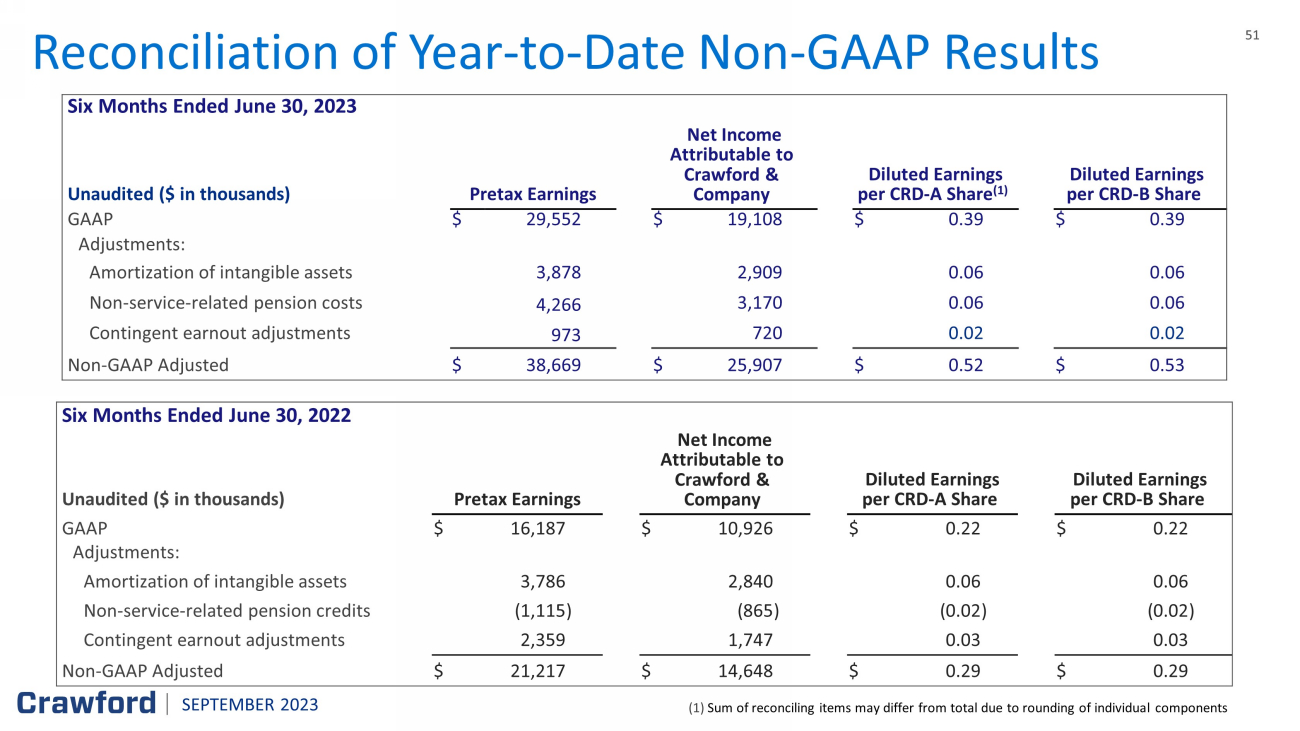
51 51 Reconciliation of Year - to - Date Non - GAAP Results Six Months Ended June 30, 2023 Unaudited ($ in thousands) Pretax Earnings Net Income Attributable to Crawford & Company Diluted Earnings per CRD - A Share (1) Diluted Earnings per CRD - B Share GAAP $ 29,552 $ 19,108 $ 0.39 $ 0.39 Adjustments: Amortization of intangible assets 3,878 2,909 0. 06 0. 06 Non - service - related pension costs 4,266 3,170 0.06 0.06 Contingent earnout adjustments 973 720 0.02 0.02 Non - GAAP Adjusted $ 38,669 $ 25,907 $ 0. 52 $ 0. 53 Six Months Ended June 30, 2022 Unaudited ($ in thousands) Pretax Earnings Net Income Attributable to Crawford & Company Diluted Earnings per CRD - A Share Diluted Earnings per CRD - B Share GAAP $ 16,187 $ 10,926 $ 0.22 $ 0.22 Adjustments: Amortization of intangible assets 3,786 2,840 0.06 0.06 Non - service - related pension credits (1,115 ) (865 ) (0.02 ) (0.02 ) Contingent earnout adjustments 2,359 1,747 0.03 0.03 Non - GAAP Adjusted $ 21,217 $ 14,648 $ 0. 29 $ 0.29 (1) Sum of reconciling items may differ from total due to rounding of individual components SEPTEMBER 2023

52 52 Reconciliation of Full - Year Non - GAAP Results Year Ended December 31, 2022 Unaudited ($ in thousands) Pretax Earnings Net (Loss) Income Attributable to Crawford & Company Diluted (Loss) Earnings per CRD - A Share Diluted Earnings (Loss) per CRD - B Share GAAP $ 5,046 $ (18,305 ) $ (0.37 ) $ (0.37 ) Adjustments: Amortization of intangible assets 7,836 5,877 0. 12 0. 12 Goodwill impairment 36,808 33,300 0.67 0.67 Non - service - related pension credits (1,591 ) (1,389 ) (0.03 ) (0.03 ) Contingent earnout adjustments 2,921 2,163 0.04 0.04 Reserves on certain income tax assets — 11,767 0.24 0.24 Non - GAAP Adjusted $ 51,020 $ 33,413 $ 0. 67 $ 0. 67 SEPTEMBER 2023

53 CRD - A & CRD - B (NYSE)
v3.23.2
| X |
- DefinitionBoolean flag that is true when the XBRL content amends previously-filed or accepted submission.
| Name: |
dei_AmendmentFlag |
| Namespace Prefix: |
dei_ |
| Data Type: |
xbrli:booleanItemType |
| Balance Type: |
na |
| Period Type: |
duration |
|
| X |
- DefinitionFor the EDGAR submission types of Form 8-K: the date of the report, the date of the earliest event reported; for the EDGAR submission types of Form N-1A: the filing date; for all other submission types: the end of the reporting or transition period. The format of the date is YYYY-MM-DD.
| Name: |
dei_DocumentPeriodEndDate |
| Namespace Prefix: |
dei_ |
| Data Type: |
xbrli:dateItemType |
| Balance Type: |
na |
| Period Type: |
duration |
|
| X |
- DefinitionThe type of document being provided (such as 10-K, 10-Q, 485BPOS, etc). The document type is limited to the same value as the supporting SEC submission type, or the word 'Other'.
| Name: |
dei_DocumentType |
| Namespace Prefix: |
dei_ |
| Data Type: |
dei:submissionTypeItemType |
| Balance Type: |
na |
| Period Type: |
duration |
|
| X |
- DefinitionAddress Line 1 such as Attn, Building Name, Street Name
| Name: |
dei_EntityAddressAddressLine1 |
| Namespace Prefix: |
dei_ |
| Data Type: |
xbrli:normalizedStringItemType |
| Balance Type: |
na |
| Period Type: |
duration |
|
| X |
- Definition
+ References
+ Details
| Name: |
dei_EntityAddressCityOrTown |
| Namespace Prefix: |
dei_ |
| Data Type: |
xbrli:normalizedStringItemType |
| Balance Type: |
na |
| Period Type: |
duration |
|
| X |
- DefinitionCode for the postal or zip code
| Name: |
dei_EntityAddressPostalZipCode |
| Namespace Prefix: |
dei_ |
| Data Type: |
xbrli:normalizedStringItemType |
| Balance Type: |
na |
| Period Type: |
duration |
|
| X |
- DefinitionName of the state or province.
| Name: |
dei_EntityAddressStateOrProvince |
| Namespace Prefix: |
dei_ |
| Data Type: |
dei:stateOrProvinceItemType |
| Balance Type: |
na |
| Period Type: |
duration |
|
| X |
- DefinitionA unique 10-digit SEC-issued value to identify entities that have filed disclosures with the SEC. It is commonly abbreviated as CIK. Reference 1: http://www.xbrl.org/2003/role/presentationRef
-Publisher SEC
-Name Exchange Act
-Number 240
-Section 12
-Subsection b-2
| Name: |
dei_EntityCentralIndexKey |
| Namespace Prefix: |
dei_ |
| Data Type: |
dei:centralIndexKeyItemType |
| Balance Type: |
na |
| Period Type: |
duration |
|
| X |
- DefinitionIndicate if registrant meets the emerging growth company criteria. Reference 1: http://www.xbrl.org/2003/role/presentationRef
-Publisher SEC
-Name Exchange Act
-Number 240
-Section 12
-Subsection b-2
| Name: |
dei_EntityEmergingGrowthCompany |
| Namespace Prefix: |
dei_ |
| Data Type: |
xbrli:booleanItemType |
| Balance Type: |
na |
| Period Type: |
duration |
|
| X |
- DefinitionCommission file number. The field allows up to 17 characters. The prefix may contain 1-3 digits, the sequence number may contain 1-8 digits, the optional suffix may contain 1-4 characters, and the fields are separated with a hyphen.
| Name: |
dei_EntityFileNumber |
| Namespace Prefix: |
dei_ |
| Data Type: |
dei:fileNumberItemType |
| Balance Type: |
na |
| Period Type: |
duration |
|
| X |
- DefinitionTwo-character EDGAR code representing the state or country of incorporation.
| Name: |
dei_EntityIncorporationStateCountryCode |
| Namespace Prefix: |
dei_ |
| Data Type: |
dei:edgarStateCountryItemType |
| Balance Type: |
na |
| Period Type: |
duration |
|
| X |
- DefinitionThe exact name of the entity filing the report as specified in its charter, which is required by forms filed with the SEC. Reference 1: http://www.xbrl.org/2003/role/presentationRef
-Publisher SEC
-Name Exchange Act
-Number 240
-Section 12
-Subsection b-2
| Name: |
dei_EntityRegistrantName |
| Namespace Prefix: |
dei_ |
| Data Type: |
xbrli:normalizedStringItemType |
| Balance Type: |
na |
| Period Type: |
duration |
|
| X |
- DefinitionThe Tax Identification Number (TIN), also known as an Employer Identification Number (EIN), is a unique 9-digit value assigned by the IRS. Reference 1: http://www.xbrl.org/2003/role/presentationRef
-Publisher SEC
-Name Exchange Act
-Number 240
-Section 12
-Subsection b-2
| Name: |
dei_EntityTaxIdentificationNumber |
| Namespace Prefix: |
dei_ |
| Data Type: |
dei:employerIdItemType |
| Balance Type: |
na |
| Period Type: |
duration |
|
| X |
- DefinitionLocal phone number for entity.
| Name: |
dei_LocalPhoneNumber |
| Namespace Prefix: |
dei_ |
| Data Type: |
xbrli:normalizedStringItemType |
| Balance Type: |
na |
| Period Type: |
duration |
|
| X |
- DefinitionBoolean flag that is true when the Form 8-K filing is intended to satisfy the filing obligation of the registrant as pre-commencement communications pursuant to Rule 13e-4(c) under the Exchange Act. Reference 1: http://www.xbrl.org/2003/role/presentationRef
-Publisher SEC
-Name Exchange Act
-Number 240
-Section 13e
-Subsection 4c
| Name: |
dei_PreCommencementIssuerTenderOffer |
| Namespace Prefix: |
dei_ |
| Data Type: |
xbrli:booleanItemType |
| Balance Type: |
na |
| Period Type: |
duration |
|
| X |
- DefinitionBoolean flag that is true when the Form 8-K filing is intended to satisfy the filing obligation of the registrant as pre-commencement communications pursuant to Rule 14d-2(b) under the Exchange Act. Reference 1: http://www.xbrl.org/2003/role/presentationRef
-Publisher SEC
-Name Exchange Act
-Number 240
-Section 14d
-Subsection 2b
| Name: |
dei_PreCommencementTenderOffer |
| Namespace Prefix: |
dei_ |
| Data Type: |
xbrli:booleanItemType |
| Balance Type: |
na |
| Period Type: |
duration |
|
| X |
- DefinitionTitle of a 12(b) registered security. Reference 1: http://www.xbrl.org/2003/role/presentationRef
-Publisher SEC
-Name Exchange Act
-Number 240
-Section 12
-Subsection b
| Name: |
dei_Security12bTitle |
| Namespace Prefix: |
dei_ |
| Data Type: |
dei:securityTitleItemType |
| Balance Type: |
na |
| Period Type: |
duration |
|
| X |
- DefinitionName of the Exchange on which a security is registered. Reference 1: http://www.xbrl.org/2003/role/presentationRef
-Publisher SEC
-Name Exchange Act
-Number 240
-Section 12
-Subsection d1-1
| Name: |
dei_SecurityExchangeName |
| Namespace Prefix: |
dei_ |
| Data Type: |
dei:edgarExchangeCodeItemType |
| Balance Type: |
na |
| Period Type: |
duration |
|
| X |
- DefinitionBoolean flag that is true when the Form 8-K filing is intended to satisfy the filing obligation of the registrant as soliciting material pursuant to Rule 14a-12 under the Exchange Act. Reference 1: http://www.xbrl.org/2003/role/presentationRef
-Publisher SEC
-Name Exchange Act
-Section 14a
-Number 240
-Subsection 12
| Name: |
dei_SolicitingMaterial |
| Namespace Prefix: |
dei_ |
| Data Type: |
xbrli:booleanItemType |
| Balance Type: |
na |
| Period Type: |
duration |
|
| X |
- DefinitionTrading symbol of an instrument as listed on an exchange.
| Name: |
dei_TradingSymbol |
| Namespace Prefix: |
dei_ |
| Data Type: |
dei:tradingSymbolItemType |
| Balance Type: |
na |
| Period Type: |
duration |
|
| X |
- DefinitionBoolean flag that is true when the Form 8-K filing is intended to satisfy the filing obligation of the registrant as written communications pursuant to Rule 425 under the Securities Act. Reference 1: http://www.xbrl.org/2003/role/presentationRef
-Publisher SEC
-Name Securities Act
-Number 230
-Section 425
| Name: |
dei_WrittenCommunications |
| Namespace Prefix: |
dei_ |
| Data Type: |
xbrli:booleanItemType |
| Balance Type: |
na |
| Period Type: |
duration |
|
| X |
- Details
| Name: |
us-gaap_StatementClassOfStockAxis=us-gaap_CommonClassAMember |
| Namespace Prefix: |
|
| Data Type: |
na |
| Balance Type: |
|
| Period Type: |
|
|
| X |
- Details
| Name: |
us-gaap_StatementClassOfStockAxis=us-gaap_CommonClassBMember |
| Namespace Prefix: |
|
| Data Type: |
na |
| Balance Type: |
|
| Period Type: |
|
|
Crawford (NYSE:CRD.B)
Historical Stock Chart
From Apr 2024 to May 2024

Crawford (NYSE:CRD.B)
Historical Stock Chart
From May 2023 to May 2024
