false 0000716605 0000716605 2023-11-30 2023-11-30 iso4217:USD xbrli:shares iso4217:USD xbrli:shares


UNITED STATES

SECURITIES AND EXCHANGE COMMISSION

Washington, D.C.  20549


FORM 8-K


CURRENT REPORT


Pursuant to Section 13 or 15(d) of

The Securities Exchange Act of 1934


November 30, 2023

Date of Report (Date of earliest event reported)


PENNS WOODS BANCORP, INC.

(Exact name of registrant as specified in its charter)


Pennsylvania   000-17077   23-2226454

(State or other jurisdiction

of incorporation)


(Commission

File Number)


(IRS Employer

Ident. No.)

         
300 Market Street, P.O. Box 967, Williamsport, Pennsylvania   17703-0967
(Address of principal executive offices)   (Zip Code)
 

(570) 322-1111

Registrant’s telephone number, including area code

 
N/A
(Former name or former address, if changed since last report.)


Check the appropriate box below if the Form 8-K filing is intended to simultaneously satisfy the filing obligation of the registrant under any of the following provisions:


o Written communications pursuant to Rule 425 under the Securities Act (17 CFR 230.425)


o Soliciting material pursuant to Rule 14a-12 under the Exchange Act (17 CFR 240.14a-12)


o Pre-commencement communications pursuant to Rule 14d-2(b) under the Exchange Act (17 CFR 240.14d-2(b))


o Pre-commencement communications pursuant to Rule 13e-4(c) under the Exchange Act (17 CFR 240.13e-4 (c))


Securities registered pursuant to Section 12(b) of the Act:


Title of each class Trading Symbol(s) Name of each exchange on which registered
Common Stock, $5.55 par value PWOD The Nasdaq Global Select Market


Indicate by check mark whether the registrant is an emerging growth company as defined in Rule 405 of the Securities Act of 1933 (17 CFR §230.405 of this chapter) or Rule 12b-2 of the Securities Exchange Act of 1934 (17 CFR §240.12b-2 of this chapter).


Emerging growth company ¨


If an emerging growth company, indicate by check mark if the registrant has elected not to use the extended transition period for complying with any new or revised financial accounting standards provided pursuant to Section 13(a) of the Exchange Act. ¨


Item 7.01Regulation FD Disclosure.


On November 30, 2023, Penns Woods Bancorp, Inc. (the “Company”) made available on its website an updated slide presentation regarding the Company, which presentation is furnished as Exhibit 99.1 attached hereto and is incorporated herein by reference.


The information contained in this Report, including Exhibit 99.1 attached hereto, is considered to be “furnished” and shall not be deemed to be “filed” for purposes of Section 18 of the Securities Exchange Act of 1934, as amended, or otherwise subject to liability under that section. The information contained in this Report, including Exhibit 99.1 attached hereto, shall not be incorporated by reference into any filing or other document pursuant to the Securities Act of 1933, as amended, or the Exchange Act, except as expressly set forth by specific reference in such filing.


Item 9.01Financial Statements and Exhibits.


(d)       Exhibits:


99.1 Slide Presentation of Penn Woods Bancorp, Inc. (furnished pursuant to Item 7.01 of this Form 8-K)


104Cover Page Interactive Data File (the cover page XBRL tags are embedded within the Inline XBRL document)


2


SIGNATURES


Pursuant to the requirements of the Securities Exchange Act of 1934, the registrant has duly caused this report to be signed on its behalf by the undersigned hereunto duly authorized.


  PENNS WOODS BANCORP, INC.
     
Dated:   November 30, 2023    
     
  By: /s/  Brian L. Knepp
    Brian L. Knepp
    President and Chief Financial Officer


3


Exhibit 99.1


GRAPHIC

1 Creating Success by Delivering Solutions Penns Woods Bancorp, Inc. November 2023

GRAPHIC

2 Forward-Looking Information Certain statements contained in this presentation are forward-looking in nature. These include all statements about PWB’s plans, objectives, expectations and other statements that are not historical facts, and usually use words such as "expect," "anticipate," "believe" and similar expressions. Such statements represent management's current beliefs, based upon information available at the time the statements are made, with regard to the matters addressed. All forward-looking statements are subject to risks and uncertainties that could cause PWB’s actual results or financial condition to differ materially from those expressed in or implied by such statements. Factors of particular importance to PWB include, but are not limited to: (1) changes in general, national or regional economic conditions; (2) changes in interest rates; (3) changes in loan default and charge-off rates; (4) changes in deposit levels; (5) changes in levels of income and expense in non-interest income and expense related activities; (6) residential mortgage and secondary market activity; (7) changes in accounting and regulatory guidance applicable to banks; (8) price levels and conditions in the public securities markets generally; (9) competition and its effect on pricing, spending, third-party relationships and revenues; (10) changes in regulation resulting from or relating to financial reform legislation; and (11) the risk factors identified in PWB’s Annual Report on Form 10-K for the year ended December 31, 2022 and in other filings made by PWB under the Securities Exchange Act of 1934. PWB does not undertake any obligation to update or revise any forward-looking statements, whether as a result of new information, future events or otherwise. Penns Woods Bancorp, Inc.

GRAPHIC

3 Non-GAAP Financial Measures This presentation contains financial information determined by methods other than in accordance with generally accepted accounting principles in the United States (“GAAP”). These non-GAAP measures include tangible book value per share and return on average tangible common equity. Management uses these non-GAAP financial measures because this information is commonly utilized by regulators and investors to evaluate financial condition, and is therefore useful to investors. These disclosures should not be viewed as a substitute for operating results determined in accordance with GAAP, nor are they necessarily comparable to non-GAAP performance measures that may be presented by other companies. A reconciliation of the non-GAAP measures, tangible book value per share and return on average tangible common equity, used in this presentation to the related GAAP measure is included in the appendix to this presentation. Penns Woods Bancorp, Inc.

GRAPHIC

4 $1.2 $1.2 $1.3 $1.3 $1.5 $1.7 $1.7 $1.8 $1.9 $2.0 $2.2 2013 2014 2015 2016 2017 2018 2019 2020 2021 2022 2023Q3 Company Profile Penns Woods Bancorp, Inc. NASDAQ Ticker: PWOD Market Cap: $152.1 million (11/8/2023) Headquarters: Williamsport, Lycoming County, PA Branch Offices: 24 Total Assets: $2.2 billion Total Loans: $1.8 billion Total Deposits: $1.6 billion Total Equity: $174.5 million Total Assets $ in billions HQ MSA # of Branches Total Deposits ($M) Williamsport, PA 8 $659 Scranton--Wilkes-Barre, PA 8 465 State College, PA 3 167 Lock Haven, PA 2 166 Sunbury, PA 1 50 Lewisburg, PA 1 27 Altoona, PA 1 21 Total 24 $1,554 Source: S&P Global Market Intelligence, FDIC. Note: FDIC deposit data as of 6/30/2023.

GRAPHIC

5 Company Structure Penns Woods Bancorp, Inc. (1983) Jersey Shore State Bank Bank Subsidiary (1934) M-Group DBA The Comprehensive Financial Group (2000) Woods Investment Company, Inc. (1994) United Insurance Solutions, LLC (2017) Woods Real Estate (1984) Luzerne Bank Bank Subsidiary (2013) Penns Woods Bancorp, Inc.

GRAPHIC

6 Market Area Penns Woods Bancorp, Inc. Primary Areas of Operation • Luzerne, PA (Primary Service Area) • Lycoming, PA – Williamsport, PA • Centre, PA – State College, PA • Clinton, PA • Montour, PA – Danville, PA • Union, PA – Lewisburg, PA • Blair, PA Source: S&P Global Market Intelligence. Jersey Shore State Bank: 16 branches Luzerne Bank: 8 branches

GRAPHIC

7 Mission Remain a high performing regional community bank Continue creating long-term shareholder value through a combination of Return on Equity and cash dividends to shareholders Grow the bank in a safe, sound, diversified, and profitable manner Be the “best of the best” in financial services Be the “best place to work” Provide exceptional service to our customers in a friendly way Employ the best by attracting and retaining highly motivated professionals Penns Woods Bancorp, Inc. 1 2 3 4 5 6 7

GRAPHIC

8 129.2% 109.1% 0% 20% 40% 60% 80% 100% 120% 140% 160% PWOD Peers Tangible Book Value (+ Dividends) Growth Track Record Penns Woods Bancorp, Inc. Growth in Economic Value – Since YE 2013 Tangible Book Value “TBV” + Dividends Annual Growth Rates TBV + Dividends CAGR – Since YE 2013 2023Q3 ROATCE(1) + Dividends Source: S&P Global Market Intelligence. Note: Peer group consists of major-exchange traded U.S. banks with total assets between $1 billion and $3 billion, excluding merger targets and mutuals. (1) ROATCE = Return on Average Tangible Common Equity. PWOD Outperformance of 20% 8.2% 7.2% PWOD Peers 5.8% 3.4% 5.6% 10.9% PWOD Peers 11.4% 14.3%

GRAPHIC

9 76bps 109bps PWOD KRX High Quality Deposit Base Penns Woods Bancorp, Inc. Historically Consistent Deposit Base… … Leads to Strength in Times of Turmoil Source: S&P Global Market Intelligence. Note: Peer group consists of the NASDAQ Regional Bank index as of September 2023. Note: Deposit Beta calculated as the change in the Company’s deposit costs as a % of the change in the Fed Fund Rate. (1) Annualized growth figures shown. 25% 32% PWOD KRX 16% 25% PWOD KRX Current Cycle Deposit Beta (2022 – Now) 0.27% 0.20% 0.17% 0.17% 0.38% 0.85% 1.26% 1.64% 0.10% 0.08% 0.12% 0.31% 0.66% 1.09% 1.52% 1.86% 2021Q4 2022Q1 2022Q2 2022Q3 2022Q4 2023Q1 2023Q2 2023Q3 KRX = NASDAQ Regional Banking Index Stickier Core Deposits Lend to Cushion on Funding Costs in Tense Times Cumulative Cycle Deposit Beta (2015 – Now) Cost of Total Deposits (2021Q4 – Now) 2.32% 2.44% PWOD KRX (12.2%) (20.2%) PWOD KRX Cost of Interest-Bearing Deposits (2023Q3) Non-Interest Bearing Deposit Growth(1) (2022Q4 vs. 2023Q3) Proven Ability to Weather Storms Pre/Post Covid – Cost of Deposits Δ (2019 Year End vs. 2023Q3)

GRAPHIC

10 0.85% 0.90% 0.70% 2021 2022 2023 YTD Financial Summary 2020 – 2023 Penns Woods Bancorp, Inc. Return on Equity (%) Return on Average Assets (%) 9.9% 10.7% 8.6% 2021 2022 2023 YTD Earnings Per Share - Basic $2.27 $2.47 $2.08 2021 2022 2023 YTD Source: S&P Global Market Intelligence, Company documents. Note: YTD = Year-to-date annualized as of 9/30/2023. Return on Average Tangible Common Equity (%) 10.8% 12.5% 9.6% 2021 2022 2023 YTD

GRAPHIC

11 Value Proposition Franchise Value Capital Balance Sheet Integrity Diversification Expansion Penns Woods Bancorp, Inc. 1 2 3 4 5

GRAPHIC

12 Value Proposition 1 Franchise Value Source: S&P Global Market Intelligence, FDIC. Note: FDIC deposit data as of 6/30/2023. (1) Excludes banks over $50 billion in most recent quarter total assets; MSA: Metropolitan Statistical Area. PWOD Commands Excellent Market Share in the Four Major MSAs It Operates In(1) Williamsport Scranton-Wilkes-Barre State College Lock Haven Company # of Branches Total Deposits ($M) 1 Penns Woods Bancorp Inc. 8 $659 2 Woodlands Fnl Services Co 7 506 3 CCFNB Bancorp Inc. 8 481 Company # of Branches Total Deposits ($M) 1 Peoples Financial Services 2 8 $2,669 2 Fidelity D & D Bancorp Inc. 1 6 1,628 3 Community Bank System Inc. 2 1 1,315 6 Penns Woods Bancorp Inc. 8 465 Company # of Branches Total Deposits ($M) 1 F.N.B. Corp. 9 $837 2 Kish Bancorp Inc. 5 441 3 Northwest Bancshares, Inc. 4 301 5 Penns Woods Bancorp Inc. 3 167 Company # of Branches Total Deposits ($M) 1 Penns Woods Bancorp Inc. 2 $166 2 First Commonwealth Financial 3 148 3 F.N.B. Corp. 2 126 Penns Woods Bancorp, Inc.

GRAPHIC

13 Loan and Deposit Portfolio Composition Penns Woods Bancorp, Inc. Loan Composition Deposit Composition Commercial, Financial, and Ag. 12% Resi CRE 44% 30% Construction 3% Auto 14% Other 1% Non-Interest Bearing 30% Savings 14% NOW 14% Money Market 19% Time Deposits 16% Brokered CDS 7% Yield on Total Loans: 4.81 % CRE / TRBC: 275 % Cost of Interest Bearing Deposits: 2.32 % Cost of Total Deposits: 1.64 % Cost of Funds: 2.17 % 2023Q3 2023Q3 Source: Company documents.

GRAPHIC

14 $321 $335 $449 $494 $519 $472 $166 $177 $210 $236 $248 $208 $227 $219 $288 $366 $373 $239 $221 $216 $284 $319 $271 $287 $292 $378 $264 $205 $146 $250 $107 $0 $200 $400 $600 $800 $1,000 $1,200 $1,400 $1,600 $1,800 2018 2019 2020 2021 2022 2023 Q3 Noninterest Bearing Savings NOW Money Market Time Deposits Brokered CDS Loan and Deposit Portfolio Composition, Continued Penns Woods Bancorp, Inc. Total Loans Total Deposits $189 $156 $165 $163 $190 $211 $622 $623 $590 $596 $708 $774 $372 $363 $373 $447 $501 $526 $44 $38 $39 $37 $43 $56 $25 $23 $20 $9 $10 $11 $133 $151 $156 $139 $186 $240 $0 $200 $400 $600 $800 $1,000 $1,200 $1,400 $1,600 $1,800 2018 2019 2020 2021 2022 2023 Q3 Commercial R/E Residential R/E Commercial R/E Construction Installment Automobile $1,354 $1,343 $ in millions $ in millions $1,324 $1,621 Source: Company documents. $1,392 $1,639 $1,494 $1,556 $1,384 $1,817 $1,220 $1,567

GRAPHIC

15 9.0% 8.2% $106 $173 $1.42 $1.28 9.4% 6.0% Capital Tier 1 Capital ($M) Value Proposition Long-term track record of building capital while providing strong shareholder returns Cash Dividend as a % of Tangible Capital(1) Source: S&P Global Market Intelligence, Company documents. Note: 2023 YTD annualized, shown through 9/30/2023. (1) Cash Dividend as a % of Tangible Capital defined as Cash dividends per share / average tangible book value per share. (2) 2023 YTD is annualized. Cumulative Cash Dividends Since ’13: $14.07 p/share 93% return on 2013 TBV Penns Woods Bancorp, Inc. (2) (2) Tier 1 Leverage Ratio Cash Dividends per Share 2

GRAPHIC

16 0.5% 1.1% 2.2% PWOD Pennsylvania Banks All Banks Value Proposition Cumulative Net Charge-offs / Avg. Loans Balance Sheet Integrity 2018 – 2023 YTD 2013 – 2023 YTD Source: S&P Global Market Intelligence, Company documents. Note: 2023 YTD annualized, shown through 9/30/2023. (1) All banks currently operating, acquired, and defunct companies. (2) Annualized NCO data. Penns Woods Bancorp, Inc. (1) 0.9% 2.4% 4.4% PWOD Pennsylvania Banks All Banks (1) 3 0.05% 0.02% 0.03% 0.01% 0.04% 0.03% (0.11%) 0.01% 2020 2021 2022 Q3 '22 Q4 '22 Q1 '23 Q2 '23 Q3 '23 Net Charge-offs (Recoveries) / Avg. Loans $9,122 $5,389 $3,615 $3,551 $3,156 $2,005 0.50% 0.28% 0.18% 0.17% 0.15% 0.09% 2020 2021 2022 Q1 '23 Q2 '23 Q3 '23 Nonaccrual Loans ($000) For the Years Ended For the Quarters Ended (2) $9,122 $5,389 $3,615 $3,551 $3,156 0.50% 0.28% 0.18% 0.17% 0.15% 2020 2021 2022 Q1 '23 Q2 '23 Nonaccrual Loans Nonaccrual Loans / Assets

GRAPHIC

17 50% 29% 8% 2% 4% 7% Consumer Net Interest Income Commerical Net Interest Income Other Net Interest Income Mortgage Banking Service Charges on Deposits Insurance & Other Fee Income $0.3 $0.3 $0.4 $0.4 $0.4 $0.4 $0.5 $0.5 $0.6 $0.5 $0.6 Value Proposition 4 Diversification Total Revenue(1) 2023Q3 Source: S&P Global Market Intelligence. (1) Net Interest Income items estimated based on overall cost of funds for PWOD of 2.17%. 5 Expansion $0.9 $0.9 $1.0 $1.0 $1.1 $1.3 $1.2 $1.3 $1.4 $1.5 $1.6 Total Assets ($bn) Fee Income / Total Revenue: 13% PWOD has demonstrated successful execution of M&A and the ability to grow its bank subsidiaries organically while maintaining a low risk profile and high returns to shareholders Fee Income + Consumer Income / Total Revenue: 63% Penns Woods Bancorp, Inc.

GRAPHIC

18Penns Woods Bancorp, Inc. Strategies for a Successful Future Leverage Holding Company Structure Emphasis on “E” Delivery Channels Re-Engineering Company Remain Different From Our Peers Strive for Excellence

GRAPHIC

19 1.3 2.0 2.4 5.7 7.1 2019 2020 2021 2022 2023Q3 18.3 24.1 25.1 24.2 25.9 2019 2020 2021 2022 2023Q3 42.5 45.2 50.1 58.0 64.6 2019 2020 2021 2022 2023Q3 Delivery Channel Changes Penns Woods Bancorp, Inc. Estatement Accounts Internet Banking Accounts Mobile Banking Accounts Accounts in thousands Source: Company documents.

GRAPHIC

20Penns Woods Bancorp, Inc. Future Holding Company Structure Penns Woods Bancorp, Inc. Holding Company Western Region (Brand to be Determined) Blair, Cambria, Clearfield and Huntingdon Counties Jersey Shore State Bank Lycoming, Clinton, Centre, Montour, Union, Columbia, Snyder and Northumberland Counties Luzerne Bank Luzerne, Lackawanna and Wyoming Counties Northern Region (Brand to be Determined) Bradford, Tioga and Susquehanna Counties Southern Region (Brand to be Determined) Lehigh, Lebanon, Dauphin and Perry Counties

GRAPHIC

21 Strong Financial Management Penns Woods Bancorp, Inc. Culture & People Quality Loan Growth Core Deposit Growth Capital Earnings Tax Management Investment Portfolio

GRAPHIC

22 Selected Financial Data Penns Woods Bancorp, Inc. Source: Company documents. 
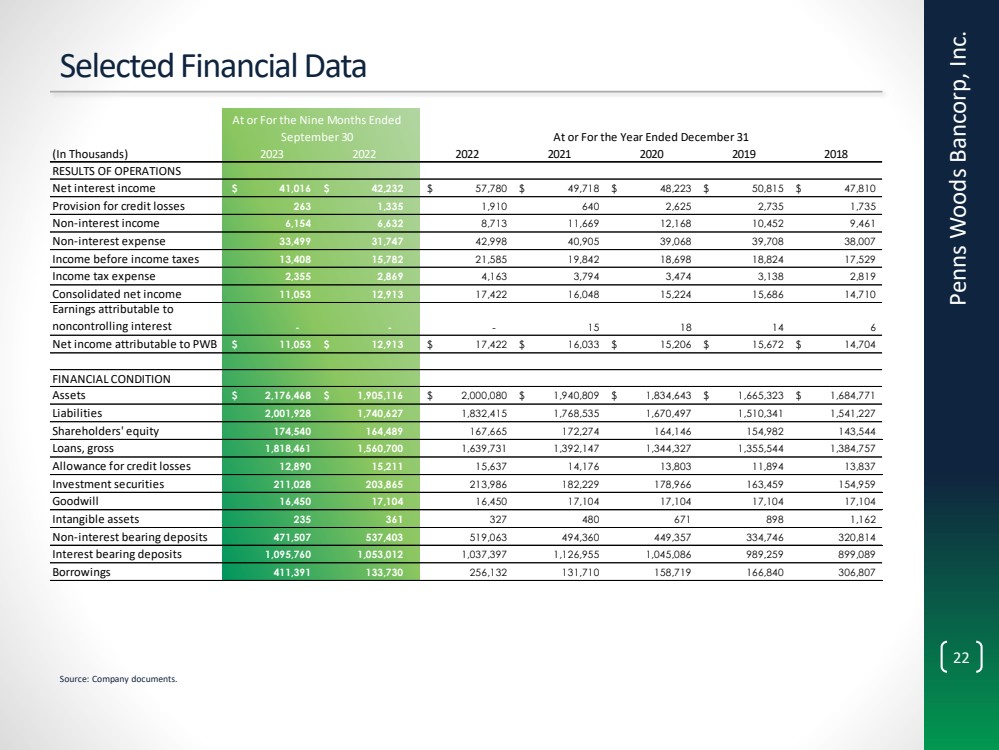
(In Thousands) 2023 2022 2022 2021 2020 2019 2018 RESULTS OF OPERATIONS Net interest income $ 41,016 $ 42,232 $ 57,780 $ 49,718 $ 48,223 $ 50,815 $ 47,810 Provision for credit losses 263 1,335 1,910 640 2,625 2,735 1,735 Non-interest income 6,154 6,632 8,713 11,669 12,168 10,452 9,461 Non-interest expense 33,499 31,747 42,998 40,905 39,068 39,708 38,007 Income before income taxes 13,408 15,782 21,585 19,842 18,698 18,824 17,529 Income tax expense 2,355 2,869 4,163 3,794 3,474 3,138 2,819 Consolidated net income 11,053 12,913 17,422 16,048 15,224 15,686 14,710 Earnings attributable to noncontrolling interest - - - 1 5 1 8 1 4 6 Net income attributable to PWB $ 11,053 $ 12,913 $ 17,422 $ 16,033 $ 15,206 $ 15,672 $ 14,704 FINANCIAL CONDITION Assets $ 2,176,468 $ 1,905,116 $ 2,000,080 $ 1,940,809 $ 1,834,643 $ 1,665,323 $ 1,684,771 Liabilities 2,001,928 1,740,627 1,832,415 1,768,535 1,670,497 1,510,341 1,541,227 Shareholders' equity 174,540 164,489 167,665 172,274 164,146 154,982 143,544 Loans, gross 1,818,461 1,560,700 1,639,731 1,392,147 1,344,327 1,355,544 1,384,757 Allowance for credit losses 12,890 15,211 15,637 14,176 13,803 11,894 13,837 Investment securities 211,028 203,865 213,986 182,229 178,966 163,459 154,959 Goodwill 16,450 17,104 16,450 17,104 17,104 17,104 17,104 Intangible assets 235 361 327 480 671 898 1,162 Non-interest bearing deposits 471,507 537,403 519,063 494,360 449,357 334,746 320,814 Interest bearing deposits 1,095,760 1,053,012 1,037,397 1,126,955 1,045,086 989,259 899,089 Borrowings 411,391 133,730 256,132 131,710 158,719 166,840 306,807 At or For the Nine Months Ended September 30 At or For the Year Ended December 31

GRAPHIC

23 Per Share Metrics Penns Woods Bancorp, Inc. $2.09 $2.20 $2.16 $2.27 $2.47 $2.08 2018 2019 2020 2021 2022 2023 YTD Earnings Per Share - Basic Tangible Book Value per Share $17.80 $19.45 $20.75 $21.88 $21.38 $22.20 2018 2019 2020 2021 2022 2023Q3 Source: Company documents. Note: 2023 YTD annualized, shown through 9/30/2023.

GRAPHIC

24 Non -GAAP Reconciliation Penns Woods Bancorp, Inc. Source: S&P Global Market Intelligence, Company documents. (1) Tax affected with each respective year’s statutory corporate tax rate. (2) 2023 YTD annualized. 2018 2019 2020 2021 2022 2022 2023 Total Common Equity $143,536 $154,960 $164,142 $172,274 $167,665 $164,489 $174,540 Goodwill 17,104 17,104 17,104 17,104 16,450 17,104 16,450 Other Intangibles 1,162 898 671 480 327 361 235 Less: Total Intangible Assets 18,266 18,002 17,775 17,584 16,777 17,465 16,685 Tangible Common Equity $125,270 $136,958 $146,367 $154,690 $150,888 $147,024 $157,855 Net Income $14,704 $15,672 $15,206 $16,033 $17,422 $12,913 $11,053 Plus: Amortization of Intangibles & Goodwill Impairment(1) $237 $209 $179 $151 $638 $94 $73 Average Tangible Common Equity 121,250 132,581 141,644 149,218 144,966 146,787 155,133 Return on Average Tangible Common Equity(2) 12.32% 11.98% 10.86% 10.85% 12.46% 11.81% 9.56% Total Assets $1,684,771 $1,665,323 $1,834,643 $1,940,809 $2,000,080 $1,905,116 $2,176,468 Goodwill 17,104 17,104 17,104 17,104 16,450 17,104 16,450 Other Intangibles 1,162 898 671 480 327 361 235 Less: Total Intangible Assets 18,266 18,002 17,775 17,584 16,777 17,465 16,685 Tangible Assets $1,666,505 $1,647,321 $1,816,868 $1,923,225 $1,983,303 $1,887,651 $2,159,783 Tangible Common Equity / Tangible Assets 7.52% 8.31% 8.06% 8.04% 7.61% 7.79% 7.31% Tangible Book Value Per Share $17.80 $19.45 $20.75 $21.88 $21.38 $20.85 $22.20 Common Shares Outstanding 7,037,322 7,040,515 7,052,351 7,070,047 7,056,585 7,052,975 7,110,025 At or For the Fiscal Year At or For the 9 Months Ended Ended December 31, As of September 30,

v3.23.3
Cover
Nov. 30, 2023
Cover [Abstract]  
Document Type 8-K
Amendment Flag false
Document Period End Date Nov. 30, 2023
Entity File Number 000-17077
Entity Registrant Name PENNS WOODS BANCORP, INC.
Entity Central Index Key 0000716605
Entity Tax Identification Number 23-2226454
Entity Incorporation, State or Country Code PA
Entity Address, Address Line One 300 Market Street
Entity Address, Address Line Two P.O. Box 967
Entity Address, City or Town Williamsport
Entity Address, State or Province PA
Entity Address, Postal Zip Code 17703-0967
City Area Code 570
Local Phone Number 322-1111
Written Communications false
Soliciting Material false
Pre-commencement Tender Offer false
Pre-commencement Issuer Tender Offer false
Title of 12(b) Security Common Stock, $5.55 par value
Trading Symbol PWOD
Security Exchange Name NASDAQ
Entity Emerging Growth Company false

Penns Woods Bancorp (NASDAQ:PWOD)
Historical Stock Chart
From Apr 2024 to May 2024 Click Here for more Penns Woods Bancorp Charts.
Penns Woods Bancorp (NASDAQ:PWOD)
Historical Stock Chart
From May 2023 to May 2024 Click Here for more Penns Woods Bancorp Charts.