Kentucky First Federal Bancorp (Nasdaq: KFFB), the holding company
(the “Company”) for First Federal Savings and Loan Association of
Hazard and First Federal Savings Bank of Kentucky, Frankfort,
Kentucky, announced net earnings of $144,000 or $0.02 diluted
earnings per share for the three months ended March 31, 2023,
compared to net earnings of $334,000 or $0.04 diluted earnings per
share for the three months ended March 31, 2022, a decrease of
$190,000 or 56.9%. Net earnings were $891,000 or $0.11 diluted
earnings per share for the nine months ended March 31, 2023,
compared to net earnings of $1.4 million or $0.17 diluted earnings
per share for the nine months ended March 31, 2022, a decrease of
$493,000 or 35.6%.
The decrease in net earnings for the quarter ended
March 31, 2023 was primarily attributable to provision for losses
on loans and lower net interest income. The decrease in net
earnings for the nine months ended March 31, 2023, was primarily
attributed to provision for losses on loans, lower non-interest
income, and higher non-interest expense.
In the three months ended March 31, 2022, the
Company recorded a negative provision for losses on loans of
$106,000, compared to no provision for the recently-ended quarterly
period. The negative provision in the prior year was due, in part,
to an overall decrease in the Company’s loan portfolio at that
time. Since June 30, 2022 the loan portfolio has increased $32.4
million or 11.8% to $307.0 million and has continued to perform
well. As a result, management determined that no provision for
losses on loans was necessary for the quarter just ended. Net
interest income decreased $93,000 or 4.4% and totaled $2.0 million
for the quarter ended March 31, 2023, primarily because interest
income increased less than interest expense increased. Interest
income increased $649,000 or 25.3% and totaled $3.2 million for the
recently-ended quarter due primarily to an increased average
balance of interest-earning assets period to period as well as a
higher average interest rate earned on those assets. Interest
expense increased $742,000 or 175.4% and totaled $1.2 million for
the three months just ended primarily due to higher average
interest rates paid on funding sources. Deposits and FHLB advances
are the primary funding sources utilized by the Company and
interest expense on those funds has increased in response to the
475 basis point increase implemented by the Federal Open Market
Committee of the Federal Reserve Bank (“FOMC”) over the past twelve
months. Although the yield on the Company’s assets generally
changes in response to interest rate changes, those assets do not
reprice as quickly as funding sources reprice. If the FOMC
continues to increase, management expects net earnings to be
negatively impacted as the cost of funding is expected to increase
faster than the yield on assets increases. The extent of any such
negative impact will be largely dependent on whether and how much
the FOMC continues to escalate interest rates.
Non-interest expense increased $45,000 or 2.4%
totaling $1.9 million for the quarter ended March 31, 2023, due
primarily to an increase in outside service fees.
The decrease in net earnings on a nine-month basis
was primarily attributable to provision for losses on loans, lower
non-interest income, higher non-interest expense, and decreased net
interest income.
As referenced herein the Company recorded a
negative provision for losses on loans of $106,000 during the nine
months ended March 31, 2022. A provision of $113,000 was recorded
for the nine month period just ended due primarily to an increase
in the loan portfolio during the period. Non-interest income
decreased $186,000 or 44.1% to $236,000 for the nine months just
ended due primarily to decreased net gains on sales of loans, which
was due, in turn, to a reduction in volume of loans sold during the
comparable period. The Company sells most of its long-term,
fixed-rate mortgage loans to the Federal Home Loan Bank of
Cincinnati, while retaining the servicing rights on the loans.
Increases in market interest rates during the prior twelve months
has significantly reduced demand for long-term, fixed-rate
mortgages which can be made and sold.
Non-interest expense increased $128,000 or 2.2%
to $5.9 million for the nine months ended March 31, 2023, due
primarily to an increase in auditing and accounting and outside
service fees.
Net interest income decreased $51,000 or 0.7%
and totaled $6.9 million for the nine months ended March 31, 2023,
as interest income increased less than interest expense increased.
Interest income increased $910,000 or 10.9% and totaled $9.2
million for the nine months just ended primarily due to an
increased average balance of interest-earning assets period to
period as well as a higher average interest rate earned on those
assets. Interest expense increased $961,000 or 71.7% and totaled
$2.3 million for the nine months just ended, primarily due to an
increase in the average rate paid on funding sources.
At March 31, 2023, assets totaled $342.9 million,
an increase of $14.8 million or 4.5%, compared to $328.1 million at
June 30, 2022. The increase in assets was attributed primarily to a
$32.4 million or 11.8% increase in loans, net, which totaled $307.0
million at March 31, 2023, while cash and cash equivalents
decreased $17.7 million or 68.7% to $8.1 million. Deposits
decreased $30.5 million or 12.7% to $209.4 million at March 31,
2023 compared to June 30, 2022 while advances increased $46.8
million or 137.5% to $80.9 million at the end of the period.
Deposits decreased in the first two quarters of the fiscal year as
general interest rates in the market rose and customers sought
higher yields on their interest-bearing deposits. Deposits
decreased approximately $14.1 million and $17.0 million for the
quarterly periods ended September 30, and December 31, 2022, but
increased approximately $524,000 for the recently-ended quarter.
The Banks maintain a relatively low 13% of deposits which are not
insured by the Federal Deposit Insurance Corporation (“FDIC”).
At March 31, 2023, the Company reported its book
value per share as $6.32. The change in shareholders’ equity was
primarily associated with net profits for the period, less
dividends paid on common stock and common stock repurchased for
treasury purposes. Included in shareholders’ equity at March 31,
2023 was $361,000 in unrealized losses on available-for-sale
investments, net of tax, which was the sole component of the
Company’s accumulated other comprehensive gain (loss).
This press release may contain statements that are
forward-looking, as that term is defined by the Private Securities
Litigation Act of 1995 or the Securities and Exchange Commission in
its rules, regulations and releases. The Company intends that such
forward-looking statements be subject to the safe harbors created
thereby. All forward-looking statements are based on current
expectations regarding important risk factors including, but not
limited to, real estate values, the impact of interest rates on
financing, changes in general economic conditions, legislative and
regulatory changes that adversely affect the business of the
Company, changes in the securities markets and the Risk Factors
described in Item 1A of the Company’s Annual Report on Form 10-K
for the year ended June 30, 2022. Accordingly, actual results may
differ from those expressed in the forward-looking statements, and
the making of such statements should not be regarded as a
representation by the Company or any other person that results
expressed therein will be achieved.
Kentucky First Federal Bancorp is the parent
company of First Federal Savings and Loan Association of Hazard,
which operates one banking office in Hazard, Kentucky and First
Federal Savings Bank of Kentucky, which operates three banking
offices in Frankfort, Kentucky, two banking offices in Danville,
Kentucky and one banking office in Lancaster, Kentucky. Kentucky
First Federal Bancorp shares are traded on the Nasdaq National
Market under the symbol KFFB. At March 31, 2023, the Company had
approximately 8,097,695 shares outstanding of which approximately
58.4% was held by First Federal MHC.
|
SUMMARY OF FINANCIAL HIGHLIGHTS |
|
|
|
|
|
|
|
Condensed Consolidated Balance Sheets |
|
|
|
|
|
|
|
|
(In thousands, except share data) |
|
|
|
|
March 31, |
|
June 30, |
| |
|
|
|
|
2023 |
|
2022 |
|
ASSETS |
|
|
|
|
|
|
Cash and cash equivalents |
|
|
|
|
$ |
8,085 |
|
$ |
25,823 |
|
Investment Securities |
|
|
|
|
13,152 |
|
10,816 |
|
Loans available-for sale |
|
|
|
|
- |
|
152 |
|
Loans, net |
|
|
|
|
306,960 |
|
274,583 |
|
Real estate acquired through foreclosure |
|
|
|
|
70 |
|
10 |
|
Goodwill |
|
|
|
|
947 |
|
947 |
|
Other Assets |
|
|
|
|
13,700 |
|
15,749 |
|
Total Assets |
|
|
|
|
$ |
342,914 |
|
$ |
328,080 |
|
LIABILITIES AND SHAREHOLDERS' EQUITY |
|
|
|
|
|
|
|
Deposits |
|
|
|
|
$ |
209,391 |
|
$ |
239,857 |
|
FHLB Advances |
|
|
|
|
80,899 |
|
34,066 |
|
Other Liabilities |
|
|
|
|
1,485 |
|
2,132 |
|
Total liabilities |
|
|
|
|
291,775 |
|
276,055 |
|
Shareholders' Equity |
|
|
|
|
51,139 |
|
52,025 |
|
Total liabilities and shareholders' equity |
|
|
|
|
$ |
342,914 |
|
$ |
328,080 |
|
Book value per share |
|
|
|
|
$ |
6.32 |
|
$ |
6.38 |
|
Tangible book value per share |
|
|
|
|
$ |
6.20 |
|
$ |
6.26 |
|
Outstanding shares |
|
|
|
|
8,097,695 |
|
8,154,695 |
|
|
|
|
|
|
|
|
|
Condensed Consolidated Statements of Income |
|
|
|
|
|
|
| (In
thousands, except share data) |
|
|
|
|
|
|
|
| |
Nine months ended
March 31, |
|
Three months ended
March 31, |
|
|
2023 |
|
2022 |
|
2023 |
|
2022 |
|
|
|
|
|
|
Interest Income |
$ |
9,226 |
|
$ |
8,316 |
|
$ |
3,210 |
|
$ |
2,561 |
| Interest
Expense |
2,301 |
|
1,340 |
|
1,165 |
|
423 |
| Net Interest
Income |
6,925 |
|
6,976 |
|
2,045 |
|
2,138 |
| Provision
for Losses on Loans |
113 |
|
(106) |
|
- |
|
(106) |
| Non-interest
Income |
236 |
|
422 |
|
69 |
|
94 |
| Non-interest
Expense |
5,874 |
|
5,746 |
|
1,916 |
|
1,871 |
| Income
Before Income Taxes |
1,174 |
|
1,758 |
|
198 |
|
467 |
| Income
Taxes |
283 |
|
374 |
|
54 |
|
133 |
| Net (Loss)
Income |
$ |
891 |
|
$ |
1,384 |
|
$ |
144 |
|
$ |
334 |
| Earnings per
share: |
|
|
|
|
|
|
|
| Basic and
Diluted |
$ |
0.11 |
|
$ |
0.17 |
|
$ |
0.02 |
|
$ |
0.04 |
| Weighted
average outstanding shares: |
|
|
|
|
|
|
|
| Basic and
Diluted |
8,144,767 |
|
8,216,836 |
|
8,129,006 |
|
8,217,207 |
Contact: Don Jennings, President, or Clay Hulette,
Vice President
(502) 223-1638
216 West Main Street
P.O. Box 535
Frankfort, KY 40602
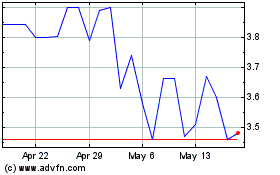
Kentucky First Federal B... (NASDAQ:KFFB)
Historical Stock Chart
From Dec 2024 to Jan 2025

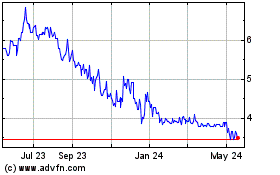
Kentucky First Federal B... (NASDAQ:KFFB)
Historical Stock Chart
From Jan 2024 to Jan 2025
