Stock Market News for April 18, 2013 - Market News
April 18 2013 - 5:36AM
Zacks
Weaker-than-expected results of a
major bank coupled with concerns over weak sales reports of a
technology bellwether dragged the benchmarks into negative
territory. Apprehensions surrounding the growth of the global
economy added to the gloom. All the top ten S&P 500 industry
groups suffered losses, among which energy stocks suffered the
most.
The Dow Jones Industrial Average (DJI) decreased 0.9% to close the
day at 14,618.59. The S&P 500 lost 1.4% to finish yesterday’s
trading session at 1,552.01. The tech-laden Nasdaq Composite Index
slid 1.8% to end at 3,204.67. The fear-gauge CBOE Volatility Index
(VIX) surged 18.3% to settle at 16.51. Consolidated volumes on the
New York Stock Exchange, American Stock Exchange and Nasdaq were
roughly 7.89 billion shares, well above 2012’s average of 6.48
billion shares. Declining stocks outnumbered the advancers. For the
22% that advanced, 76% declined.
In the fourth quarter of 2012, corporate results and economic
numbers were robust. The markets touched all-time highs on the back
of strong housing numbers and an improving job scenario. But weak
payroll data and mixed economic numbers in this quarter indicates a
lull in the economy. In spite of witnessing one of the worst
trading days this week, the Dow Jones and the S&P 500 are up
11.6% and 8.8%, respectively, from the previous year’s level.
According to the Thomson Reuters data, analysts expect a rise 1.7%
in the earnings in comparison with the previous quarter.
Investor sentiment was dampened during early trading after Bank of
America Corp (NYSE:BAC) reported earnings below the Street’s
estimates. Investors grew more cautious when a supplier, Cirrus
Logic, Inc. (NASDAQ:CRUS) to technology bellwether, Apple, Inc.
(NASDAQ:AAPL), reported weakening demand for Apple’s products, iPad
and iPhone.
Weak international numbers added weight to investor sentiment.
According to the Association of European Carmakers, car sales in
Europe decreased 10.3% in March. Registration of cars dropped to
1.35 million this year from 1.5 million in the previous year. This
data reflected a sixth consecutive annual decline in car sales.
Meanwhile, unemployment rate in Britain increased 0.3% sequentially
on a quarterly basis to 7.9% in February.
The Federal Reserve’s Beige report, which covers twelve Federal
Reserve districts, indicated an economic expansion in comparison
with the previous month. Companies related to residential
construction and automobiles led growth in most of the districts
while a slowdown was seen in defense-related companies. Increase in
the gasoline price, expiration of the payroll tax cut and winter
weather remain a barrier for further growth. Employment conditions
were unchanged or marginally improved in most of the areas. Hiring
took place in a few sectors such as residential construction,
information technology, professional services and manufacturing
sector.
On the earnings front, shares of banking giant Bank of America
Corp. decreased almost 4.7% after it reported results below the
Street’s expectations. The revenue of the company increased to
$23.7 billion or $0.20 a share in comparison with estimates of
$23.4 billion or $0.22 a share. Profits of the company were largely
hit by the $500 million lawsuit it lost in settlement to
shareholders.
Of the top ten S&P 500 industry groups, energy stocks suffered
the most. The Energy Select Sector SPDR (XLE) lost almost 2.2%.
Stocks such as Exxon Mobil Corporation (NYSE:XOM), Hess Corp.
(NYSE:HES), Marathon Oil Corporation (NYSE:MRO), Suncor Energy Inc.
(USA) (NYSE:SU) and Chevron Corporation (NYSE:CVX) lost 0.6%, 2.7%,
3.4%, 2.1% and 1.9%, respectively.
APPLE INC (AAPL): Free Stock Analysis Report
BANK OF AMER CP (BAC): Free Stock Analysis Report
CIRRUS LOGIC (CRUS): Free Stock Analysis Report
CHEVRON CORP (CVX): Free Stock Analysis Report
HESS CORP (HES): Free Stock Analysis Report
MARATHON OIL CP (MRO): Free Stock Analysis Report
SUNCOR ENERGY (SU): Free Stock Analysis Report
EXXON MOBIL CRP (XOM): Free Stock Analysis Report
To read this article on Zacks.com click here.
Zacks Investment Research
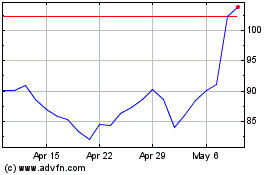
Cirrus Logic (NASDAQ:CRUS)
Historical Stock Chart
From Jun 2024 to Jul 2024

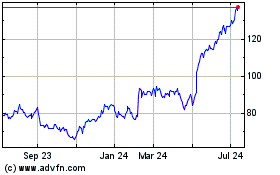
Cirrus Logic (NASDAQ:CRUS)
Historical Stock Chart
From Jul 2023 to Jul 2024
