false 0001752036 0001752036 2023-07-27 2023-07-27
UNITED STATES
SECURITIES AND EXCHANGE COMMISSION
Washington, D.C. 20549
FORM 8-K
CURRENT REPORT
Pursuant to Section 13 or 15(d)
of the Securities Exchange Act of 1934
Date of Report (Date of earliest event reported): July 27, 2023
CALIFORNIA BANCORP
(Exact name of registrant as specified in its charter)
|
|
|
|
|
| California |
|
001-39242 |
|
82-1751097 |
| (State or other jurisdiction of incorporation) |
|
(Commission File Number) |
|
(IRS Employer Identification Number) |
|
|
|
| 1300 Clay Street, Suite 500 |
|
|
| Oakland, California |
|
94612 |
| (Address of Principal Executive Offices) |
|
(Zip Code) |
(510) 457-3737
(Registrant’s Telephone Number, Including Area Code)
N/A
(Former name or former address, if changed since last report.)
Check the appropriate box below if the Form 8-K filing is intended to simultaneously satisfy the filing obligation of the registrant under any of the following provisions:
| ☐ |
Written communications pursuant to Rule 425 under the Securities Act (17 CFR 230.425) |
| ☐ |
Soliciting material pursuant to Rule 14a-12 under the Exchange Act (17 CFR 240.14a-12) |
| ☐ |
Pre-commencement communications pursuant to Rule 14d-2(b) under the Exchange Act (17 CFR 240.14d-2(b)) |
| ☐ |
Pre-commencement communications pursuant to Rule 13e-4(c) under the Exchange Act (17 CFR 240.13e-4(c)) |
Securities registered pursuant to Section 12(b) of the Act:
|
|
|
|
|
| Title of each class |
|
Trading
Symbol(s) |
|
Name of each exchange on which registered |
| Common Stock |
|
CALB |
|
The Nasdaq Stock Market LLC |
Indicate by check mark whether the registrant is an emerging growth company as defined in Rule 405 of the Securities Act of 1933 (§230.405 of this chapter) or Rule 12b-2 of the Securities Exchange Act of 1934 (§240.12b-2 of this chapter).
Emerging growth company ☒
If an emerging growth company, indicate by check mark if the registrant has elected not to use the extended transition period for complying with any new or revised financial accounting standards provided pursuant to Section 13(a) of the Exchange Act. ☐
| Item 2.02 |
Results of Operations and Financial Condition |
On July 27, 2023, California BanCorp (the “Company”) issued a press release setting forth its unaudited financial results for the quarter and six months ended June 30, 2023. A copy of the Company’s press release is furnished as Exhibit 99.1 and is hereby incorporated by reference.
| Item 7.01 |
Regulation FD Disclosure. |
Over the upcoming weeks, members of management will be presenting to or conducting one-on-one meetings with investors, analysts or other third parties about the Company and its latest financial results. A copy of the presentation slides, updated with the Company’s financial results for the second quarter and six months ended June 30, 2023, substantially in the form expected to be used in such presentations and meetings, is attached hereto as Exhibit 99.2 and is incorporated herein by reference.
The information furnished under this Item 2.02 and Item 7.01 and the related Exhibits 99.1 and 99.2 of this Current Report on Form 8-K shall not be deemed “filed” for purposes of Section 18 of the Securities Exchange Act of 1934, as amended (the “Exchange Act”), or otherwise subject to liabilities under that Section, nor shall it be deemed incorporated by reference in any registration statement or other filings of the Company under the Securities Act of 1933, as amended (the “Securities Act”) or the Exchange Act, except as shall be set forth by specific reference in such filing.
| Item 9.01 |
Financial Statements and Exhibits |
SIGNATURES
Pursuant to the requirements of the Securities Exchange Act of 1934, the registrant has duly caused this report to be signed on its behalf by the undersigned hereunto duly authorized.
|
|
|
|
|
|
|
CALIFORNIA BANCORP |
|
|
|
| Date: July 27, 2023 |
|
By: |
|
/s/ THOMAS A. SA |
|
|
|
|
Thomas A. Sa President, Chief Financial Officer and Chief Operating Officer |
Exhibit 99.1

California BanCorp Reports Financial Results for the Second Quarter and Six Months Ended June 30,
2023
Oakland, CA – July 27, 2023 – California BanCorp (NASDAQ: CALB), whose subsidiary is California Bank
of Commerce, announced today its financial results for the second quarter and six months ended June 30, 2023.
The Company reported net income of
$5.4 million for the second quarter of 2023, representing a decrease of $11,000, or 0%, compared to $5.5 million for the first quarter of 2023 and an increase of $1.2 million, or 28%, compared to $4.2 million in the second
quarter of 2022. For the six months ended June 30, 2023, net income was $10.9 million representing an increase of $3.0 million, or 38%, compared to $7.9 million for the same period in 2022.
Diluted earnings per share of $0.65 for the second quarter of 2023 compared to $0.64 for the first quarter of 2023 and $0.51 for the second quarter of 2022.
For the six months ended June 30, 2023, diluted earnings per share of $1.29 compared to $0.94 for the same period in 2022.
“We executed well in
the second quarter and continued to generate strong financial performance with our return on average assets remaining above 1% while maintaining a prudent approach to risk management with a high level of capital, liquidity and reserves,” said
Steven Shelton, Chief Executive Officer of California BanCorp. “We continued to see good stability in our deposit base and noninterest-bearing deposits remained above 40% of our total deposits, which reflects the strength of our
relationship-oriented approach and the loyalty of the client base we have built. Due to the stability in our deposit base, we were able to repay the borrowings we added towards the end of the first quarter, which helped limit the amount of
compression that we had in our net interest margin and support profitability. We also maintained disciplined expense control, which enabled us to continue realizing more operating leverage and improve our efficiency ratio.”
“Given our conservative approach in the current environment, we expect our balance sheet to be relatively flat over the remainder of the year. However,
given the strength of the franchise we have built and the reputation we have developed for providing a superior level of service and expertise, we continue to believe that we have good opportunities to continue adding deposit relationships with high
quality commercial clients. While we will continue to maintain disciplined expense control, our strong financial performance enables us to continue to make investments in our technology platform, including our treasury management solutions, that
will further enhance our level of client service and improve our ability to add new client relationships. We believe these investments will help us to continue growing our client base, add more scale and improve our efficiencies, and further
increase the value of our franchise,” said Mr. Shelton.
Financial Highlights:
Profitability – three months ended June 30, 2023 compared to March 31, 2023
| |
• |
|
Net income of $5.4 million and $0.65 per diluted share, compared to $5.5 million and $0.64 per diluted
share, respectively. |
| |
• |
|
Revenue of $19.8 million decreased $83,000, or 0%, compared to $19.9 million for the first quarter of
2023. |
| |
• |
|
Net interest income of $18.6 million decreased $111,000, or 1%, compared to $18.8 million for the first
quarter of 2023. |
| |
• |
|
Provision for credit losses of $444,000 increased $86,000, or 24%, from $358,000 for the first quarter of 2023.
|
| |
• |
|
Non-interest income of $1.1 million remained consistent with the
first quarter of 2023. |
| |
• |
|
Non-interest expense, excluding capitalized loan origination costs, of
$12.3 million decreased $197,000, or 2%, compared to $12.5 million for the first quarter of 2023. |
Profitability – six
months ended June 30, 2023 compared to June 30, 2022
| |
• |
|
Net income of $10.9 million and $1.29 per diluted share, compared to $7.9 million and $0.94 per diluted
share, respectively. |
| |
• |
|
Revenue of $39.6 million increased $4.9 million, or 14%, compared to $34.7 million in the prior
year. |
| |
• |
|
Net interest income of $37.4 million increased $6.7 million, or 22%, compared to $30.7 million for
the same period in the prior year. |
| |
• |
|
Provision for credit losses of $802,000 decreased $1.1 million, or 57%, from $1.9 million for the six
months ended June 30, 2022. |
| |
• |
|
Non-interest income of $2.2 million decreased $1.7 million, or
43%, from $3.9 million for the same period in the prior year. |
| |
• |
|
Non-interest expense, excluding capitalized loan origination costs, of
$24.8 million increased $1.0 million, or 4%, compared to $23.8 million for the six months ended June 30, 2022. |
Financial Position – June 30, 2023 compared to March 31, 2023
| |
• |
|
Total assets decreased by $45.1 million, or 2%, to $2.01 billion; average total assets increased by
$9.6 million to $1.98 billion. |
| |
• |
|
Total gross loans decreased by $33.6 million, or 2%, to $1.58 billion. |
| |
• |
|
Total deposits increased by $20.7 million, or 1%, to $1.74 billion. |
| |
• |
|
Excluding junior subordinated debt securities, the Company had no other borrowings outstanding compared to
$75.0 million at March 31, 2023. |
| |
• |
|
Capital ratios remain healthy with a tier I leverage ratio of 9.01%, tier I capital ratio of 9.07% and total
risk-based capital ratio of 12.73%. |
| |
• |
|
Tangible book value per share of $21.09 increased by $0.61, or 3%. |
Net Interest Income and Margin:
Net interest income for
the quarter ended June 30, 2023 was $18.6 million, a decrease of $111,000 or 1%, from $18.8 million for the three months ended March 31, 2023, and an increase of $2.4 million, or 15%, from $16.2 million for the quarter
ended June 30, 2022. The decrease in net interest income from the first quarter of 2023 was a result of lower net interest margin. The increase in net interest income compared to the second quarter of 2022 was primarily attributable to the
growth of the loan portfolio and an increase in net interest margin.
Net interest income for the six months ended June 30, 2023 was $37.4 million, an increase of
$6.7 million, or 22% over $30.7 million for the six months ended June 30, 2022. The increase in net interest income was primarily attributable to an increase in interest income as the result of a more favorable mix of earning assets
combined with higher yields on those assets.
The Company’s net interest margin for the second quarter of 2023 was 3.93%, compared to 4.02% for the
first quarter of 2023 and 3.65% for the same period in 2022. The decrease in margin compared to the prior quarter was primarily due to an increase in the cost of deposits and other borrowings. The increase in margin from the same period last year
was primarily the result of a more favorable mix of earning assets combined with higher yields, partially offset by an increase in cost of deposits.
The
Company’s net interest margin for the six months ended June 30, 2023 was 3.98% compared to 3.42% for the same period in 2022. The increase in margin compared to prior year was primarily due to loan growth and increased yields on earnings
assets, partially offset by an increase in the cost of deposits and other borrowings.
Non-Interest Income:
The Company’s non-interest income for the quarters ended June 30, 2023, March 31, 2023, and
June 30, 2022 was $1.1 million, $1.1 million and $1.4 million, respectively. The decrease in non-interest income from the second quarter of 2022 was primarily due to a decrease in service
charges and other fee income.
For the six months ended June 30, 2023, non-interest income of
$2.2 million compared to $3.9 million for the same period of 2022. The decrease in non-interest income from prior year was the result of a decrease in service charges and loan related fees and a gain
recognized in the first quarter of 2022 on the sale of a portion of our solar loan portfolio.
Net interest income and
non-interest income comprised total revenue of $19.8 million, $19.9 million, and $17.6 million for the quarters ended June 30, 2023, March 31, 2023, and June 30, 2022,
respectively. Total revenue for the six months ended June 30, 2023 and 2022 was $39.6 million and $34.7 million, respectively.
Non-Interest Expense:
The Company’s non-interest expense for the
quarters ended June 30, 2023, March 31, 2023, and June 30, 2022 was $11.6 million, $11.8 million, and $10.8 million, respectively. The increase in non-interest expense from the
second quarter of 2022 was primarily due to an increase in salaries and benefits related to investments to support the continued growth of the business, partially offset by a reduction in capitalized loan origination costs. Excluding capitalized
loan origination costs, non-interest expense for the second quarter of 2023, the first quarter of 2023 and the second quarter of 2022 was $12.3 million, $12.5 million, and $11.9 million,
respectively.
Non-interest expense of $23.4 million for the six months ended
June 30, 2023 increased by $1.7 million, or 8%, compared to $21.7 million for the same period of 2022. Excluding capitalized loan origination costs, non-interest expense was $24.8 million
for the six months ended June 30, 2023 and $23.8 million for the same period in 2022 which reflects investment in infrastructure to support the continued growth of the Company.
The Company’s efficiency ratio, the ratio of non-interest expense to revenues, was 58.66%, 59.62%, and 61.41% for
the quarters ended June 30, 2023, March 31, 2023, and June 30, 2022, respectively. For the six months ended June 30, 2023 and 2022, the Company’s efficiency ratio was 59.14% and 62.68%, respectively.
Balance Sheet:
Total assets of $2.01 billion as of
June 30, 2023, represented a decrease of $45.1 million, or 2%, compared to $2.05 billion at March 31, 2023 and an increase of $120.3 million, or 6%, compared to $1.89 billion at June 30, 2022. The decrease in total
assets from the prior quarter was primarily the result of a modest reduction in line utilization in our commercial loan portfolio. Compared to the same period in the prior year, total assets increased primarily due to strong loan growth in the
commercial and real estate portfolios.
Total gross loans decreased by $33.6 million, or 2%, to $1.58 billion at June 30, 2023, from
$1.62 billion at March 31, 2023 and increased by $83.3 million, or 6%, compared to $1.50 billion at June 30, 2022. During the second quarter of 2023, the reduction in gross loans was primarily the result of commercial loans
decreasing by $34.2 million, or 5%. Compared to the same period in the prior year, commercial loans increased by $32.7 million, or 6%, and real estate other loans increased by $61.8 million, or 8%, primarily due to organic growth.
These increases were partially offset by a decrease in SBA loans of $8.4 million, or 63%, primarily due to PPP loan forgiveness.
Total deposits
increased by $20.7 million, or 1%, to $1.74 billion at June 30, 2023 from $1.72 billion at March 31, 2023, and increased by $186.2 million, or 12%, from $1.55 billion at June 30, 2022. The increase in total
deposits from the end of the first quarter of 2023 was primarily due to an increase in money market and savings deposits of $16.8 million. Compared to the same period last year, the increase in total deposits was primarily concentrated in time
deposits as a result of higher balances of short-term brokered certificates of deposits which were added to temporarily increase liquidity. Non-interest bearing deposits, primarily commercial business
operating accounts, represented 42.7% of total deposits at June 30, 2023, compared to 43.1% at March 31, 2023 and 46.1% at June 30, 2022.
As of June 30, 2023, the Company had no outstanding borrowings, excluding junior subordinated debt securities, compared to $75.0 million at
March 31, 2023 and $100.0 million at June 30, 2022. The decrease in borrowings during the second quarter of 2023 compared to the prior periods was primarily due to increased liquidity generated from the deposit portfolio.
Asset Quality:
The provision for credit losses on loans
decreased to $340,000 for the second quarter of 2023 compared to $464,000 for the first quarter of 2023, and $925,000 for the second quarter of 2022. The Company did not have any loan charge-offs or recoveries during the second
quarter of 2023, a loan charge-off of $247,000, or 0.02% of gross loans, and no recoveries during the first quarter of 2023, and no loan charge-offs or recoveries during the second quarter of 2022.
Non-performing assets (“NPAs”) to total assets of 0.01% at
June 30, 2023 and March 31, 2023 compared to 0.03% at June 30, 2022, with non-performing loans of $181,000, $222,000 and $549,000, respectively, on those dates.
The allowance for credit losses on loans increased by $340,000 to $15.7 million, or 0.99% of total loans, at June 30, 2023, compared to
$15.4 million, or 0.95% of total loans, at March 31, 2023 and $16.0 million, or 1.06% of total loans, at June 30, 2022. On January 1, 2023, the Company adopted the new current expected credit losses (CECL) standard. The
Company’s allowance for credit losses on loans was 0.95% upon adoption on January 1, 2023 compared to 1.07% at December 31, 2022.
The
allowance for credit losses on unfunded loan commitments increased by $156,000 to $1.9 million, or 0.31% of total unfunded loan commitments, at June 30, 2023, compared to $1.7 million, or 0.29% of total unfunded loan commitments, at
March 31, 2023 and $430,000, or 0.7% of total unfunded loan commitments at June 30, 2022. The Company’s allowance for credit losses on unfunded loan commitments was 0.28% upon the adoption of CECL on January 1, 2023 compared to
0.07% at December 31, 2022.
Capital Adequacy:
At June 30, 2023, shareholders’ equity totaled $184.2 million compared to $178.6 million at March 31, 2023 and $158.7 million one
year ago. As a result, the Company’s total risk-based capital ratio, tier I capital ratio and tier I leverage ratio of 12.73%, 9.07%, and 9.01%, respectively, were all above the regulatory standards for “well-capitalized” institutions
of 10.00%, 8.00% and 5.00% respectively.
“Our strong financial performance and prudent balance sheet management resulted in an increase in all of
our capital ratios and a 3% increase in our tangible book value per share during the second quarter,” said Thomas A. Sa, President, Chief Financial Officer and Chief Operating Officer of California BanCorp. “We also continue to have
exceptional asset quality with non-performing assets remaining at just 0.01% of total assets. Further, our exposure to investor office commercial real estate, excluding medical offices, sits at just 4.0%
of total loans, with no exposure in downtown San Francisco. With our high level of capital and liquidity, stable deposit base, strong asset quality, and well managed interest rate sensitivity, we believe we are well positioned to effectively manage
through the current challenging environment and create long-term value for our shareholders.”
About California BanCorp:
California BanCorp, the parent company for California Bank of Commerce, offers a broad range of commercial banking services to closely held businesses and
professionals located throughout Northern California. The Company’s common stock trades on the Nasdaq Global Select marketplace under the symbol CALB. For more information on California BanCorp, please visit our webite at
www.californiabankofcommerce.com.
Contacts:
Steven
E. Shelton, (510) 457-3751
Chief Executive Officer
seshelton@bankcbc.com
Thomas A. Sa, (510) 457-3775
President, Chief Financial Officer and Chief Operating Officer
tsa@bankcbc.com
Use of Non-GAAP Financial Information:
This press release contains both financial measures based on GAAP and non-GAAP.
Non-GAAP financial measures are used where management believes them to be helpful in understanding the Company’s results of operations or financial position. Where
non-GAAP financial measures are used, the comparable GAAP financial measure, as well as the reconciliation to the comparable GAAP financial measure, can be found in this press release. These disclosures should
not be viewed as a substitute for operating results determined in accordance with GAAP, nor are they necessarily comparable to non-GAAP performance measures that may be presented by other companies.
Forward-Looking Information:
Statements in this news
release regarding expectations and beliefs about future financial performance and financial condition, as well as trends in the Company’s business and markets are “forward-looking statements” as defined in the Private Securities
Litigation Reform Act of 1995. Forward-looking statements often include words such as “believe,” “expect,” “anticipate,” “intend,” “plan,” “estimate,” “project,”
“outlook,” or words of similar meaning, or future or conditional verbs such as “will,” “would,” “should,” “could,” or “may.” The forward-looking statements in this news release are based on
current information and on assumptions that the Company makes about future events and circumstances that are subject to a number of risks and uncertainties that are often difficult to predict and beyond the Company’s control. As a result of
those risks and uncertainties, the Company’s actual financial results in the future could differ, possibly materially, from those expressed in or implied by the forward-looking statements contained in this news release and could cause the
Company to make changes to future plans. Those risks and uncertainties include, but are not limited to, the risk of incurring loan losses, which is an inherent risk of the banking business; the risk that the Company will not be able to continue its
internal growth rate; the risk that the United States economy will experience slowed growth or recession or will be adversely affected by domestic or international economic conditions and risks associated with the Federal Reserve Board taking
actions with respect to interest rates, any of which could adversely affect, among other things, the values of real estate collateral supporting many of the Company’s loans, interest income and interest rate margins and, therefore, the
Company’s future operating results; risks associated with changes in income tax laws and regulations; and risks associated with seeking new client relationships and maintaining existing client relationships. Readers of this news release are
encouraged to review the additional information regarding these and other risks and uncertainties to which our business is subject that are contained in our Annual Report on Form 10-K for the year ended
December 31, 2022 which is on file with the Securities and Exchange Commission (the “SEC”). Additional information will be set forth in our Quarterly Report on Form 10-Q for the quarter ended
June 30, 2023, which we expect to file with the SEC during the third quarter of 2023, and readers of this release are urged to review the additional information that will be contained in that report.
Due to these and other possible uncertainties and risks, readers are cautioned not to place undue reliance on the forward-looking statements contained in
this news release, which speak only as of today’s date, or to make predictions based solely on historical financial performance. The Company disclaims any obligation to update forward-looking statements contained in this news release, whether
as a result of new information, future events or otherwise, except as may be required by law.
FINANCIAL TABLES FOLLOW
CALIFORNIA BANCORP AND SUBSIDIARY
SELECTED FINANCIAL INFORMATION (UNAUDITED) – PROFITABILITY
(Dollars in Thousands, Except Per Share Data)
|
|
|
|
|
|
|
|
|
|
|
|
|
|
|
|
|
|
|
|
|
|
|
|
|
|
|
|
|
| |
|
|
|
|
|
|
|
Change |
|
|
|
|
|
Change |
|
| QUARTERLY HIGHLIGHTS: |
|
Q2 2023 |
|
|
Q1 2023 |
|
|
$ |
|
|
% |
|
|
Q2 2022 |
|
|
$ |
|
|
% |
|
| Interest income |
|
$ |
27,172 |
|
|
$ |
25,539 |
|
|
$ |
1,633 |
|
|
|
6 |
% |
|
$ |
17,706 |
|
|
$ |
9,466 |
|
|
|
53 |
% |
| Interest expense |
|
|
8,526 |
|
|
|
6,782 |
|
|
|
1,744 |
|
|
|
26 |
% |
|
|
1,483 |
|
|
|
7,043 |
|
|
|
475 |
% |
|
|
|
|
|
|
|
|
|
|
|
|
|
|
|
|
|
|
|
|
|
|
|
|
|
|
|
|
|
| Net interest income |
|
|
18,646 |
|
|
|
18,757 |
|
|
|
(111 |
) |
|
|
-1 |
% |
|
|
16,223 |
|
|
|
2,423 |
|
|
|
15 |
% |
|
|
|
|
|
|
|
|
| Provision for credit losses |
|
|
444 |
|
|
|
358 |
|
|
|
86 |
|
|
|
24 |
% |
|
|
925 |
|
|
|
(481 |
) |
|
|
-52 |
% |
|
|
|
|
|
|
|
|
|
|
|
|
|
|
|
|
|
|
|
|
|
|
|
|
|
|
|
|
|
| Net interest income after provision for credit losses |
|
|
18,202 |
|
|
|
18,399 |
|
|
|
(197 |
) |
|
|
-1 |
% |
|
|
15,298 |
|
|
|
2,904 |
|
|
|
19 |
% |
|
|
|
|
|
|
|
|
| Non-interest income |
|
|
1,135 |
|
|
|
1,107 |
|
|
|
28 |
|
|
|
3 |
% |
|
|
1,394 |
|
|
|
(259 |
) |
|
|
-19 |
% |
| Non-interest expense |
|
|
11,603 |
|
|
|
11,843 |
|
|
|
(240 |
) |
|
|
-2 |
% |
|
|
10,819 |
|
|
|
784 |
|
|
|
7 |
% |
|
|
|
|
|
|
|
|
|
|
|
|
|
|
|
|
|
|
|
|
|
|
|
|
|
|
|
|
|
| Income before income taxes |
|
|
7,734 |
|
|
|
7,663 |
|
|
|
71 |
|
|
|
1 |
% |
|
|
5,873 |
|
|
|
1,861 |
|
|
|
32 |
% |
|
|
|
|
|
|
|
|
| Income tax expense |
|
|
2,294 |
|
|
|
2,212 |
|
|
|
82 |
|
|
|
4 |
% |
|
|
1,629 |
|
|
|
665 |
|
|
|
41 |
% |
|
|
|
|
|
|
|
|
|
|
|
|
|
|
|
|
|
|
|
|
|
|
|
|
|
|
|
|
|
| Net income |
|
$ |
5,440 |
|
|
$ |
5,451 |
|
|
$ |
(11 |
) |
|
|
0 |
% |
|
$ |
4,244 |
|
|
$ |
1,196 |
|
|
|
28 |
% |
|
|
|
|
|
|
|
|
|
|
|
|
|
|
|
|
|
|
|
|
|
|
|
|
|
|
|
|
|
| Diluted earnings per share |
|
$ |
0.65 |
|
|
$ |
0.64 |
|
|
$ |
0.01 |
|
|
|
2 |
% |
|
$ |
0.51 |
|
|
$ |
0.14 |
|
|
|
27 |
% |
|
|
|
|
|
|
|
|
|
|
|
|
|
|
|
|
|
|
|
|
|
|
|
|
|
|
|
|
|
| Net interest margin |
|
|
3.93 |
% |
|
|
4.02 |
% |
|
|
-9 Basis Points |
|
|
|
3.65 |
% |
|
|
+28 Basis Points |
|
|
|
|
|
|
|
| Efficiency ratio |
|
|
58.66 |
% |
|
|
59.62 |
% |
|
|
-96 Basis Points |
|
|
|
61.41 |
% |
|
|
-275 Basis Points |
|
|
|
|
|
|
|
|
|
|
|
|
|
|
|
|
|
|
|
|
|
|
| |
|
|
|
|
|
|
|
Change |
|
| YEAR-TO-DATE HIGHLIGHTS: |
|
Q2 2023 |
|
|
Q2 2022 |
|
|
$ |
|
|
% |
|
| Interest income |
|
$ |
52,711 |
|
|
$ |
33,630 |
|
|
$ |
19,081 |
|
|
|
57 |
% |
| Interest expense |
|
|
15,308 |
|
|
|
2,881 |
|
|
|
12,427 |
|
|
|
431 |
% |
|
|
|
|
|
|
|
|
|
|
|
|
|
|
|
|
|
| Net interest income |
|
|
37,403 |
|
|
|
30,749 |
|
|
|
6,654 |
|
|
|
22 |
% |
|
|
|
|
|
| Provision for loan losses |
|
|
802 |
|
|
|
1,875 |
|
|
|
(1,073 |
) |
|
|
-57 |
% |
|
|
|
|
|
|
|
|
|
|
|
|
|
|
|
|
|
| Net interest income after provision for loan losses |
|
|
36,601 |
|
|
|
28,874 |
|
|
|
7,727 |
|
|
|
27 |
% |
|
|
|
|
|
| Non-interest income |
|
|
2,242 |
|
|
|
3,928 |
|
|
|
(1,686 |
) |
|
|
-43 |
% |
| Non-interest expense |
|
|
23,446 |
|
|
|
21,735 |
|
|
|
1,711 |
|
|
|
8 |
% |
|
|
|
|
|
|
|
|
|
|
|
|
|
|
|
|
|
| Income before income taxes |
|
|
15,397 |
|
|
|
11,067 |
|
|
|
4,330 |
|
|
|
39 |
% |
|
|
|
|
|
| Income tax expense |
|
|
4,506 |
|
|
|
3,150 |
|
|
|
1,356 |
|
|
|
43 |
% |
|
|
|
|
|
|
|
|
|
|
|
|
|
|
|
|
|
| Net income |
|
$ |
10,891 |
|
|
$ |
7,917 |
|
|
$ |
2,974 |
|
|
|
38 |
% |
|
|
|
|
|
|
|
|
|
|
|
|
|
|
|
|
|
| Diluted earnings per share |
|
$ |
1.29 |
|
|
$ |
0.94 |
|
|
$ |
0.35 |
|
|
|
37 |
% |
|
|
|
|
|
|
|
|
|
|
|
|
|
|
|
|
|
| Net interest margin |
|
|
3.98 |
% |
|
|
3.42 |
% |
|
|
+56 Basis Points |
|
|
|
|
|
| Efficiency ratio |
|
|
59.14 |
% |
|
|
62.68 |
% |
|
|
-354 Basis Points |
|
CALIFORNIA BANCORP AND SUBSIDIARY
SELECTED FINANCIAL INFORMATION (UNAUDITED) – FINANCIAL POSITION
(Dollars in Thousands, Except Per Share Data)
|
|
|
|
|
|
|
|
|
|
|
|
|
|
|
|
|
|
|
|
|
|
|
|
|
|
|
|
|
| |
|
|
|
|
|
|
|
Change |
|
|
|
|
|
Change |
|
| PERIOD-END HIGHLIGHTS: |
|
Q2 2023 |
|
|
Q1 2023 |
|
|
$ |
|
|
% |
|
|
Q2 2022 |
|
|
$ |
|
|
% |
|
| Total assets |
|
$ |
2,005,646 |
|
|
$ |
2,050,774 |
|
|
$ |
(45,128 |
) |
|
|
-2 |
% |
|
$ |
1,885,352 |
|
|
$ |
120,294 |
|
|
|
6 |
% |
| Gross loans |
|
|
1,583,631 |
|
|
|
1,617,263 |
|
|
|
(33,632 |
) |
|
|
-2 |
% |
|
|
1,500,379 |
|
|
|
83,252 |
|
|
|
6 |
% |
| Deposits |
|
|
1,738,296 |
|
|
|
1,717,610 |
|
|
|
20,686 |
|
|
|
1 |
% |
|
|
1,552,139 |
|
|
|
186,157 |
|
|
|
12 |
% |
| Tangible equity |
|
|
176,783 |
|
|
|
171,099 |
|
|
|
5,684 |
|
|
|
3 |
% |
|
|
151,251 |
|
|
|
25,532 |
|
|
|
17 |
% |
|
|
|
|
|
|
|
|
| Tangible book value per share |
|
$ |
21.09 |
|
|
$ |
20.48 |
|
|
$ |
0.61 |
|
|
|
3 |
% |
|
$ |
18.19 |
|
|
$ |
2.90 |
|
|
|
16 |
% |
|
|
|
|
|
|
| Tangible equity / total assets |
|
|
8.81 |
% |
|
|
8.34 |
% |
|
|
+47 Basis Points |
|
|
|
8.02 |
% |
|
|
+79 Basis Points |
|
| Gross loans / total deposits |
|
|
91.10 |
% |
|
|
94.16 |
% |
|
|
-306 Basis Points |
|
|
|
96.67 |
% |
|
|
-557 Basis Points |
|
| Noninterest-bearing deposits / total deposits |
|
|
42.69 |
% |
|
|
43.12 |
% |
|
|
-43 Basis Points |
|
|
|
46.09 |
% |
|
|
-340 Basis Points |
|
| |
|
|
|
|
|
|
|
|
|
|
|
|
|
|
|
|
|
|
|
|
|
| QUARTERLY AVERAGE HIGHLIGHTS: |
|
|
|
|
|
|
|
Change |
|
|
|
|
|
Change |
|
| |
Q2 2023 |
|
|
Q1 2023 |
|
|
$ |
|
|
% |
|
|
Q2 2022 |
|
|
$ |
|
|
% |
|
| Total assets |
|
$ |
1,983,877 |
|
|
$ |
1,974,285 |
|
|
$ |
9,592 |
|
|
|
0 |
% |
|
$ |
1,864,196 |
|
|
$ |
119,681 |
|
|
|
6 |
% |
| Total earning assets |
|
|
1,900,918 |
|
|
|
1,893,940 |
|
|
|
6,978 |
|
|
|
0 |
% |
|
|
1,783,017 |
|
|
|
117,901 |
|
|
|
7 |
% |
| Gross loans |
|
|
1,577,529 |
|
|
|
1,582,332 |
|
|
|
(4,803 |
) |
|
|
0 |
% |
|
|
1,464,922 |
|
|
|
112,607 |
|
|
|
8 |
% |
| Deposits |
|
|
1,684,008 |
|
|
|
1,699,930 |
|
|
|
(15,922 |
) |
|
|
-1 |
% |
|
|
1,567,412 |
|
|
|
116,596 |
|
|
|
7 |
% |
| Tangible equity |
|
|
175,783 |
|
|
|
169,454 |
|
|
|
6,329 |
|
|
|
4 |
% |
|
|
150,176 |
|
|
|
25,607 |
|
|
|
17 |
% |
|
|
|
|
|
|
| Tangible equity / total assets |
|
|
8.86 |
% |
|
|
8.58 |
% |
|
|
+28 Basis Points |
|
|
|
8.06 |
% |
|
|
+80 Basis Points |
|
| Gross loans / total deposits |
|
|
93.68 |
% |
|
|
93.08 |
% |
|
|
+60 Basis Points |
|
|
|
93.46 |
% |
|
|
+50 Basis Points |
|
| Noninterest-bearing deposits / total deposits |
|
|
42.65 |
% |
|
|
42.88 |
% |
|
|
-23 Basis Points |
|
|
|
46.86 |
% |
|
|
-421 Basis Points |
|
|
|
|
|
|
|
|
|
|
|
|
|
|
|
|
|
|
|
|
|
|
| YEAR-TO-DATE AVERAGE HIGHLIGHTS: |
|
|
|
|
|
|
|
Change |
|
| |
Q2 2023 |
|
|
Q2 2022 |
|
|
$ |
|
|
% |
|
| Total assets |
|
$ |
1,979,107 |
|
|
$ |
1,896,191 |
|
|
$ |
82,916 |
|
|
|
4 |
% |
| Total earning assets |
|
|
1,897,448 |
|
|
|
1,814,448 |
|
|
|
83,000 |
|
|
|
5 |
% |
| Gross loans |
|
|
1,579,917 |
|
|
|
1,418,315 |
|
|
|
161,602 |
|
|
|
11 |
% |
| Deposits |
|
|
1,691,925 |
|
|
|
1,609,478 |
|
|
|
82,447 |
|
|
|
5 |
% |
| Tangible equity |
|
|
172,636 |
|
|
|
148,115 |
|
|
|
24,521 |
|
|
|
17 |
% |
|
|
|
|
| Tangible equity / total assets |
|
|
8.72 |
% |
|
|
7.81 |
% |
|
|
+91 Basis Points |
|
| Gross loans / total deposits |
|
|
93.38 |
% |
|
|
88.12 |
% |
|
|
+526 Basis Points |
|
| Noninterest-bearing deposits / total deposits |
|
|
42.76 |
% |
|
|
45.85 |
% |
|
|
-309 Basis Points |
|
CALIFORNIA BANCORP AND SUBSIDIARY
SELECTED INTERIM FINANCIAL INFORMATION (UNAUDITED) – ASSET QUALITY
(Dollars in Thousands)
|
|
|
|
|
|
|
|
|
|
|
|
|
|
|
|
|
|
|
|
|
| ALLOWANCE FOR CREDIT LOSSES (LOANS): |
|
06/30/23 |
|
|
03/31/23 |
|
|
12/31/22 |
|
|
09/30/22 |
|
|
06/30/22 |
|
| Balance, beginning of period |
|
$ |
15,382 |
|
|
$ |
17,005 |
|
|
$ |
16,555 |
|
|
$ |
15,957 |
|
|
$ |
15,032 |
|
| CECL adjustment |
|
|
— |
|
|
|
(1,840 |
) |
|
|
— |
|
|
|
— |
|
|
|
— |
|
| Provision for credit losses, quarterly |
|
|
340 |
|
|
|
464 |
|
|
|
1,100 |
|
|
|
800 |
|
|
|
925 |
|
| Charge-offs, quarterly |
|
|
— |
|
|
|
(247 |
) |
|
|
(650 |
) |
|
|
(202 |
) |
|
|
— |
|
| Recoveries, quarterly |
|
|
— |
|
|
|
— |
|
|
|
— |
|
|
|
— |
|
|
|
— |
|
|
|
|
|
|
|
|
|
|
|
|
|
|
|
|
|
|
|
|
|
|
| Balance, end of period |
|
$ |
15,722 |
|
|
$ |
15,382 |
|
|
$ |
17,005 |
|
|
$ |
16,555 |
|
|
$ |
15,957 |
|
|
|
|
|
|
|
|
|
|
|
|
|
|
|
|
|
|
|
|
|
|
|
|
|
|
|
|
| NONPERFORMING ASSETS: |
|
06/30/23 |
|
|
03/31/23 |
|
|
12/31/22 |
|
|
09/30/22 |
|
|
06/30/22 |
|
| Loans accounted for on a non-accrual basis |
|
$ |
181 |
|
|
$ |
222 |
|
|
$ |
1,250 |
|
|
$ |
182 |
|
|
$ |
549 |
|
| Loans with principal or interest contractually past due 90 days or more and still accruing
interest |
|
|
— |
|
|
|
— |
|
|
|
— |
|
|
|
161 |
|
|
|
— |
|
|
|
|
|
|
|
|
|
|
|
|
|
|
|
|
|
|
|
|
|
|
| Nonperforming loans |
|
$ |
181 |
|
|
$ |
222 |
|
|
$ |
1,250 |
|
|
$ |
343 |
|
|
$ |
549 |
|
| Other real estate owned |
|
|
— |
|
|
|
— |
|
|
|
— |
|
|
|
— |
|
|
|
— |
|
|
|
|
|
|
|
|
|
|
|
|
|
|
|
|
|
|
|
|
|
|
| Nonperforming assets |
|
$ |
181 |
|
|
$ |
222 |
|
|
$ |
1,250 |
|
|
$ |
343 |
|
|
$ |
549 |
|
|
|
|
|
|
|
|
|
|
|
|
|
|
|
|
|
|
|
|
|
|
| Loans restructured and in compliance with modified terms |
|
|
— |
|
|
|
— |
|
|
|
— |
|
|
|
— |
|
|
|
— |
|
|
|
|
|
|
|
|
|
|
|
|
|
|
|
|
|
|
|
|
|
|
| Nonperforming assets and restructured loans |
|
$ |
181 |
|
|
$ |
222 |
|
|
$ |
1,250 |
|
|
$ |
343 |
|
|
$ |
549 |
|
|
|
|
|
|
|
|
|
|
|
|
|
|
|
|
|
|
|
|
|
|
| Nonperforming loans by asset type: |
|
|
|
|
|
|
|
|
|
|
|
|
|
|
|
|
|
|
|
|
| Commercial |
|
$ |
— |
|
|
$ |
— |
|
|
$ |
1,028 |
|
|
$ |
161 |
|
|
$ |
— |
|
| Real estate other |
|
|
— |
|
|
|
— |
|
|
|
— |
|
|
|
— |
|
|
|
— |
|
| Real estate construction and land |
|
|
— |
|
|
|
— |
|
|
|
— |
|
|
|
— |
|
|
|
— |
|
| SBA |
|
|
181 |
|
|
|
222 |
|
|
|
222 |
|
|
|
182 |
|
|
|
549 |
|
| Other |
|
|
— |
|
|
|
— |
|
|
|
— |
|
|
|
— |
|
|
|
— |
|
|
|
|
|
|
|
|
|
|
|
|
|
|
|
|
|
|
|
|
|
|
| Nonperforming loans |
|
$ |
181 |
|
|
$ |
222 |
|
|
$ |
1,250 |
|
|
$ |
343 |
|
|
$ |
549 |
|
|
|
|
|
|
|
|
|
|
|
|
|
|
|
|
|
|
|
|
|
|
|
|
|
|
|
|
| ASSET QUALITY: |
|
06/30/23 |
|
|
03/31/23 |
|
|
12/31/22 |
|
|
09/30/22 |
|
|
06/30/22 |
|
| Allowance for credit losses (loans) / gross loans |
|
|
0.99 |
% |
|
|
0.95 |
% |
|
|
1.07 |
% |
|
|
1.04 |
% |
|
|
1.06 |
% |
| Allowance for credit losses (loans) / nonperforming loans |
|
|
8686.19 |
% |
|
|
6928.83 |
% |
|
|
1360.40 |
% |
|
|
4826.53 |
% |
|
|
2906.56 |
% |
| Nonperforming assets / total assets |
|
|
0.01 |
% |
|
|
0.01 |
% |
|
|
0.06 |
% |
|
|
0.02 |
% |
|
|
0.03 |
% |
| Nonperforming loans / gross loans |
|
|
0.01 |
% |
|
|
0.01 |
% |
|
|
0.08 |
% |
|
|
0.02 |
% |
|
|
0.04 |
% |
| Net quarterly charge-offs / gross loans |
|
|
0.00 |
% |
|
|
0.02 |
% |
|
|
0.04 |
% |
|
|
0.01 |
% |
|
|
0.00 |
% |
CALIFORNIA BANCORP AND SUBSIDIARY
INTERIM CONSOLIDATED STATEMENTS OF OPERATIONS (UNAUDITED)
(Dollars in Thousands, Except Per Share Data)
|
|
|
|
|
|
|
|
|
|
|
|
|
|
|
|
|
|
|
|
|
| |
|
Three months ended |
|
|
Six months ended |
|
| |
|
06/30/23 |
|
|
03/31/23 |
|
|
06/30/22 |
|
|
06/30/23 |
|
|
06/30/22 |
|
| INTEREST INCOME |
|
|
|
|
|
|
|
|
|
|
|
|
|
|
|
|
|
|
|
|
| Loans |
|
$ |
23,476 |
|
|
$ |
22,472 |
|
|
$ |
16,298 |
|
|
$ |
45,948 |
|
|
$ |
31,184 |
|
| Federal funds sold |
|
|
2,238 |
|
|
|
1,760 |
|
|
|
280 |
|
|
|
3,998 |
|
|
|
416 |
|
| Investment securities |
|
|
1,458 |
|
|
|
1,307 |
|
|
|
1,128 |
|
|
|
2,765 |
|
|
|
2,030 |
|
|
|
|
|
|
|
|
|
|
|
|
|
|
|
|
|
|
|
|
|
|
| Total interest income |
|
|
27,172 |
|
|
|
25,539 |
|
|
|
17,706 |
|
|
|
52,711 |
|
|
|
33,630 |
|
|
|
|
|
|
|
|
|
|
|
|
|
|
|
|
|
|
|
|
|
|
| INTEREST EXPENSE |
|
|
|
|
|
|
|
|
|
|
|
|
|
|
|
|
|
|
|
|
| Deposits |
|
|
7,493 |
|
|
|
6,022 |
|
|
|
796 |
|
|
|
13,515 |
|
|
|
1,602 |
|
| Other |
|
|
1,033 |
|
|
|
760 |
|
|
|
687 |
|
|
|
1,793 |
|
|
|
1,279 |
|
|
|
|
|
|
|
|
|
|
|
|
|
|
|
|
|
|
|
|
|
|
| Total interest expense |
|
|
8,526 |
|
|
|
6,782 |
|
|
|
1,483 |
|
|
|
15,308 |
|
|
|
2,881 |
|
|
|
|
|
|
|
|
|
|
|
|
|
|
|
|
|
|
|
|
|
|
| Net interest income |
|
|
18,646 |
|
|
|
18,757 |
|
|
|
16,223 |
|
|
|
37,403 |
|
|
|
30,749 |
|
| Provision for credit losses |
|
|
444 |
|
|
|
358 |
|
|
|
925 |
|
|
|
802 |
|
|
|
1,875 |
|
|
|
|
|
|
|
|
|
|
|
|
|
|
|
|
|
|
|
|
|
|
| Net interest income after provision for credit losses |
|
|
18,202 |
|
|
|
18,399 |
|
|
|
15,298 |
|
|
|
36,601 |
|
|
|
28,874 |
|
|
|
|
|
|
|
|
|
|
|
|
|
|
|
|
|
|
|
|
|
|
| NON-INTEREST INCOME |
|
|
|
|
|
|
|
|
|
|
|
|
|
|
|
|
|
|
|
|
| Service charges and other fees |
|
|
867 |
|
|
|
863 |
|
|
|
1,134 |
|
|
|
1,730 |
|
|
|
2,023 |
|
| Gain on sale of loans |
|
|
— |
|
|
|
— |
|
|
|
— |
|
|
|
— |
|
|
|
1,393 |
|
| Other non-interest income |
|
|
268 |
|
|
|
244 |
|
|
|
260 |
|
|
|
512 |
|
|
|
512 |
|
|
|
|
|
|
|
|
|
|
|
|
|
|
|
|
|
|
|
|
|
|
| Total non-interest income |
|
|
1,135 |
|
|
|
1,107 |
|
|
|
1,394 |
|
|
|
2,242 |
|
|
|
3,928 |
|
|
|
|
|
|
|
|
|
|
|
|
|
|
|
|
|
|
|
|
|
|
| NON-INTEREST EXPENSE |
|
|
|
|
|
|
|
|
|
|
|
|
|
|
|
|
|
|
|
|
| Salaries and benefits |
|
|
7,831 |
|
|
|
7,876 |
|
|
|
7,146 |
|
|
|
15,707 |
|
|
|
14,239 |
|
| Premises and equipment |
|
|
1,168 |
|
|
|
1,180 |
|
|
|
1,267 |
|
|
|
2,348 |
|
|
|
2,569 |
|
| Other |
|
|
2,604 |
|
|
|
2,787 |
|
|
|
2,406 |
|
|
|
5,391 |
|
|
|
4,927 |
|
|
|
|
|
|
|
|
|
|
|
|
|
|
|
|
|
|
|
|
|
|
| Total non-interest expense |
|
|
11,603 |
|
|
|
11,843 |
|
|
|
10,819 |
|
|
|
23,446 |
|
|
|
21,735 |
|
|
|
|
|
|
|
|
|
|
|
|
|
|
|
|
|
|
|
|
|
|
| Income before income taxes |
|
|
7,734 |
|
|
|
7,663 |
|
|
|
5,873 |
|
|
|
15,397 |
|
|
|
11,067 |
|
| Income taxes |
|
|
2,294 |
|
|
|
2,212 |
|
|
|
1,629 |
|
|
|
4,506 |
|
|
|
3,150 |
|
|
|
|
|
|
|
|
|
|
|
|
|
|
|
|
|
|
|
|
|
|
| NET INCOME |
|
$ |
5,440 |
|
|
$ |
5,451 |
|
|
$ |
4,244 |
|
|
$ |
10,891 |
|
|
$ |
7,917 |
|
|
|
|
|
|
|
|
|
|
|
|
|
|
|
|
|
|
|
|
|
|
| EARNINGS PER SHARE |
|
|
|
|
|
|
|
|
|
|
|
|
|
|
|
|
|
|
|
|
| Basic earnings per share |
|
$ |
0.65 |
|
|
$ |
0.65 |
|
|
$ |
0.51 |
|
|
$ |
1.30 |
|
|
$ |
0.96 |
|
|
|
|
|
|
|
|
|
|
|
|
|
|
|
|
|
|
|
|
|
|
| Diluted earnings per share |
|
$ |
0.65 |
|
|
$ |
0.64 |
|
|
$ |
0.51 |
|
|
$ |
1.29 |
|
|
$ |
0.94 |
|
|
|
|
|
|
|
|
|
|
|
|
|
|
|
|
|
|
|
|
|
|
| Average common shares outstanding |
|
|
8,369,907 |
|
|
|
8,339,080 |
|
|
|
8,295,014 |
|
|
|
8,354,564 |
|
|
|
8,285,950 |
|
|
|
|
|
|
|
|
|
|
|
|
|
|
|
|
|
|
|
|
|
|
| Average common and equivalent shares outstanding |
|
|
8,414,213 |
|
|
|
8,492,067 |
|
|
|
8,395,701 |
|
|
|
8,442,607 |
|
|
|
8,393,776 |
|
|
|
|
|
|
|
|
|
|
|
|
|
|
|
|
|
|
|
|
|
|
| PERFORMANCE MEASURES |
|
|
|
|
|
|
|
|
|
|
|
|
|
|
|
|
|
|
|
|
| Return on average assets |
|
|
1.10 |
% |
|
|
1.12 |
% |
|
|
0.91 |
% |
|
|
1.11 |
% |
|
|
0.84 |
% |
| Return on average equity |
|
|
11.91 |
% |
|
|
12.50 |
% |
|
|
10.80 |
% |
|
|
12.19 |
% |
|
|
10.26 |
% |
| Return on average tangible equity |
|
|
12.41 |
% |
|
|
13.05 |
% |
|
|
11.34 |
% |
|
|
12.72 |
% |
|
|
10.78 |
% |
| Efficiency ratio |
|
|
58.66 |
% |
|
|
59.62 |
% |
|
|
61.41 |
% |
|
|
59.14 |
% |
|
|
62.68 |
% |
CALIFORNIA BANCORP AND SUBSIDIARY
INTERIM CONSOLIDATED BALANCE SHEETS (UNAUDITED)
(Dollars in Thousands)
|
|
|
|
|
|
|
|
|
|
|
|
|
|
|
|
|
|
|
|
|
| |
|
06/30/23 |
|
|
03/31/23 |
|
|
12/31/22 |
|
|
09/30/22 |
|
|
06/30/22 |
|
| ASSETS |
|
|
|
|
|
|
|
|
|
|
|
|
|
|
|
|
|
|
|
|
| Cash and due from banks |
|
$ |
19,763 |
|
|
$ |
15,121 |
|
|
$ |
16,686 |
|
|
$ |
24,709 |
|
|
$ |
20,378 |
|
| Federal funds sold |
|
|
187,904 |
|
|
|
198,804 |
|
|
|
215,696 |
|
|
|
216,345 |
|
|
|
138,057 |
|
| Investment securities |
|
|
151,129 |
|
|
|
153,769 |
|
|
|
155,878 |
|
|
|
157,531 |
|
|
|
165,309 |
|
| Loans: |
|
|
|
|
|
|
|
|
|
|
|
|
|
|
|
|
|
|
|
|
| Commercial |
|
|
622,270 |
|
|
|
656,519 |
|
|
|
634,535 |
|
|
|
643,131 |
|
|
|
589,562 |
|
| Real estate other |
|
|
856,344 |
|
|
|
853,431 |
|
|
|
848,241 |
|
|
|
824,867 |
|
|
|
794,504 |
|
| Real estate construction and land |
|
|
60,595 |
|
|
|
63,928 |
|
|
|
63,730 |
|
|
|
71,523 |
|
|
|
63,189 |
|
| SBA |
|
|
4,936 |
|
|
|
5,610 |
|
|
|
7,220 |
|
|
|
8,565 |
|
|
|
13,310 |
|
| Other |
|
|
39,486 |
|
|
|
37,775 |
|
|
|
39,695 |
|
|
|
39,815 |
|
|
|
39,814 |
|
|
|
|
|
|
|
|
|
|
|
|
|
|
|
|
|
|
|
|
|
|
| Loans, gross |
|
|
1,583,631 |
|
|
|
1,617,263 |
|
|
|
1,593,421 |
|
|
|
1,587,901 |
|
|
|
1,500,379 |
|
| Unamortized net deferred loan costs (fees) |
|
|
1,637 |
|
|
|
1,765 |
|
|
|
2,040 |
|
|
|
1,902 |
|
|
|
2,570 |
|
| Allowance for credit losses |
|
|
(15,722 |
) |
|
|
(15,382 |
) |
|
|
(17,005 |
) |
|
|
(16,555 |
) |
|
|
(15,957 |
) |
|
|
|
|
|
|
|
|
|
|
|
|
|
|
|
|
|
|
|
|
|
| Loans, net |
|
|
1,569,546 |
|
|
|
1,603,646 |
|
|
|
1,578,456 |
|
|
|
1,573,248 |
|
|
|
1,486,992 |
|
| Premises and equipment, net |
|
|
2,625 |
|
|
|
2,848 |
|
|
|
3,072 |
|
|
|
3,382 |
|
|
|
3,736 |
|
| Bank owned life insurance |
|
|
25,519 |
|
|
|
25,334 |
|
|
|
25,127 |
|
|
|
24,955 |
|
|
|
24,788 |
|
| Goodwill and core deposit intangible |
|
|
7,452 |
|
|
|
7,462 |
|
|
|
7,472 |
|
|
|
7,483 |
|
|
|
7,493 |
|
| Accrued interest receivable and other assets |
|
|
41,708 |
|
|
|
43,790 |
|
|
|
39,828 |
|
|
|
40,848 |
|
|
|
38,599 |
|
|
|
|
|
|
|
|
|
|
|
|
|
|
|
|
|
|
|
|
|
|
| Total assets |
|
$ |
2,005,646 |
|
|
$ |
2,050,774 |
|
|
$ |
2,042,215 |
|
|
$ |
2,048,501 |
|
|
$ |
1,885,352 |
|
|
|
|
|
|
|
|
|
|
|
|
|
|
|
|
|
|
|
|
|
|
| LIABILITIES |
|
|
|
|
|
|
|
|
|
|
|
|
|
|
|
|
|
|
|
|
| Deposits: |
|
|
|
|
|
|
|
|
|
|
|
|
|
|
|
|
|
|
|
|
| Demand noninterest-bearing |
|
$ |
742,160 |
|
|
$ |
740,650 |
|
|
$ |
811,671 |
|
|
$ |
758,716 |
|
|
$ |
715,432 |
|
| Demand interest-bearing |
|
|
29,324 |
|
|
|
30,798 |
|
|
|
37,815 |
|
|
|
35,183 |
|
|
|
45,511 |
|
| Money market and savings |
|
|
633,620 |
|
|
|
616,864 |
|
|
|
671,016 |
|
|
|
597,244 |
|
|
|
626,156 |
|
| Time |
|
|
333,192 |
|
|
|
329,298 |
|
|
|
271,238 |
|
|
|
317,935 |
|
|
|
165,040 |
|
|
|
|
|
|
|
|
|
|
|
|
|
|
|
|
|
|
|
|
|
|
| Total deposits |
|
|
1,738,296 |
|
|
|
1,717,610 |
|
|
|
1,791,740 |
|
|
|
1,709,078 |
|
|
|
1,552,139 |
|
|
|
|
|
|
|
|
|
|
|
|
|
|
|
|
|
|
|
|
|
|
| Junior subordinated debt securities |
|
|
54,221 |
|
|
|
54,186 |
|
|
|
54,152 |
|
|
|
54,117 |
|
|
|
54,097 |
|
| Other borrowings |
|
|
— |
|
|
|
75,000 |
|
|
|
— |
|
|
|
100,000 |
|
|
|
100,000 |
|
| Accrued interest payable and other liabilities |
|
|
28,894 |
|
|
|
25,417 |
|
|
|
24,069 |
|
|
|
21,248 |
|
|
|
20,372 |
|
|
|
|
|
|
|
|
|
|
|
|
|
|
|
|
|
|
|
|
|
|
| Total liabilities |
|
|
1,821,411 |
|
|
|
1,872,213 |
|
|
|
1,869,961 |
|
|
|
1,884,443 |
|
|
|
1,726,608 |
|
|
|
|
|
|
|
|
|
|
|
|
|
|
|
|
|
|
|
|
|
|
| SHAREHOLDERS’ EQUITY |
|
|
|
|
|
|
|
|
|
|
|
|
|
|
|
|
|
|
|
|
| Common stock |
|
|
112,167 |
|
|
|
111,609 |
|
|
|
111,257 |
|
|
|
110,786 |
|
|
|
110,289 |
|
| Retained earnings |
|
|
73,423 |
|
|
|
68,082 |
|
|
|
62,297 |
|
|
|
54,628 |
|
|
|
49,106 |
|
| Accumulated other comprehensive loss |
|
|
(1,355 |
) |
|
|
(1,130 |
) |
|
|
(1,300 |
) |
|
|
(1,356 |
) |
|
|
(651 |
) |
|
|
|
|
|
|
|
|
|
|
|
|
|
|
|
|
|
|
|
|
|
| Total shareholders’ equity |
|
|
184,235 |
|
|
|
178,561 |
|
|
|
172,254 |
|
|
|
164,058 |
|
|
|
158,744 |
|
|
|
|
|
|
|
|
|
|
|
|
|
|
|
|
|
|
|
|
|
|
| Total liabilities and shareholders’ equity |
|
$ |
2,005,646 |
|
|
$ |
2,050,774 |
|
|
$ |
2,042,215 |
|
|
$ |
2,048,501 |
|
|
$ |
1,885,352 |
|
|
|
|
|
|
|
|
|
|
|
|
|
|
|
|
|
|
|
|
|
|
| |
|
|
|
|
|
|
|
|
|
|
|
|
|
|
|
| CAPITAL ADEQUACY |
|
|
|
|
|
|
|
|
|
|
|
|
|
|
|
|
|
|
|
|
| Tier I leverage ratio |
|
|
9.01 |
% |
|
|
8.76 |
% |
|
|
7.98 |
% |
|
|
8.21 |
% |
|
|
8.27 |
% |
| Tier I risk-based capital ratio |
|
|
9.07 |
% |
|
|
8.54 |
% |
|
|
8.23 |
% |
|
|
7.98 |
% |
|
|
8.09 |
% |
| Total risk-based capital ratio |
|
|
12.73 |
% |
|
|
12.08 |
% |
|
|
11.77 |
% |
|
|
11.57 |
% |
|
|
11.84 |
% |
| Total equity/ total assets |
|
|
9.19 |
% |
|
|
8.71 |
% |
|
|
8.43 |
% |
|
|
8.01 |
% |
|
|
8.42 |
% |
| Book value per share |
|
$ |
21.98 |
|
|
$ |
21.37 |
|
|
$ |
20.67 |
|
|
$ |
19.70 |
|
|
$ |
19.09 |
|
| Common shares outstanding |
|
|
8,383,772 |
|
|
|
8,355,378 |
|
|
|
8,332,479 |
|
|
|
8,327,781 |
|
|
|
8,317,161 |
|
CALIFORNIA BANCORP AND SUBSIDIARY
INTERIM CONSOLIDATED AVERAGE BALANCE SHEET AND YIELD DATA (UNAUDITED)
(Dollars in Thousands)
|
|
|
|
|
|
|
|
|
|
|
|
|
|
|
|
|
|
|
|
|
|
|
|
|
| |
|
Three months ended June 30, |
|
|
Three months ended March 31, |
|
| |
|
2023 |
|
|
2023 |
|
| |
|
Average
Balance |
|
|
Yields
or
Rates |
|
|
Interest
Income/
Expense |
|
|
Average
Balance |
|
|
Yields
or
Rates |
|
|
Interest
Income/
Expense |
|
| ASSETS |
|
|
|
|
|
|
|
|
|
|
|
|
|
|
|
|
|
|
|
|
|
|
|
|
| Interest earning assets: |
|
|
|
|
|
|
|
|
|
|
|
|
|
|
|
|
|
|
|
|
|
|
|
|
| Loans (1) |
|
$ |
1,577,529 |
|
|
|
5.97 |
% |
|
$ |
23,476 |
|
|
$ |
1,582,332 |
|
|
|
5.76 |
% |
|
$ |
22,472 |
|
| Federal funds sold |
|
|
170,608 |
|
|
|
5.26 |
% |
|
|
2,238 |
|
|
|
156,941 |
|
|
|
4.55 |
% |
|
|
1,760 |
|
| Investment securities |
|
|
152,781 |
|
|
|
3.83 |
% |
|
|
1,458 |
|
|
|
154,667 |
|
|
|
3.43 |
% |
|
|
1,307 |
|
|
|
|
|
|
|
|
|
|
|
|
|
|
|
|
|
|
|
|
|
|
|
|
|
|
| Total interest earning assets |
|
|
1,900,918 |
|
|
|
5.73 |
% |
|
|
27,172 |
|
|
|
1,893,940 |
|
|
|
5.47 |
% |
|
|
25,539 |
|
|
|
|
|
|
|
|
|
|
|
|
|
|
|
|
|
|
|
|
|
|
|
|
|
|
| Noninterest-earning assets: |
|
|
|
|
|
|
|
|
|
|
|
|
|
|
|
|
|
|
|
|
|
|
|
|
| Cash and due from banks |
|
|
19,207 |
|
|
|
|
|
|
|
|
|
|
|
18,098 |
|
|
|
|
|
|
|
|
|
| All other assets (2) |
|
|
63,752 |
|
|
|
|
|
|
|
|
|
|
|
62,247 |
|
|
|
|
|
|
|
|
|
|
|
|
|
|
|
|
|
|
|
|
|
|
|
|
|
|
|
|
|
|
|
|
|
|
| TOTAL |
|
$ |
1,983,877 |
|
|
|
|
|
|
|
|
|
|
$ |
1,974,285 |
|
|
|
|
|
|
|
|
|
|
|
|
|
|
|
|
|
|
|
|
|
|
|
|
|
|
|
|
|
|
|
|
|
|
| LIABILITIES AND SHAREHOLDERS’ EQUITY |
|
|
|
|
|
|
|
|
|
|
|
|
|
|
|
|
|
|
|
|
|
|
|
|
| Interest-bearing liabilities: |
|
|
|
|
|
|
|
|
|
|
|
|
|
|
|
|
|
|
|
|
|
|
|
|
| Deposits: |
|
|
|
|
|
|
|
|
|
|
|
|
|
|
|
|
|
|
|
|
|
|
|
|
| Demand |
|
$ |
30,346 |
|
|
|
0.16 |
% |
|
|
12 |
|
|
$ |
34,032 |
|
|
|
0.08 |
% |
|
$ |
7 |
|
| Money market and savings |
|
|
609,200 |
|
|
|
2.50 |
% |
|
|
3,793 |
|
|
|
626,666 |
|
|
|
2.01 |
% |
|
|
3,104 |
|
| Time |
|
|
326,291 |
|
|
|
4.53 |
% |
|
|
3,688 |
|
|
|
310,246 |
|
|
|
3.81 |
% |
|
|
2,911 |
|
| Other |
|
|
90,188 |
|
|
|
4.59 |
% |
|
|
1,033 |
|
|
|
71,108 |
|
|
|
4.33 |
% |
|
|
760 |
|
|
|
|
|
|
|
|
|
|
|
|
|
|
|
|
|
|
|
|
|
|
|
|
|
|
| Total interest-bearing liabilities |
|
|
1,056,025 |
|
|
|
3.24 |
% |
|
|
8,526 |
|
|
|
1,042,052 |
|
|
|
2.64 |
% |
|
|
6,782 |
|
|
|
|
|
|
|
|
|
|
|
|
|
|
|
|
|
|
|
|
|
|
|
|
|
|
| Noninterest-bearing liabilities: |
|
|
|
|
|
|
|
|
|
|
|
|
|
|
|
|
|
|
|
|
|
|
|
|
| Demand deposits |
|
|
718,171 |
|
|
|
|
|
|
|
|
|
|
|
728,986 |
|
|
|
|
|
|
|
|
|
| Accrued expenses and other liabilities |
|
|
26,441 |
|
|
|
|
|
|
|
|
|
|
|
26,326 |
|
|
|
|
|
|
|
|
|
| Shareholders’ equity |
|
|
183,240 |
|
|
|
|
|
|
|
|
|
|
|
176,921 |
|
|
|
|
|
|
|
|
|
|
|
|
|
|
|
|
|
|
|
|
|
|
|
|
|
|
|
|
|
|
|
|
|
|
| TOTAL |
|
$ |
1,983,877 |
|
|
|
|
|
|
|
|
|
|
$ |
1,974,285 |
|
|
|
|
|
|
|
|
|
|
|
|
|
|
|
|
|
|
|
|
|
|
|
|
|
|
|
|
|
|
|
|
|
|
|
|
|
|
|
|
|
|
|
|
|
|
|
|
|
|
|
|
|
|
|
|
|
|
|
| Net interest income and margin (3) |
|
|
|
|
|
|
3.93 |
% |
|
$ |
18,646 |
|
|
|
|
|
|
|
4.02 |
% |
|
$ |
18,757 |
|
|
|
|
|
|
|
|
|
|
|
|
|
|
|
|
|
|
|
|
|
|
|
|
|
|
| (1) |
Nonperforming loans are included in average loan balances. No adjustment has been made for these loans in the
calculation of yields. Interest income on loans includes amortization of net deferred loan costs of $175,000 and $226,000, respectively. |
| (2) |
Other noninterest-earning assets includes the allowance for credit losses of $15.4 million and
$17.0 million, respectively. |
| (3) |
Net interest margin is net interest income divided by total interest-earning assets.
|
CALIFORNIA BANCORP AND SUBSIDIARY
INTERIM CONSOLIDATED AVERAGE BALANCE SHEET AND YIELD DATA (UNAUDITED)
(Dollars in Thousands)
|
|
|
|
|
|
|
|
|
|
|
|
|
|
|
|
|
|
|
|
|
|
|
|
|
| |
|
Three months ended June 30, |
|
| |
|
2023 |
|
|
2022 |
|
| |
|
Average
Balance |
|
|
Yields
or
Rates |
|
|
Interest
Income/
Expense |
|
|
Average
Balance |
|
|
Yields
or
Rates |
|
|
Interest
Income/
Expense |
|
| ASSETS |
|
|
|
|
|
|
|
|
|
|
|
|
|
|
|
|
|
|
|
|
|
|
|
|
| Interest earning assets: |
|
|
|
|
|
|
|
|
|
|
|
|
|
|
|
|
|
|
|
|
|
|
|
|
| Loans (1) |
|
$ |
1,577,529 |
|
|
|
5.97 |
% |
|
$ |
23,476 |
|
|
$ |
1,464,922 |
|
|
|
4.46 |
% |
|
$ |
16,298 |
|
| Federal funds sold |
|
|
170,608 |
|
|
|
5.26 |
% |
|
|
2,238 |
|
|
|
145,329 |
|
|
|
0.77 |
% |
|
|
280 |
|
| Investment securities |
|
|
152,781 |
|
|
|
3.83 |
% |
|
|
1,458 |
|
|
|
172,766 |
|
|
|
2.62 |
% |
|
|
1,128 |
|
|
|
|
|
|
|
|
|
|
|
|
|
|
|
|
|
|
|
|
|
|
|
|
|
|
| Total interest earning assets |
|
|
1,900,918 |
|
|
|
5.73 |
% |
|
|
27,172 |
|
|
|
1,783,017 |
|
|
|
3.98 |
% |
|
|
17,706 |
|
|
|
|
|
|
|
|
|
|
|
|
|
|
|
|
|
|
|
|
|
|
|
|
|
|
| Noninterest-earning assets: |
|
|
|
|
|
|
|
|
|
|
|
|
|
|
|
|
|
|
|
|
|
|
|
|
| Cash and due from banks |
|
|
19,207 |
|
|
|
|
|
|
|
|
|
|
|
19,735 |
|
|
|
|
|
|
|
|
|
| All other assets (2) |
|
|
63,752 |
|
|
|
|
|
|
|
|
|
|
|
61,444 |
|
|
|
|
|
|
|
|
|
|
|
|
|
|
|
|
|
|
|
|
|
|
|
|
|
|
|
|
|
|
|
|
|
|
| TOTAL |
|
$ |
1,983,877 |
|
|
|
|
|
|
|
|
|
|
$ |
1,864,196 |
|
|
|
|
|
|
|
|
|
|
|
|
|
|
|
|
|
|
|
|
|
|
|
|
|
|
|
|
|
|
|
|
|
|
| LIABILITIES AND SHAREHOLDERS’ EQUITY |
|
|
|
|
|
|
|
|
|
|
|
|
|
|
|
|
|
|
|
|
|
|
|
|
| Interest-bearing liabilities: |
|
|
|
|
|
|
|
|
|
|
|
|
|
|
|
|
|
|
|
|
|
|
|
|
| Deposits: |
|
|
|
|
|
|
|
|
|
|
|
|
|
|
|
|
|
|
|
|
|
|
|
|
| Demand |
|
$ |
30,346 |
|
|
|
0.16 |
% |
|
|
12 |
|
|
$ |
42,380 |
|
|
|
0.08 |
% |
|
$ |
8 |
|
| Money market and savings |
|
|
609,200 |
|
|
|
2.50 |
% |
|
|
3,793 |
|
|
|
636,692 |
|
|
|
0.37 |
% |
|
|
582 |
|
| Time |
|
|
326,291 |
|
|
|
4.53 |
% |
|
|
3,688 |
|
|
|
153,859 |
|
|
|
0.54 |
% |
|
|
206 |
|
| Other |
|
|
90,188 |
|
|
|
4.59 |
% |
|
|
1,033 |
|
|
|
119,970 |
|
|
|
2.30 |
% |
|
|
687 |
|
|
|
|
|
|
|
|
|
|
|
|
|
|
|
|
|
|
|
|
|
|
|
|
|
|
| Total interest-bearing liabilities |
|
|
1,056,025 |
|
|
|
3.24 |
% |
|
|
8,526 |
|
|
|
952,901 |
|
|
|
0.62 |
% |
|
|
1,483 |
|
|
|
|
|
|
|
|
|
|
|
|
|
|
|
|
|
|
|
|
|
|
|
|
|
|
| Noninterest-bearing liabilities: |
|
|
|
|
|
|
|
|
|
|
|
|
|
|
|
|
|
|
|
|
|
|
|
|
| Demand deposits |
|
|
718,171 |
|
|
|
|
|
|
|
|
|
|
|
734,481 |
|
|
|
|
|
|
|
|
|
| Accrued expenses and other liabilities |
|
|
26,441 |
|
|
|
|
|
|
|
|
|
|
|
19,139 |
|
|
|
|
|
|
|
|
|
| Shareholders’ equity |
|
|
183,240 |
|
|
|
|
|
|
|
|
|
|
|
157,675 |
|
|
|
|
|
|
|
|
|
|
|
|
|
|
|
|
|
|
|
|
|
|
|
|
|
|
|
|
|
|
|
|
|
|
| TOTAL |
|
$ |
1,983,877 |
|
|
|
|
|
|
|
|
|
|
$ |
1,864,196 |
|
|
|
|
|
|
|
|
|
|
|
|
|
|
|
|
|
|
|
|
|
|
|
|
|
|
|
|
|
|
|
|
|
|
|
|
|
|
|
|
|
|
|
|
|
|
|
|
|
|
|
|
|
|
|
|
|
|
|
| Net interest income and margin (3) |
|
|
|
|
|
|
3.93 |
% |
|
$ |
18,646 |
|
|
|
|
|
|
|
3.65 |
% |
|
$ |
16,223 |
|
|
|
|
|
|
|
|
|
|
|
|
|
|
|
|
|
|
|
|
|
|
|
|
|
|
| (1) |
Nonperforming loans are included in average loan balances. No adjustment has been made for these loans in the
calculation of yields. Interest income on loans includes amortization of net deferred loan (costs) fees of $(175,000) and $83,000, respectively. |
| (2) |
Other noninterest-earning assets includes the allowance for credit losses of $15.4 million and
$15.0 million, respectively. |
| (3) |
Net interest margin is net interest income divided by total interest-earning assets. |
CALIFORNIA BANCORP AND SUBSIDIARY
INTERIM CONSOLIDATED AVERAGE BALANCE SHEET AND YIELD DATA (UNAUDITED)
(Dollars in Thousands)
|
|
|
|
|
|
|
|
|
|
|
|
|
|
|
|
|
|
|
|
|
|
|
|
|
| |
|
Six months ended June 30, |
|
| |
|
2023 |
|
|
2022 |
|
| |
|
Average
Balance |
|
|
Yields
or
Rates |
|
|
Interest
Income/
Expense |
|
|
Average
Balance |
|
|
Yields
or
Rates |
|
|
Interest
Income/
Expense |
|
| ASSETS |
|
|
|
|
|
|
|
|
|
|
|
|
|
|
|
|
|
|
|
|
|
|
|
|
| Interest earning assets: |
|
|
|
|
|
|
|
|
|
|
|
|
|
|
|
|
|
|
|
|
|
|
|
|
| Loans (1) |
|
$ |
1,579,917 |
|
|
|
5.86 |
% |
|
$ |
45,948 |
|
|
$ |
1,418,314 |
|
|
|
4.43 |
% |
|
$ |
31,184 |
|
| Federal funds sold |
|
|
163,812 |
|
|
|
4.92 |
% |
|
|
3,998 |
|
|
|
244,809 |
|
|
|
0.34 |
% |
|
|
416 |
|
| Investment securities |
|
|
153,719 |
|
|
|
3.63 |
% |
|
|
2,765 |
|
|
|
151,324 |
|
|
|
2.71 |
% |
|
|
2,030 |
|
|
|
|
|
|
|
|
|
|
|
|
|
|
|
|
|
|
|
|
|
|
|
|
|
|
| Total interest earning assets |
|
|
1,897,448 |
|
|
|
5.60 |
% |
|
|
52,711 |
|
|
|
1,814,447 |
|
|
|
3.74 |
% |
|
|
33,630 |
|
|
|
|
|
|
|
|
|
|
|
|
|
|
|
|
|
|
|
|
|
|
|
|
|
|
| Noninterest-earning assets: |
|
|
|
|
|
|
|
|
|
|
|
|
|
|
|
|
|
|
|
|
|
|
|
|
| Cash and due from banks |
|
|
18,656 |
|
|
|
|
|
|
|
|
|
|
|
19,244 |
|
|
|
|
|
|
|
|
|
| All other assets (2) |
|
|
63,003 |
|
|
|
|
|
|
|
|
|
|
|
62,500 |
|
|
|
|
|
|
|
|
|
|
|
|
|
|
|
|
|
|
|
|
|
|
|
|
|
|
|
|
|
|
|
|
|
|
| TOTAL |
|
$ |
1,979,107 |
|
|
|
|
|
|
|
|
|
|
$ |
1,896,191 |
|
|
|
|
|
|
|
|
|
|
|
|
|
|
|
|
|
|
|
|
|
|
|
|
|
|
|
|
|
|
|
|
|
|
| LIABILITIES AND SHAREHOLDERS’ EQUITY |
|
|
|
|
|
|
|
|
|
|
|
|
|
|
|
|
|
|
|
|
|
|
|
|
| Interest-bearing liabilities: |
|
|
|
|
|
|
|
|
|
|
|
|
|
|
|
|
|
|
|
|
|
|
|
|
| Deposits: |
|
|
|
|
|
|
|
|
|
|
|
|
|
|
|
|
|
|
|
|
|
|
|
|
| Demand |
|
$ |
32,179 |
|
|
|
0.12 |
% |
|
|
19 |
|
|
$ |
40,300 |
|
|
|
0.09 |
% |
|
|
17 |
|
| Money market and savings |
|
|
617,885 |
|
|
|
2.25 |
% |
|
|
6,897 |
|
|
|
679,662 |
|
|
|
0.37 |
% |
|
|
1,247 |
|
| Time |
|
|
318,313 |
|
|
|
4.18 |
% |
|
|
6,599 |
|
|
|
151,588 |
|
|
|
0.45 |
% |
|
|
338 |
|
| Other |
|
|
80,701 |
|
|
|
4.48 |
% |
|
|
1,793 |
|
|
|
110,370 |
|
|
|
2.34 |
% |
|
|
1,279 |
|
|
|
|
|
|
|
|
|
|
|
|
|
|
|
|
|
|
|
|
|
|
|
|
|
|
| Total interest-bearing liabilities |
|
|
1,049,078 |
|
|
|
2.94 |
% |
|
|
15,308 |
|
|
|
981,920 |
|
|
|
0.59 |
% |
|
|
2,881 |
|
|
|
|
|
|
|
|
|
|
|
|
|
|
|
|
|
|
|
|
|
|
|
|
|
|
| Noninterest-bearing liabilities: |
|
|
|
|
|
|
|
|
|
|
|
|
|
|
|
|
|
|
|
|
|
|
|
|
| Demand deposits |
|
|
723,548 |
|
|
|
|
|
|
|
|
|
|
|
737,928 |
|
|
|
|
|
|
|
|
|
| Accrued expenses and other liabilities |
|
|
26,383 |
|
|
|
|
|
|
|
|
|
|
|
20,724 |
|
|
|
|
|
|
|
|
|
| Shareholders’ equity |
|
|
180,098 |
|
|
|
|
|
|
|
|
|
|
|
155,619 |
|
|
|
|
|
|
|
|
|
|
|
|
|
|
|
|
|
|
|
|
|
|
|
|
|
|
|
|
|
|
|
|
|
|
| TOTAL |
|
$ |
1,979,107 |
|
|
|
|
|
|
|
|
|
|
$ |
1,896,191 |
|
|
|
|
|
|
|
|
|
|
|
|
|
|
|
|
|
|
|
|
|
|
|
|
|
|
|
|
|
|
|
|
|
|
|
|
|
|
|
|
|
|
|
|
|
|
|
|
|
|
|
|
|
|
|
|
|
|
|
| Net interest income and margin (3) |
|
|
|
|
|
|
3.98 |
% |
|
$ |
37,403 |
|
|
|
|
|
|
|
3.42 |
% |
|
$ |
30,749 |
|
|
|
|
|
|
|
|
|
|
|
|
|
|
|
|
|
|
|
|
|
|
|
|
|
|
| (1) |
Nonperforming loans are included in average loan balances. No adjustment has been made for these loans in the
calculation of yields. Interest income on loans includes amortization of net deferred loan (costs) fees of $(401,000) and $402,000, respectively. |
| (2) |
Other noninterest-earning assets includes the allowance for loan losses of $16.2 million and
$14.6 million, respectively. |
| (3) |
Net interest margin is net interest income divided by total interest-earning assets. |
CALIFORNIA BANCORP AND SUBSIDIARY
INTERIM CONSOLIDATED NON GAAP DATA (UNAUDITED)
(Dollars in Thousands)
|
|
|
|
|
|
|
|
|
|
|
|
|
|
|
|
|
|
|
|
|
| REVENUE: |
|
Three months ended |
|
|
Six months ended |
|
| |
|
06/30/23 |
|
|
03/31/23 |
|
|
06/30/22 |
|
|
06/30/23 |
|
|
06/30/22 |
|
| Net interest income |
|
$ |
18,646 |
|
|
$ |
18,757 |
|
|
$ |
16,223 |
|
|
$ |
37,403 |
|
|
$ |
30,749 |
|
| Non-interest income |
|
|
1,135 |
|
|
|
1,107 |
|
|
|
1,394 |
|
|
|
2,242 |
|
|
|
3,928 |
|
|
|
|
|
|
|
|
|
|
|
|
|
|
|
|
|
|
|
|
|
|
| Total revenue |
|
$ |
19,781 |
|
|
$ |
19,864 |
|
|
$ |
17,617 |
|
|
$ |
39,645 |
|
|
$ |
34,677 |
|
|
|
|
|
|
|
|
|
|
|
|
|
|
|
|
|
|
|
|
|
|
|
|
|
| NON-INTEREST EXPENSE: |
|
Three months ended |
|
|
Six months ended |
|
| |
|
06/30/23 |
|
|
03/31/23 |
|
|
06/30/22 |
|
|
06/30/23 |
|
|
06/30/22 |
|
| Total non-interest expense |
|
$ |
11,603 |
|
|
$ |
11,843 |
|
|
$ |
10,819 |
|
|
$ |
23,446 |
|
|
$ |
21,735 |
|
| Total capitalized loan origination costs |
|
|
694 |
|
|
|
651 |
|
|
|
1,073 |
|
|
|
1,345 |
|
|
|
2,057 |
|
|
|
|
|
|
|
|
|
|
|
|
|
|
|
|
|
|
|
|
|
|
| Total operating expenses, before capitalization of loan origination costs |
|
$ |
12,297 |
|
|
$ |
12,494 |
|
|
$ |
11,892 |
|
|
$ |
24,791 |
|
|
$ |
23,792 |
|
|
|
|
|
|
|
|
|
|
|
|
|
|
|
|
|
|
|
|
|
|

Exhibit 99.2 INVESTOR PRESENTATION Q2 2023 Steven E. Shelton Thomas A.
Sa CEO President, CFO & COO
FORWARD-LOOKING STATEMENTS During the course of the presentation and any
transcript that may result, written or otherwise, California BanCorp (the “Company”) may make projections or other forward-looking statements regarding a variety of items. Such forward-looking statements are based upon current
expectations and involve risks and uncertainties. Actual results may differ materially from those stated in any forward-looking statement based on a number of important factors and risks. Although the Company may indicate and believe that the
assumptions underlying the forward-looking statements are reasonable, any of the assumptions could prove inaccurate or incorrect and therefore, there can be no assurance that the results contemplated in the forward-looking statements will be
realized. The Company undertakes no obligation to release publicly the results of any revisions to the forward-looking statements included herein to reflect events or circumstances after today, or to reflect the occurrence of unanticipated events.
The Company claims the protection of the safe harbor for forward-looking statements contained in the Private Securities Litigation Reform Act of 1995. 2
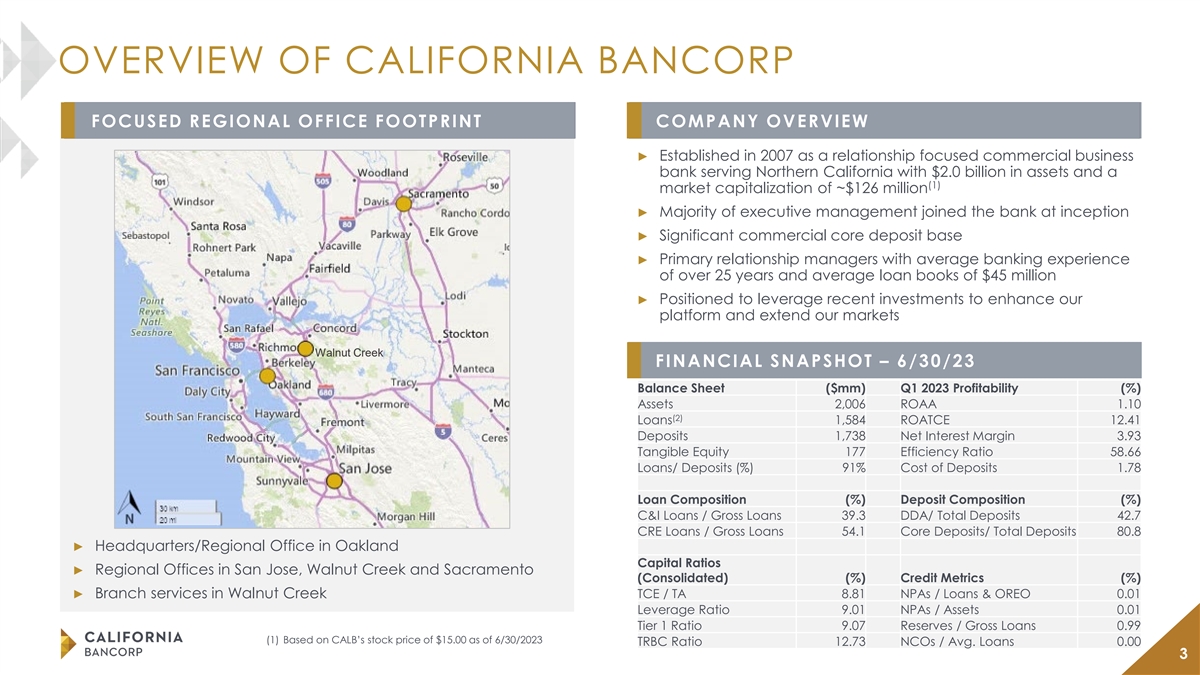
OVERVIEW OF CALIFORNIA BANCORP FOCUSED REGIONAL OFFICE FOOTPRINT COMPANY
OVERVIEW ► Established in 2007 as a relationship focused commercial business bank serving Northern California with $2.0 billion in assets and a (1) market capitalization of ~$126 million ► Majority of executive management joined the bank
at inception ► Significant commercial core deposit base ► Primary relationship managers with average banking experience of over 25 years and average loan books of $45 million ► Positioned to leverage recent investments to enhance
our platform and extend our markets Walnut Creek FINANCIAL SNAPSHOT – 6/30/23 Balance Sheet ($mm) Q1 2023 Profitability (%) Assets 2,006 ROAA 1.10 (2) Loans 1,584 ROATCE 12.41 Deposits 1,738 Net Interest Margin 3.93 Tangible Equity 177
Efficiency Ratio 58.66 Loans/ Deposits (%) 91% Cost of Deposits 1.78 Loan Composition (%) Deposit Composition (%) C&I Loans / Gross Loans 39.3 DDA/ Total Deposits 42.7 CRE Loans / Gross Loans 54.1 Core Deposits/ Total Deposits 80.8 ►
Headquarters/Regional Office in Oakland Capital Ratios ► Regional Offices in San Jose, Walnut Creek and Sacramento (Consolidated) (%) Credit Metrics (%) ► Branch services in Walnut Creek TCE / TA 8.81 NPAs / Loans & OREO 0.01
Leverage Ratio 9.01 NPAs / Assets 0.01 Tier 1 Ratio 9.07 Reserves / Gross Loans 0.99 (1) Based on CALB’s stock price of $15.00 as of 6/30/2023 TRBC Ratio 12.73 NCOs / Avg. Loans 0.00 3

INVESTMENT HIGHLIGHTS Branch light, commercial Experienced management
focused business bank with team and seasoned C&I Proven organic and strong middle market relationship teams with strong acquisitive growth story relationships throughout ties to the local markets Northern California Strong earnings outlook as
Quality core deposit Disciplined underwriting franchise and commercial standards with best-in-class efficiencies from investments relationship strategy asset quality metrics are realized 4 3
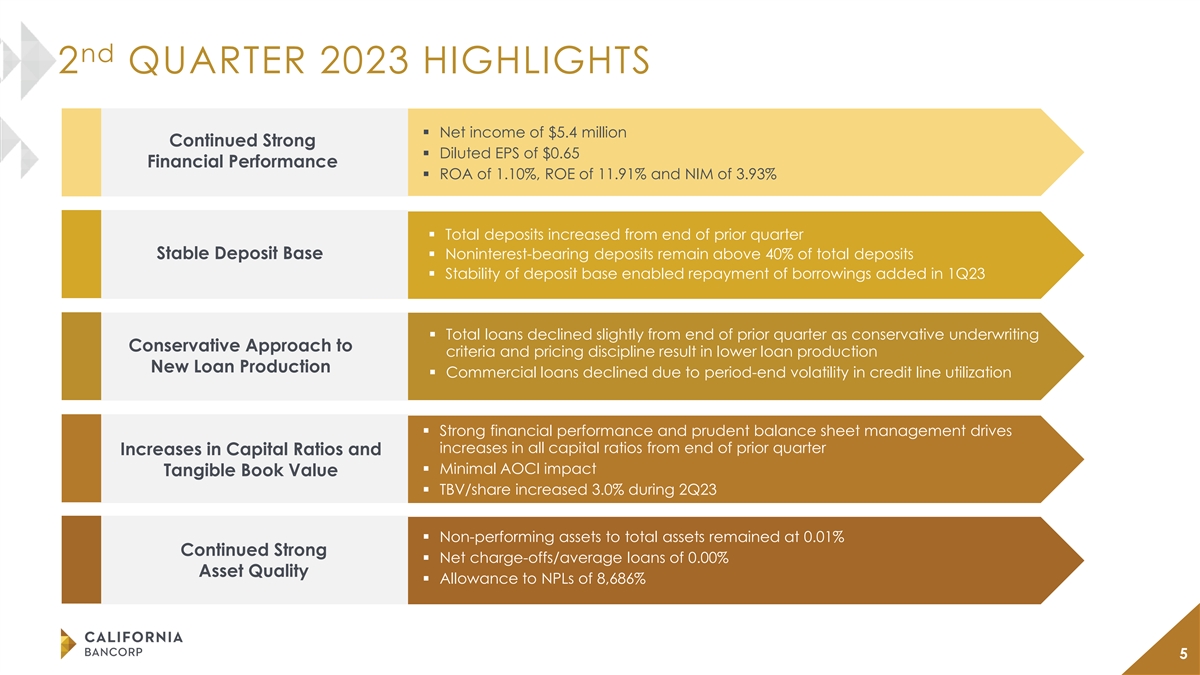
nd 2 QUARTER 2023 HIGHLIGHTS § Net income of $5.4 million Continued
Strong § Diluted EPS of $0.65 Financial Performance § ROA of 1.10%, ROE of 11.91% and NIM of 3.93% § Total deposits increased from end of prior quarter Stable Deposit Base § Noninterest-bearing deposits remain above 40% of total
deposits § Stability of deposit base enabled repayment of borrowings added in 1Q23 § Total loans declined slightly from end of prior quarter as conservative underwriting Conservative Approach to criteria and pricing discipline result in
lower loan production New Loan Production § Commercial loans declined due to period-end volatility in credit line utilization § Strong financial performance and prudent balance sheet management drives increases in all capital ratios from
end of prior quarter Increases in Capital Ratios and § Minimal AOCI impact Tangible Book Value § TBV/share increased 3.0% during 2Q23 § Non-performing assets to total assets remained at 0.01% Continued Strong § Net
charge-offs/average loans of 0.00% Asset Quality § Allowance to NPLs of 8,686% 5
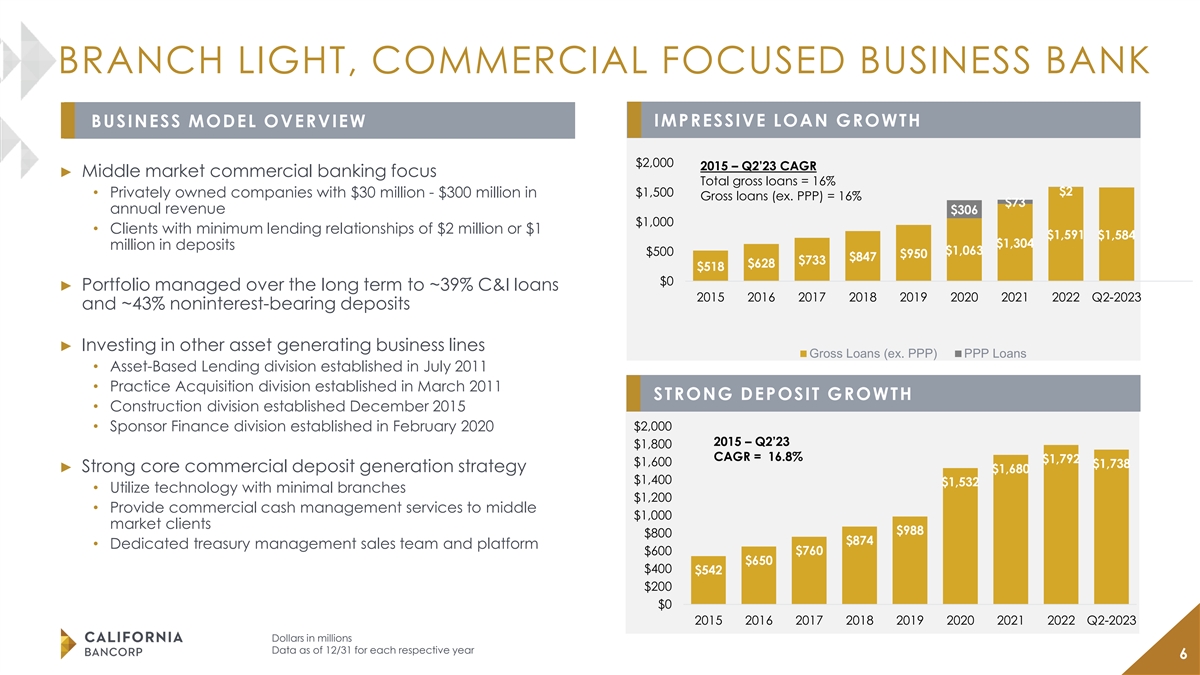
BRANCH LIGHT, COMMERCIAL FOCUSED BUSINESS BANK IMPRESSIVE LOAN GROWTH
BUSINESS MODEL OVERVIEW $2,000 2015 – Q2’23 CAGR ► Middle market commercial banking focus Total gross loans = 16% $1,500 $2 • Privately owned companies with $30 million - $300 million in Gross loans (ex. PPP) = 16% $73 annual
revenue $306 $1,000 • Clients with minimum lending relationships of $2 million or $1 $1,591 $1,584 $1,304 million in deposits $1,063 $500 $950 $847 $733 $628 $518 $0 ► Portfolio managed over the long term to ~39% C&I loans 2015 2016
2017 2018 2019 2020 2021 2022 Q2-2023 and ~43% noninterest-bearing deposits ► Investing in other asset generating business lines Gross Loans (ex. PPP) PPP Loans • Asset-Based Lending division established in July 2011 • Practice
Acquisition division established in March 2011 STRONG DEPOSIT GROWTH • Construction division established December 2015 • Sponsor Finance division established in February 2020 $2,000 2015 – Q2’23 $1,800 CAGR = 16.8% $1,792
$1,600 $1,738 ► Strong core commercial deposit generation strategy $1,680 $1,400 $1,532 • Utilize technology with minimal branches $1,200 • Provide commercial cash management services to middle $1,000 market clients $988 $800 $874
• Dedicated treasury management sales team and platform $600 $760 $650 $400 $542 $200 $0 2015 2016 2017 2018 2019 2020 2021 2022 Q2-2023 Dollars in millions Data as of 12/31 for each respective year 6

TAKING SHARE FROM NATIONAL/REGIONAL BANKS PRODUCT AND SERVICE
DIFFERENTIATION OUR “TYPICAL CLIENT” Combine Capabilities of a Big Bank with the $8 M ~$75 M $3 M High Service Levels of a Community Bank revolving line in annual equipment with $3 M average ► Attract top talent with deep market
experience to compete revenue term loan outstanding against and win business from large banks ► Professional team with a consultative delivery process $5 M $5 M $3 M ► Invest in systems, tools, and technology for success in niche markets
money market commercial real demand deposit accounts to hold ► Offer clients access to key decision makers estate loan operating account surplus deposits ► Ability to execute quickly, with market leading responsiveness Fee income driven
by commercial portfolio account analysis and treasury management services INDUSTRY & SPECIALTY LENDING FOCUS Commercial Banking Focused on Four Core Industries Manufacturing and Professional Contractor Investor CRE Distribution Specialty Lending
Groups Practice Asset Based Sponsor Construction Acquisition Lending Finance 7
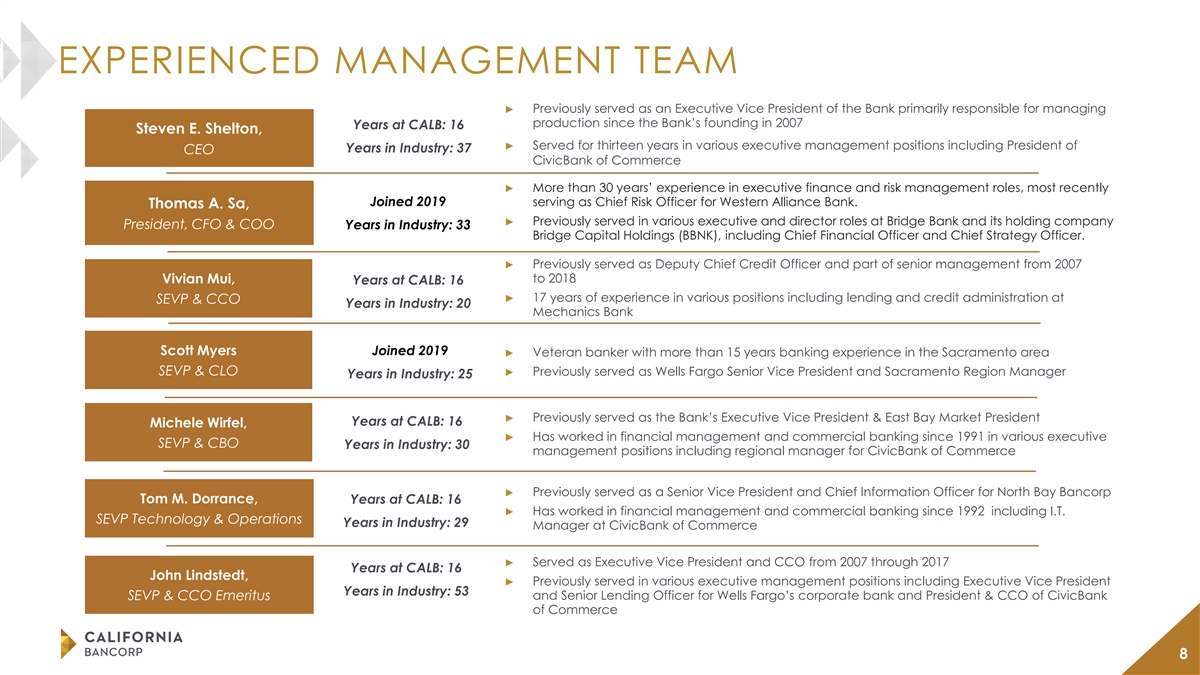
EXPERIENCED MANAGEMENT TEAM ► Previously served as an Executive
Vice President of the Bank primarily responsible for managing production since the Bank’s founding in 2007 Years at CALB: 16 Steven E. Shelton, Age : 58 ► Served for thirteen years in various executive management positions including
President of Years in Industry: 37 CEO CivicBank of Commerce ► More than 30 years’ experience in executive finance and risk management roles, most recently Joined 2019 serving as Chief Risk Officer for Western Alliance Bank. Thomas A.
Sa, Age: ► Previously served in various executive and director roles at Bridge Bank and its holding company 57 President, CFO & COO Years in Industry: 33 Bridge Capital Holdings (BBNK), including Chief Financial Officer and Chief Strategy
Officer. ► Previously served as Deputy Chief Credit Officer and part of senior management from 2007 to 2018 Vivian Mui, Years at CALB: 16 Age Age : 84 : 40► 17 years of experience in various positions including lending and credit
administration at SEVP & CCO Years in Industry: 20 Mechanics Bank Scott Myers Joined 2019 ► Veteran banker with more than 15 years banking experience in the Sacramento area Age : 49 SEVP & CLO► Previously served as Wells Fargo
Senior Vice President and Sacramento Region Manager Years in Industry: 25 ► Previously served as the Bank’s Executive Vice President & East Bay Market President Years at CALB: 16 Michele Wirfel, Age ► Has worked in financial
management and commercial banking since 1991 in various executive : 51 SEVP & CBO Years in Industry: 30 management positions including regional manager for CivicBank of Commerce ► Previously served as a Senior Vice President and Chief
Information Officer for North Bay Bancorp Tom M. Dorrance, Years at CALB: 16 Age ► Has worked in financial management and commercial banking since 1992 including I.T. : 57 SEVP Technology & Operations Years in Industry: 29 Manager at
CivicBank of Commerce ► Served as Executive Vice President and CCO from 2007 through 2017 Years at CALB: 16 John Lindstedt, ► Previously served in various executive management positions including Executive Vice President Years in
Industry: 53 SEVP & CCO Emeritus and Senior Lending Officer for Wells Fargo’s corporate bank and President & CCO of CivicBank of Commerce 8

DEMONSTRATED GROWTH TRACK RECORD SUCCESSFUL EXPANSION THROUGHOUT
NORTHERN CALIFORNIA Launched Sponsor 2015 – Completed Holding Company formed Finance in February Completed $25.0 $4 million private placement expansion into Q2’23 Asset 2020 in June 2017 million private offering at $12.86 per share to
the CAGR of Walnut Creek LPO opened offering of payoff SBLF in May 2016 Listed on the Sacramento common stock in 16.1% in July 2017 NASDAQ stock Region August 2018 Completed acquisition of Pan market in March Pacific Bank ($131 million in 2020
Completed assets) in December 2015 Completed $20 $35 million million sub-debt $16 million common stock sub-debt offering in offering at $9.90 per share to offering in September 2020 August 2021 fund growth in June 2014 Bank founded in March 2007
with Practice Acquisition $27.5 million in Division opened in capital March 2011 $21.09 $19.78 San Jose ABL Division $17.33 opened in July 2011 $15.77 $15.16 $2,042 $2,015 $2,006 $1,906 $14.20 $12.01 $11.16 $10.48 $10.19 $9.61 $8.90 $8.21 $8.58
$1,152 $7.94 $7.04 $6.70 $1,006 $866 $765 $653 $446 $365 $350 $53 $194 $240 $299 $137 2007 2008 2009 2010 2011 2012 2013 2014 2015 2016 2017 2018 2019 2020 2021 2022 Q2-2023 Dollars in millions Assets ($mm) TBVPS Tangible book value per share and
capital offering price adjusted for historical stock splits 9 Data as of 12/31 for each respective year

STRONG AND GROWING CORE DEPOSIT BASE DEPOSIT COMPOSITION HISTORICAL
DEPOSIT COMPOSITION Time deposits $1,792 $1,738 $1,800 19% 2015 –Q2’23 CAGR $1,680 Demand DDA: 17.2% deposits $1,532 $1,600 Total Deposits: 16.8% 43% $1,400 $1,200 Money market $988 & savings $1,000 deposits $874 $812 $742 Interest
bearing $771 36% $761 demand deposits $800 $673 45% 2% 46% $650 43% $542 44% $600 DEPOSIT PORTFOLIO HIGHLIGHTS–6/30/23 $387 $352 $400 $315 $285 39% $225 40% ► Deposits increased $21 million from 3/31/23 with increases across 41% $200 44%
42% all categories except for interest-bearing demand $0 ► Resilient core deposit base driven by commercial clients 2015 2016 2017 2018 2019 2020 2021 2022 Q2-2023 • 95%+ of commercial relationships hold deposits at the bank • Core
deposits comprise 81% of total deposits Total Deposits NIB Deposits Cost of 0.23% 0.24% 0.35% 0.55% 0.81% 0.48% 0.27% 0.47% 1.78% ► Utilize remote deposit capture and commercial cash Deposits management to generate and retain deposits Core 91%
94% 93% 94% 88% 87% 91% 85% 81% Deposit Mix ► Treasury management division established in Q4-2019 Dollars in millions Core deposits defined as total deposits less time deposits and brokered deposits. 10 Data as of 12/31 for each respective
year

DEPOSIT BASE CHARACTERISTICS ►Granular, well diversified deposit
base ►No meaningful industry concentrations ►No venture capital or crypto-related deposits ►High percentage of deposits related to operating accounts and credit facilities creates sticky deposit base ►Strong deposit pipeline
centered in operating accounts ►Insured and Collateralized Deposits represent 62% of total deposits ►Liquidity coverage of uninsured deposits exceeds 100% 11

DIVERSIFIED COMMERCIAL LOAN PORTFOLIO (1) LOAN PORTFOLIO COMPOSITION
HISTORICAL LOAN COMPOSITION 2017 – Q2’23 CAGR Other 3% $1,584 $1,593 $1,600 C&I: 12.3% $1,377 $1,369 Construction 4% Total Loans: 15.0% $950 $1,100 $847 $733 $635 $622 $474 $415 $600 $390 Commercial 39% $341 $329 CRE - Non-Owner 40%
45% 41% 34% 40% 39% $100 30% Occupied 36% (41% (39% (36% ex.PPP) ex.PPP) ex.PPP) -$400 2017 2018 2019 2020 2021 2022 2Q23 Total Loans C&I Loans Yield on CRE - Owner 4.88% 5.09% 5.19% 4.22% 4.29% 4.96% 5.97% Loans (3) Occupied 18% Loans / 96% 97%
96% 89% 82% 89% 91% Deposits (2) OPERATING LOC USAGE GROSS LOAN FUNDING VS. NET LOAN GROWTH $200 $1,000 50% 43% 40% 39% 38% $150 34% $800 40% $167 $100 $129 $131 $600 30% $124 $888 $88 $889 $884 $862 $400 $823 20% $50 $6 $42 $24 $43 $380 $353 $347
$200 $327 10% $0 $310 -$34 $0 0% -$50 2Q22 3Q22 4Q22 1Q23 2Q23 2Q22 3Q22 4Q22 1Q23 2Q23 Commitment Amount Gross Balance Usage Gross Loan Funding Net Loan Growth Dollars in millions (1) Data as of 12/31 for each respective year 12 (2) Excludes PPP
loans

NEW LOAN PRODUCTION IN 2Q23 (1) BOOKING NEW LOANS AT ATTRACTIVE RATES
► Funded new loans with balances of $43 million in 2Q23 compared to $42 million in 1Q23 and $167 million in 2Q22 ► Weighted average rate on newly funded loans was 8.41% in 1Q23 compared to 7.72% in 1Q23 and 4.57% in 2Q22 ► 2Q23 new
loan dollar mix was 83% commercial, 17% CRE and 0% other (1) (1) NEW LOAN FUNDINGS WTD. AVG. RATE ON NEW LOANS $200 8.41% $0 7.72% $150 $1 $2 6.72% $93 $45 $100 5.87% $63 4.57% $50 $0 $85 $0 $7 $73 $17 $59 $36 $25 $0 2Q22 3Q22 4Q22 1Q23 2Q23
Commercial CRE Other 2Q22 3Q22 4Q22 1Q23 2Q23 Dollars in millions (1) Excludes PPP loans 13

CRE LOAN PORTFOLIO – INVESTOR CRE CONSERVATIVELY UNDERWRITTEN
PORTFOLIO WITH AVERAGE LTV OF 48.9% (1) (1) INVESTOR CRE BY PROPERTY TYPE INVESTOR CRE BY GEOGRAPHIC BREAKDOWN 4% 1% 15% Mobile Home Land Out of State Park 6% Multi-Family 32% 6% Retail Other 9% Other California 48% Bay Area 19% Industrial 28% 17%
Sacramento 15% Office Mixed-Use (1) Data as a percent of total investor CRE, $577 million Data as of 6/30/2023 14
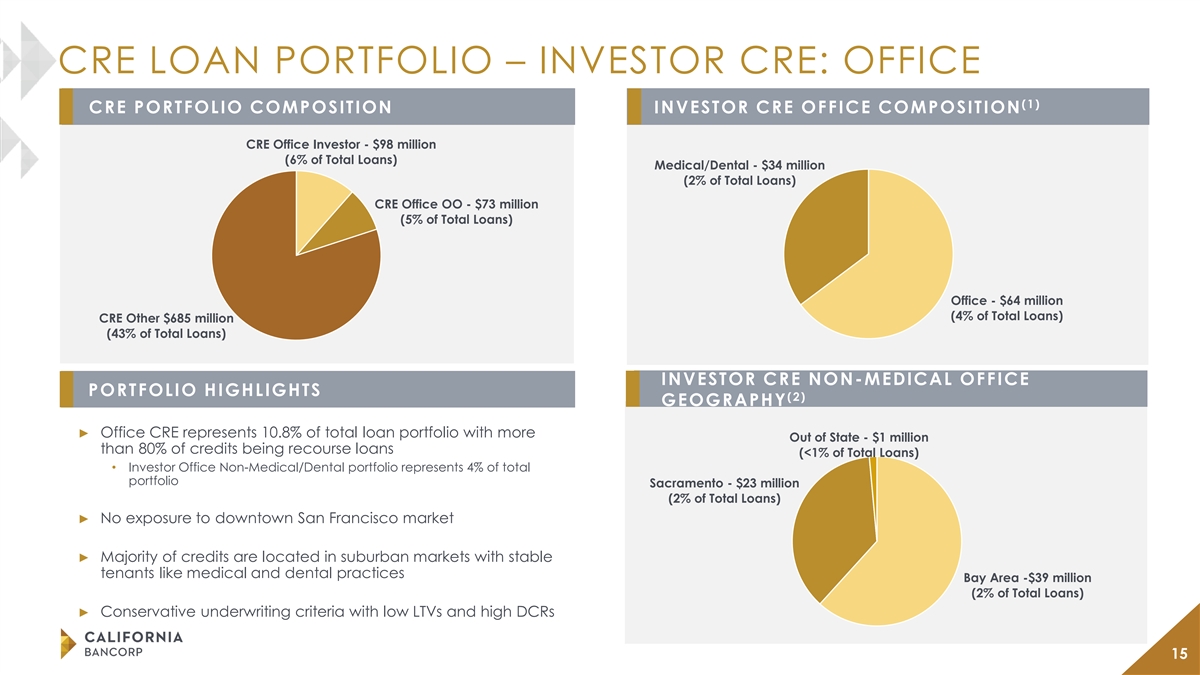
CRE LOAN PORTFOLIO – INVESTOR CRE: OFFICE (1) CRE PORTFOLIO
COMPOSITION INVESTOR CRE OFFICE COMPOSITION CRE Office Investor - $98 million (6% of Total Loans) Medical/Dental - $34 million (2% of Total Loans) CRE Office OO - $73 million (5% of Total Loans) Office - $64 million (4% of Total Loans) CRE Other
$685 million (43% of Total Loans) INVESTOR CRE NON-MEDICAL OFFICE PORTFOLIO HIGHLIGHTS (2) GEOGRAPHY ► Office CRE represents 10.8% of total loan portfolio with more Out of State - $1 million than 80% of credits being recourse loans (<1% of
Total Loans) • Investor Office Non-Medical/Dental portfolio represents 4% of total portfolio Sacramento - $23 million (2% of Total Loans) ► No exposure to downtown San Francisco market ► Majority of credits are located in suburban
markets with stable tenants like medical and dental practices Bay Area -$39 million (2% of Total Loans) ► Conservative underwriting criteria with low LTVs and high DCRs 15
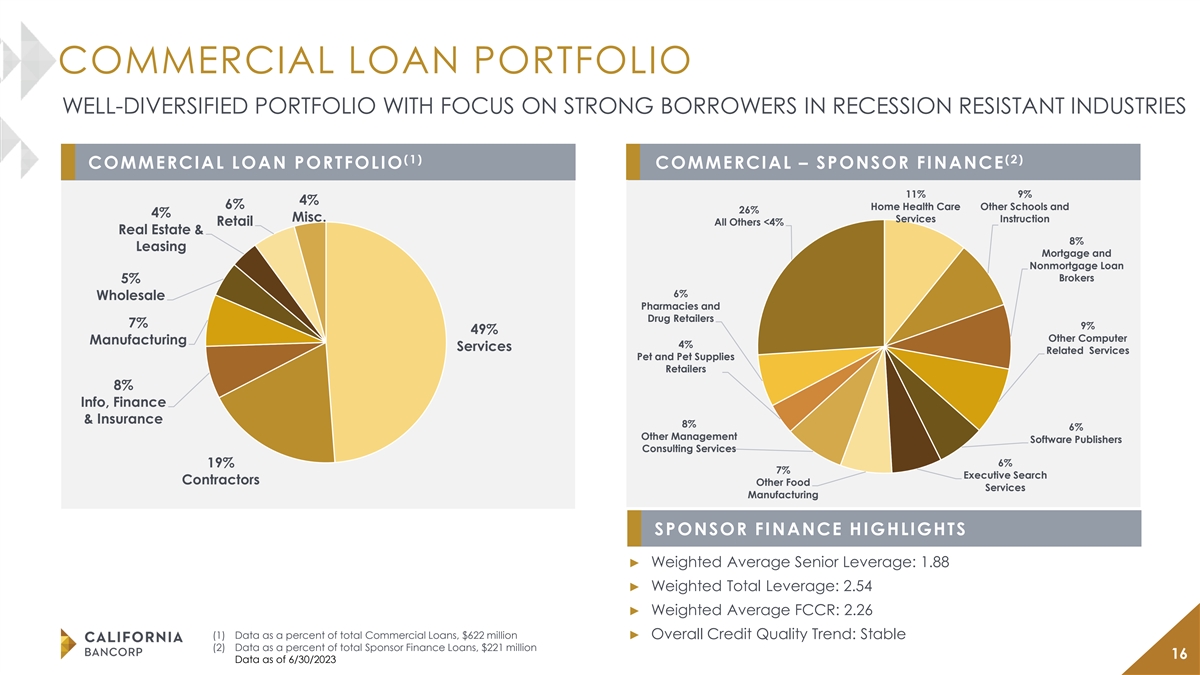
COMMERCIAL LOAN PORTFOLIO WELL-DIVERSIFIED PORTFOLIO WITH FOCUS ON
STRONG BORROWERS IN RECESSION RESISTANT INDUSTRIES (1) (2) COMMERCIAL LOAN PORTFOLIO COMMERCIAL – SPONSOR FINANCE 11% 9% 4% 6% Home Health Care Other Schools and 26% 4% Misc. Services Instruction Retail All Others <4% Real Estate & 8%
Leasing Mortgage and Nonmortgage Loan Brokers 5% 6% Wholesale Pharmacies and Drug Retailers 7% 9% 49% Other Computer Manufacturing 4% Services Related Services Pet and Pet Supplies Retailers 8% Info, Finance & Insurance 8% 6% Other Management
Software Publishers Consulting Services 6% 19% 7% Executive Search Contractors Other Food Services Manufacturing SPONSOR FINANCE HIGHLIGHTS ► Weighted Average Senior Leverage: 1.88 ► Weighted Total Leverage: 2.54 ► Weighted Average
FCCR: 2.26 (1) Data as a percent of total Commercial Loans, $622 million► Overall Credit Quality Trend: Stable (2) Data as a percent of total Sponsor Finance Loans, $221 million 16 Data as of 6/30/2023
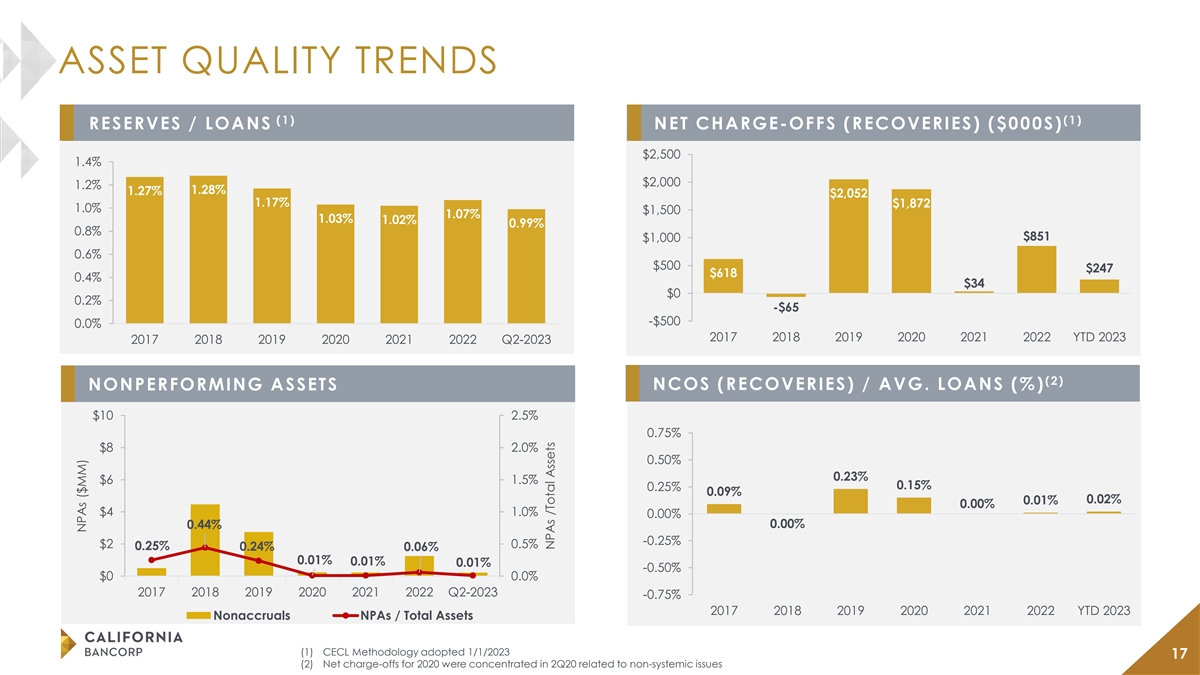
ASSET QUALITY TRENDS (1) (1) RESERVES / LOANS NET CHARGE-OFFS
(RECOVERIES) ($000S) $2,500 1.4% $2,000 1.2% 1.28% 1.27% $2,052 1.17% $1,872 1.0% $1,500 1.07% 1.03% 1.02% 0.99% 0.8% $851 $1,000 0.6% $500 $247 $618 0.4% $34 $0 0.2% -$65 -$500 0.0% 2017 2018 2019 2020 2021 2022 YTD 2023 2017 2018 2019 2020 2021
2022 Q2-2023 (2) NCOS (RECOVERIES) / AVG. LOANS (%) NONPERFORMING ASSETS $10 2.5% 0.75% $8 2.0% 0.50% 0.23% $6 1.5% 0.15% 0.25% 0.09% 0.02% 0.01% 0.00% $4 1.0% 0.00% 0.44% 0.00% -0.25% $2 0.5% 0.25% 0.24% 0.06% 0.01% 0.01% 0.01% -0.50% $0 0.0% 2017
2018 2019 2020 2021 2022 Q2-2023 -0.75% 2017 2018 2019 2020 2021 2022 YTD 2023 Nonaccruals NPAs / Total Assets (1) CECL Methodology adopted 1/1/2023 17 (2) Net charge-offs for 2020 were concentrated in 2Q20 related to non-systemic issues NPAs ($MM)
NPAs /Total Assets
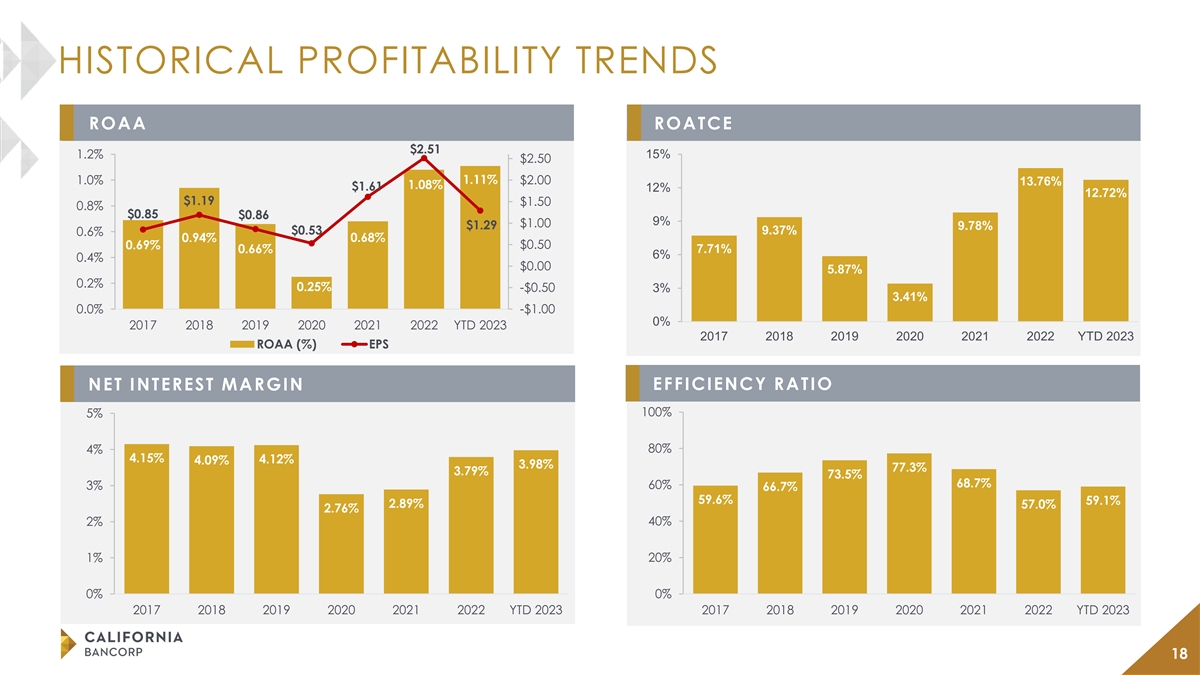
HISTORICAL PROFITABILITY TRENDS ROAA ROATCE $2.51 1.2% 15% $2.50 1.11%
1.0% $2.00 13.76% 1.08% $1.61 12% 12.72% $1.19 $1.50 0.8% $0.85 $0.86 9% $1.00 $1.29 9.78% $0.53 9.37% 0.6% 0.94% 0.68% $0.50 0.69% 0.66% 7.71% 6% 0.4% $0.00 5.87% 0.2% 0.25% -$0.50 3% 3.41% 0.0% -$1.00 0% 2017 2018 2019 2020 2021 2022 YTD 2023 2017
2018 2019 2020 2021 2022 YTD 2023 ROAA (%) EPS EFFICIENCY RATIO NET INTEREST MARGIN 100% 5% 80% 4% 4.15% 4.12% 4.09% 3.98% 77.3% 3.79% 73.5% 68.7% 60% 3% 66.7% 59.6% 59.1% 2.89% 57.0% 2.76% 40% 2% 1% 20% 0% 0% 2017 2018 2019 2020 2021 2022 YTD 2023
2017 2018 2019 2020 2021 2022 YTD 2023 18

Disciplined Expense Management Driving Greater Operating Leverage
► Investment phase in 2018-2019 (talent, product development, and technology) built highly leverageable infrastructure and strong commercial banking team ► Following investment phase, revenue growth rate has been well in excess of
expense growth rate, resulting in greater operating leverage and increasing profitability OPERATING EXPENSES BEFORE CAPITALIZED LOAN ORIGINATION COSTS $12.7 $12.5 $12.3 $12.3 $11.9 $11.9 $11.7 $11.6 $1.0 $0.7 $0.7 $11.1 $1.1 $1.0 $1.1 $1.2 $1.6 $1.2
$11.7 $11.8 $11.6 $11.2 $10.9 $10.8 $10.5 $10.0 $9.8 2Q21 3Q21 4Q21 1Q22 2Q22 3Q22 4Q22 1Q23 2Q23 Total operating expenses, as reported Capitalized loan origination costs Dollars in millions 19
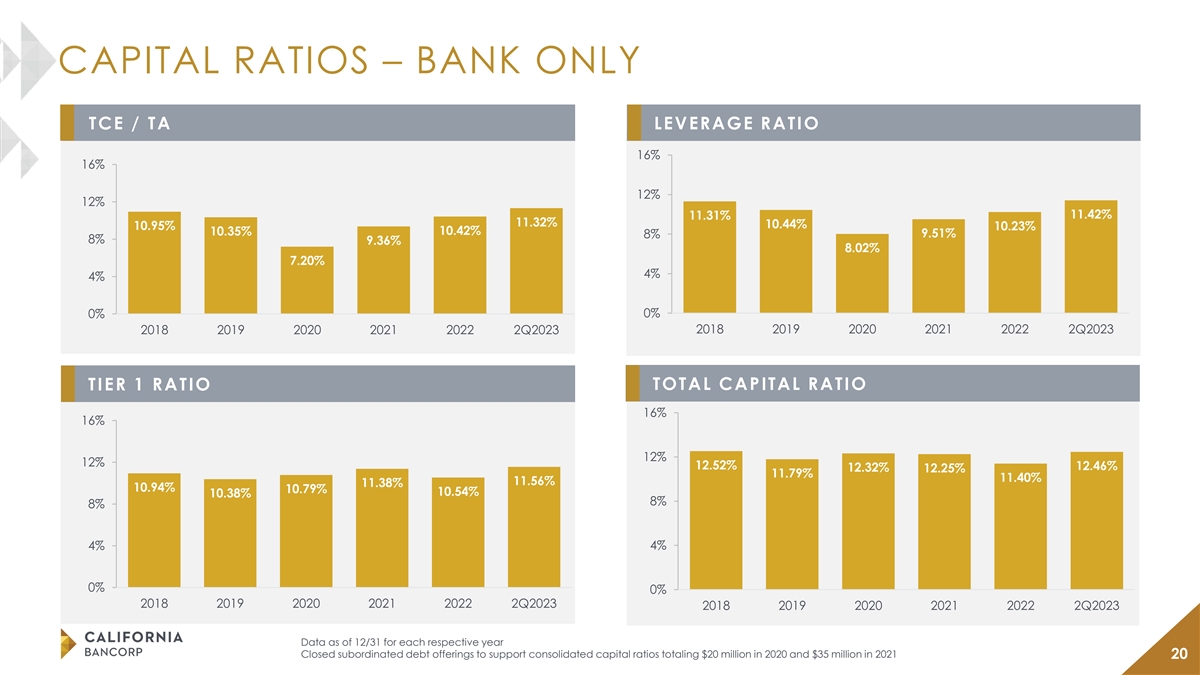
CAPITAL RATIOS – BANK ONLY TCE / TA LEVERAGE RATIO 16% 16% 12%
12% 11.42% 11.31% 11.32% 10.44% 10.95% 10.23% 10.42% 10.35% 9.51% 8% 8% 9.36% 8.02% 7.20% 4% 4% 0% 0% 2018 2019 2020 2021 2022 2Q2023 2018 2019 2020 2021 2022 2Q2023 TOTAL CAPITAL RATIO TIER 1 RATIO 16% 16% 12% 12% 12.52% 12.46% 12.32% 12.25% 11.79%
11.40% 11.56% 11.38% 10.94% 10.79% 10.54% 10.38% 8% 8% 4% 4% 0% 0% 2018 2019 2020 2021 2022 2Q2023 2018 2019 2020 2021 2022 2Q2023 Data as of 12/31 for each respective year Closed subordinated debt offerings to support consolidated capital ratios
totaling $20 million in 2020 and $35 million in 2021 20
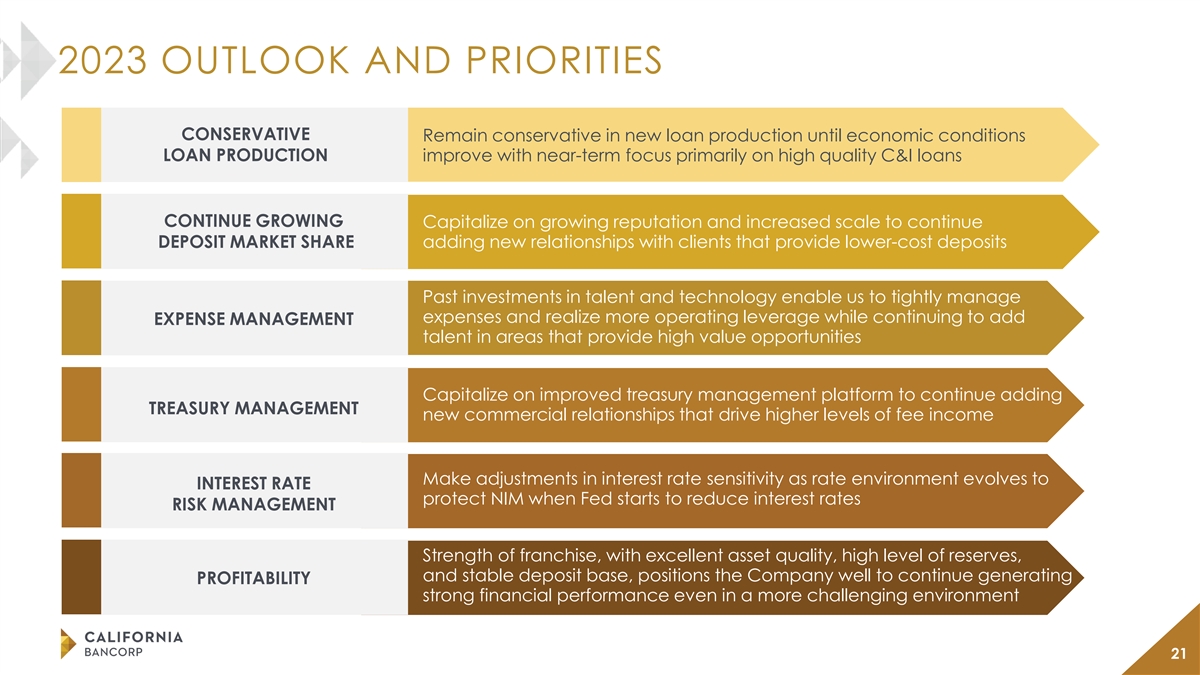
2023 OUTLOOK AND PRIORITIES CONSERVATIVE Remain conservative in new
loan production until economic conditions LOAN PRODUCTION improve with near-term focus primarily on high quality C&I loans CONTINUE GROWING Capitalize on growing reputation and increased scale to continue DEPOSIT MARKET SHARE adding new
relationships with clients that provide lower-cost deposits Past investments in talent and technology enable us to tightly manage expenses and realize more operating leverage while continuing to add EXPENSE MANAGEMENT talent in areas that provide
high value opportunities Capitalize on improved treasury management platform to continue adding TREASURY MANAGEMENT new commercial relationships that drive higher levels of fee income Make adjustments in interest rate sensitivity as rate environment
evolves to INTEREST RATE protect NIM when Fed starts to reduce interest rates RISK MANAGEMENT Strength of franchise, with excellent asset quality, high level of reserves, and stable deposit base, positions the Company well to continue generating
PROFITABILITY strong financial performance even in a more challenging environment 21
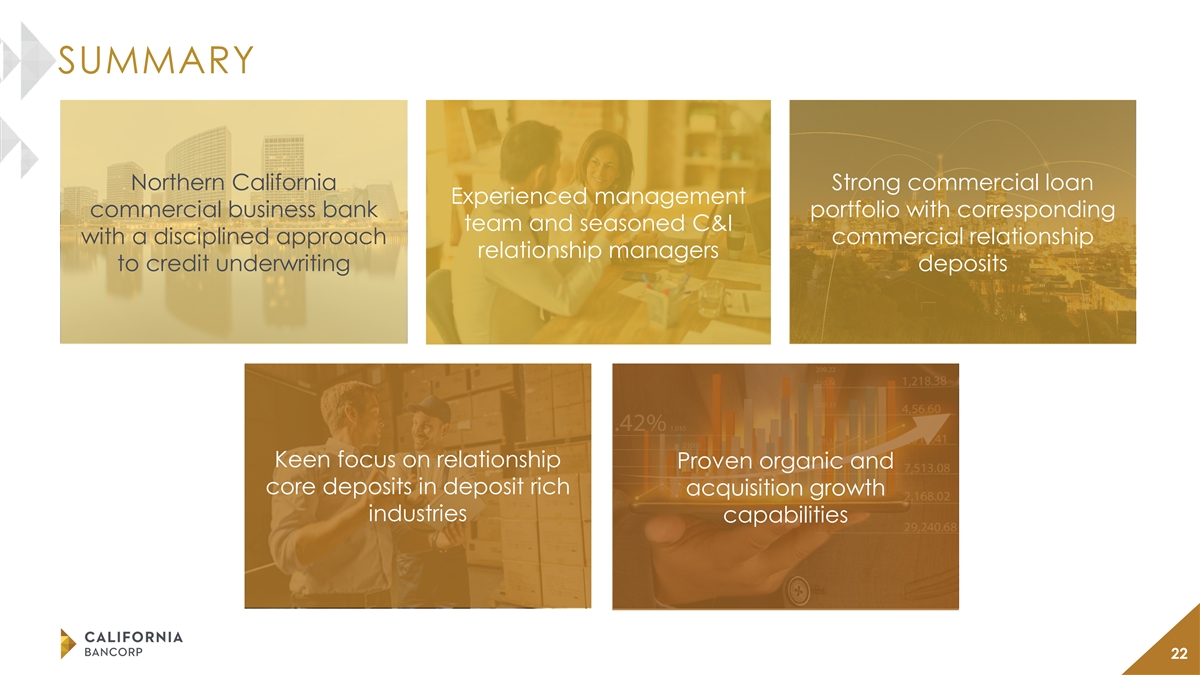
SUMMARY Northern California Strong commercial loan Experienced
management commercial business bank portfolio with corresponding team and seasoned C&I with a disciplined approach commercial relationship relationship managers to credit underwriting deposits Keen focus on relationship Proven organic and core
deposits in deposit rich acquisition growth industries capabilities 22 3

Please send questions to ir@bankcbc.com Or Call 510.457.3751
CaliforniaBankofCommerce.com
v3.23.2
| X |
- DefinitionBoolean flag that is true when the XBRL content amends previously-filed or accepted submission.
| Name: |
dei_AmendmentFlag |
| Namespace Prefix: |
dei_ |
| Data Type: |
xbrli:booleanItemType |
| Balance Type: |
na |
| Period Type: |
duration |
|
| X |
- DefinitionFor the EDGAR submission types of Form 8-K: the date of the report, the date of the earliest event reported; for the EDGAR submission types of Form N-1A: the filing date; for all other submission types: the end of the reporting or transition period. The format of the date is YYYY-MM-DD.
| Name: |
dei_DocumentPeriodEndDate |
| Namespace Prefix: |
dei_ |
| Data Type: |
xbrli:dateItemType |
| Balance Type: |
na |
| Period Type: |
duration |
|
| X |
- DefinitionThe type of document being provided (such as 10-K, 10-Q, 485BPOS, etc). The document type is limited to the same value as the supporting SEC submission type, or the word 'Other'.
| Name: |
dei_DocumentType |
| Namespace Prefix: |
dei_ |
| Data Type: |
dei:submissionTypeItemType |
| Balance Type: |
na |
| Period Type: |
duration |
|
| X |
- DefinitionAddress Line 1 such as Attn, Building Name, Street Name
| Name: |
dei_EntityAddressAddressLine1 |
| Namespace Prefix: |
dei_ |
| Data Type: |
xbrli:normalizedStringItemType |
| Balance Type: |
na |
| Period Type: |
duration |
|
| X |
- DefinitionAddress Line 2 such as Street or Suite number
| Name: |
dei_EntityAddressAddressLine2 |
| Namespace Prefix: |
dei_ |
| Data Type: |
xbrli:normalizedStringItemType |
| Balance Type: |
na |
| Period Type: |
duration |
|
| X |
- Definition
+ References
+ Details
| Name: |
dei_EntityAddressCityOrTown |
| Namespace Prefix: |
dei_ |
| Data Type: |
xbrli:normalizedStringItemType |
| Balance Type: |
na |
| Period Type: |
duration |
|
| X |
- DefinitionCode for the postal or zip code
| Name: |
dei_EntityAddressPostalZipCode |
| Namespace Prefix: |
dei_ |
| Data Type: |
xbrli:normalizedStringItemType |
| Balance Type: |
na |
| Period Type: |
duration |
|
| X |
- DefinitionName of the state or province.
| Name: |
dei_EntityAddressStateOrProvince |
| Namespace Prefix: |
dei_ |
| Data Type: |
dei:stateOrProvinceItemType |
| Balance Type: |
na |
| Period Type: |
duration |
|
| X |
- DefinitionA unique 10-digit SEC-issued value to identify entities that have filed disclosures with the SEC. It is commonly abbreviated as CIK. Reference 1: http://www.xbrl.org/2003/role/presentationRef
-Publisher SEC
-Name Exchange Act
-Number 240
-Section 12
-Subsection b-2
| Name: |
dei_EntityCentralIndexKey |
| Namespace Prefix: |
dei_ |
| Data Type: |
dei:centralIndexKeyItemType |
| Balance Type: |
na |
| Period Type: |
duration |
|
| X |
- DefinitionIndicate if registrant meets the emerging growth company criteria. Reference 1: http://www.xbrl.org/2003/role/presentationRef
-Publisher SEC
-Name Exchange Act
-Number 240
-Section 12
-Subsection b-2
| Name: |
dei_EntityEmergingGrowthCompany |
| Namespace Prefix: |
dei_ |
| Data Type: |
xbrli:booleanItemType |
| Balance Type: |
na |
| Period Type: |
duration |
|
| X |
- DefinitionCommission file number. The field allows up to 17 characters. The prefix may contain 1-3 digits, the sequence number may contain 1-8 digits, the optional suffix may contain 1-4 characters, and the fields are separated with a hyphen.
| Name: |
dei_EntityFileNumber |
| Namespace Prefix: |
dei_ |
| Data Type: |
dei:fileNumberItemType |
| Balance Type: |
na |
| Period Type: |
duration |
|
| X |
- DefinitionTwo-character EDGAR code representing the state or country of incorporation.
| Name: |
dei_EntityIncorporationStateCountryCode |
| Namespace Prefix: |
dei_ |
| Data Type: |
dei:edgarStateCountryItemType |
| Balance Type: |
na |
| Period Type: |
duration |
|
| X |
- DefinitionThe exact name of the entity filing the report as specified in its charter, which is required by forms filed with the SEC. Reference 1: http://www.xbrl.org/2003/role/presentationRef
-Publisher SEC
-Name Exchange Act
-Number 240
-Section 12
-Subsection b-2
| Name: |
dei_EntityRegistrantName |
| Namespace Prefix: |
dei_ |
| Data Type: |
xbrli:normalizedStringItemType |
| Balance Type: |
na |
| Period Type: |
duration |
|
| X |
- DefinitionThe Tax Identification Number (TIN), also known as an Employer Identification Number (EIN), is a unique 9-digit value assigned by the IRS. Reference 1: http://www.xbrl.org/2003/role/presentationRef
-Publisher SEC
-Name Exchange Act
-Number 240
-Section 12
-Subsection b-2
| Name: |
dei_EntityTaxIdentificationNumber |
| Namespace Prefix: |
dei_ |
| Data Type: |
dei:employerIdItemType |
| Balance Type: |
na |
| Period Type: |
duration |
|
| X |
- DefinitionLocal phone number for entity.
| Name: |
dei_LocalPhoneNumber |
| Namespace Prefix: |
dei_ |
| Data Type: |
xbrli:normalizedStringItemType |
| Balance Type: |
na |
| Period Type: |
duration |
|
| X |
- DefinitionBoolean flag that is true when the Form 8-K filing is intended to satisfy the filing obligation of the registrant as pre-commencement communications pursuant to Rule 13e-4(c) under the Exchange Act. Reference 1: http://www.xbrl.org/2003/role/presentationRef
-Publisher SEC
-Name Exchange Act
-Number 240
-Section 13e
-Subsection 4c
| Name: |
dei_PreCommencementIssuerTenderOffer |
| Namespace Prefix: |
dei_ |
| Data Type: |
xbrli:booleanItemType |
| Balance Type: |
na |
| Period Type: |
duration |
|
| X |
- DefinitionBoolean flag that is true when the Form 8-K filing is intended to satisfy the filing obligation of the registrant as pre-commencement communications pursuant to Rule 14d-2(b) under the Exchange Act. Reference 1: http://www.xbrl.org/2003/role/presentationRef
-Publisher SEC
-Name Exchange Act
-Number 240
-Section 14d
-Subsection 2b
| Name: |
dei_PreCommencementTenderOffer |
| Namespace Prefix: |
dei_ |
| Data Type: |
xbrli:booleanItemType |
| Balance Type: |
na |
| Period Type: |
duration |
|
| X |
- DefinitionTitle of a 12(b) registered security. Reference 1: http://www.xbrl.org/2003/role/presentationRef
-Publisher SEC
-Name Exchange Act
-Number 240
-Section 12
-Subsection b
| Name: |
dei_Security12bTitle |
| Namespace Prefix: |
dei_ |
| Data Type: |
dei:securityTitleItemType |
| Balance Type: |
na |
| Period Type: |
duration |
|
| X |
- DefinitionName of the Exchange on which a security is registered. Reference 1: http://www.xbrl.org/2003/role/presentationRef
-Publisher SEC
-Name Exchange Act
-Number 240
-Section 12
-Subsection d1-1
| Name: |
dei_SecurityExchangeName |
| Namespace Prefix: |
dei_ |
| Data Type: |
dei:edgarExchangeCodeItemType |
| Balance Type: |
na |
| Period Type: |
duration |
|
| X |
- DefinitionBoolean flag that is true when the Form 8-K filing is intended to satisfy the filing obligation of the registrant as soliciting material pursuant to Rule 14a-12 under the Exchange Act. Reference 1: http://www.xbrl.org/2003/role/presentationRef
-Publisher SEC
-Name Exchange Act
-Section 14a
-Number 240
-Subsection 12
| Name: |
dei_SolicitingMaterial |
| Namespace Prefix: |
dei_ |
| Data Type: |
xbrli:booleanItemType |
| Balance Type: |
na |
| Period Type: |
duration |
|
| X |
- DefinitionTrading symbol of an instrument as listed on an exchange.
| Name: |
dei_TradingSymbol |
| Namespace Prefix: |
dei_ |
| Data Type: |
dei:tradingSymbolItemType |
| Balance Type: |
na |
| Period Type: |
duration |
|
| X |
- DefinitionBoolean flag that is true when the Form 8-K filing is intended to satisfy the filing obligation of the registrant as written communications pursuant to Rule 425 under the Securities Act. Reference 1: http://www.xbrl.org/2003/role/presentationRef
-Publisher SEC
-Name Securities Act
-Number 230
-Section 425
| Name: |
dei_WrittenCommunications |
| Namespace Prefix: |
dei_ |
| Data Type: |
xbrli:booleanItemType |
| Balance Type: |
na |
| Period Type: |
duration |
|
California BanCorp (NASDAQ:CALB)
Historical Stock Chart
From Mar 2024 to Apr 2024

California BanCorp (NASDAQ:CALB)
Historical Stock Chart
From Apr 2023 to Apr 2024
